Article

Kinetics of Dry-Batch Grinding in a Laboratory-Scale Ball Mill of Sn–Ta–Nb Minerals from the Penouta Mine (Spain)

by
Jenniree V. Nava
1,
Teresa Llorens
1 and
Juan María Menéndez-Aguado
2,*
1
Strategic Minerals Spain, S.L. Ctra. OU-0901 Km 14, Penouta Mine, Viana do Bolo, 32558 Ourense, Galicia, Spain
2
Escuela Politécnica de Mieres, University of Oviedo, Gonzalo Gutiérrez Quirós, 33600 Mieres, Asturias, Spain
*
Author to whom correspondence should be addressed.
Metals 2020, 10(12), 1687; https://doi.org/10.3390/met10121687
Submission received: 17 November 2020 / Revised: 5 December 2020 / Accepted: 16 December 2020 / Published: 17 December 2020
(This article belongs to the Special Issue Grinding and Concentration Technology of Critical Metals)

Abstract

:
The optimization of processing plants is one of the main concerns in the mining industry, since the comminution stage, a fundamental operation, accounts for up to 70% of total energy consumption. The aim of this study was to determine the effects that ball size and mill speed exert on the milling kinetics over a wide range of particle sizes. This was done through dry milling and batch grinding tests performed on two samples from the Penouta Sn–Ta–Nb mine (Galicia, Spain), and following Austin methodology. In addition, the relationships amongst Sn, Ta and Nb content, as metals of interest, the specific rate of breakage Si, the kinetic parameters, and the operational conditions were studied through X-Ray fluorescence (XRF) techniques. The results show that, overall, the specific rate of breakage Si decreases with decreasing feed particle size and increasing ball size for most of the tested conditions. A selection function, αT, was formulated on the basis of the ball size for both Penouta mine samples. Finally, it was found that there does exist a direct relationship amongst Sn, Ta and Nb content, as metals of interest, in the milling product, the specific rate of breakage Si and the operational–mineralogical variables of ball size, mill speed and feed particle size.

1. Introduction

In the mining industry, the comminution stage can represent up to 70% of the energy consumed in a mineral processing plant [1,2,3,4,5]. With ball-mill grinding being one of the most energy-consuming techniques, setting the optimal values of the operational and mineralogical parameters for efficient grinding is a key target in mineral processing plants [6,7,8,9,10]. Ball size is one of the key factors of ball-mill efficiency [11,12], and may have a significant financial impact [13]. The population balance model (PBM) has been widely used in ball mills [14]. This model is a simple mass balance to reduce size being used in fragmentation models [15]. Several methods have been implemented to determine those functions. Some were based on simple laboratory-scale grinding essays [16,17,18,19,20,21], whereas others were based on industry-scale works [22,23,24,25,26]. This paper focuses on studying the specific rate of breakage Si and its kinetic parameters based on the Austin methodology [27], which assumes that the specific rate of breakage (Si) is a constant of proportionality that may or may not behave as a first-order function, whereas the function of fracture (Bij) does not change with grinding time.
Tantalum and Niobium are considered critical raw material in the EU, due to their features and applications in a wide range of industrial sectors, and the strong EU import dependence [28]. This makes it of paramount importance to increase the research in the mineral deposits that contain them, and to optimize the processing plants to increase their efficiency and to minimize their energy consumption.
One of those processing plants lies in the Penouta Sn–Ta–Nb mine. Currently, it is the only working mine in Europe producing Ta and Nb concentrates as its main product. This is done by reprocessing the tailing ponds generated by the mining works up to the 1980s, and it is pending authorizations to start mining the source rock. Due to that, two types of sample have been studied: (i) unaltered rock from the Sn-, Ta- and Nb-enriched albite leucogranite (Bedrock); and (ii) material from the tailing ponds (Tailings Pond).
The aim of this work was to study the effects of ball size on milling kinetics, operating at different mill speeds and with a wide range of feed particle size. This was done through dry milling and batch grinding tests, following the methodology proposed by Austin et al. [7] and developed in [9,29]. In addition, it studied the relationships amongst the evolution of Sn, Ta and Nb content, as metals of interest, determined by XRF, the specific rate of breakage Si, and the operational conditions for both samples, Bedrock and Tailings Pond, from the Penouta mine.

2. Theoretical Background

The population balance model (PBM) has been widely used in ball mills. This model is based on determining the particle size distribution grouped in size classes. A mass balance for the class i in a well-mixed grinding process is done by means of Equation (1), where comminution is linear, and a first-order kinetic fragmentation is assumed [19].
d w i d t = S i w i ( t ) + j = 1 i 1 b i j k j w j ( t )
where wi (t) is the particle mass fraction of size class i at grinding time t. The first term of the right-hand side is the mass fraction of particles of the monosize i that break and, thus, no longer belong to that monosize. Si is the specific rate of breakage. The second term represents the contribution of all monosizes coarser than i that at breaking produce particles of monosize i. The fracture rate or fracture velocity of a monosize material can be expressed by Equation (2):
d w i d t = S i w i ( t )
where Si is a constant of proportionality called the specific rate of breakage or probability of fracture, whose unit is t−1. Assuming that Si does not change with time, the integral results in Equation (3).
log ( w i ( t ) ) log ( w i ( 0 ) ) = S i ( t ) 2.3
where wi (t) and wi(0) are the mass fractions for size class i, at grinding times t and 0, respectively. Si is the specific rate of breakage. Following the methodology proposed by Austin et al. [7] once Si values have been obtained through slope determination, they are plotted to the particle size, and Equation (4) is proposed to study the behavior of the specific rate of breakage Si.
S i = α T · X i α · Q i
where Xi is the upper size limit of the interval (in mm), and α T , is a parameter that depends on milling conditions and, is the breakage rate for size xi = 1 mm, while α is a characteristic parameter depending on material properties; Qi is a correction factor, which is 1 for small particles (normal breakage, which was assumed in this case) and less than 1 for large particles that need to be nipped and fractured by the grinding media (abnormal breakage); Si increases up to a specified size xm (optimum feed size), but above this size breakage rates decrease sharply [9].
Rotating critical speed of the mill, Nc, is calculated with Equation (5).
N c = 42.3 D d
where D is the mill diameter and d is the ball diameter (in m). Ball mill filling volume is calculated using Equation (6), assuming that the bed porosity of balls is 40%.
J = ( m a s s   o f   b a l l s b a l l   d e n s i t y × m i l l   v o l u m e ) × 1.0 0.6
On the other hand, Austin and Brame [25] calculated the selection function α T in a general way through Equation (7).
α T = υ c 0.1 1 + e [ 15.7 ( υ c 0.94 ) ]
where υ c is the mill speed expressed as the fraction of critical speed.

3. Methodology

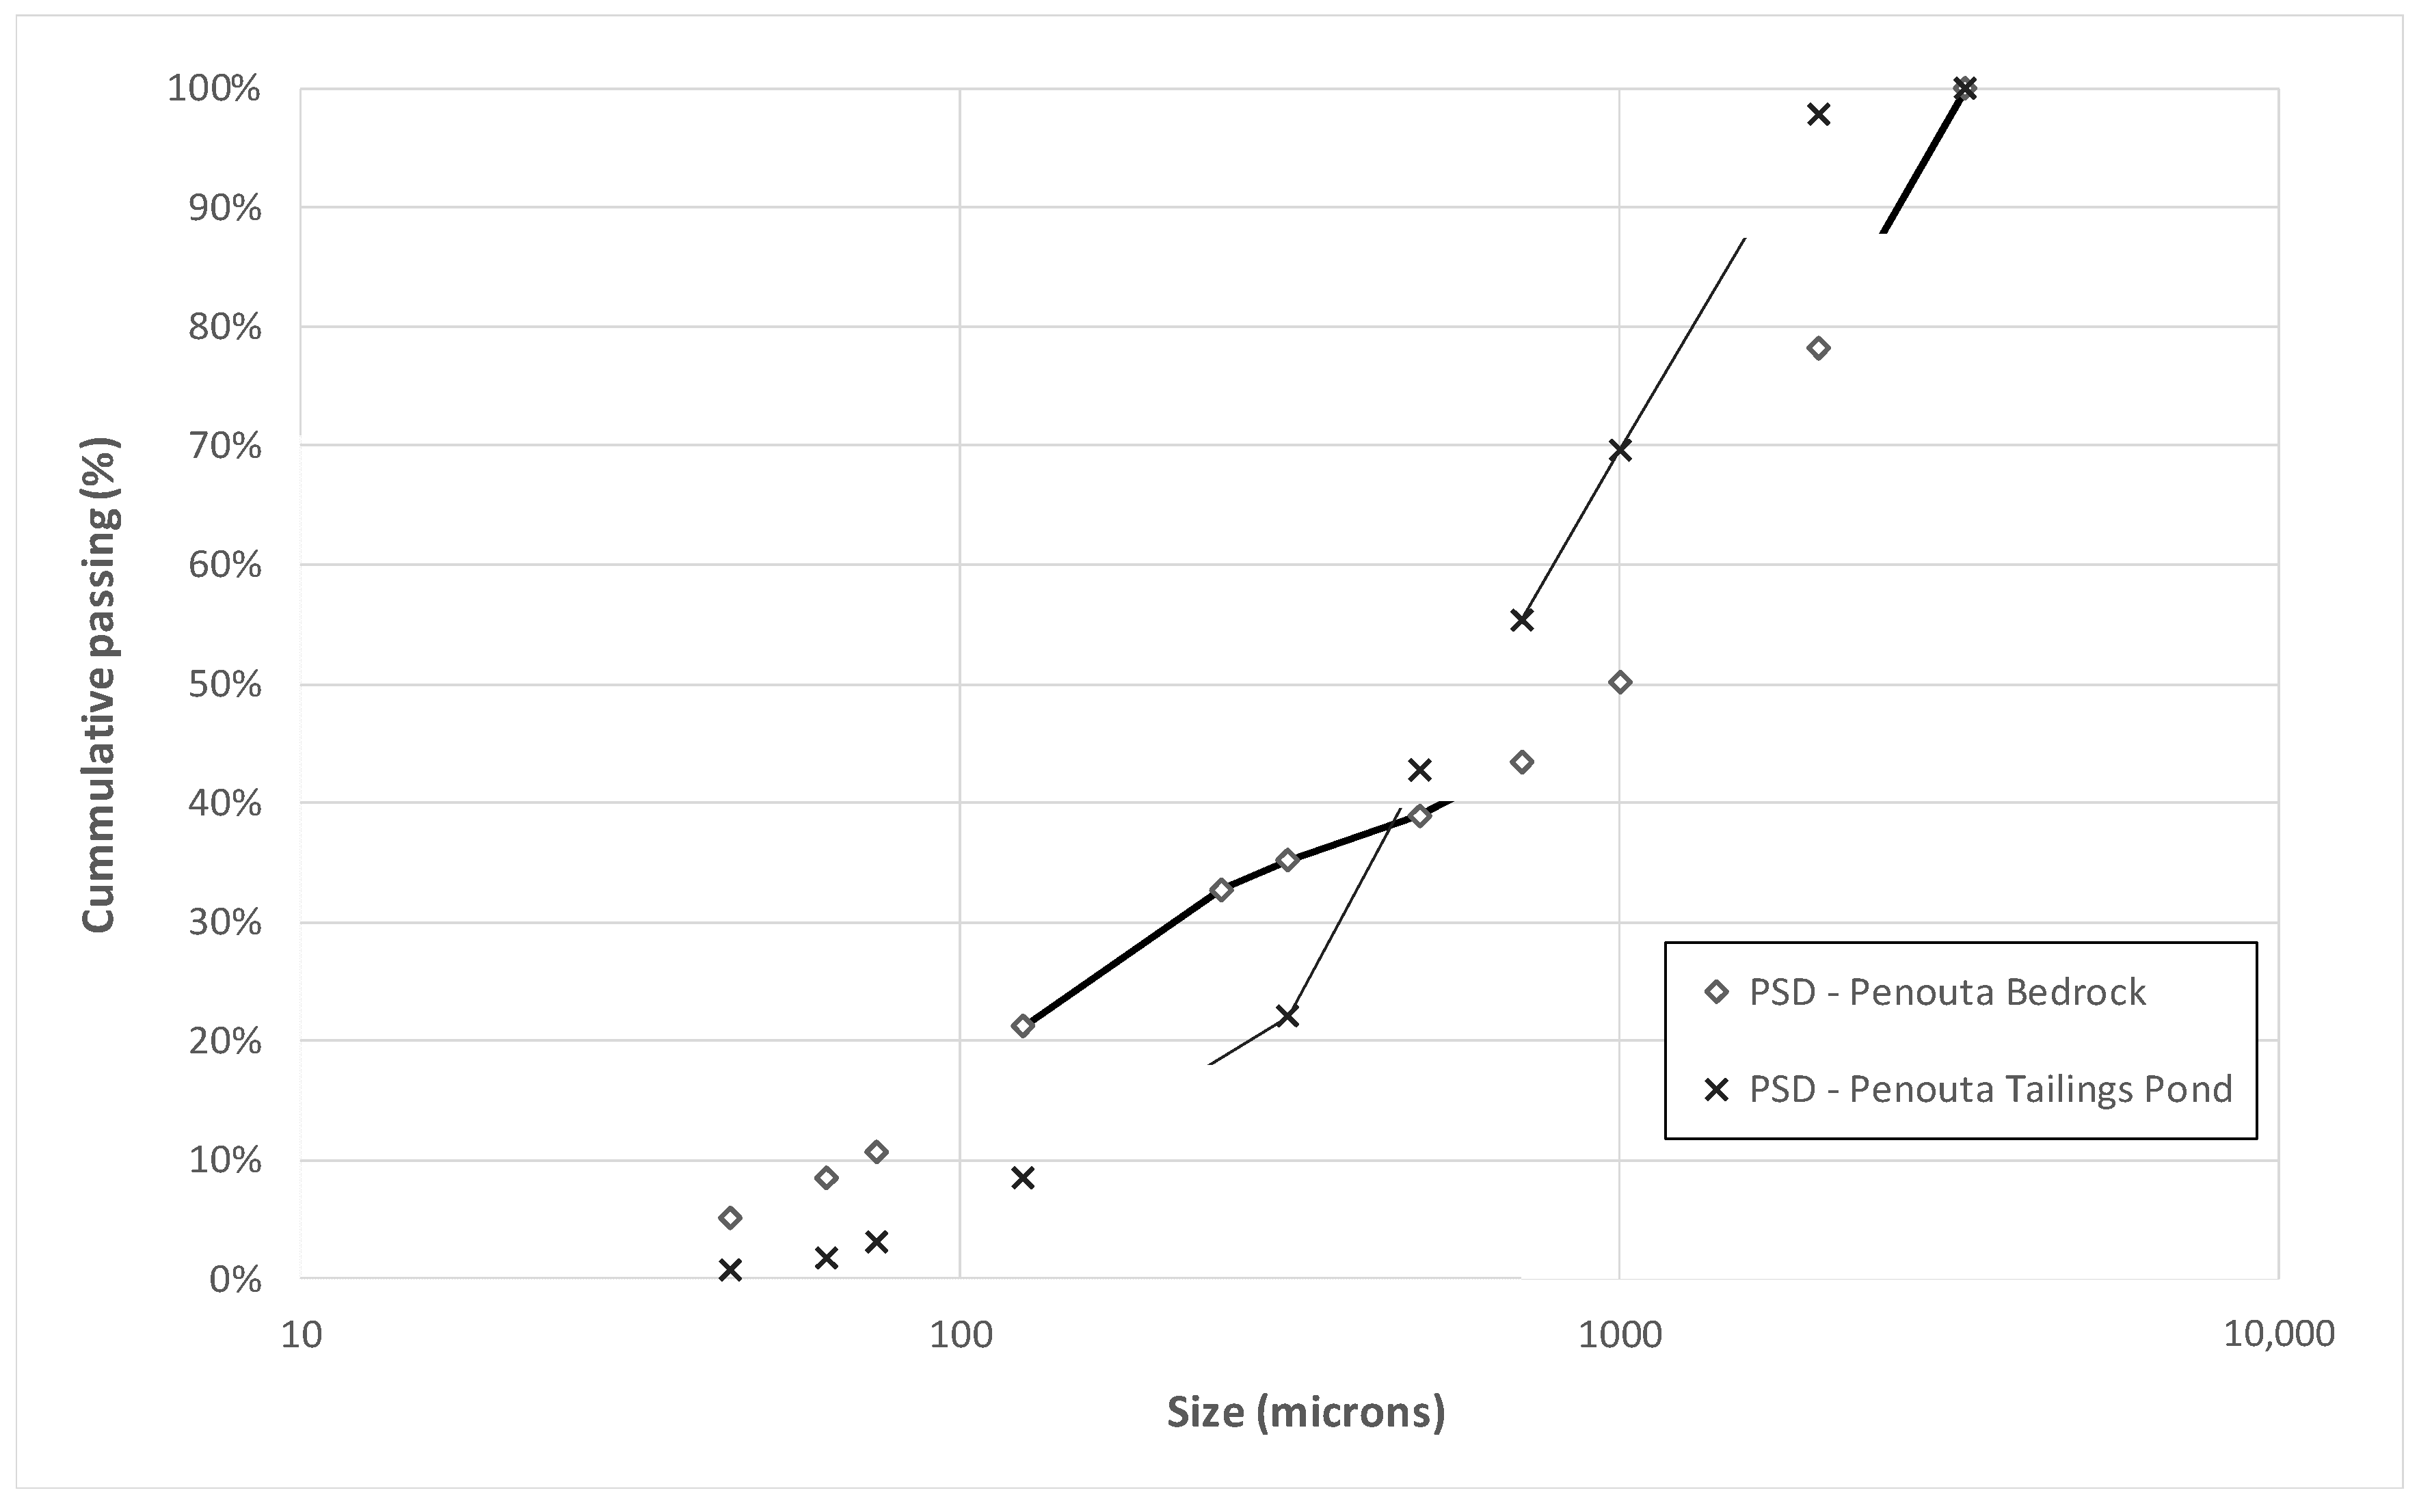
3.1. Sample Characterization

First, a representative sample of a metric tonne from each of both areas of interest of the Penouta mine, Bedrock and Tailings Pond, was crushed at a size of −4 mm using a jaw crusher. Working samples were obtained after homogenization and quartering using a Jones splitter. Feed monosizes of 3350/2000, 2000/1000, 1000/500, 500/250, 250/125, 125/75 and 75/45 µm were obtained in a sieve shaker using a series of sieves with the openings of above.
Next, feed was characterized by means of grain-size analysis of the above-mentioned size fractions and by means of XRF analysis of fused bead samples using a 4 kW BRUKER spectrometer (Leipzig, Germany), specifically calibrated for this mineralogy, installed in the ALS laboratory at the Penouta mine.

3.2. Calculation of the Critical Speed and Initial Conditions for the Grinding Kinetics Tests

Critical speed was calculated using Equation (5). Table 1 displays mill rotational speeds as a function of ball monosizes for each test.
Dry batch milling kinetics tests were done in a lab-scale mill, 17.8 cm in diameter and 4.5 L in capacity, on a 600 cm3 representative volume of each Penouta mine sample. The mill charge consisted of 5.0 kg of steel balls, of 19.0 mm, 22.0 mm and 31.0 mm monosizes. Fill fraction was calculated from Equation (6). Seven feed size fractions (3350/2000, 2000/1000, 1000/500, 500/250, 250/125, 125/75, 75/45 µm) were used to evaluate the influence of this mineralogical variable in the kinetic parameters. Mill discharges were marked through 5 grinding times (0.5; 1; 1.5; 3.5; 7.5 min). This way, each sample was dumped from the mill, and then it went through a grain size analysis by means of dry sieving. In addition, after completing the grinding time, Sn, Ta and Nb content was determined for the undersize to grid i in order to evaluate the evolution of Sn, Ta and Nb grades, with respect to the specific rate of breakage.

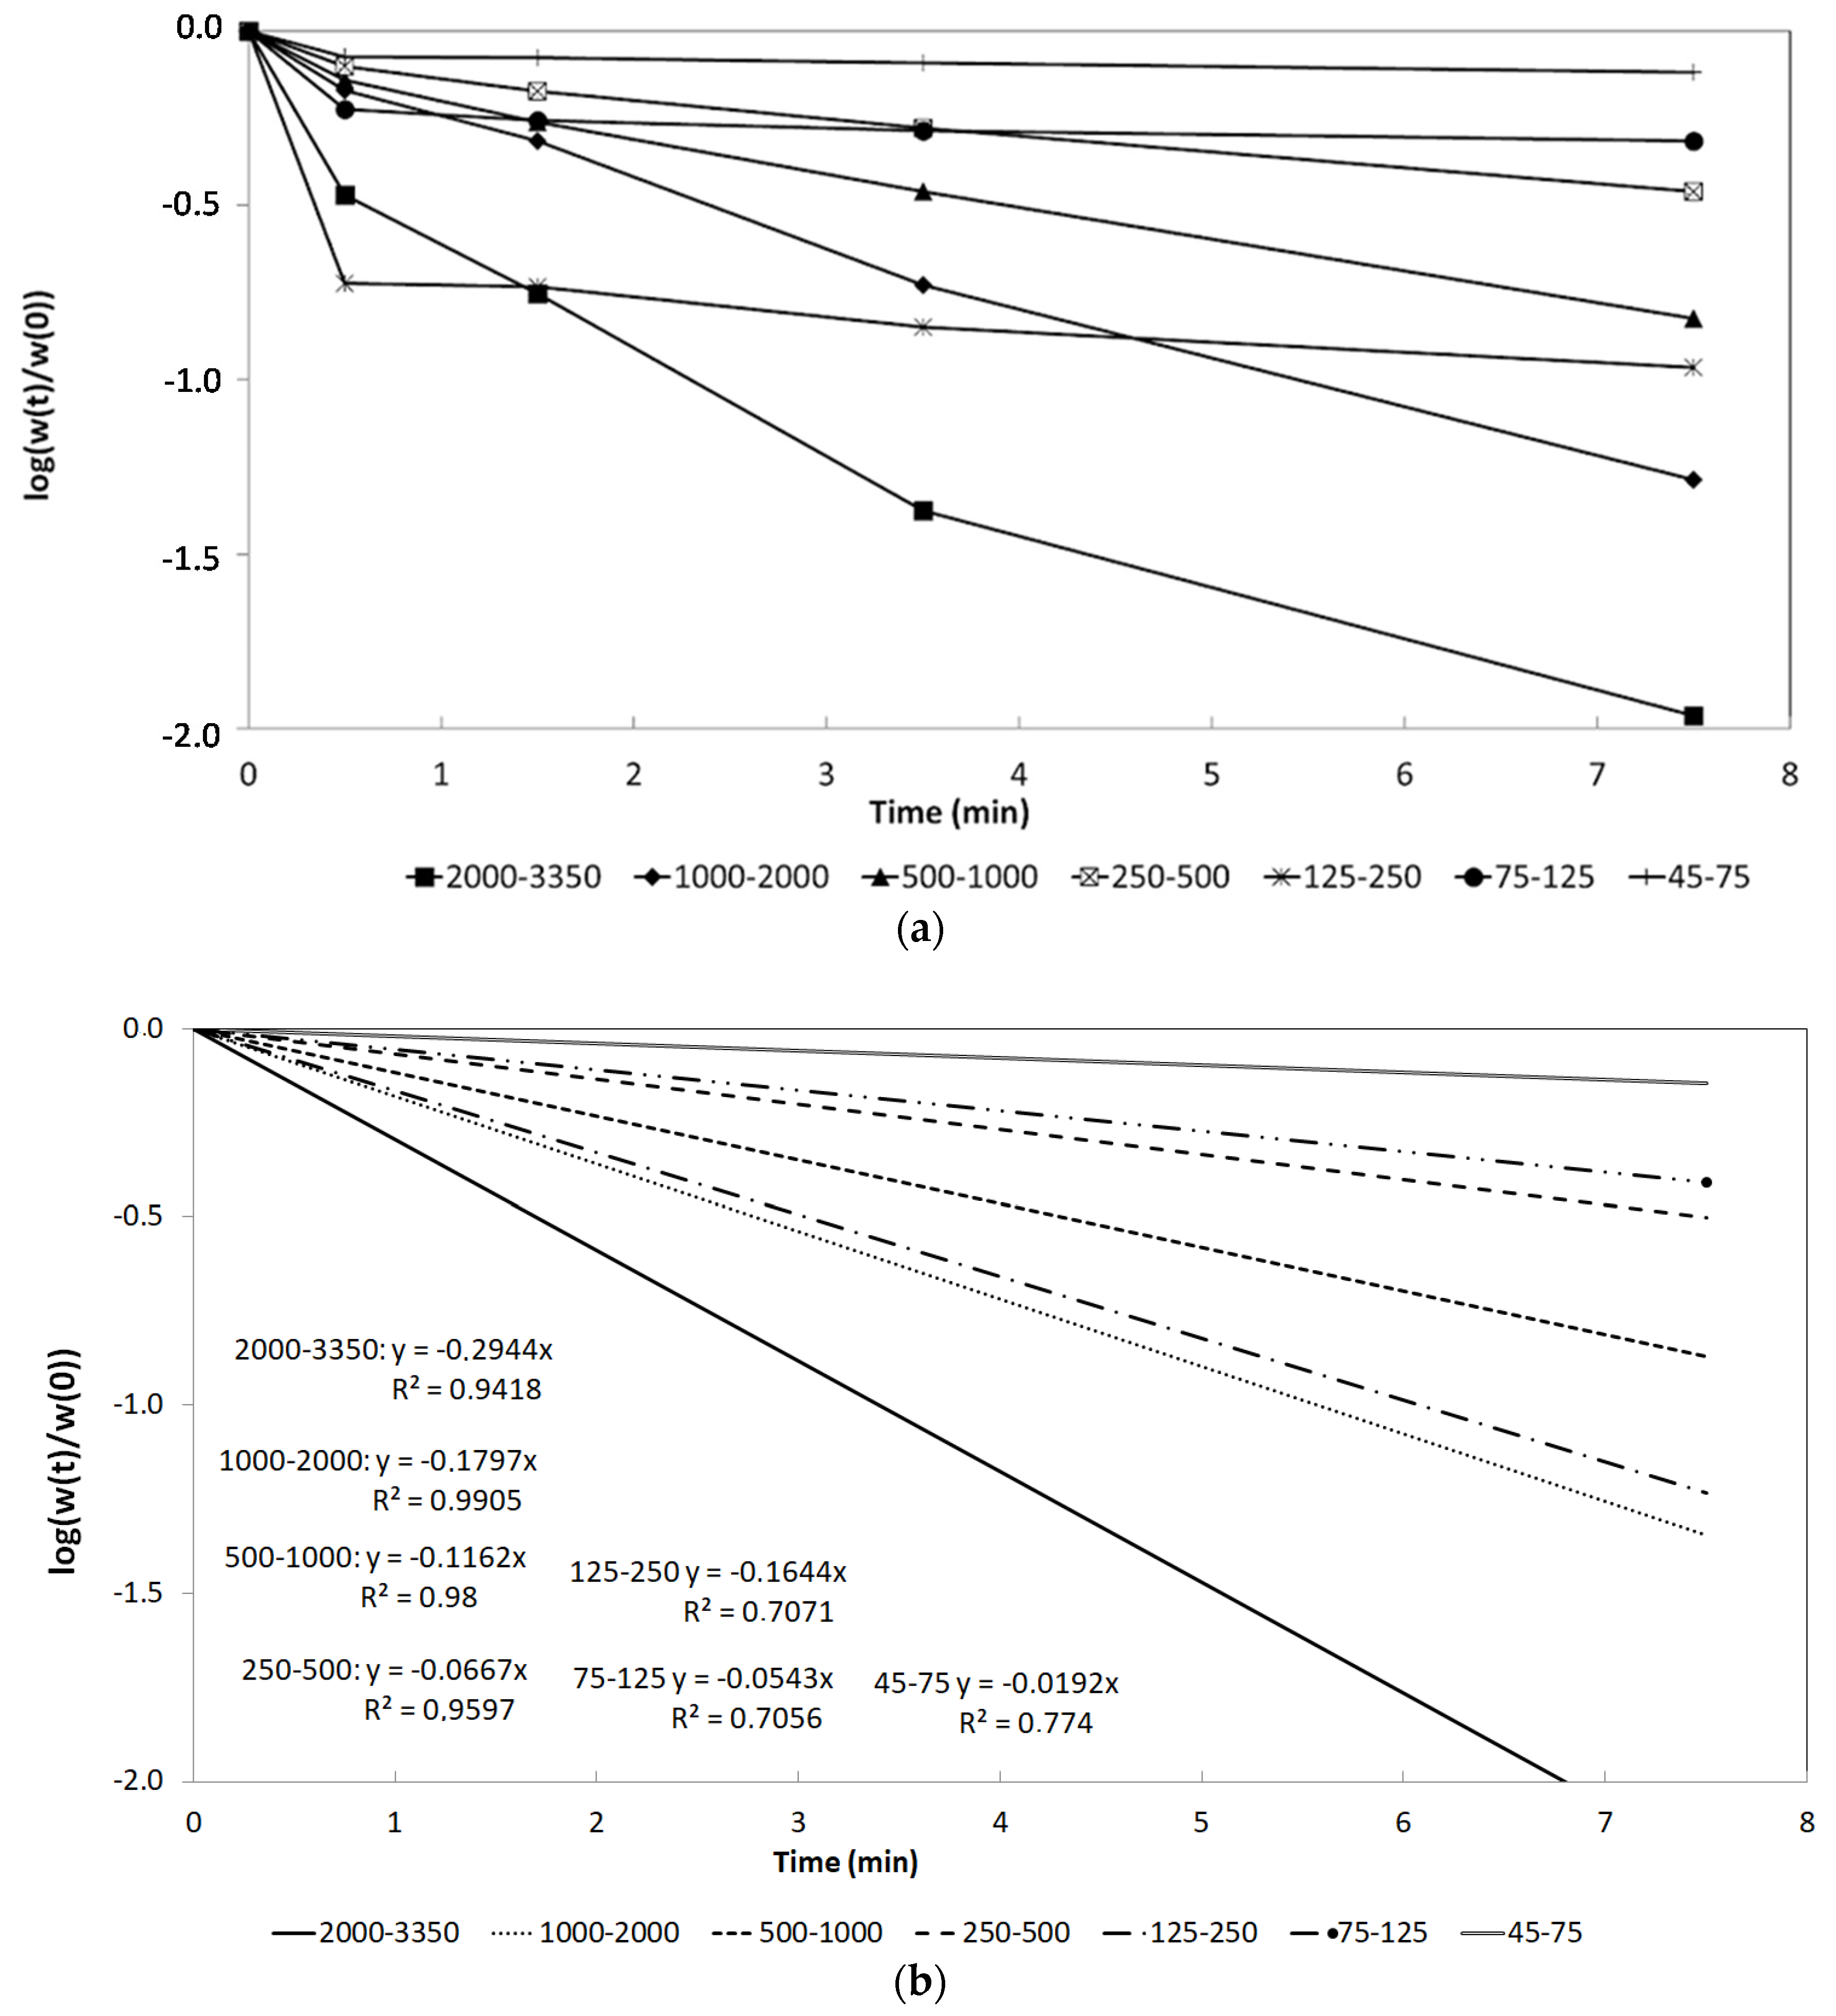
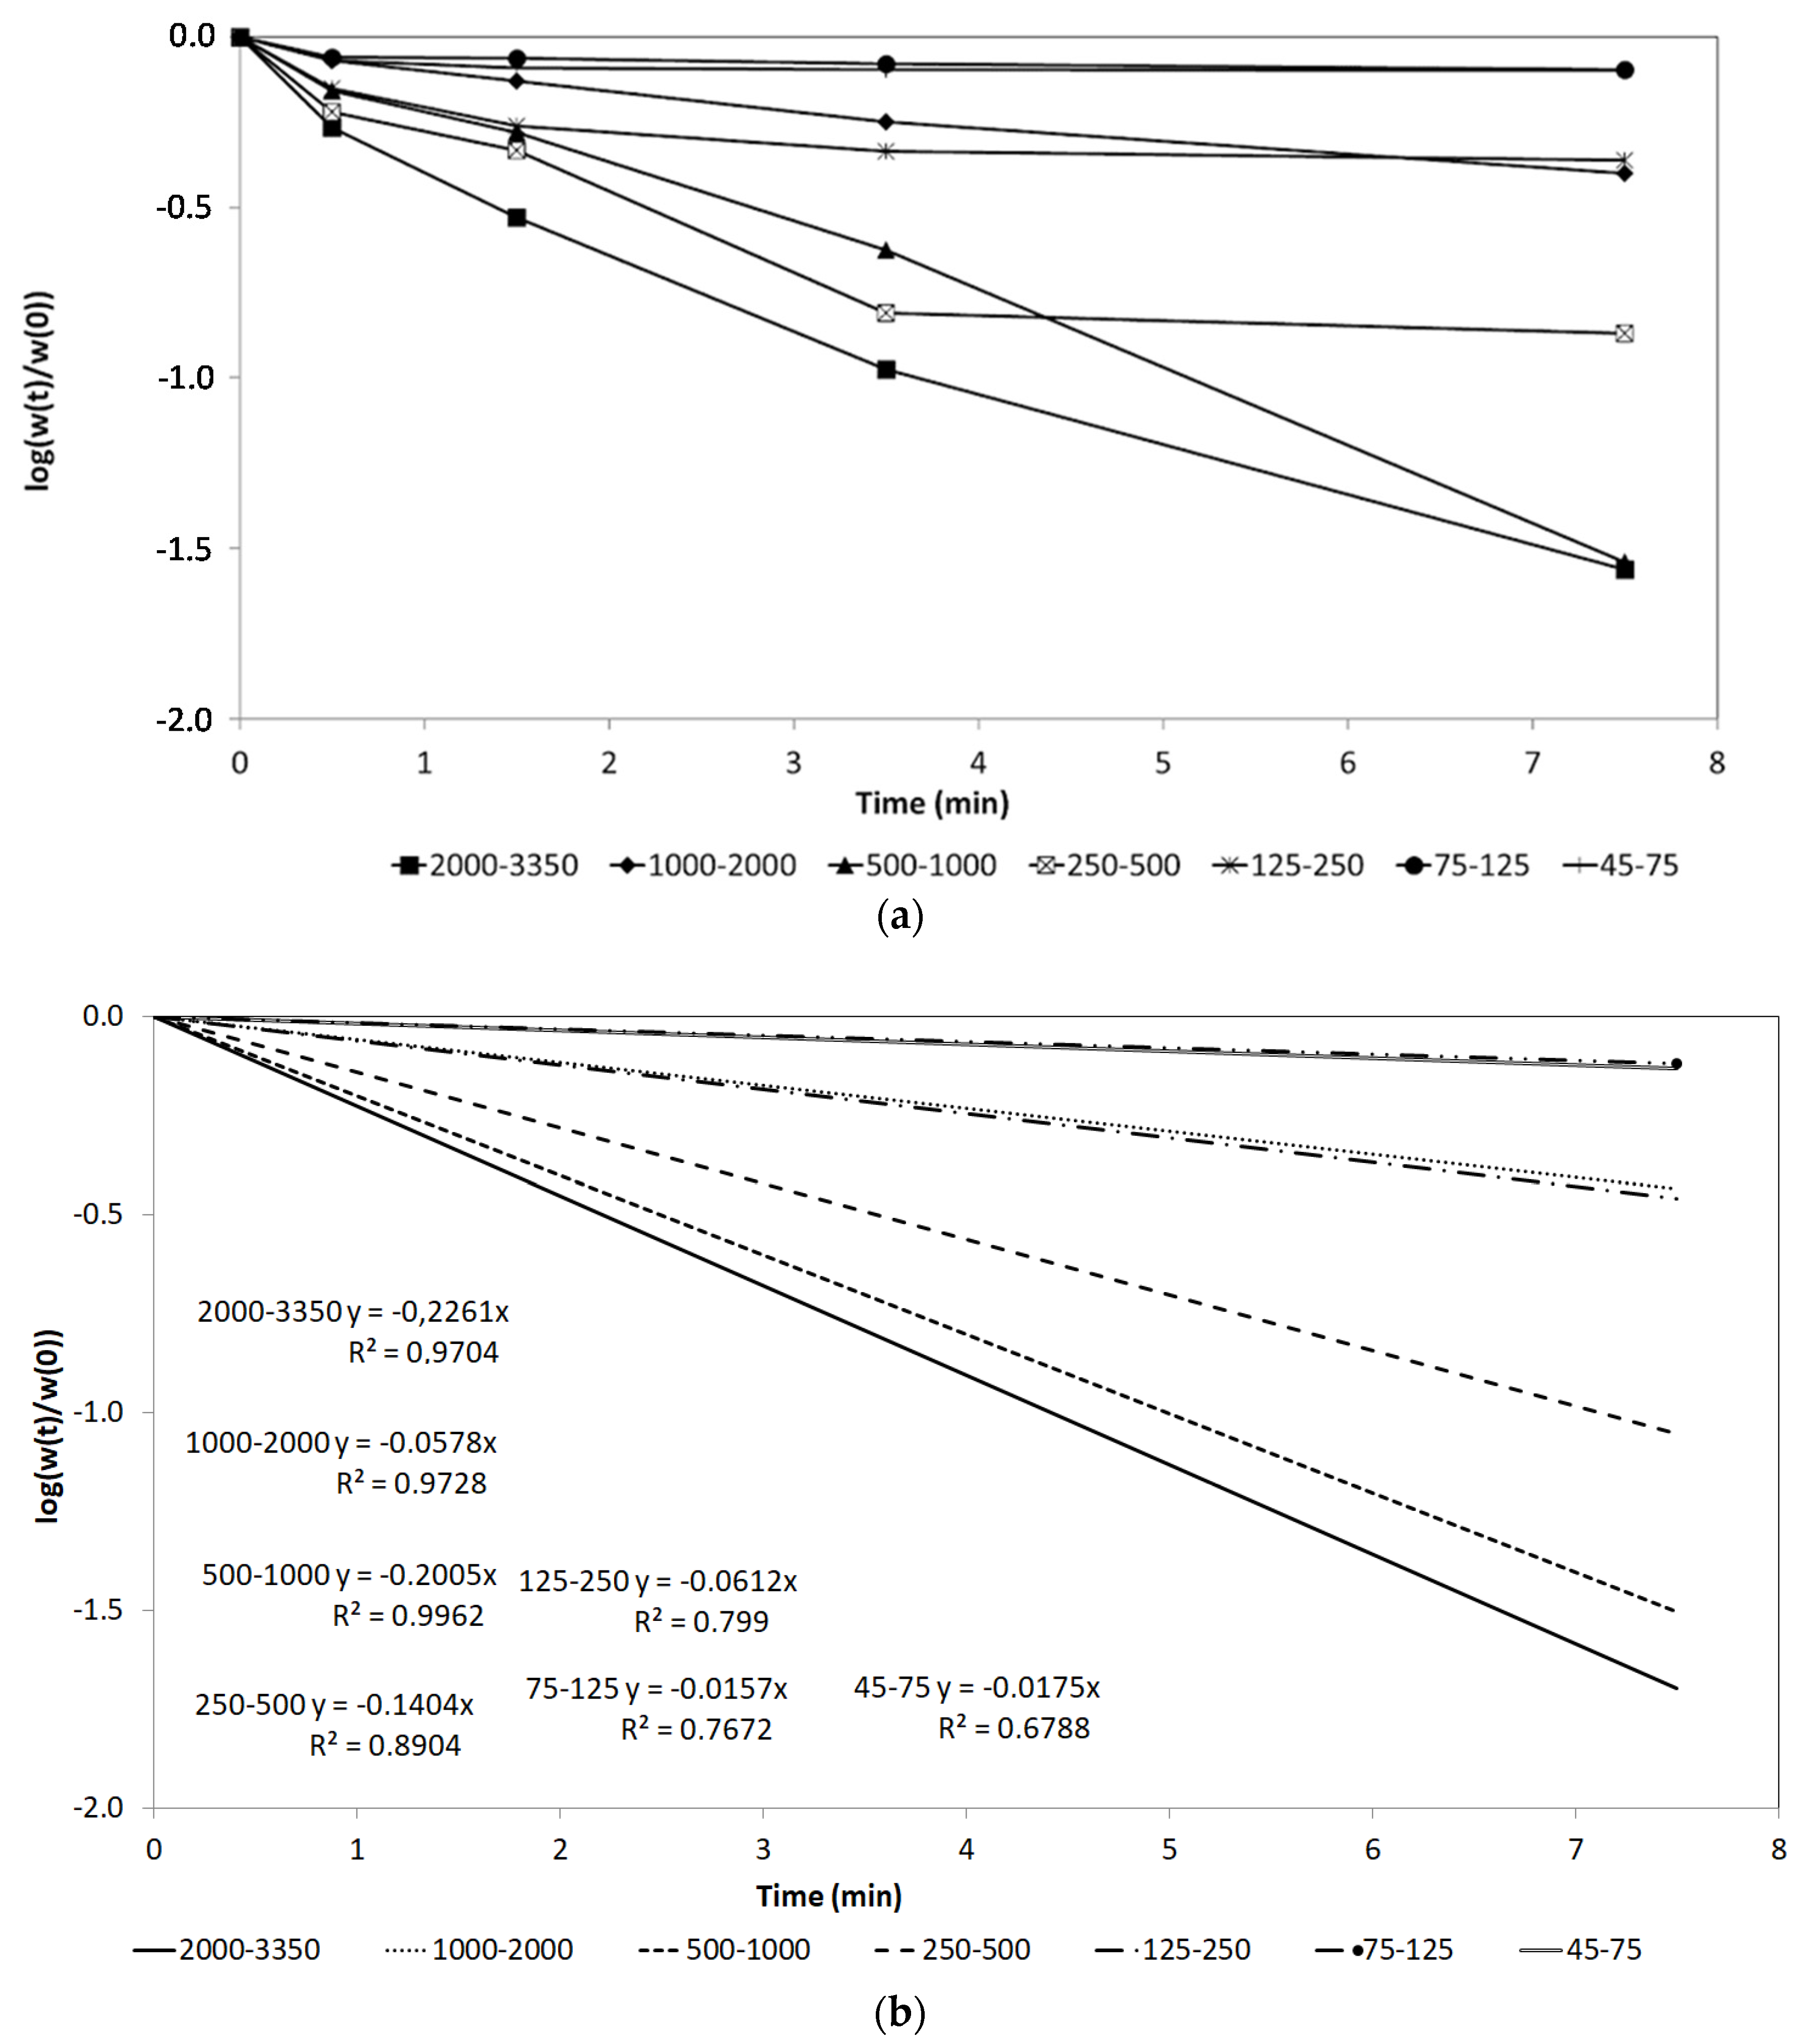
3.3. Determination of the Specific Rate of Breakage (Si) and the Kinetic Parameters (αT, α)

Following the BII methodology introduced in [27], after measuring the oversize weight for each grinding time, the graph log (wi(t)/wi(0)) vs. time is plotted for each monosize. The equation of each curve and thus the Si value are obtained through linear fitting using Equation (3). Then, the Si values for each monosize are plotted and using Equation (4) the parameters (αT and α) are calculated for each condition of mill speed and ball size. This allows studying the influence of these two operational variables on the specific rate of breakage and the kinetic parameters αT and α. The selection function αT was formulated by means of Equation (9). Nevertheless, this is a general equation, so a specific formula was generated to characterize the samples Bedrock and Tailings Pond from Penouta mine.

4. Results and Discussion

4.1. Chemical Characterisation of the Feed

Both the Tailings Pond and Bedrock head samples display the grain size distribution shown in Figure 1.
Bedrock and Tailings Pond samples display an F80 of 2110 μm and 1369 μm, respectively. The smaller F80 value of Tailings Pond sample results from this material having been previously processed during the mining activities throughout the 20th century, until the 1980s.
The representative chemical composition for both the Tailings Pond and Bedrock head samples is shown in Table 2 and has been obtained through XRF analysis in the ALS-Penouta lab.
The obtained values are consistent with Polonio [30], taking into account that the tailings pond contains 4,815,307 metric tonnes of material, which, as occurs in this kind of deposits, displays a highly heterogeneous distribution of the metals of interest, in contrast to the homogeneous distribution displayed by the source rock. Furthermore, Sn, Ta and Nb values obtained for the Bedrock sample are within the range reported by [30,31,32].

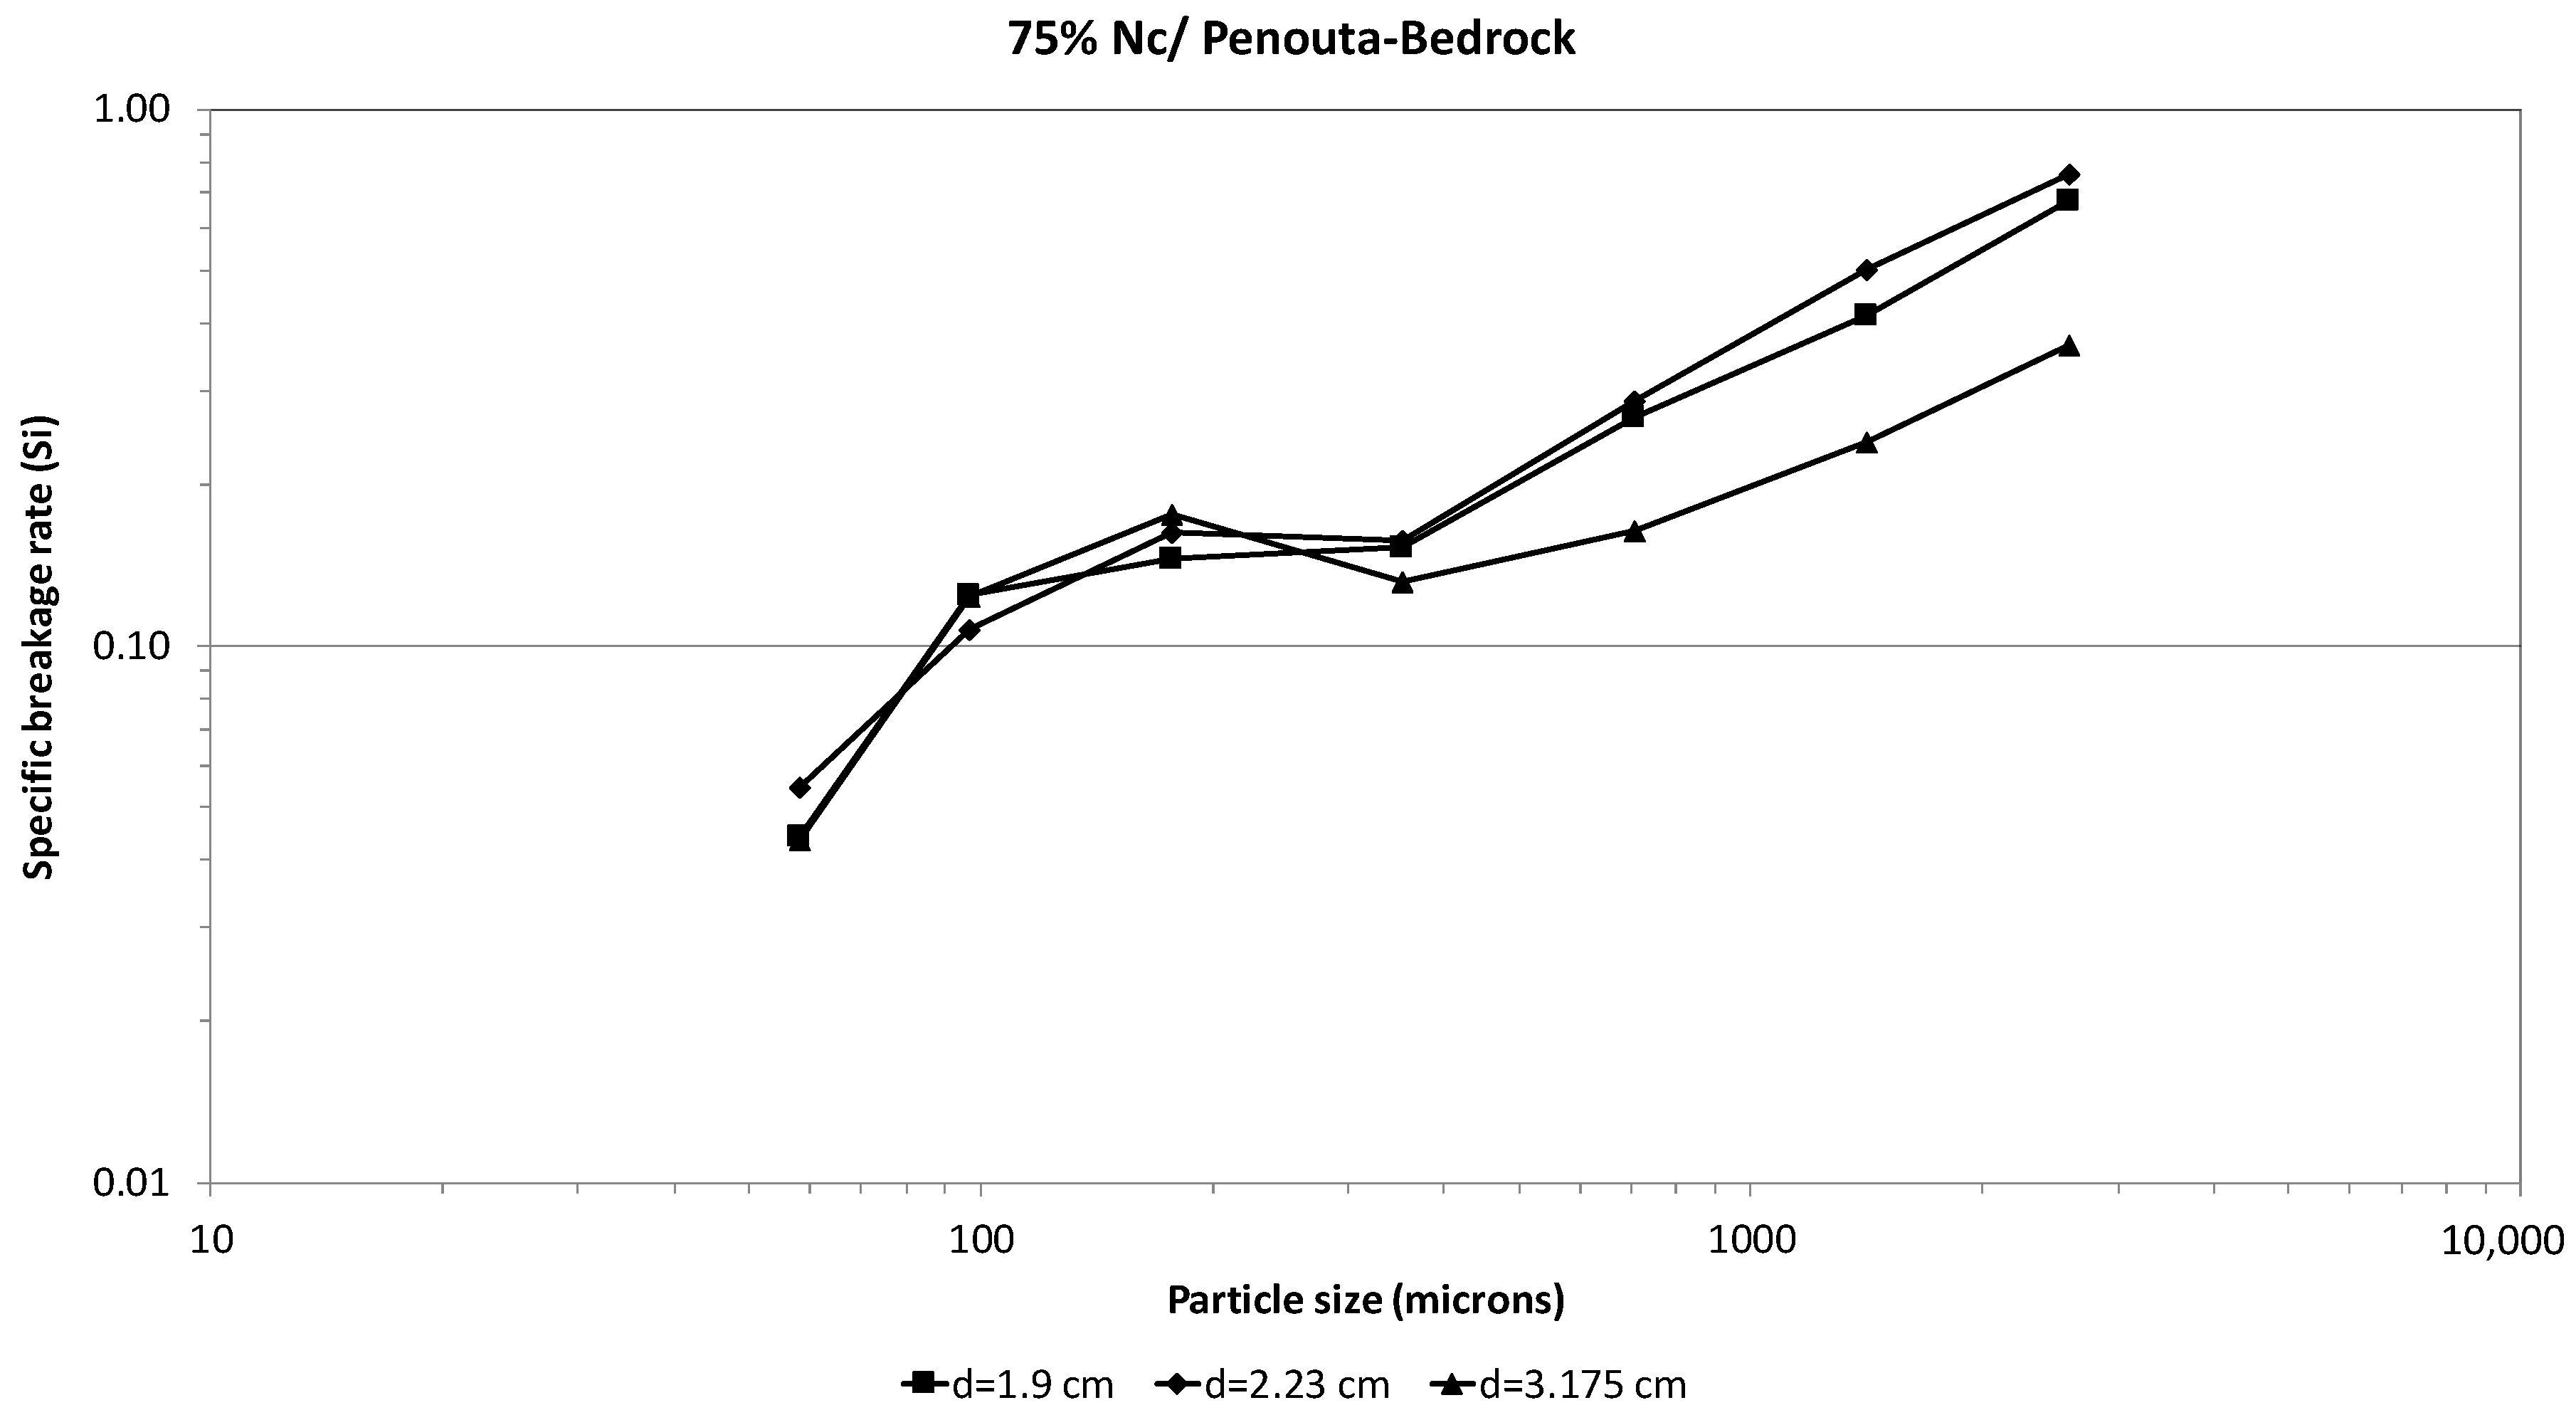
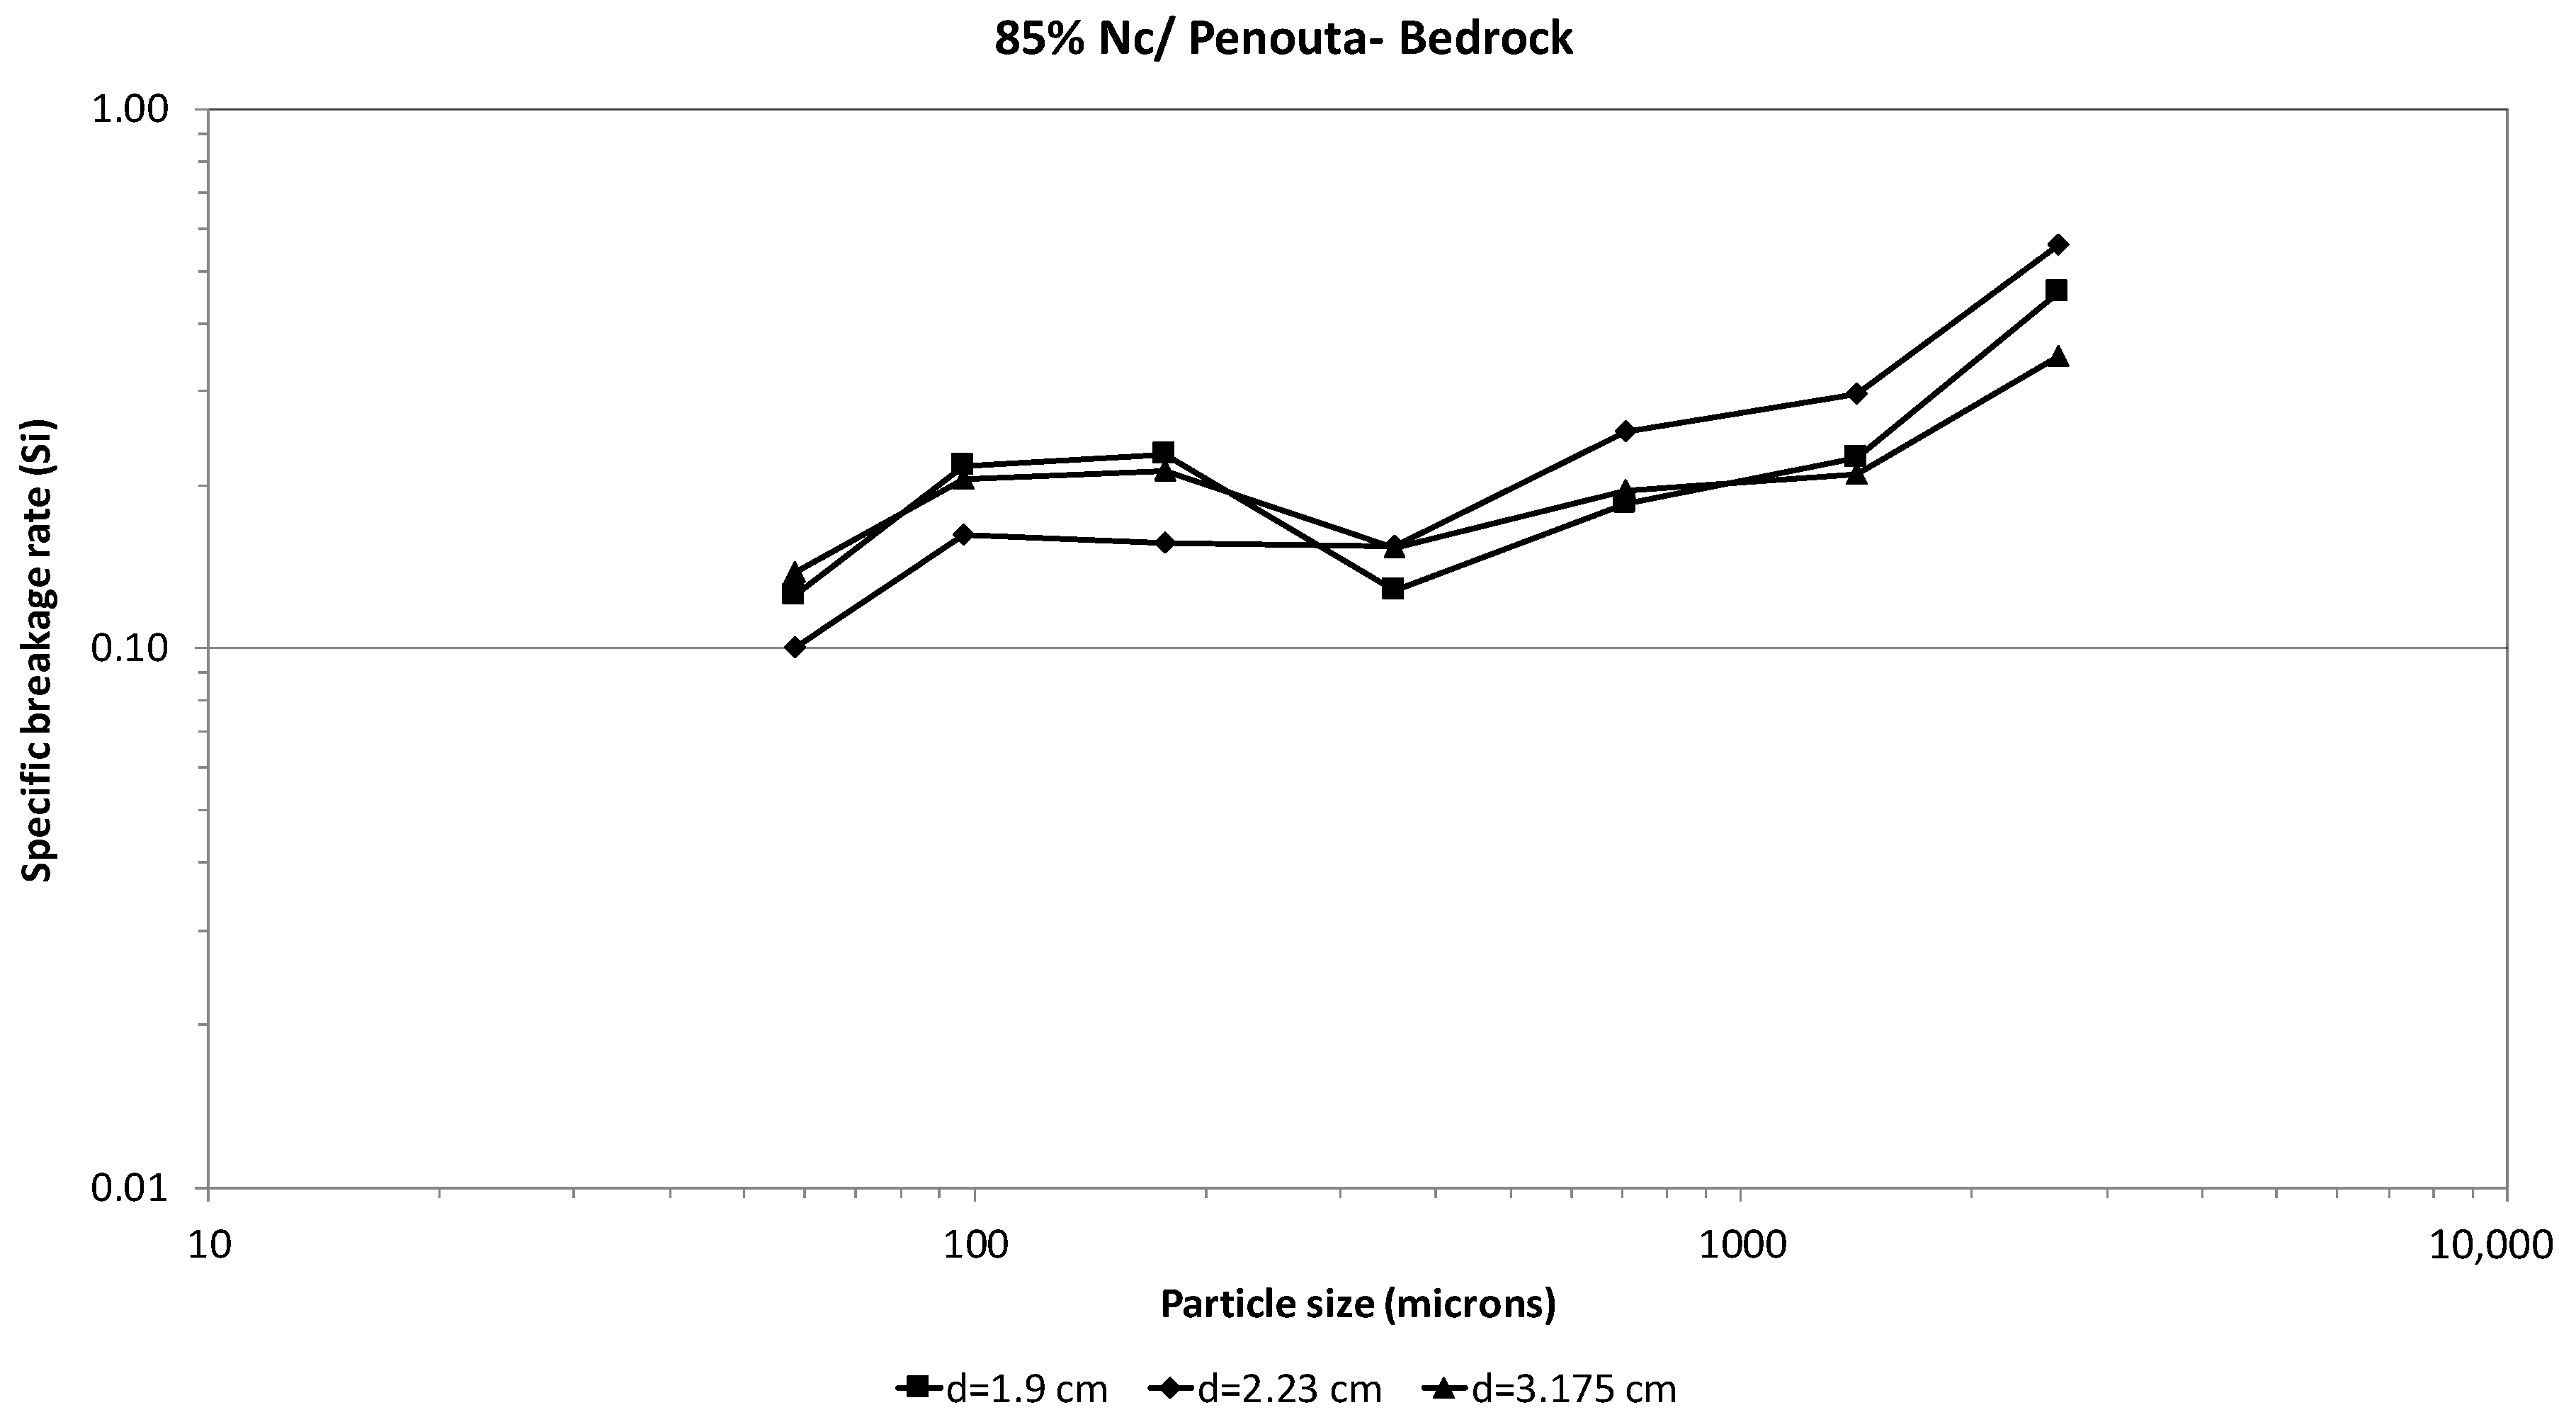
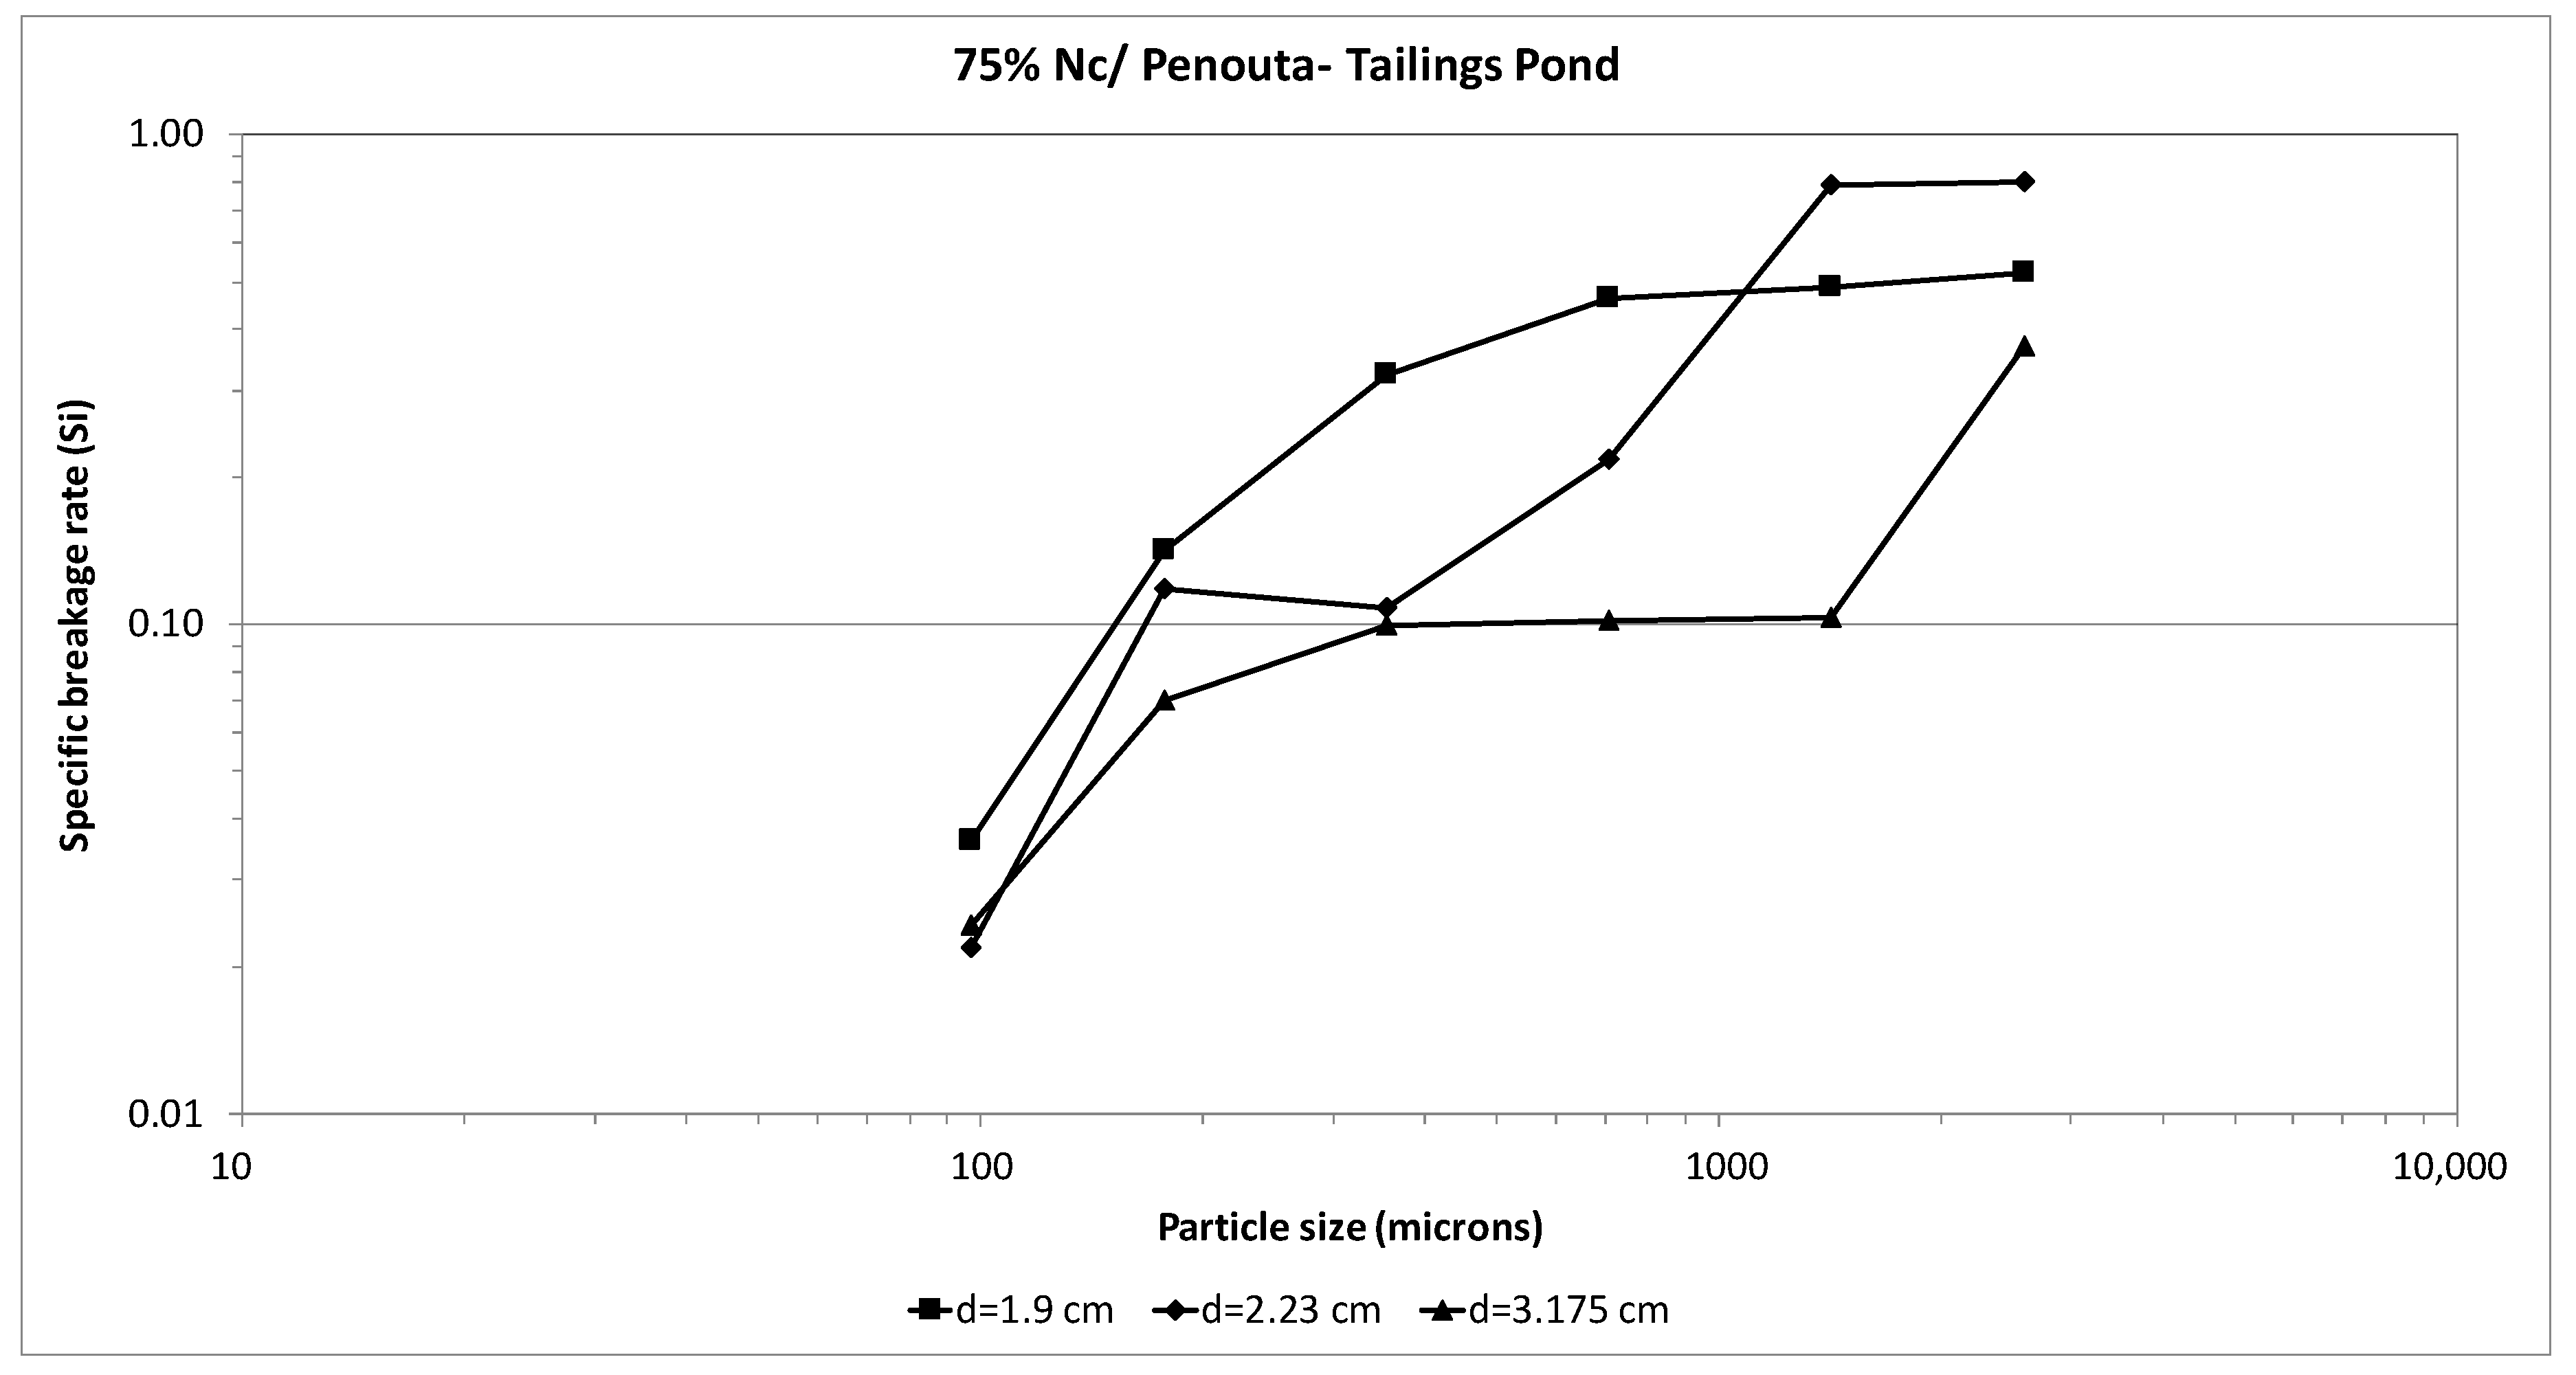
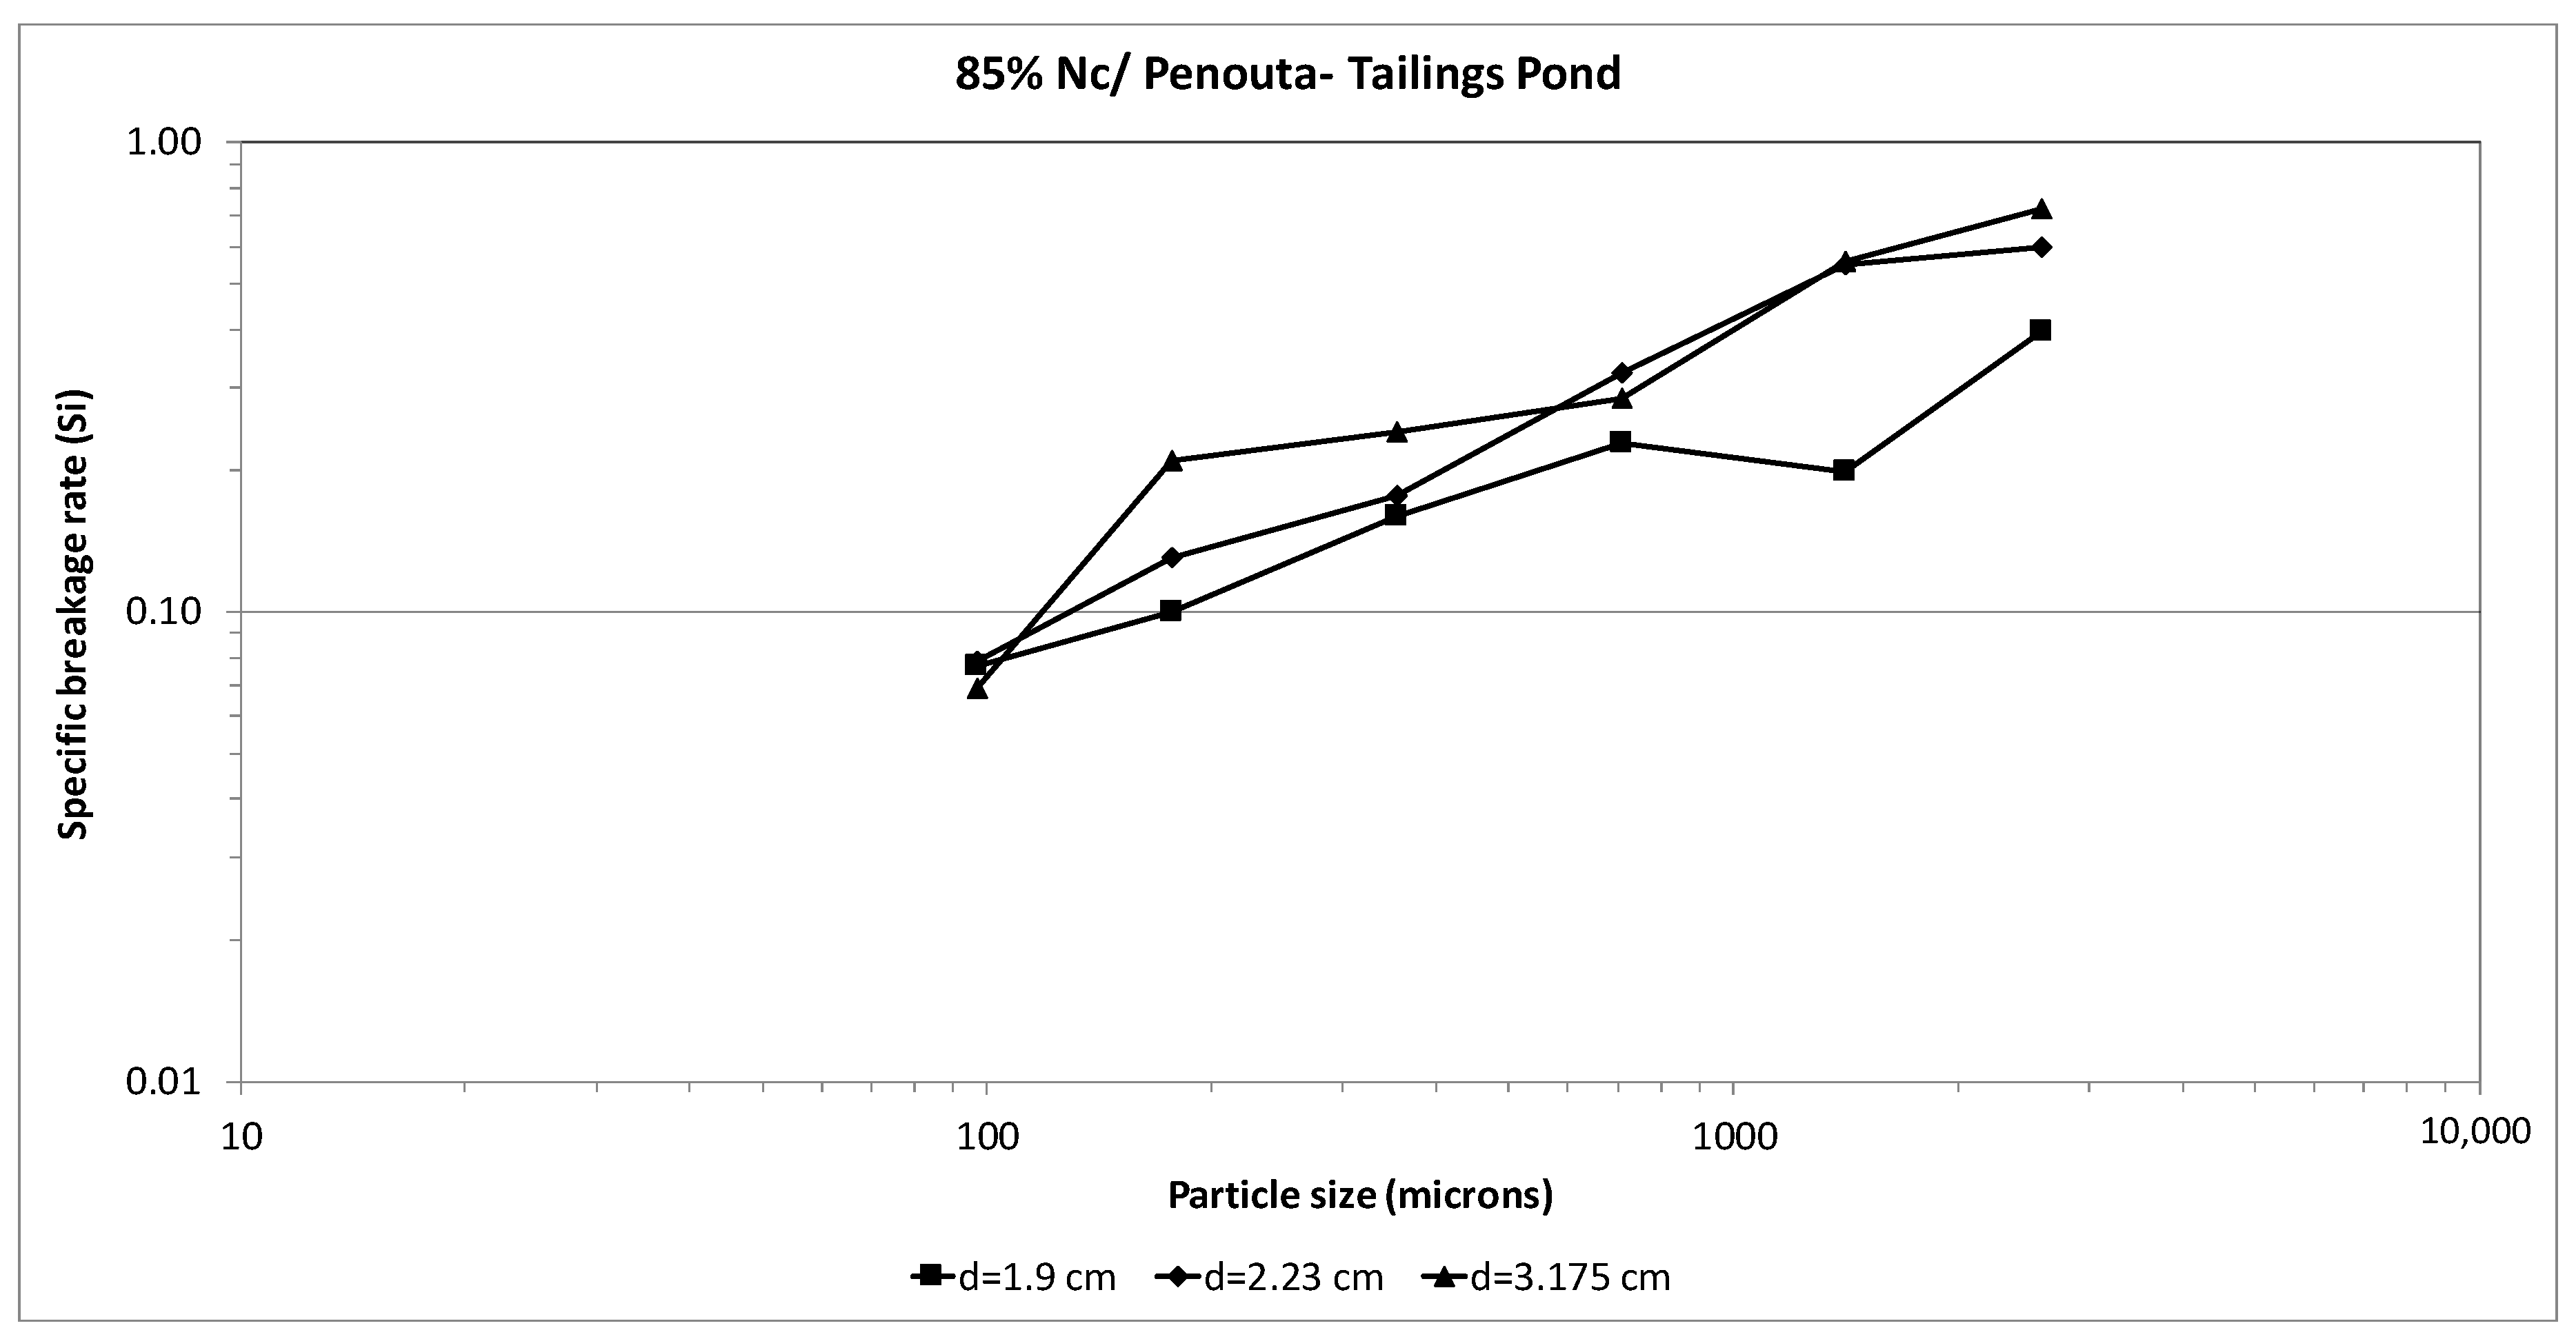
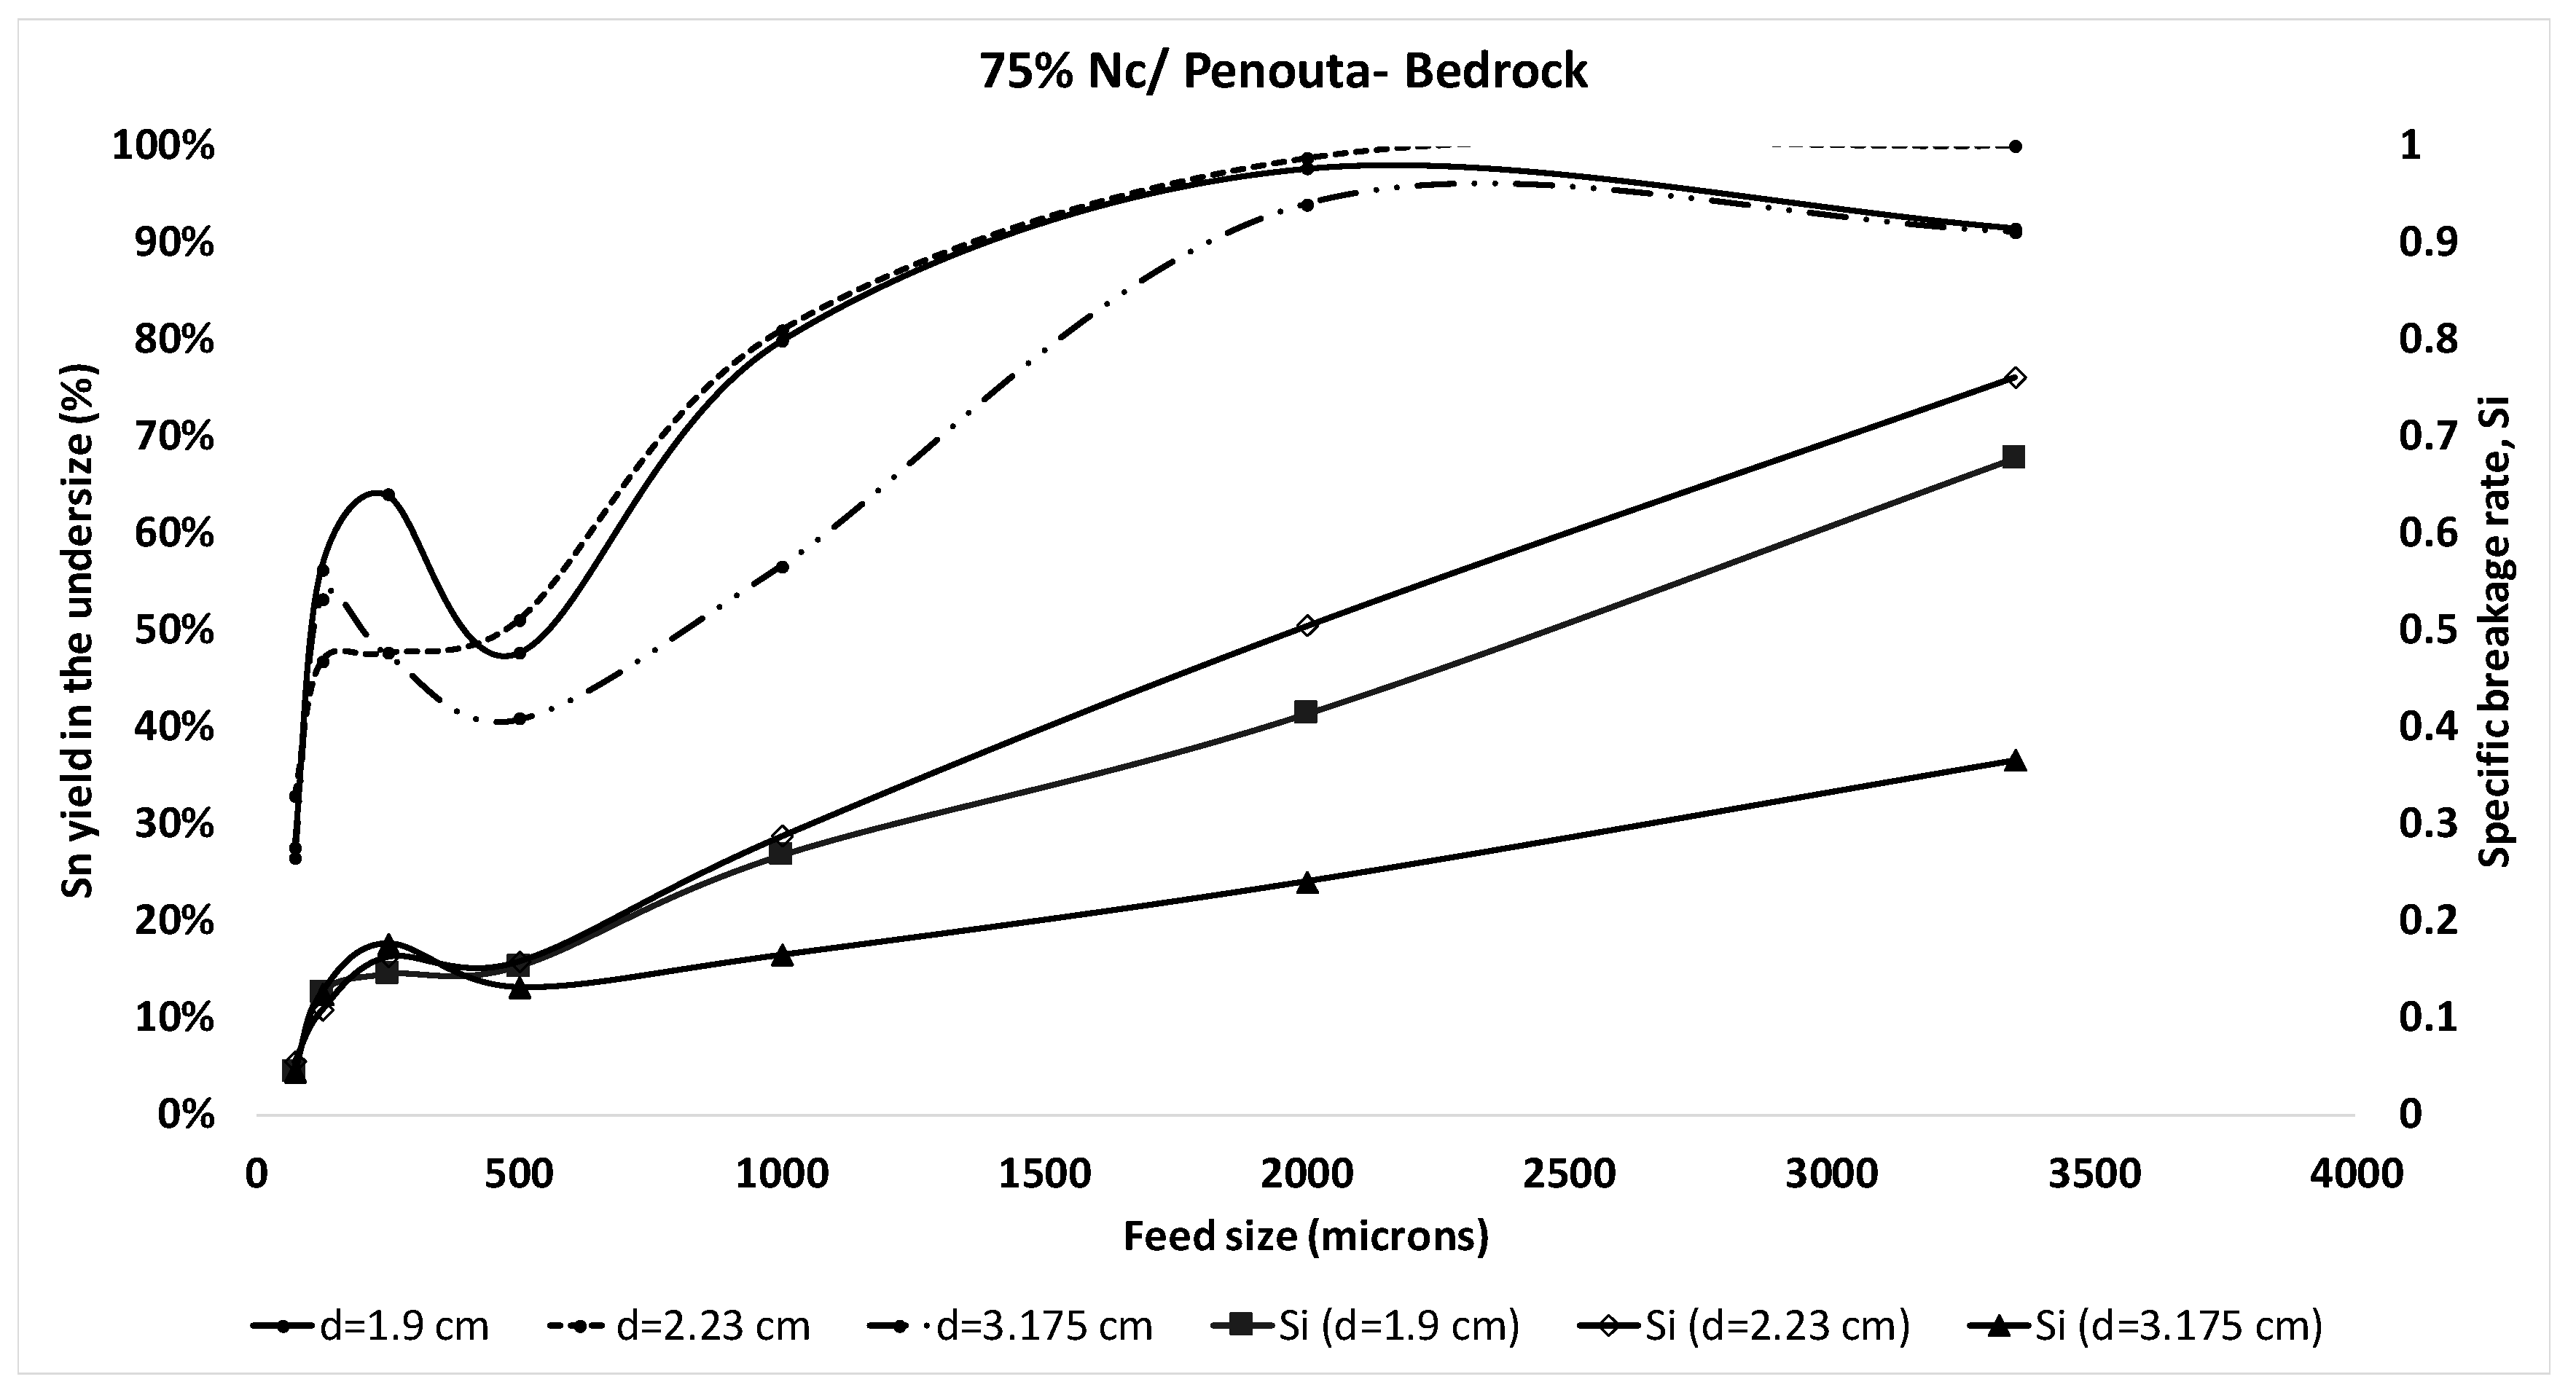
4.2. Obtaining the Specific Rate of Breakage (Si)

Figure 2, Figure 3, Figure 4 and Figure 5 display the relationship between log (wi(t)/wi(0)) and time for 75% and 85% critical speed and ball size d = 1.9 cm, for Bedrock and Tailings Pond samples.
Figure 2, Figure 3, Figure 4 and Figure 5 show a deviation from the straight lines at initial grinding stages. This is probably due to abnormal breakage and, according to [8], it should be performed a pre-grinding stage in the mill for about 2 min in order to avoid abnormal breakage behavior, which was not considered in this study.
Overall, fracture velocity of the feed monosizes fits a first order kinetic behavior, thus, being independent from time. Si was obtained for each sample using Equation (3), and the slope calculated from Figure 2, Figure 3, Figure 4 and Figure 5 for each ball-size and mill-speed condition. The relation between the specific rate of breakage Si, and feed grain size was plotted in Figure 6, Figure 7, Figure 8 and Figure 9 for each condition to visualize the behavior of Si, as operating parameters varied for each sample.
In Figure 6, Figure 7, Figure 8 and Figure 9, the specific rate of breakage Si in the usual operational range increases as ball size diminishes [8,10,11,26,33,34,35], as happens for most of the feed grain sizes at 75% of critical mill speed. Nevertheless, at 85% critical speed, the opposite seems to happen for the Tailings Pond sample shown in Figure 9. This is probably due to better behavior under a greater influence of mill speed and ball size, mainly for the coarse feed particles size as a consequence of a greater influence of the impact breakdown and the cascading effect [36,37]. In addition, the harder ores, such as Tailings Pond samples and the coarser feeds, require high impact energy and large grinding media, and, on the other hand, very fine grind sizes require substantial grinding media surface area and small grinding media [38,39,40]. As a consequence, medium size balls (d = 2.23 cm) seem to have a better performance for most feed sizes, mill speeds, and samples tested [10,34,41,42].

4.3. Kinetic Parameters (α, αT)

The grinding kinetic parameters for Bedrock and Tailings Pond samples from Penouta mine are shown in Table 3 to study the influence of ball size and mill speed in those parameters.
It can be seen that α values fall within the reported normal values [26], and that the selection function αT varies little with mill speed. From this data, the graph of Figure 10 was constructed. It plots the selection function, αT, vs. the ball size, at constant working speed, for the studied samples.
From Table 3, the Bedrock sample yields higher αT values than Tailings Pond sample, thus, being ground more rapidly than the latter. It must be highlighted that the Bedrock sample was taken from a slightly altered leucogranite, which results in low hardness and fracture strength. On the other hand, and due to its origin, the sandy Tailings Pond sample is heterogeneous, with a higher quartz content. It is a previously processed material and, consequently, with a higher fracture strength. In his study focused on the parameter αT, Teke et al. [33] found a linear trend between that parameter and the ball size, characterizing the mineral calcite in this way. A good approach to determine the selection function from ball diameter in the studied samples is shown in Figure 10 with the Bedrock and Tailings Pond samples characterized through Equations (8) and (9), respectively.
α T = d b + 0.1453
α T = d b + 0.0128
where αT is the selection function and db is ball size in cm.
In this sense, the results shown in Figure 10 are sound and agree with the Bond index trends previously reported for the same samples [43]. Other authors [9,44] also compared the features of other rocks like quartzite and metasandstone through the selection function, αΤ.

4.4. Chemical Characterisation of the Grinding Products

The results depicted in Figure 11, Figure 12, Figure 13 and Figure 14 show the relationship between the Sn yield trends and the specific rate of breakage, Si, for each mill-speed and ball-size condition employed. Table 4, Table 5, Table 6 and Table 7 include the Pearson coefficient in each case, showing a better correlation in the case of medium size balls in all cases.
Finally, Figure 15 and Figure 16 depict the plot of Sn, Ta and Nb yield in the undersize product, vs. the specific rate of breakage Si, at 75% mill critical speed and ball size of 2.23 cm for both studied samples.
The results depicted in Figure 11, Figure 12, Figure 13, Figure 14, Figure 15 and Figure 16 demonstrate that direct relationships exist amongst Sn, Ta and Nb yield in the undersize product, as elements of interest in the product, the specific rate of breakage and the operational variables mill speed, ball size and feed size. Consequently, it can be stated that, at 75% of critical speed, grinding is more efficient with medium to small ball sizes, whereas, at 85% of critical speed, better results occur with larger ball sizes. These conditions would represent the optimal working parameters to enhance the specific rate of breakage, thus, guaranteeing a proper mineral liberation and concomitantly a higher mineral recovery and product grade.

5. Conclusions

The experimental work done and its further analysis permit to draw the following conclusions:
  • Austin’s methodology has allowed studying the effects of ball size in the kinetics of dry and batch grinding over a wide range of feed particle size feed for the samples Bedrock and Tailings Pond (Penouta mine). The mineralogical and operational parameters studied in this investigation, mill speed, ball size and feed size, also influenced the grinding kinetics.
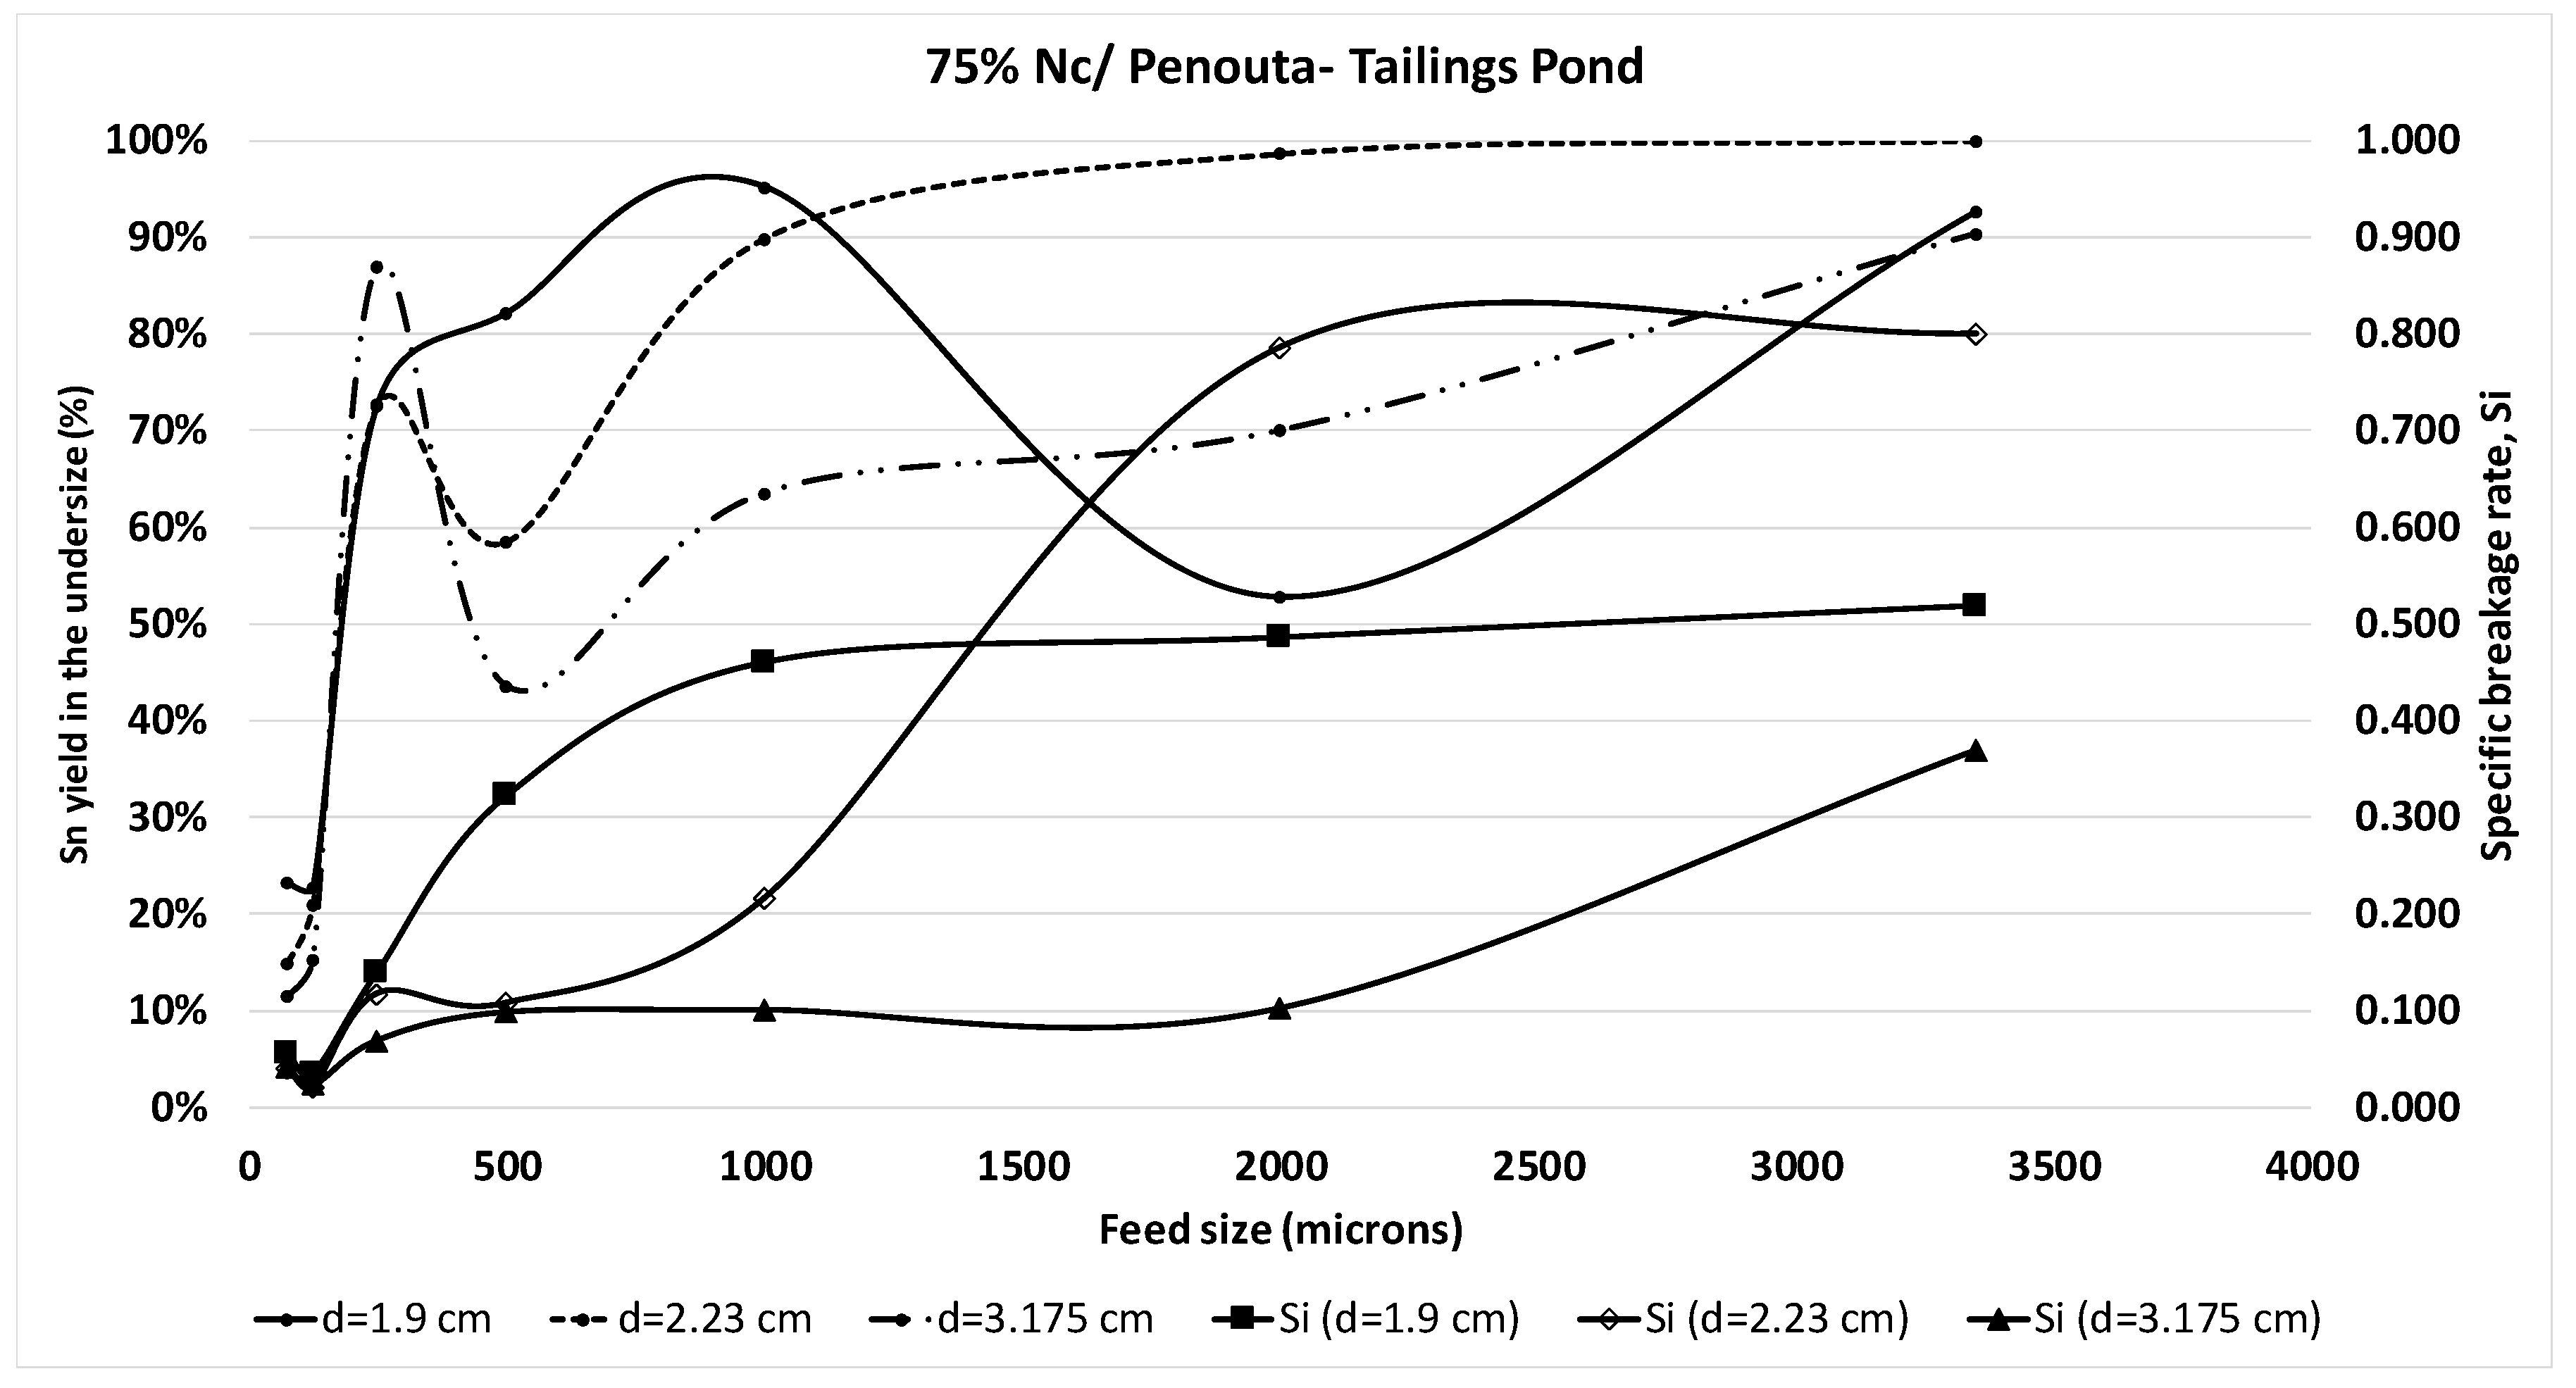
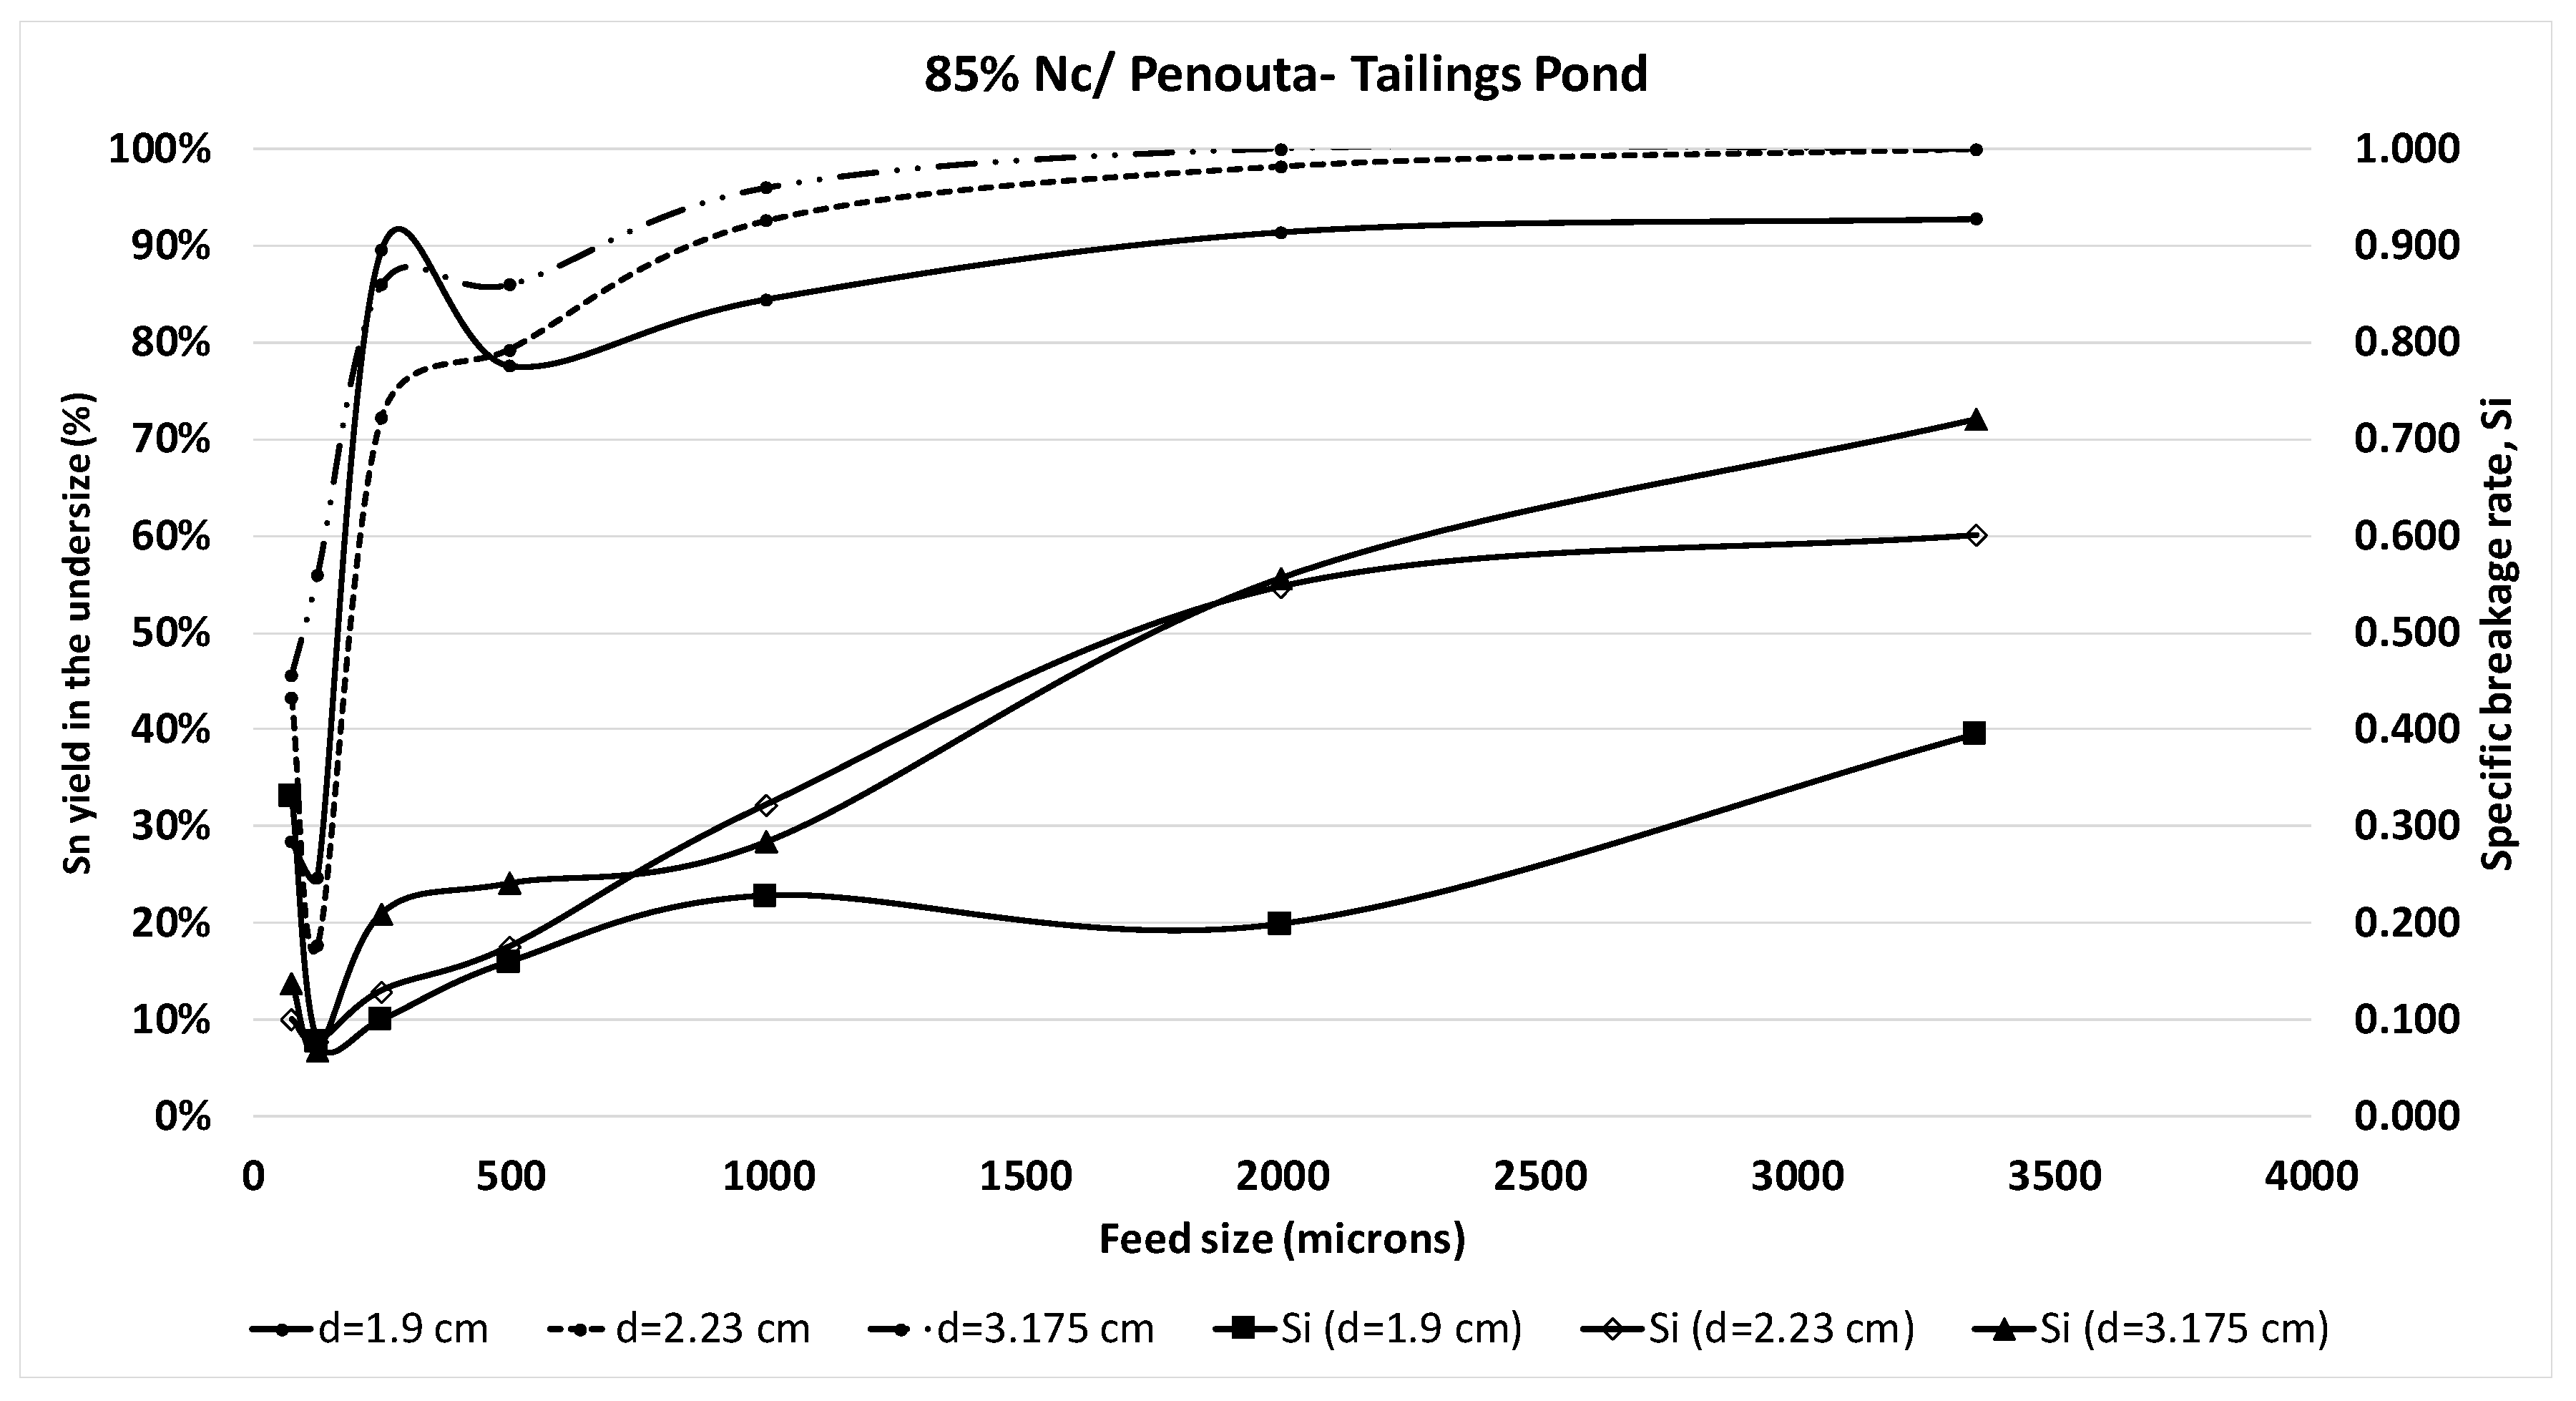
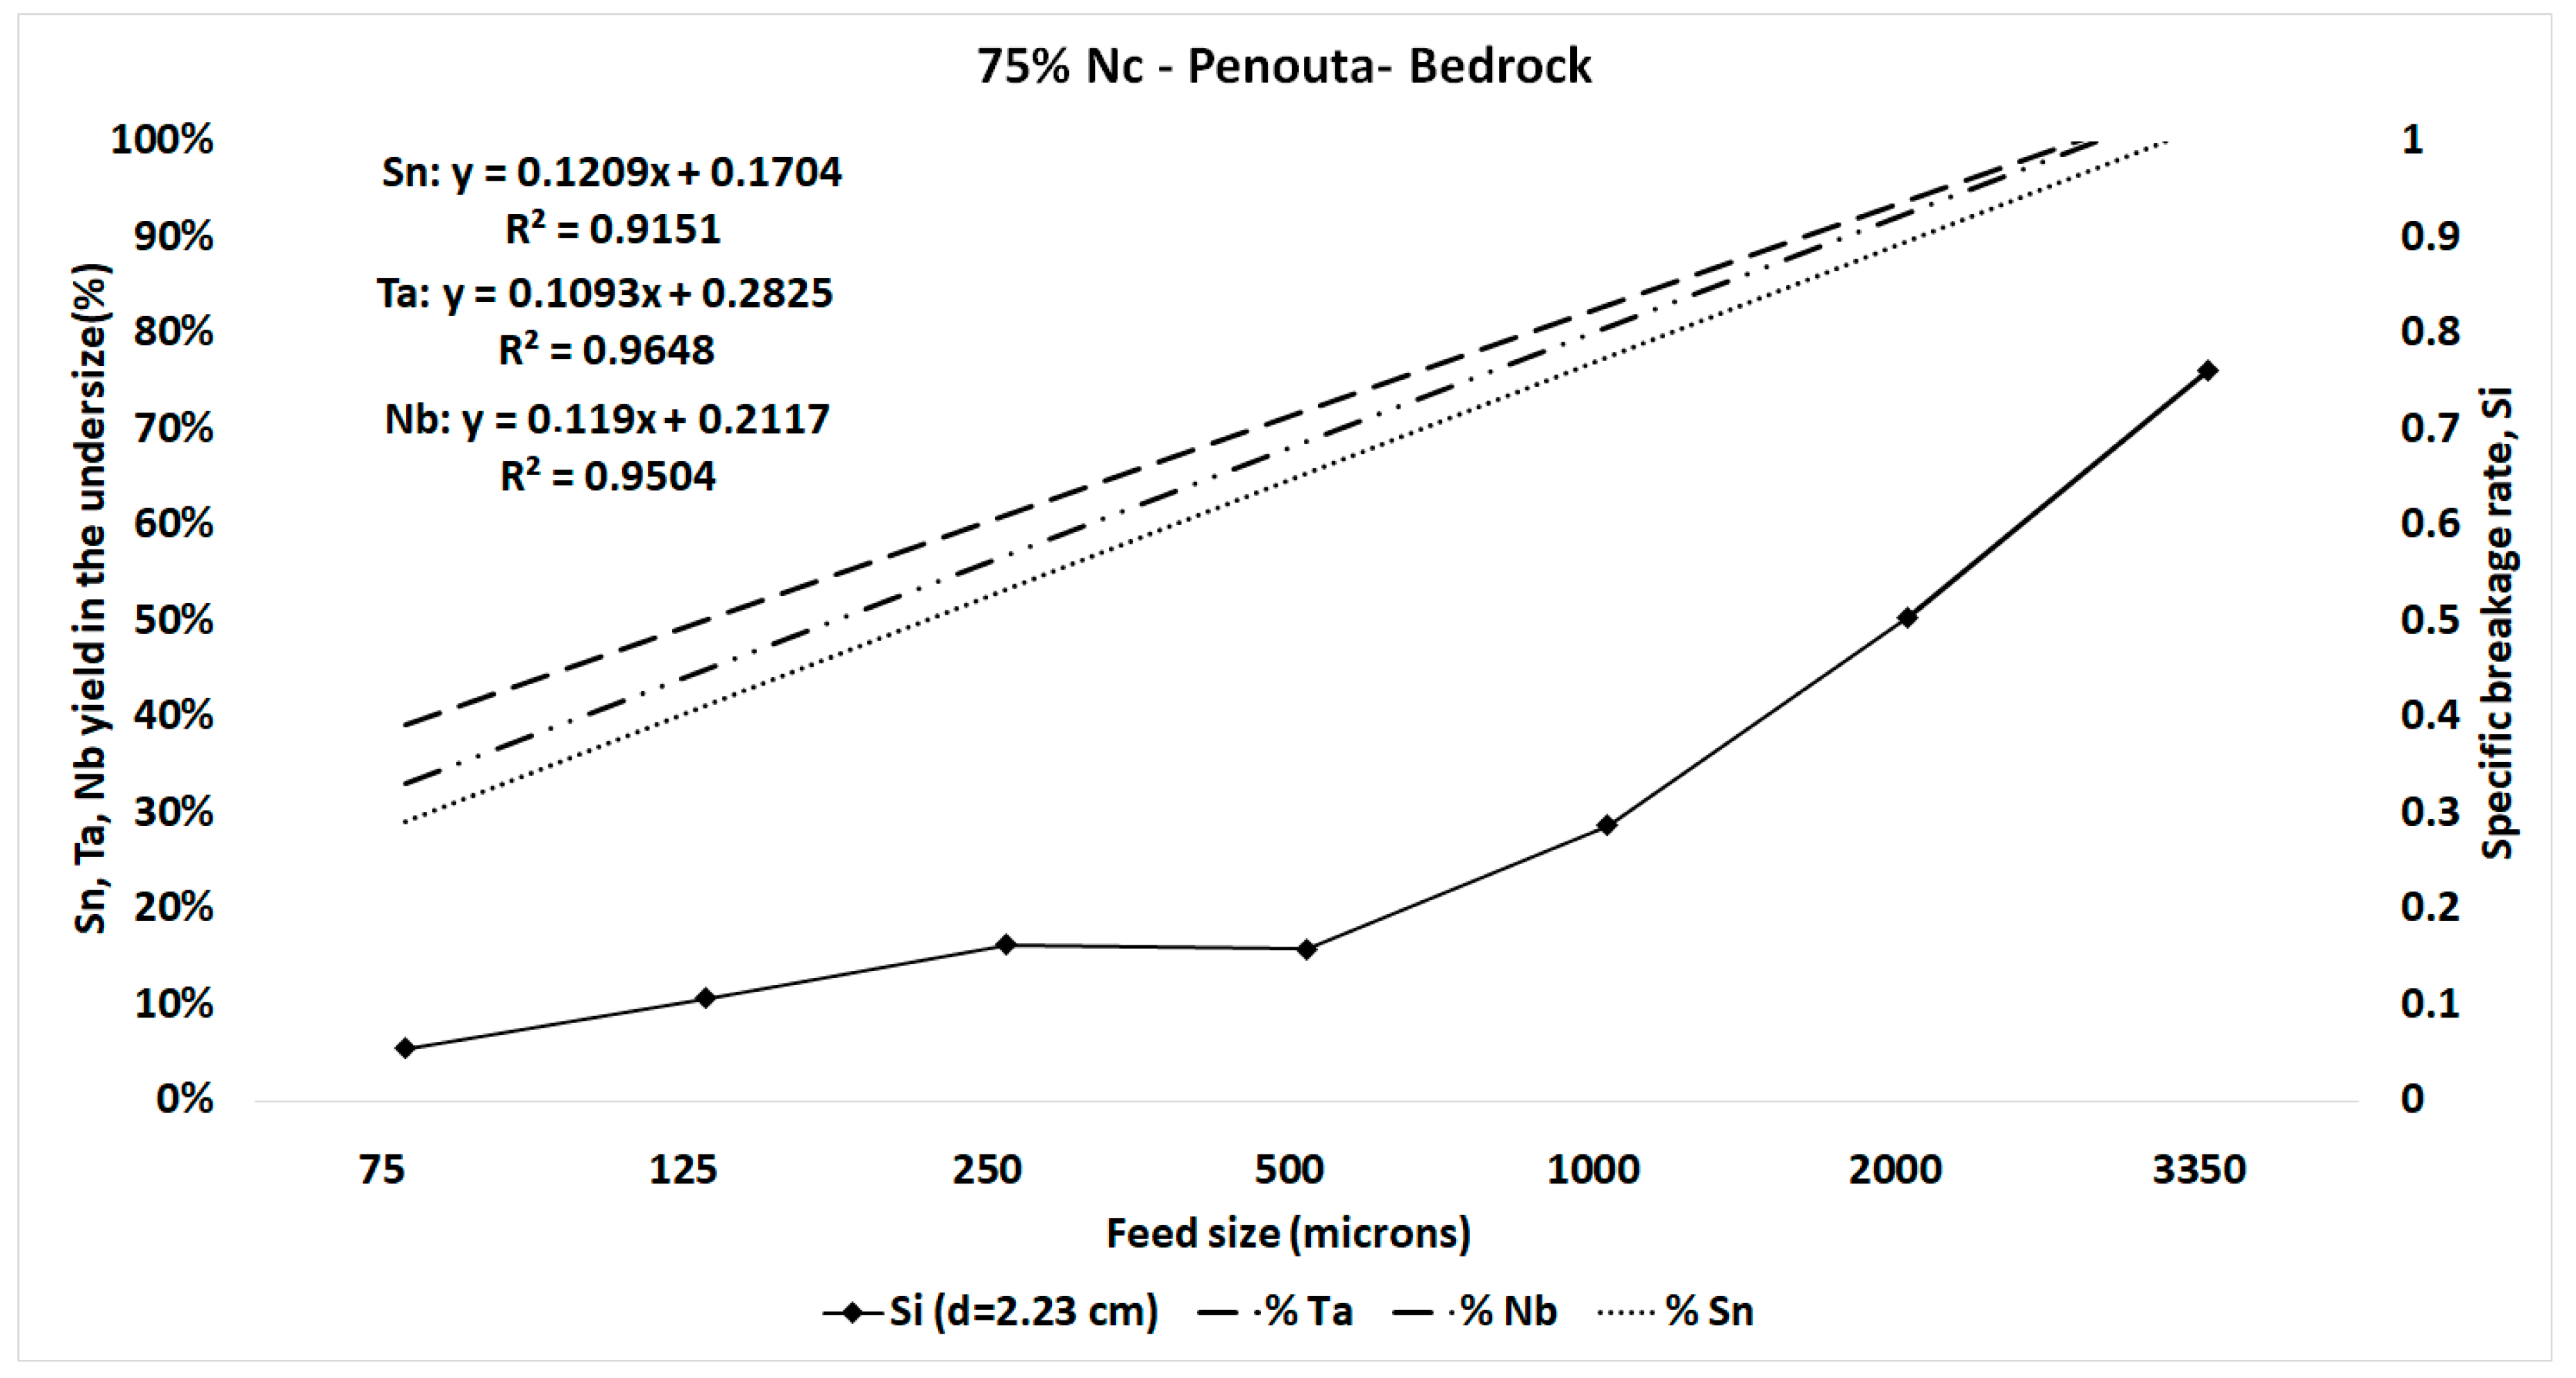
  • Si decreases as feed particle size decreases and ball size increases. This is due to a reduction of the effective grinding area over most conditions considered, and to the fact that the finer the particle size the higher the fracture strength, owing to the lesser crack and microcrack concentration in the particles.
  • A direct relation exists amongst Sn, Ta and Nb yield in the undersize product, the Si and the studied mineralogical and operational variables. Optimal mineralogical and operational conditions will increase the grinding efficiency to obtain the best liberation degree and the highest grade of minerals of interest, such as Sn, Ta and Nb, thus impacting positively the recovery scores of the plant.
  • Use of medium-diameter balls is recommended, since they yield a steadier behavior over a wide range of feed particle sizes and studied conditions.
  • Using ball size, a selection function, αT, was formulated for the Bedrock and Tailings Pond samples from the Penouta mine. This demonstrated that αΤ values are higher for Bedrock sample than for Tailings Pond sample, resulting in the former being ground more rapidly than the latter, as a consequence of their respective mineralogy and origin.

Author Contributions

Conceptualization and execution of experiments, J.V.N.; methodology, J.V.N.; formal analysis, J.V.N., T.L., J.M.M.-A.; investigation, J.V.N.; data curation, J.V.N.; writing–original draft preparation, J.V.N.; writing–review and editing, J.V.N., T.L. and J.M.M.-A.; supervision, T.L. and J.M.M.-A.; and project administration and funding acquisition, J.M.M.-A. All authors have read and agreed to the published version of the manuscript.

Funding

This work is part of the OptimOre project funded by the European Union Horizon 2020 Research and Innovation Programme under grant agreement No 642201.

Acknowledgments

The authors thank Strategic Minerals Spain, S.L. for their support providing the samples.

Conflicts of Interest

The authors declare no conflict of interest.

References

  1. Fuerstenau, D.W.; Lutch, J.J.; De, A. The effect of ball size on the energy efficiency of hybrid high-pressure roll mill/ball mill grinding. Powder Technol. 1999, 105, 199–204. [Google Scholar] [CrossRef]
  2. Coello Velázquez, A.L.; Menéndez-Aguado, J.M.; Brown, R.L. Grindability of lateritic nickel ores in Cuba. Powder Technol. 2008, 182, 113–115. [Google Scholar] [CrossRef]
  3. Pedrayes, F.; Norniella, J.G.; Melero, M.G.; Menéndez-Aguado, J.M.; del Coz-Díaz, J.J. Frequency domain characterization of torque in tumbling ball mills using DEM modelling: Application to filling level monitoring. Powder Technol. 2018, 323, 433–444. [Google Scholar] [CrossRef]
  4. Osorio, A.M.; Menéndez-Aguado, J.M.; Bustamante, O.; Restrepo, G.M. Fine grinding size distribution analysis using the Swebrec function. Powder Technol. 2014, 258, 206–208. [Google Scholar] [CrossRef]
  5. Rodríguez, B.Á.; García, G.G.; Coello-Velázquez, A.L.; Menéndez-Aguado, J.M. Product size distribution function influence on interpolation calculations in the Bond ball mill grindability test. Int. J. Miner. Process. 2016, 157, 16–20. [Google Scholar] [CrossRef]
  6. Deniz, V. The effect of mill speed on kinetic breakage parameters of clinker and limestone. Cem. Concr. Res. 2004, 34, 1365–1371. [Google Scholar] [CrossRef]
  7. Olejnik, T.P. Analysis of the breakage rate function for selected process parameters in quartzite milling. Chem. Process. Eng. Inzynieria Chemiczna i Procesowa 2012, 33, 117–129. [Google Scholar] [CrossRef]
  8. Gupta, V.K.; Sharma, S. Analysis of ball mill grinding operation using mill power specific kinetic parameters. Adv. Powder Technol. 2014, 25, 625–634. [Google Scholar] [CrossRef]
  9. Petrakis, E.; Komnitsas, K. Improved modeling of the grinding process through the combined use of matrix and population balance models. Minerals 2017, 7, 67. [Google Scholar] [CrossRef] [Green Version]
  10. Cayirli, S. Influences of operating parameters on dry ball mill performance. Physicochem. Probl. Mineral Process. 2018, 54, 751–762. [Google Scholar]
  11. Cho, H.; Kwon, J.; Kim, K.; Mun, M. Optimum choice of the make-up ball sizes for maximum throughput in tumbling ball mills. Powder Technol. 2013, 246, 625–634. [Google Scholar] [CrossRef] [Green Version]
  12. Hlabangana, N.; Danha, G.; Muzenda, E. Effect of ball and feed particle size distribution on the milling efficiency of a ball mill: An attainable region approach. S. Afr. J. Chem. Eng. 2018, 25, 79–84. [Google Scholar] [CrossRef]
  13. Bwalya, M.M.; Moys, M.H.; Finnie, G.J.; Mulenga, F.K. Exploring ball size distribution in coal grinding mills. Powder Technol. 2014, 257, 68–73. [Google Scholar] [CrossRef]
  14. King, R.P. Modeling and Simulation of Mineral Processing Systems; Butterworth-Heinemann Elsevier Ltd.: Oxford, UK, 2001. [Google Scholar]
  15. Epstein, B. The mathematical description of certain breakage mechanisms leading to the logarithmic-normal distribution. J. Frankl. Inst. 1947, 244, 471–477. [Google Scholar] [CrossRef]
  16. Kelsall, D.F. A study of the breakage in a small continuous open circuit wet mill. Can. Min. J. 1965, 86, 89–94. [Google Scholar]
  17. Herbst, J.A.; Fuerstenau, D.W. The zero-order production of fine sizes in comminution and its implications in simulation. Trans. AIME 1968, 241, 538–549. [Google Scholar]
  18. Austin, L.G.; Luckie, P.T. Methods for the determination of breakage distribution parameters. Powder Technol. 1971, 5, 267–271. [Google Scholar] [CrossRef]
  19. Austin, L. A Review–Introduction to the mathematical description of grinding as a rate process. Powder Technol. 1972, 5, 1–17. [Google Scholar] [CrossRef]
  20. Gardner, R.P.; Sukanjnajtee, K. A combined tracer and back-calculation method for determining particulate breakage functions in ball milling: Part I—rationale and description of the proposed method. Powder Technol. 1972, 6, 65–74. [Google Scholar] [CrossRef]
  21. Kapur, P.C. An improved method for estimating the feed-size breakage distribution functions. Powder Technol. 1982, 33, 269–275. [Google Scholar] [CrossRef]
  22. Kapur, P.C.; Agrawal, P. Approximate solutions to the discretized batch grinding equation. Chem. Eng. Sci. 1970, 25, 1111–1113. [Google Scholar] [CrossRef]
  23. Malghan, S.G.; Fuerstenau, D.W. The scale-up of ball mills using population balance models and specific power input. Dechem. Monogr. 1976, 79, 613–630. [Google Scholar]
  24. Austin, L.G.; Luckie, P.T.; Shoji, K. An analysis of ball-and-race milling part II: The babcock E 1.7 mill. Powder Technol. 1982, 33, 113–125. [Google Scholar] [CrossRef]
  25. Austin, L.G.; Brame, K. A comparison of the Bond method for sizing wet tumbling ball mills with a size—mass balance simulation model. Powder Technol. 1983, 34, 261–274. [Google Scholar] [CrossRef]
  26. Austin, L.; Concha, F. Diseño y Simulación de Circuitos de Molienda y Clasificación; CYTED: Valparaiso, Chile, 1994. [Google Scholar]
  27. Austin, L.G.; Klimpel, R.R.; Luckie, P. Process Engineering of Size Reduction: Ball Milling; Society of Mining Engineers of the AIME: Littleton, CO, USA, 1984. [Google Scholar]
  28. European Commission. Study on the EU’s List of Critical Raw Materials. Available online: https://ec.europa.eu/commission/presscorner/detail/en/ip_20_1542 (accessed on 1 January 2020).
  29. Wang, X.; Gui, W.; Yang, C.; Wang, Y. Wet grindability of an industrial ore and its breakage parameters estimation using population balances. Int. J. Miner. Process. 2011, 98, 113–117. [Google Scholar] [CrossRef]
  30. Polonio, G.F. El Interés Económico y Estratégico del Aprovechamiento de Metales Raros y Minerales Industriales Asociados, en el Marco Actual de la Minería Sostenible: La Mina de Penouta. Ph.D. Thesis, Universidad Politécnica de Madrid, Orense, España, 2015. [Google Scholar]
  31. Llorens, G.T.; García, P.F.; López, M.F.J.; Fernández, F.A.; Sanz, C.J.L.; Moro, B.M.C. Tin-tantalum-niobium mineralization in the Penouta deposit (NW Spain): Textural features and mineral chemistry to unravel the genesis and evolution of cassiterite and columbite group minerals in a peraluminous system. Ore Geol. Rev. 2017, 81, 79–95. [Google Scholar] [CrossRef]
  32. López-Moro, F.J.; García, P.F.; Llorens, G.T.; Sanz, C.J.L.; Fernández, F.A.; Moro, B.M.C. Ta and Sn concentration by muscovite fractionation and degassing in a lens-like granite body: The case study of the Penouta rare-metal albite granite (NW Spain). Ore Geol. Rev. 2017, 82, 10–30. [Google Scholar] [CrossRef]
  33. Teke, E.; Yekeler, M.; Ulusoy, U.; Canbazoglu, M. Kinetics of dry grinding of industrial minerals: Calcite and barite. Int. Miner. Process. 2002, 67, 29–42. [Google Scholar] [CrossRef]
  34. Erdem, A.S.; Ergün, S.L. The effect of ball size on breakage rate parameter in a pilot scale ball mill. Miner. Eng. 2009, 22, 660–664. [Google Scholar] [CrossRef]
  35. Gupta, V.K. Determination of the specific breakage rate parameters using the top-size-fraction method: Preparation of the feed charge and design of experiments. Adv. Powder Technol. 2016, 27, 1710–1718. [Google Scholar] [CrossRef]
  36. Touil, D.; Belaadi, S.; Frances, C. The specific selection function effect on clinker grinding efficiency in a dry batch ball mill. Int. J. Miner. Process. 2008, 87, 141–145. [Google Scholar] [CrossRef] [Green Version]
  37. De Carvalho, R.M.; Tavares, L.M. Predicting the effect of operating and design variables on breakage rates using the mechanistic ball mill model. Miner. Eng. 2013, 43–44, 91–101. [Google Scholar] [CrossRef]
  38. Napier-Munn, T.J.; Morrell, S.; Morrison, R.D.; Kojovic, T. Mineral. Comminution Circuits: Their Operation and Optimization; Napier-Munn, T.J., Ed.; Julius Kruttschnitt Mineral Research Centre, University of Queensland: Indooroopilly, QLD, Australia, 1996. [Google Scholar]
  39. Wills, B.A.; Napier-Munn, T. Mineral Processing Technology. In An Introduction to the Practical Aspects of Ore Treatment and Mineral Recovery, 7th ed.; Elsevier Science & Technology Books: London, UK, 2006. [Google Scholar]
  40. Chimwani, N.; Glasser, D.; Hildebrandt, D.; Metzger, M.J.; Mulenga, F.K. Determination of the milling parameters of a platinum group minerals ore to optimize product size distribution for flotation purposes. Miner. Eng. 2013, 43–44, 67–78. [Google Scholar] [CrossRef]
  41. Mulenga, F. Effect of Ball Size Distribution on Milling Parameters. Ph.D. Thesis, University of Witwatersrand, Johannesburg, South Africa, 2008. [Google Scholar]
  42. Ucurum, M.; Gulec, Ö.; Cingitas, M. Wet grindability of calcite to ultra-fine sizes in conventional ball mill. Part. Sci. Technol. 2015, 33, 342–348. [Google Scholar] [CrossRef]
  43. González, G.; Menéndez, A.J.M. Variación del índice de trabajo en molino de bolas según el grado de molienda para varias menas de tungsteno. In Proceedings of the XIII Jornadas Argentinas de Tratamiento de Minerales Octubre de 2016, Mendoza, Argentina, 5–7 October 2016. [Google Scholar]
  44. Petrakis, E.; Stamboliadis, E.; Komnitsas, K. Identification of Optimal Mill Operating Parameters during Grinding of Quartz with the Use of Population Balance Modeling. KONA Powder Part. J. 2017, 34, 213–223. [Google Scholar] [CrossRef] [Green Version]
Figure 1. Grain size distribution curves for the Penouta mine head samples.
Metals 10 01687 g001
Figure 2. (a) Plot of log (wi(t)/wi(0)) vs. time for 75% critical speed and d = 1.9 cm (Penouta-Bedrock), (b) linear least square fitting performed.
Metals 10 01687 g002
Figure 3. (a) Plot of log (wi(t)/wi(0)) vs. time; for 75% critical speed and d = 1.9 cm (Penouta-Tailings Pond), (b) linear least square fitting performed.
Metals 10 01687 g003
Figure 4. (a) Plot of log (wi(t)/wi(0)) vs. time for 85% critical speed and d = 1.9 cm (Penouta Bedrock), (b) linear least square fitting performed.
Metals 10 01687 g004
Figure 5. (a) Plot of log (wi(t)/wi(0)) vs. time for 85% critical speed and d = 1.9 cm (Penouta Tailings Pond), (b) linear least square fitting performed.
Metals 10 01687 g005
Figure 6. The specific rate of breakage vs. particle size for selected ball sizes at 75% of working speed (Penouta Bedrock).
Metals 10 01687 g006
Figure 7. The specific rate of breakage vs. particle size for selected ball sizes at 85% of working speed (Penouta Bedrock).
Metals 10 01687 g007
Figure 8. The specific rate of breakage vs. particle size for selected ball sizes at 75% of working speed (Penouta Tailings Pond).
Metals 10 01687 g008
Figure 9. The specific rate of breakage vs. particle size for selected ball sizes at 85% of working speed (Penouta Tailings Pond).
Metals 10 01687 g009
Figure 10. Graph showing the selection function vs. ball size for Penouta Bedrock and Tailings Pond.
Metals 10 01687 g010
Figure 11. Plot of Sn yield and the specific rate of breakage, Si, vs. feed size at 75% Nc for several ball sizes (Penouta Bedrock).
Metals 10 01687 g011
Figure 12. Plot of Sn yield and the specific rate of breakage, Si, vs. feed size at 85% Nc for several ball sizes (Penouta Bedrock).
Metals 10 01687 g012
Figure 13. Plot of Sn yield and the specific rate of breakage, Si, vs. feed size at 75% Nc for several ball sizes (Penouta Tailings Pond).
Metals 10 01687 g013
Figure 14. Plot of Sn yield and the specific rate of breakage, Si, vs. feed size at 85% Nc for several ball sizes (Penouta Tailings Pond).
Metals 10 01687 g014
Figure 15. Plot of Sn, Ta and Nb yield in the undersize product and the specific rate of breakage, Si, vs. feed size for 75% Nc and ball size = 2.23 cm (Penouta Bedrock).
Metals 10 01687 g015
Figure 16. Plot of Sn, Ta and Nb yield in the undersize product and the specific rate of breakage, Si, vs. feed size for 75% Nc and ball size = 2.23 cm (Penouta Tailings Pond).
Metals 10 01687 g016
Table 1. Working speeds for the grinding kinetic tests.
d, Balls Size (mm)Nc, Mill Critical Speed (rpm)Work Speed/75% Nc (rpm)Work Speed/85% Nc (rpm)
19.1105.979.490.0
22.3106.980.290.1
31.8110.382.893.8
Table 2. Chemical composition of Bedrock and Tailings Pond head samples obtained through XRF.
SampleSn (ppm)Ta (ppm)Nb (ppm)
Penouta-Bedrock392 ± 5114 ± 1031 ± 2
Penouta-Tailings Pond334 ± 560 ± 1064 ± 2
Table 3. Kinetic parameters for several ball sizes and mil speed (Penouta Bedrock and Tailings Pond).
Kinetic 75% Nc85% Nc
Parametersd = 1.9 cmd = 2.23 cmd = 3.175 cmd = 1.9 cmd = 2.23 cmd = 3.175 cm
α (Bedrock)0.55310.63450.41210.08850.37640.1482
αT (Bedrock)0.00830.00490.01320.14510.02250.0839
α (Tailings)0.74321.04140.62800.45330.64740.6320
αT (Tailings)0.00240.00030.00190.01000.00430.0053
Table 4. Correlation between the specific rate of breakage Si and Sn, Ta, Nb yields (%) for each ball size (Penouta Bedrock, 75% Nc).
Ball Diameter (cm)
Size1.92.233.175
(µm)Si
(min−1)
Sn y.(%)Ta y. (%)Nb y. (%)Si
(min−1)
Sn y. (%)Ta y. (%)Nb y. (%)Si
(min−1)
Sn y. (%)Ta y. (%)Nb y. (%)
750.04428%33%27%0.05533%42%36%0.04327%29%28%
1250.12556%57%52%0.10747%46%41%0.12453%50%50%
2500.14564%45%70%0.16348%55%49%0.17648%56%51%
5000.15348%76%63%0.15851%75%78%0.13141%66%66%
10000.26780%89%84%0.28781%88%85%0.16457%72%66%
20000.41398%99%93%0.50499%97%93%0.2494%93%84%
33500.67791%68%92%0.761100%100%100%0.36591%71%90%
Pearson c. (r)0.830.510.80 0.920.870.84 0.890.680.89
Table 5. Correlation between the specific rate of breakage Si and Sn, Ta, Nb yields (%) for each ball size (Penouta Bedrock, 85% Nc).
Ball Diameter (cm)
Size1.92.233.175
(µm)Si
(min−1)
Sn y. (%)Ta y. (%)Nb y. (%)Si
(min−1)
Sn y. (%)Ta y. (%)Nb y. (%)Si
(min−1)
Sn y. (%)Ta y. (%)Nb y. (%)
750.12518%19%18%0.123%23%23%0.13824%30%23%
1250.21743%45%45%0.16333%37%34%0.20636%41%38%
2500.22968%70%71%0.15743%50%46%0.21449%52%52%
5000.12843%65%62%0.15548%68%58%0.15351%72%66%
10000.18655%75%67%0.25276%87%81%0.19716%29%23%
20000.22589%89%79%0.29795%93%86%0.21184%83%75%
33500.45891%74%93%0.55991%70%91%0.34890%61%88%
Pearson c. (r)0.750.410.70 0.810.52081 0.680.250.64
Table 6. Correlation between the specific rate of breakage Si and Sn, Ta, Nb yields (%) for each ball size (Penouta Tailings Pond, 75% Nc).
Ball Diameter (cm)
Size1.92.233.175
(µm)Si
(min−1)
Sn y. (%)Ta y. (%)Nb y. (%)Si
(min−1)
Sn y. (%)Ta y. (%)Nb y. (%)Si
(min−1)
Sn y. (%)Ta y. (%)Nb y. (%)
750.05723%35%28%0.04115%21%16%0.04311%17%13%
1250.03623%33%26%0.02221%31%21%0.02415%15%15%
2500.14173%60%60%0.11873%60%56%0.07087%83%82%
5000.32382%96%90%0.10858%76%71%0.09944%70%58%
10000.46195%81%90%0.21690%78%84%0.10164%63%64%
20000.48753%70%67%0.78699%93%97%0.10370%58%44%
33500.52093%70%79%0.800100%100%100%0.37090%89%89%
Pearson c. (r)0.750.750.83 0.780.800.80 0.640.650.68
Table 7. Correlation between the specific rate of breakage Si and Sn, Ta, Nb yields (%) for each ball size (Penouta Tailings Pond, 85% Nc).
Ball Diameter (cm)
Size1.92.233.175
(µm)Si
(min−1)
Sn y. (%)Ta y. (%)Nb y. (%)Si
(min−1)
Sn y. (%)Ta y. (%)Nb y. (%)Si
(min−1)
Sn y. (%)Ta y. (%)Nb y. (%)
750.33128%31%30%0.10043%58%48%0.13846%64%51%
1250.07725%27%23%0.07818%27%20%0.06956%71%62%
2500.10090%85%83%0.13072%61%56%0.21086%82%78%
5000.16078%82%75%0.17679%90%67%0.24186%98%90%
10000.22884%81%84%0.32393%92%90%0.28496%92%90%
20000.19991%75%75%0.54898%95%91%0.557100%100%100%
33500.39593%89%89%0.601100%100%100%0.721100%100%100%
Pearson c. (r)0.130.130.19 0.800.790.88 0.760.770.81
Publisher’s Note: MDPI stays neutral with regard to jurisdictional claims in published maps and institutional affiliations.

