Complete Extraction of Amorphous Aluminosilicate from Coal Fly Ash by Alkali Leaching under Atmospheric Pressure


Abstract
1. Introduction
2. Materials and Methods
2.1. Analysis
2.2. Experiments
2.3. Materials and Reagents
3. Results and Discussion
3.1. The Effect of Leaching Conditions on the Desilication Efficiency
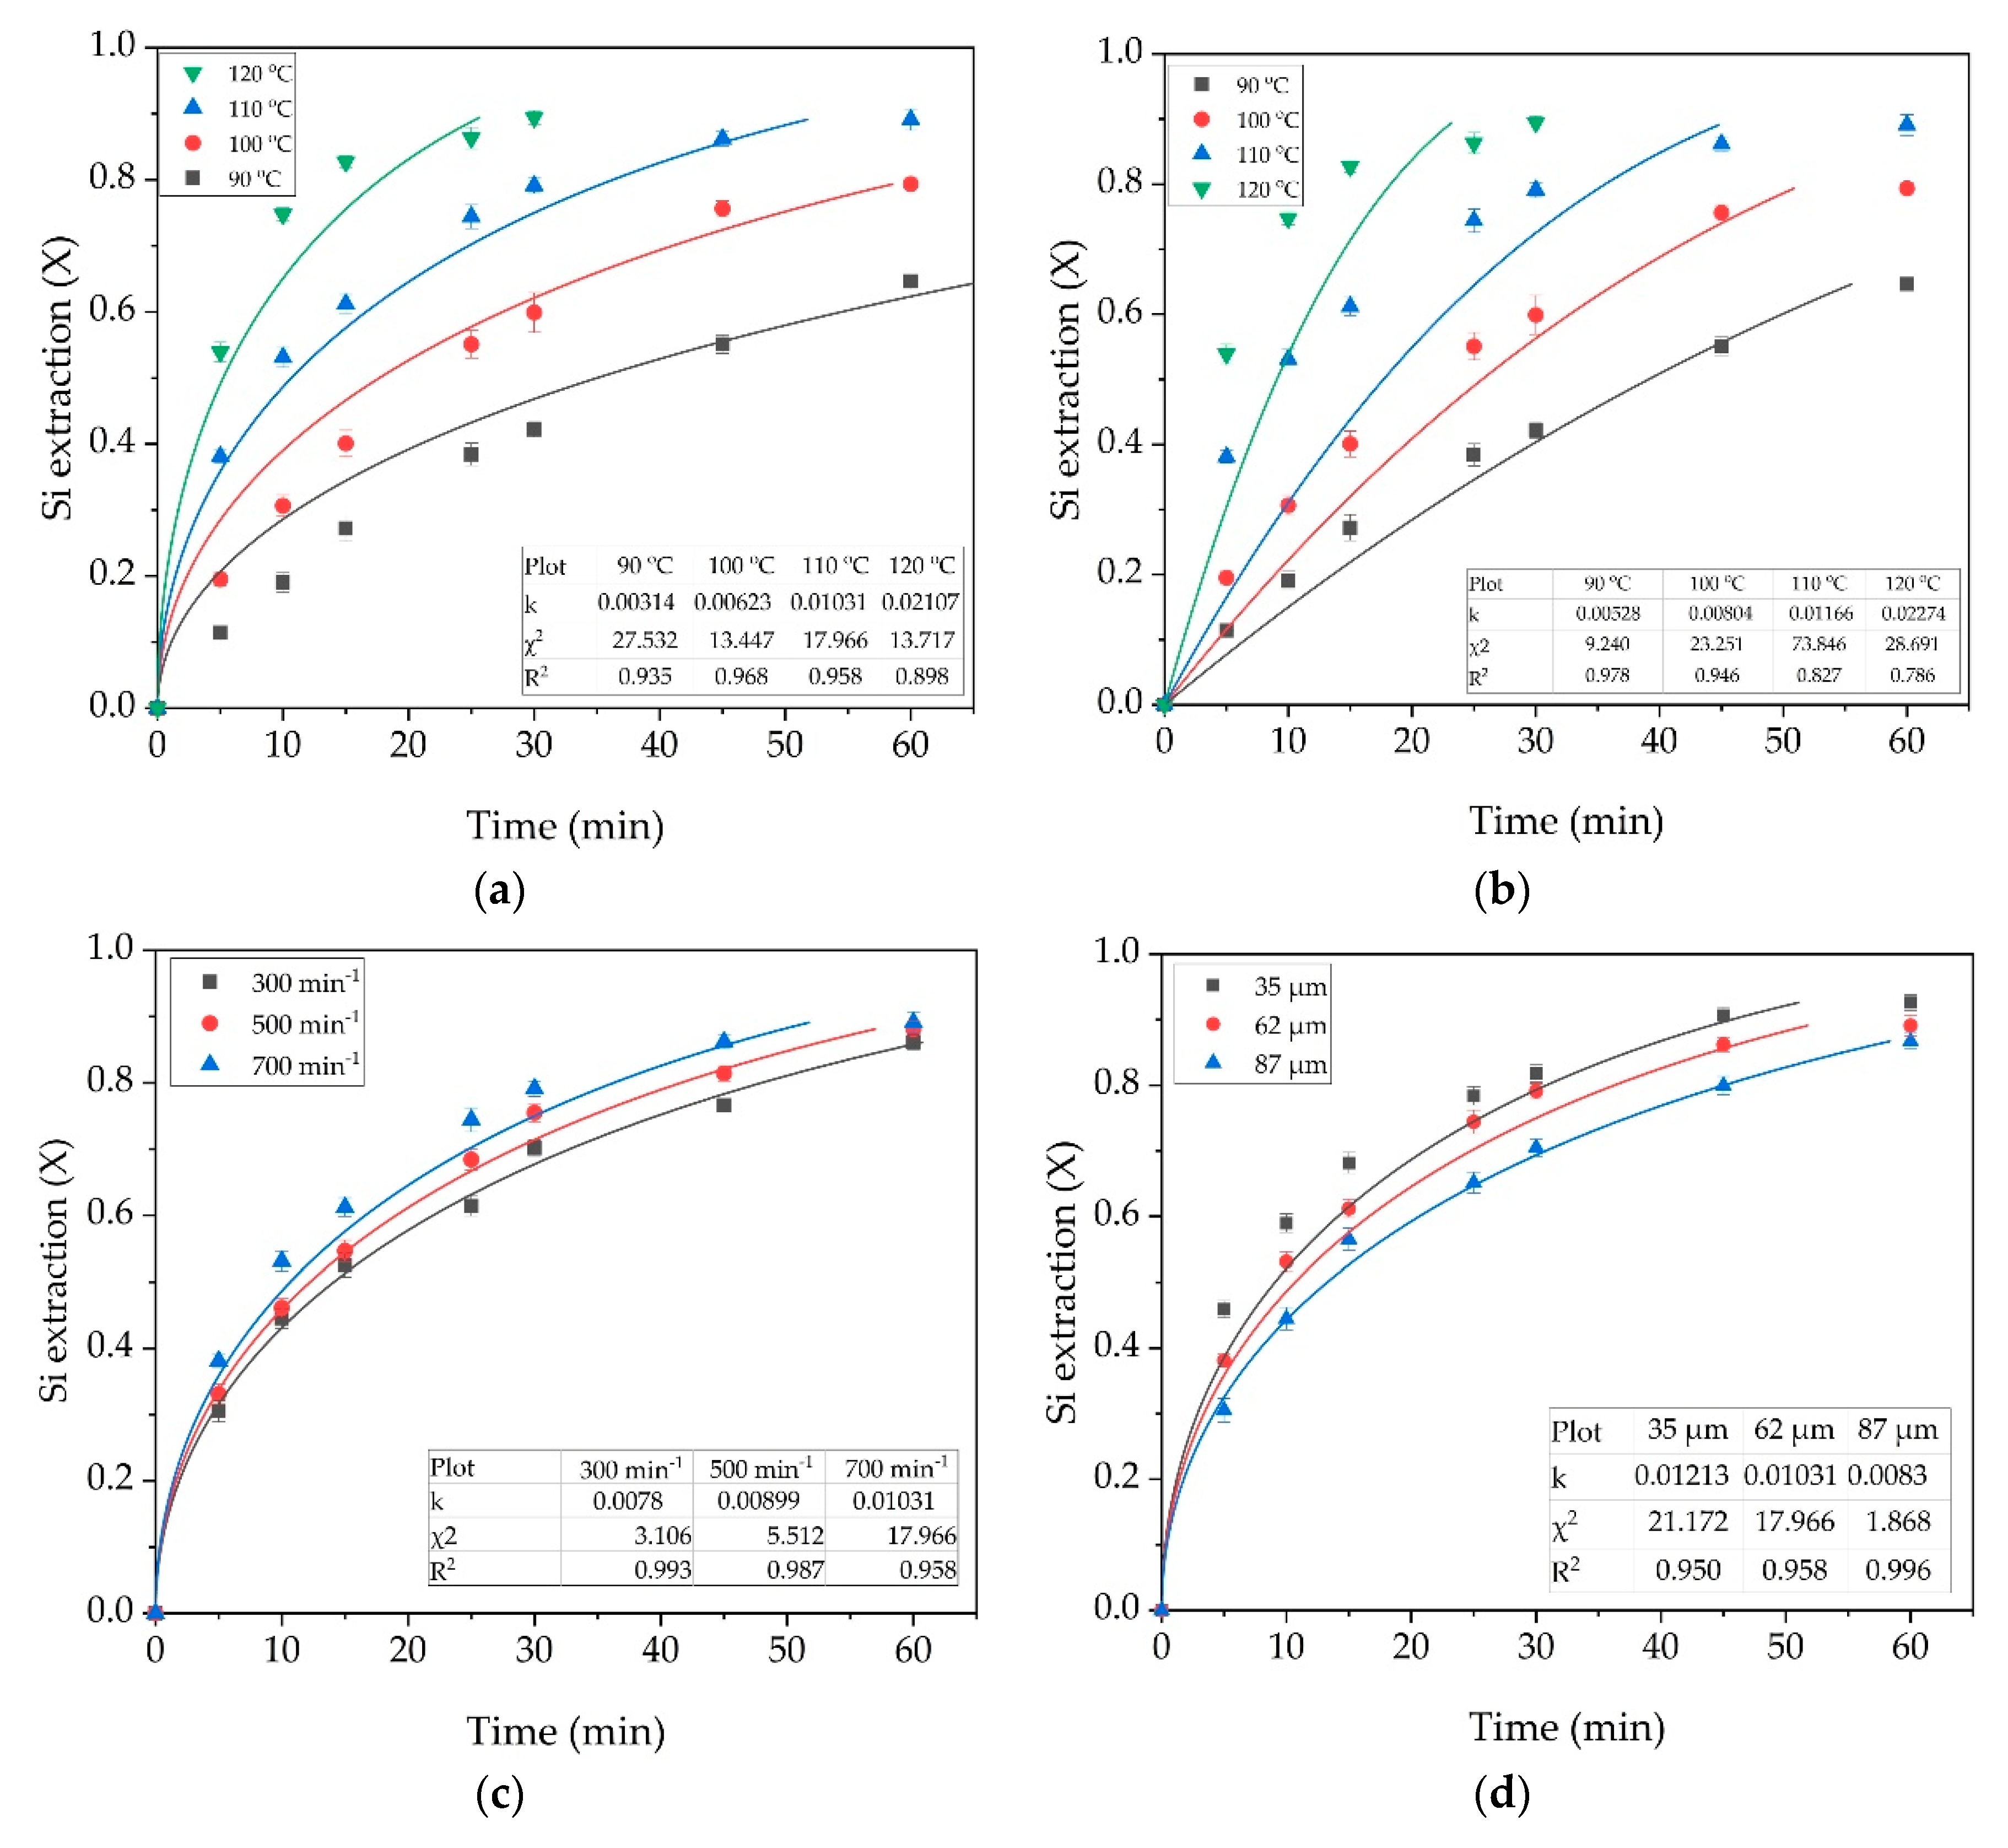
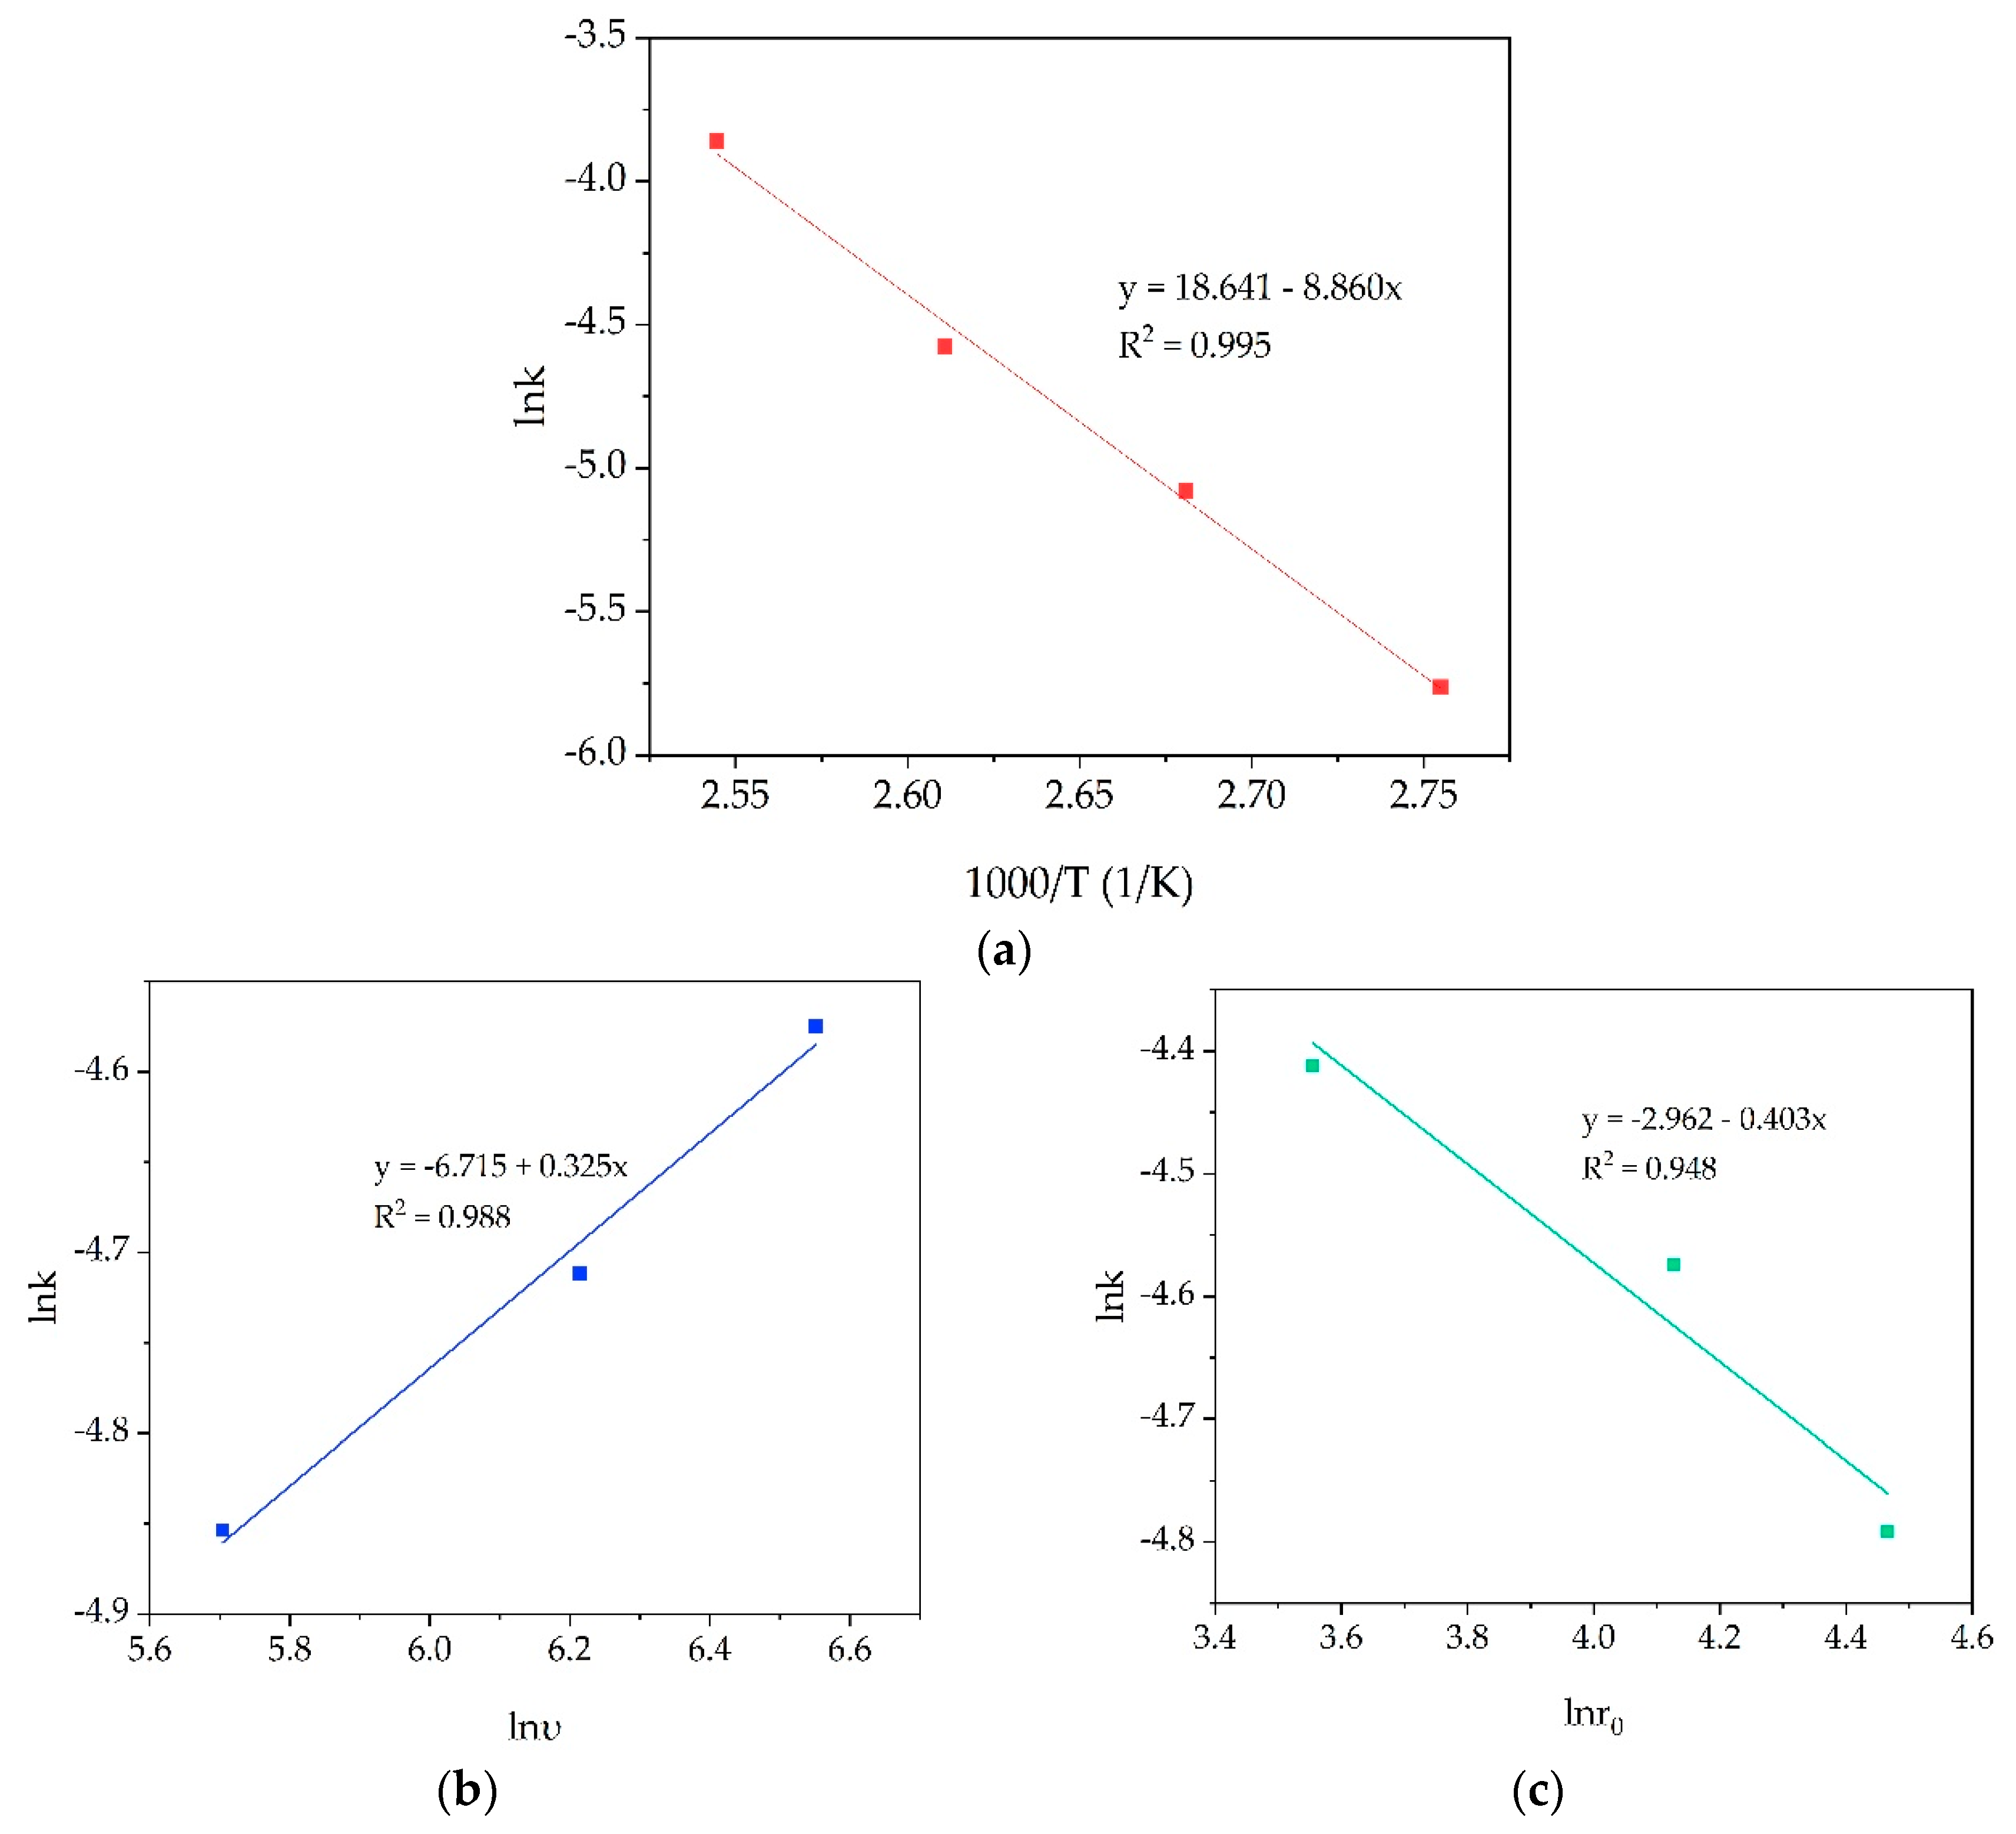
3.2. Kinetic Study
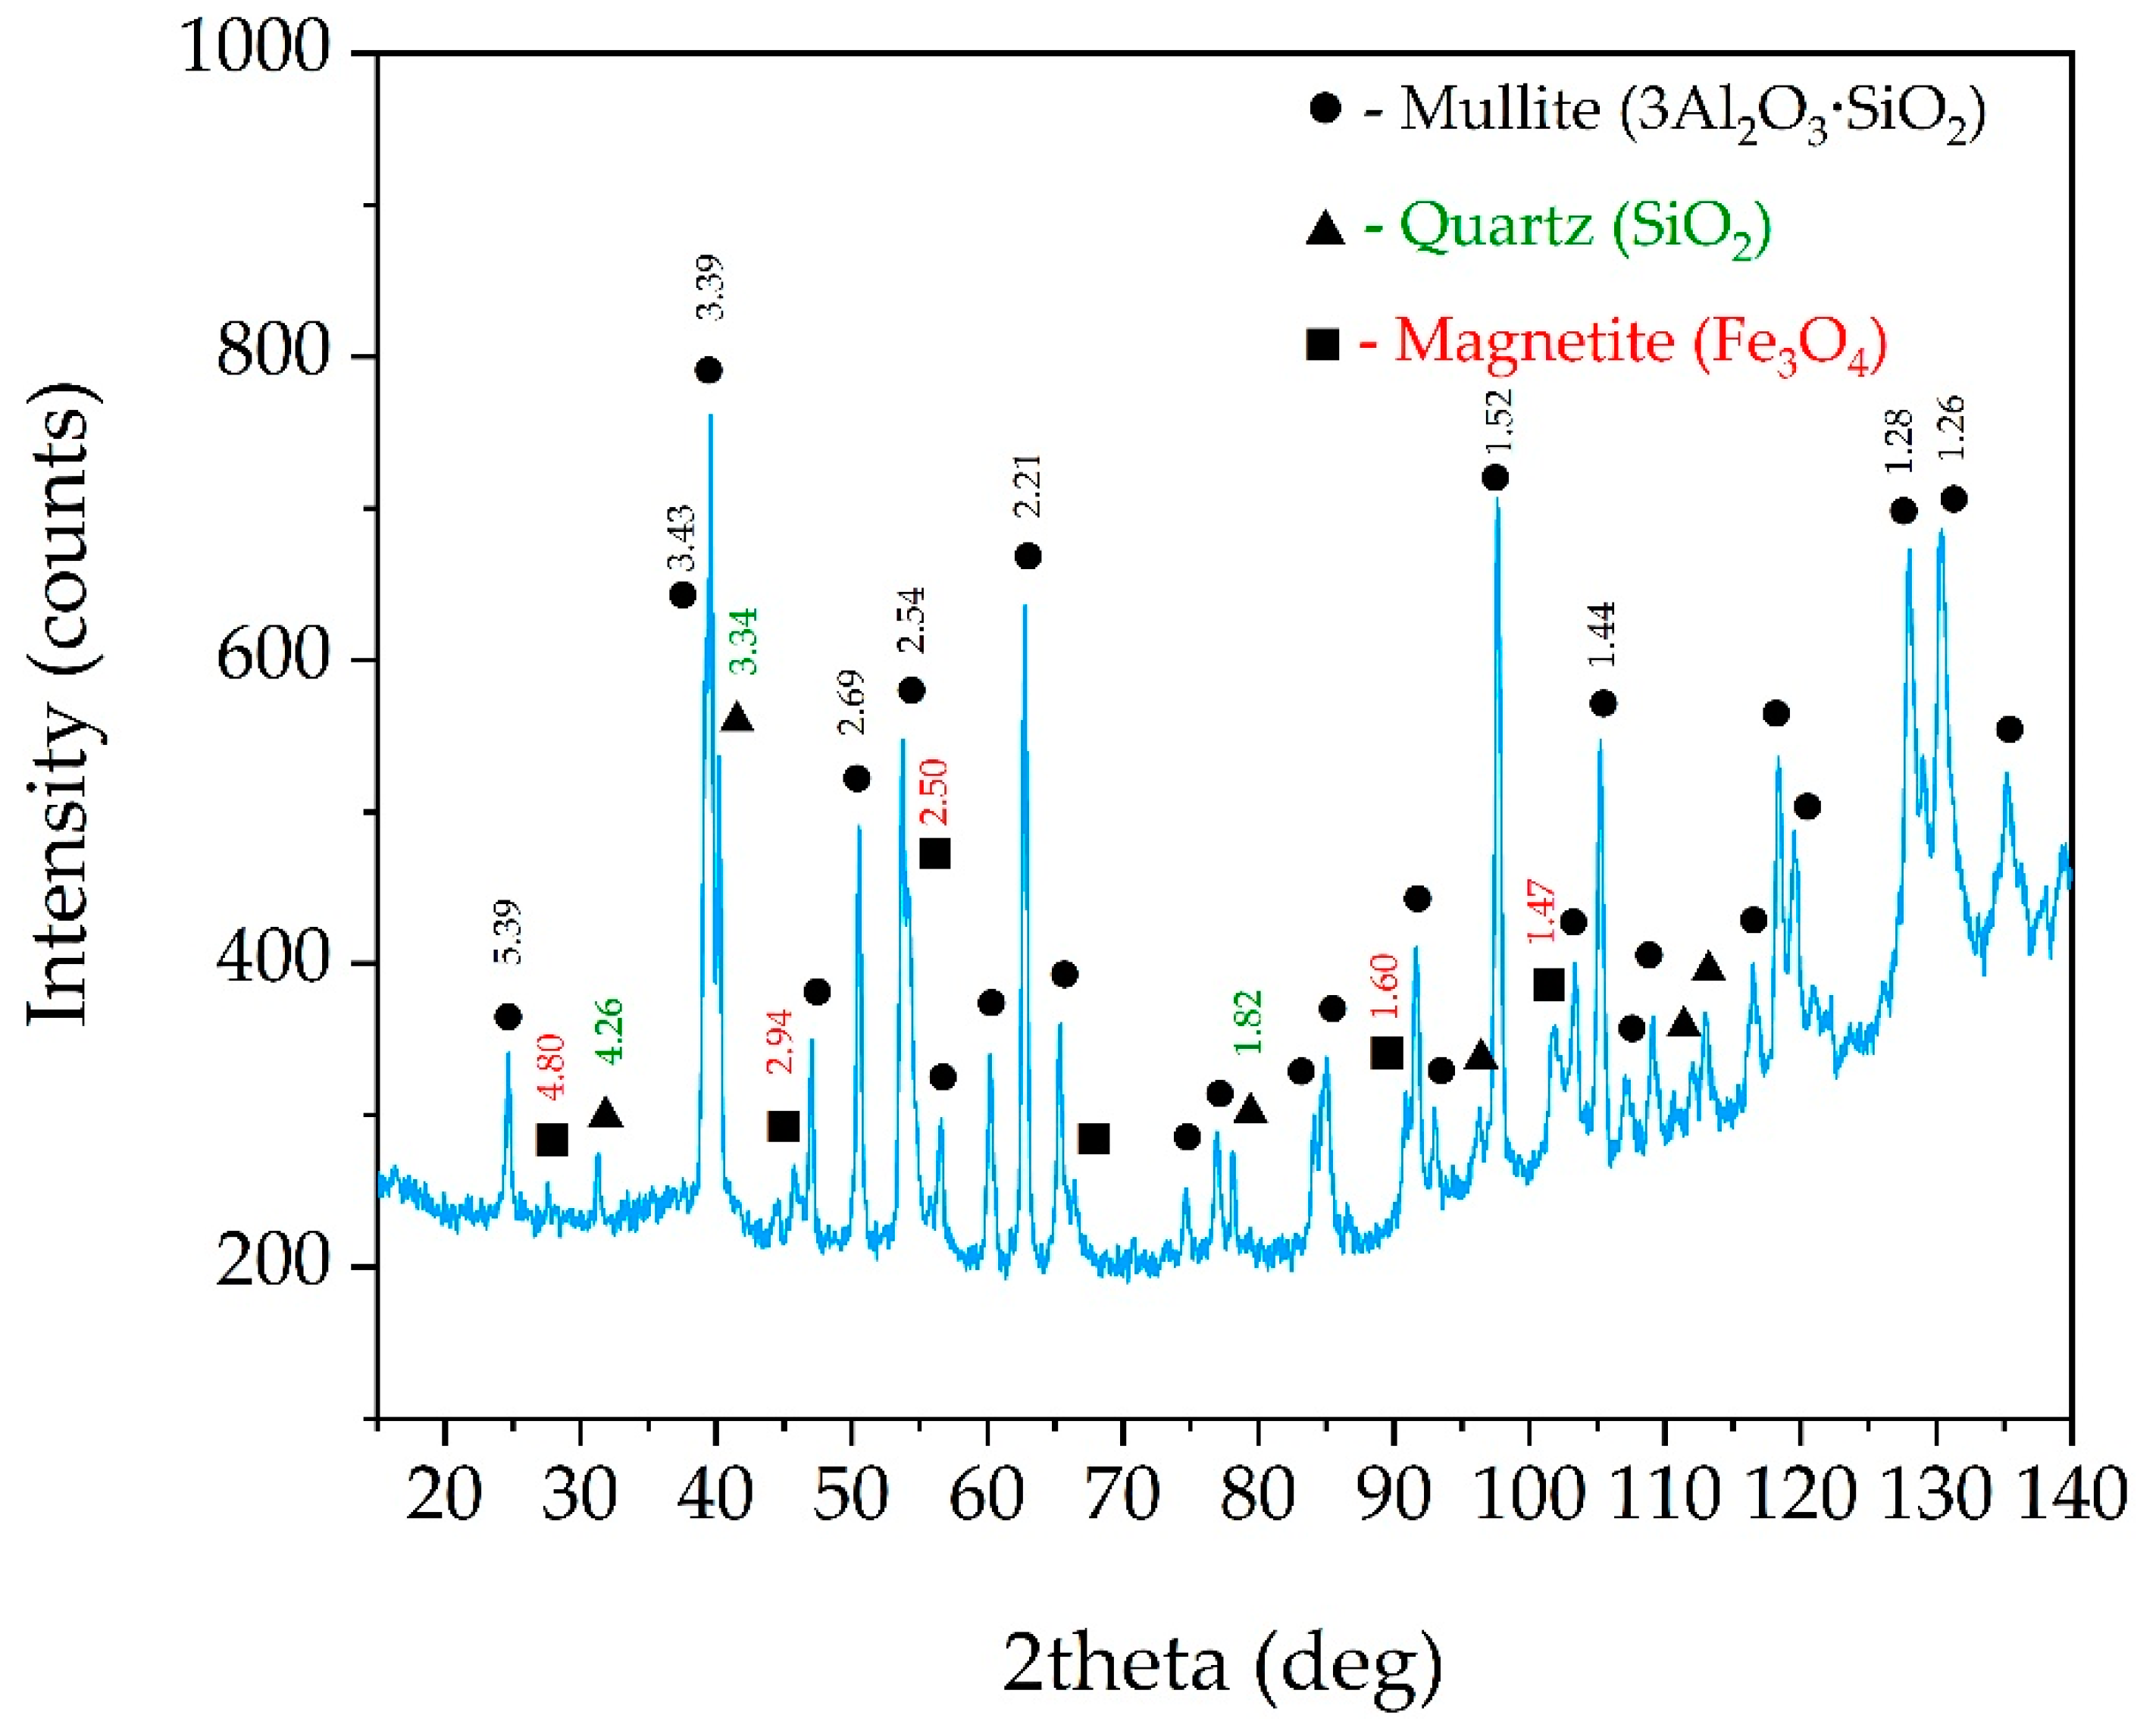
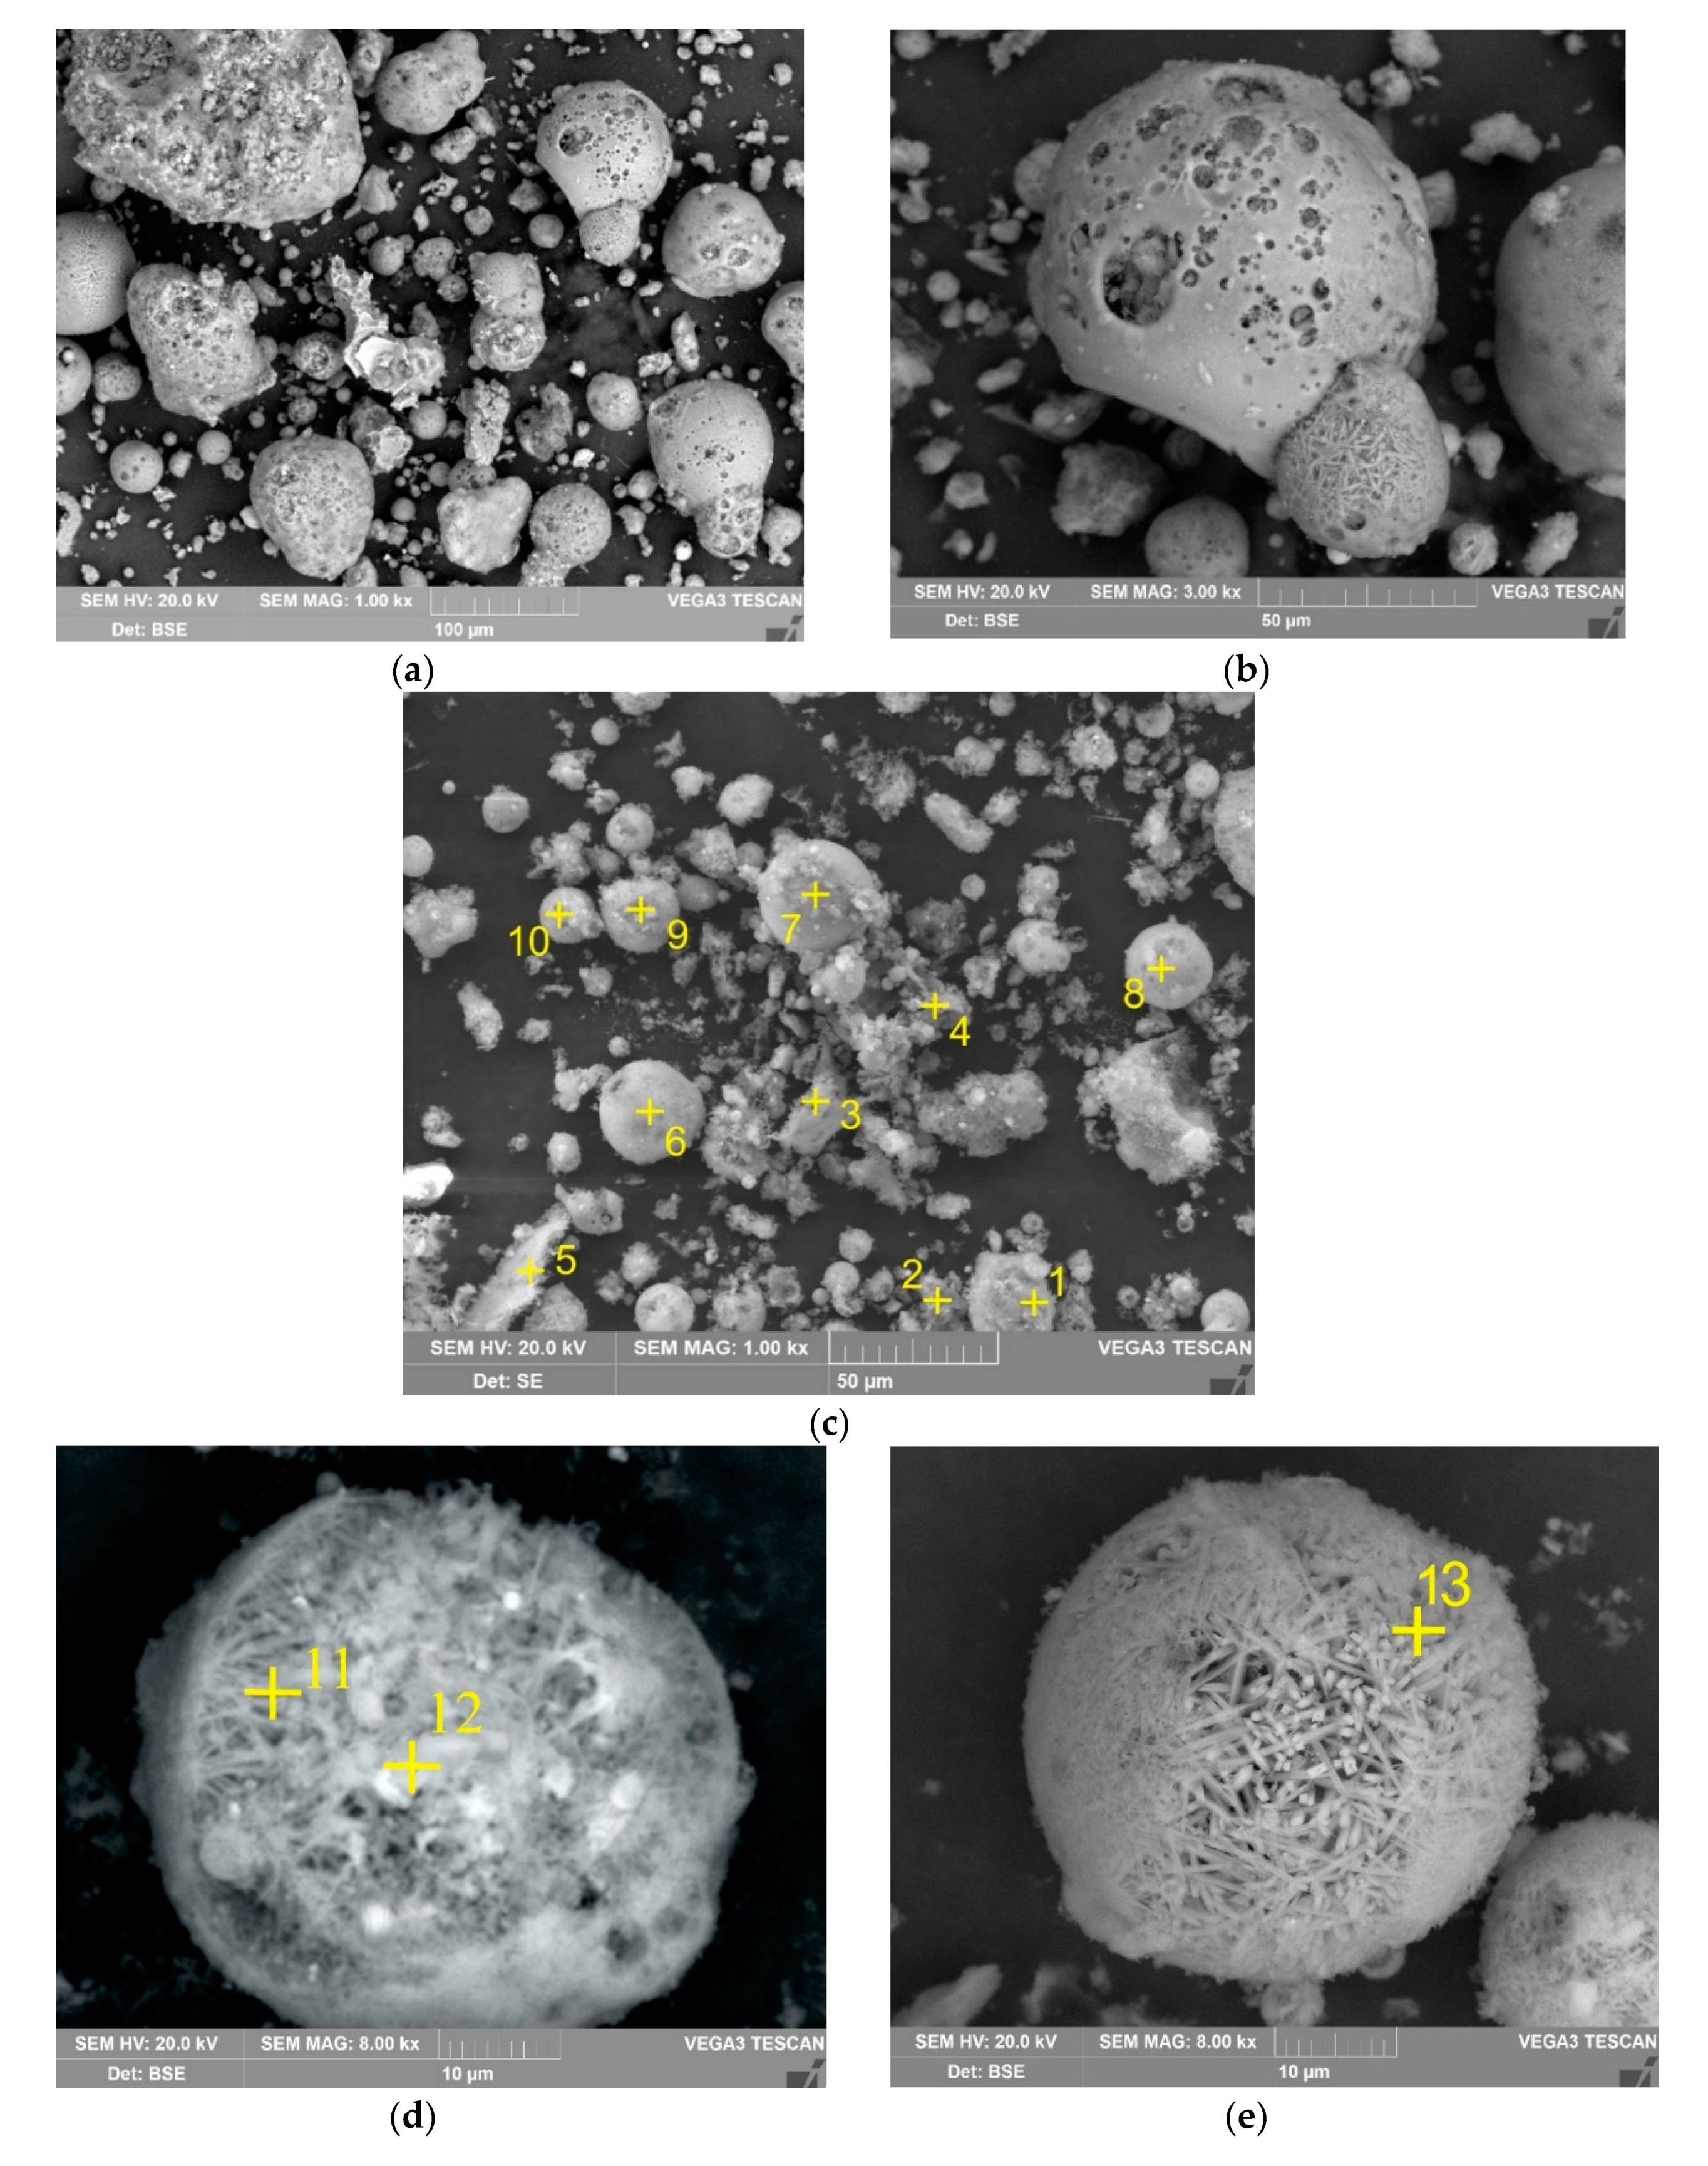
3.3. Solid Residue Characterization
4. Conclusions
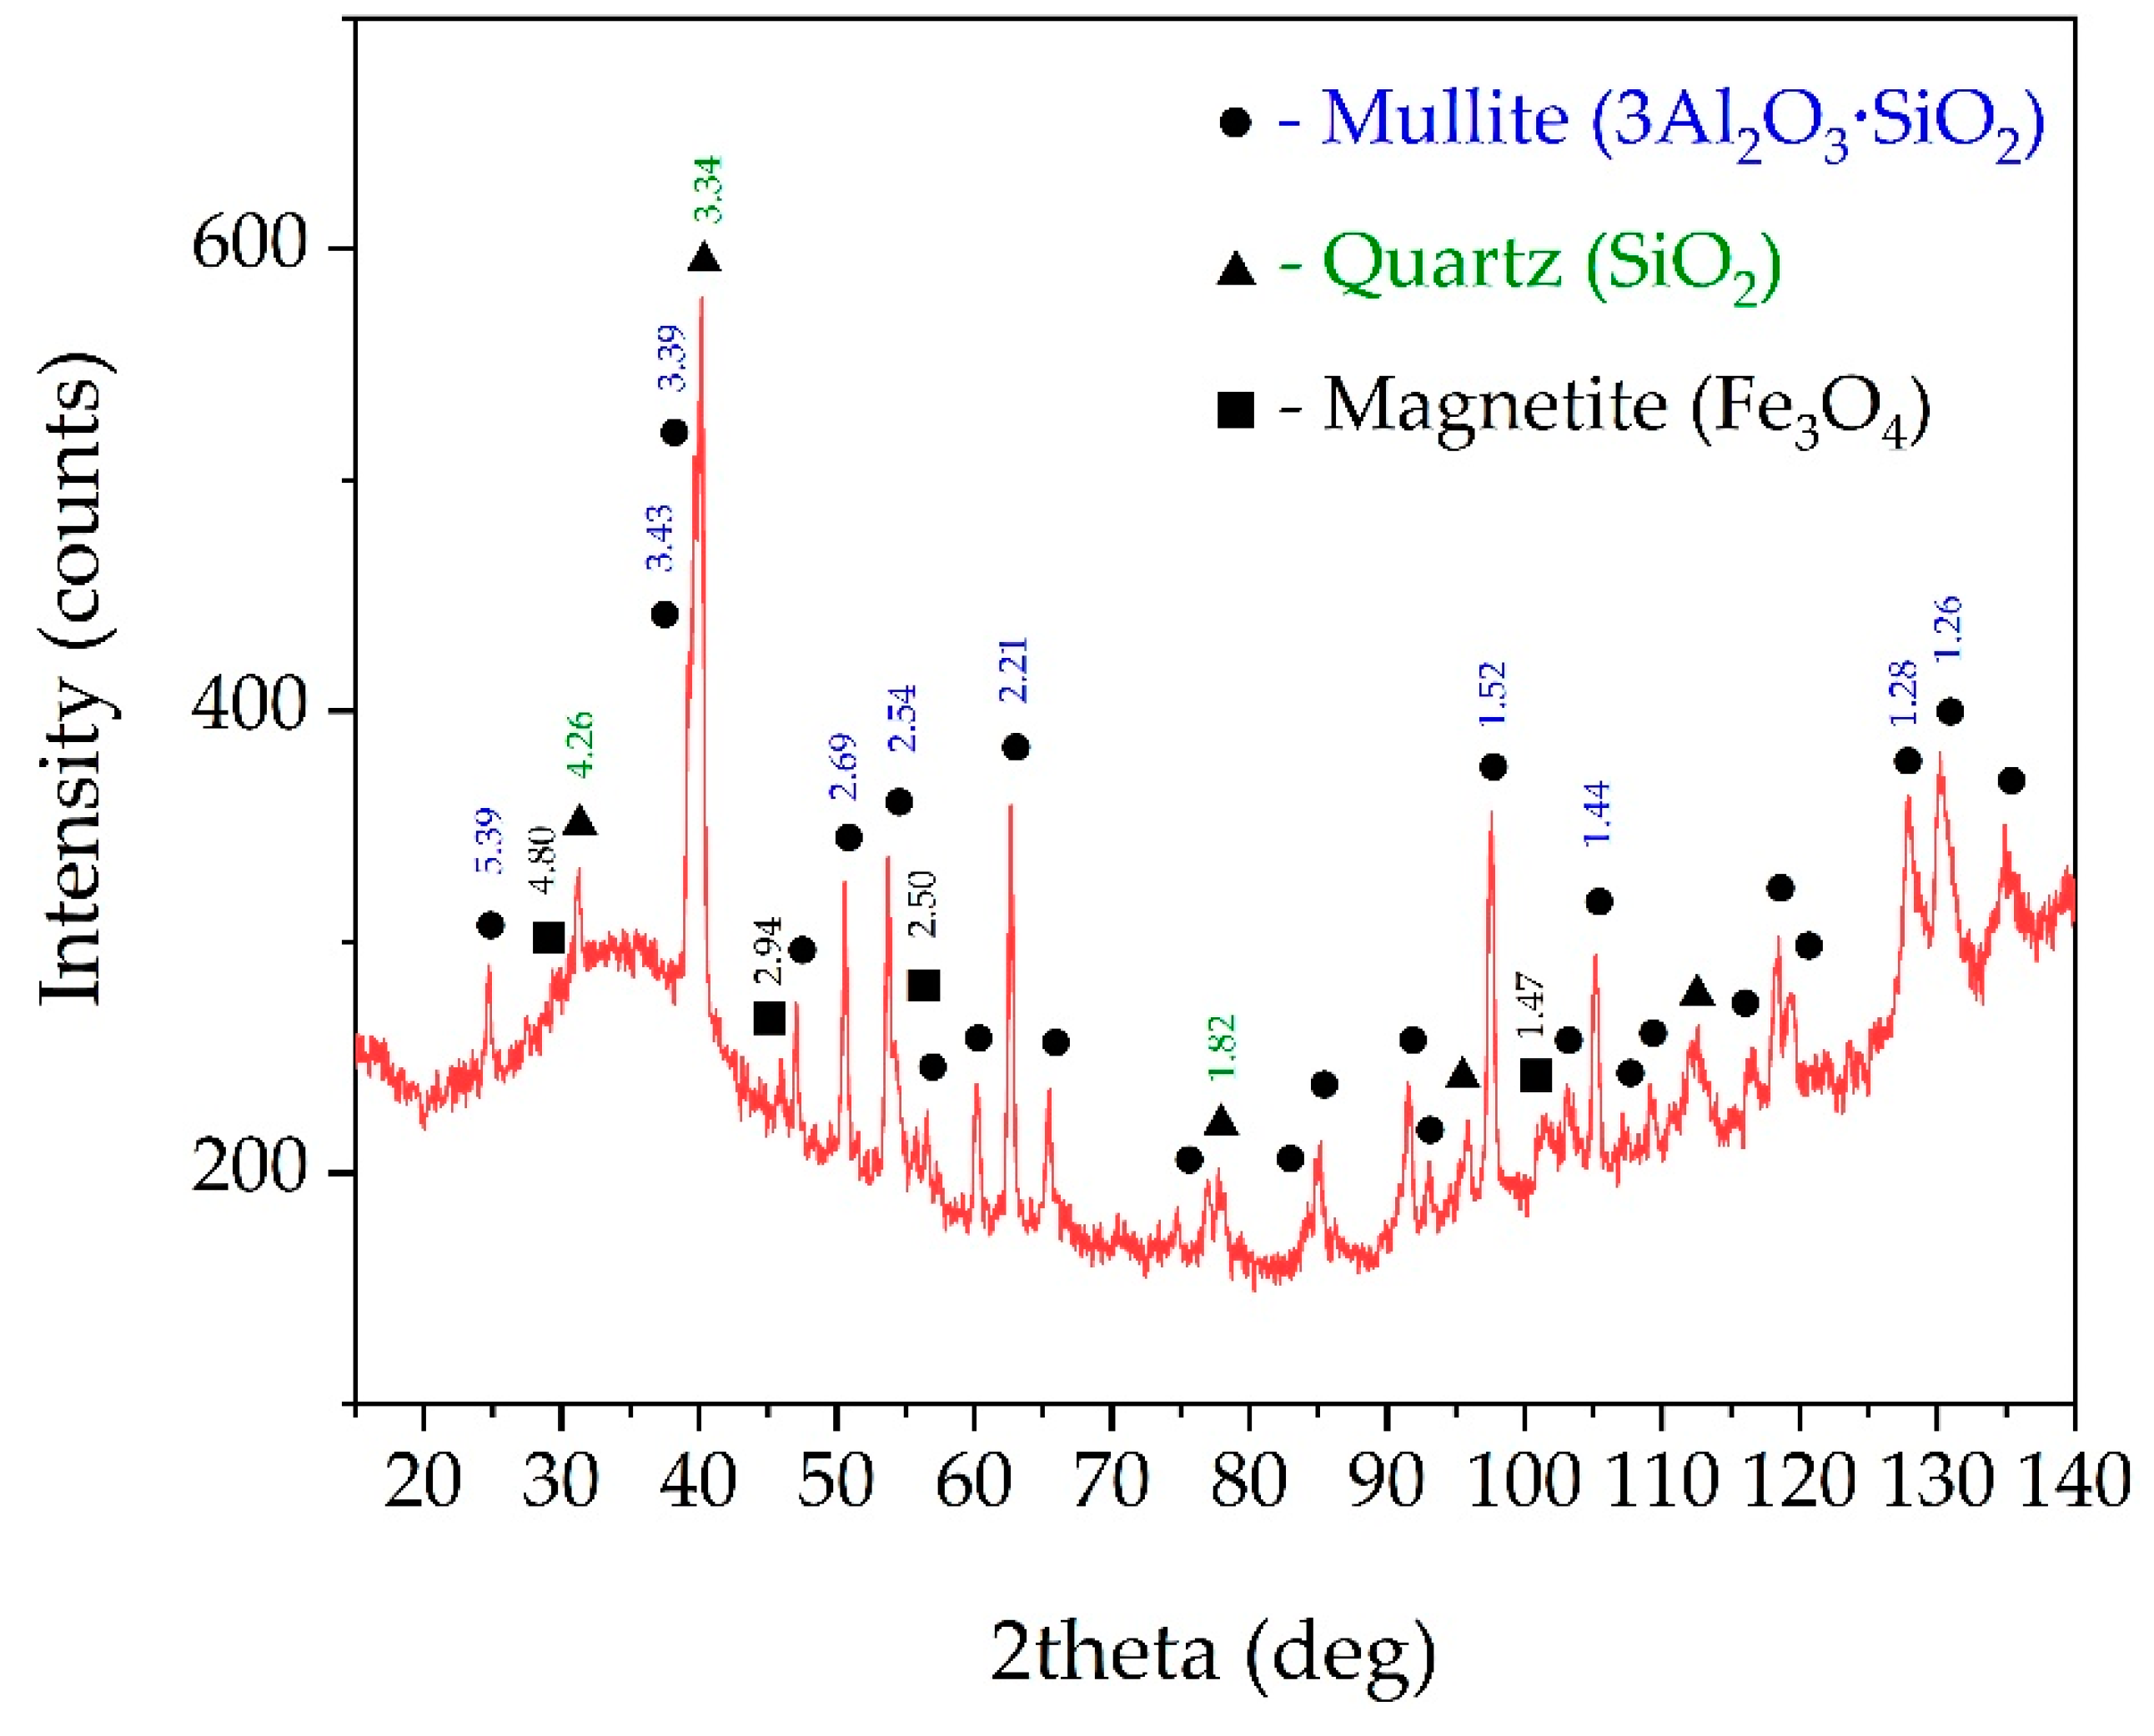
- The raw CFA contains a large amount of amorphous aluminosilicate with high content of easily soluble alumina. The extraction of this alumina by the NaOH simultaneously with silica at low L/S ratio (<15) leads to the formation of DSP.
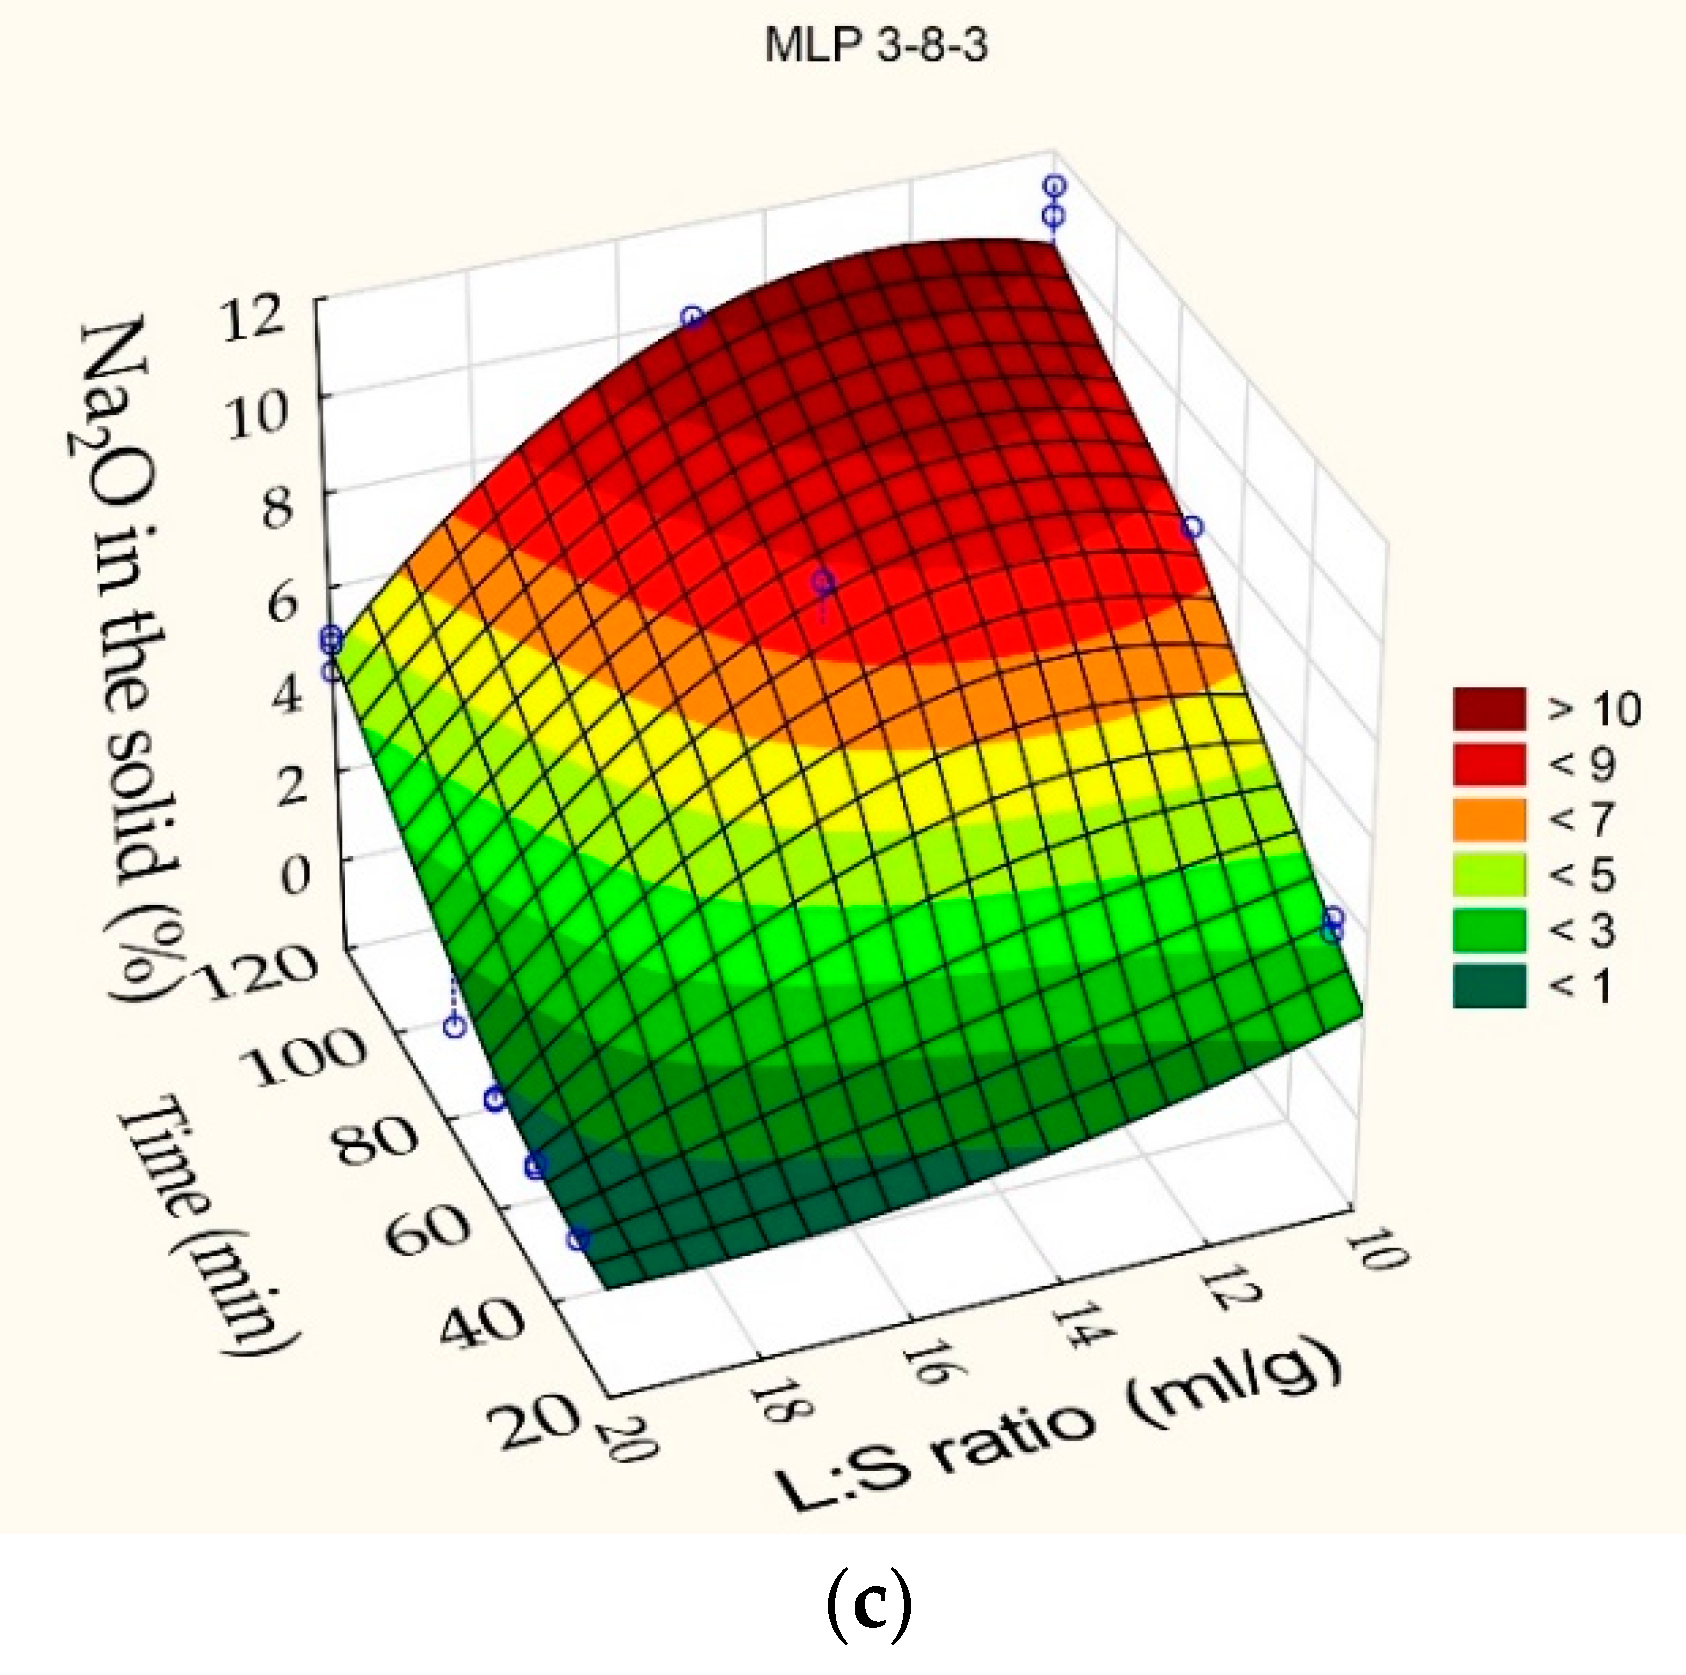
- According to the response surfaces, at the T = 110 °C; C(Na2O) = 400 g/L; L/S ratio = 20 and 60 min leaching duration, the Si and Al extraction degrees were 88% and 45%. A very low Na2O content (0.65 mas.%) is observed in the solid residue at these conditions. It indicates the absence of the DSP formation.
- The results of the kinetic analysis show that the leaching process is limited by the surface chemical reaction at low T <100 °C; at high T >100 °C—the leaching process is limited by the diffusion through the product layer. The apparent Ea was 73.8 kJ/mol.
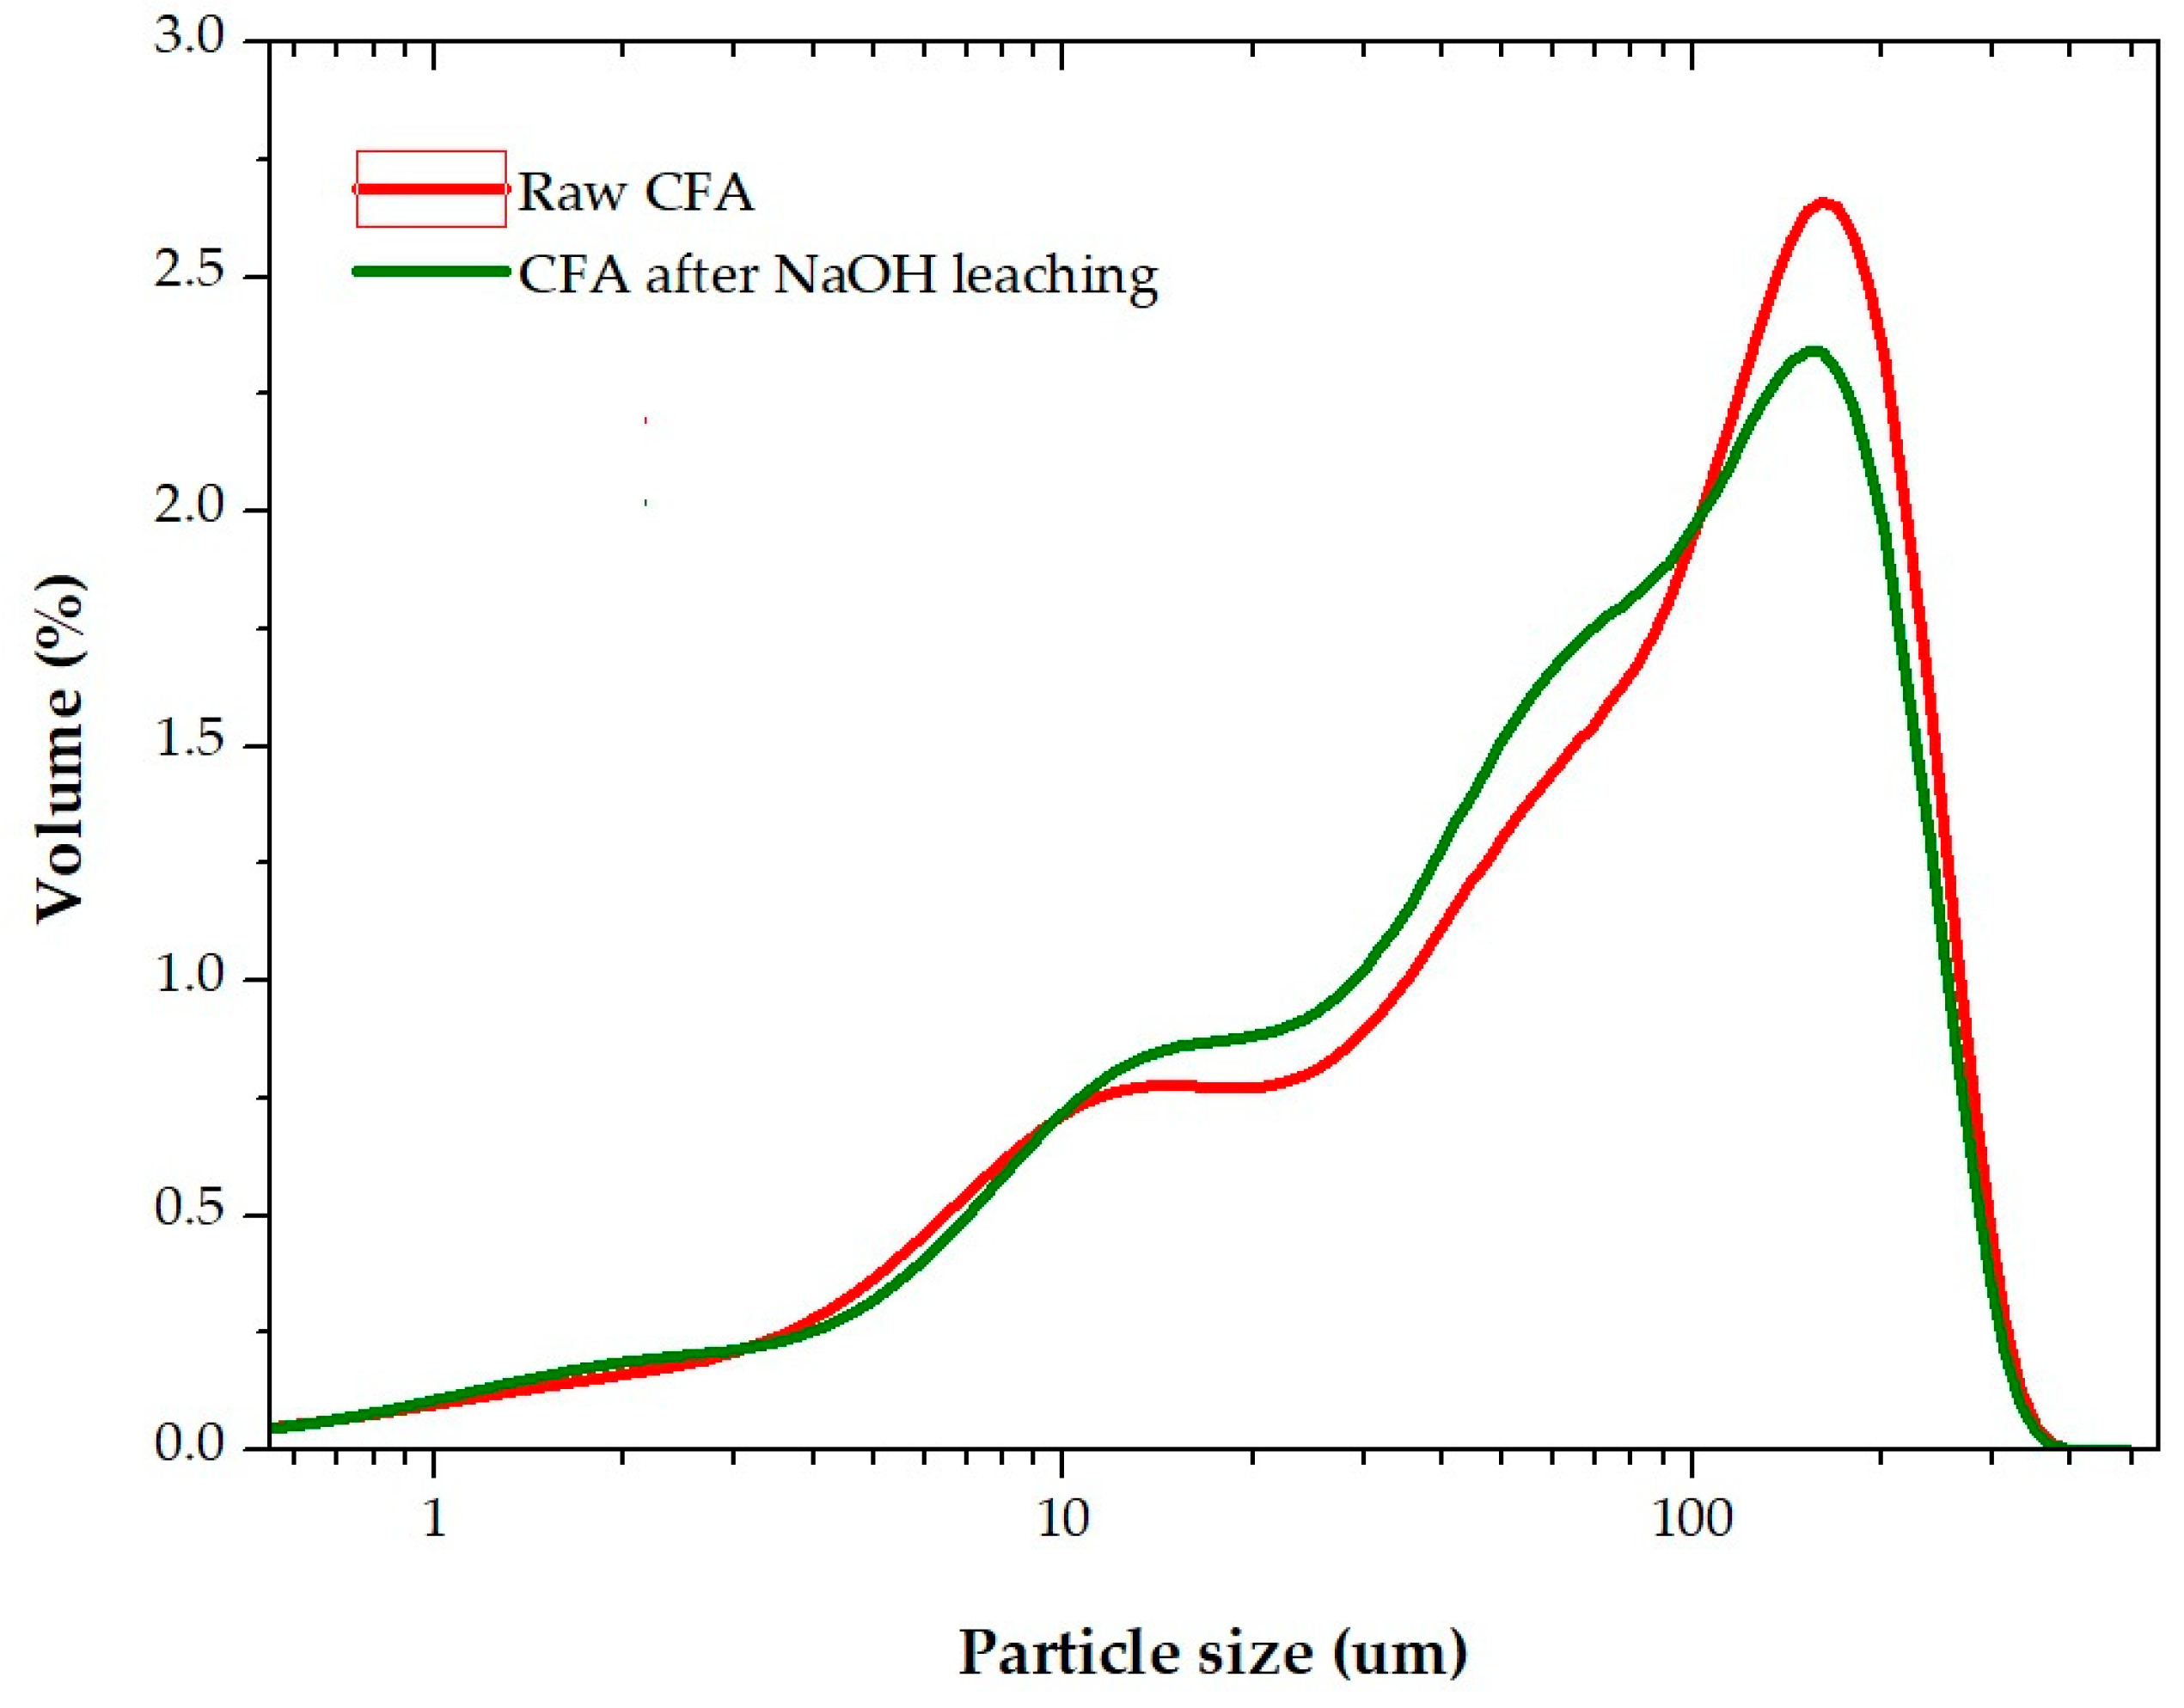
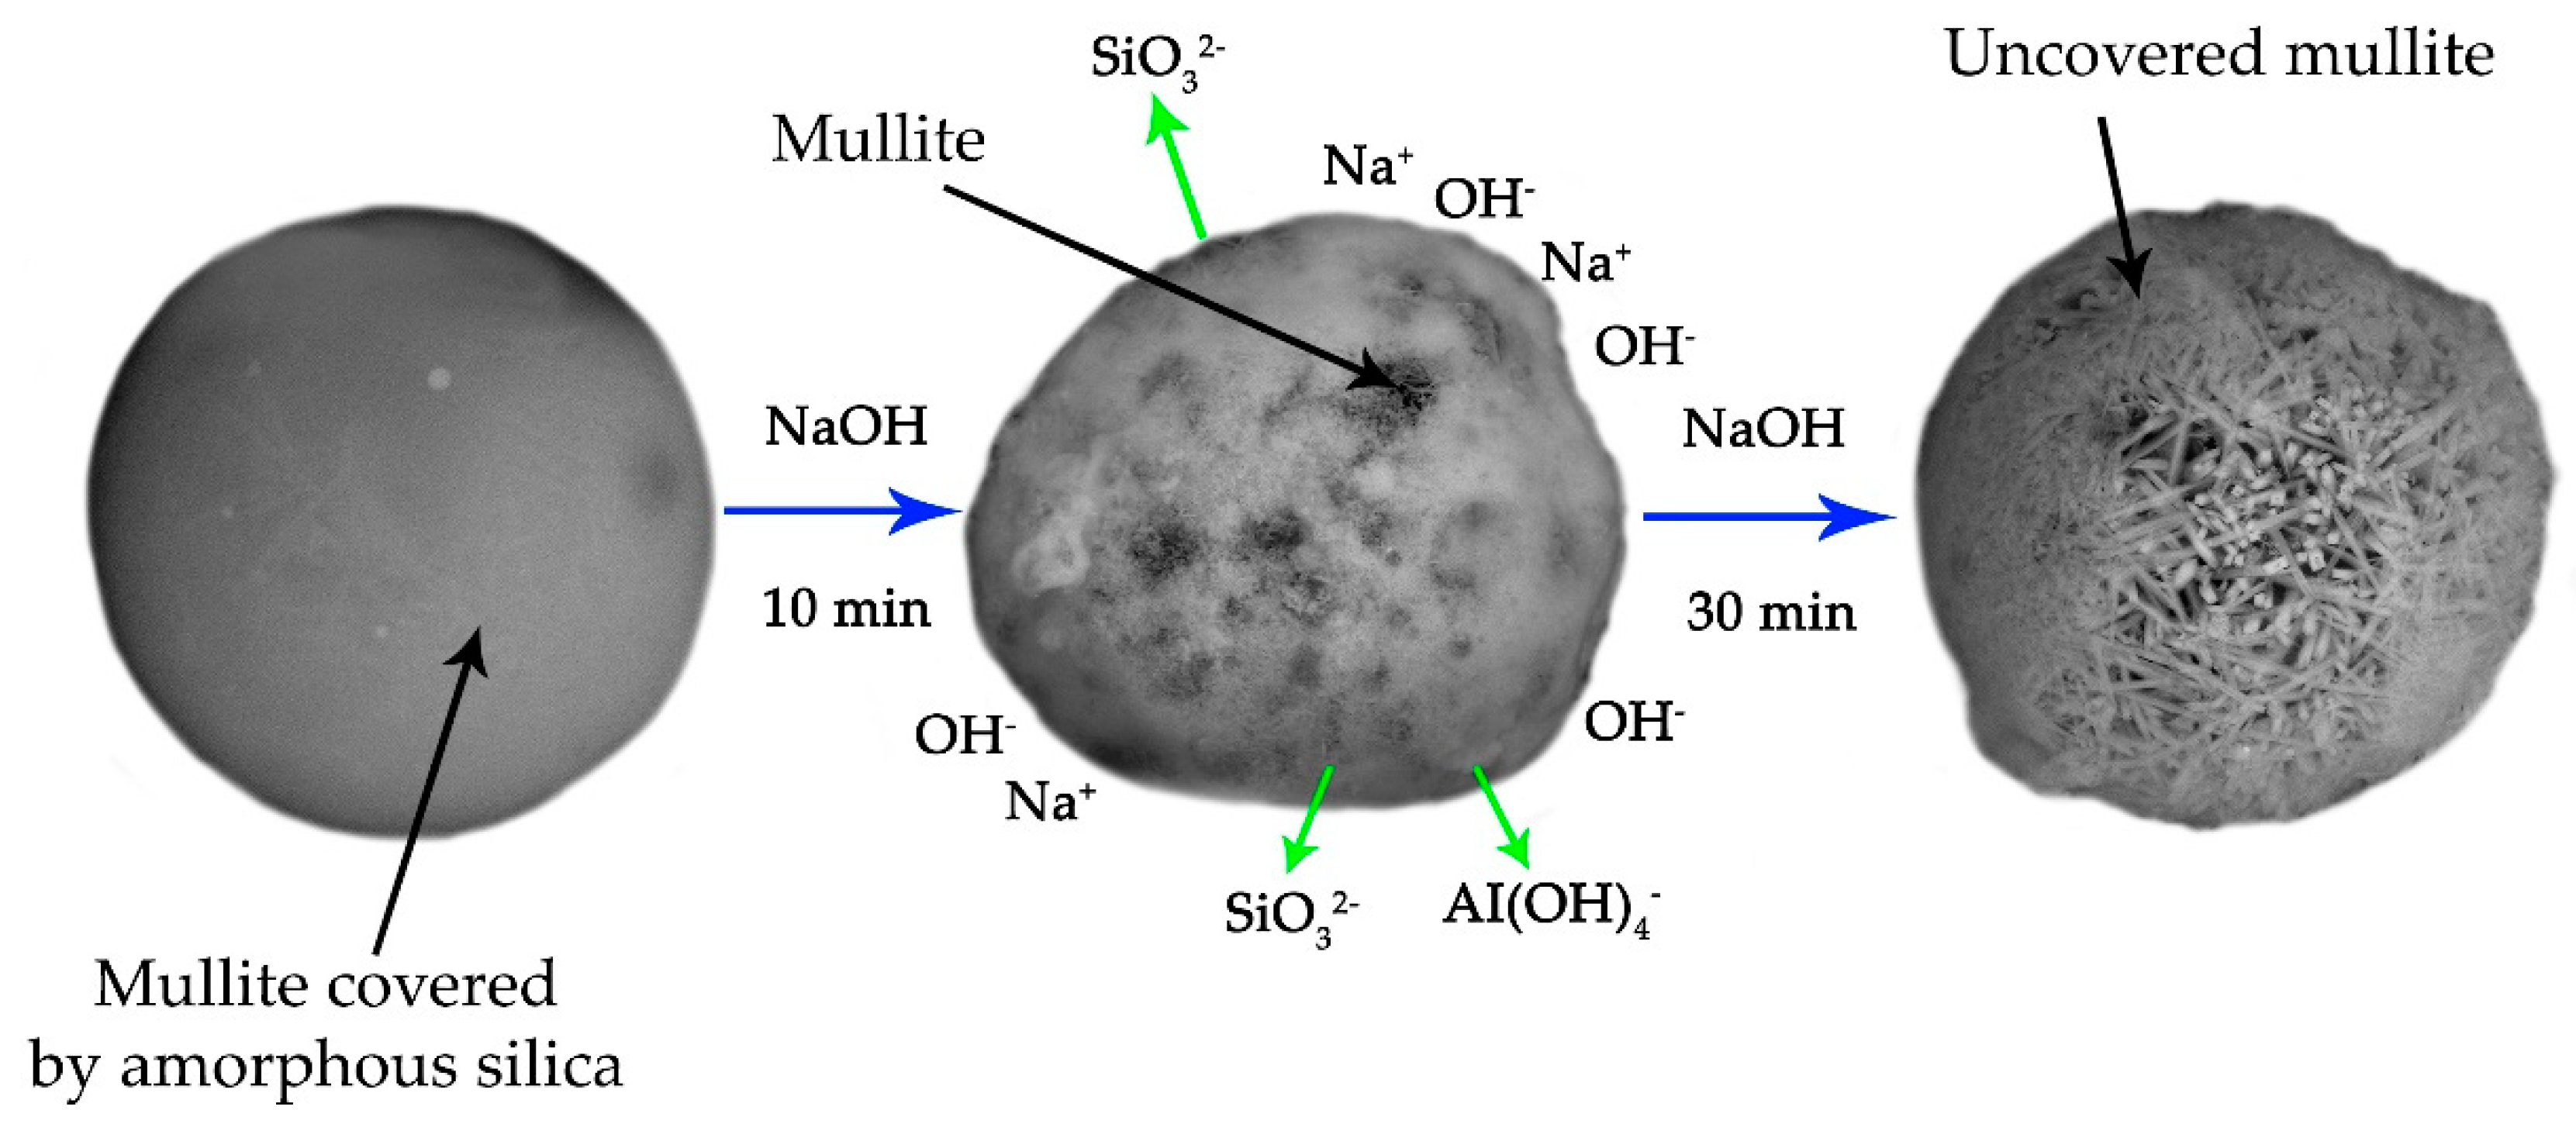
- Due to the NaOH leaching of CFA at conditions that prevent the formation of a DSP, mullite particles with an acicular structure are exposed. This leads to a significant increase of the porosity and specific surface area of the solid residue, and, consequently, to an increase in its reactivity.
Author Contributions
Funding
Acknowledgments
Conflicts of Interest
References
- Bazhin, V.Y.; Beloglazov, I.I.; Feshchenko, R.Y. Deep conversion and metal content of Russian coals. Eurasian Min. 2016, 2, 28–32. [Google Scholar] [CrossRef]
- Yao, Z.T.; Xia, M.S.; Sarker, P.K.; Chen, T. A review of the alumina recovery from coal fly ash, with a focus in China. Fuel 2014, 120, 74–85. [Google Scholar] [CrossRef]
- Dikhanbaev, B.; Dikhanbaev, A.B.; Sultan, I.; Rusowicz, A. Development of hydrogen-enriched water gas production technology by processing Ekibastuz coal with technogenic waste. Arch. Mech. Eng. 2018. [Google Scholar] [CrossRef]
- Bhatt, A.; Priyadarshini, S.; Acharath Mohanakrishnan, A.; Abri, A.; Sattler, M.; Techapaphawit, S. Physical, chemical, and geotechnical properties of coal fly ash: A global review. Case Stud. Constr. Mater. 2019, 11, e00263. [Google Scholar] [CrossRef]
- Blissett, R.S.; Rowson, N.A. A review of the multi-component utilisation of coal fly ash. Fuel 2012, 97, 1–23. [Google Scholar] [CrossRef]
- Coal Mining in Russia: Basic Indicators. Available online: https://minenergo.gov.ru/node/435 (accessed on 27 May 2020).
- Ryabov, Y.V.; Delitsyn, L.M.; Ezhova, N.N.; Sudareva, S.V. Methods for Beneficiation of Ash and Slag Waste from Coal-Fired Thermal Power Plants and Ways for Their Commercial Use (a Review). Therm. Eng. 2019, 66, 149–168. [Google Scholar] [CrossRef]
- Project Energy Strategy of the Russian Federation for the Period Until 2035. Available online: minenergo.gov.ru/node/1920 (accessed on 27 May 2020).
- Amster, E. Public health impact of coal-fired power plants: A critical systematic review of the epidemiological literature. Int. J. Environ. Health Res. 2019, 1–23. [Google Scholar] [CrossRef]
- Ilic, M.; Cheeseman, C.; Sollars, C.; Knight, J. Mineralogy and microstructure of sintered lignite coal fly ash. Fuel 2003, 82, 331–336. [Google Scholar] [CrossRef]
- Temimi, M.; Camps, J.P.; Laquerbe, M. Valorization of fly ash in the cold stabilization of clay materials. Resour. Conserv. Recycl. 1995, 15, 219–234. [Google Scholar] [CrossRef]
- Manoharan, V.; Yunusa, I.A.M.; Loganathan, P.; Lawrie, R.; Skilbeck, C.G.; Burchett, M.D.; Murray, B.R.; Eamus, D. Assessments of Class F fly ashes for amelioration of soil acidity and their influence on growth and uptake of Mo and Se by canola. Fuel 2010, 89, 3498–3504. [Google Scholar] [CrossRef]
- Matsi, T.; Keramidas, V.Z. Fly ash application on two acid soils and its effect on soil salinity, pH, B, P and on ryegrass growth and composition. Environ. Pollut. 1999, 104, 107–112. [Google Scholar] [CrossRef]
- Lee, H.; Ha, H.S.; Lee, C.H.; Lee, Y.B.; Kim, P.J. Fly ash effect on improving soil properties and rice productivity in Korean paddy soils. Bioresour. Technol. 2006, 97, 1490–1497. [Google Scholar] [CrossRef] [PubMed]
- Furlani, E.; Brückner, S.; Minichelli, D.; Maschio, S. Synthesis and characterization of ceramics from coal fly ash and incinerated paper mill sludge. Ceram. Int. 2008, 34, 2137–2142. [Google Scholar] [CrossRef]
- Yao, Z.; Tan, S.; Xia, M.; Ye, Y.; Li, J. Synthesis, characterization and sintering behaviour of indialite ceramic from fly ash. Waste Manag. Res. 2011, 29, 1090–1097. [Google Scholar] [CrossRef]
- Erol, M.; Küçükbayrak, S.; Ersoy-Meriçboyu, A. Characterization of sintered coal fly ashes. Fuel 2008, 87, 1334–1340. [Google Scholar] [CrossRef]
- Erol, M.; Küçükbayrak, S.; Ersoy-Meriçboyu, A. Comparison of the properties of glass, glass–ceramic and ceramic materials produced from coal fly ash. J. Hazard. Mater. 2008, 153, 418–425. [Google Scholar] [CrossRef]
- Xuan, X.; Yue, C.; Li, S.; Yao, Q. Selective catalytic reduction of NO by ammonia with fly ash catalyst. Fuel 2003, 82, 575–579. [Google Scholar] [CrossRef]
- Jain, D.; Khatri, C.; Rani, A. Fly ash supported calcium oxide as recyclable solid base catalyst for Knoevenagel condensation reaction. Fuel Process. Technol. 2010, 91, 1015–1021. [Google Scholar] [CrossRef]
- Saputra, E.; Muhammad, S.; Sun, H.; Ang, H.M.; Tadé, M.O.; Wang, S. Red mud and fly ash supported Co catalysts for phenol oxidation. Catal. Today 2012, 190, 68–72. [Google Scholar] [CrossRef]
- Wang, S. Application of Solid Ash Based Catalysts in Heterogeneous Catalysis. Environ. Sci. Technol. 2008, 42, 7055–7063. [Google Scholar] [CrossRef]
- Wang, S.; Wu, H. Environmental-benign utilisation of fly ash as low-cost adsorbents. J. Hazard. Mater. 2006, 136, 482–501. [Google Scholar] [CrossRef] [PubMed]
- Hirajima, T.; Petrus, H.T.B.M.; Oosako, Y.; Nonaka, M.; Sasaki, K.; Ando, T. Recovery of cenospheres from coal fly ash using a dry separation process: Separation estimation and potential application. Int. J. Miner. Process. 2010, 95, 18–24. [Google Scholar] [CrossRef]
- Niewiadomski, M.; Hupka, J.; Bokotko, R.; Miller, J.D. Recovery of coke fines from fly ash by air sparged hydrocyclone flotation. Fuel 1999, 78, 161–168. [Google Scholar] [CrossRef]
- Shoumkova, A.S. Magnetic separation of coal fly ash from Bulgarian power plants. Waste Manag. Res. 2011, 29, 1078–1089. [Google Scholar] [CrossRef]
- Valeev, D.; Kunilova, I.; Alpatov, A.; Mikhailova, A.; Goldberg, M.; Kondratiev, A. Complex utilisation of ekibastuz brown coal fly ash: Iron & carbon separation and aluminum extraction. J. Clean. Prod. 2019, 218, 192–201. [Google Scholar]
- Verrecchia, G.; Cafiero, L.; de Caprariis, B.; Dell’Era, A.; Pettiti, I.; Tuffi, R.; Scarsella, M. Study of the parameters of zeolites synthesis from coal fly ash in order to optimize their CO2 adsorption. Fuel 2020, 276, 118041. [Google Scholar] [CrossRef]
- Ren, X.; Qu, R.; Liu, S.; Zhao, H.; Wu, W.; Song, H.; Zheng, C.; Wu, X.; Gao, X. Synthesis of Zeolites from Coal Fly Ash for Removal of Harmful Gaseous Pollutants: A Review. Aerosol Air Qual. Res. 2020, 20, 1127–1144. [Google Scholar] [CrossRef]
- Liu, Z.; Li, S.; Li, L.; Wang, J.; Zhou, Y.; Wang, D. One-step high efficiency crystallization of zeolite A from ultra-fine circulating fluidized bed fly ash by hydrothermal synthesis method. Fuel 2019, 257, 116043. [Google Scholar] [CrossRef]
- Malonda Shabani, J.; Babajide, O.; Oyekola, O.; Petrik, L. Synthesis of Hydroxy Sodalite from Coal Fly Ash for Biodiesel Production from Waste-Derived Maggot Oil. Catalysts 2019, 9, 1052. [Google Scholar] [CrossRef]
- Torralvo, F.A.; Fernández-Pereira, C. Recovery of germanium from real fly ash leachates by ion-exchange extraction. Miner. Eng. 2011, 24, 35–41. [Google Scholar] [CrossRef]
- Wang, N.; Sun, X.; Zhao, Q.; Yang, Y.; Wang, P. Leachability and adverse effects of coal fly ash: A review. J. Hazard. Mater. 2020, 396, 122725. [Google Scholar] [CrossRef] [PubMed]
- Shi, Y.; Jiang, K.; Zhang, T.; Guo, J.; Zhao, A. Clean production of porous-Al(OH)3 from fly ash. J. Hazard. Mater. 2020, 393, 122371. [Google Scholar] [CrossRef] [PubMed]
- Ding, J.; Ma, S.; Shen, S.; Xie, Z.; Zheng, S.; Zhang, Y. Research and industrialization progress of recovering alumina from fly ash: A concise review. Waste Manag. 2017, 60, 375–387. [Google Scholar] [CrossRef] [PubMed]
- Valeev, D.; Shoppert, A.; Mikhailova, A.; Kondratiev, A. Acid and Acid-Alkali Treatment Methods of Al-Chloride Solution Obtained by the Leaching of Coal Fly Ash to Produce Sandy Grade Alumina. Metals 2020, 10, 585. [Google Scholar] [CrossRef]
- Valeev, D.; Kunilova, I.; Shoppert, A.; Salazar-Concha, C.; Kondratiev, A. High-pressure HCl leaching of coal ash to extract Al into a chloride solution with further use as a coagulant for water treatment. J. Clean. Prod. 2020, 276, 123206. [Google Scholar] [CrossRef]
- Ma, Z.; Zhang, S.; Zhang, H.; Cheng, F. Novel extraction of valuable metals from circulating fluidized bed-derived high-alumina fly ash by acid–alkali–based alternate method. J. Clean. Prod. 2019, 230, 302–313. [Google Scholar] [CrossRef]
- Panek, R.; Wdowin, M.; Franus, W.; Czarna, D.; Stevens, L.A.; Deng, H.; Liu, J.; Sun, C.; Liu, H.; Snape, C.E. Fly ash-derived MCM-41 as a low-cost silica support for polyethyleneimine in post-combustion CO2 capture. J. CO2 Util. 2017, 22, 81–90. [Google Scholar] [CrossRef]
- Yan, F.; Jiang, J.; Tian, S.; Liu, Z.; Shi, J.; Li, K.; Chen, X.; Xu, Y. A Green and Facile Synthesis of Ordered Mesoporous Nanosilica Using Coal Fly Ash. ACS Sustain. Chem. Eng. 2016, 4, 4654–4661. [Google Scholar] [CrossRef]
- Ju, T.; Jiang, J.; Meng, Y.; Yan, F.; Xu, Y.; Gao, Y.; Aihemaiti, A. An investigation of the effect of ultrasonic waves on the efficiency of silicon extraction from coal fly ash. Ultrason. Sonochem. 2020, 60, 104765. [Google Scholar] [CrossRef]
- Kuppusamy, V.K.; Kumar, A.; Holuszko, M. Simultaneous Extraction of Clean Coal and Rare Earth Elements From Coal Tailings Using Alkali-Acid Leaching Process. J. Energy Resour. Technol. 2019, 141, 070708. [Google Scholar] [CrossRef]
- Kumar, A.; Agrawal, S.; Dhawan, N. Processing of Coal Fly Ash for the Extraction of Alumina Values. J. Sustain. Metall. 2020, 6, 294–306. [Google Scholar] [CrossRef]
- Guo, Y.; Zhao, Z.; Zhao, Q.; Cheng, F. Novel process of alumina extraction from coal fly ash by pre-desilicating—Na2CO3 activation—Acid leaching technique. Hydrometallurgy 2017, 169, 418–425. [Google Scholar] [CrossRef]
- Bai, G.; Teng, W.; Wang, X.; Zhang, H.; Xu, P. Processing and kinetics studies on the alumina enrichment of coal fly ash by fractionating silicon dioxide as nano particles. Fuel Process. Technol. 2010, 91, 175–184. [Google Scholar] [CrossRef]
- Smith, P. The processing of high silica bauxites—Review of existing and potential processes. Hydrometallurgy 2009, 98, 162–176. [Google Scholar] [CrossRef]
- Czarna-Juszkiewicz, D.; Kunecki, P.; Panek, R.; Madej, J.; Wdowin, M. Impact of Fly Ash Fractionation on the Zeolitization Process. Materials 2020, 13, 1035. [Google Scholar] [CrossRef]
- Kunecki, P.; Panek, R.; Wdowin, M.; Bień, T.; Franus, W. Influence of the fly ash fraction after grinding process on the hydrothermal synthesis efficiency of Na-A, Na-P1, Na-X and sodalite zeolite types. Int. J. Coal Sci. Technol. 2020. [Google Scholar] [CrossRef]
- Aphane, M.E.; Doucet, F.J.; Kruger, R.A.; Petrik, L.; van der Merwe, E.M. Preparation of Sodium Silicate Solutions and Silica Nanoparticles from South African Coal Fly Ash. Waste Biomass Valor 2019. [Google Scholar] [CrossRef]
- Shoppert, A.; Loginova, I.; Rogozhnikov, D.; Karimov, K.; Chaikin, L. Increased As Adsorption on Maghemite-Containing Red Mud Prepared by the Alkali Fusion-Leaching Method. Minerals 2019, 9, 60. [Google Scholar] [CrossRef]
- Loginova, I.V.; Shoppert, A.A.; Chaikin, L.I. Effect of Adding Sintering Furnace Electrostatic Precipitator Dust on Combined Leaching of Bauxites and Cakes. Metallurgist 2015, 59, 698–704. [Google Scholar] [CrossRef]
- Abdrakhimov, V.Z.; Abdrakhimova, E.S. Phase Structure of Pottery on the Basis of Waste Products of Combustible Slates, Coal Enrichment, Oil Extracting and Ashes Slag Materials. Bull. Samara Sci. Cent. Russ. Acad. Sci. 2013, 15, 82–95. [Google Scholar]
- Xie, Y.; Wei, S.; Wang, X.; Xie, S.; Yang, C. A new prediction model based on the leaching rate kinetics in the alumina digestion process. Hydrometallurgy 2016, 164, 7–14. [Google Scholar] [CrossRef]
- Shokri, A. Degradation of 4-Chloro phenol in aqueous media thru UV/Persulfate method by Artificial Neural Network and full factorial design method. Int. J. Environ. Anal. Chem. 2020, 1–15. [Google Scholar] [CrossRef]
- Myerson, A.S. Handbook of Industrial Crystallization; Butterworth-Heinemann: Oxford, UK, 2002; ISBN 978-0-08-053351-3. [Google Scholar]
- Levenspiel, O. Chemical Reaction Engineering, 3rd ed.; Wiley: New York, NY, USA, 1999; ISBN 978-0-471-25424-9. [Google Scholar]
- Taleb, K.; Markovski, J.; Milosavljević, M.; Marinović-Cincović, M.; Rusmirović, J.; Ristić, M.; Marinković, A. Efficient arsenic removal by cross-linked macroporous polymer impregnated with hydrous iron oxide: Material performance. Chem. Eng. J. 2015, 279, 66–78. [Google Scholar] [CrossRef]
- Choo, T.F.; Mohd Salleh, M.A.; Kok, K.Y.; Matori, K.A.; Abdul Rashid, S. Characterization of High-Temperature Hierarchical Porous Mullite Washcoat Synthesized Using Aluminum Dross and Coal Fly Ash. Crystals 2020, 10, 178. [Google Scholar] [CrossRef]
- Musyoka, N.M.; Wdowin, M.; Rambau, K.M.; Franus, W.; Panek, R.; Madej, J.; Czarna-Juszkiewicz, D. Synthesis of activated carbon from high-carbon coal fly ash and its hydrogen storage application. Renew. Energy 2020, 155, 1264–1271. [Google Scholar] [CrossRef]
- Bazhin, V.Y. Structural modification of petroleum needle coke by adding lithium on calcining. Coke Chem. 2015, 58, 138–142. [Google Scholar] [CrossRef]


| Main Components, wt.% | |||||||||
|---|---|---|---|---|---|---|---|---|---|
| SiO2 | Al2O3 | CaO | Fe2O3 | TiO2 | MgO | Na2O | K2O | LOI | C |
| 63.12 | 23.40 | 1.85 | 4.85 | 1.17 | 0.51 | 0.75 | 0.59 | 3.99 | 1.60 |
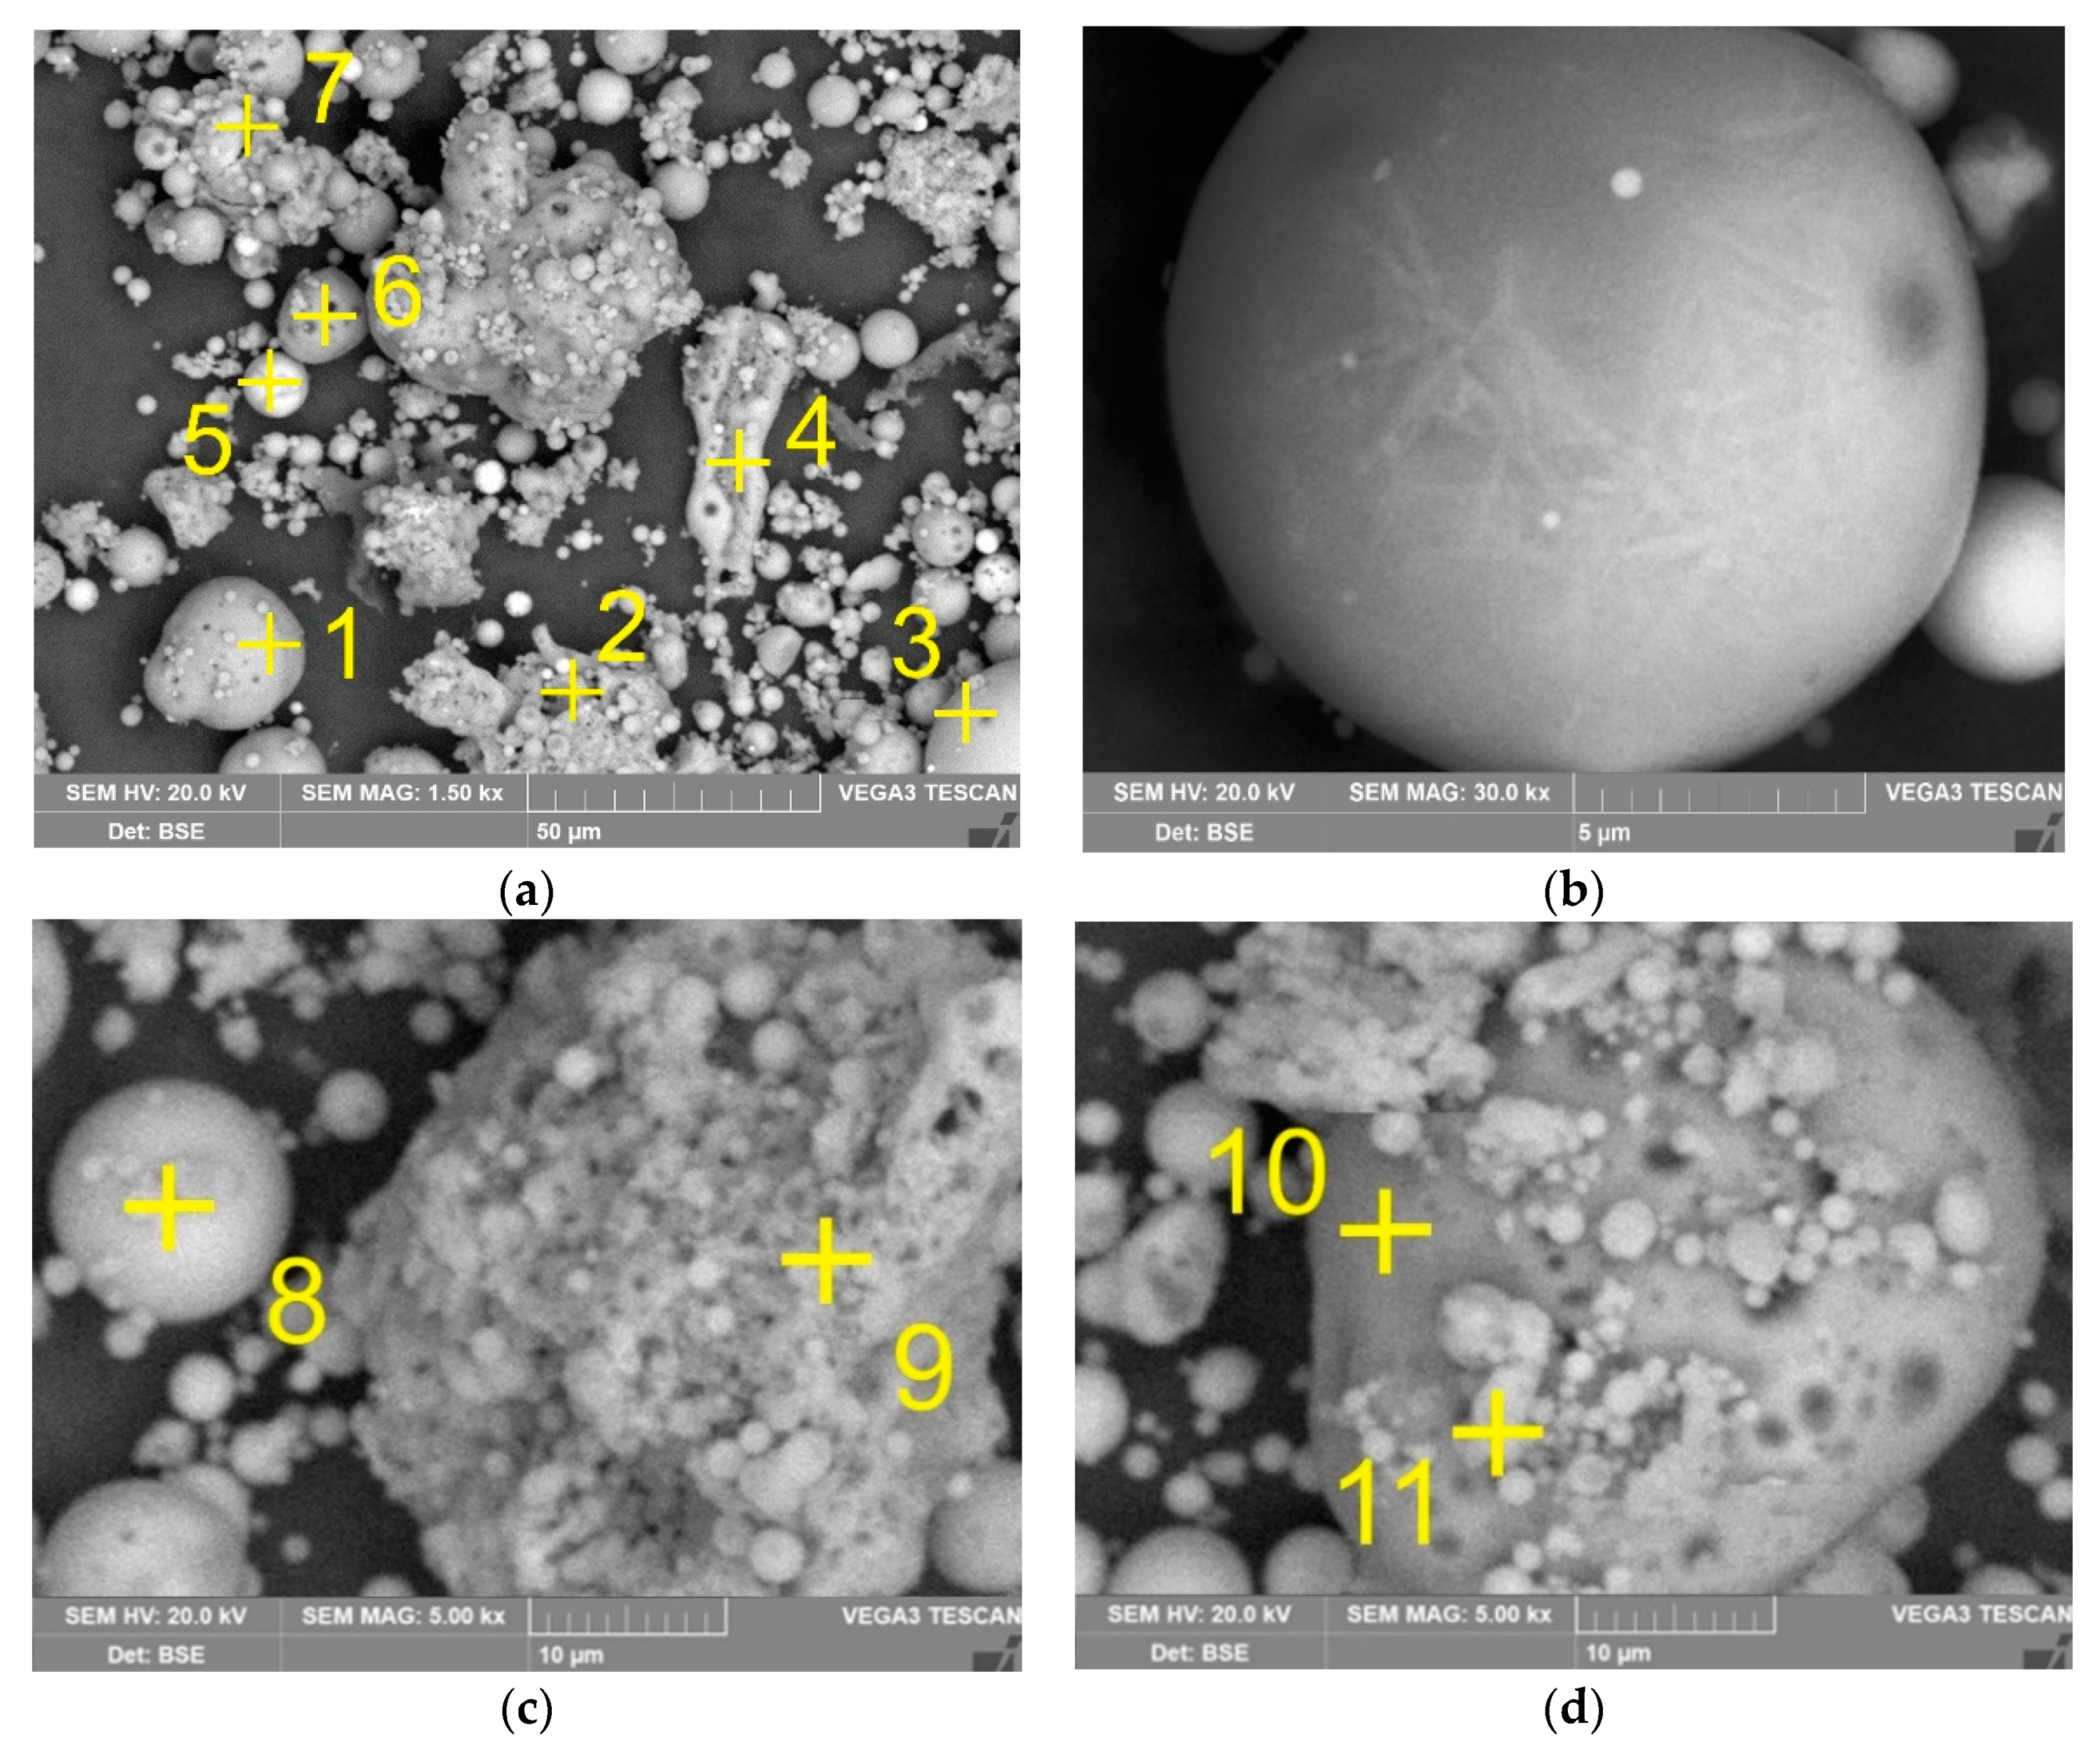
| Spectrum | O | Si | Al | Ca | K | Fe | Ti | Mg | Na | Phase |
|---|---|---|---|---|---|---|---|---|---|---|
| 1 | 53.9 | 20.5 | 16.5 | 1.0 | 1.1 | 6.1 | 0.3 | - | 0.7 | Mullite + A-S 1 |
| 2 | 52.9 | 30.4 | 14.7 | 0.3 | 0.7 | 0.3 | 0.3 | - | 0.5 | A-S |
| 3 | 46.1 | 22.7 | 4.8 | 4.6 | - | 19.2 | 0.8 | 1.7 | - | Magnetite + Ca-A-S 2 |
| 4 | 52.7 | 26.0 | 10.6 | 0.3 | 0.8 | 8.0 | - | 0.7 | 0.5 | A-S |
| 5 | 56.1 | 8.2 | 5.8 | 0.7 | - | 0.7 | 19.7 | 0.2 | 0.2 | Rutile + A-S |
| 6 | 54.2 | 22.7 | 21.3 | - | 0.5 | 0.4 | 0.4 | - | 0.6 | Mullite + A-S |
| 7 | 56.3 | 9.8 | 4.6 | 11.6 | - | 0.3 | - | 0.3 | - | Ca-A-S |
| 8 | 57.5 | 21.6 | 9.8 | 8.4 | 0.3 | 1.3 | - | - | 0.4 | Ca-A-S |
| 9 | 57.2 | 31.1 | 10.6 | - | 0.8 | - | 0.4 | - | - | A-S |
| 10 | 50.8 | 26.5 | 18.8 | 0.7 | 0.7 | 1.2 | 0.5 | 0.4 | 0.5 | Mullite + A-S |
| 11 | 59.2 | 23.7 | 14.6 | 0.3 | 0.5 | 1.1 | - | - | 0.6 | A-S |
| Phase | Content % |
|---|---|
| Amorphous | 50.26 |
| Mullite | 22.05 |
| Quartz | 12.06 |
| Feldspar | 7.22 |
| Magnetite | 4.69 |
| Rutile | 1.17 |
| Other | 2.55 |
| Total | 100 |
| No. | Time (min) | L/S Ratio (mL/g) | Temperature (°C) | Si Recovery (%) | Al Recovery (%) | Na2O in Solid Residue (%) |
|---|---|---|---|---|---|---|
| 1 | 30 | 10 | 120 | 76.82 | 17.99 | 6.00 |
| 2 | 120 | 20 | 120 | 79.54 | 29.35 | 10.12 |
| 3 | 120 | 20 | 100 | 77.24 | 20.74 | 3.02 |
| 4 | 75 | 21.5 | 110 | 91.63 | 41.64 | 0.89 |
| 5 | 30 | 20 | 100 | 52.13 | 6.38 | 0.44 |
| 6 | 75 | 15 | 110 | 70.26 | 5.86 | 8.86 |
| 7 | 75 | 15 | 97 | 64.20 | 18.43 | 0.46 |
| 8 | 120 | 10 | 100 | 60.57 | 2.08 | 7.62 |
| 9 | 120 | 10 | 120 | 56.86 | 1.00 | 11.00 |
| 10 | 133 | 15 | 110 | 66.44 | 5.66 | 9.99 |
| 11 | 30 | 20 | 120 | 88.14 | 43.75 | 0.65 |
| 12 | 75 | 8.5 | 110 | 83.87 | 40.11 | 8.05 |
| 13 | 75 | 15 | 123 | 73.87 | 21.05 | 10.59 |
| 14 | 75 | 15 | 110 | 69.18 | 9.50 | 8.86 |
| 15 | 30 | 10 | 100 | 44.87 | 12.59 | 0.53 |
| 16 | 17 | 15 | 110 | 59.06 | 21.97 | 0.42 |
| Main Components, wt.% | |||||||||
|---|---|---|---|---|---|---|---|---|---|
| SiO2 | Al2O3 | CaO | Fe2O3 | TiO2 | MgO | Na2O | K2O | LOI | C |
| 23.42 | 41.42 | 2.83 | 15.30 | 3.69 | 1.61 | 0.89 | 0.28 | 8.15 | 5.05 |
| Spectrum | O | Si | Al | Ca | K | Fe | Ti | Mg | Na | C | Phase |
|---|---|---|---|---|---|---|---|---|---|---|---|
| 1 | 40.5 | 4.2 | 5.4 | 15.3 | 0.3 | 27.5 | 1.8 | 0.6 | 0.5 | - | Magnetite + Ca-A-S |
| 2 | 61.7 | 37.5 | 0.8 | - | - | - | - | - | - | - | Quartz |
| 3 | 23.3 | 1.9 | 4.8 | 0.7 | - | 0.8 | 0.7 | - | - | 67.7 | C |
| 4 | 55.9 | 30.4 | 2.7 | 0.8 | - | 0.5 | 0.3 | - | 0.2 | - | Quartz |
| 5 | 33.2 | 5.0 | 14.7 | 0.2 | - | 0.4 | 0.3 | - | - | 46.2 | C + mullite |
| 6 | 57.1 | 10.4 | 30.7 | 0.3 | 0.4 | 0.7 | 0.5 | 0.3 | 0.4 | - | Mullite |
| 7 | 37.6 | 1.9 | 8.1 | 6.2 | 0.3 | 44.6 | 6.2 | 1.0 | - | - | Magnetite + Ca-A-S |
| 8 | 59.0 | 10.7 | 30.2 | 0.3 | - | - | 0.5 | - | - | - | Mullite |
| 9 | 52.2 | 12.0 | 31.4 | 0.6 | 0.4 | 0.9 | 1.0 | 0.5 | - | - | Mullite |
| 10 | 43.0 | 6.5 | 24.3 | 0.4 | 0.3 | 0.4 | 1.7 | - | - | 23.6 | C + mullite |
| 11 | 65.1 | 20.5 | 8.6 | 3.5 | - | 0.5 | 0.6 | 0.4 | - | - | Ca-A-S |
| 12 | 61.1 | 10.1 | 20.0 | 4.5 | - | 0.7 | 1.4 | - | - | - | Mullite + Ca-A-S |
| 13 | 57.9 | 10.3 | 30.9 | 0.2 | 0.2 | 0.2 | 0.3 | - | - | - | Mullite |
| CFA | Specific Surface Area (BET) (m2/g) | Total Pore Volume (cm3/g) | Pore Diameter (nm) | Particle Size Distribution (µm) | ||
|---|---|---|---|---|---|---|
| Dx (10) | Dx (50) | Dx (90) | ||||
| Raw CFA | 0.81 | 0.07 | 88 | 7.17 | 77.06 | 210.38 |
| Solid residue | 15.70 | 8.99 | 25 | 7.41 | 67.23 | 200.45 |
Publisher’s Note: MDPI stays neutral with regard to jurisdictional claims in published maps and institutional affiliations. |
© 2020 by the authors. Licensee MDPI, Basel, Switzerland. This article is an open access article distributed under the terms and conditions of the Creative Commons Attribution (CC BY) license (http://creativecommons.org/licenses/by/4.0/).
Share and Cite
Shoppert, A.; Valeev, D.; Loginova, I.; Chaikin, L. Complete Extraction of Amorphous Aluminosilicate from Coal Fly Ash by Alkali Leaching under Atmospheric Pressure. Metals 2020, 10, 1684. https://doi.org/10.3390/met10121684
Shoppert A, Valeev D, Loginova I, Chaikin L. Complete Extraction of Amorphous Aluminosilicate from Coal Fly Ash by Alkali Leaching under Atmospheric Pressure. Metals. 2020; 10(12):1684. https://doi.org/10.3390/met10121684
Chicago/Turabian StyleShoppert, Andrei, Dmitry Valeev, Irina Loginova, and Leonid Chaikin. 2020. "Complete Extraction of Amorphous Aluminosilicate from Coal Fly Ash by Alkali Leaching under Atmospheric Pressure" Metals 10, no. 12: 1684. https://doi.org/10.3390/met10121684
APA StyleShoppert, A., Valeev, D., Loginova, I., & Chaikin, L. (2020). Complete Extraction of Amorphous Aluminosilicate from Coal Fly Ash by Alkali Leaching under Atmospheric Pressure. Metals, 10(12), 1684. https://doi.org/10.3390/met10121684