Article

Pneumatic Experimental Design for Strain Rate Sensitive Forming Limit Evaluation of 7075 Aluminum Alloy Sheets under Biaxial Stretching Modes at Elevated Temperature

1
Department of Materials Science and Engineering, Seoul National University, Daehak-dong, Gwanak-gu, Seoul 151-744, Korea
2
Materials Deformation Department, Korea Institute of Materials Science, 797 Changwon-daero, Changwon 642-831, Korea
3
Aerospace Materials Center, Korea Institute of Materials Science, 797 Changwon-daero, Changwon 642-831, Korea
*
Author to whom correspondence should be addressed.
Metals 2020, 10(12), 1639; https://doi.org/10.3390/met10121639
Submission received: 30 October 2020 / Revised: 2 December 2020 / Accepted: 2 December 2020 / Published: 5 December 2020
(This article belongs to the Special Issue Latest Hydroforming Technology of Metallic Tubes and Sheets)

Abstract

:
A pneumatic experimental design to evaluate strain rate sensitive biaxial stretching forming limits for 7075 aluminum alloy sheets was attempted with the finite element method. It was composed of apparatus geometric design with pressure optimization as the process design. The 7075 aluminum alloy material was characterized by conventional Voce-type hardening law with power law strain rate sensitivity relationship. For optimization of the die shape design, the ratio of minor to major die radius (k) and profile radius (R) were parametrically studied. The final shape of die was determined by how the history of targeted deformation mode was well maintained and whether the fracture was induced at the pole (specimen center), thereby preventing unexpected failure at other locations. As a result, a circular die with k = 1.0 and an elliptic die with k = 0.25 were selected for the balanced biaxial mode and near plane strain mode, respectively. Lastly, the pressure inducing fracture at the targeted strain rate was studied as the process design. An analytical solution that had been previously studied to maintain constant strain rate was properly modified for the designed model. The results of the integrated design were compared with real experimental results. The shape and thickness distribution of numerical simulation showed good agreement with those of the experiment.

1. Introduction

Pneumatic forming or superplastic forming (SPF) has been widely utilized in various different areas, such as the aerospace and automobile industries [1,2]. Pneumatic forming is a forming method that deforms sheets by gas pressure at elevated temperatures. Some researchers have developed the method to construct a forming limit diagram (FLD) by pneumatic forming [3,4]. Although conventional draw forming is widely utilized for constructing FLD, the apparatus for draw forming is vulnerable to elevated and high temperatures because of contact problems. Contact between specimen and tools at elevated and high temperatures causes degradation of tool life and less durability due to increased friction, heat expansion, and weakening tool strength. Moreover, the friction effect by contact can lead to inaccurate measurement of FLD, thereby triggering early failure. When it comes to constant deformation rate, it is quite difficult to maintain the targeted strain rate due to the instability coming from the contact. Pneumatic forming has no contact or only a little contact on the edge of the die during deformation. Only a little or no contact area can reduce abrupt material failure by friction without the use of lubricants, thus enduring high temperatures. Minimization of contact also enables pneumatic forming to maintain a constant strain rate more precisely than draw forming for construction of a rate-dependent forming limit diagram. In addition, pneumatic forming can be more accurately halted at the fracture point. The punching movement in draw forming is suspended after ample force reduction following a crack. However, the pneumatic test is halted right after a crack occurs. Blank deformation is stopped when there is not enough pressure to continue blowing because the air on one side of the blank is deflated to the other side as a crack occurs. Therefore, the pneumatic test has a big advantage as it does not bring disparity between fracture occurrence and halts at dome height. For all these reasons, pneumatic forming can be a good alternative to the draw forming method as it does not have the limitations of a mechanical contact test. There have been many studies to improve the pneumatic forming method to construct forming limit diagrams.
Some researchers have studied building biaxial tension–tension modes by changing the die cavity on the same specimen design [3,5]. Others have tried to construct axial tension–compression modes by changing the blank shape on the same die cavity design [4]. It is also challenging to maintain constant strain rate deformation to construct a rate-dependent forming limit diagram. An analytical solution formulated in a circular die cavity with various strain rates based on the Levy–Mises relations and linearly strain hardening material was studied [6]. The solution was modified for general die cavity shape with transversely isotropic yield function applied to Hollomon hardening material and strain rate-dependent superplastic material [5,7]. Some works of literature have researched strain rate- and temperature-dependent FLD using the Nakajima test and compared it to theoretical predictions with a Marciniak–Kaczynski (M–K) model and continuum damage mechanics (CDM)-based models [8,9]. However, such efforts to construct a FLD in an experiment are limited with the conventional draw forming method. Therefore, a FLD with rate sensitivity has to be constructed by a pneumatic forming method to eliminate failure variables, such as friction, by stopping at the exact moment with uniform deformation and constant strain rate history.
The aim of this research was to establish a design for the major factors of rate-dependent FLD of 7075 aluminum alloy sheets, such as proper die shape and pressure condition, to build fracture properties with strain rate sensitivity. In this study, an integral design for strain rate sensitive forming limit diagram by pneumatic forming was attempted with numerical simulation. The numerical procedures of the integral design consisted of two parts: apparatus geometric design and process condition design. First, two main geometric parameters were used to design a pneumatic forming die, namely, cavity radius ratio (k) and die profile radius (R), as shown in Figure 1. The cavity radius ratio (k) is the ratio of the minor to the major radius of the die. The goal of optimized k is to find the proper k value leading to proper fracture modes with a stable deformation path history. The aim of the optimization of R is to induce fracture occurrence at the pole by concentrating deformation on the center of the blank. This prevents fracture at an unexpected position that is not the center of the specimen and assists stable deformation at the pole, thereby leading to proportional load history in the domain of major and minor stress or triaxiality and effective strain. To trace the deformation mode history and compare the deformation quantity between the center of the blank and the next critical location (the largest deformed location except for the pole of the blank during deformation), numerical finite element simulation was utilized. Lastly, the pressure and time relationship for proper strain rates were studied as process conditions. An analytical solution to the pressure–time relationship was modified and compared with the results of a preexisting formulation. The effect of profile radius (R) was considered in the newly modified analytical model. For validation, the pneumatic forming die was fabricated based on the effect of the integral design process. Simulation results were finally compared with the experiments at optimized conditions.

2. Finite Element Modeling
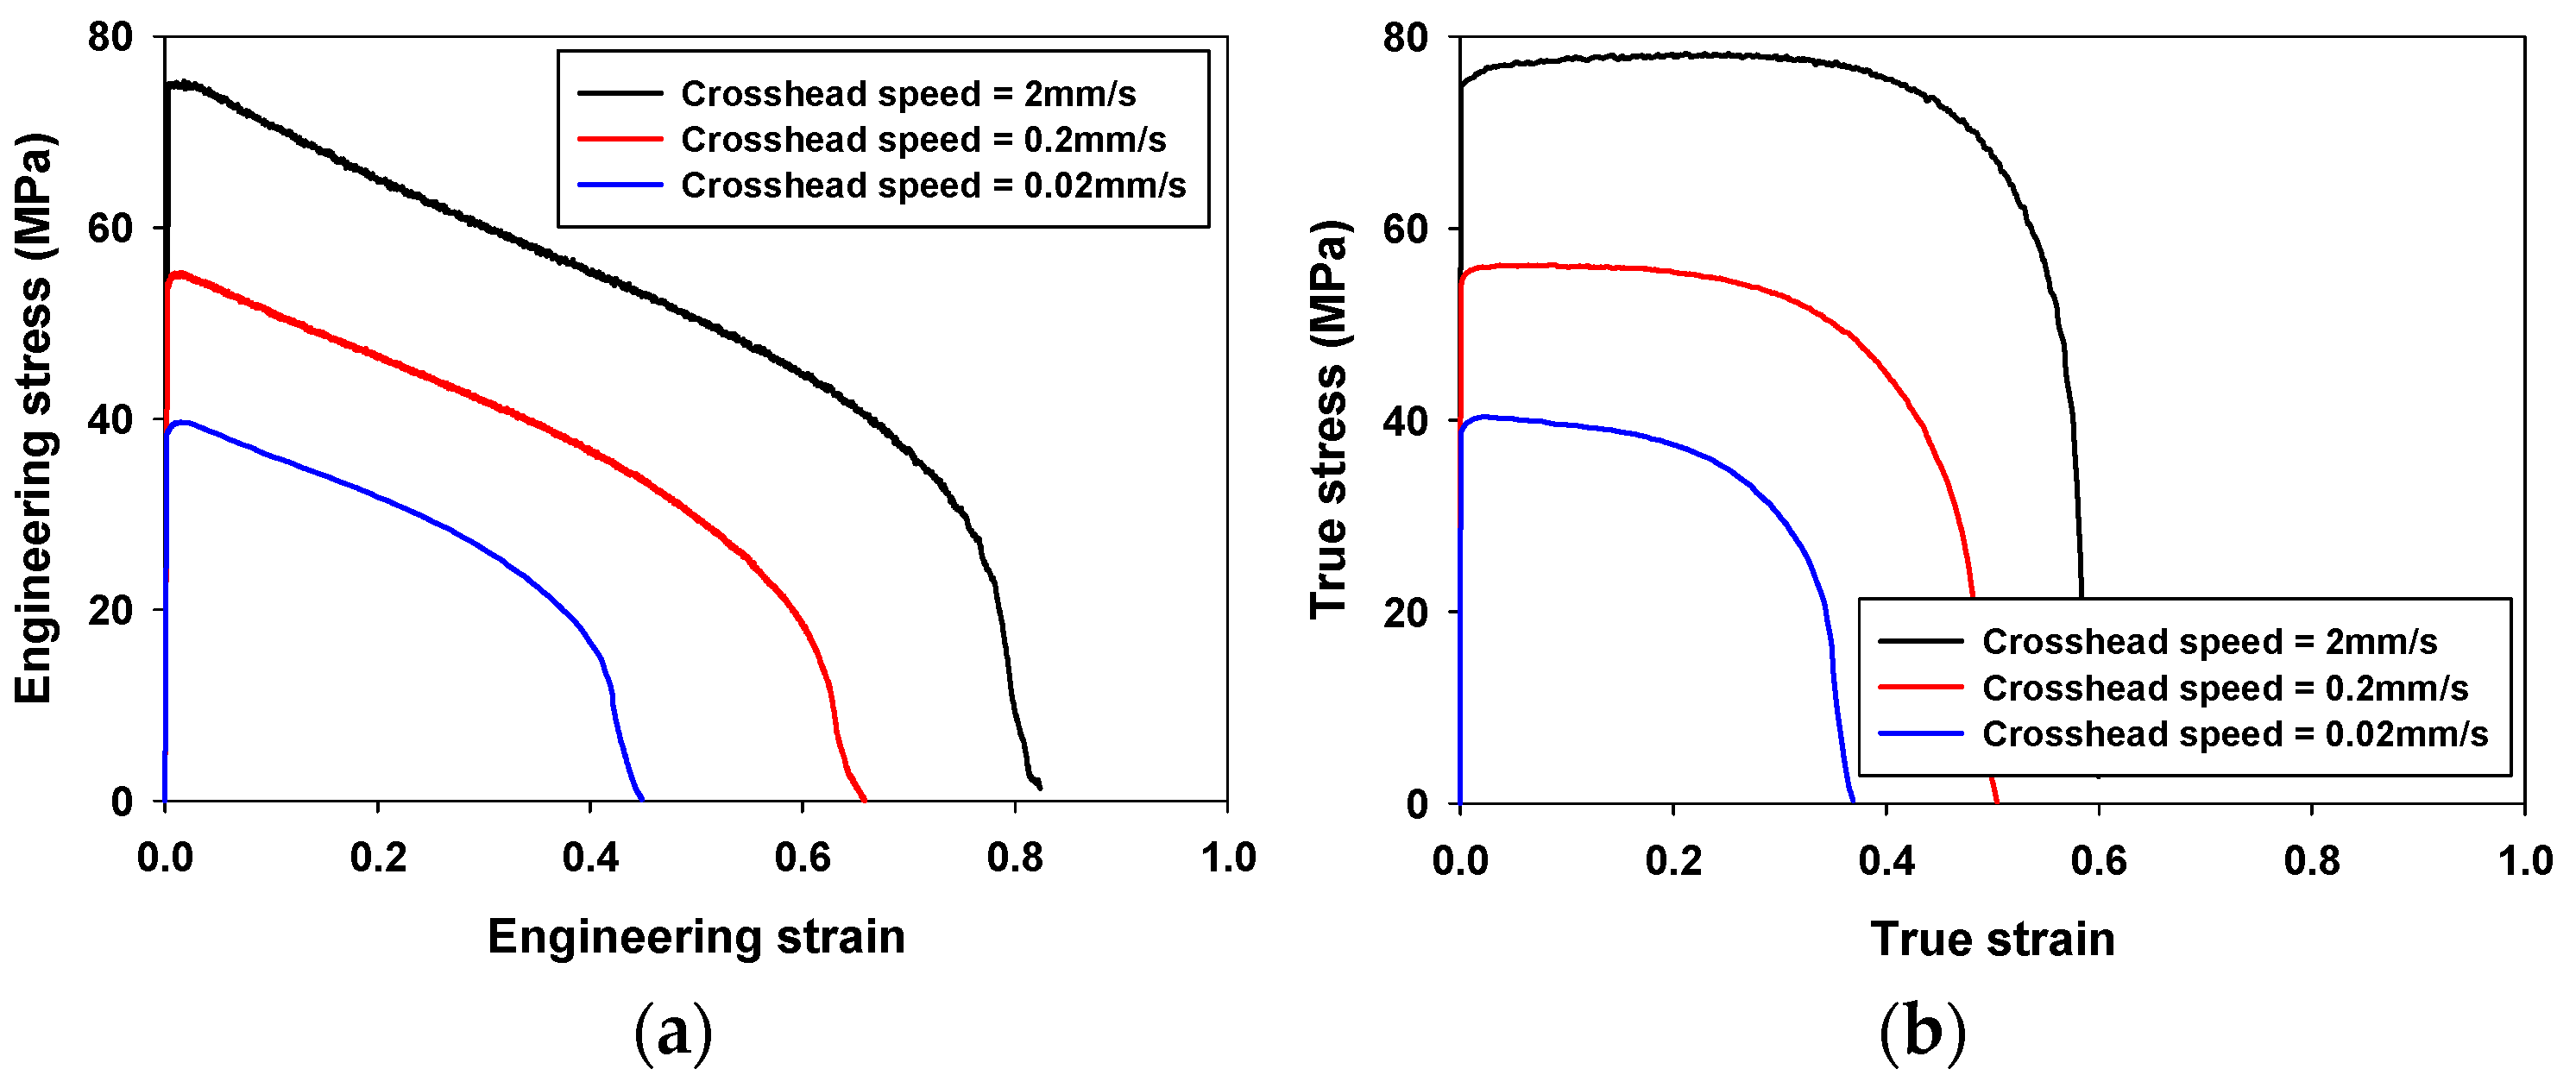
2.1. Materials

In this study, 7075 aluminum alloy sheets (Al–Zn–5.5 Mg–Cu) of 1.27 mm (0.05 inch) thickness was considered at 400 °C. Uniaxial tensile tests were performed for material plastic properties using a universal tensile test machine (Shimadzu, Kyoto, Japan). The tensile tests were examined along with the crosshead speeds to check the dependency of rate sensitivity. Every single curve representing engineering stress–engineering strain for each different crosshead speed is shown in Figure 2a. The mechanical behavior of 7075 aluminum alloy sheets at elevated temperatures shows an early, brief increase and large softening behavior in the engineering domain [10]. The engineering stress–engineering strain curves were also strongly dependent on the crosshead speed. The stress grew larger as the strain rate increased at the same temperature condition. Grip velocities of 0.02, 0.2, and 2.0 mm/s approximately corresponded to effective strain rates of 0.001, 0.01, and 0.1 s−1, respectively, based on numerical simulation. When the engineering stress–engineering strains were converted to true stress–true strains, the curves displayed virtually perfect plasticity behavior, as shown in Figure 2b [8,9]. The ASTM E 8M subsize specimen was modified for the uniaxial tensile test at elevated temperatures, as shown in Figure 3 [11]. The mechanical properties are given in Table 1. Elastic modulus and Poisson ratio were measured from 7075 aluminum alloy sheets of 2.0 mm thickness and assumed to be applied to this material. The usual 7075 aluminum alloy sheets at elevated temperatures is assumed to show an isotropic plastic behavior [8,9]. Hence, von Mises yield function for stress potential was applied throughout the study.
The effective stress–effective strain was fitted by Voce-type hardening law with power law strain rate sensitivity relationship using Equation (1). The material coefficients of Voce-type hardening law, m-value of power law, and reference strain rate are given in Table 2. The curves based on power law rate sensitivity extrapolation were well matched with the hardening curve directly obtained from the uniaxial tensile test until ultimate tensile strength (UTS) at 0.001, 0.01, and 0.1 s−1, as shown in Figure 4.
σ ¯ 0 = { K + C ( 1 e p ε ¯ ) } ( ε ¯ ˙ ε ¯ ˙ 0 ) m
where K , C , and p are coefficients of Voce-type hardening law; ε ¯ ˙ 0 is the reference strain rate; and m is the rate sensitivity coefficients.

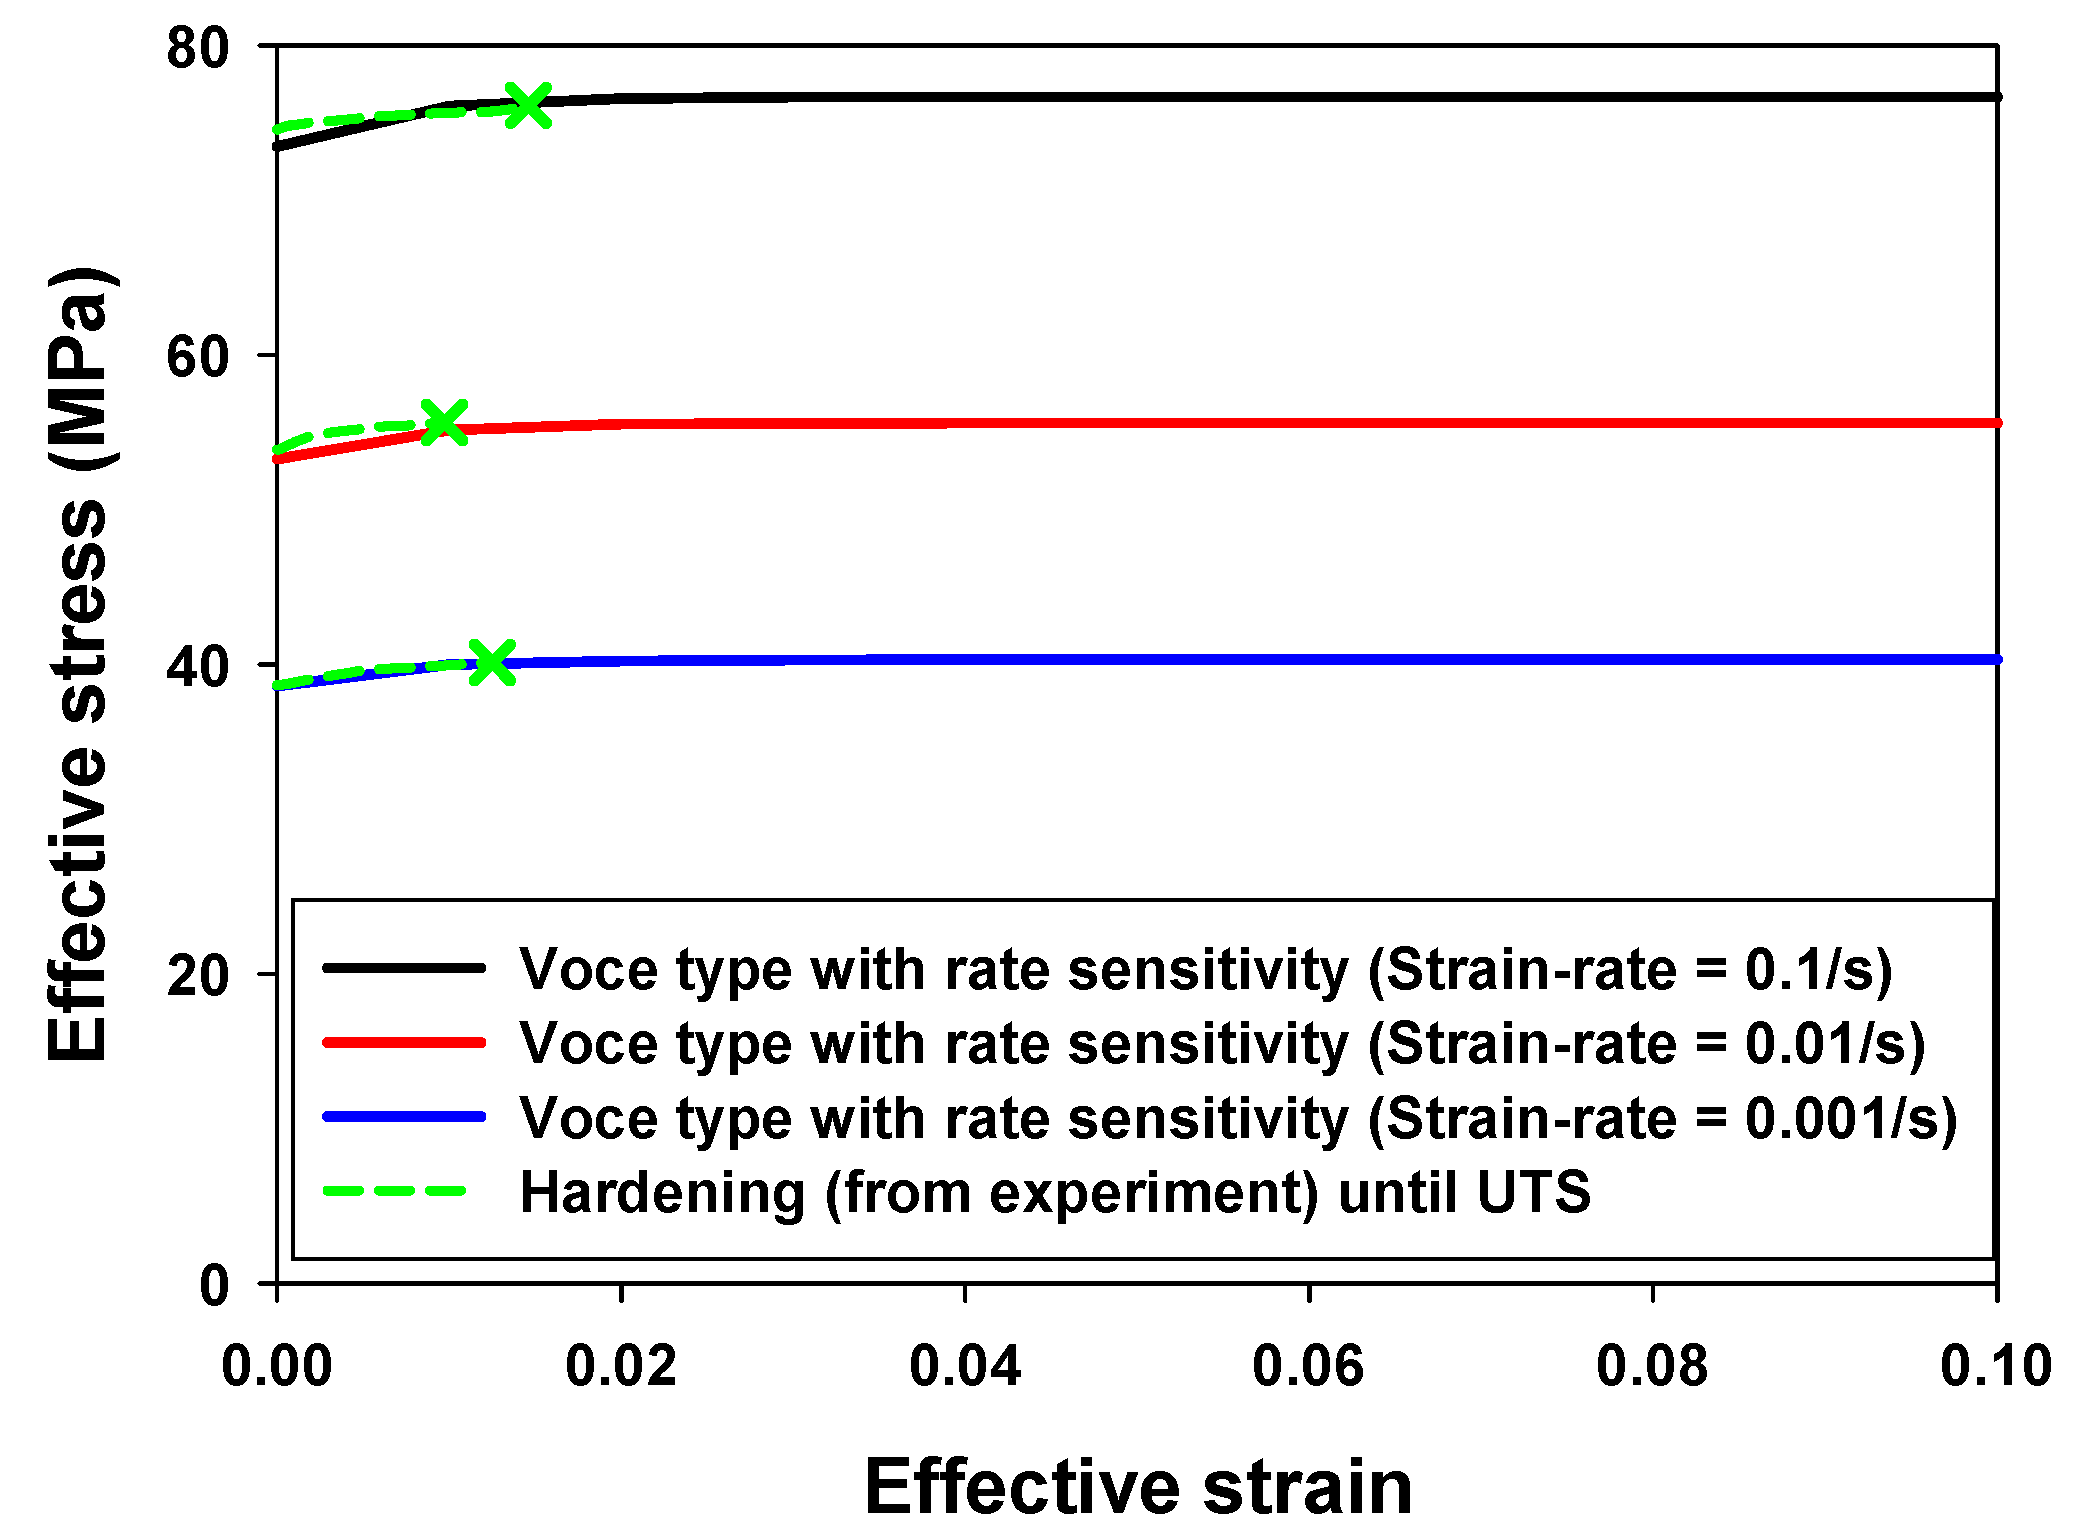
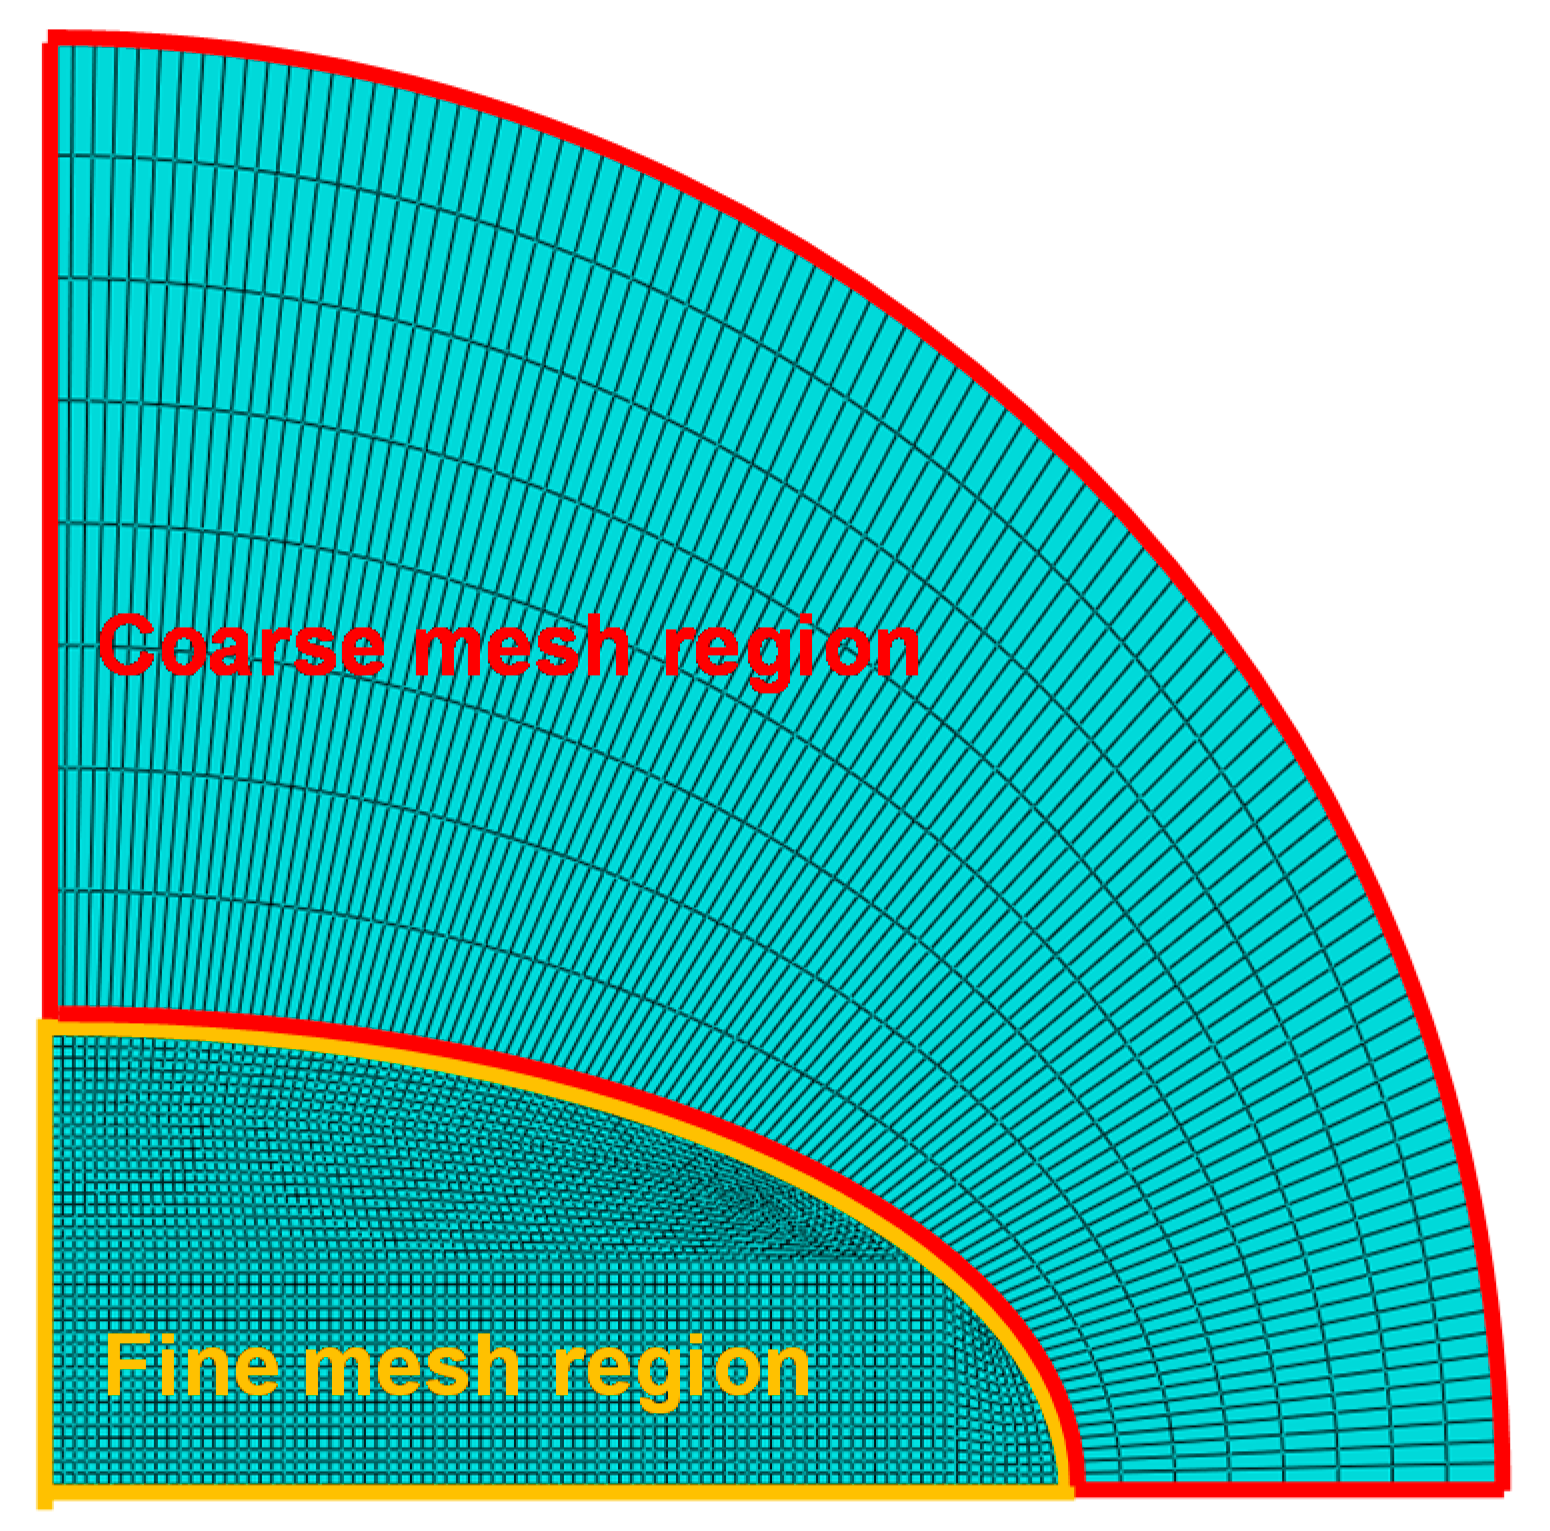
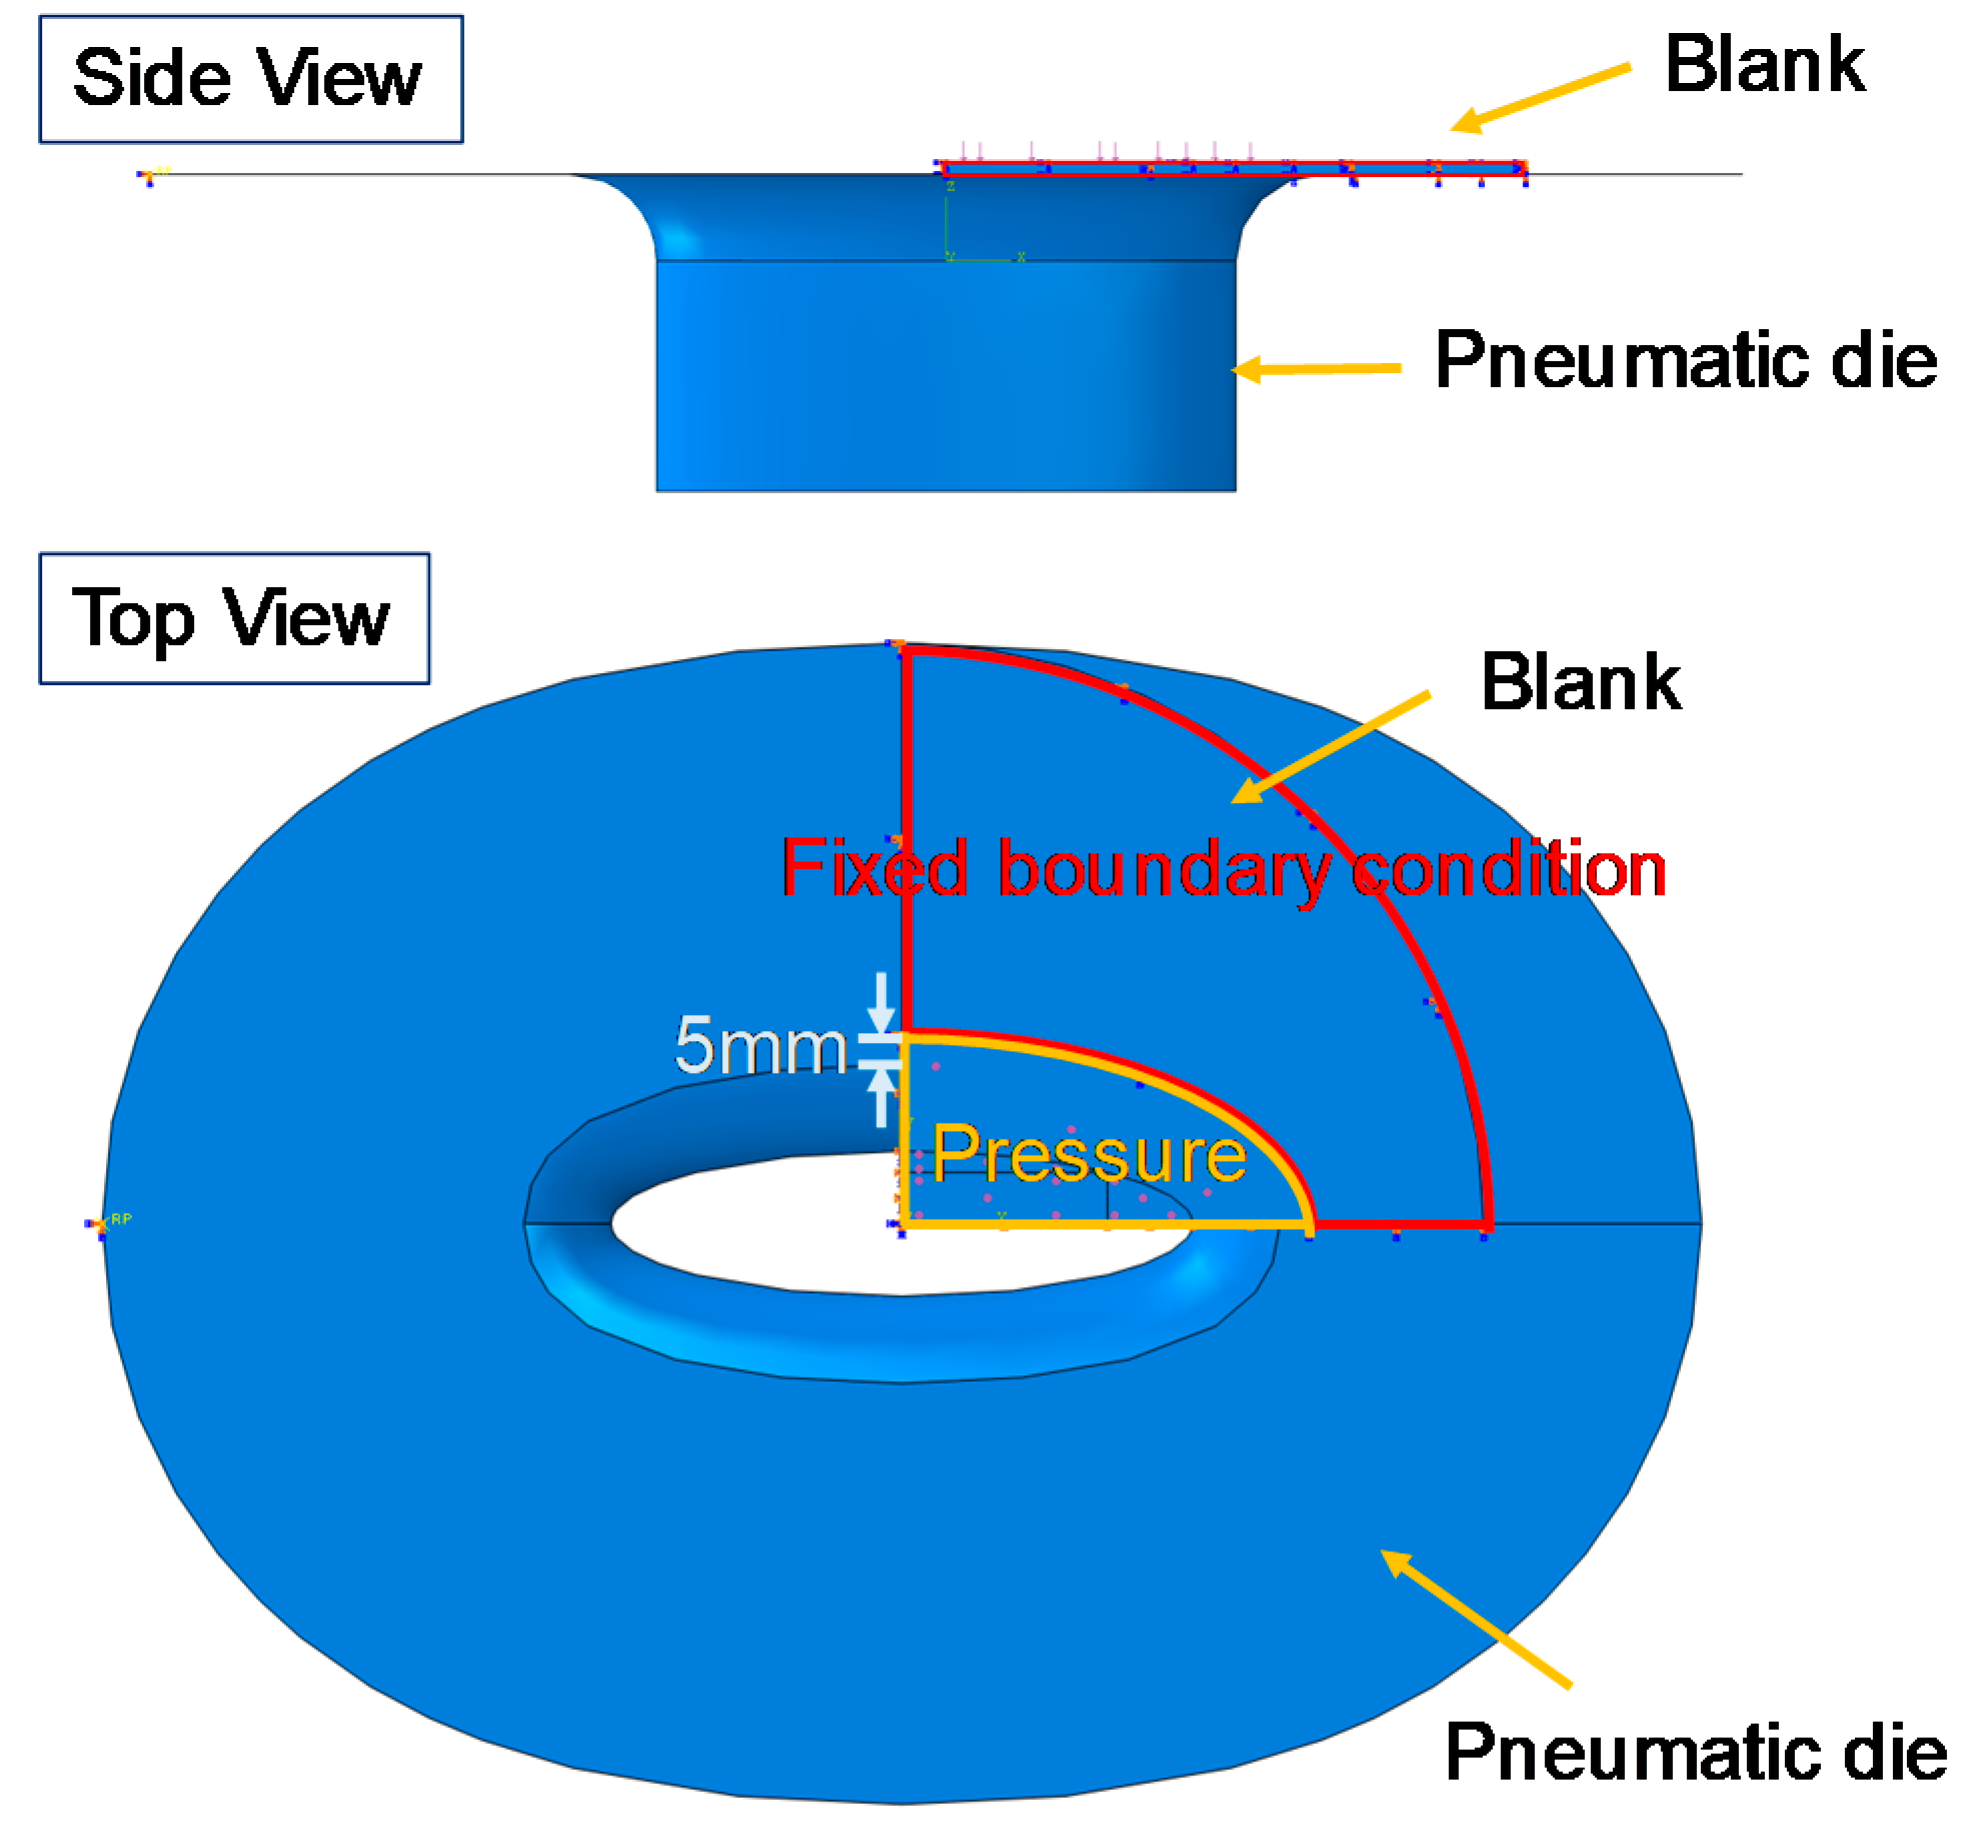
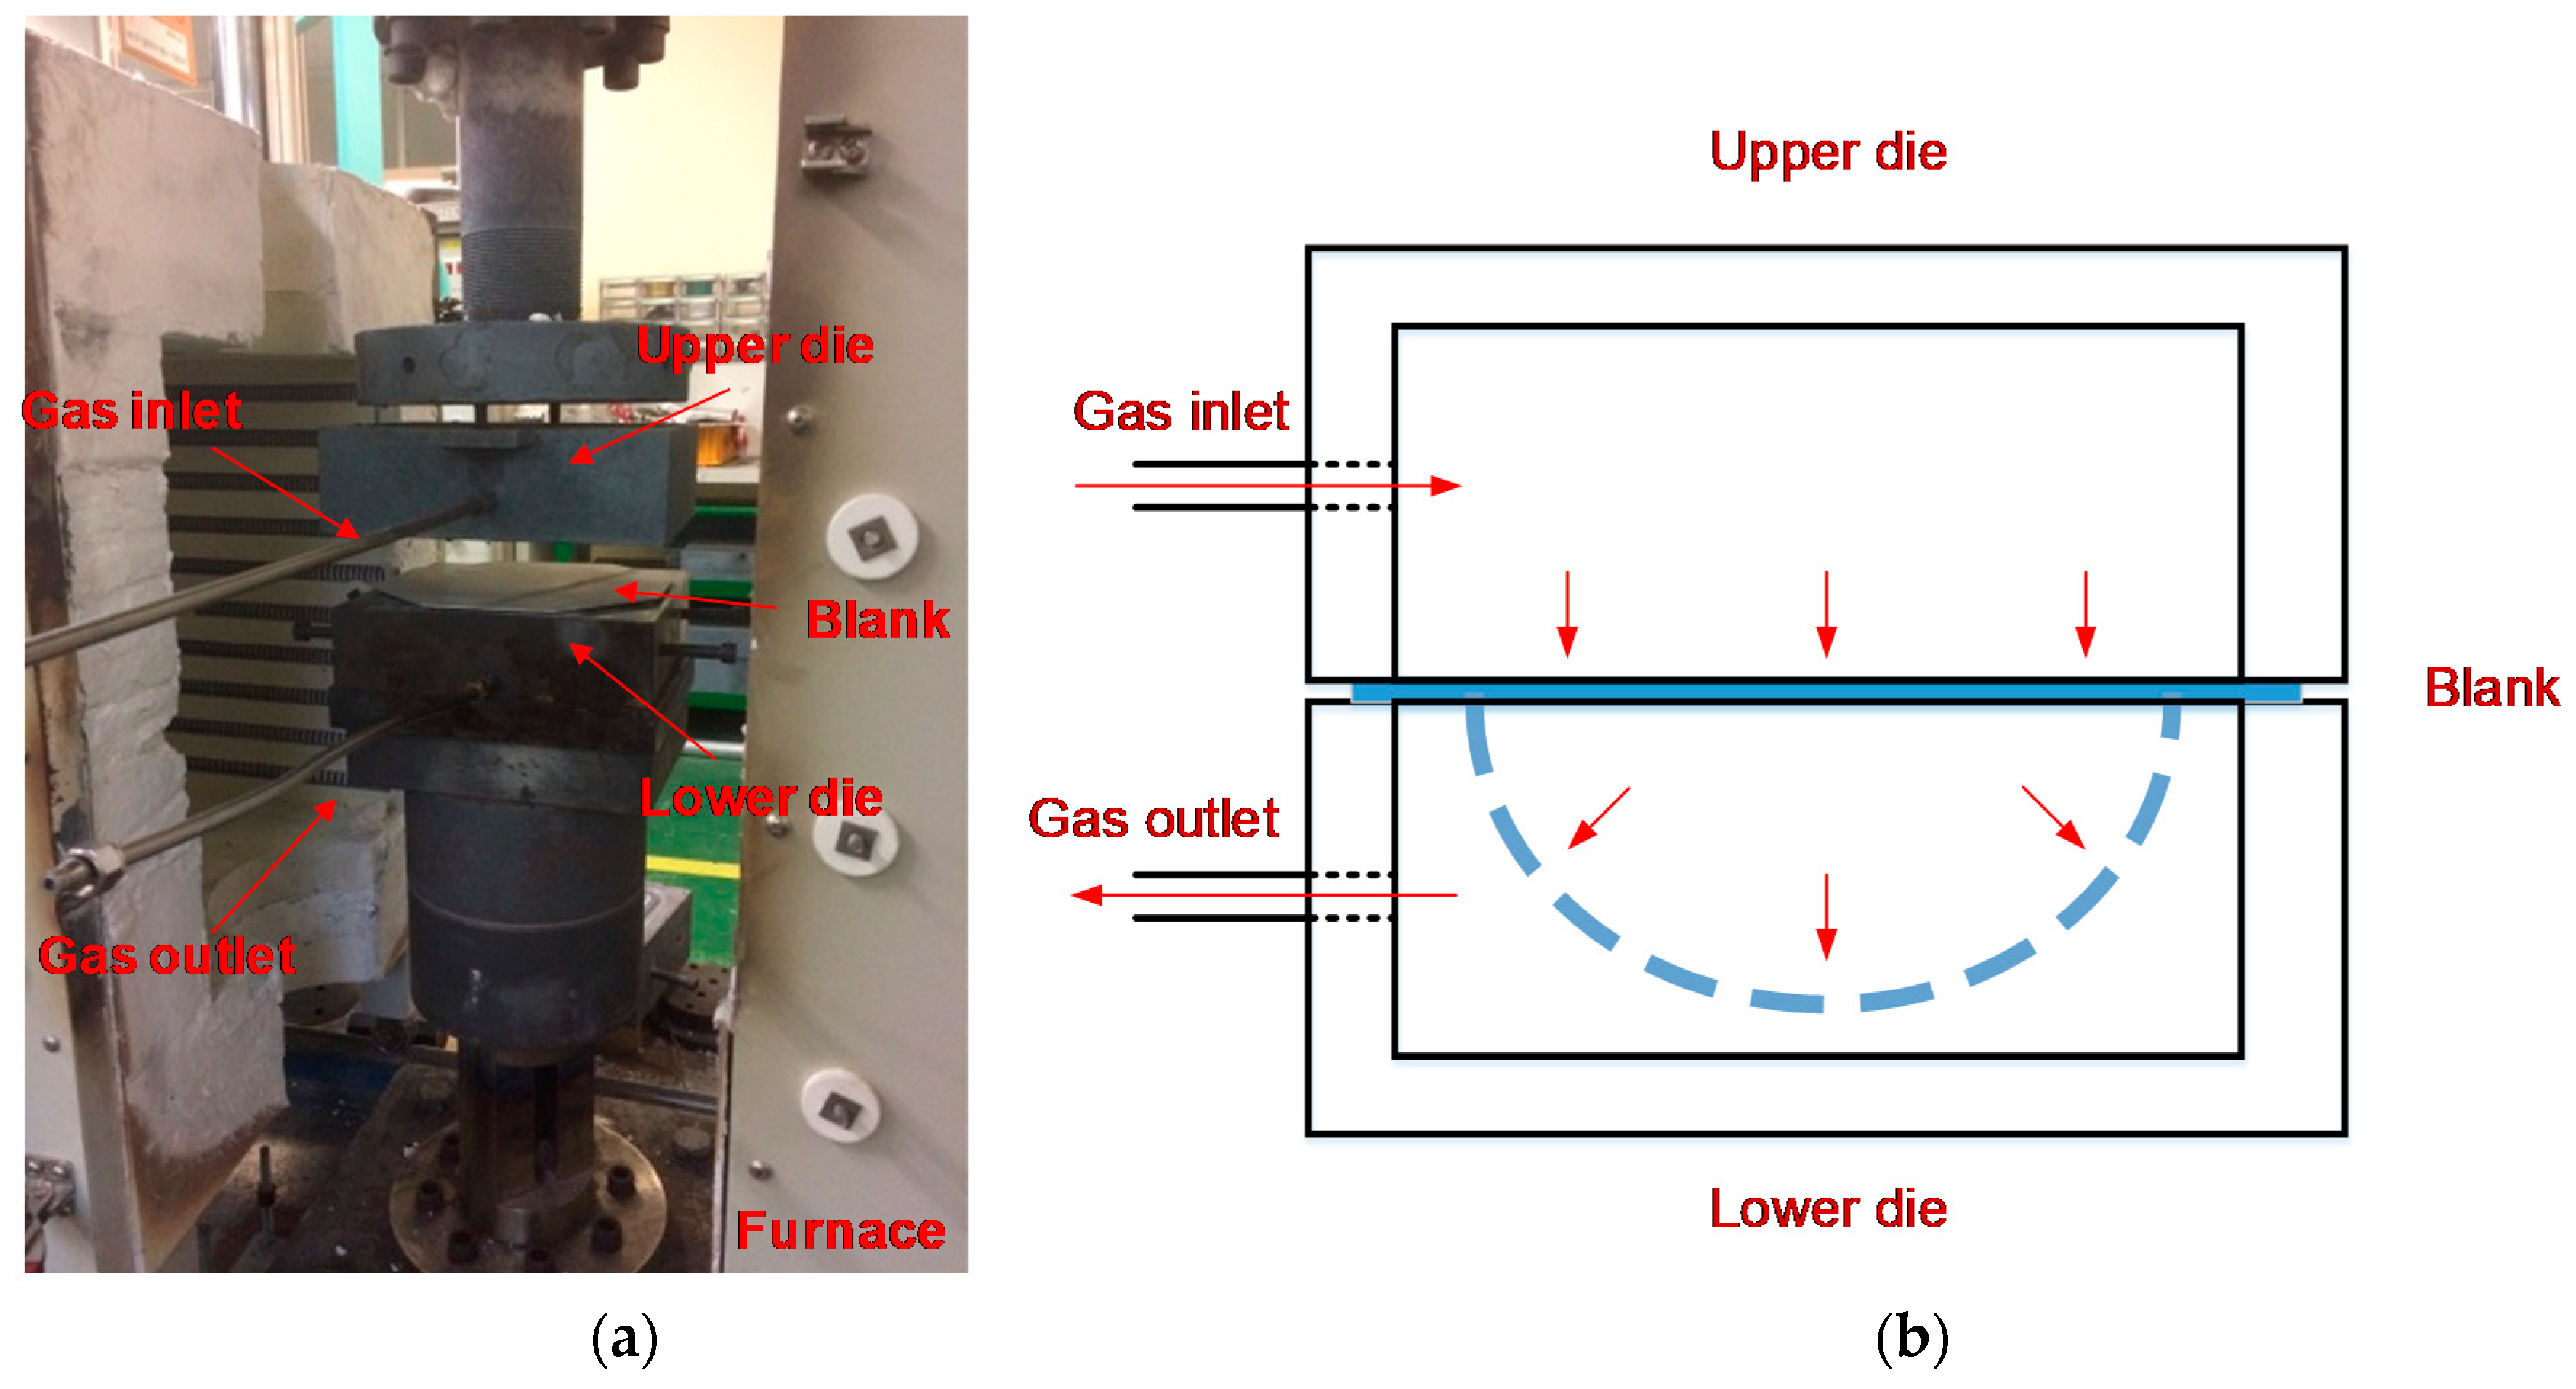
2.2. Numerical Simulation Procedure

Numerical simulation was performed to study the effects of the parameters. Isotropic elastic and Voce-type material with power law interpolation for strain rate sensitivity, as characterized in the previous section, were utilized for the numerical simulation. The ABAQUS/Implicit code (6.12-1, Dassault Systèmes, Vélizy-Villacoublay, France) for a hexahedral solid element with eight nodes and reduced integration (C3D8R) was used. Eight-node solid elements of 0.8 mm × 0.8 mm × 0.254 mm dimension and 8 mm × 8 mm × 0.254 mm dimension were used for the fine mesh region and the coarse mesh region, respectively, with five layers of thickness (1.27 mm), as shown in Figure 5. A fixed boundary condition was assumed without a blank holding force because no slip was expected with the double beads at the blank clamping area. As for the process conditions, a fixed boundary condition was utilized, as shown in Figure 6, instead of applying a blank holding force. Other process conditions, such as friction coefficient and pressure, were assumed as specific values. The friction coefficient is relatively unimportant due to minimal contact in the pneumatic forming process. However, contact of the blank with the die occurs in some parts, such as the edge of the die (or die profile). Therefore, the friction coefficient was set as 0.1, assuming that the apparatus was well lubricated and had no lubrication issue. The pressure was applied 5 mm from the finish line of the die profile covering the whole cavity and corner of the hole, as shown in Figure 6. Throughout the study, the conditions mentioned above were applied to the numerical model.

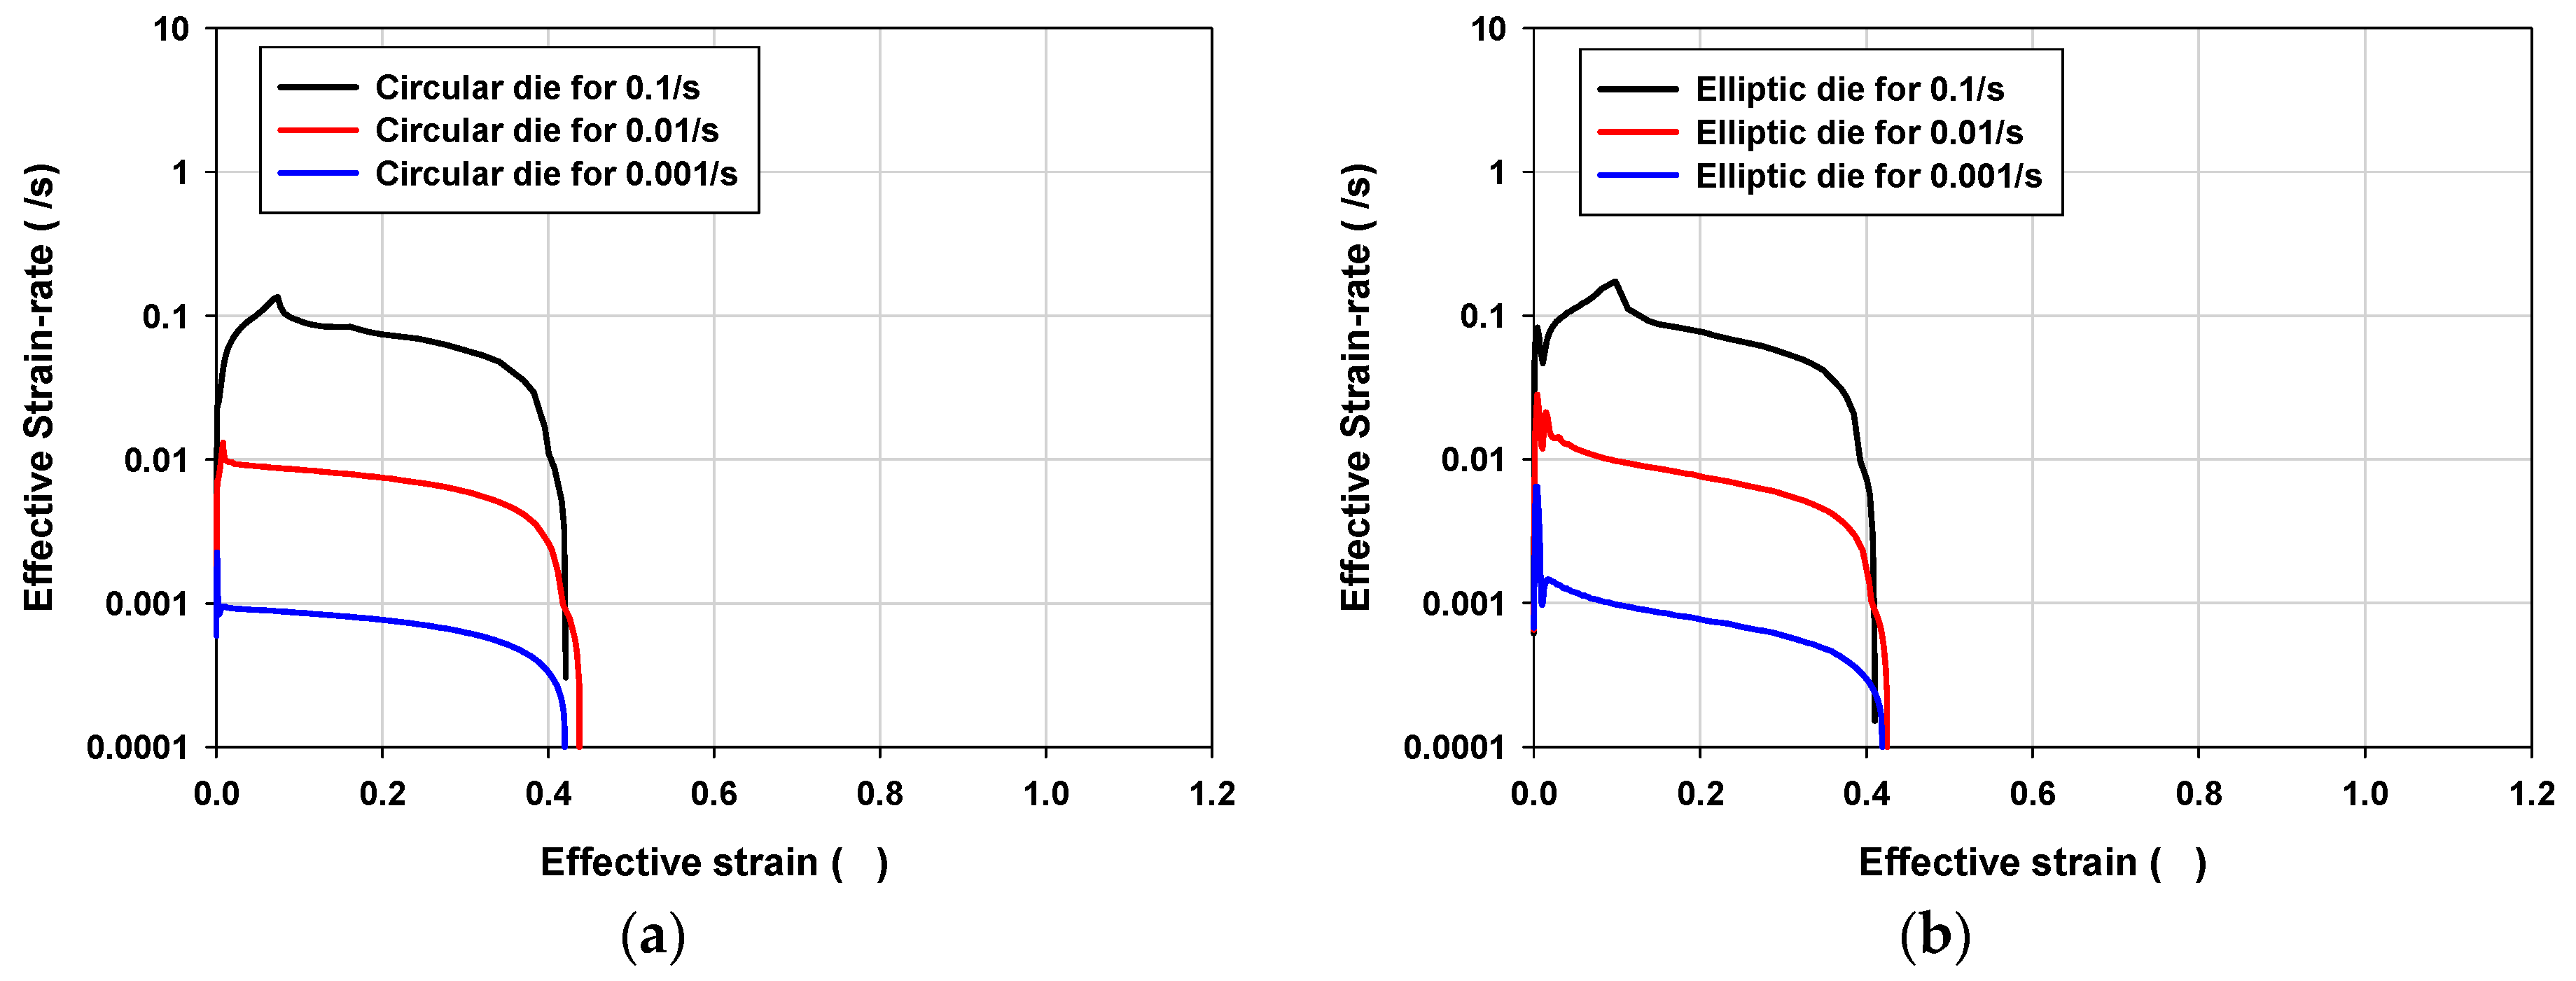
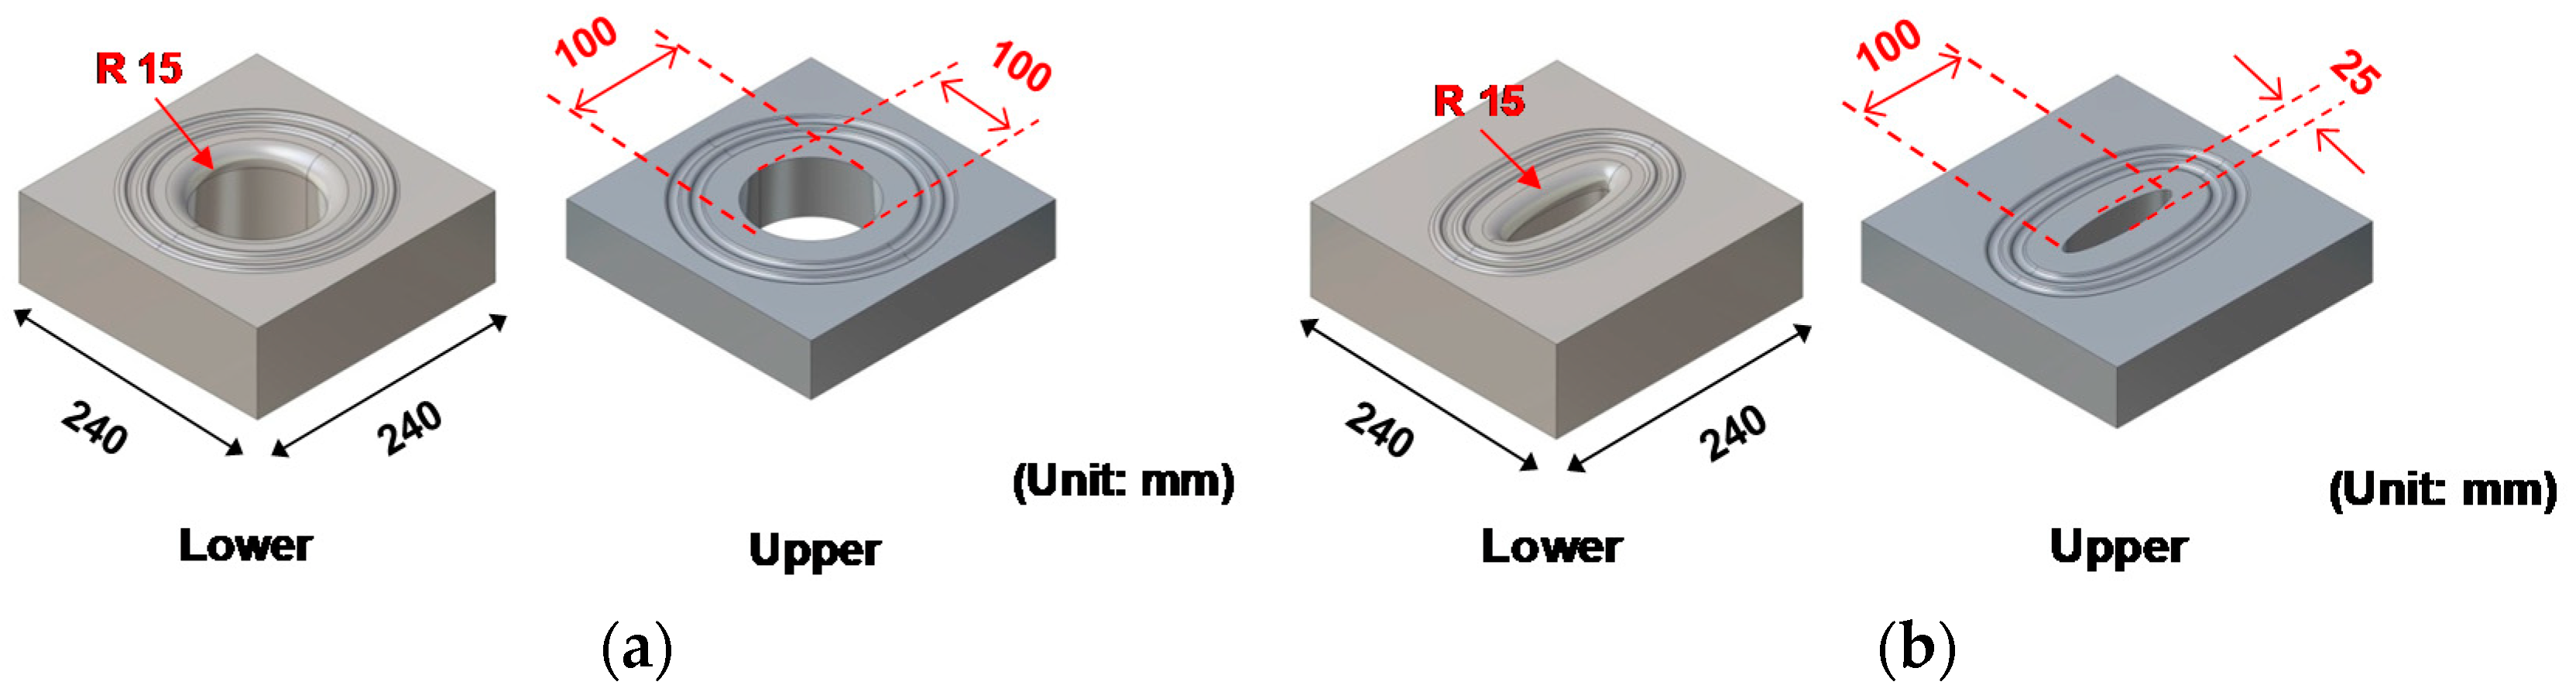
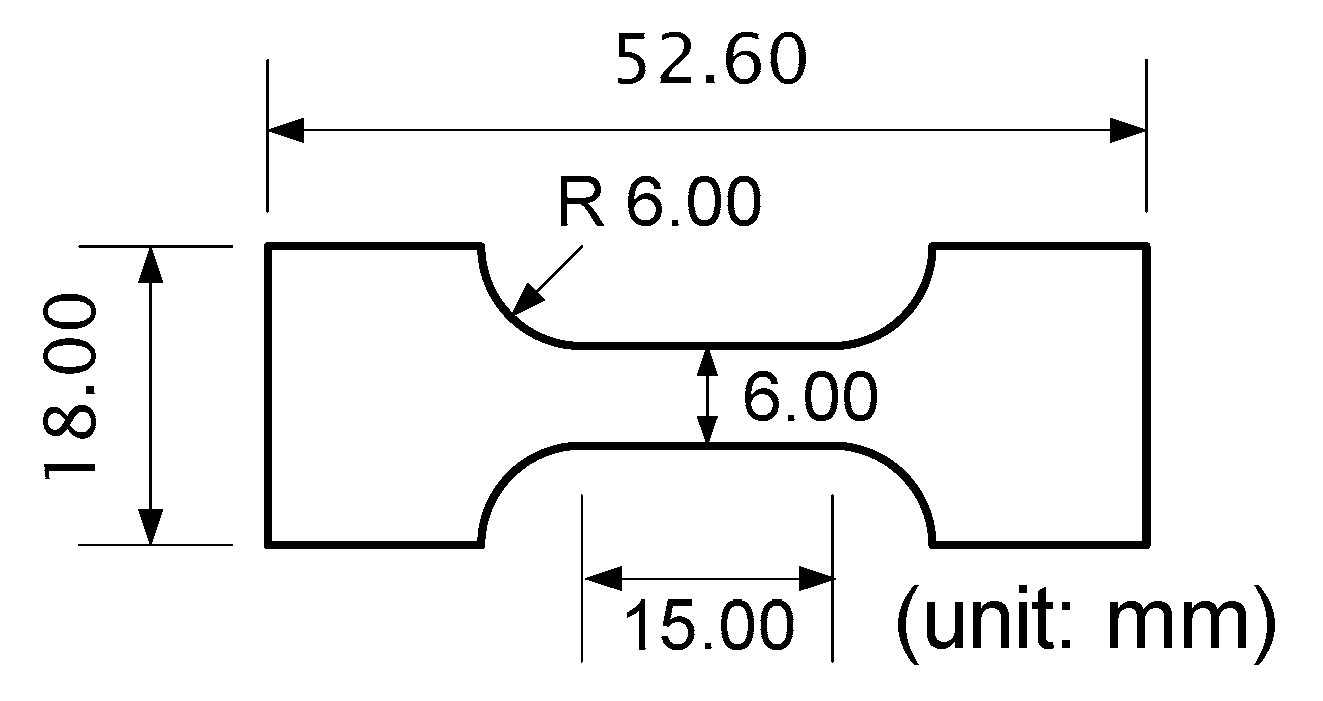
3. Design of Geometric and Process Conditions

The design of the geometric and process conditions in pneumatic forming are discussed in this section. For proper deformation modes and fracture occurrence at the proper location, the ratio of minor to major radius, k, and the profile radius, R, were studied as the geometric design. In pneumatic forming, the pole of the blank can be deformed with approximately constant strain rate by adjusting the pressure history. The pressure history, which determines approximate constant strain rate, was found as the process condition design.

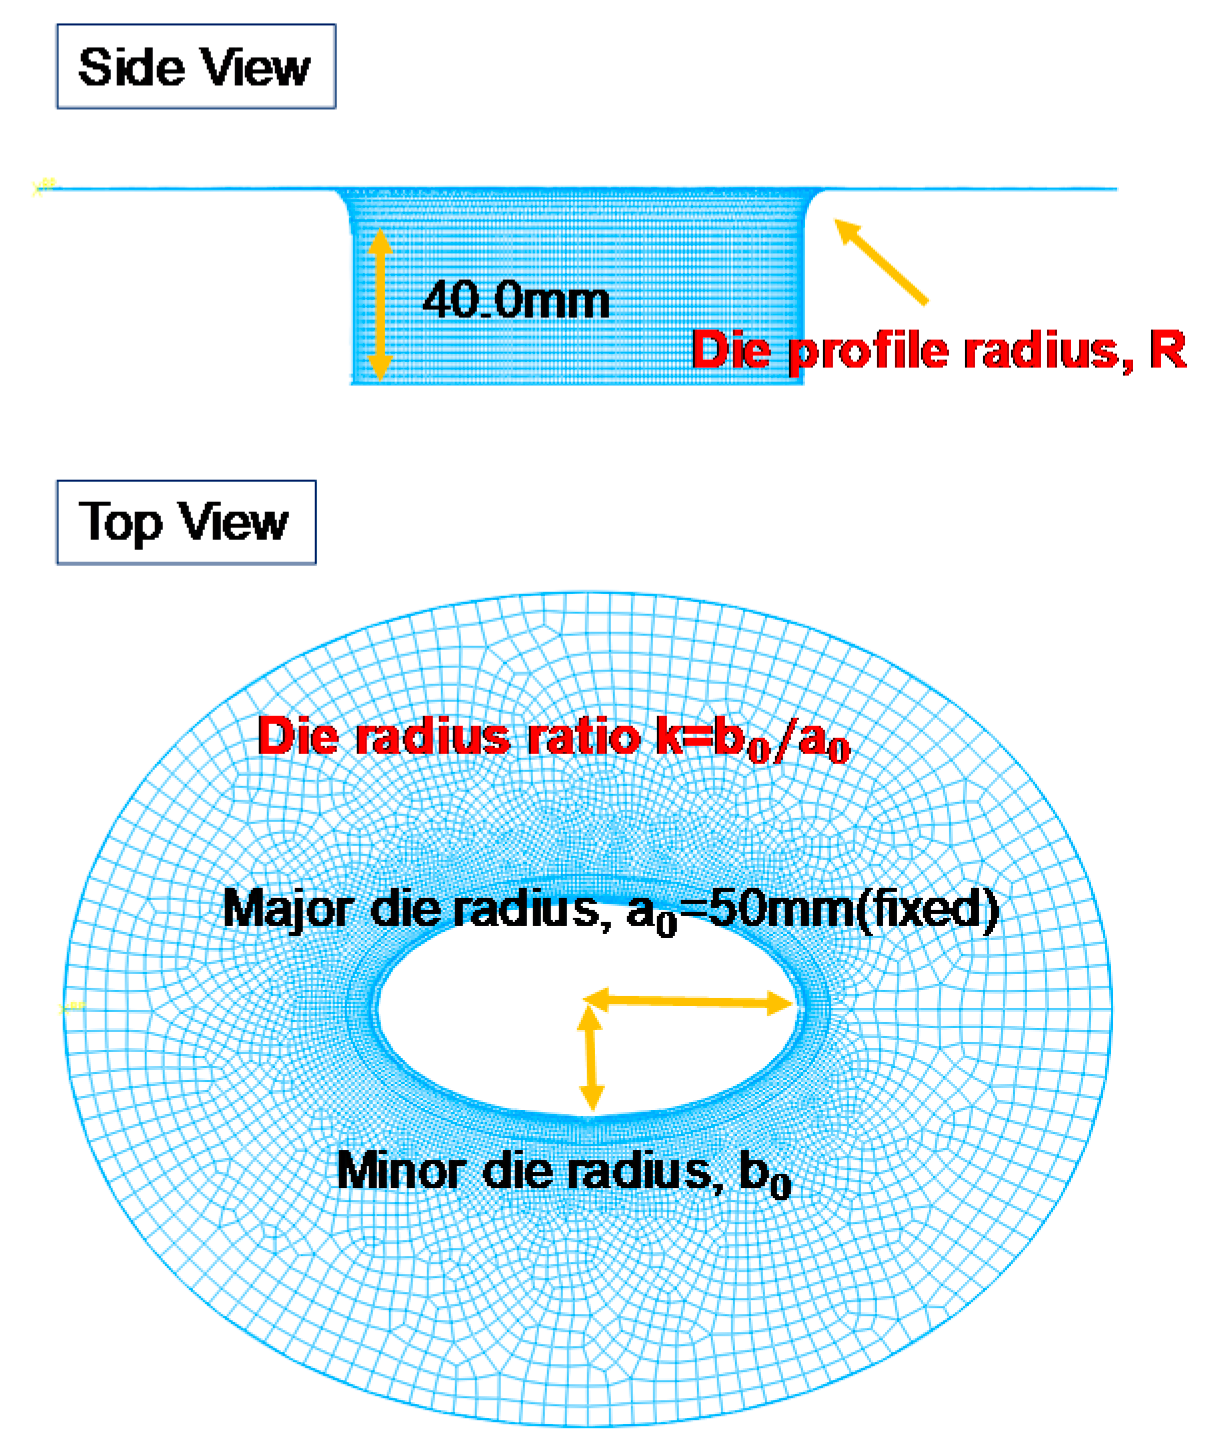
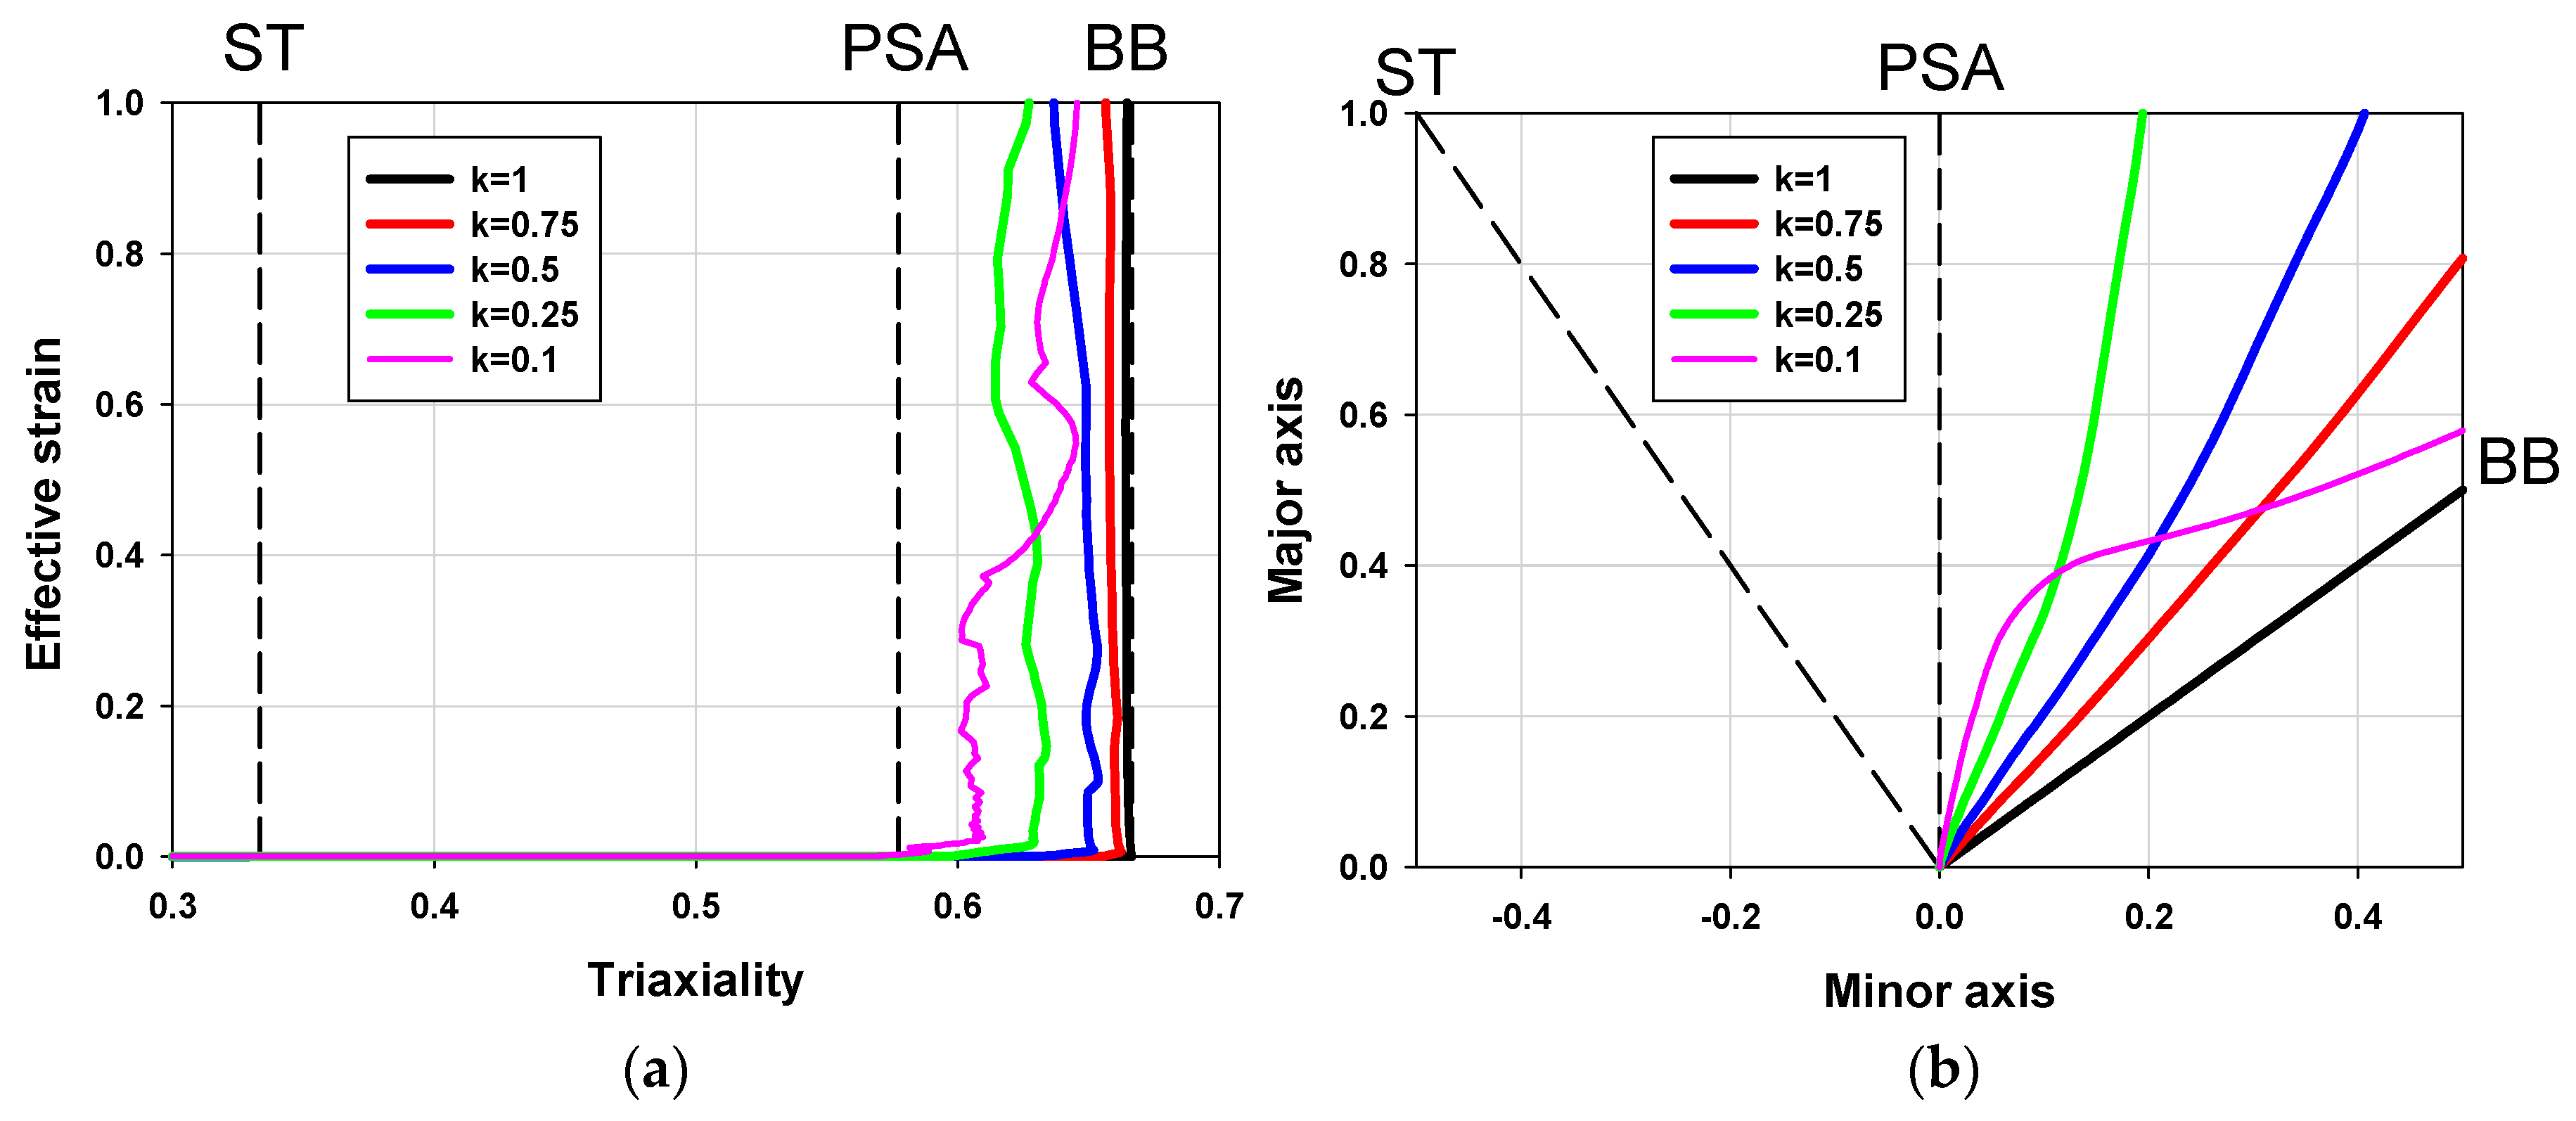
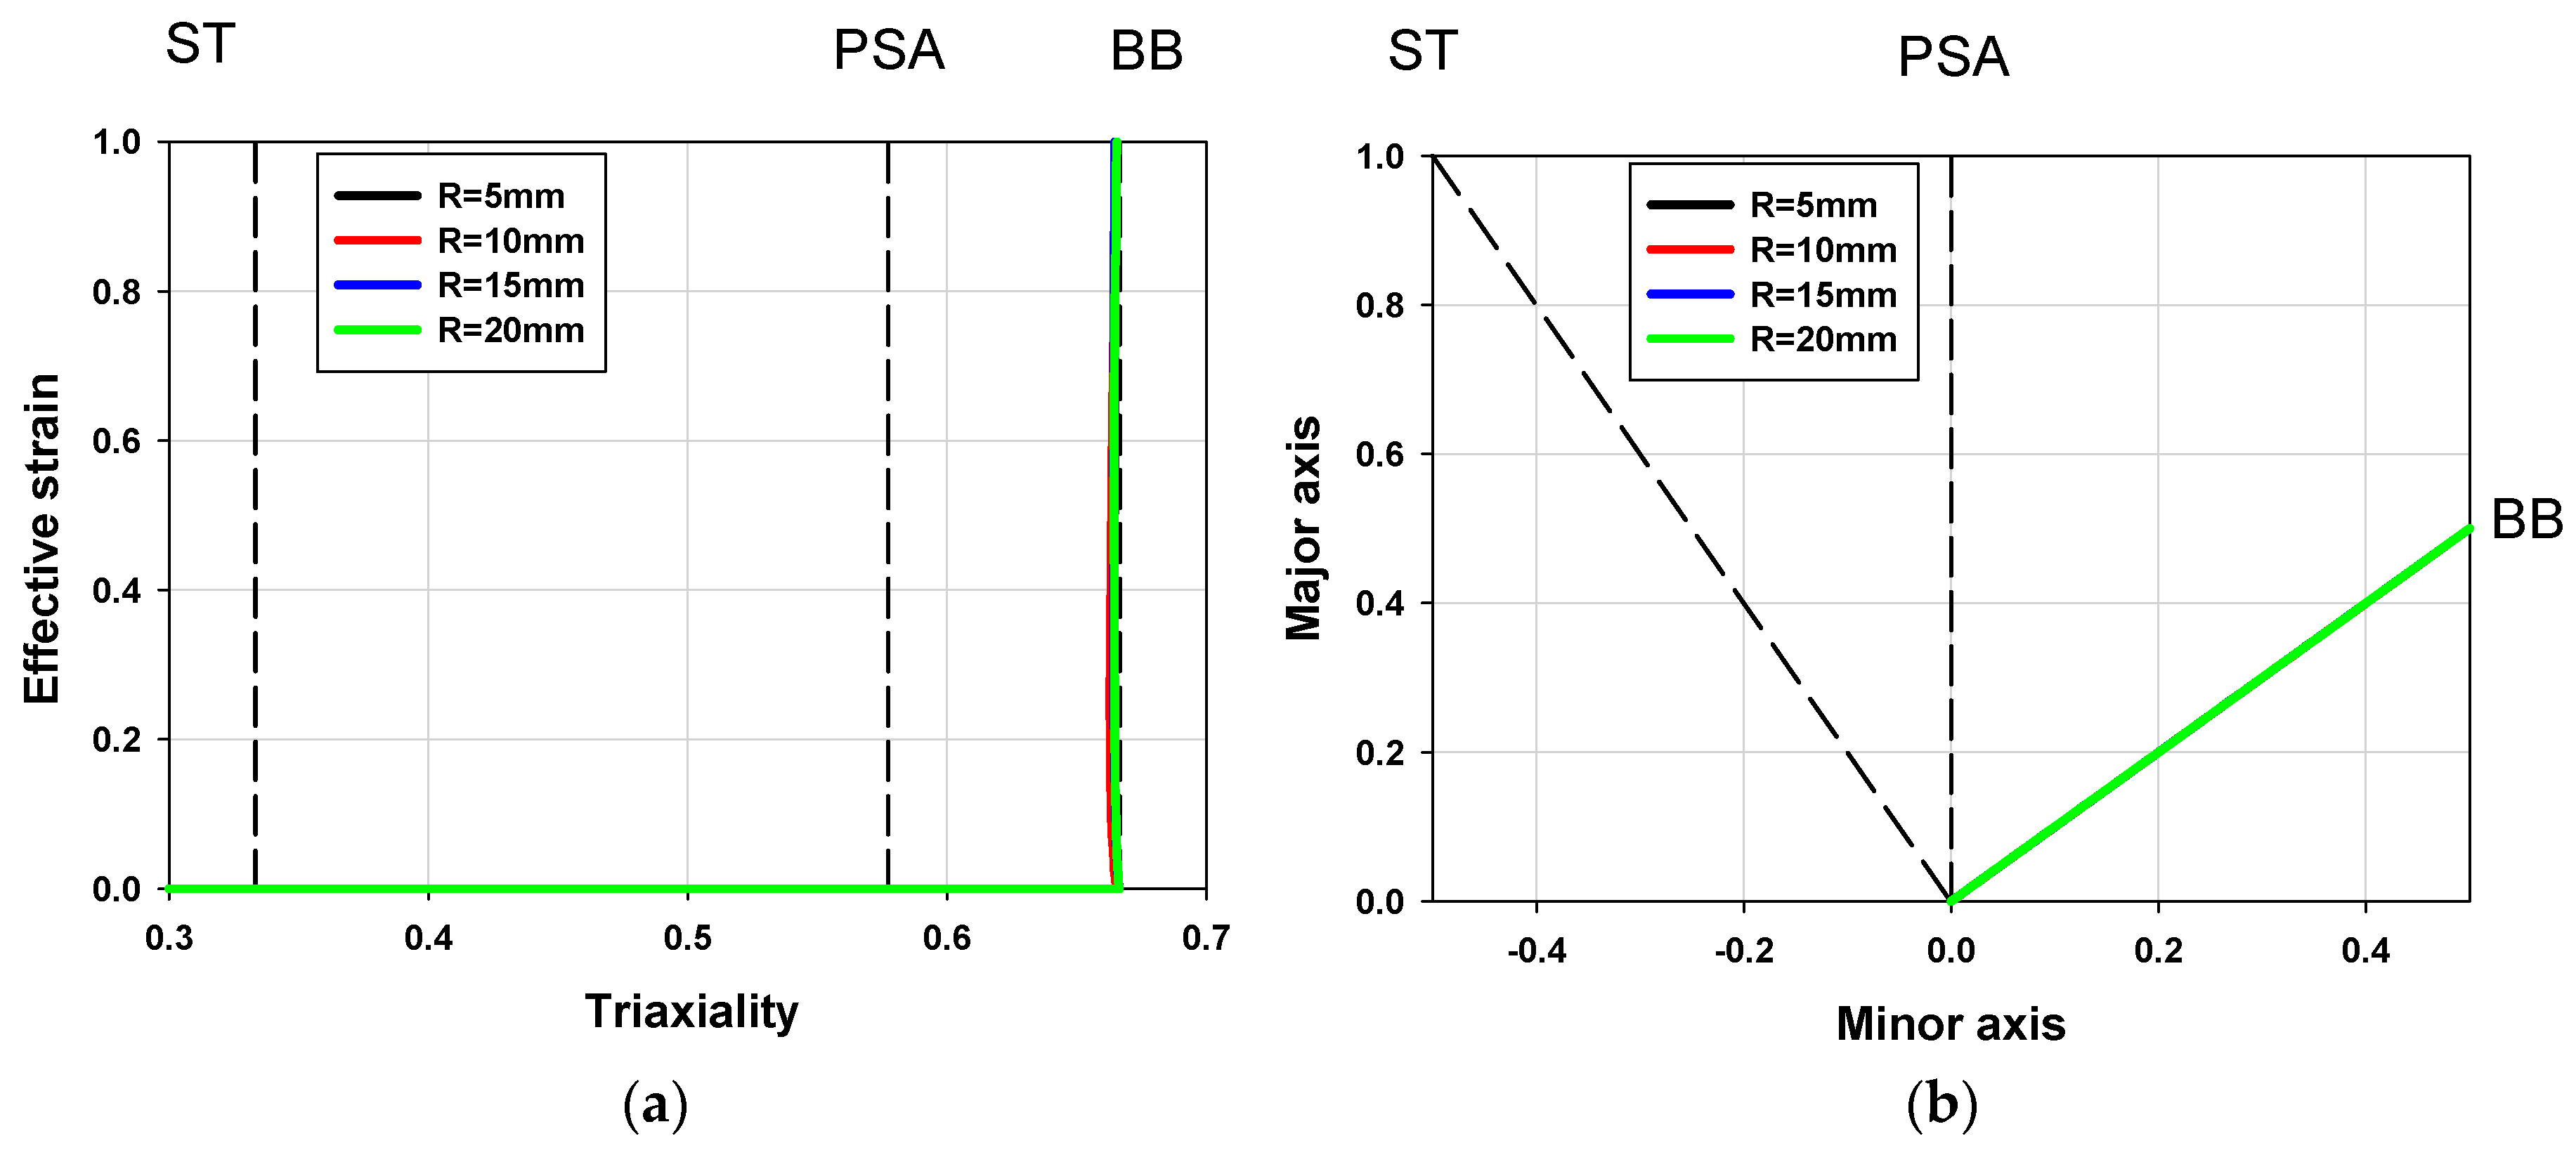
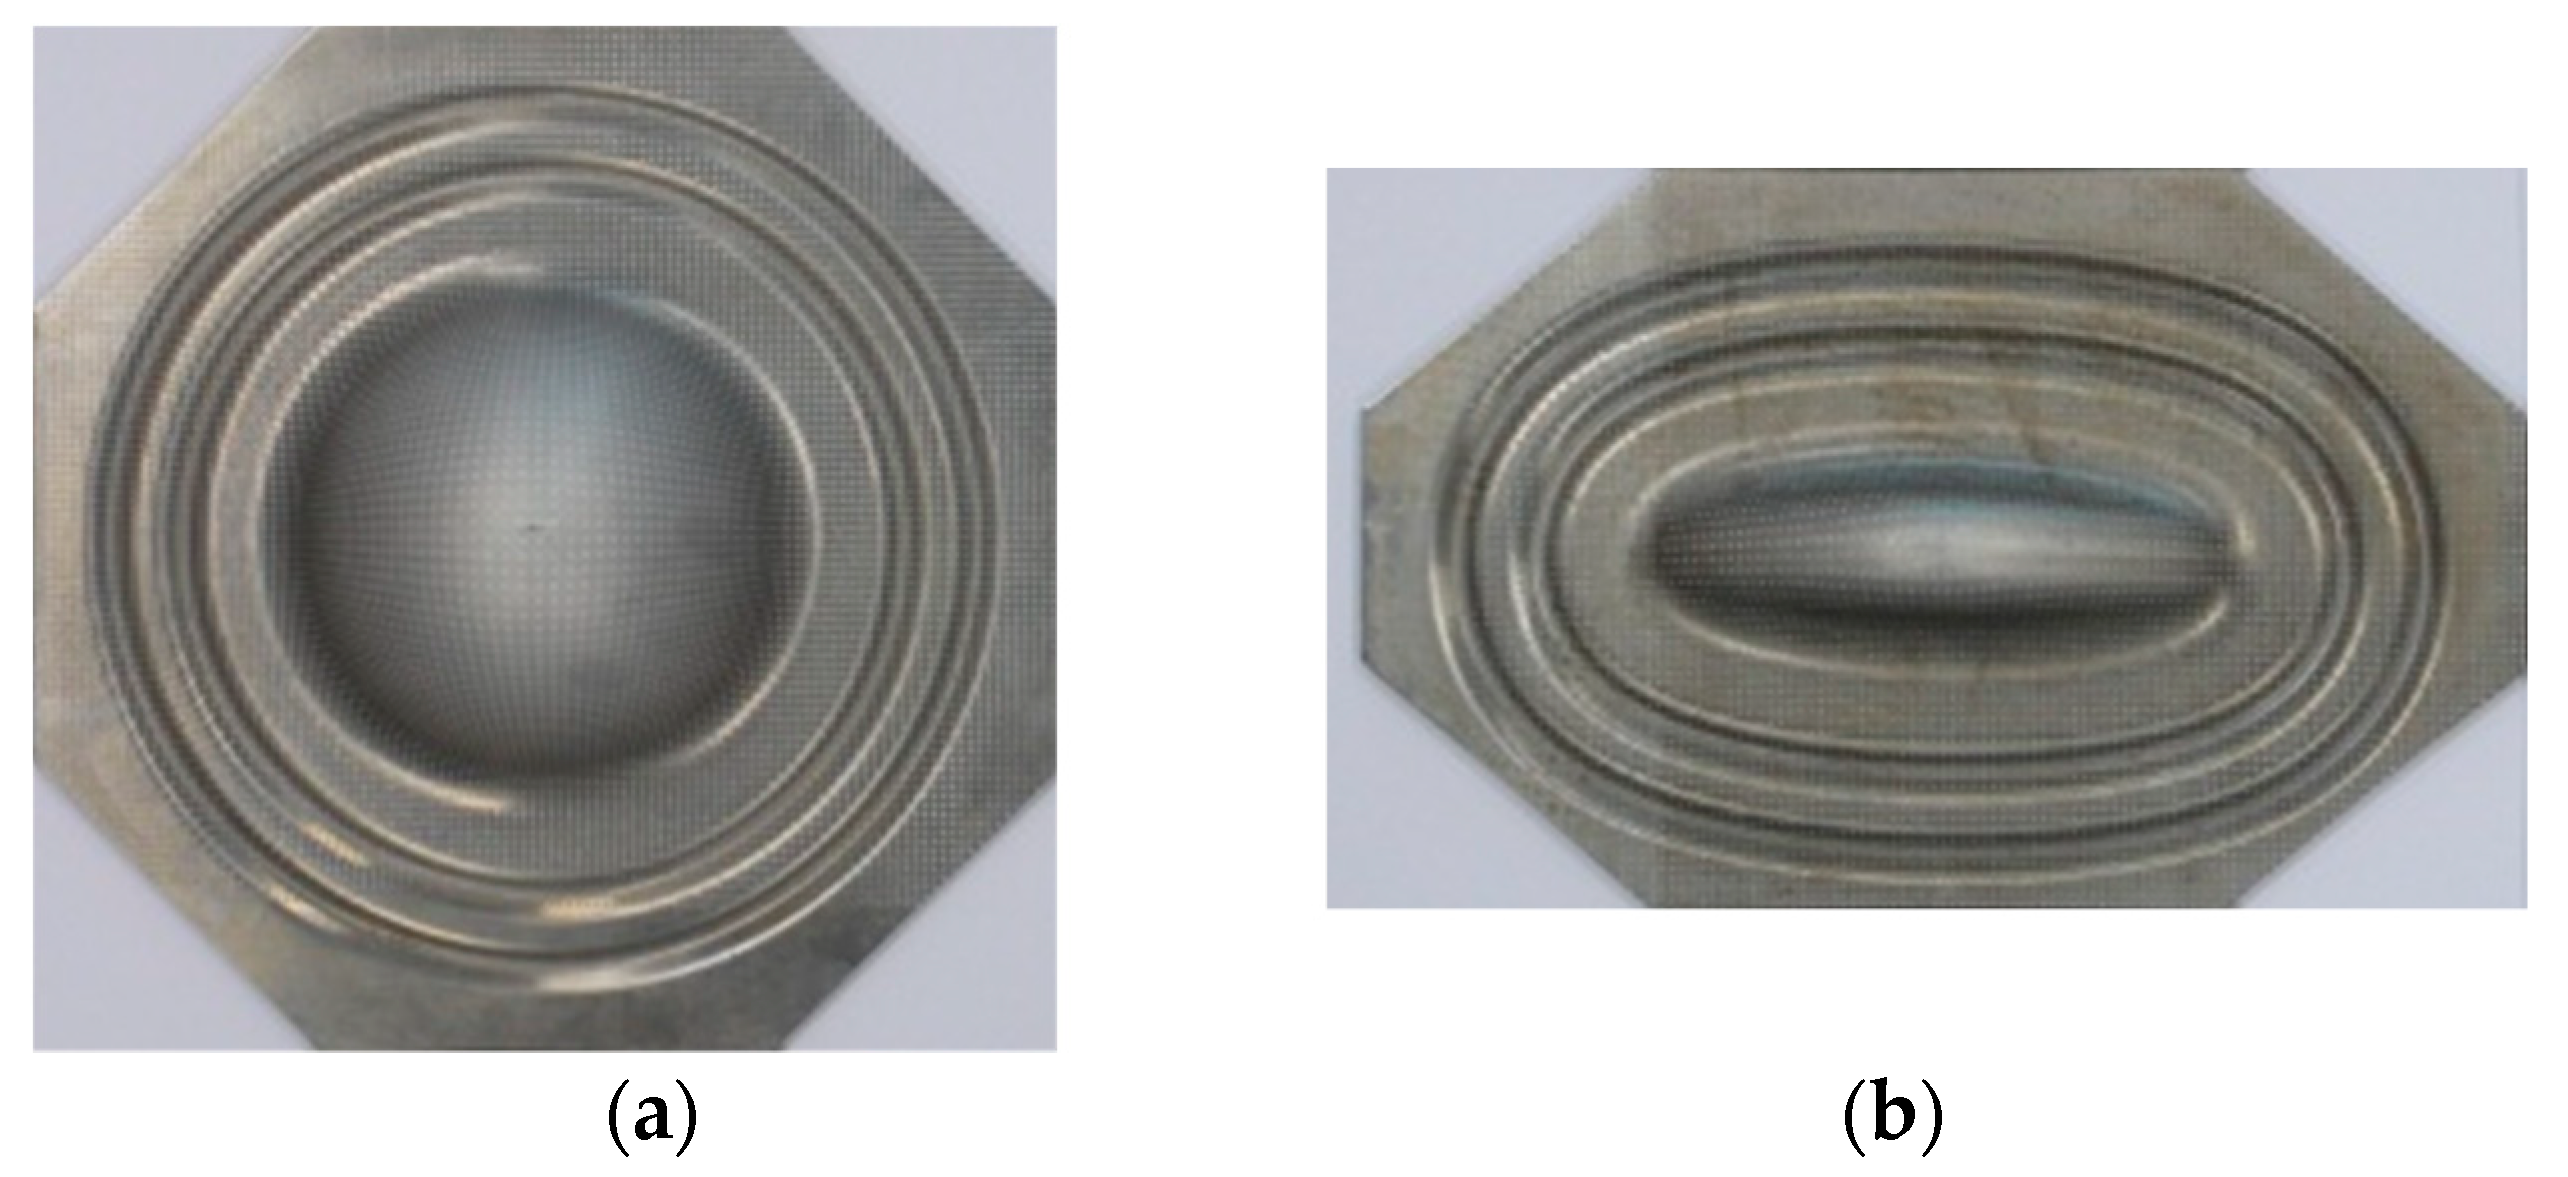
3.1. Geometric Design: The Ratio of Minor to Major Radius (k)

To determine deformation modes, a parametric study on the ratio of the minor to the major die radius, k, was performed. As shown in Figure 1, other geometric factors, such as major radius and die profile radius (R), were fixed to determine the effect of k. The major radius and die profile radius (R) have to be carefully determined according to the circumstances. As the major radius becomes small, it secures enough blank holding area to reduce the possibility of a slip in the size limit of the machine, but a small cavity requires more pressure to deform the blank in the pressure capacity limit of the machine. In this study, the major radius and the die profile radius (R) were fixed as 100.0 and 15.0 mm, respectively. The constant pressure was arbitrarily decided for each k die for simplicity. The conditions for parametric study are shown in Table 3. As can be seen, higher pressure was required as k decreased.
As k decreased, the deformation modes approached the plane strain mode, as shown in Figure 7. However, when k was too small, the deformation history became unstable and not proportional. For instance, although the deformation mode of the elliptic die with k = 0.1 seemed closer to the plane strain mode at the initial stage, the deformation history on the domain of triaxiality with respect to effective plastic strain and of the major/minor differed a lot without any proportional increase. This is because the 3D effect increases as k diminishes, meaning that the mode of the critical element is no longer plane stress, which is important for sheet metal forming. With smaller k, not only is more pressure needed to complete the same deformation, but the effective strain is also more likely to be concentrated on the edge, which will be discussed in the profile radius (R) design. In conclusion, the optimized k value was 0.25 for near plane strain mode (PSA) die with the already selected die ratio of k = 1 for balance biaxial mode.

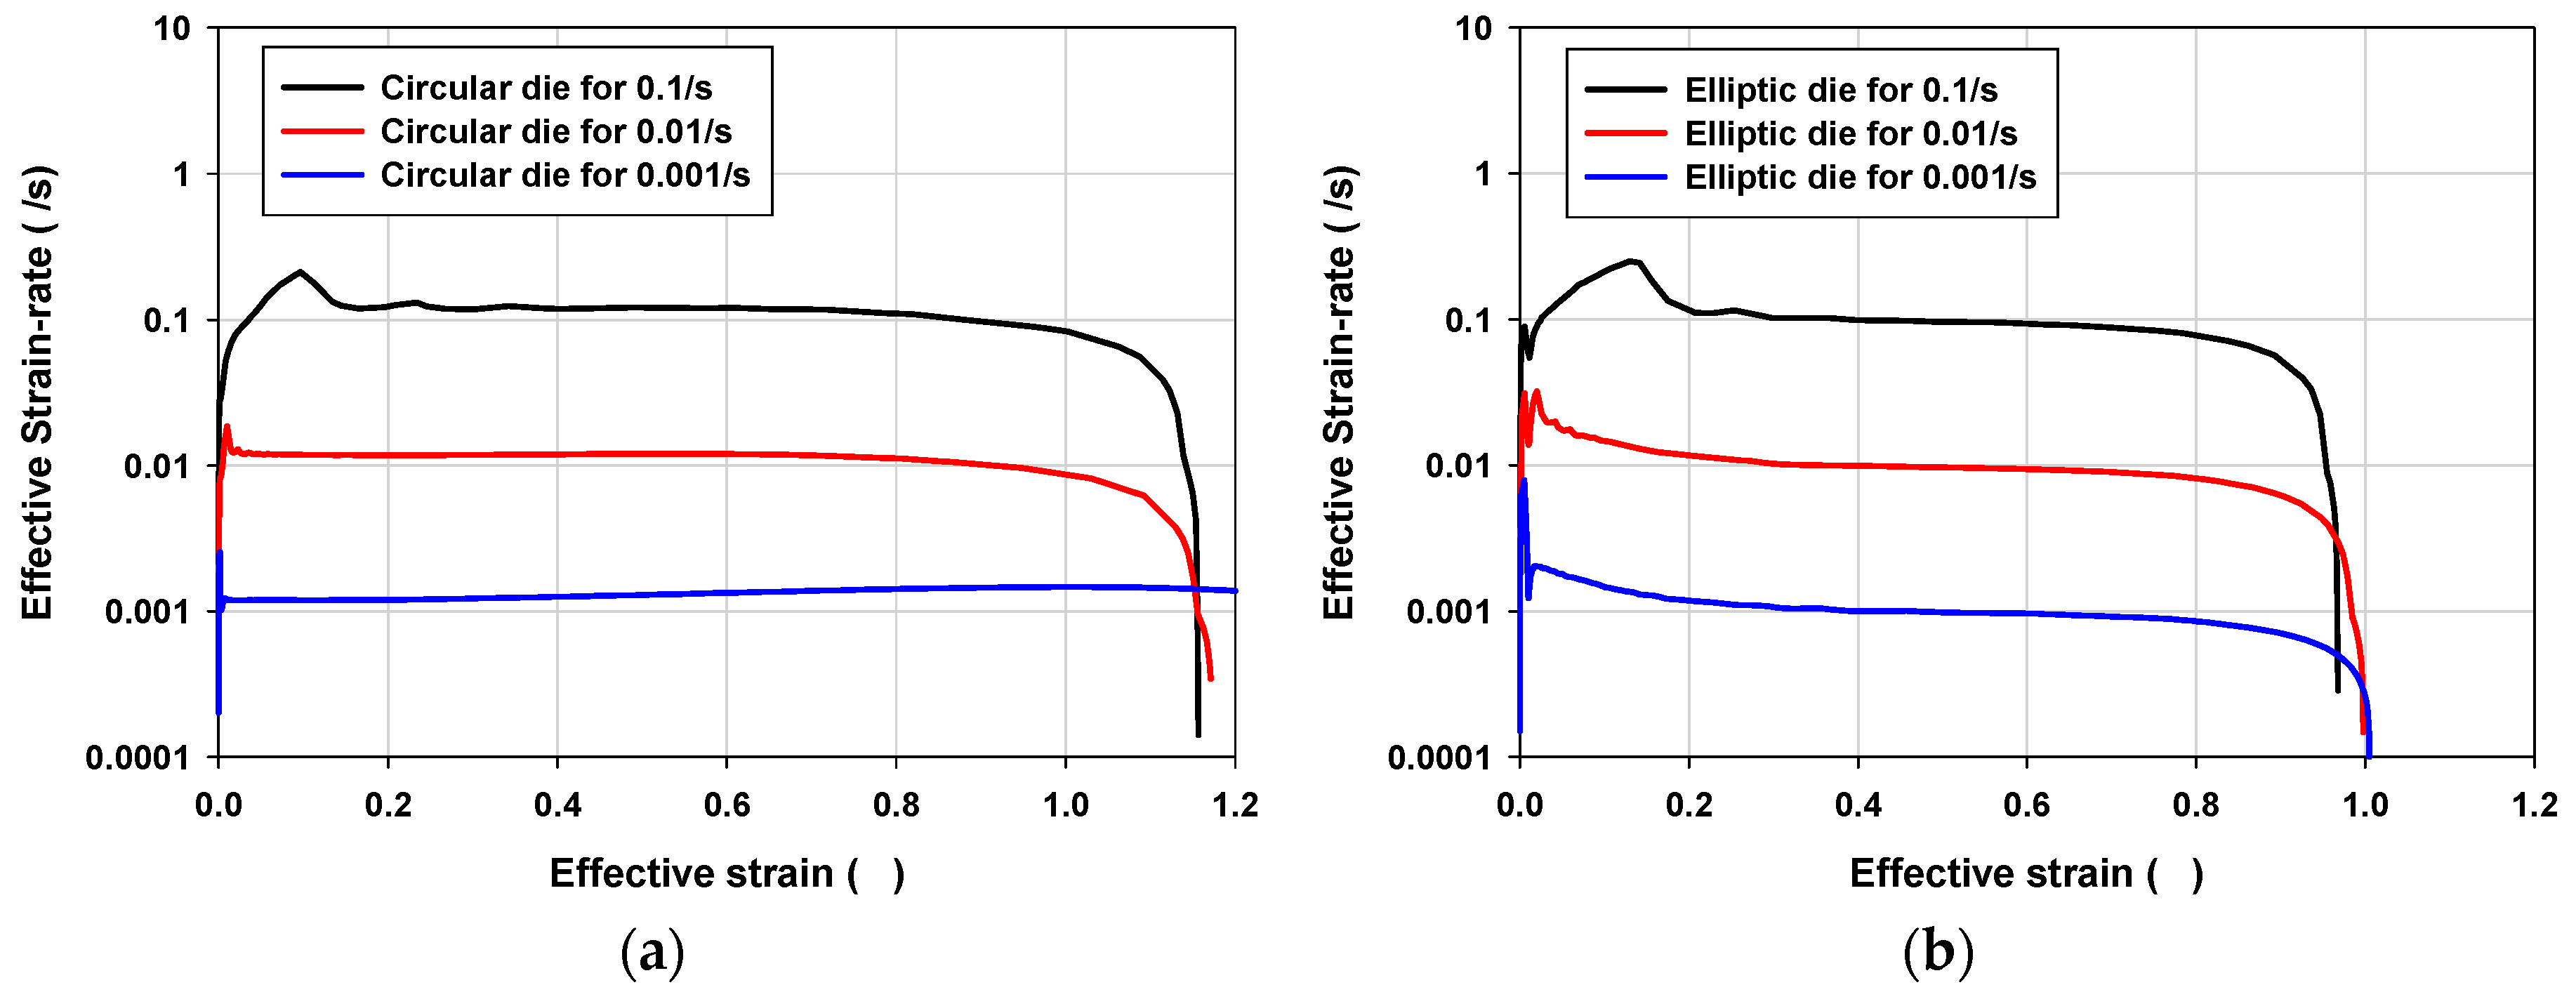
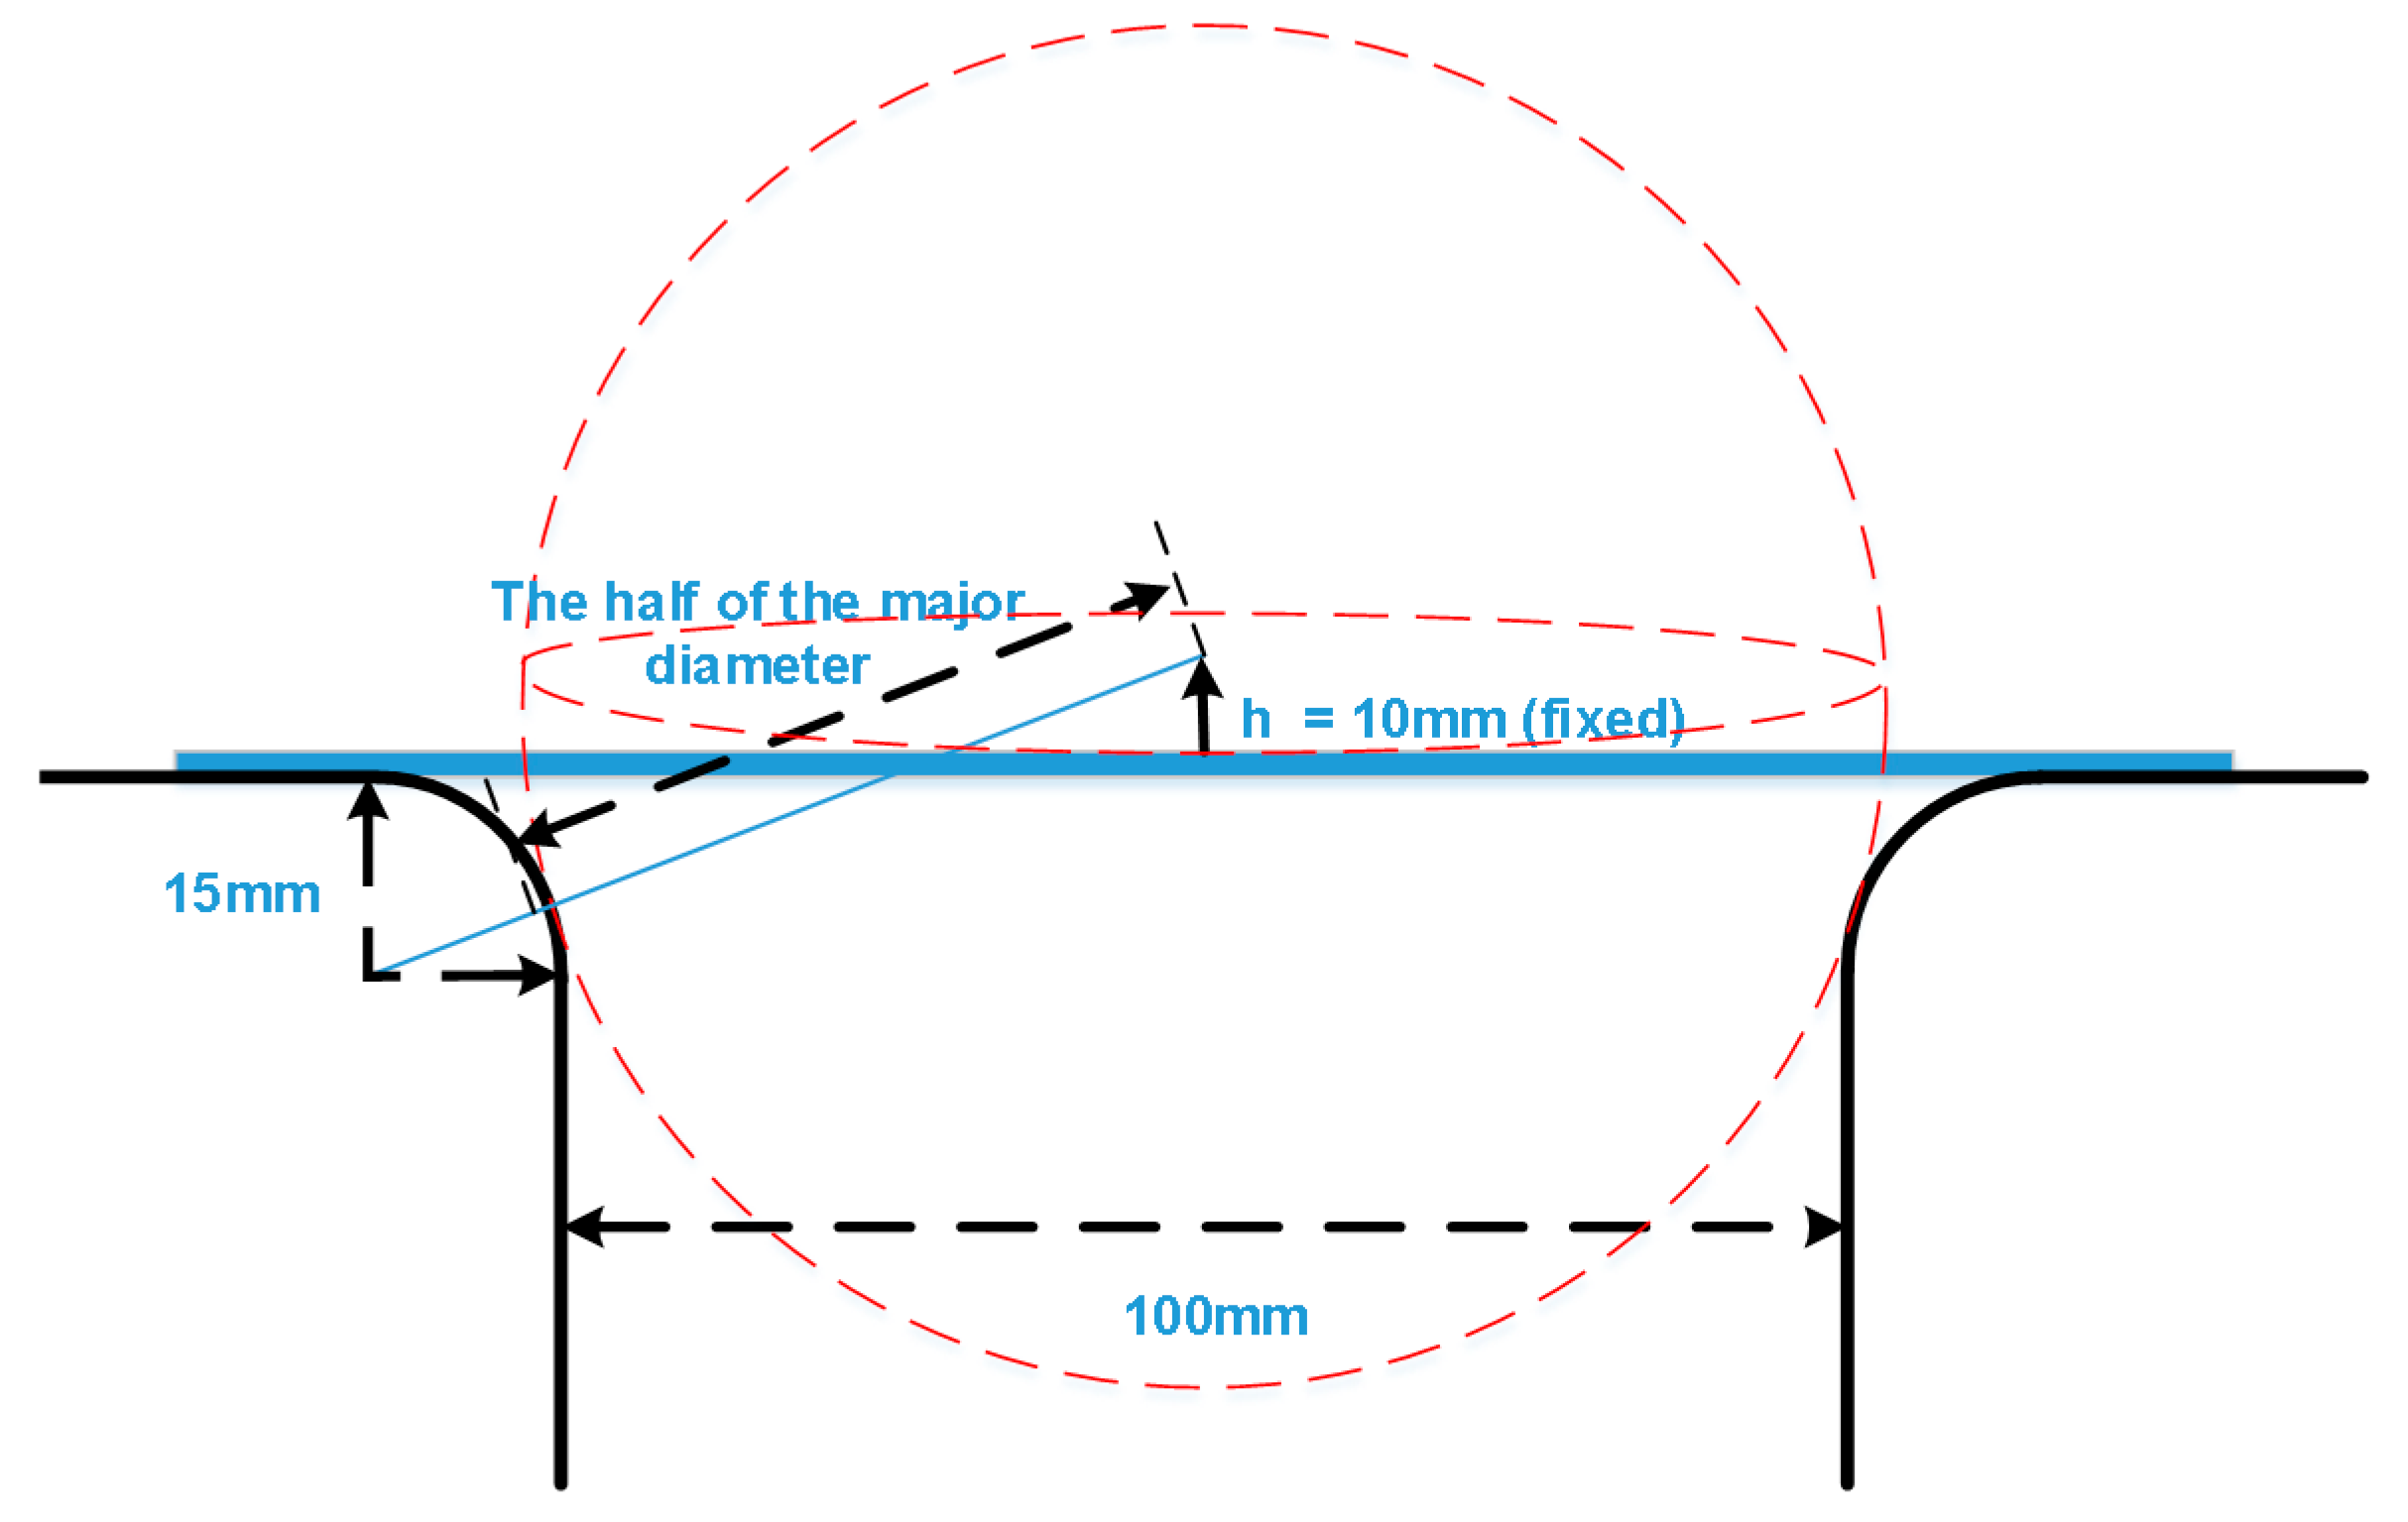
3.2. Geometric Design: The Profile Radius (R)

Another significant geometric design factor that has been negligently treated before is the profile radius (R), as shown in Figure 1. As can be seen, as k diminished, the effective strain was more likely to be concentrated on the edge. This is because the profile radius (R) is crucial to induce a fracture on the proper location during the experiment, preventing an unfavorable fracture on the edge. The parametric study conditions for optimized circular and elliptic die are given in Table 4. It can be seen that more pressure was required for the same amount of deformation as k became smaller. The amount of deformation of the center and edge of the blank was compared to each other during the deformation to determine the minimum profile radius (R) of the die to concentrate fracture on the center of the blank. The minimum profile radius (R) of the die has some advantages. A smaller R secures enough blank holding area to reduce the possibility of a slip. Aside from area cavity, larger R means less blank holding area or increased size of the machine with the same blank holding domain. Therefore, smaller but safe R can be used depending on the preference of the user and machine.
Even though R was changed, it did not occupy cavity size and did not influence the dimension of the major radius and die insert ratios (k). To reduce the possibility of fracture at an unfavorable area like the die edge, 0.4 of effective strain was set as a quantitative standard to distinguish whether the strain was largely concentrated on the center or not. Figure 8 shows a comparison of effective strain at the center element with those at the edge element as the deformation progressed with various die profile radii (R) for the circular die. The solid and dashed lines were obtained from a single center element and the critical element at the edge, respectively. The two black lines were obtained from the element of the circular die with 5 mm die profile radius (R) and the red, blue, and green were obtained from 10, 15, and 20 mm die profile radii (R), respectively. Although the deformation tended to focus on the edge as k decreased, all parameters were within the standard and did not exceed 0.4 of effective strain on the edge. The deformation history of the critical element was uniform for all the profile radii (R) for the circular shape die, as shown in Figure 9. A comparison of effective strain at the center element with those at the edge element as deformation progressed with various die profile radii (R) for elliptic die is also shown in Figure 10. The solid and dashed lines were obtained from a single center element and the critical element at the edge, respectively. The two black lines were obtained from the element of the circular die with 5 mm die profile radius (R) and the red, blue, and green were obtained from 10, 15, and 20 mm die profile radii (R), respectively. For the elliptic die, deformation also tended to focus on the edge as k decreased. However, the deformation was so severe that the effective strain on the edge exceeded 0.4 for R below 15 mm (blank and red lines). It was also further from the targeted deformation history of the critical element for R below 15 mm, as shown in Figure 11. To meet the safety condition for both circular and elliptic cases, R = 15 mm was finally determined for die profile radius (R) based on the numerical simulation results.

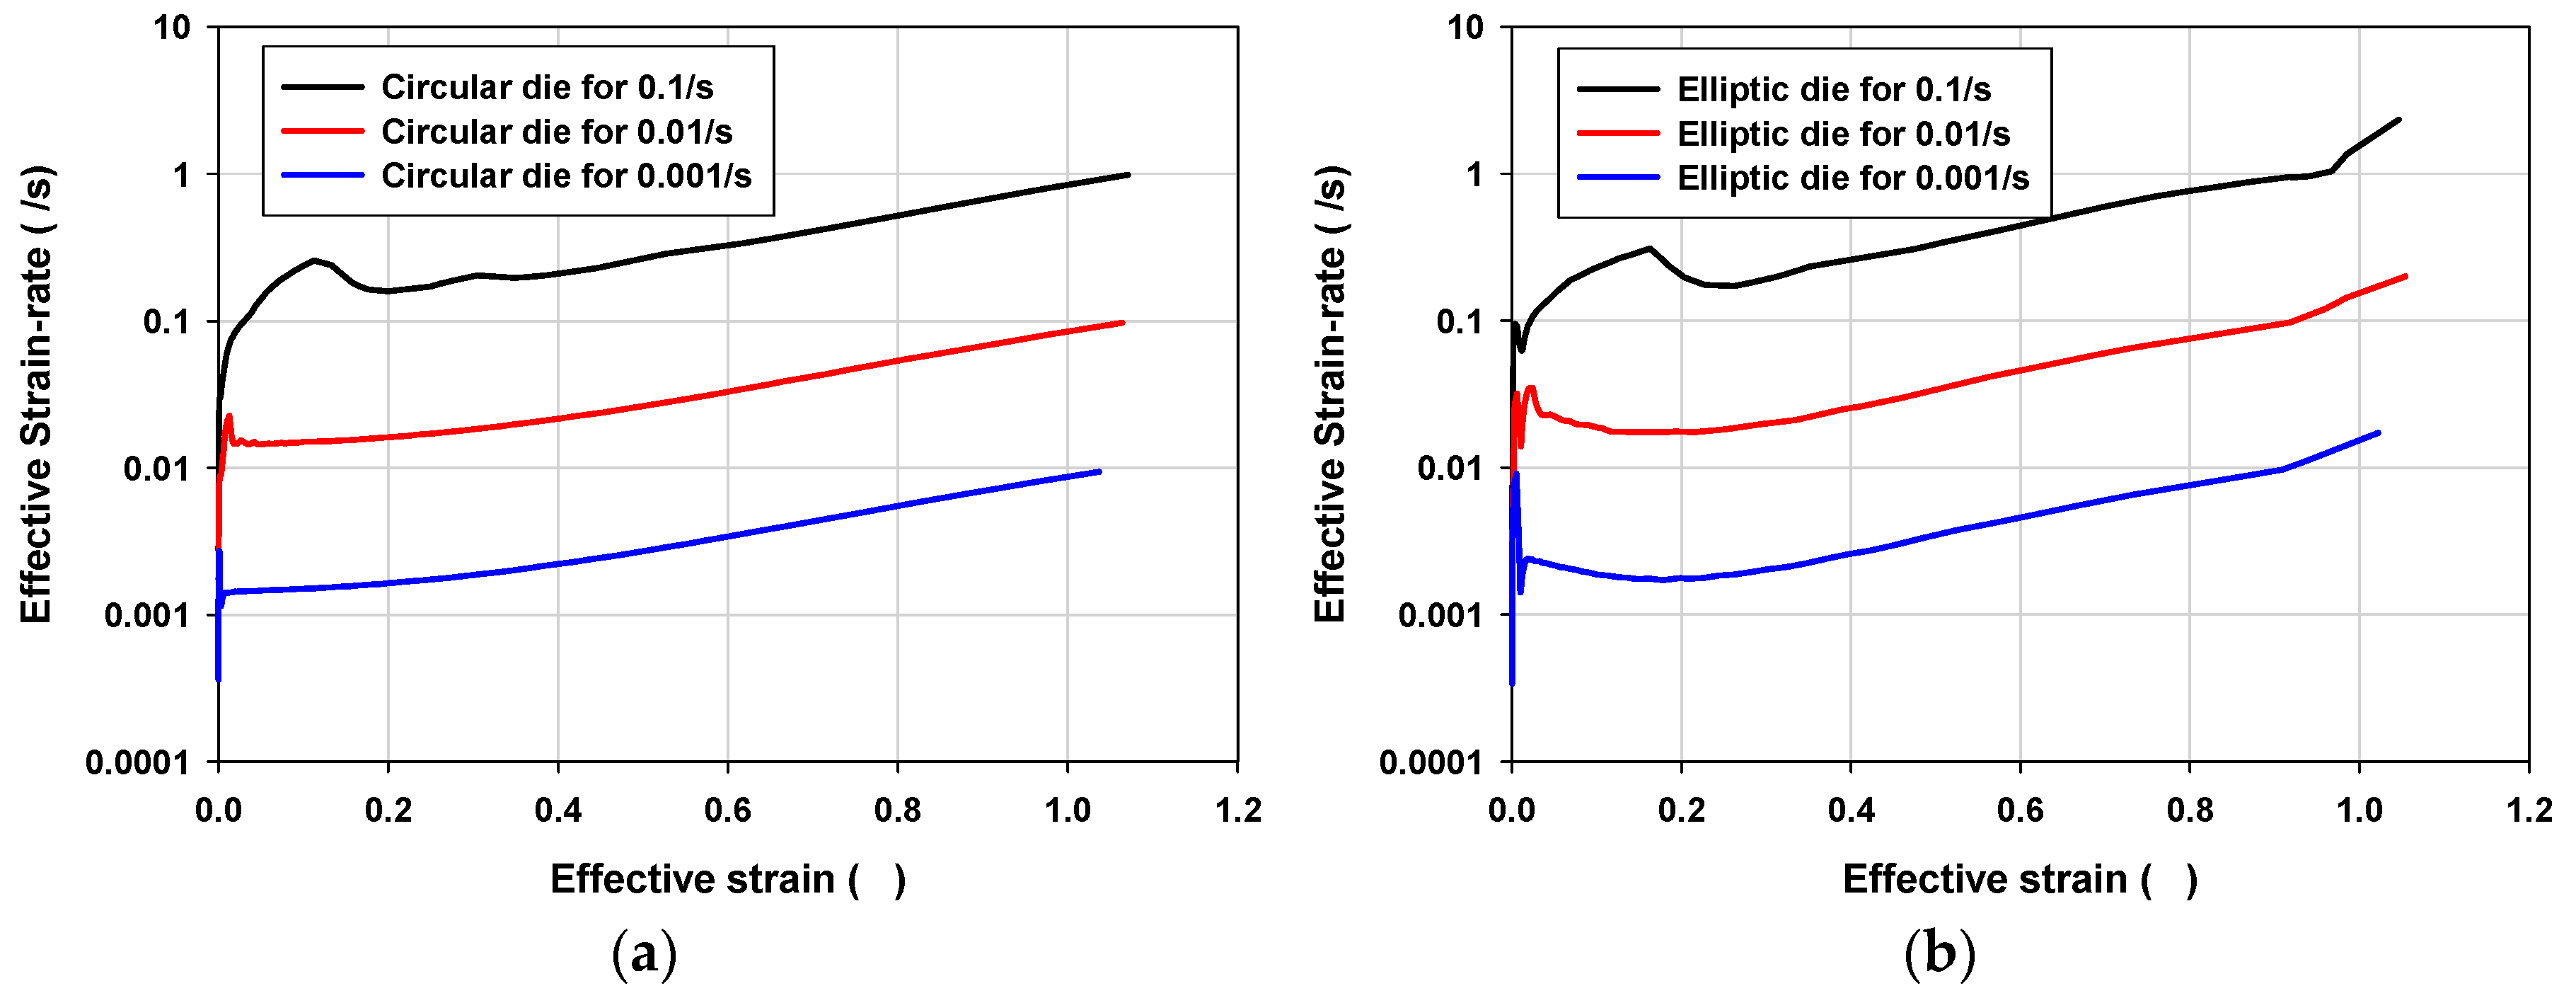
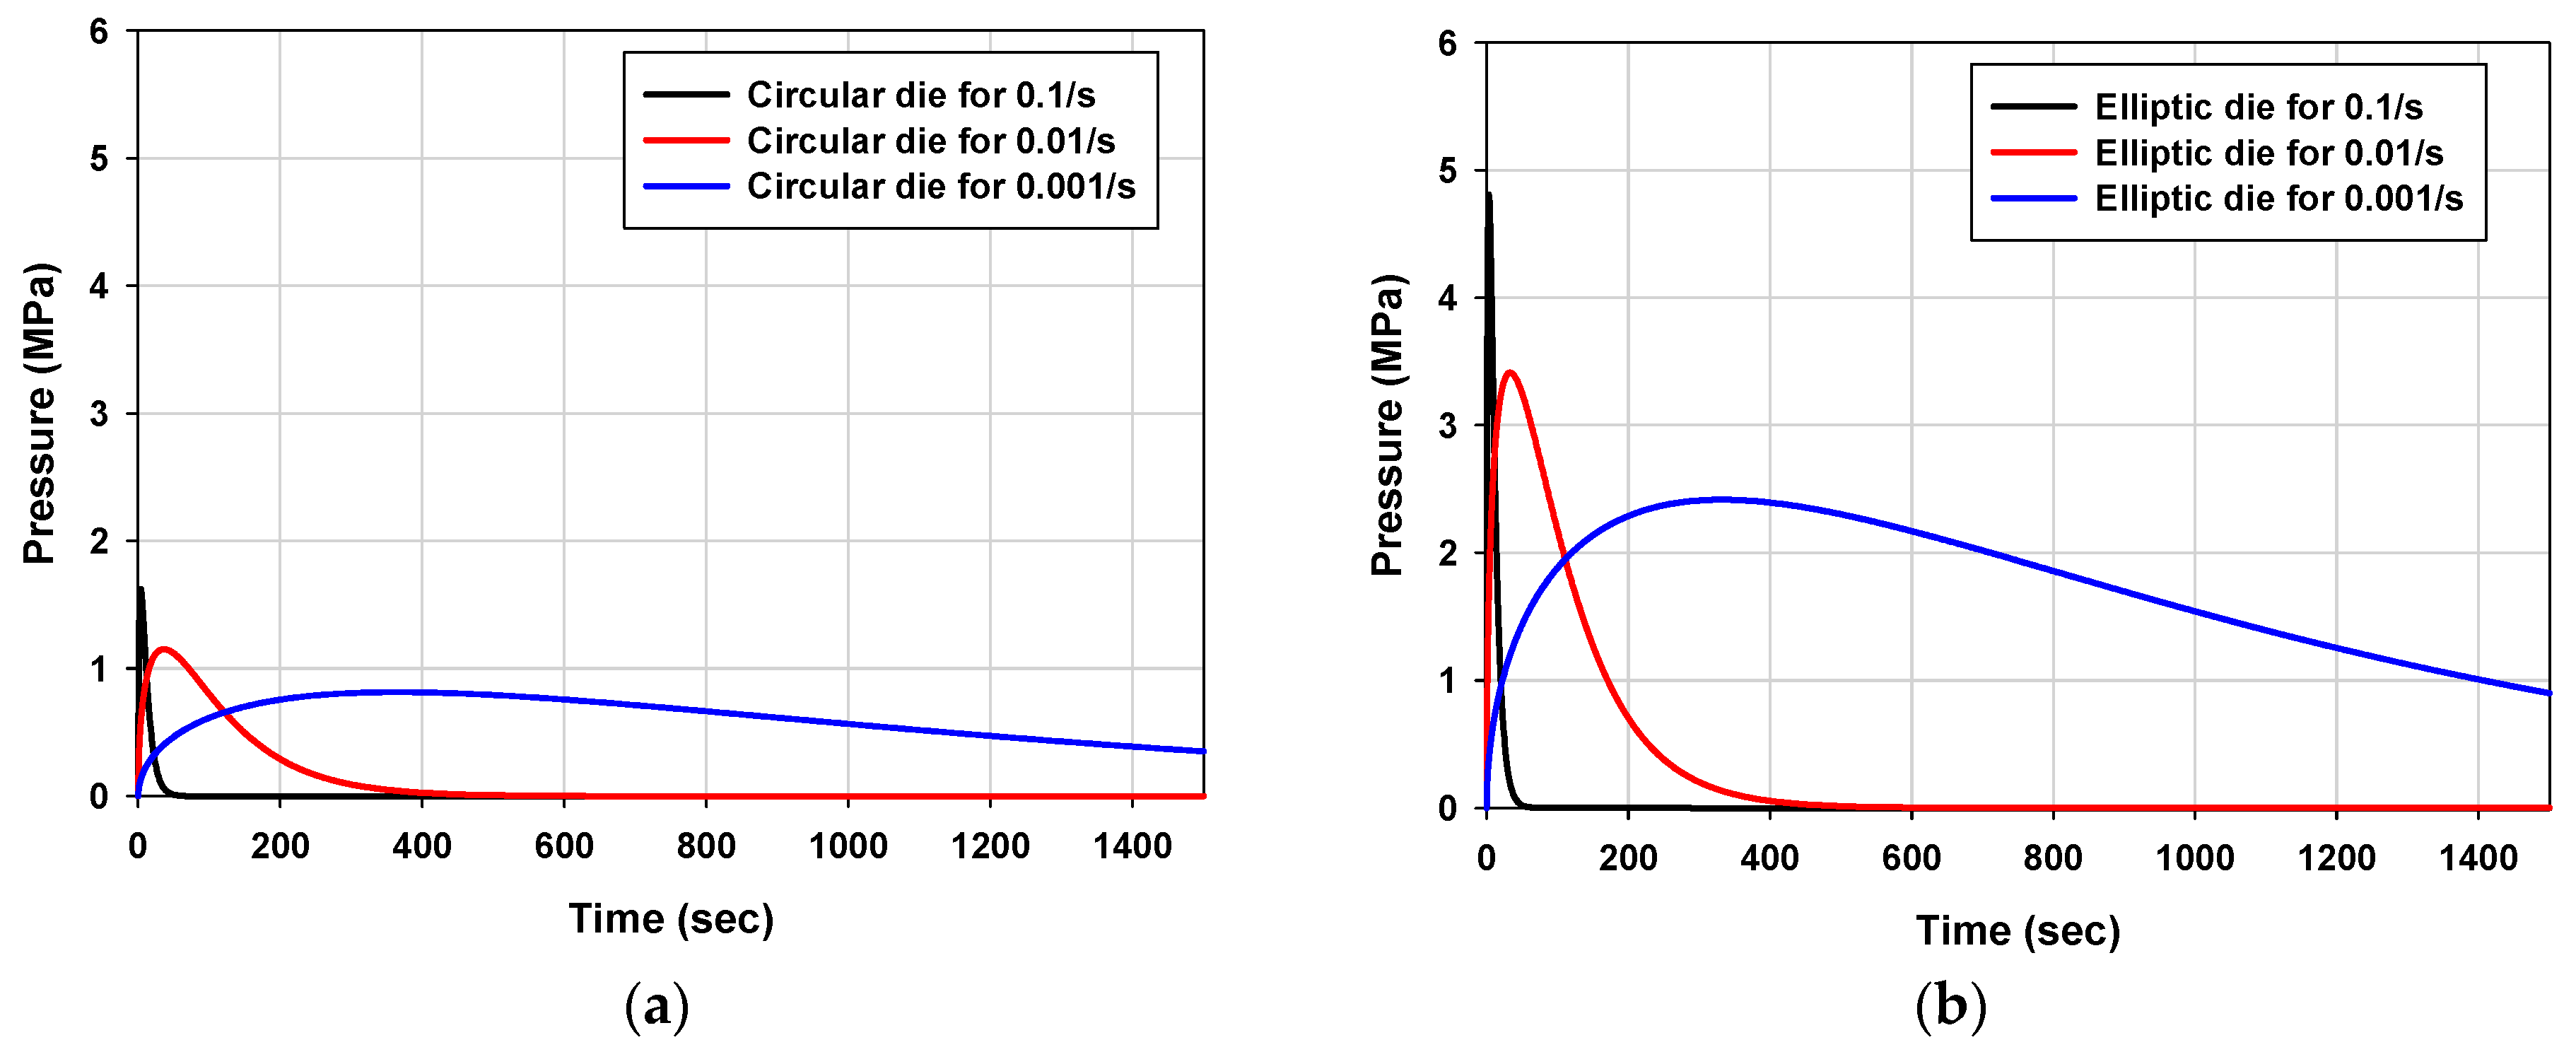
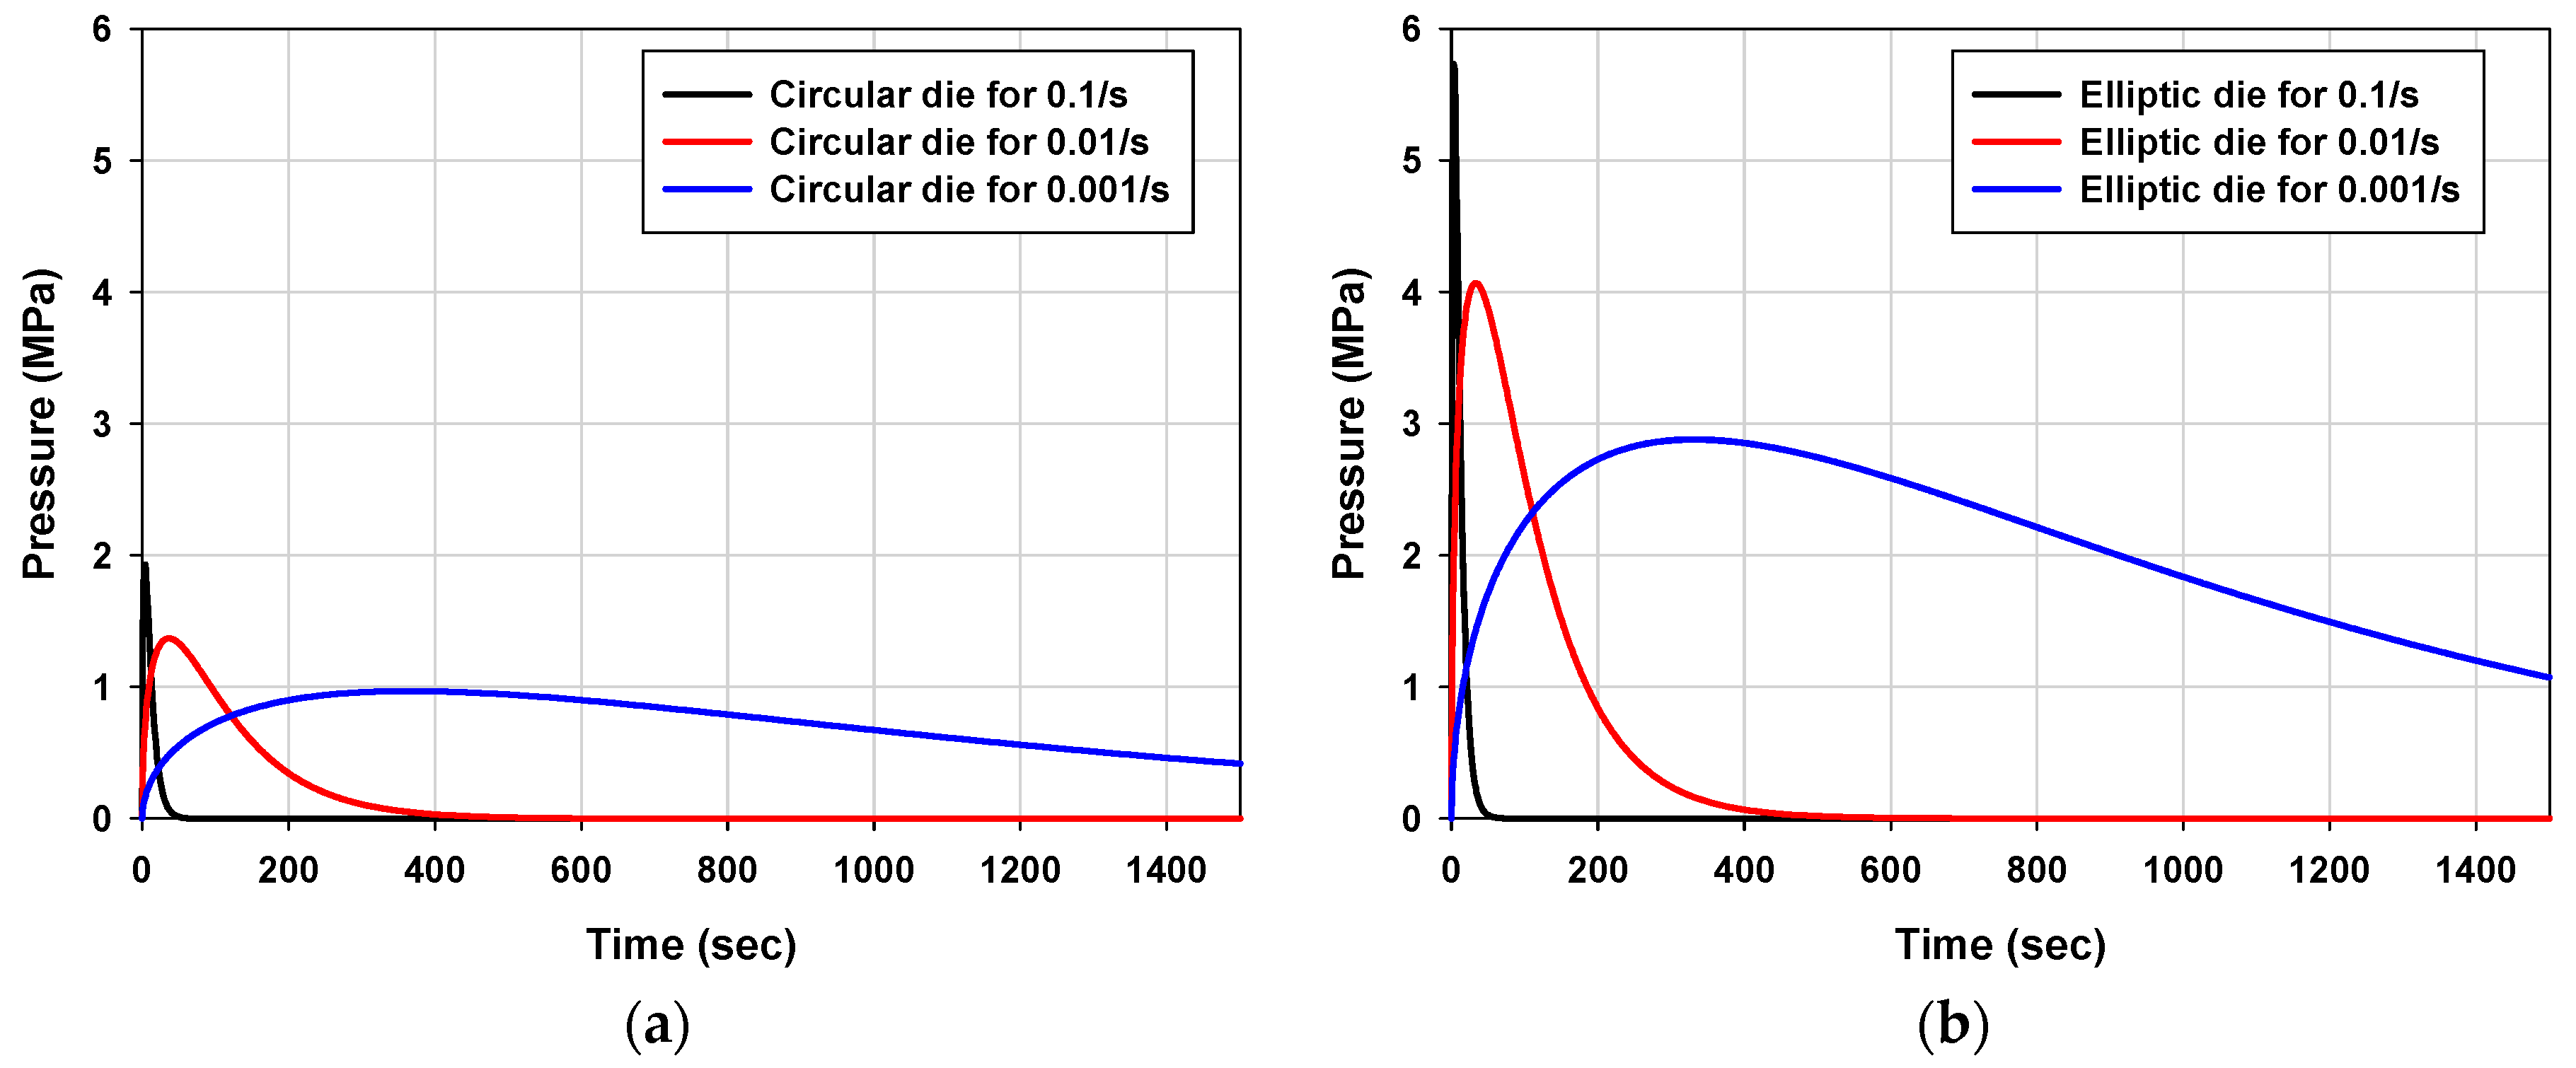
3.3. Process Condition Design

Due to its fast and easy application, an analytical solution has an advantage in the early stage of the test design and experimental setting. The relationship of the pressure and height of the blank in a circular bulge was derived with linear plasticity [6]. A closed-form analytical model with transversely isotropic material was extended to the elliptic bulge test, which is a general form of the circular bulge test. The extended model was applied to Hollomon-type hardening law and strain rate sensitive superplastic material law [7]. Pressure and time relationship for general k was obtained in full three-dimensional isotropic yield function with the general material hardening model [5]. In this study, a previous analytical model utilized for extended elliptic bulge test was modified by considering the profile radius (R) effect, as shown in Equation (2). The correlation among variables is also written in Equation (3). In this model, ω or correction factor is newly introduced. a 0 , b 0 , and k are substituted with A , B , and K , respectively.
p ( t ) = 2 s 0 σ ¯ B 0 1 + α K 2 ρ ( e ( 2 α ) ε ¯ ˙ t 2 ρ 1 ) 1 2 e 3 ε ¯ ˙ t 2 ρ
K = B 0 A 0 = b 0 + ω R a 0 + ω R , ω = ω 0 k 0 = ω 0 b 0 a 0 , α = 1 2 ( 1 + e 1 ( 1 K ) ) , ρ = 1 α + α 2
where p is the blow forming pressure; s 0 is the initial blank thickness; a 0 and b 0 are the major and minor radii of elliptic die, respectively; A and B are modified major and minor radii of elliptic die considering the effect of profile radius (R); t is the time; ε ¯ ˙ is the targeted strain rate; σ ¯ is the effective stress; ω is the correction factor taking into account the effect of the profile radius (R) and is a function of k , which is the ratio of minor radius to major radius without considering the profile radius; and ω 0 is a coefficient of the correction factor. As ω 0 becomes zero, a 0 , b 0 , and k become A , B , and K , respectively. Then, the pressure and time relationship is identical with the model developed by D. Banabic and M. Vulcan. As ω 0 becomes unity, the profile radius (R) is fully considered as part of the die hole radius in the relationship. In general, ω 0 is maintained in between 0 ω 0 1 .
Voce-type law with power law rate sensitivity model was applied to the relationship for each targeted strain rate. Two extreme cases were dealt with to show the effect of the profile radius (R). To begin with, no consideration was taken into account of the effect of R, i.e., ω 0 = 0 , which is the same as the previous model. Then, full consideration of the effect of R was taken into, i.e., ω 0 = 1 , which is the other extreme case. For the case of ω 0 = 0 , the pressure and time relationship is shown in Figure 12.
There was a discrepancy between the input strain rate in the analytical solution and output strain rate in the numerical model, as shown in Figure 13. The results were faster than each targeted strain rate. The error could have occurred because of some limitations, such as the constraint of approximated geometric assumption on the bulge test and assumption that strain increases linearly in time, as mentioned in [7]. However, the major discrepancy of the strain rate results is due to the introduction of the profile radius (R) in the geometric design. As a comparison, the effect of profile radius (R) is fully considered in Figure 14. It can be seen that as the modified major radius, a0 + ωR became 65 mm, pressure became approximately 0.77 smaller than the previous model for ω = 0 for the circular die. The effective strain rate result in numerical simulation for the circular die and elliptic die is shown in Figure 15. However, the results did not have enough deformation and did not satisfy targeted values of strain rate history.
A geometric relationship was assumed to obtain proper coefficient of correction factor, ω 0 , in between the two extreme cases, as shown in Figure 16. The sphere (red short line) was in contact with the profile radius (R) of the die. The center of the geometrical figure had a fixed distance of 10 mm from the center of the blank. The radius of the new geometrical figure was calculated with the geometric constraint. Then, ω 0 was found to be approximately 0.31, which is between zero and unity, indicating that ω was equal to ω 0 in the circular case. For the general ellipsoid, the effect of profile radius (R) was compensated by the ratio of minor radius to major radius (k) being ω . The pressure and time relationship for each circular and elliptic die is shown in Figure 17. The effective strain rate results in numerical simulation for the circular die and elliptic die are shown in Figure 18. The results were improved than the previous analytical models in maintaining approximately constant targeted strain rate.

4. Validation

To validate the integral experimental design, tests for pneumatic forming for k = 1 and 0.25 with the pressure condition maintained at approximately constant strain rate of 0.01 s−1 were performed for 7075 aluminum alloy sheets. The circular and elliptic pneumatic forming dies were fabricated, as shown in Figure 19, based on the parametric study for k and R. A double bead was also introduced to prevent slip of the blank and gas leakage. The blank dimensions for circular and elliptic pneumatic forming die used in this study are also shown in Figure 20. The pneumatic process was performed using a pneumatic forming machine. The photograph and schematic view of the machine are also shown in Figure 21.
The final blanks after deformation for circular and elliptic dies are shown in Figure 22. The pneumatic forming tests were completed due to crack formation on the pole of each blank. The shape (z coordinate) and thickness distribution results of the experiment and simulation are compared in Figure 23 and Figure 24. The shape and thickness evolution obtained from pneumatic forming numerical simulation of 7075 aluminum alloy sheets were superimposed. The black solid line was measured from the final experimental results. Dashed red lines were obtained from numerical tests at each shape height with 10 mm difference (for example, 10, 20 mm, etc.) to show the evolution of pneumatic forming. However, as no fracture properties were applied on the finite element simulation, numerical deformation continued until the onset of localized necking coming from instability of the mathematical effect. Therefore, the simulations were stopped when the height of each blown blank reached the same height of each experimental result. The simulation results at the height are plotted with a red solid line. The results showed good agreement with the experimental results. When it came to improvement of the small thickness discrepancy at the pole, a material model considering material deterioration with hardening and rate sensitivity is needed to represent the material softening behavior [12,13]. This is because of the material properties of 7075 aluminum alloy sheets at elevated temperatures, which display material softening behavior after short arrival of UTS, as shown in the Figure 2. However, sophisticated material characterization is beyond the scope of our research. Hence, the conventional Voce-type hardening law, which has been widely used for aluminum alloy, was utilized in this study to highlight and focus on the integral pneumatic die and pressure optimization design process.

5. Conclusions

An integral experimental design of strain rate sensitive forming limits in the biaxial stretching modes for 7075 aluminum alloy sheets by pneumatic forming was attempted with the finite element method. The integral experimental design work consisted of apparatus geometric design and pressure optimization as the process design. The material was characterized by conventional Voce-type hardening law with power law strain rate sensitivity relationship. For the design of the die shape, the ratio of minor to major radius (k) and profile radius (R) were parametrically studied for best fit to 7075 aluminum alloy sheets. For the design of process condition, pressure and time relationship that maintained targeted strain rate at the pole was obtained. The following conclusions were established:
  • As the ratio of minor to major radius (k) became smaller, more effective strain was likely concentrated on the edge and more pressure was needed to complete the forming process. As the ratio of minor to major radius (k) became smaller, the history of the deformation mode in triaxiality (η) and major/minor domain approached the near plane strain (PSA) mode; however, when the k was too small, it did not show uniform deformation history because of the 3D effect (no more plane strain). As for the ratio of minor to major radius (k) of the die, a circular die with k = 1.0 and elliptic die with k = 0.25 were selected for balanced biaxial mode and near plane strain mode, respectively.
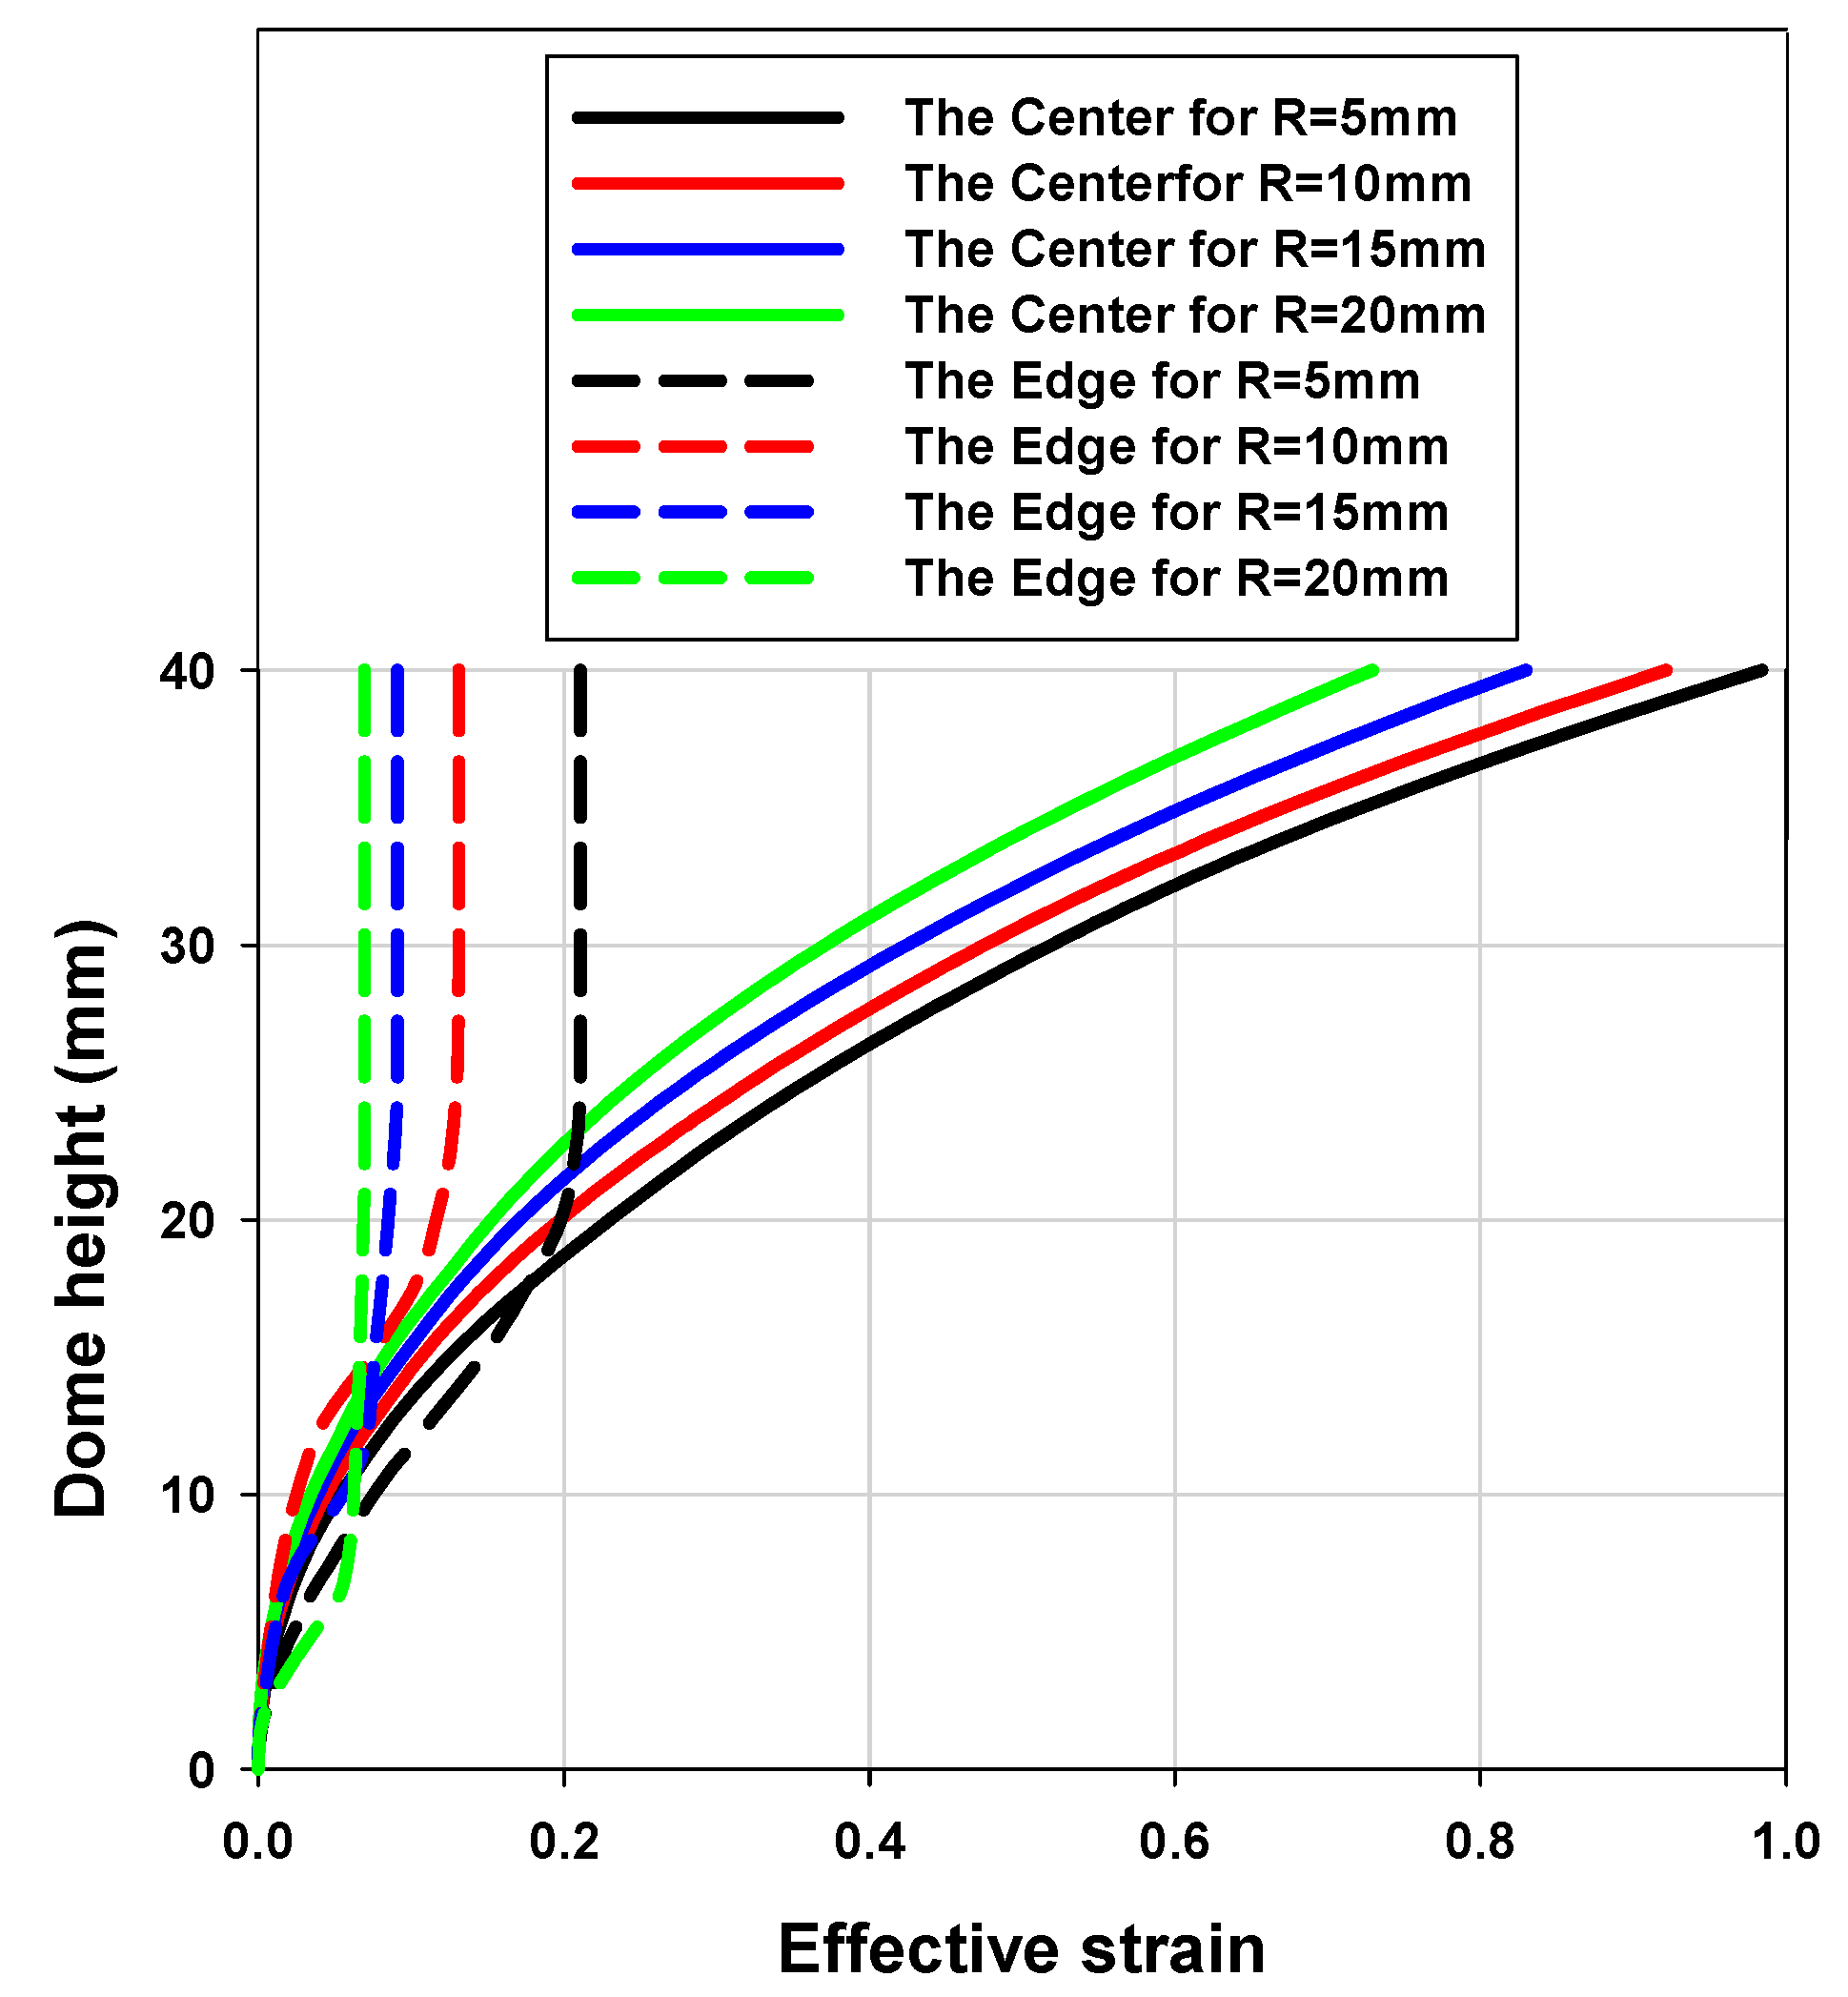
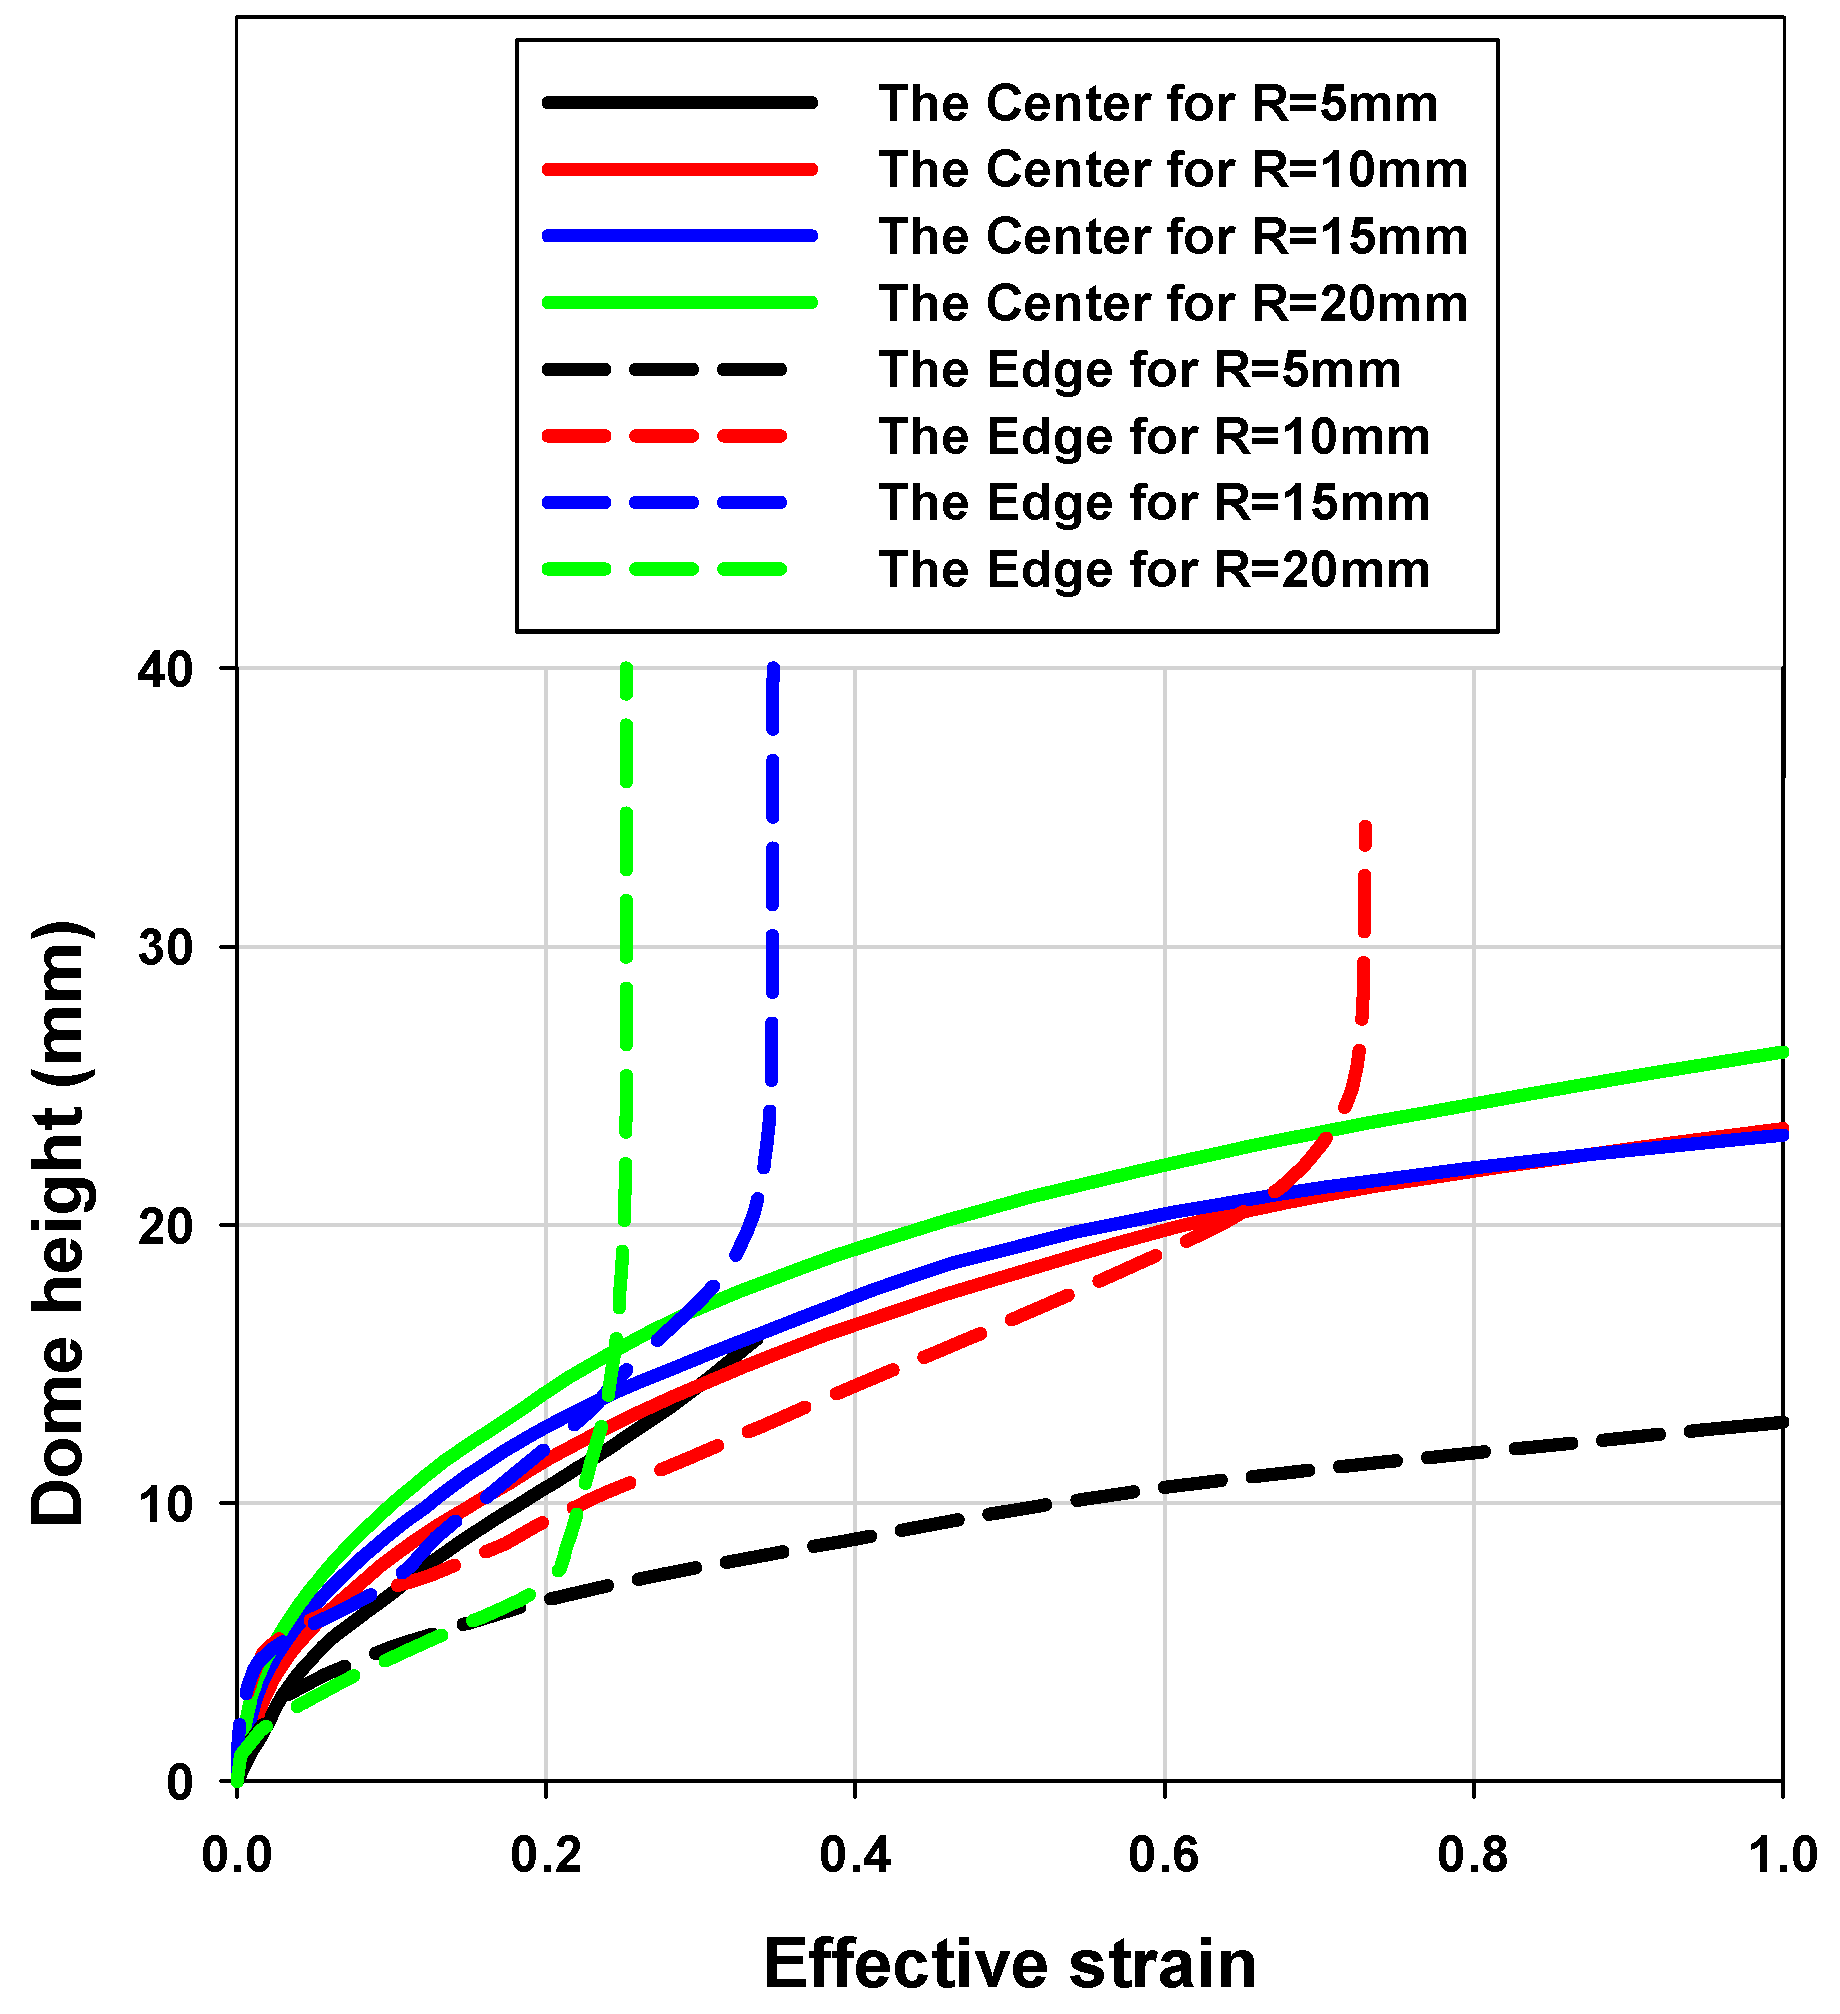
  • As the profile radius (R) of the die got larger, deformation was more likely concentrated on the center for both circular and elliptic dies. R = 15, which is safe and small enough for favorable fracture occurrence at the center of the blank, was also chosen as profile radius (R) for both circular and elliptic dies.
  • For the process design, a preexisting analytical model was modified with geometrical consideration of the profile radius (R). The modified analytical model induced fracture at the pole with approximately constant targeted strain rate.
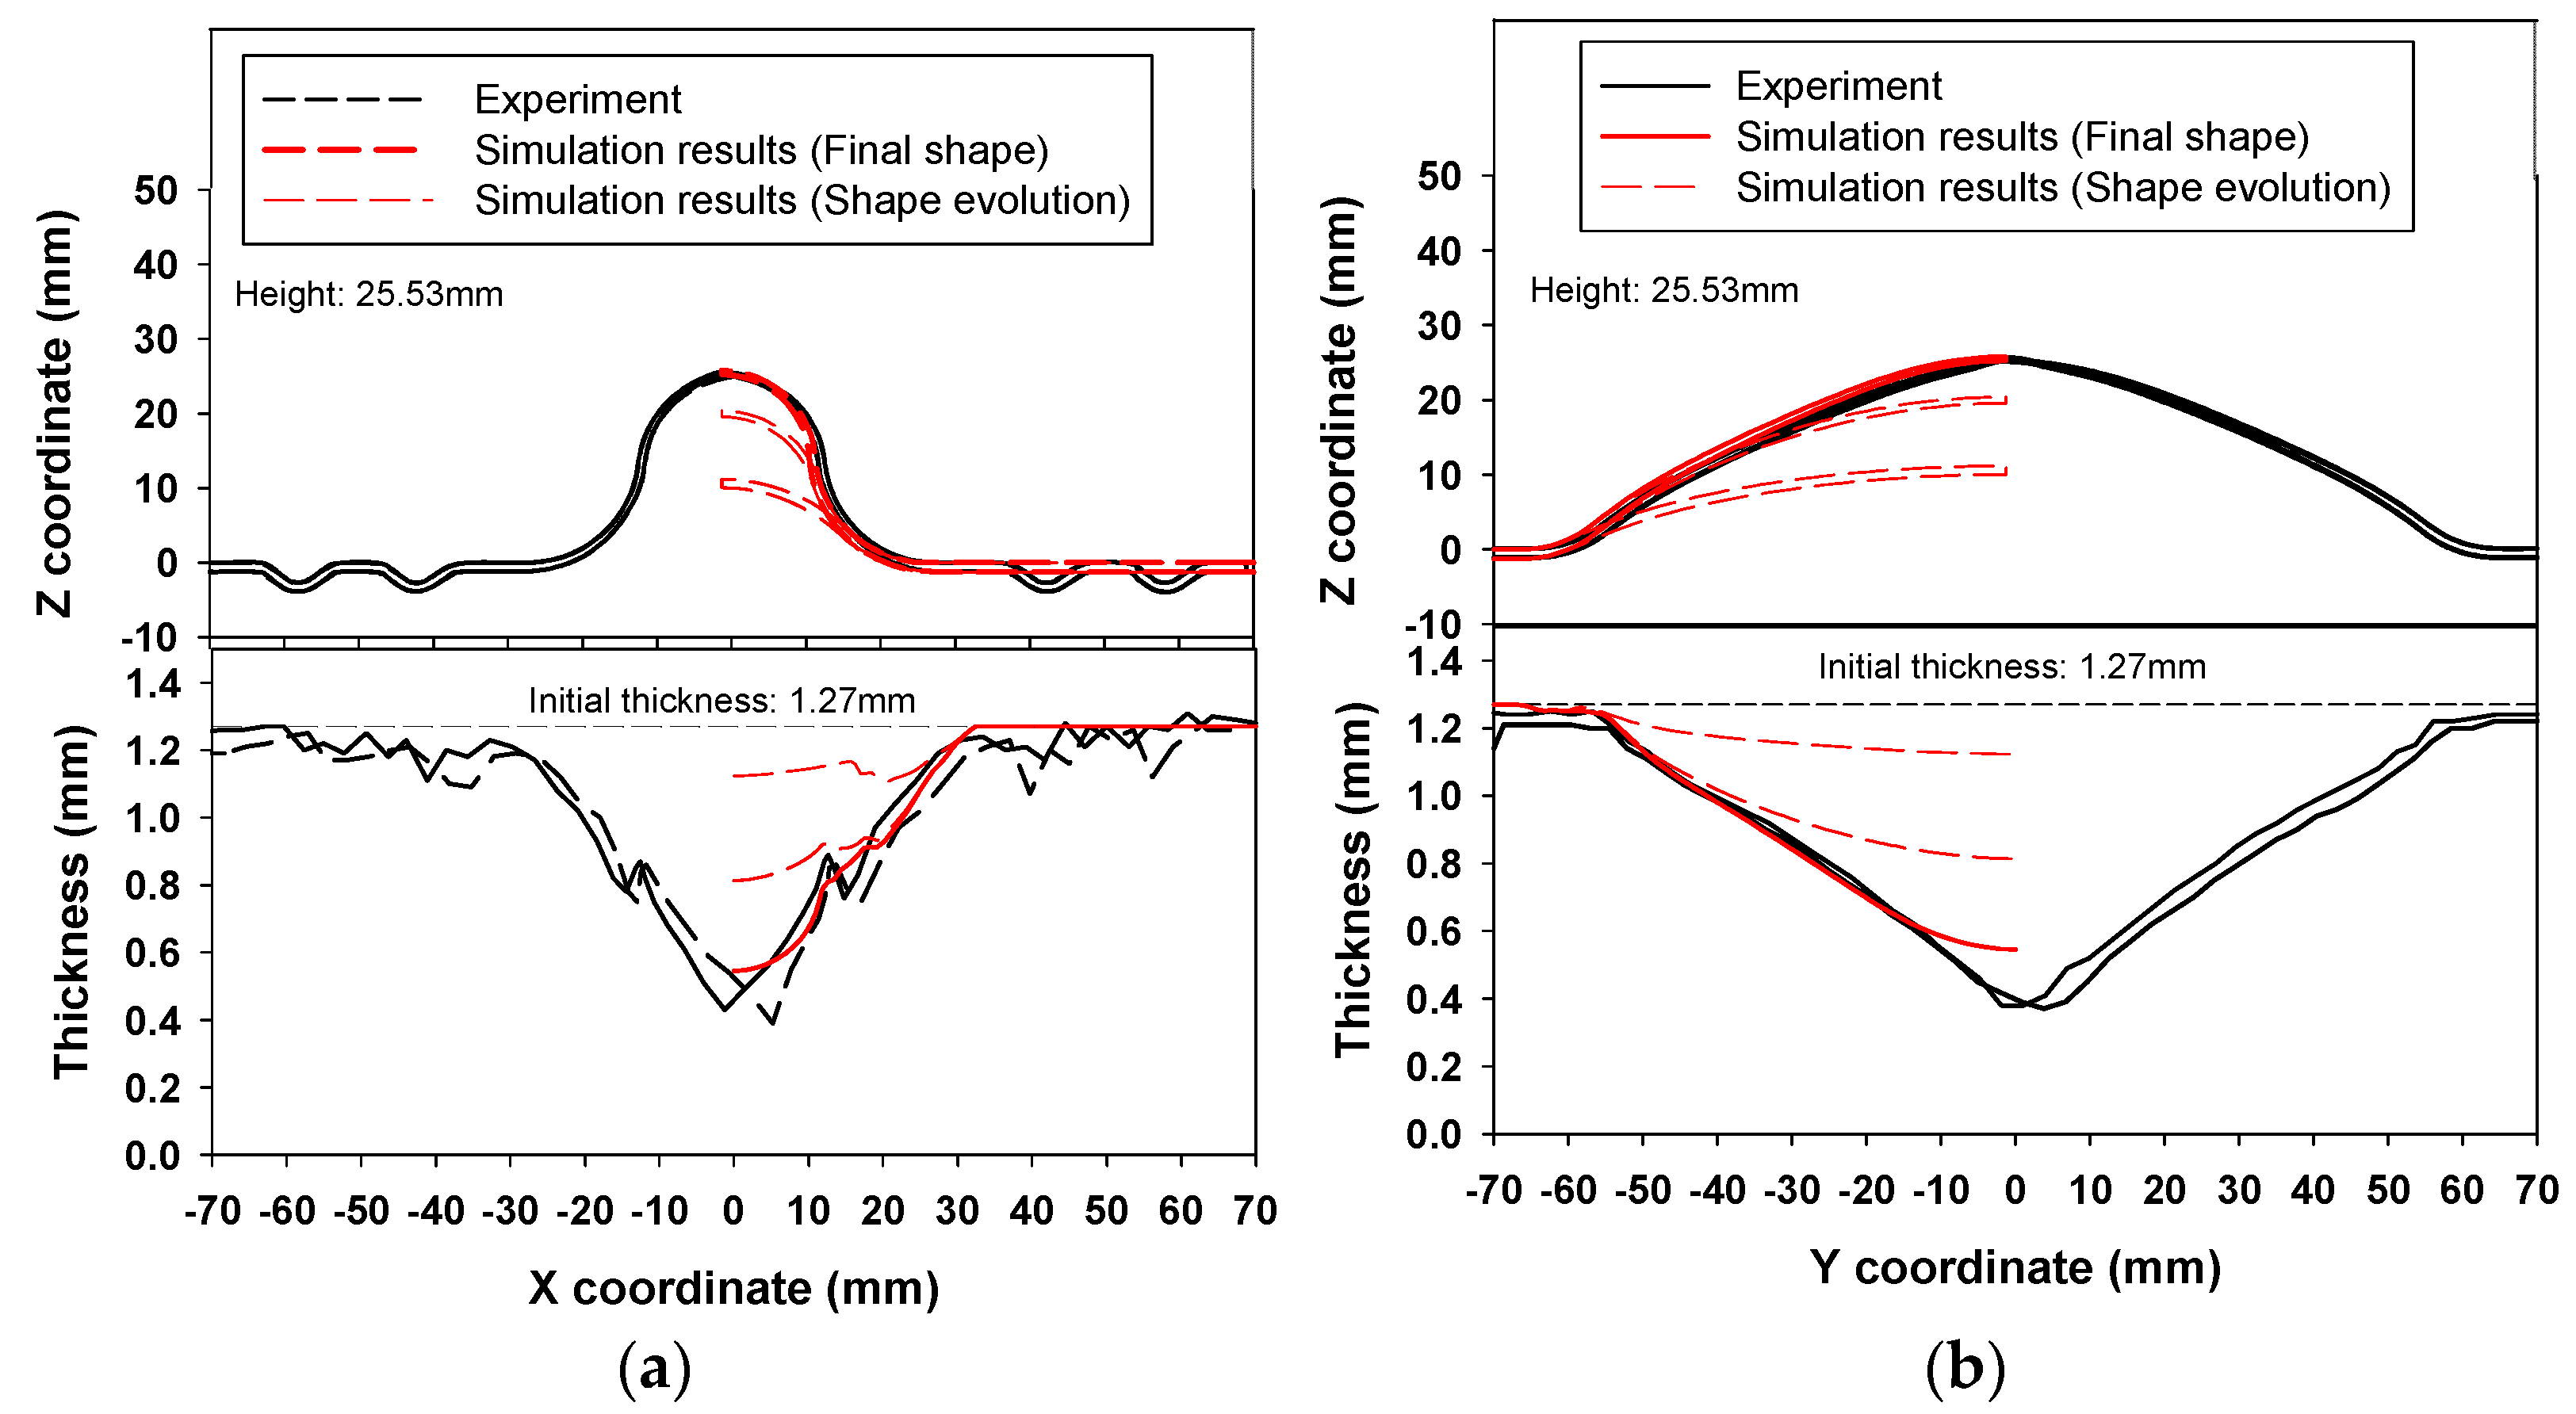
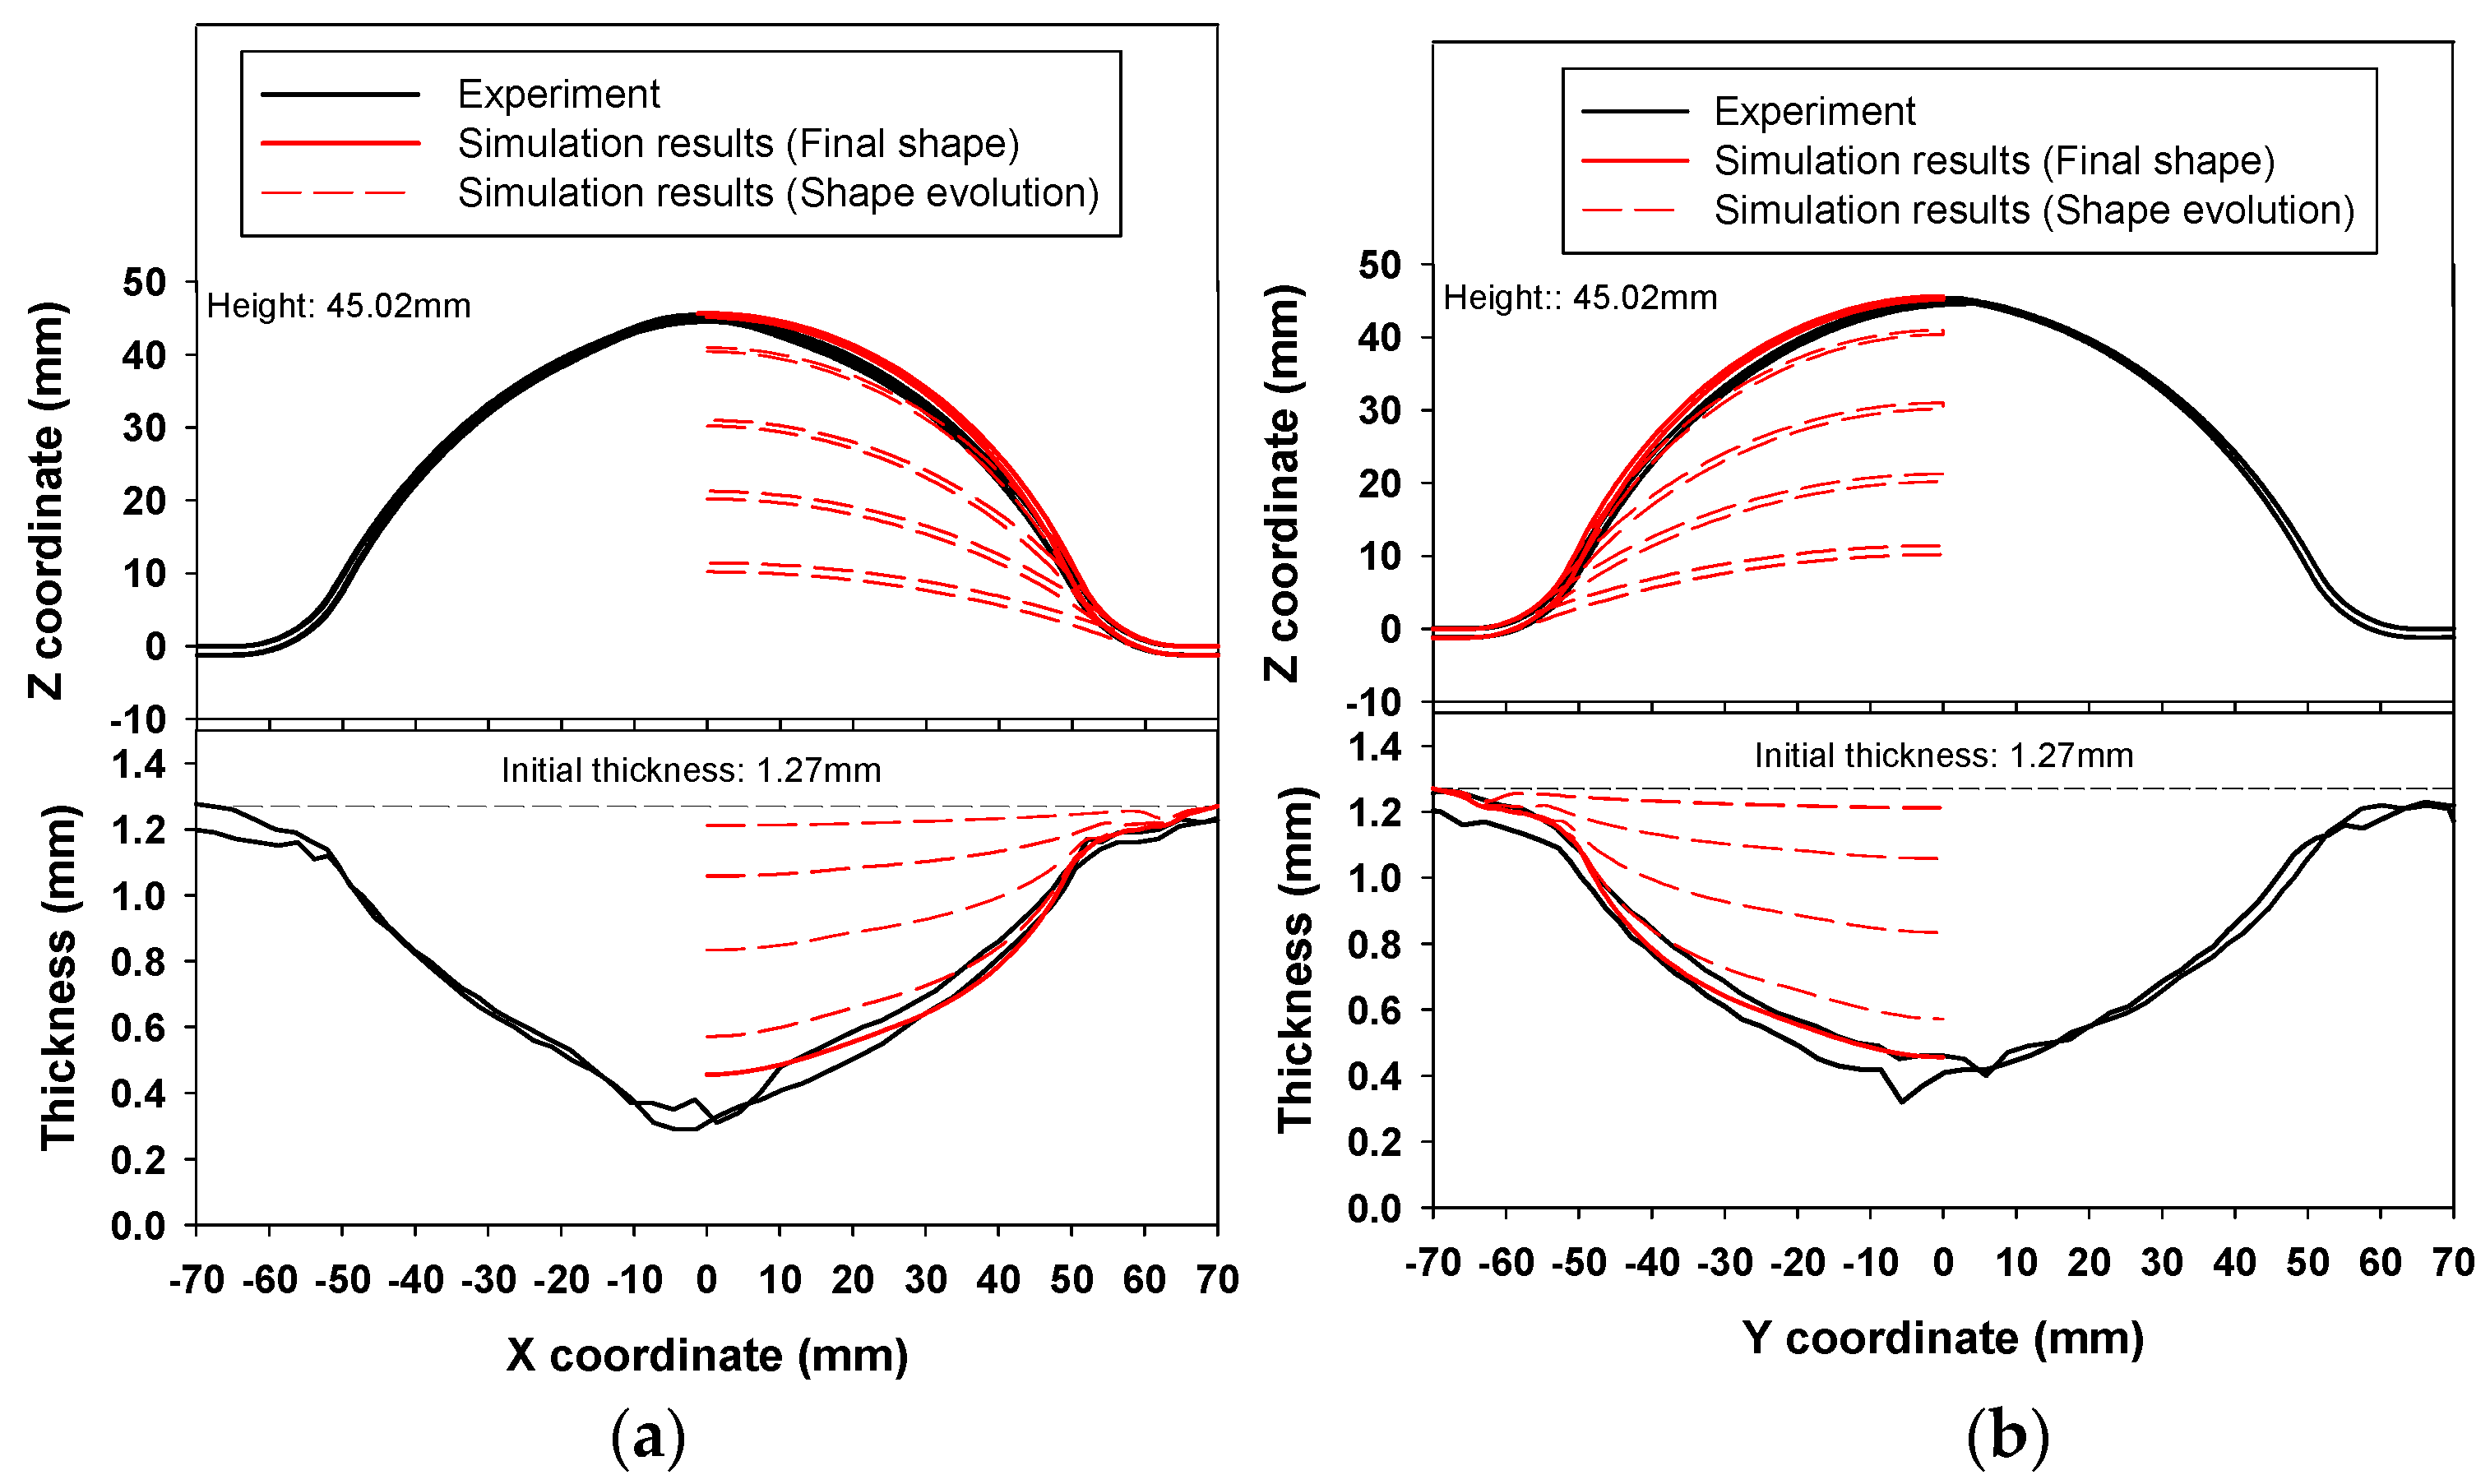
  • Finally, the simulation results of the designed geometric and process conditions were compared with the experimental results, and they showed good agreement with regard to shape and thickness distribution.

Author Contributions

Conceptualization, D.K.; data curation, J.-H.H.; investigation, J.-H.H. and D.Y.; supervision, D.K. and Y.N.K.; visualization, J.-H.H.; writing–original draft, J.-H.H.; writing–review & editing, D.K. and J.-H.H. All authors have read and agreed to the published version of the manuscript.

Funding

This study was financially supported by the Industrial Technology Innovation Program (No. 10077492) funded by the Ministry of Trade, Industry, and Energy (MOTIE) and the Fundamental Research Program of the Korea Institute of Materials Science (PNK6850) funded by the Ministry of Science and ICT (MSIT), Republic of Korea.

Conflicts of Interest

The authors declare no conflict of interest.

References

  1. Barnes, A. Superplastic forming 40 years and still growing. J. Mater. Eng. Perform. 2007, 16, 440–454. [Google Scholar] [CrossRef]
  2. Friedman, P.A.; Luckey, S.G.; Copple, W.B.; Allor, R.; Miller, C.E.; Young, C. Overview of superplastic forming research at ford motor company. J. Mater. Eng. Perform. 2004, 13, 670–677. [Google Scholar] [CrossRef]
  3. Abu-Farha, F.; Verma, R.; Hector, L.G. High temperature composite forming limit diagrams of four magnesium AZ31B sheets obtained by pneumatic stretching. J. Mater. Proc. Technol. 2012, 212, 1414–1429. [Google Scholar] [CrossRef]
  4. Mitukiewicz, G.; Antheshwara, K.; Zhou, G.; Mishra, R.K.; Jain, M.K. A new method of determining forming limit diagram for sheet materials by gas blow forming. J. Mater. Proc. Technol. 2014, 214, 2960–2970. [Google Scholar] [CrossRef]
  5. Banabic, D.; Vulcan, M.; Siegert, K. Bulge testing under constant and variable strain rates of superplastic aluminium alloys. CIRP Annals 2005, 54, 205–208. [Google Scholar] [CrossRef]
  6. Hill, R.C. A theory of the plastic bulging of a metal diaphragm by lateral pressure. Lond. Edinb. Dublin Philos. Mag. J. Sci. 1950, 41, 1133–1142. [Google Scholar] [CrossRef]
  7. Banabic, D.; Bălan, T.; Comşa, D.-S. Closed-form solution for bulging through elliptical dies. J. Mater. Proc. Technol. 2001, 115, 83–86. [Google Scholar] [CrossRef]
  8. Rong, H.; Hu, P.; Ying, L.; Hou, W.; Zhang, J. Thermal forming limit diagram (TFLD) of AA7075 aluminum alloy based on a modified continuum damage model: Experimental and theoretical investigations. Int. J. Mech. Sci. 2019, 156, 59–73. [Google Scholar] [CrossRef]
  9. Wang, N.; Ilinich, A.; Chen, M.; Luckey, G.; D’Amours, G. A comparison study on forming limit prediction methods for hot stamping of 7075 aluminum sheet. Int. J. Mech. Sci. 2019, 151, 444–460. [Google Scholar] [CrossRef]
  10. Shojaei, K.; Sajadifar, S.V.; Yapici, G.G. On the mechanical behavior of cold deformed aluminum 7075 alloy at elevated temperatures. Mater. Sci. Eng. A 2016, 670, 81–89. [Google Scholar] [CrossRef]
  11. Kim, H.; Kim, D.; Ahn, K.; Yoo, D.; Son, H.; Kim, G.; Chung, K. Inverse characterization method for mechanical properties of strain/strain-rate/temperature/temperature-history dependent steel sheets and its application for hot press forming. Metals Mater. Int. 2015, 21, 874–890. [Google Scholar] [CrossRef]
  12. Kim, H.; Yoon, J.W.; Chung, K.; Lee, M. A multiplicative plastic hardening model in consideration of strain softening and strain rate: Theoretical derivation and characterization of model parameters with simple tension and creep test. Int. J. Mech. Sci. 2020, 187, 105913. [Google Scholar] [CrossRef]
  13. Kim, H. Characterization Method for Hardening and Strain-Rate Sensitivity at Elevated Temperature Based on Uniaxial Tension and Creep Tests. Ph.D. Thesis, Seoul National University, Seoul, Korea, 2015. [Google Scholar]
Figure 1. Description of the geometric parameters (cavity radius ratio (k) and die profile radius (R)) of the die used in the pneumatic test for sheets.
Metals 10 01639 g001
Figure 2. The engineering stress–engineering strain curves (a) and the true stress–true strain curves (b) along with crosshead speeds for strain rate sensitivity measurement.
Metals 10 01639 g002
Figure 3. The dimension of the specimen utilized for uniaxial tensile test at elevated temperatures.
Metals 10 01639 g003
Figure 4. Comparison between hardening curve from Voce-type hardening law with power law rate sensitivity and hardening curve until ultimate tensile strength (UTS) directly obtained from the uniaxial tensile tests.
Metals 10 01639 g004
Figure 5. The fine mesh region and the coarse mesh region in the blank.
Metals 10 01639 g005
Figure 6. The boundary condition of the pneumatic test.
Metals 10 01639 g006
Figure 7. History of deformation mode along the die insert radius ratio (k) with regard to effective strain and triaxiality (a) and major strain and minor strain (b).
Metals 10 01639 g007
Figure 8. Comparison of deformation at the center element with those at the edge element with various die profile radii (R) for the circular die (solid line is for the center elements, dash line is for the edge elements, black color is for R = 5 mm, red color is for R = 10 mm, blue color is for R = 15 mm, and green color is for R = 20 mm).
Metals 10 01639 g008
Figure 9. Deformation history with various die profile radii (R) for the circular die with regard to effective strain and triaxiality (a) and major strain and minor strain (b).
Metals 10 01639 g009
Figure 10. Comparison of deformation at the center element with those at the edge element with various die profile radii (R) for the elliptic die (solid line is for the center elements, dash line is for the edge elements, black color is for R = 5 mm, red color is for R = 10 mm, blue color is for R = 15 mm, and green color is for R = 20 mm).
Metals 10 01639 g010
Figure 11. Deformation history with various die profile radii (R) for the elliptic die with regard to effective strain and triaxiality (a) and major strain and minor strain.
Metals 10 01639 g011
Figure 12. Pressure and time relationship of the circular die (a) and the elliptic die (b) for targeted strain rate at ω0 = 0.
Metals 10 01639 g012
Figure 13. Effective strain rate and effective strain result in numerical simulation for the circular die (a) and the elliptic die (b) at ω0 = 0.
Metals 10 01639 g013
Figure 14. Pressure and time relationship of the circular die (a) and the elliptic die (b) for targeted strain rate at ω0 = 1.
Metals 10 01639 g014
Figure 15. Effective strain rate and effective strain result in numerical simulation for the circular die (a) and the elliptic die (b) at ω0 = 1.
Metals 10 01639 g015
Figure 16. A geometric assumption to obtain coefficient of correction factor considering modified radius of the sphere in the circular die.
Metals 10 01639 g016
Figure 17. Pressure and time relationship of the circular die (a) and the elliptic die (b) for targeted strain rate at ω0 = 0.31.
Metals 10 01639 g017
Figure 18. Effective strain rate and effective strain result in numerical simulation for the circular die (a) and the elliptic die (b) at ω0 = 0.31.
Metals 10 01639 g018
Figure 19. The pneumatic forming dies for the circular die (a) and the elliptic die (b).
Metals 10 01639 g019
Figure 20. The blank dimensions for the circular die (a) and the elliptic die (b).
Metals 10 01639 g020
Figure 21. Photograph (a) and schematic view (b) of the pneumatic forming machine.
Metals 10 01639 g021
Figure 22. The blanks after pneumatic forming test for the circular die (a) and the elliptic die (b).
Metals 10 01639 g022
Figure 23. The shape and thickness distribution of the experimental and simulation results for the circular die at k = 1 in the x-direction (a) and y-direction (b).
Metals 10 01639 g023
Figure 24. The shape and thickness distribution of the experimental and simulation results for the elliptic die at k = 0.25 in the x-direction (a) and the y-direction (b).
Metals 10 01639 g024
Table 1. The mechanical (engineering) properties of 7075 aluminum alloy sheets at 400 °C.
Temperature (°C)Crosshead Speed (mm/s)E (GPa)Poisson’s RatioUTS (MPa)Elongation (%)
UTSTotal
4002.051.820.3576.151.4882.36
0.255.660.9865.85
0.0240.141.2544.85
Table 2. Parameters of Voce-type hardening law and m-value.
Temperature (°C)K (MPa)C (MPa)pm ε ¯ ˙ 0 (s−1)
40038.631.681710.140.001
Table 3. The conditions for parametric study of the die insert radius ratio (k).
Die Insert Radius Ratios (k)Major Die Radius (a0)Minor Die Radius (b0)Die Profile Radius (R)Pressure Values
150.0 mm50.0 mm15.0 mm1 MPa
0.7537.5 mm2 MPa
0.525.0 mm2 MPa
0.2512.5 mm4 MPa
0.15.0 mm6 MPa
Table 4. The parametric study conditions for the circular and elliptic die profile radius.
Die Insert Radius Ratio (k)Die Profile Radius (R)Major Die Radius (a0)Pressure Value
1
(Circular die)
5.0 mm50.0 mm1 MPa
10.0 mm
15.0 mm
20.0 mm
0.25
(Elliptic die)
5.0 mm4 MPa
10.0 mm
15.0 mm
20.0 mm
Publisher’s Note: MDPI stays neutral with regard to jurisdictional claims in published maps and institutional affiliations.

