Article

Cyclic Behavior of Hollow Section Beam–Column Moment Connection: Experimental and Numerical Study

1
Department of Civil Engineering, Universidad Católica de la Santísima Concepción, Concepcion 4090541, Chile
2
Faculty of Engineering, Materials and Structural Models Institute, Universidad Central de Venezuela, Caracas 1051, Venezuela
3
Departamento de Obras Civiles y Geología, Facultad de Ingeniería, Universidad Católica de Temuco, Temuco 4780000, Chile
4
Department of Civil Engineering, Universidad de Ibagué, Tolima 730002, Colombia
*
Author to whom correspondence should be addressed.
Metals 2020, 10(12), 1608; https://doi.org/10.3390/met10121608
Submission received: 7 October 2020 / Revised: 24 November 2020 / Accepted: 27 November 2020 / Published: 30 November 2020
(This article belongs to the Special Issue Advances in Structural Steel Research)

Abstract

:
Steel buildings with tubular columns showed a satisfactory performance during the Honshu (2011) earthquake, unlike steel buildings in the 1994 Northridge and 1995 Kobe earthquakes, where welded moment connections showed damage in their joints. In this research, a lateral joint using a hollow structural section (HSS)-beam and HSS-column subjected to cyclic displacement was performed. Three large-scale specimens were tested and a numerical model was calibrated, reaching a good adjustment. Later, several configurations of beams and columns were evaluated using finite element (FE) models from the numerical model previously calibrated. A flexural resistance higher 0.80 Mp at 0.04 [rad] was obtained for all cases studied. The ductility factor in the 3 specimens was lower than 2.5, therefore a non-ductile behavior was controlled in the connection. This aspect is very important although a 0.8 Mp at 0.04 [rad] was achieved. Finally, the typical welded moment connection can be improved using the bolted moment connection, which allows the concentration of inelastic incursion in the beam compared with the welded solution. However, a non-ductile behavior derived from local buckling in flanges of a tubular beam can affect the seismic performance.

1. Introduction

Steel moment frames have been frequently used in seismic zones. In particular, steel buildings with tubular columns showed a satisfactory performance during the Honshu (2011) earthquake, unlike steel buildings in the 1994 Northridge and 1995 Kobe earthquakes, where welded moment connections showed damage in their joints, such as was reported in the SAC project (The SAC project is the experimental research funded by Federal Emergency Management Agency of United States of America to solve the problem of brittle behavior of welded steel frame structures during the Northridge, 1994, Earthquake; the name of this project is derived from the first letter of the following Institutions: “SEA”, Structural Engineers Association of California, “ATC”, Applied Technology Council and “CUREE”, Consortium of Universities for Research in Earthquake Engineering). Since then, several research projects have been performed on welded and bolted moment connections between a wide-flange beam to a wide-flange column, and a wide-flange beam to a hollow structural section column or box section column.
Hollow structural sections (HSS) are widely used in Asia, Europe and Latin America. A higher moment of inertia around the principal axis in comparison to wide flange sections are provided by hollow structural sections. This condition has a positive impact on the seismic behavior and economy of steel buildings. Likewise, a high lateral torsional stiffness is obtained in tubular sections with respect to wide-flange sections, which improves the lateral torsional buckling resistance in the connection [1,2].
The research conducted by [3] studied a design model for bolted moment connections using rectangular hollow sections. Various yield line mechanism for two lines of bolts in the end-plate were obtained and calibrated from experimental study. This model is a simple method for end-plate design with tubular beams.
A general formulation for the analysis of steel hollow structural beams subjected to biaxial bending was studied by [4]. The model was developed considering lumped damage theory. In order to calibrate the model, experimental tests were performed. The model was evaluated by the numerical simulation of these tests obtaining an acceptable adjustment between the experimental tests and the numerical simulations. Later, a numerical and experimental study of the behavior of thin-walled circular and rectangular steel sections and a tridimensional framed structure was conducted in [5]. The experimental results were used to confirm the validity of the lumped damage mechanical theory to model the structural behavior after local buckling. The level of local buckling was obtained by a damage vector.
The behavior of HSS-to-HSS moment connections under cyclic loads was studied by [6,7,8]. A new proposal for a fully welded connection incorporating plates was obtained. The welded plates ensure plastic hinges in beams, avoiding the occurrence of non-ductile failure mechanisms in elements of connection and column. However, field welding is required. A numerical and experimental study of a concrete-filled steel tubular (CFT) column to I-beam connections was performed by [9]. The results showed that external stiffeners combined with internal shear stiffeners improve the hysteretic behavior of CFT columns to I-beam connections.
A new steel moment connection named the SidePlate moment connection (patented) for seismic loading was studied by [10]. The test results showed higher levels of strength, stiffness and ductility in the connection, complying with the requirements established in seismic provisions. Later, research performed by [11] studied a bolted moment connection considering a bolted T-stub and reduce beam section. The results showed a similar moment capacity and dissipated energy compared to the T-stub connection.
A new moment connection with reduced beam section connection (tubular web RBS connection, TW-RBS) was conducted by [12]. The results showed that TW-RBS reduced the flexural capacity of the beam, allowing a ductile failure mechanism in the beam-to-column connection. On the other hand, research performed by [13] studied the seismic behavior of the ConXtech® ConXLTM moment connection using a finite element model (FEM). The behavior of concrete filled hollow columns was examined. The results obtained showed a satisfactory performance according to requirements in [14]. In this sense, different ConXtech® ConXLTM configurations of the connection without concrete filling in the column were tested obtaining a ductile failure mode in a beam for axial load less than 0.4 the capacity of the column. However, non-ductile failure modes were obtained with increases in the axial load level.
Similarly, [15] studied an H-beam and H-column bolted moment connection. In this case, beams and columns were connected by an internal diaphragm. The results showed an influence of slip in cover plates in hysteretic behavior with pinching of the hysteretic curve, however a 4% drift could be sustained by the connection.
In the research conducted by [16], a new moment connection with I-beam connected to a HSS-column through an end-plate (EP) and outer diaphragm was proposed. A 16% thickness reduction of the plate was obtained from a new yield line pattern calibrated and validated with numerical and experimental study. The results showed that the EP-HSS reached a 5% drift, ductile failure mechanism in beam and hysteretic behavior that satisfied the requirements of [14].
Furthermore, a moment connection with blind bolts and square hollow column subject to monotonic load was studied by [17]. The numerical and experimental study showed a higher influence of end-plate and beam size in moment capacity and rotational stiffness. Similar research using blind bolts in moment connections was performed by [18]. This investigation studied the seismic performance of end-plate moment connection with concrete-filled steel tubular (CFST) columns. The results showed high ductility levels and adequate dissipation energy according to requirements in seismic zones.
In the study conducted by [19], a moment connection with concrete filled tube beam to concrete filled tube column was proposed. The experimental results showed the estimation of the embedment length required to achieve the nominal flexural capacity. Likewise, research conducted by [20], studied composite beams connected to HSS-columns. The results obtained showed the important influence of width-to-thickness ratio in the behavior of HSS column and the flexural capacity of the connection. The rotation capacity of the composite beam was reduced to 50% of the capacity of the steel beam. Additionally, the experimental tests showed the contribution of studs located on the loaded beam.
On the other hand, a methodology to obtain the seismic performance of typical Japanese beam-to-column joints was performed by [21]. An empirical equation to calculate the slip-critical moment of connections was proposed. Additionally, a study conducted by [22] evaluated the influence of weld in the fracture behavior of connections using high-strength steel. The new design proposed improved the behavior of the connections.
Recently, a moment connection with internal diaphragms to a concrete-filled steel tube was performed by [23]. The results showed a poor behavior of the moment connection subjected to seismic loads. Additionally, [24] studied a typical cold-formed moment connection. The results showed the importance of bolt pretension due to a friction-slip mechanism, which improved the energy dissipation of the connection. Finally, an improved moment connection was studied by [25] in comparison to previous research performed by the author in [15]. In this study, a moment connection with an H-beam joined to an H-column was tested under seismic loads obtaining an acceptable hysteretic behavior and reaching good dissipation energy.
In order to explore the behavior of bolted moment connections with HSS members subjected to cyclic loads, a numerical and experimental study was performed. A lateral joint using HSS-beam to HSS-column, avoiding any field welding, was studied according to requirements established in [26]. This connection was subjected to cyclic displacements according to [26] and the cyclic behavior was evaluated from hysteretic response, stiffness, equivalent damping and dissipation energy reached.

2. Hollow Structural Section (HSS) Moment Connection

2.1. Description of HSS Moment Connection

In this research, the cyclic behavior of the HSS moment connection was studied to connect an HSS-beam with an HSS-column. Two end-plates were required, a first end-plate was welded directly to the beam (HSS200 × 70 × 4.3) and a second end-plate was welded to the column through outer diaphragms (vertical and horizontal), which were welded to column (HSS220 × 220 × 9). Later, both end-plates were bolted as is shown in Figure 1. The outer diaphragms were used to decrease the stresses in the face column derived from the beam as an alternative to welded connections to the face column, which have not achieved good results.
The maximum expected moment developed by the beam at the face of the column was considered in the design of moment connection. Consequently, the bolts were calculated to resist the maximum expected moment and shear of the beam, and the thickness of the end-plate was sized to avoid the prying action, which implies that the end-plates will exhibit a thick plate behavior. The outer diaphragms and welds were calculated to remain elastic when the flexural capacity of beam is reached. Additionally, the beam end-plate was sized following equations to determine the plate thickness, which were proposed and validated.

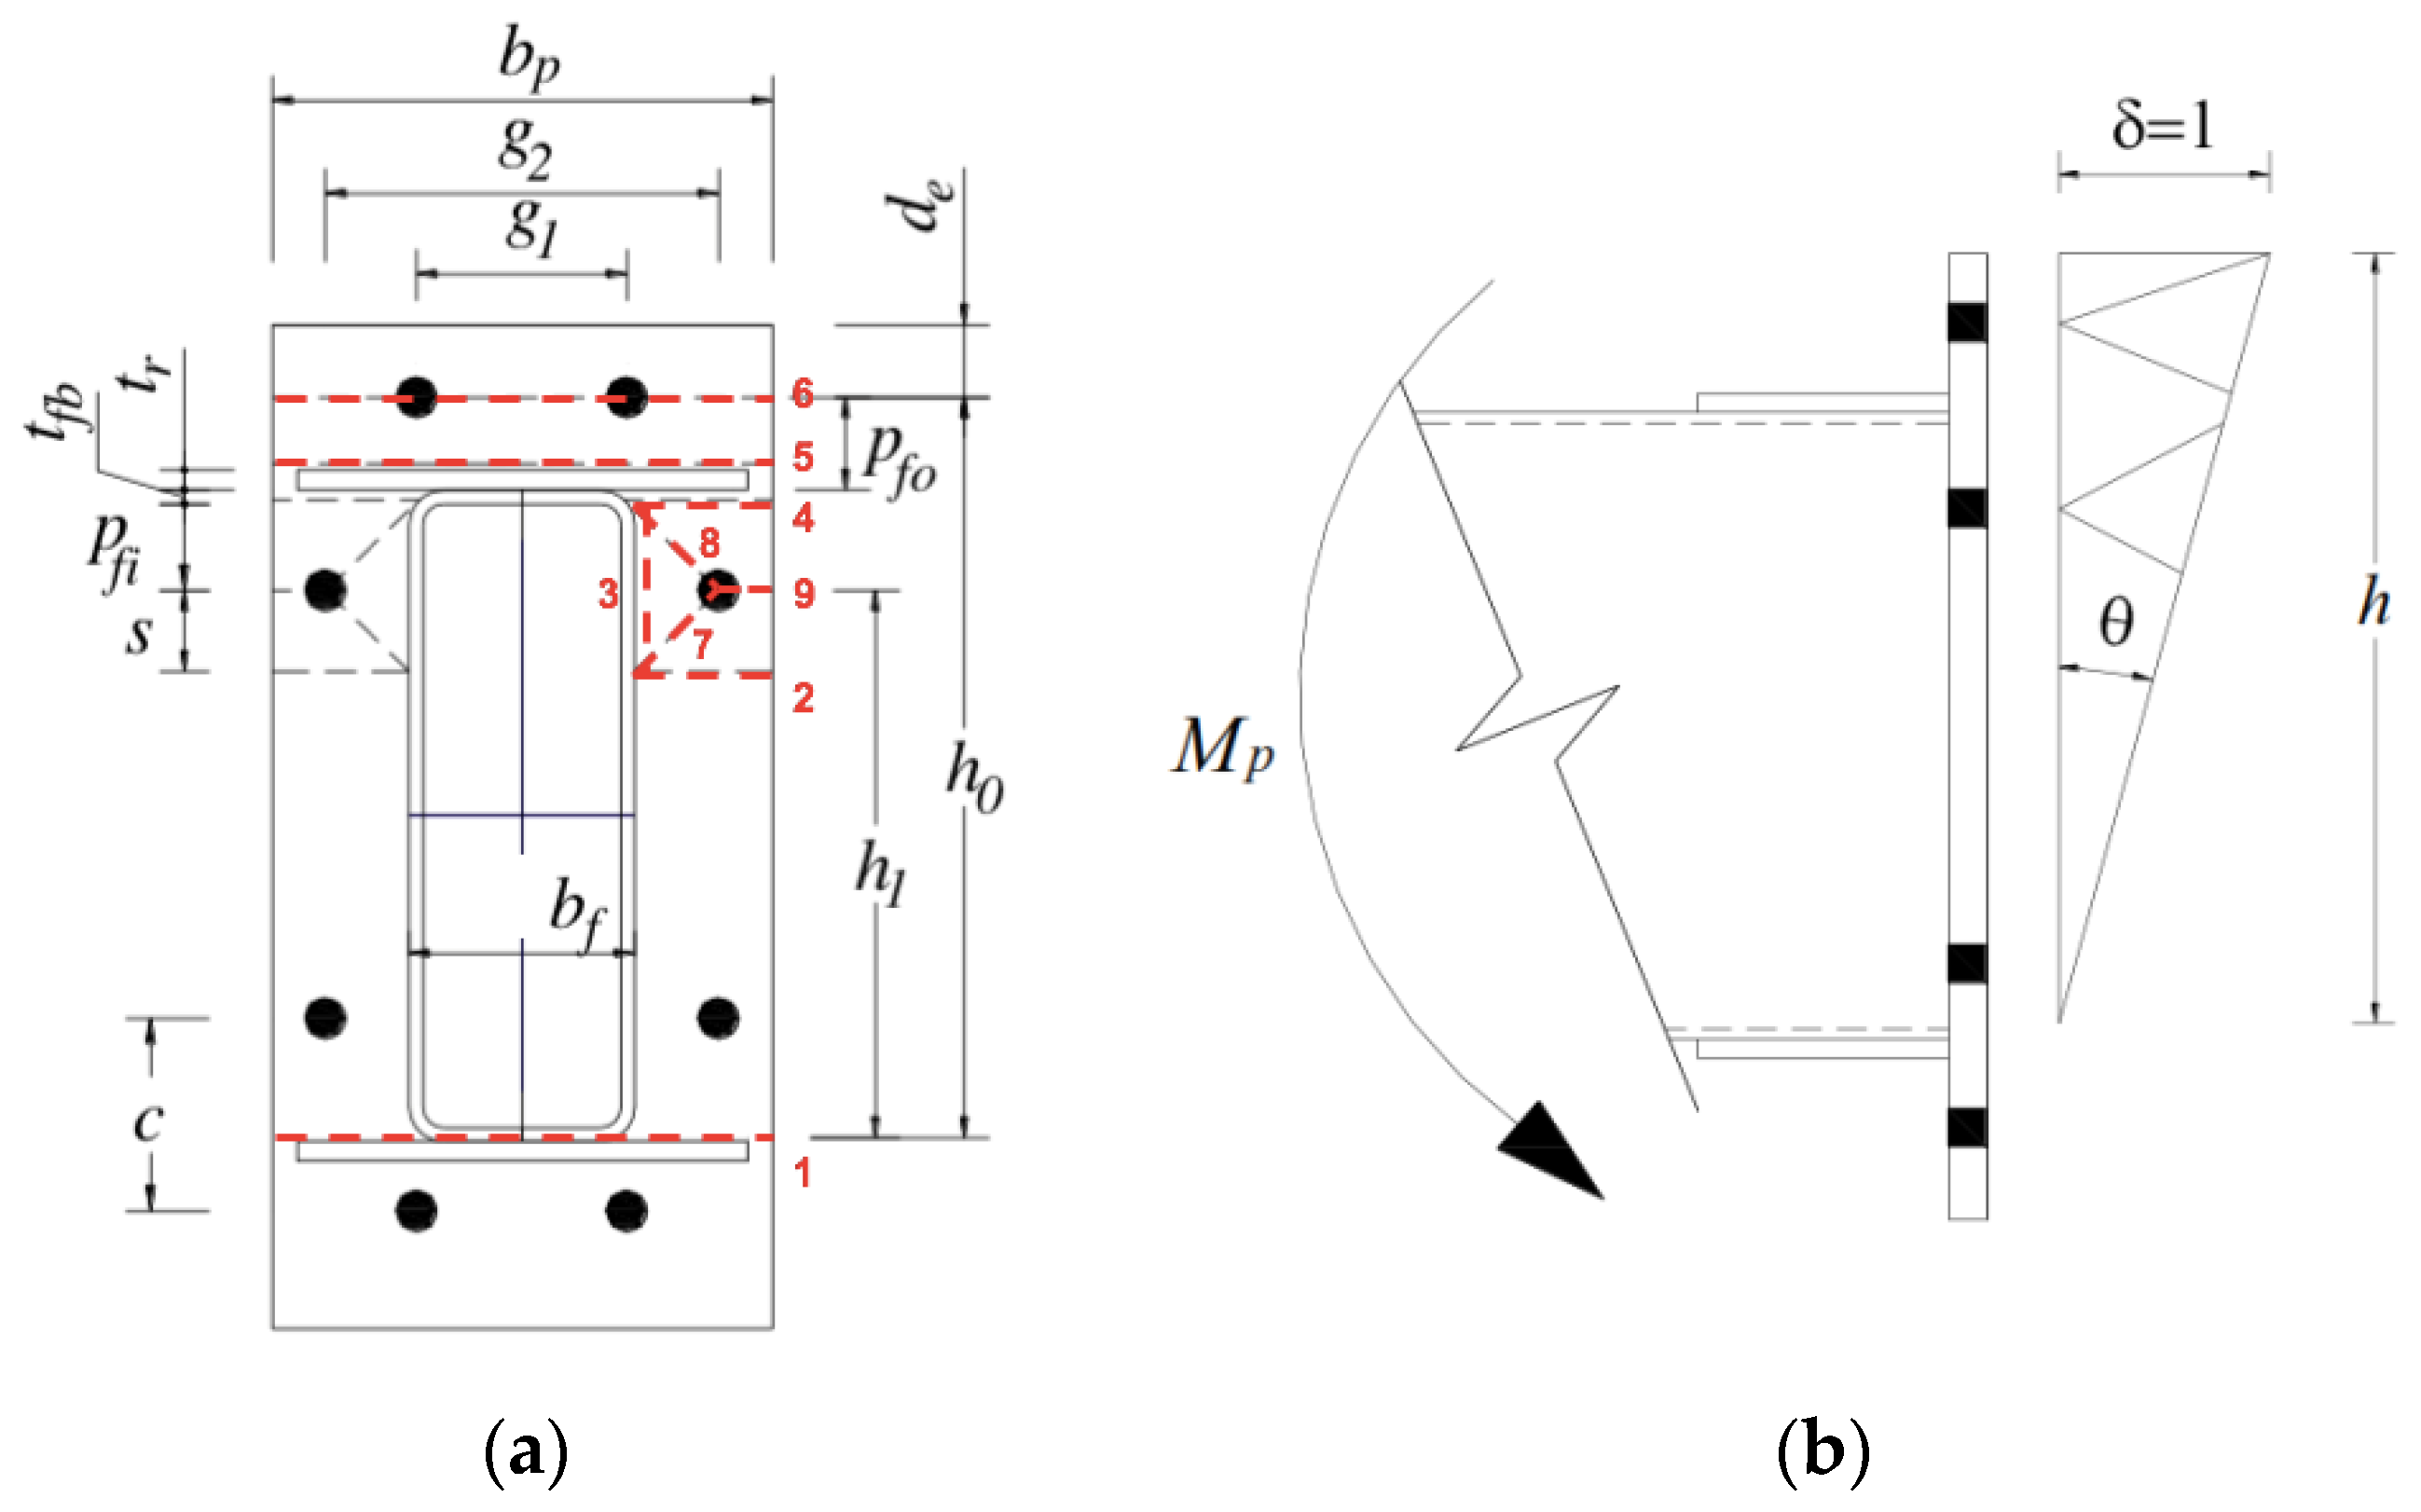
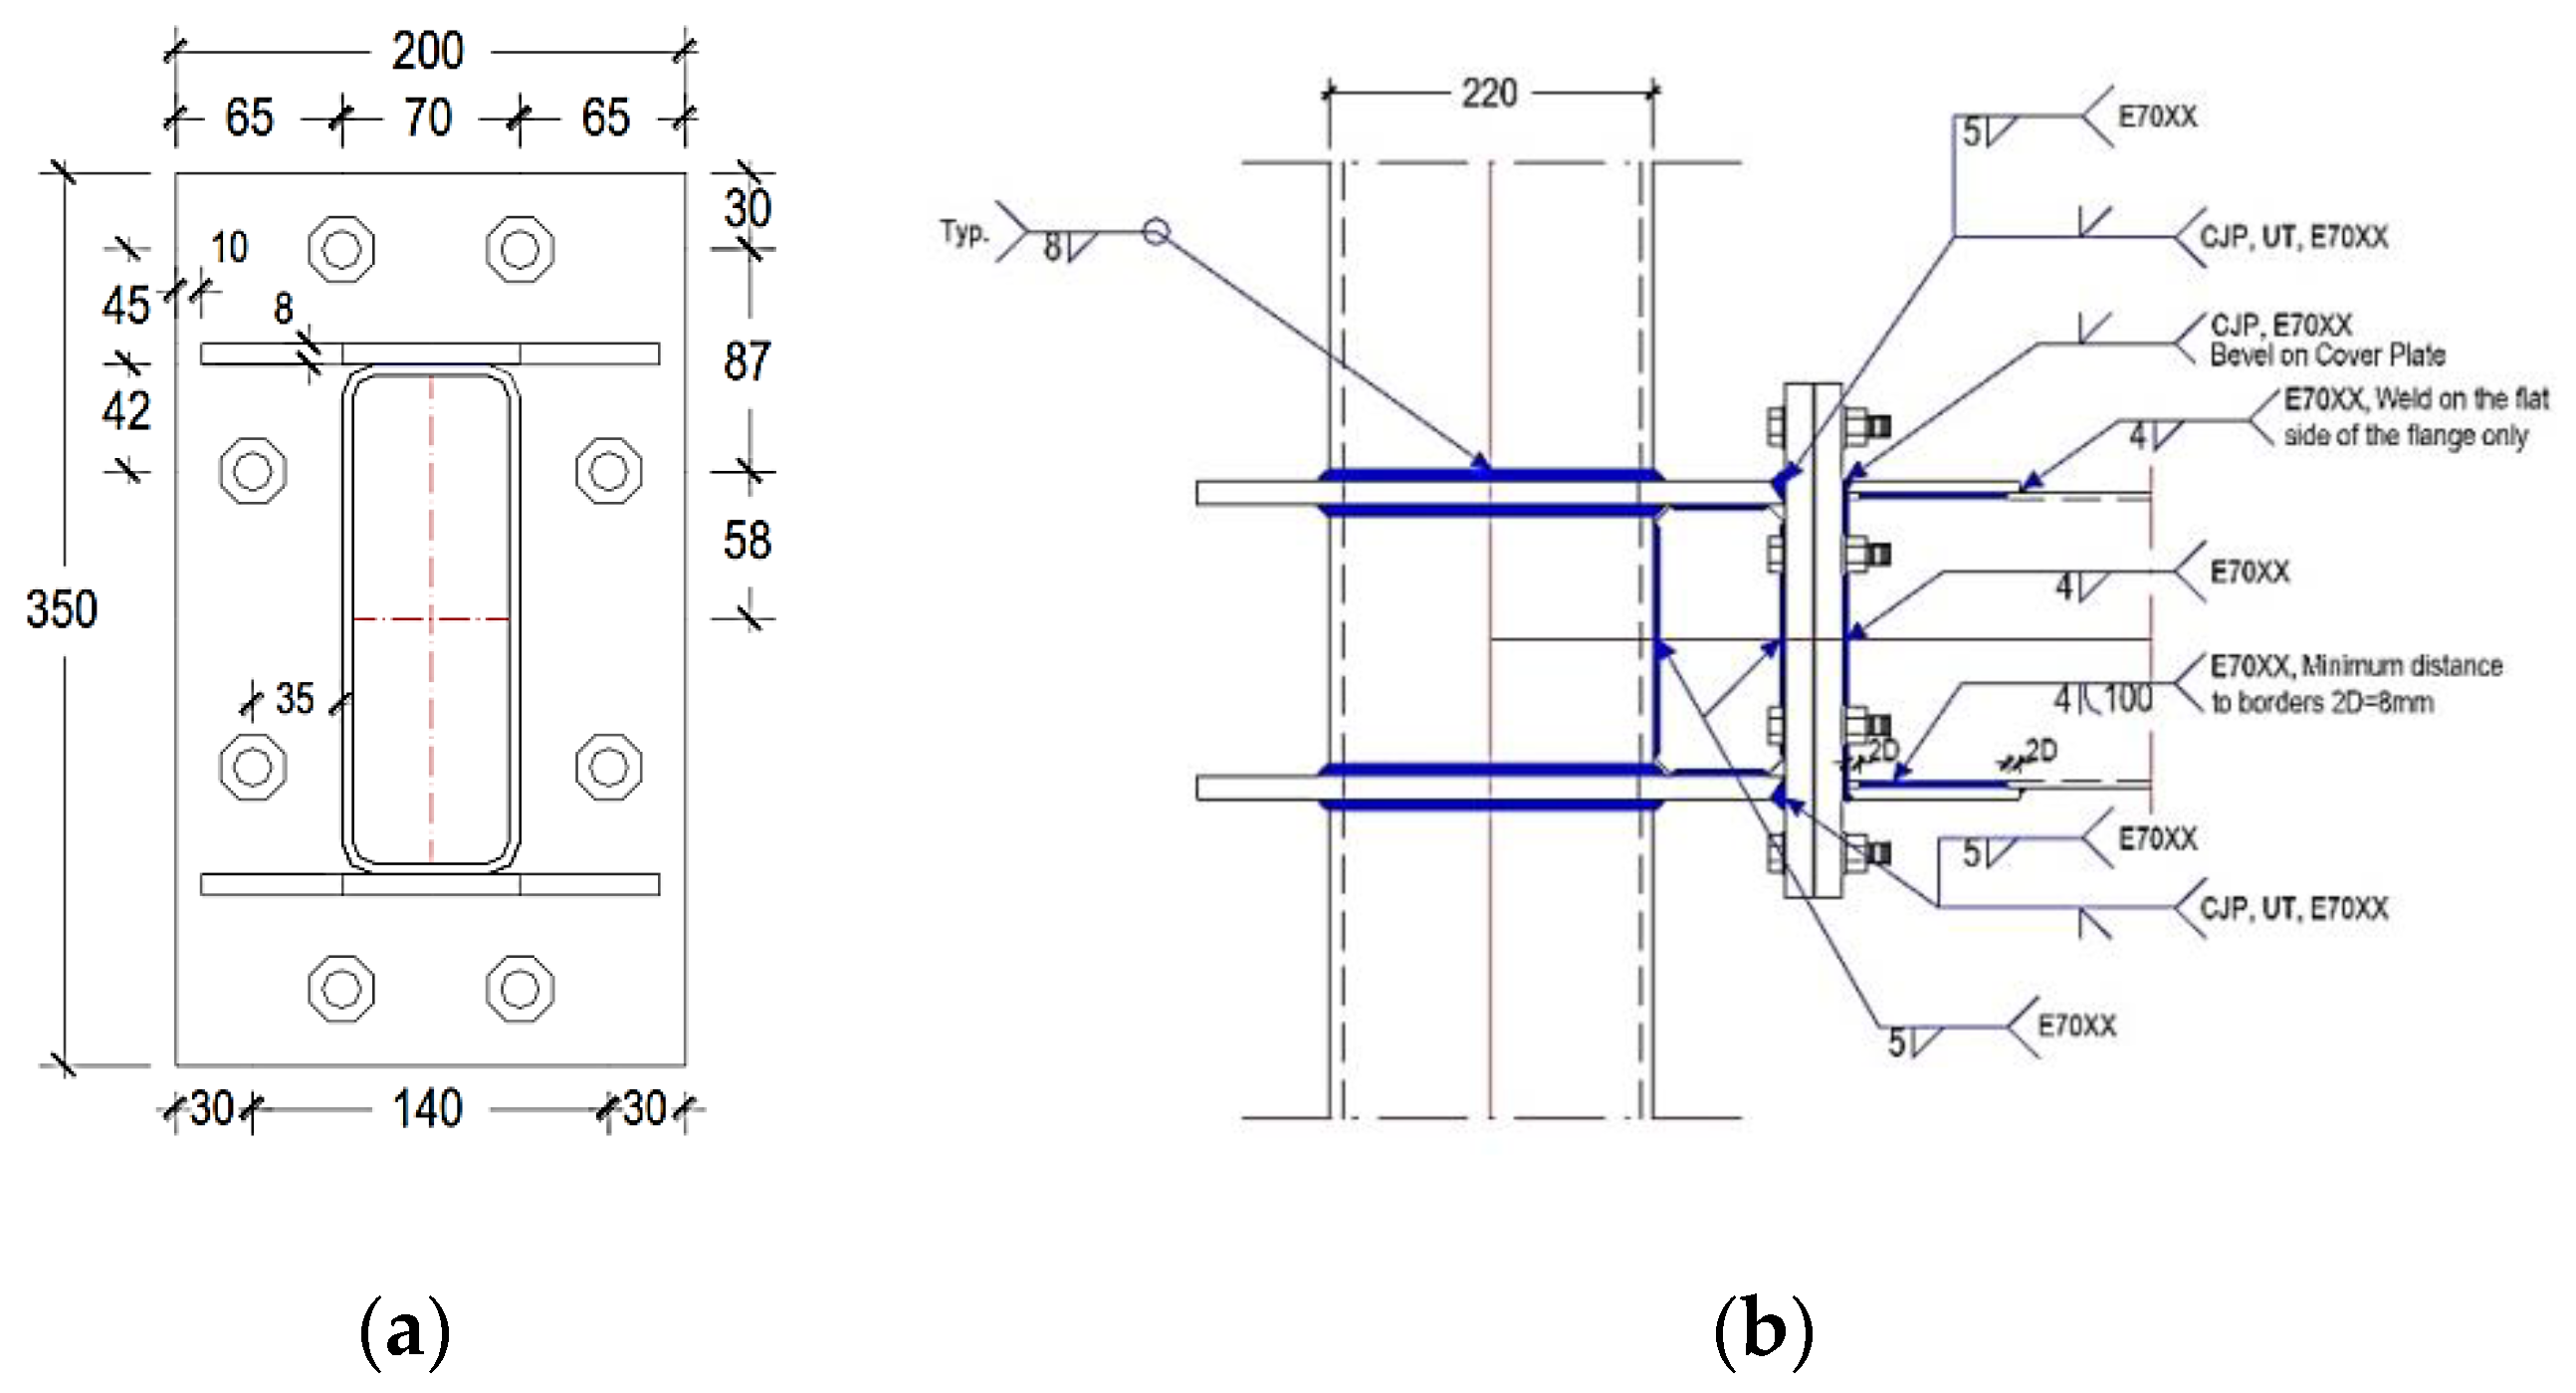
2.2. Proposed End-Plate Design

An analytical expression to calculate the capacity of the end-plate was obtained using yield line theory [27]. In this method, the external work (performed by external forces) is equal to internal work generated by the yield lines. The yield lines are shown in Figure 2a,b and the virtual rotations and lengths of yield lines of each mechanism are shown in the Table 1.
The end-plate yield line mechanisms are obtained through a procedure described considering the virtual displacements as follows:
δ 1 = θ ( d 2 )
δ 2 = θ ( h o p f o )
δ 3 = θ ( h i )
The internal work generated at the yield lines 1 to 9, defined in Figure 2a, is obtained by:
W I = ( θ i l i ) m p i
Substituting the values from Table 1 and simplifying algebraically, Equation (5) is obtained,
W I = θ × m p { 2 b p h o p f o + 2 h i [ ( b p b f ) ( 1 s ) + s ( 4 g 2 b f ) + 4 p f i g 2 b f + ( b p b f ) ( 1 p f i ) ] }
The external work is performed by the applied moment, resulting in the expression in Equation (6),
W E = M θ
Equating external and internal work, Equation (7) can be obtained,
M = m p { 2 b p h o p f o + 2 h i [ ( b p b f ) ( 1 s ) + s ( 4 g 2 b f ) + 4 p f i g 2 b f + ( b p b f ) ( 1 p f i ) ] }
To find the minimum upper bound, Equation (7) must be derived in terms of s and equated to zero, as follows:
M s = 0
s = 1 2 ( b p b f ) ( g 2 b f )
From Equation (7), the yield line mechanism parameter (Yp) can be defined by Equation (10).
Y p = 1 / 2 { b p h o p f o + h i [ ( b p b f ) ( 1 s ) + s ( 4 g 2 b f ) + 4 p f i g 2 b f + ( b p b f ) ( 1 p f i ) ] }
Equating the bending moment M on the connection to Mf, replacing mp (plastic moment) by the plastic moment capacity of a unit length of plate, and applying the strength factor ϕd, Equation (12) can be obtained. The expression to calculate the required end-plate thickness (tp) given by Equation (14) is found,
M = m p × Y p
m p = F y × t p 2 4
Substituting Equation (12) in Equation (11),
M = F y × t p 2 4 × Y p
t p = M / F y × Y p
We substitute M by 1.11Mf, where (1.11) is a factor to avoid the prying in the end-plate. Additionally, applying the strength factor ϕd to the nominal strength, the flexural strength given by Equation (15) is obtained,
t p = 1.11 × M f / d F y × Y p
A list of all abbreviations used are described at the end of this paper.

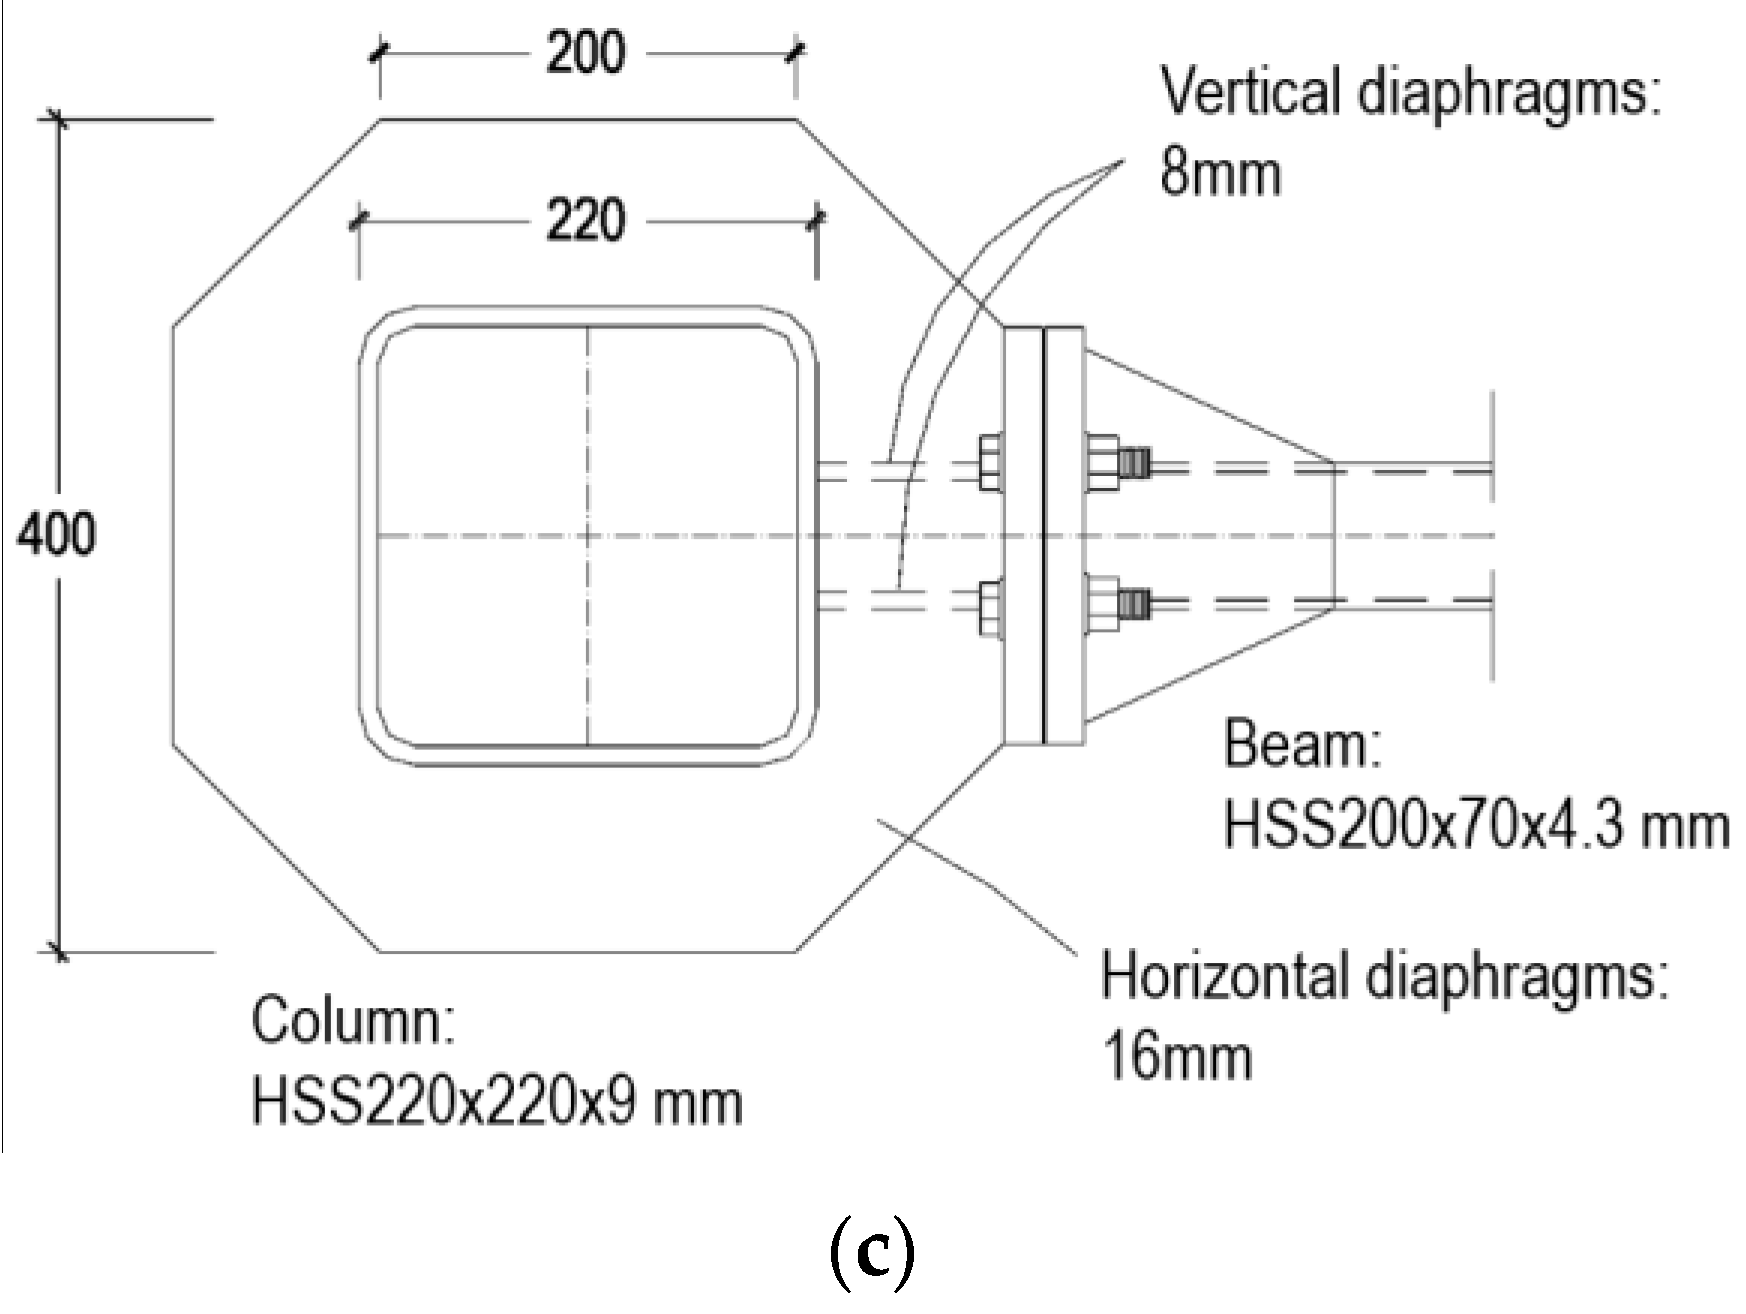
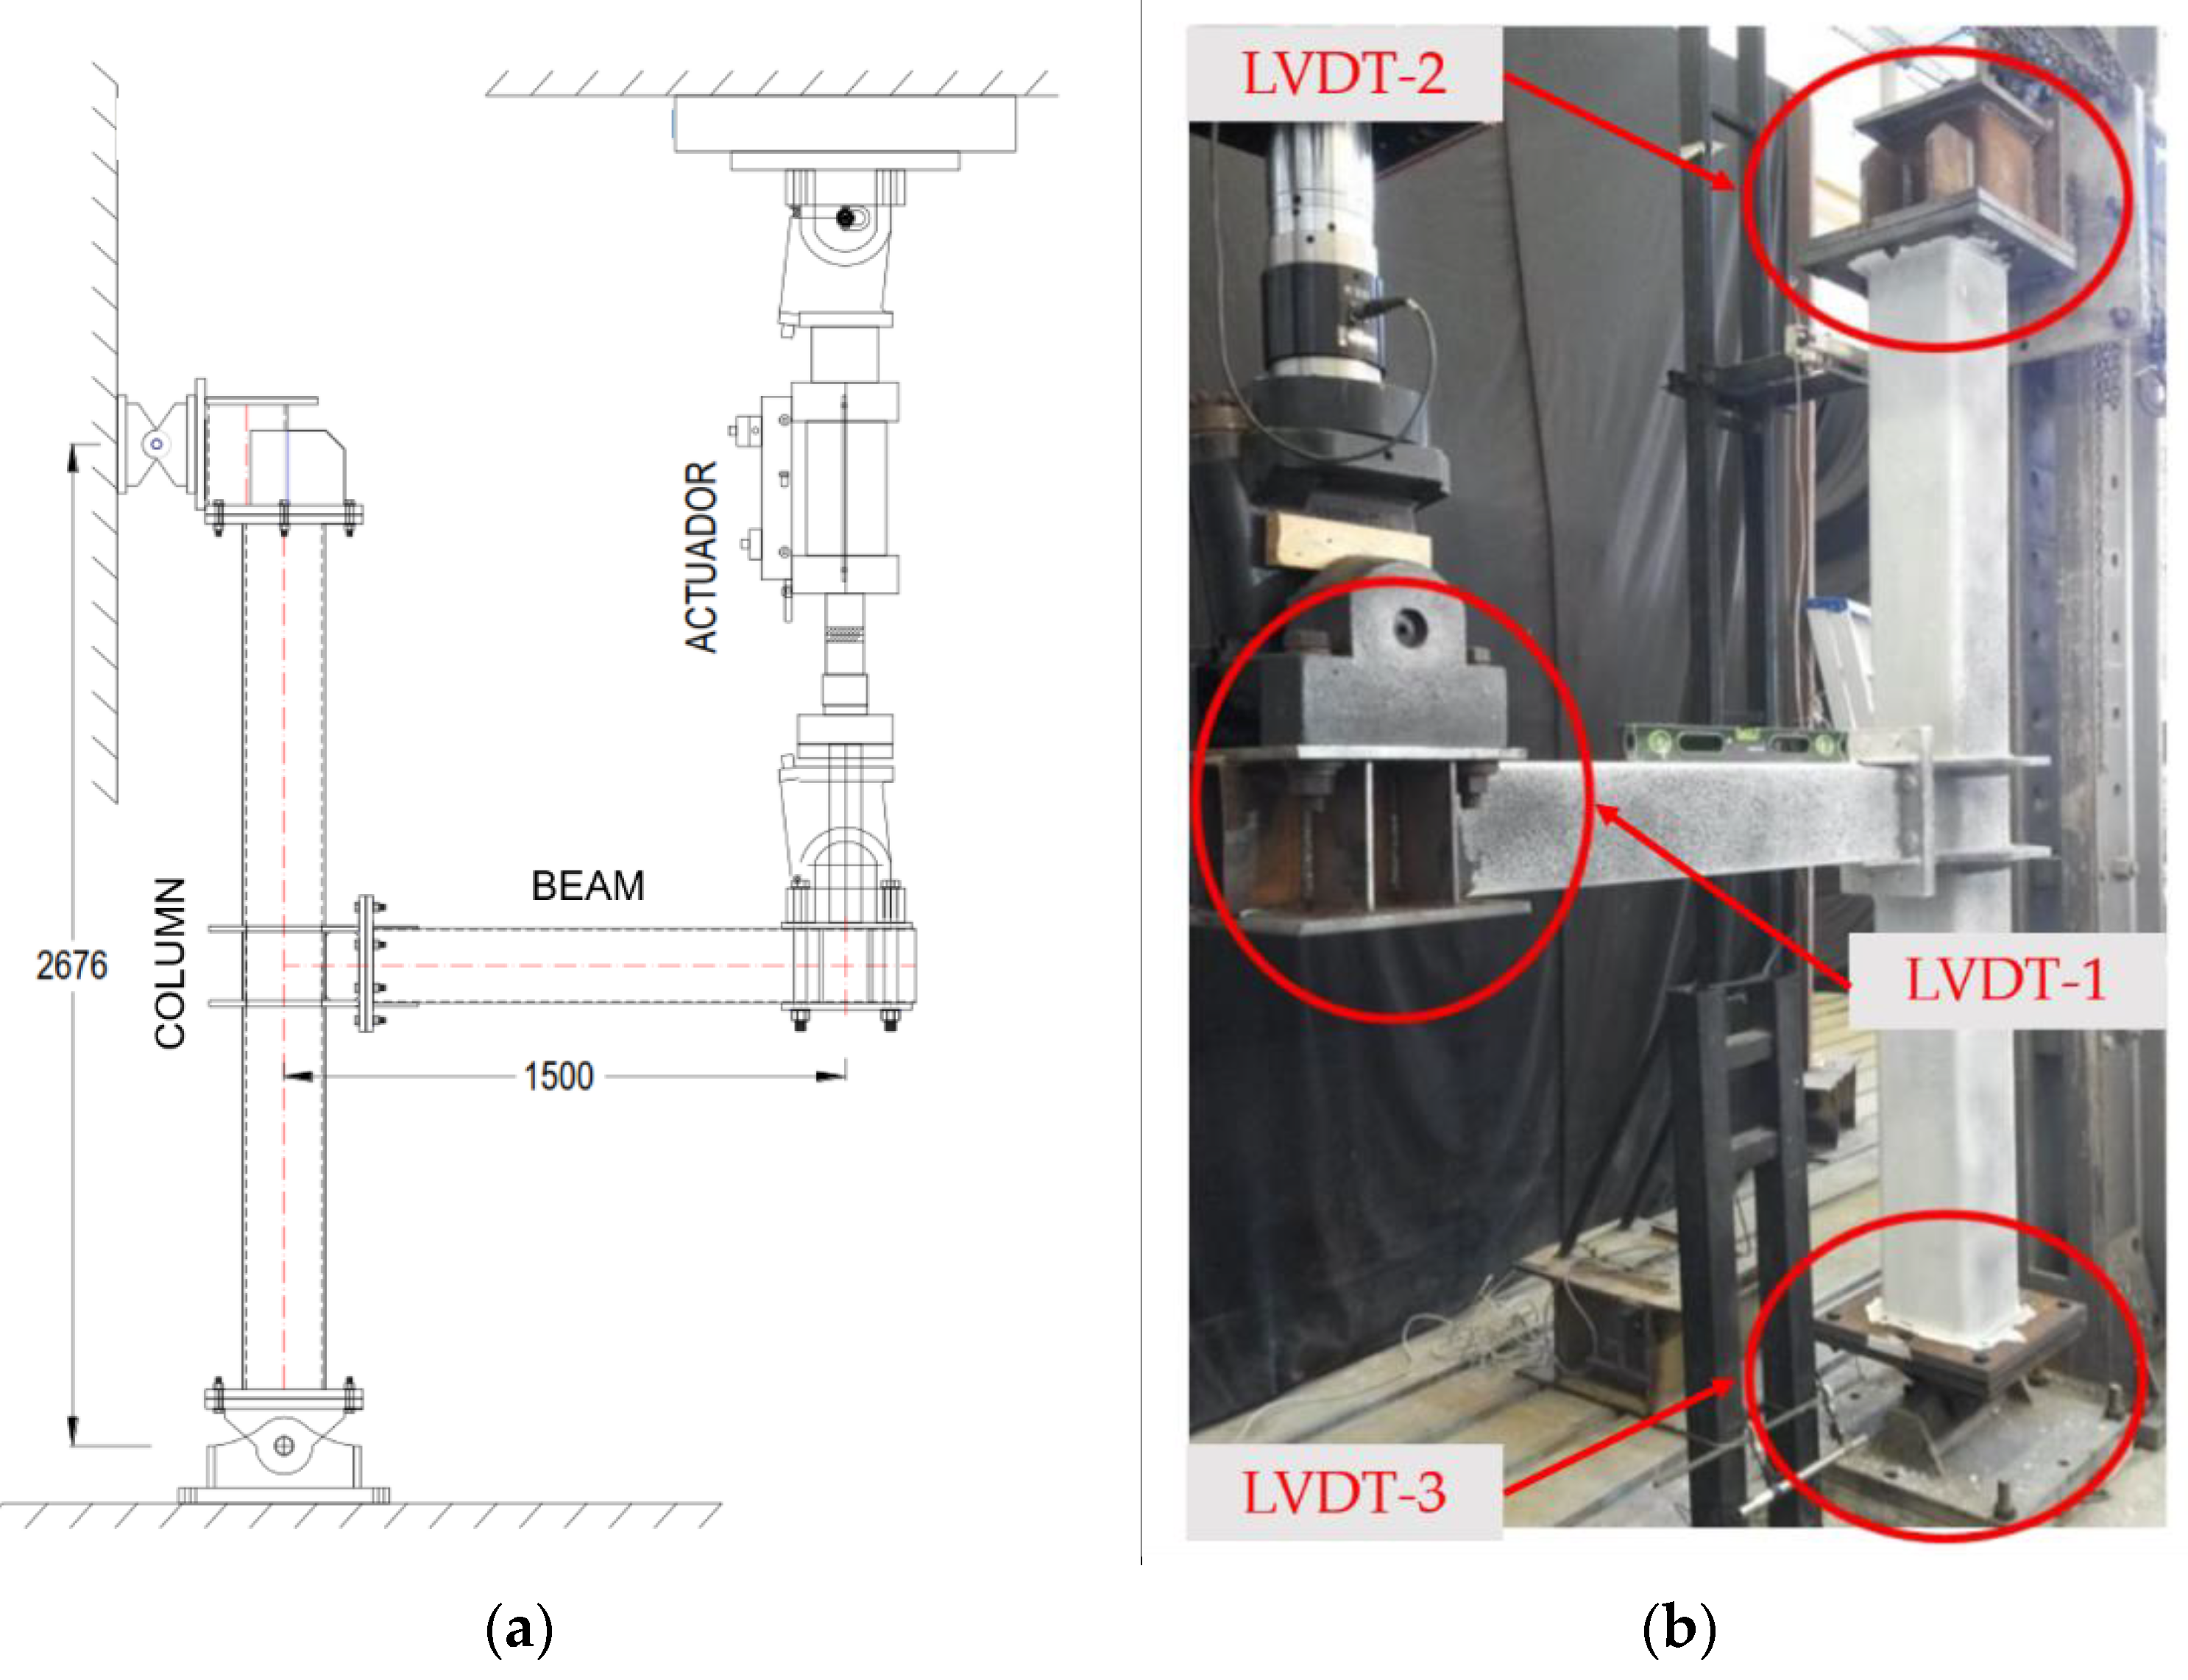
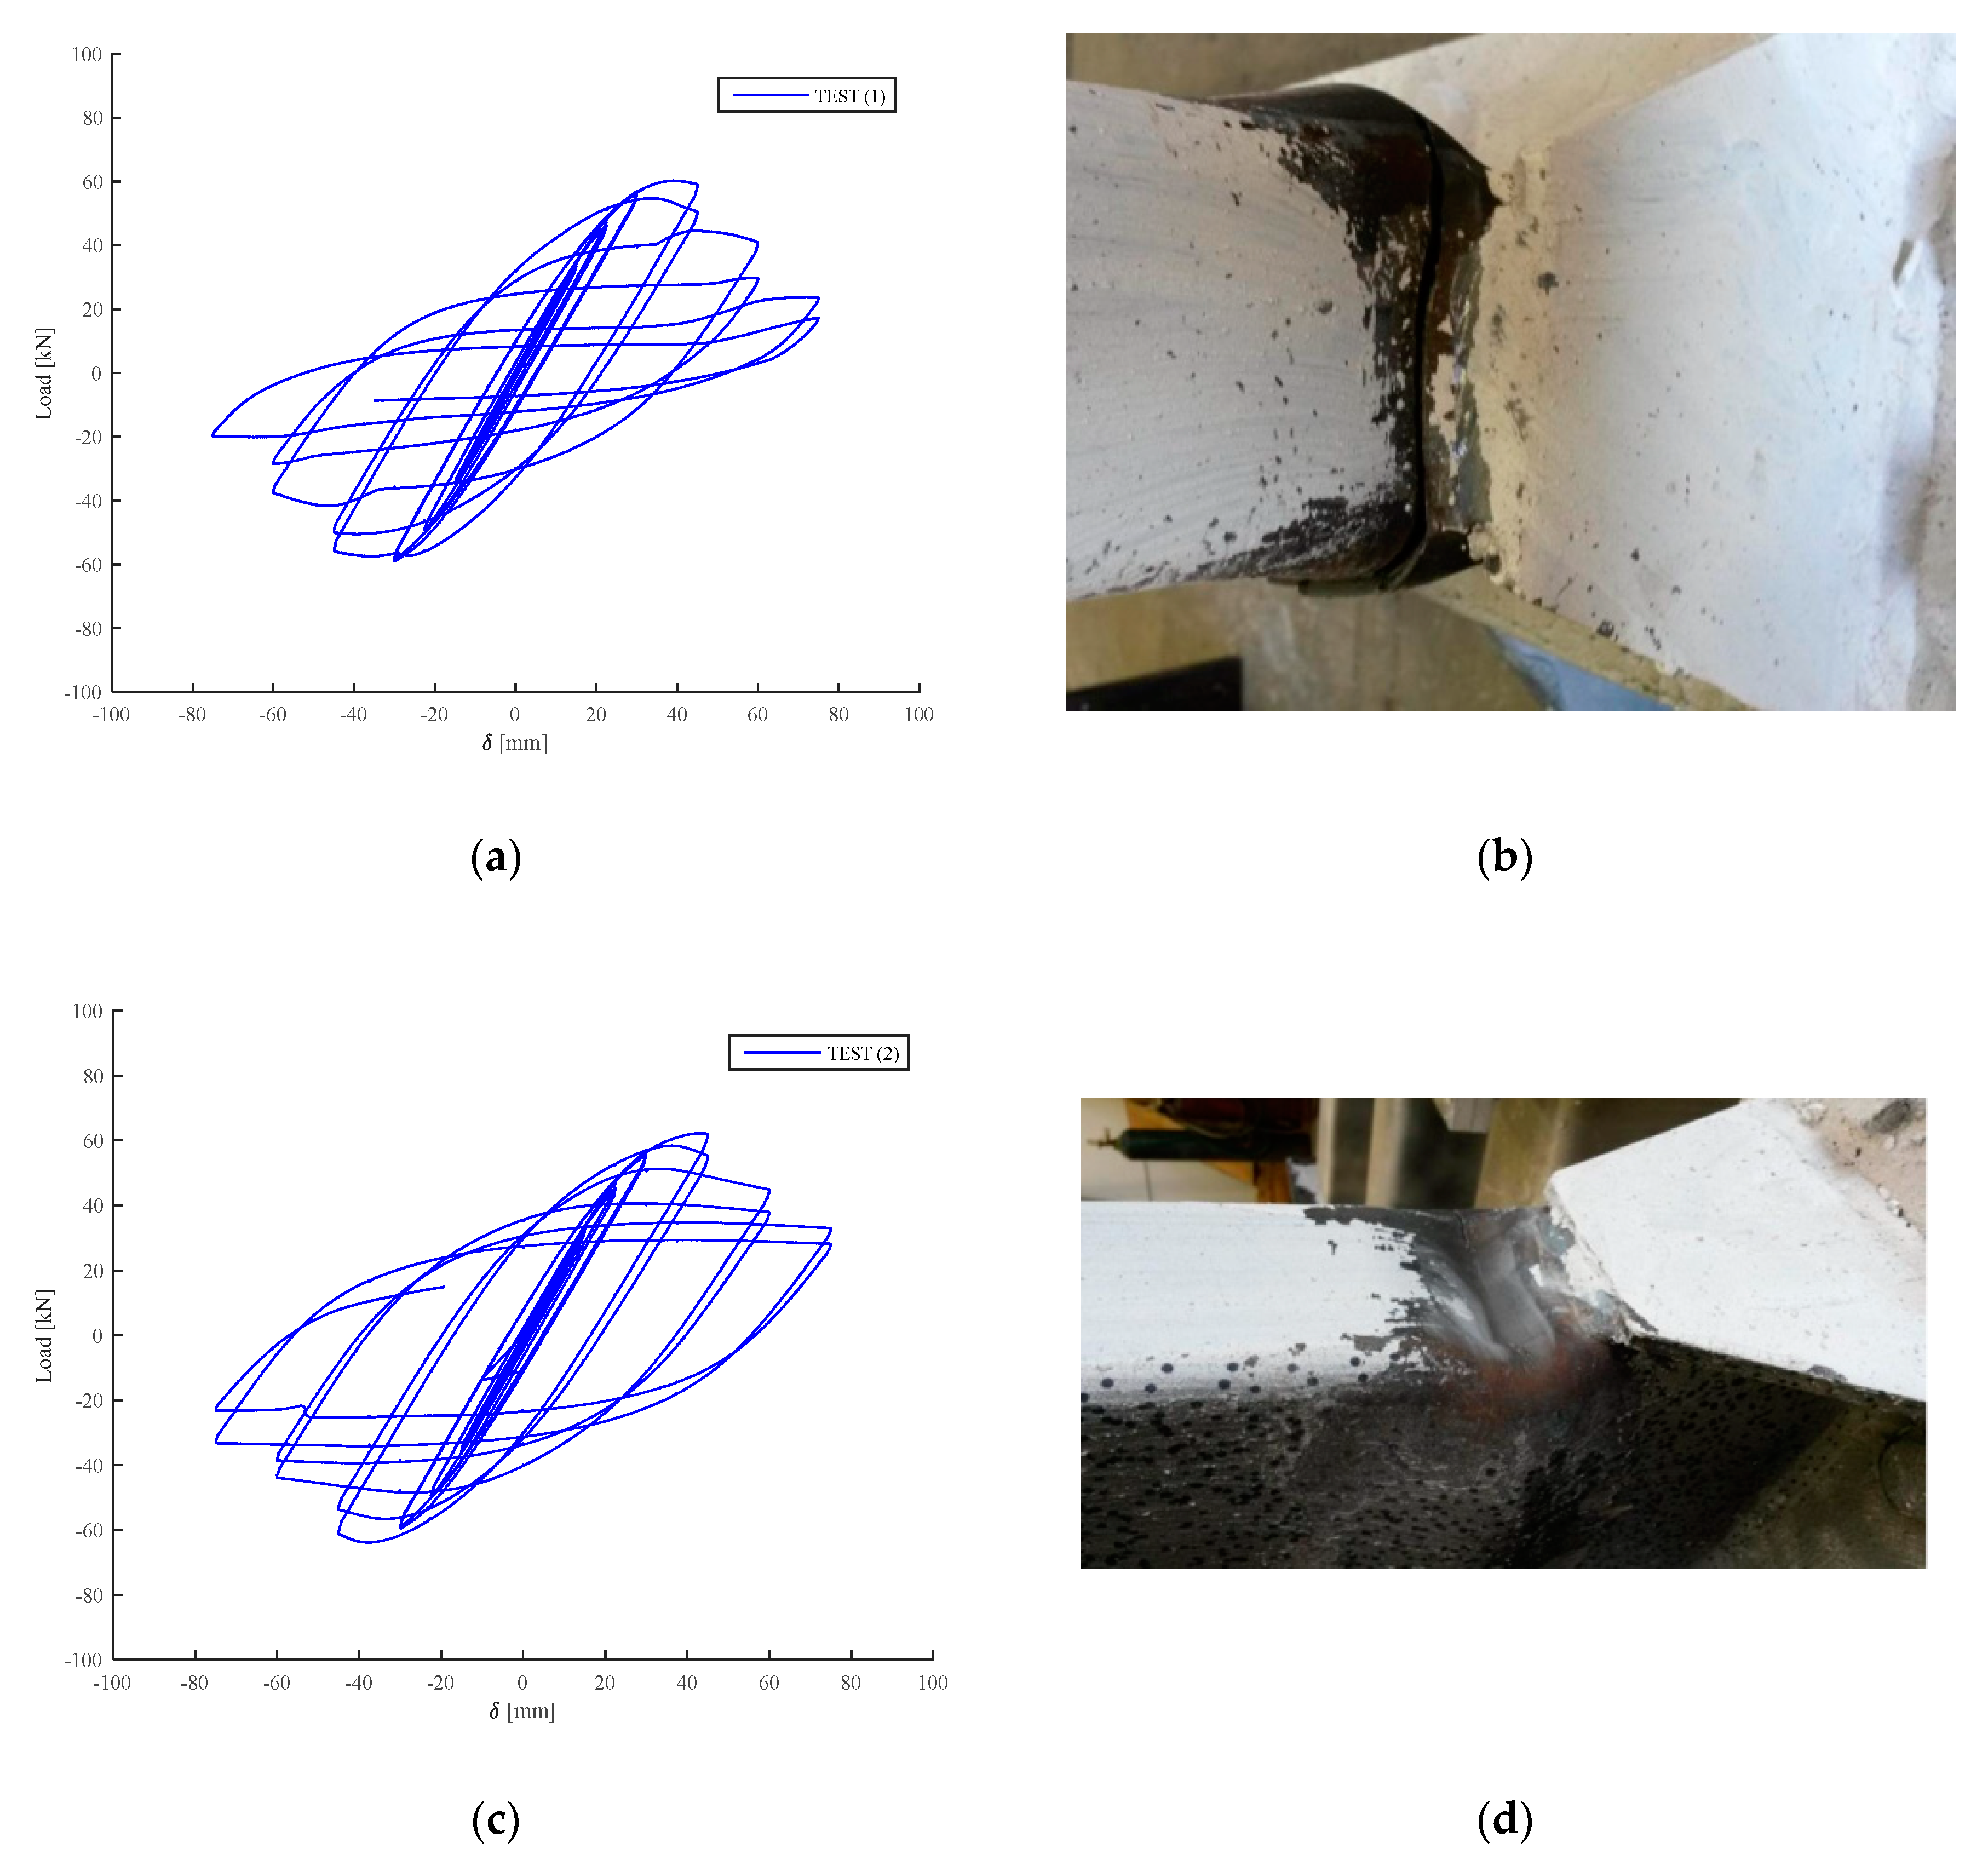
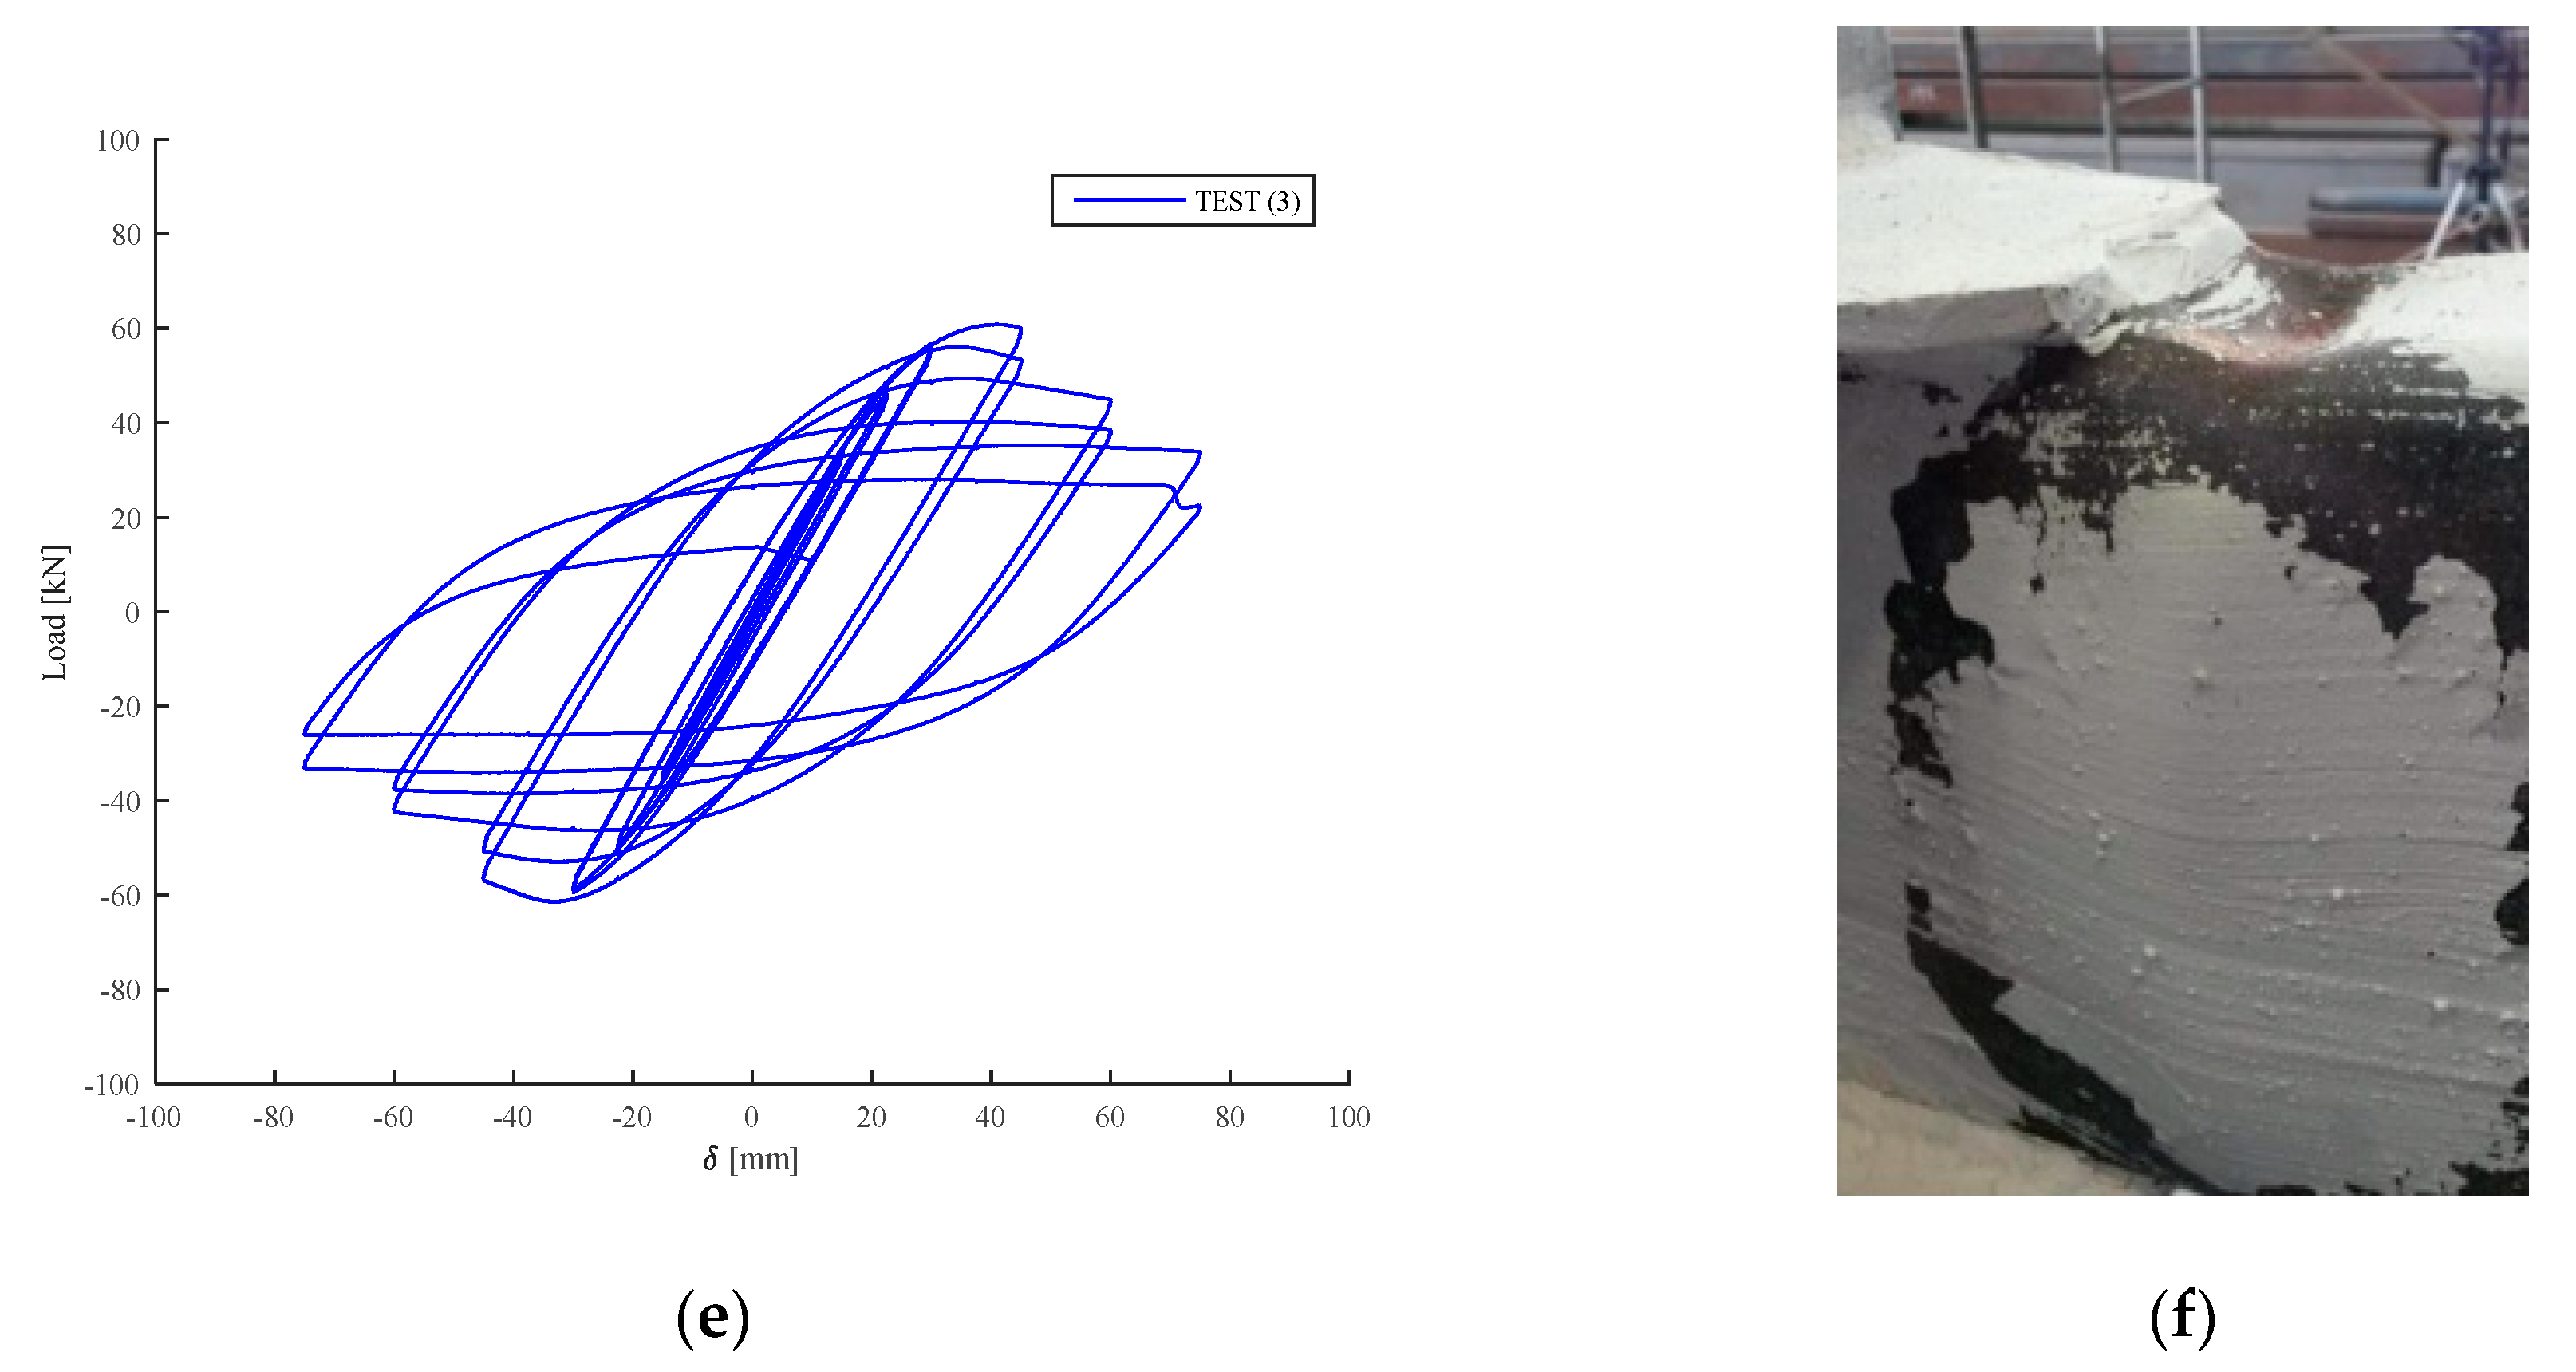
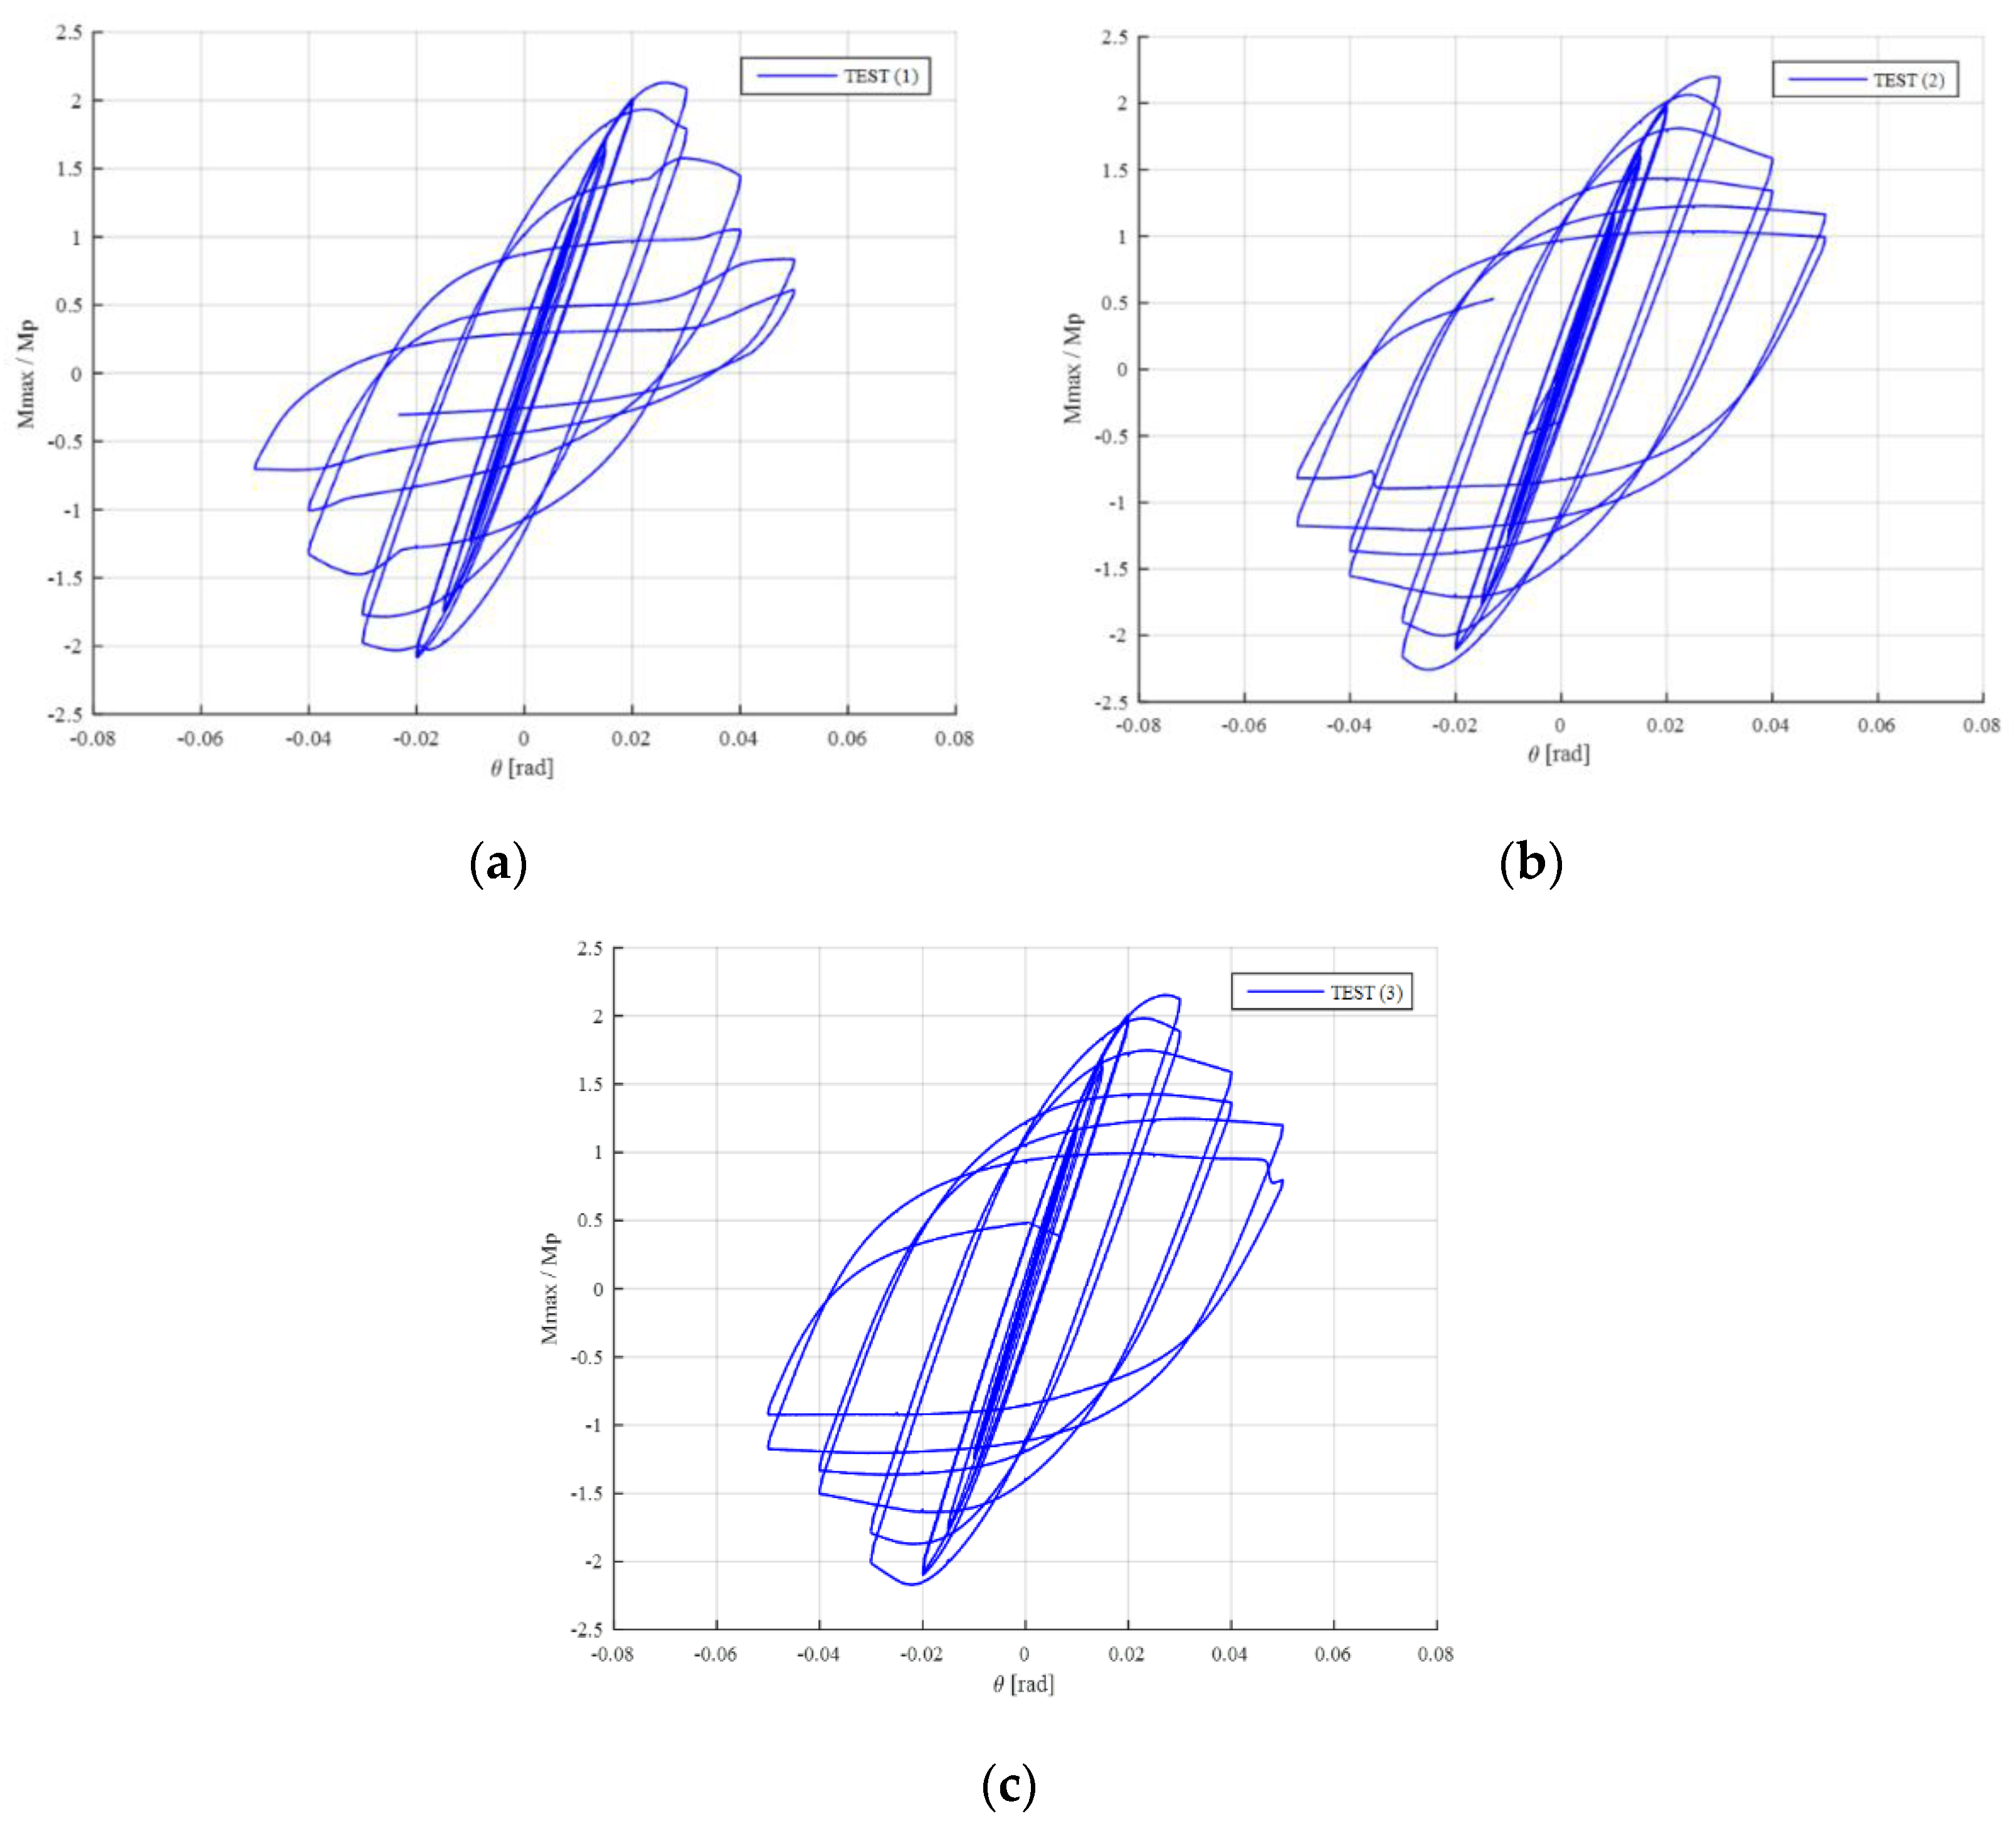
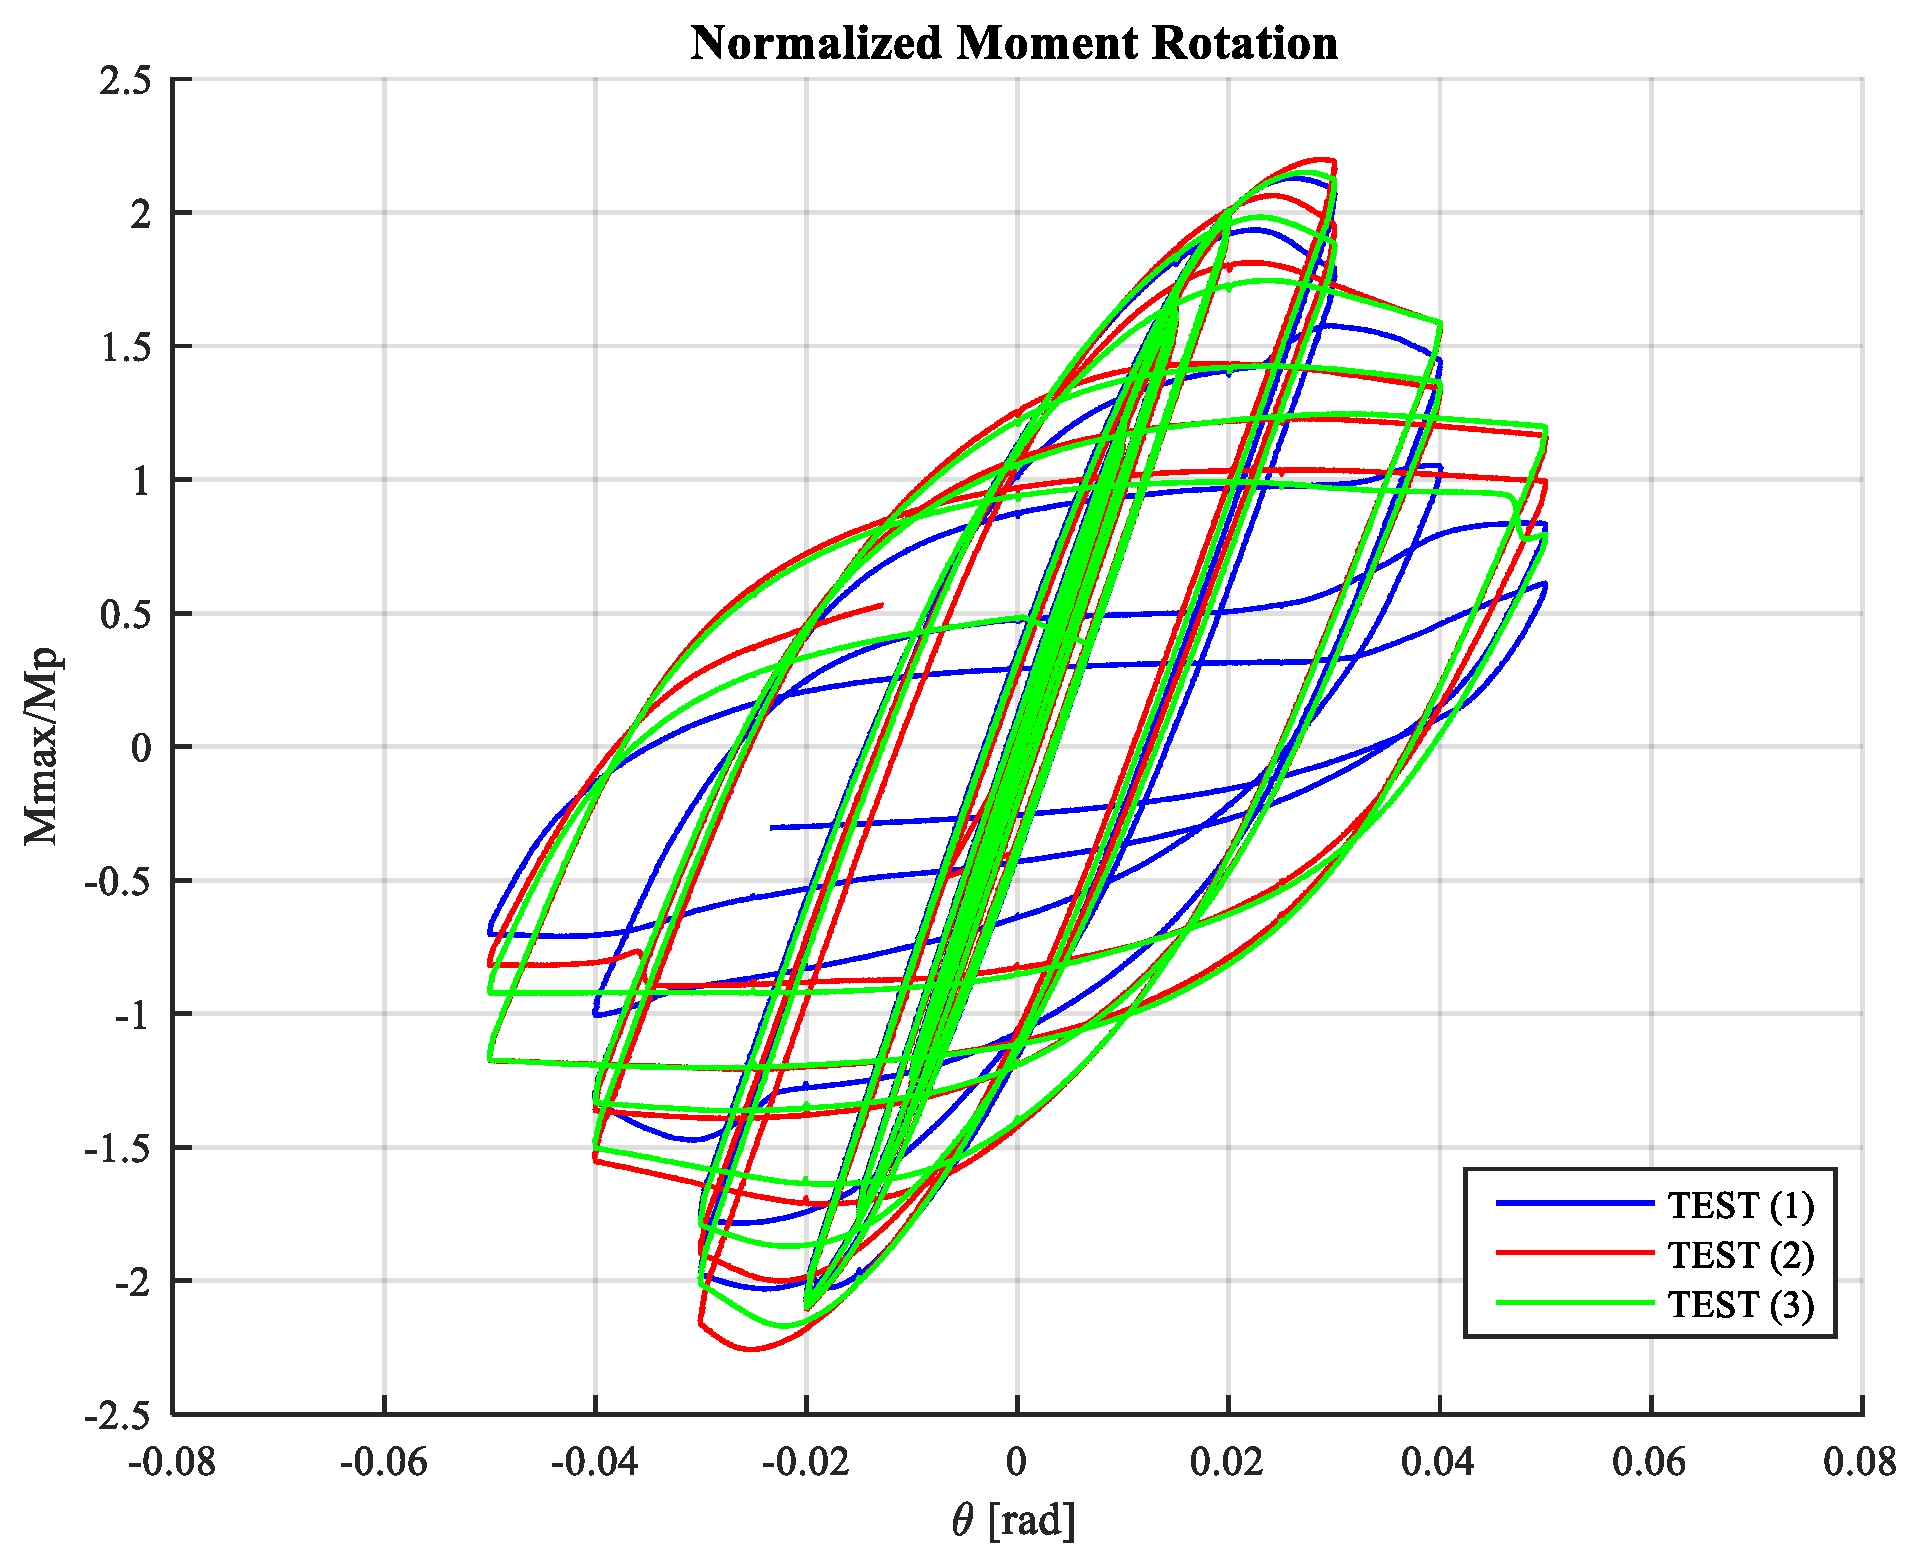
3. Experimental Study

In this research, three large-scale specimens were evaluated according to the requirements in [26]. Similar dimensions and conditions of load were used in all specimens tested ensuring the repeatability of the results. The geometry in the elements of connection are shown in Figure 3.
The material properties were obtained from tensile coupon tests and the values are reported in Table 2. The instrumentation consisted of 3 LVDTs (linear variable differential transformers) to obtain the displacements of interest and load cell to record the applied load.
The actuator load capacity was 500 [kN] with a maximum displacement range of ±125 [mm]. The force transducer, model 661.23F-01 SN: 0375349 manufactured by MTS Systems Corporation, Eden Prairie, MN, USA, was located on the actuator. The displacements applied by the actuator are shown in Table 3, according to the load protocol established in [26].
The location of LVDT in all tests is described as follows: the LVDT-1 was located in the actuator positioned in the end of the beam to capture the displacement applied (see Figure 4a), the LVDT-2 and LVDT-3 were located at the end of the columns to verify movement in the column support (see Figure 4b).

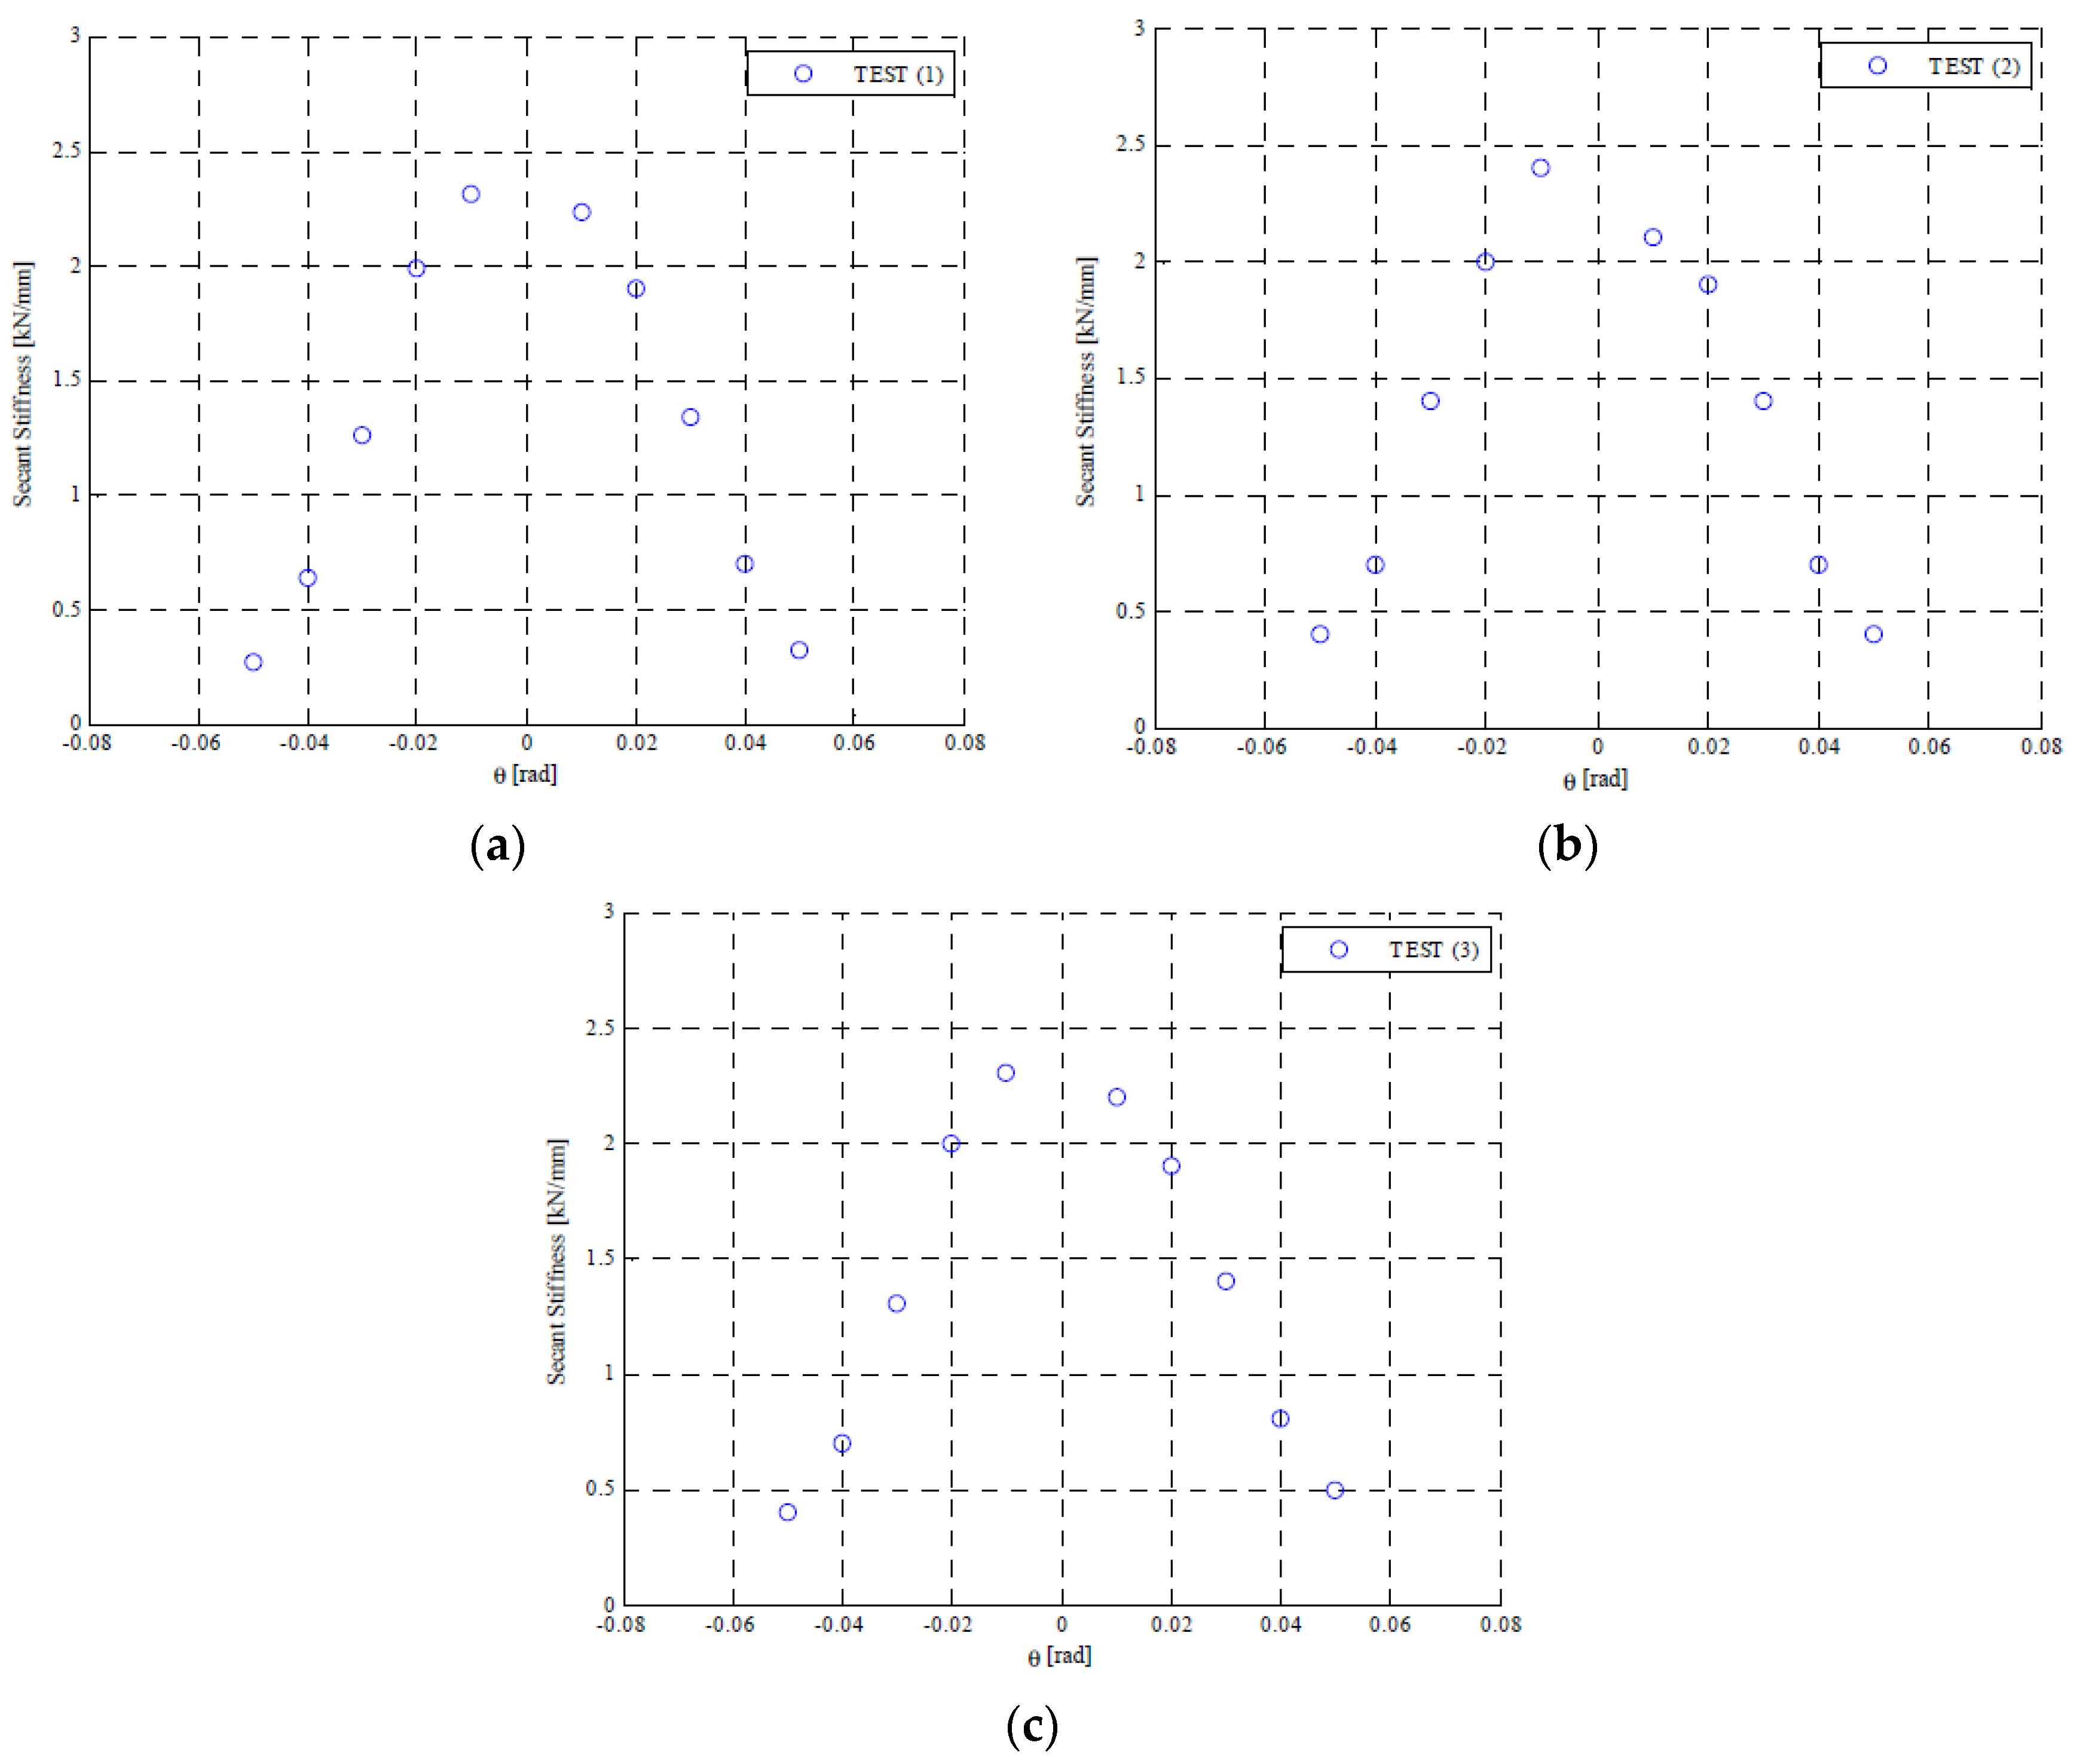
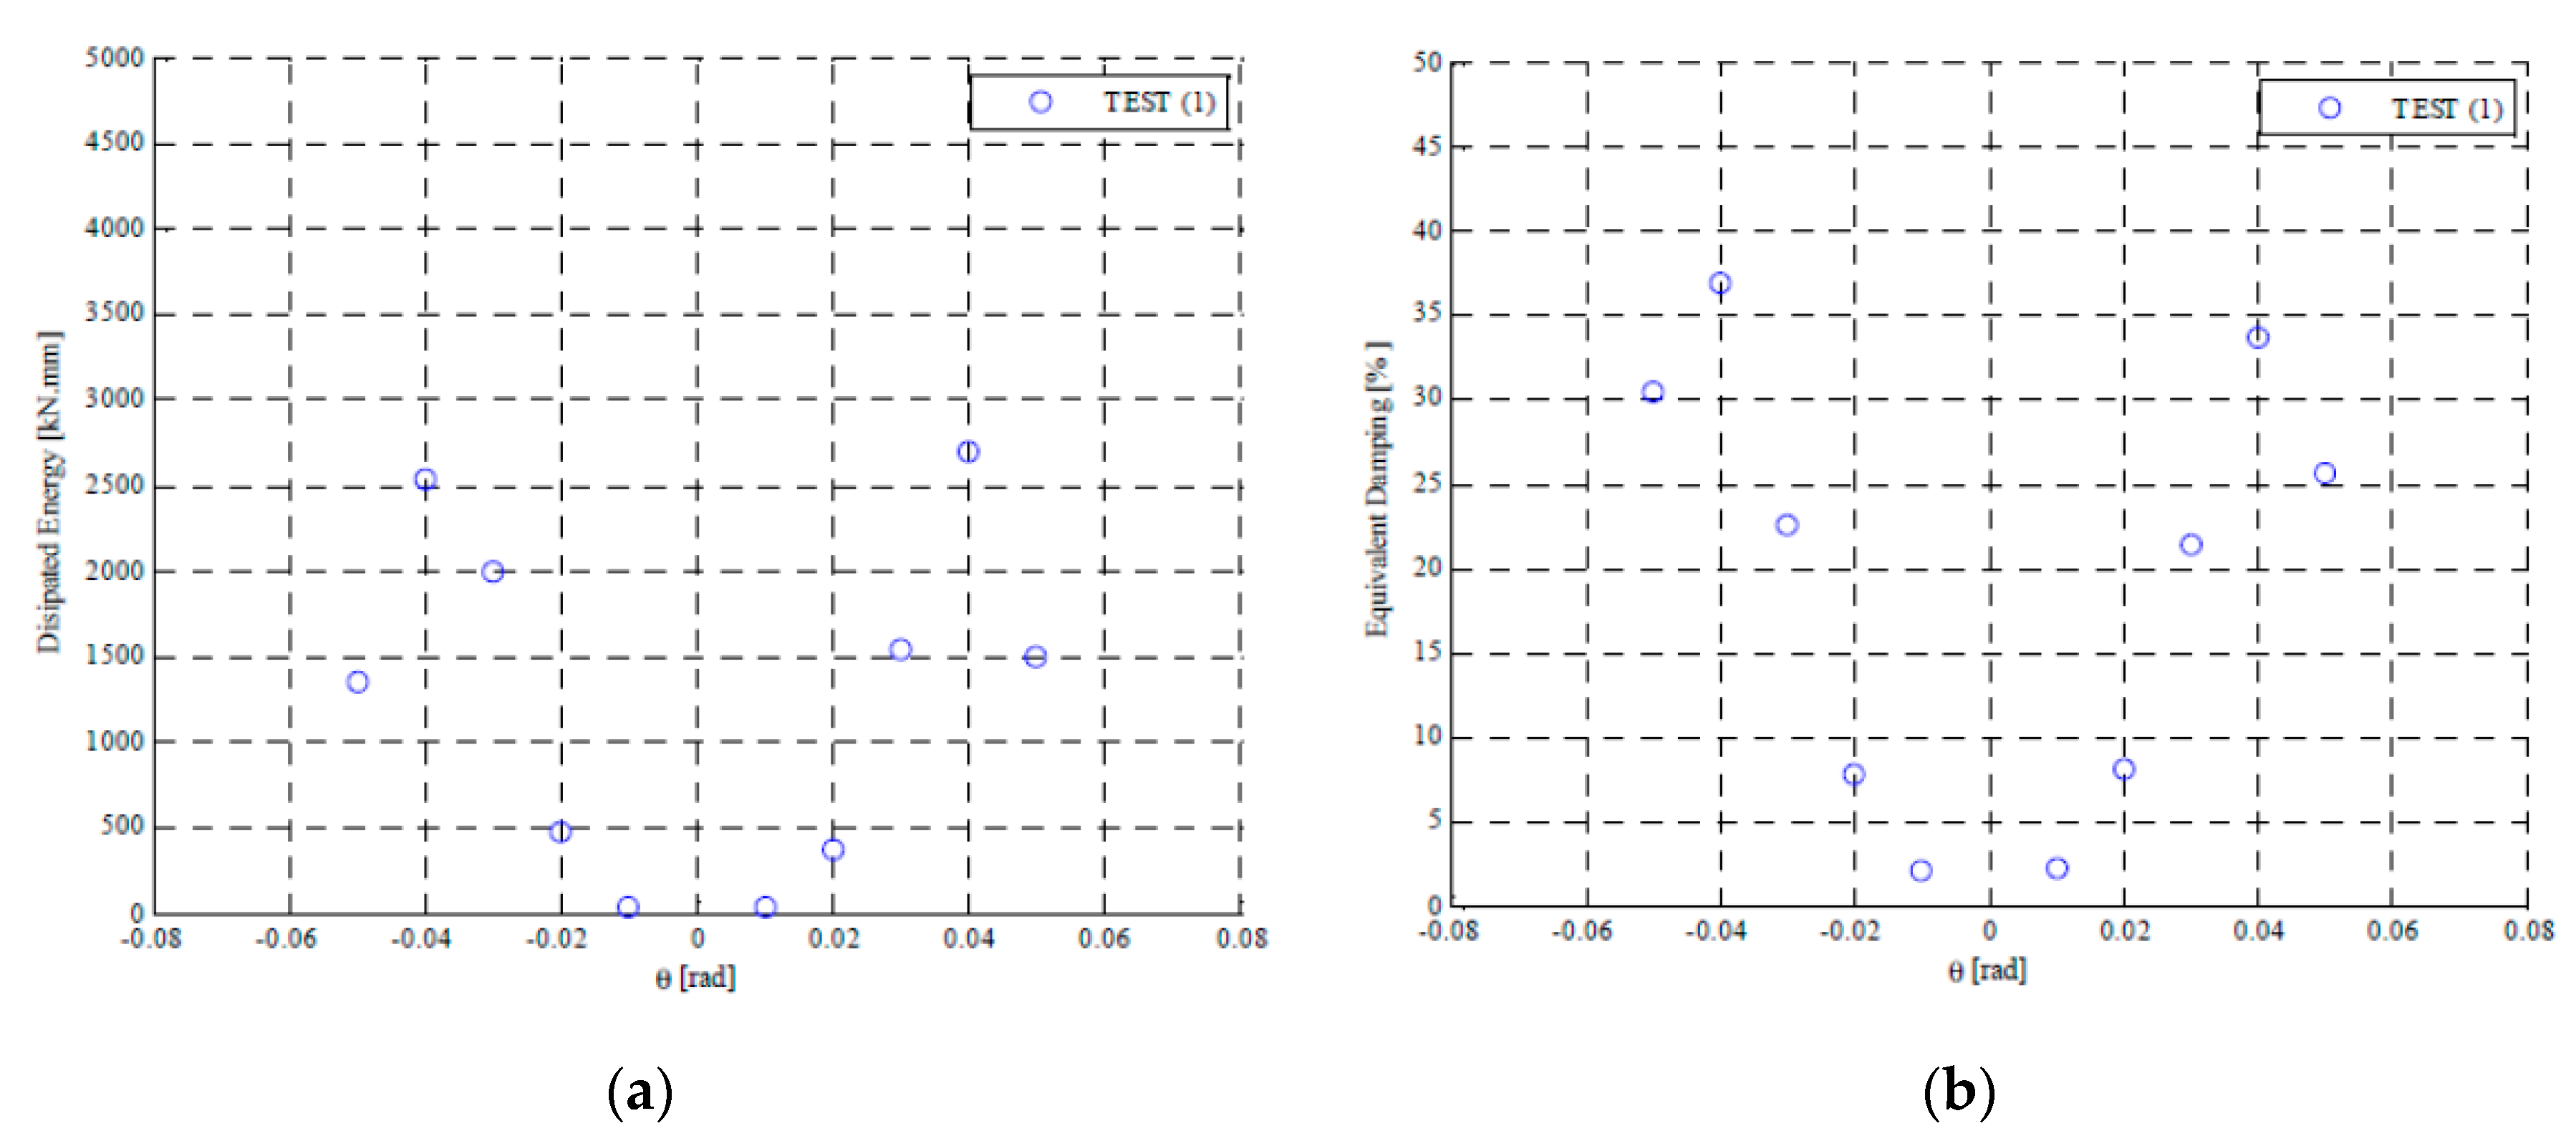
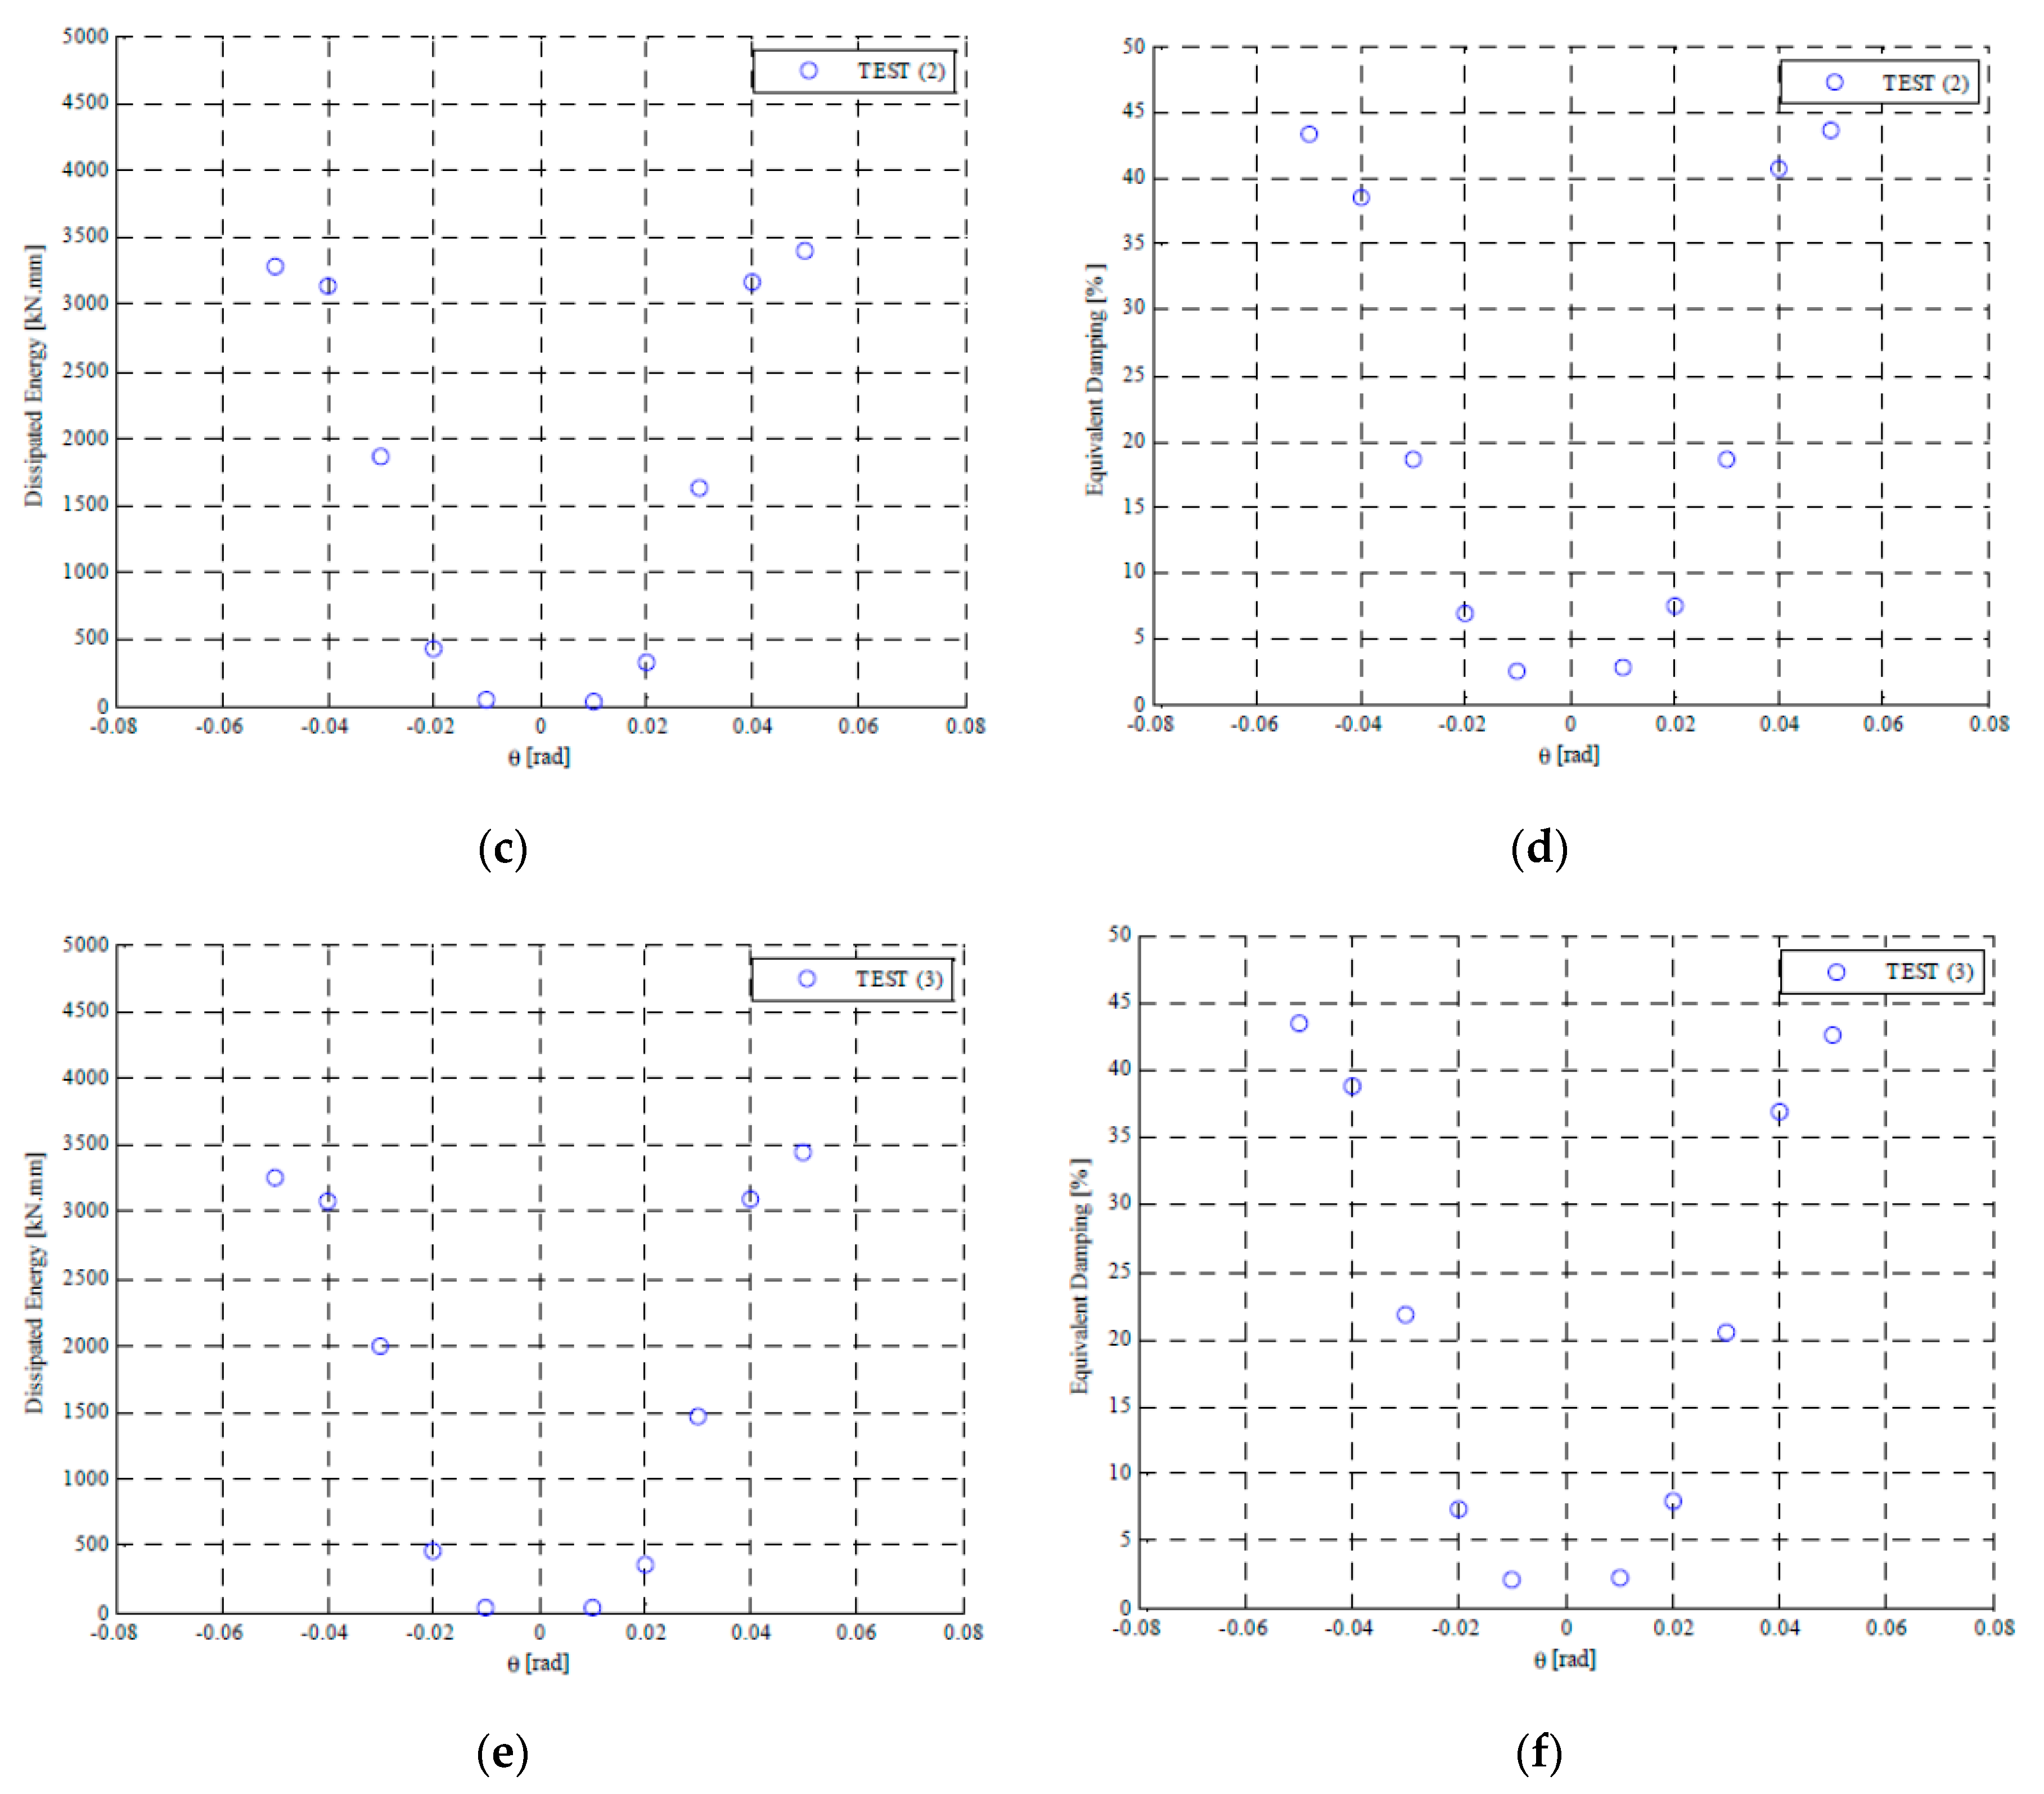
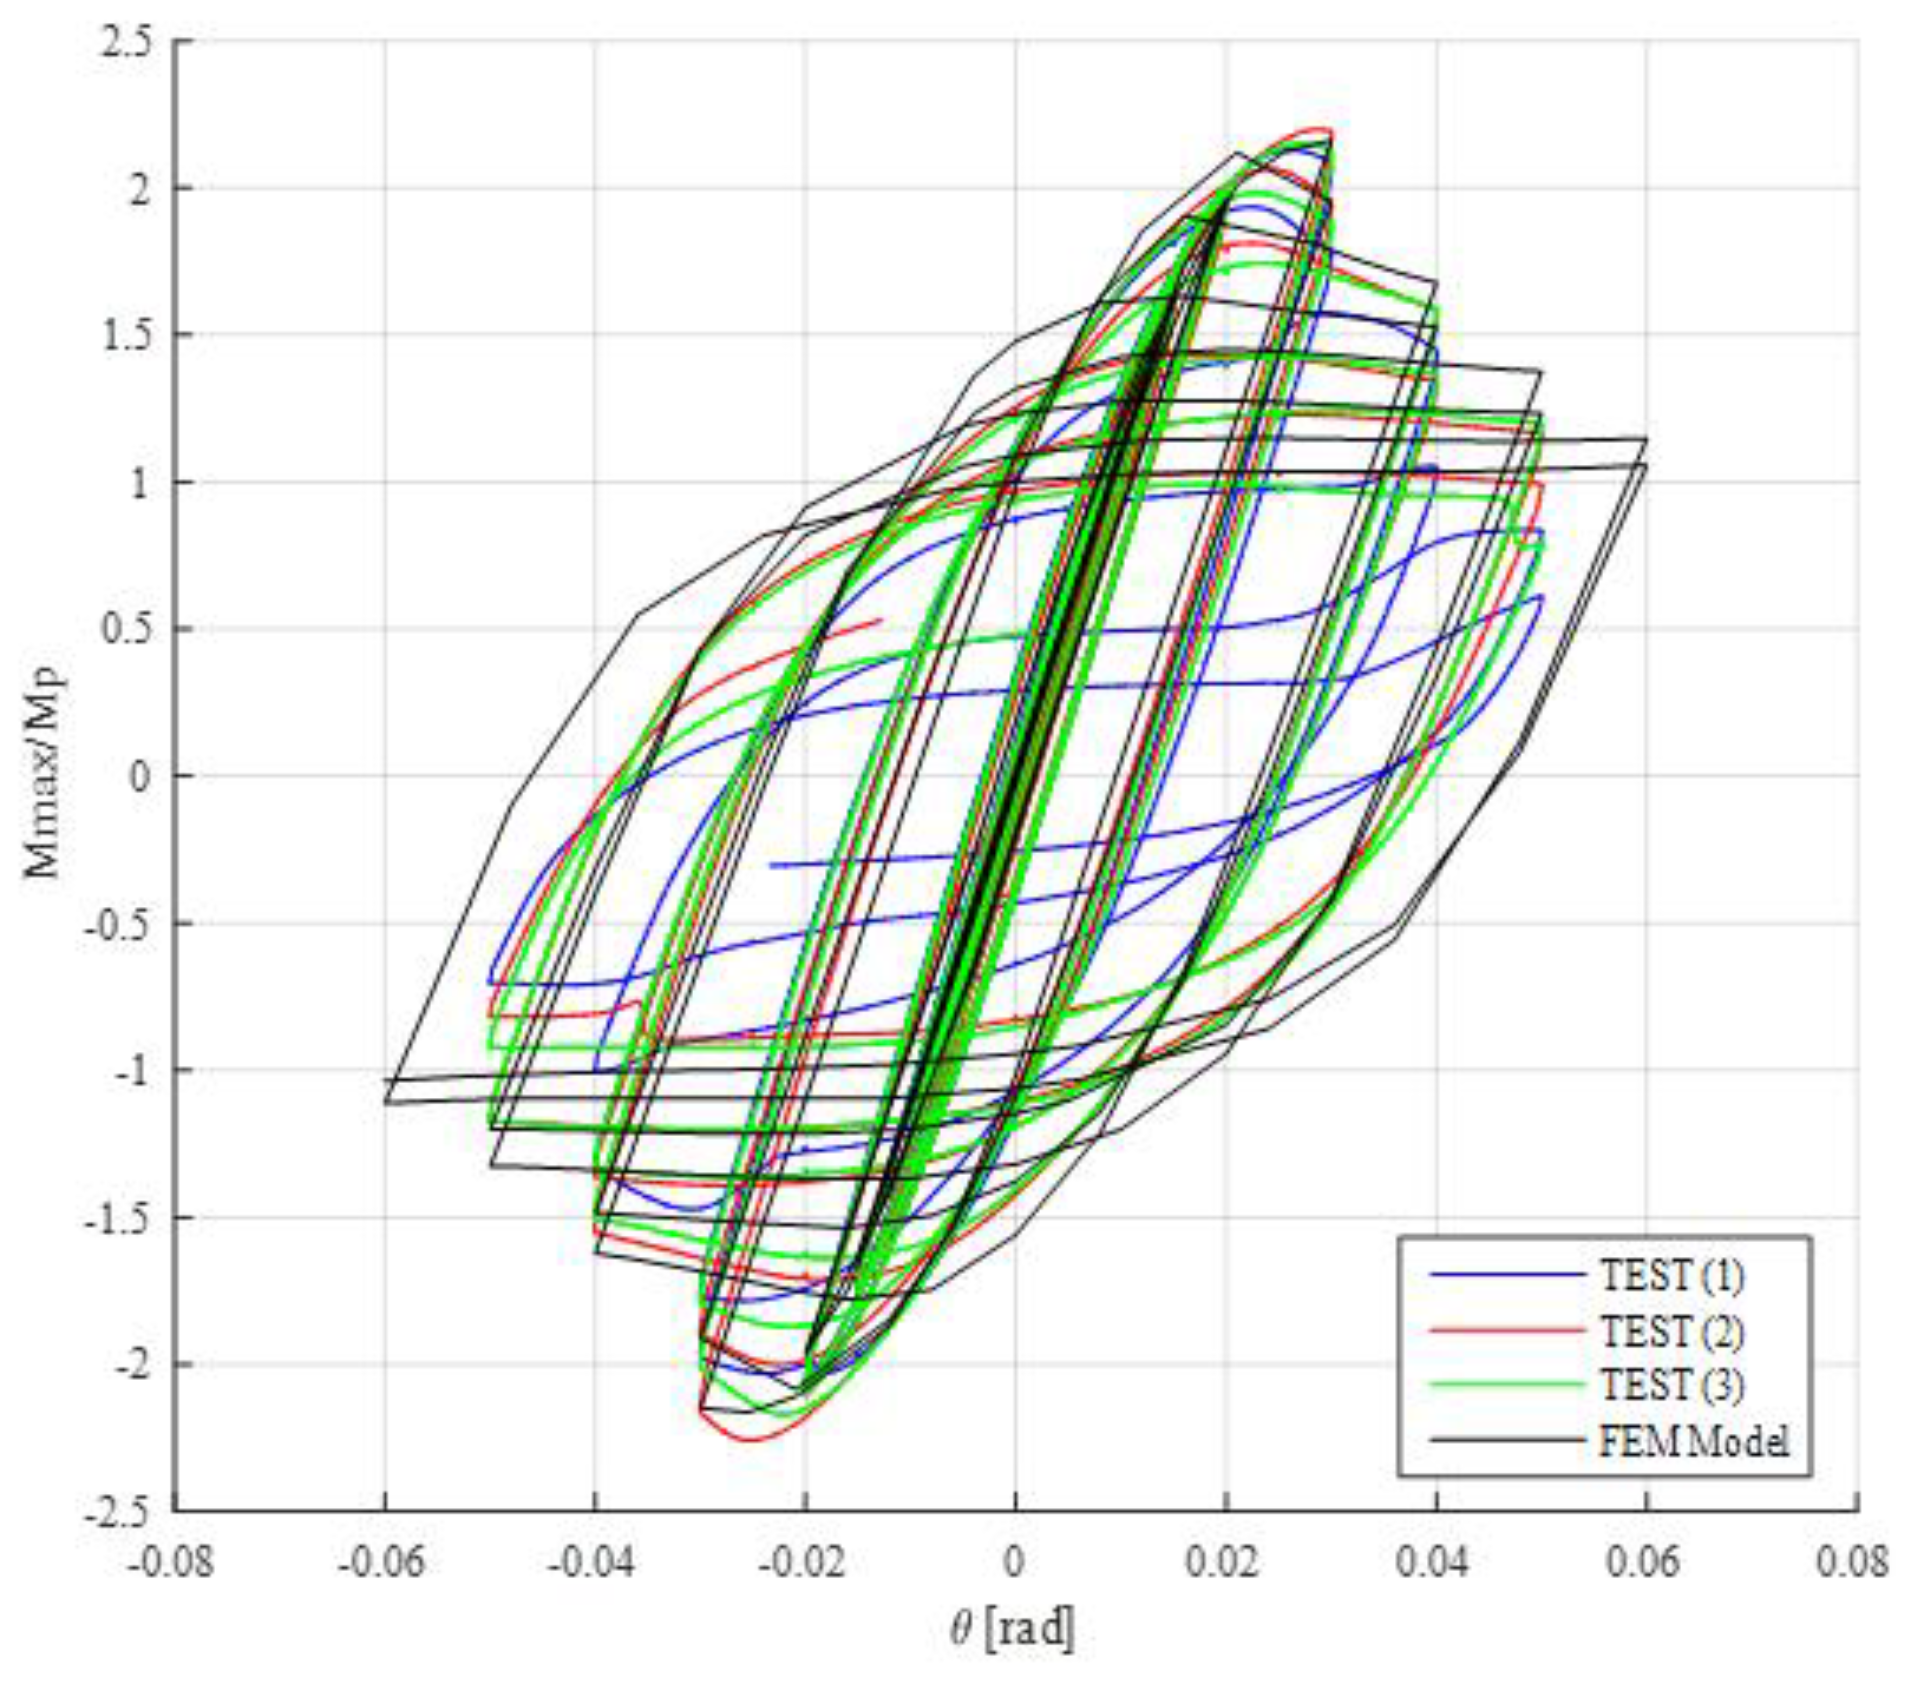
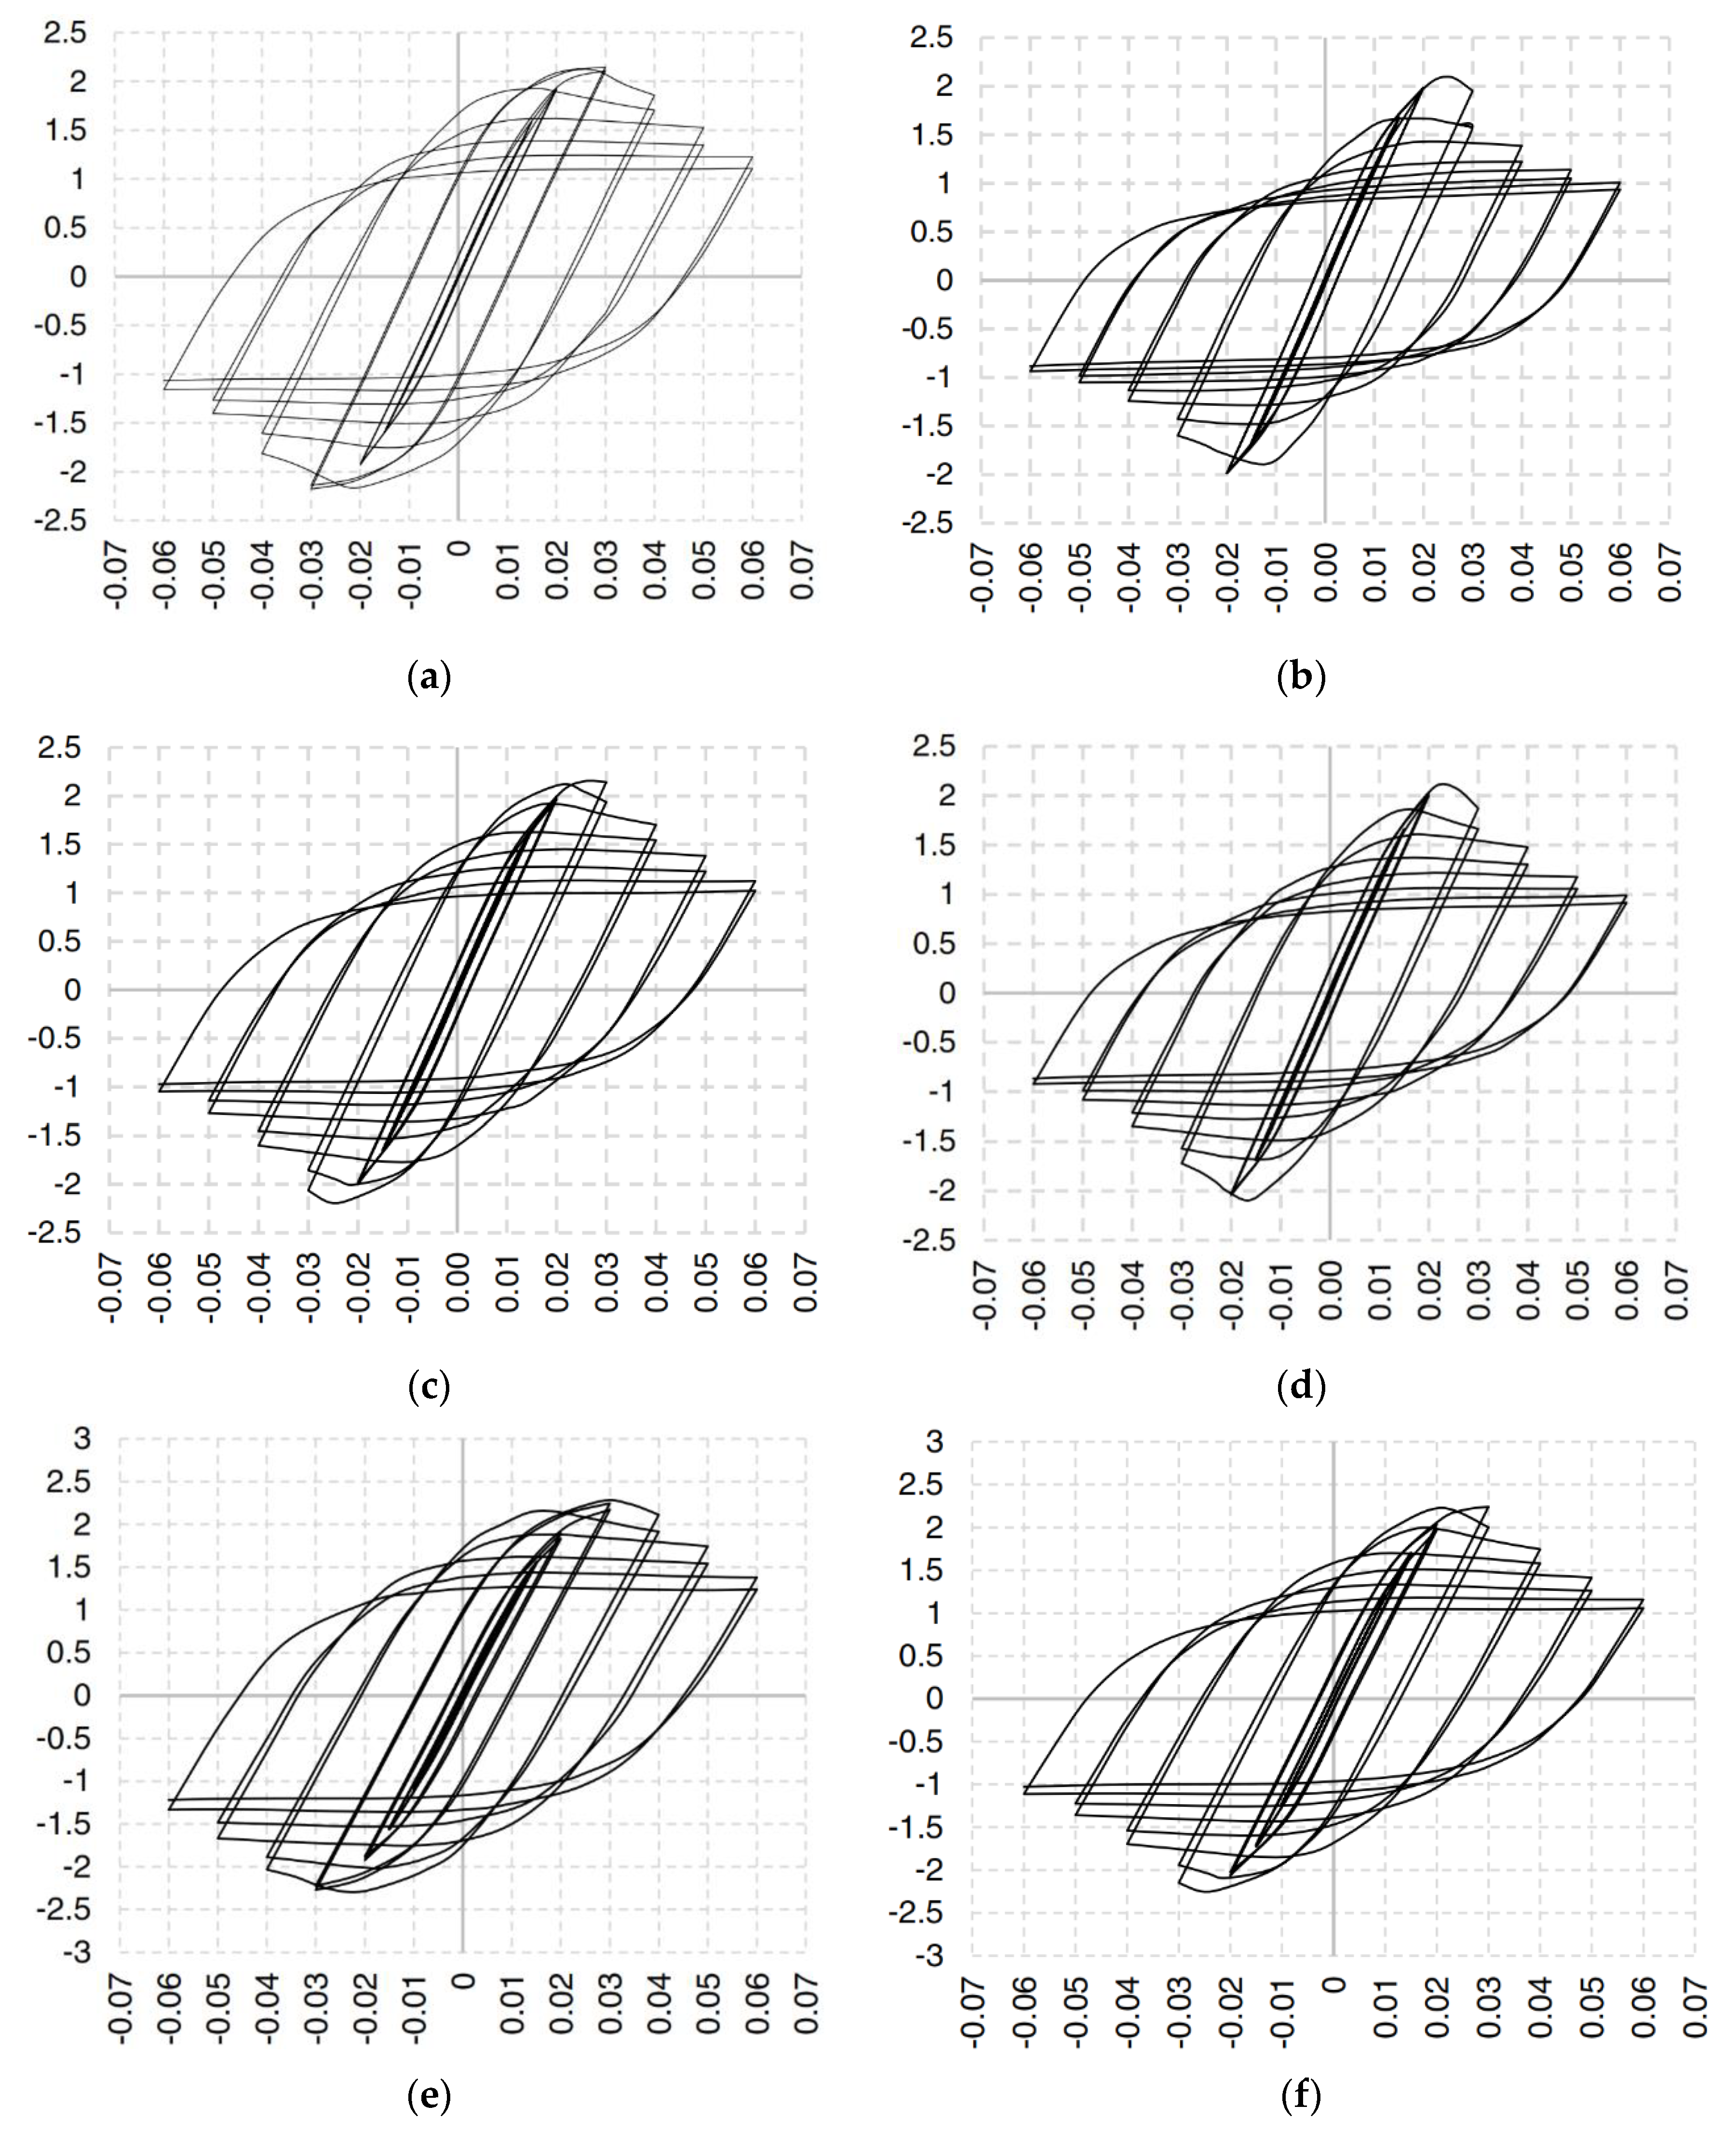
Experimental Results

As is shown in Figure 5, the load-displacement hysteresis curves and view of damage at the last load step of test 1, test 2 and test 3 are reported. In test 1, a maximum load of 60 [kN] at 40 [mm] of vertical displacement and a maximum displacement of 75 [mm] was reached. However, a loss of resistance was obtained once the peak load was achieved. Furthermore, a significant local buckling and fracture by tear out on the beam flanges were obtained. The local buckling effects on the top and bottom of the beam started when the maximum negative load and positive load were reached, respectively. In test 2, the maximum load reported was 62.25 [kN] at 45 [mm] of displacement and the loss of resistance was lower in comparison to test 1. In test 3, a peak load of 60.86 [kN] at 40 [mm] was obtained. A loss of resistance with similar behavior in comparison to previous tests was reported. However, the slope for each loop in the load/reload segment is similar between test 2 and test 3, unlike test 1 which reached a higher degradation. The elements of connection such as stiffeners, end-plate, bolts and welds remained in the elastic range in all specimens tested.
In Figure 6, normalized moment rotation curves are shown. The moment obtained was normalized by the plastic moment Mp, where Mp = FyZx (Fy, is the yield stress of material and Zx, is the plastic modulus). In test 1, a maximum flexural strength of 2.12 Mp at 0.03 [rad] was obtained and 1.0 Mp at 0.04 [rad]. Maximum flexural strength values of 2.20 Mp at 0.03 [rad] and 2.15 Mp at 0.03 [rad] were reported in test 2 and test 3, respectively. In test 2, a flexural strength of 1.0 Mp at 0.04 [rad] was reached, and test 3 achieved a value of 0.98 Mp at 0.04 [rad]. However, even though the inelastic incursion was concentrated in the beam and the flexural resistance was higher to 0.80 Mp at 0.04 [rad] according to [26], a non-ductile behavior controlled by local buckling in flanges of the HSS-beam was obtained. Finally, the ductility was obtained according to a criterion established in [28], where the ductility μ = θuyu, is the rotation capacity at the point where the flexural strength has dropped to 0.8 Mp and θy, is the value corresponding to the intersection between the line representing the initial stiffness and a horizontal line located in the point of maximum resistance). From this criteria, ductilities of μtest1 = 1.5, μtest2 = 1.48 and μtest3 = 1.54 were obtained in test 1, test 2 and test 3 respectively.
A summary of results obtained is shown in Table 4. In Figure 7, a comparison of specimens tested is shown. Similar hysteretic curves were obtained in the three tests, however test 1 exhibited a slight drop in terms of resistance.
In Figure 8, the secant stiffness is shown. As is observed, an important degradation of secant stiffness was reached in all specimens tested, specifically between 0.02 [rad] and 0.04 [rad]. In test 1, test 2 and test 3, a similar value of 2 [kN/mm] at 0.02 [rad] was achieved. However, values lower than 0.7 [kN/mm] at 0.04 [rad] were reported, which was evidence of non-ductile behavior once the peak load was exceeded.
In Figure 9, the dissipated energy and the equivalent damping are reported for all specimens tested. The equivalent damping is calculated from equation ξeq = Ed/4πEso, where Ed is the dissipated energy and Eso is the strain energy, as defined in [29]. Limited dissipation energy was obtained in tests performed in comparison to tests reported in [16], despite having similar dimensions and columns in both studies. Furthermore, the equivalent damping values were lower than 2.5% at 0.02 [rad]. Values greater than 10% at 0.04 [rad] were reached; however, these values are not representative for their use in seismic design of steel structures because they were calculated for large levels of deformation.

4. Numerical Study

In this research, the cyclic performance of the HSS moment connection was studied using the finite element method with ANSYS software [30]. The constitutive law of materials, geometrics non-linearities, contact non-linearities, and boundary condition equivalents to test conditions were considered according to [31].

4.1. General Characteristics of the Numerical Model

The following considerations in the model performed with similar dimensions to experimental specimens are reported:
  • Length of the column is equal to inflection points at mid-height of each story.
  • Washers are not included in the model for simplicity, considering that inelastic incursion is manifesting in the beam exclusively [16].
  • Diameter of the bolt holes is assumed to be equal to the diameter of the bolts, avoiding rigid body movements that could affect the convergence of the model [16].

4.2. Element Type and Mesh

Hexahedral and tetrahedral 3D solid elements (SOLID186, 20 nodes and three translational degrees of freedom per node) were considered in the model for stiffeners, plates, bolts, beams, column, and nuts. The SOLID186 elements allow considering materials with plasticity, large deflections and large deformations. A fine mesh in zones with large inelastic incursions was performed, improving the computational efficiency (see Figure 10). The number of elements and nodes used in the numerical model is shown in Table 5.

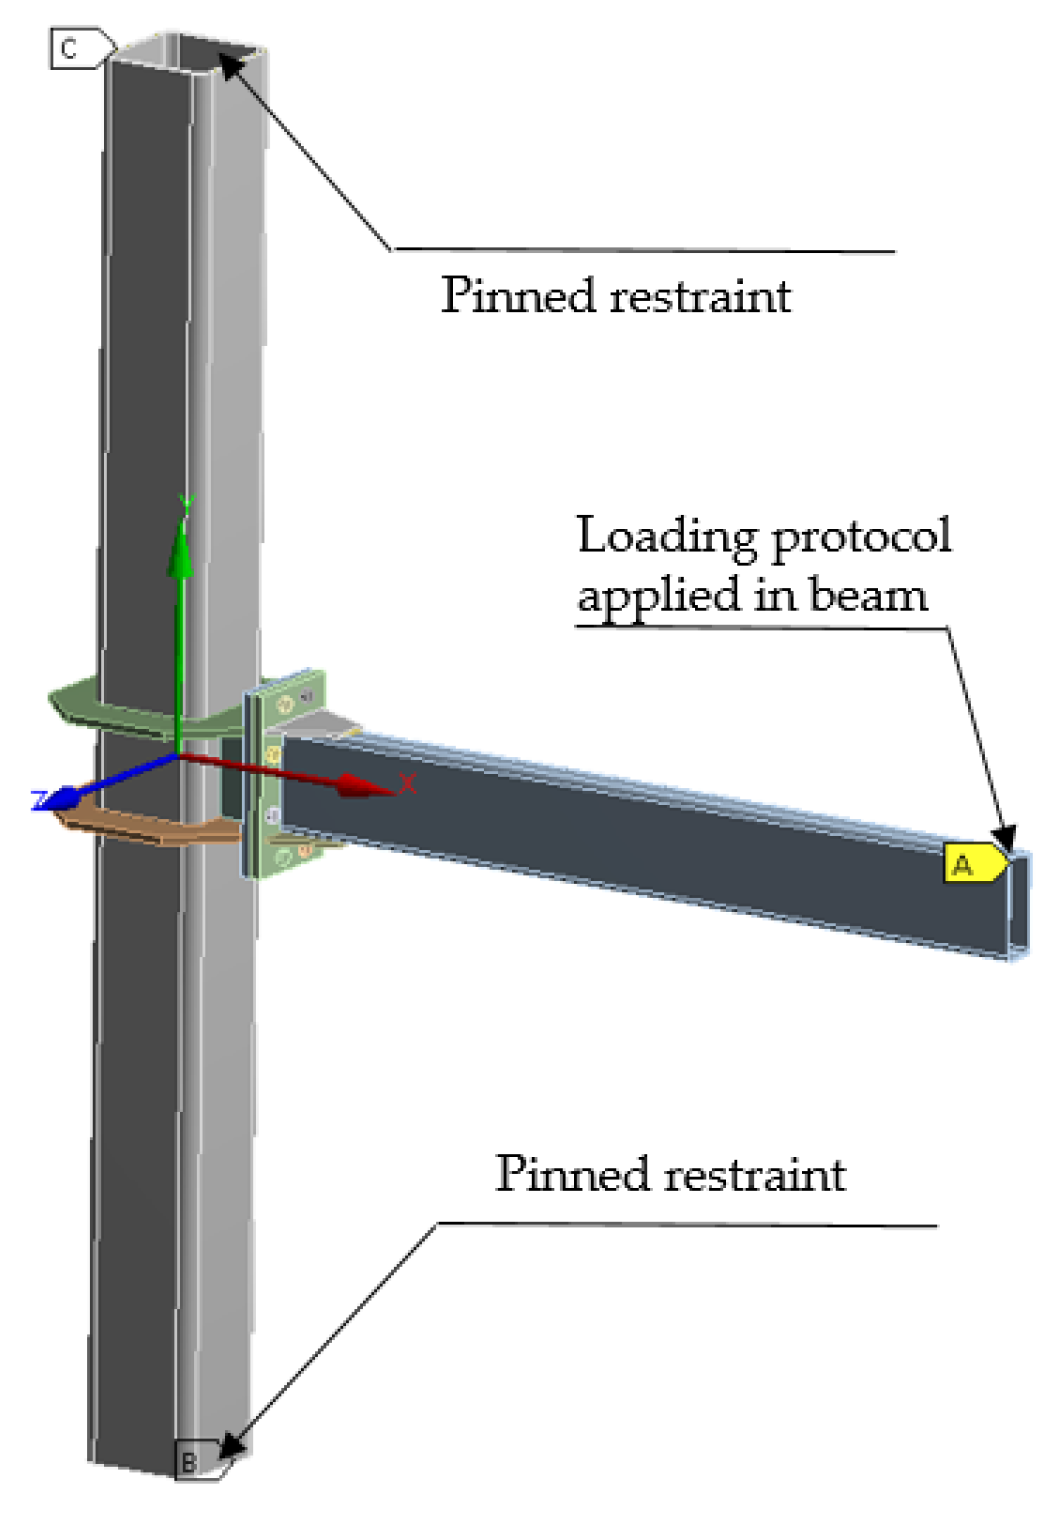
4.3. Boundary Conditions and Loading

As show in Figure 11, similar boundary conditions to the experimental study were used. Pinned restraints were applied in the end of the columns to simulate zero moment points (zero moment points in columns are assumed at mid height to be similar to columns in buildings subjected to lateral forces), while in the end of the beam vertical displacements were applied according to the protocol established in [14]. The vertical displacements history is similar to employed in experimental study, as shown in Table 3.
The bolt pretension equivalent to 70% of the nominal tension strength according to [32] was applied. A “Bonded” contact was employed to simulate welding conditions. This type of contact is a complete restraint of the displacements and rotations between the parts connected. Additionally, the contact between bolts-nuts, bolts-end plate and nuts-end plates were modelled with a “Frictionless” type contact according to research conducted by [33], avoiding a separation between the connected parts and the tangential movement without friction. The contact between end-plates was modeled with a “Frictional” type contact using a 0.3 friction coefficient according to [16,34]. The contact types used are summarized in Table 6.

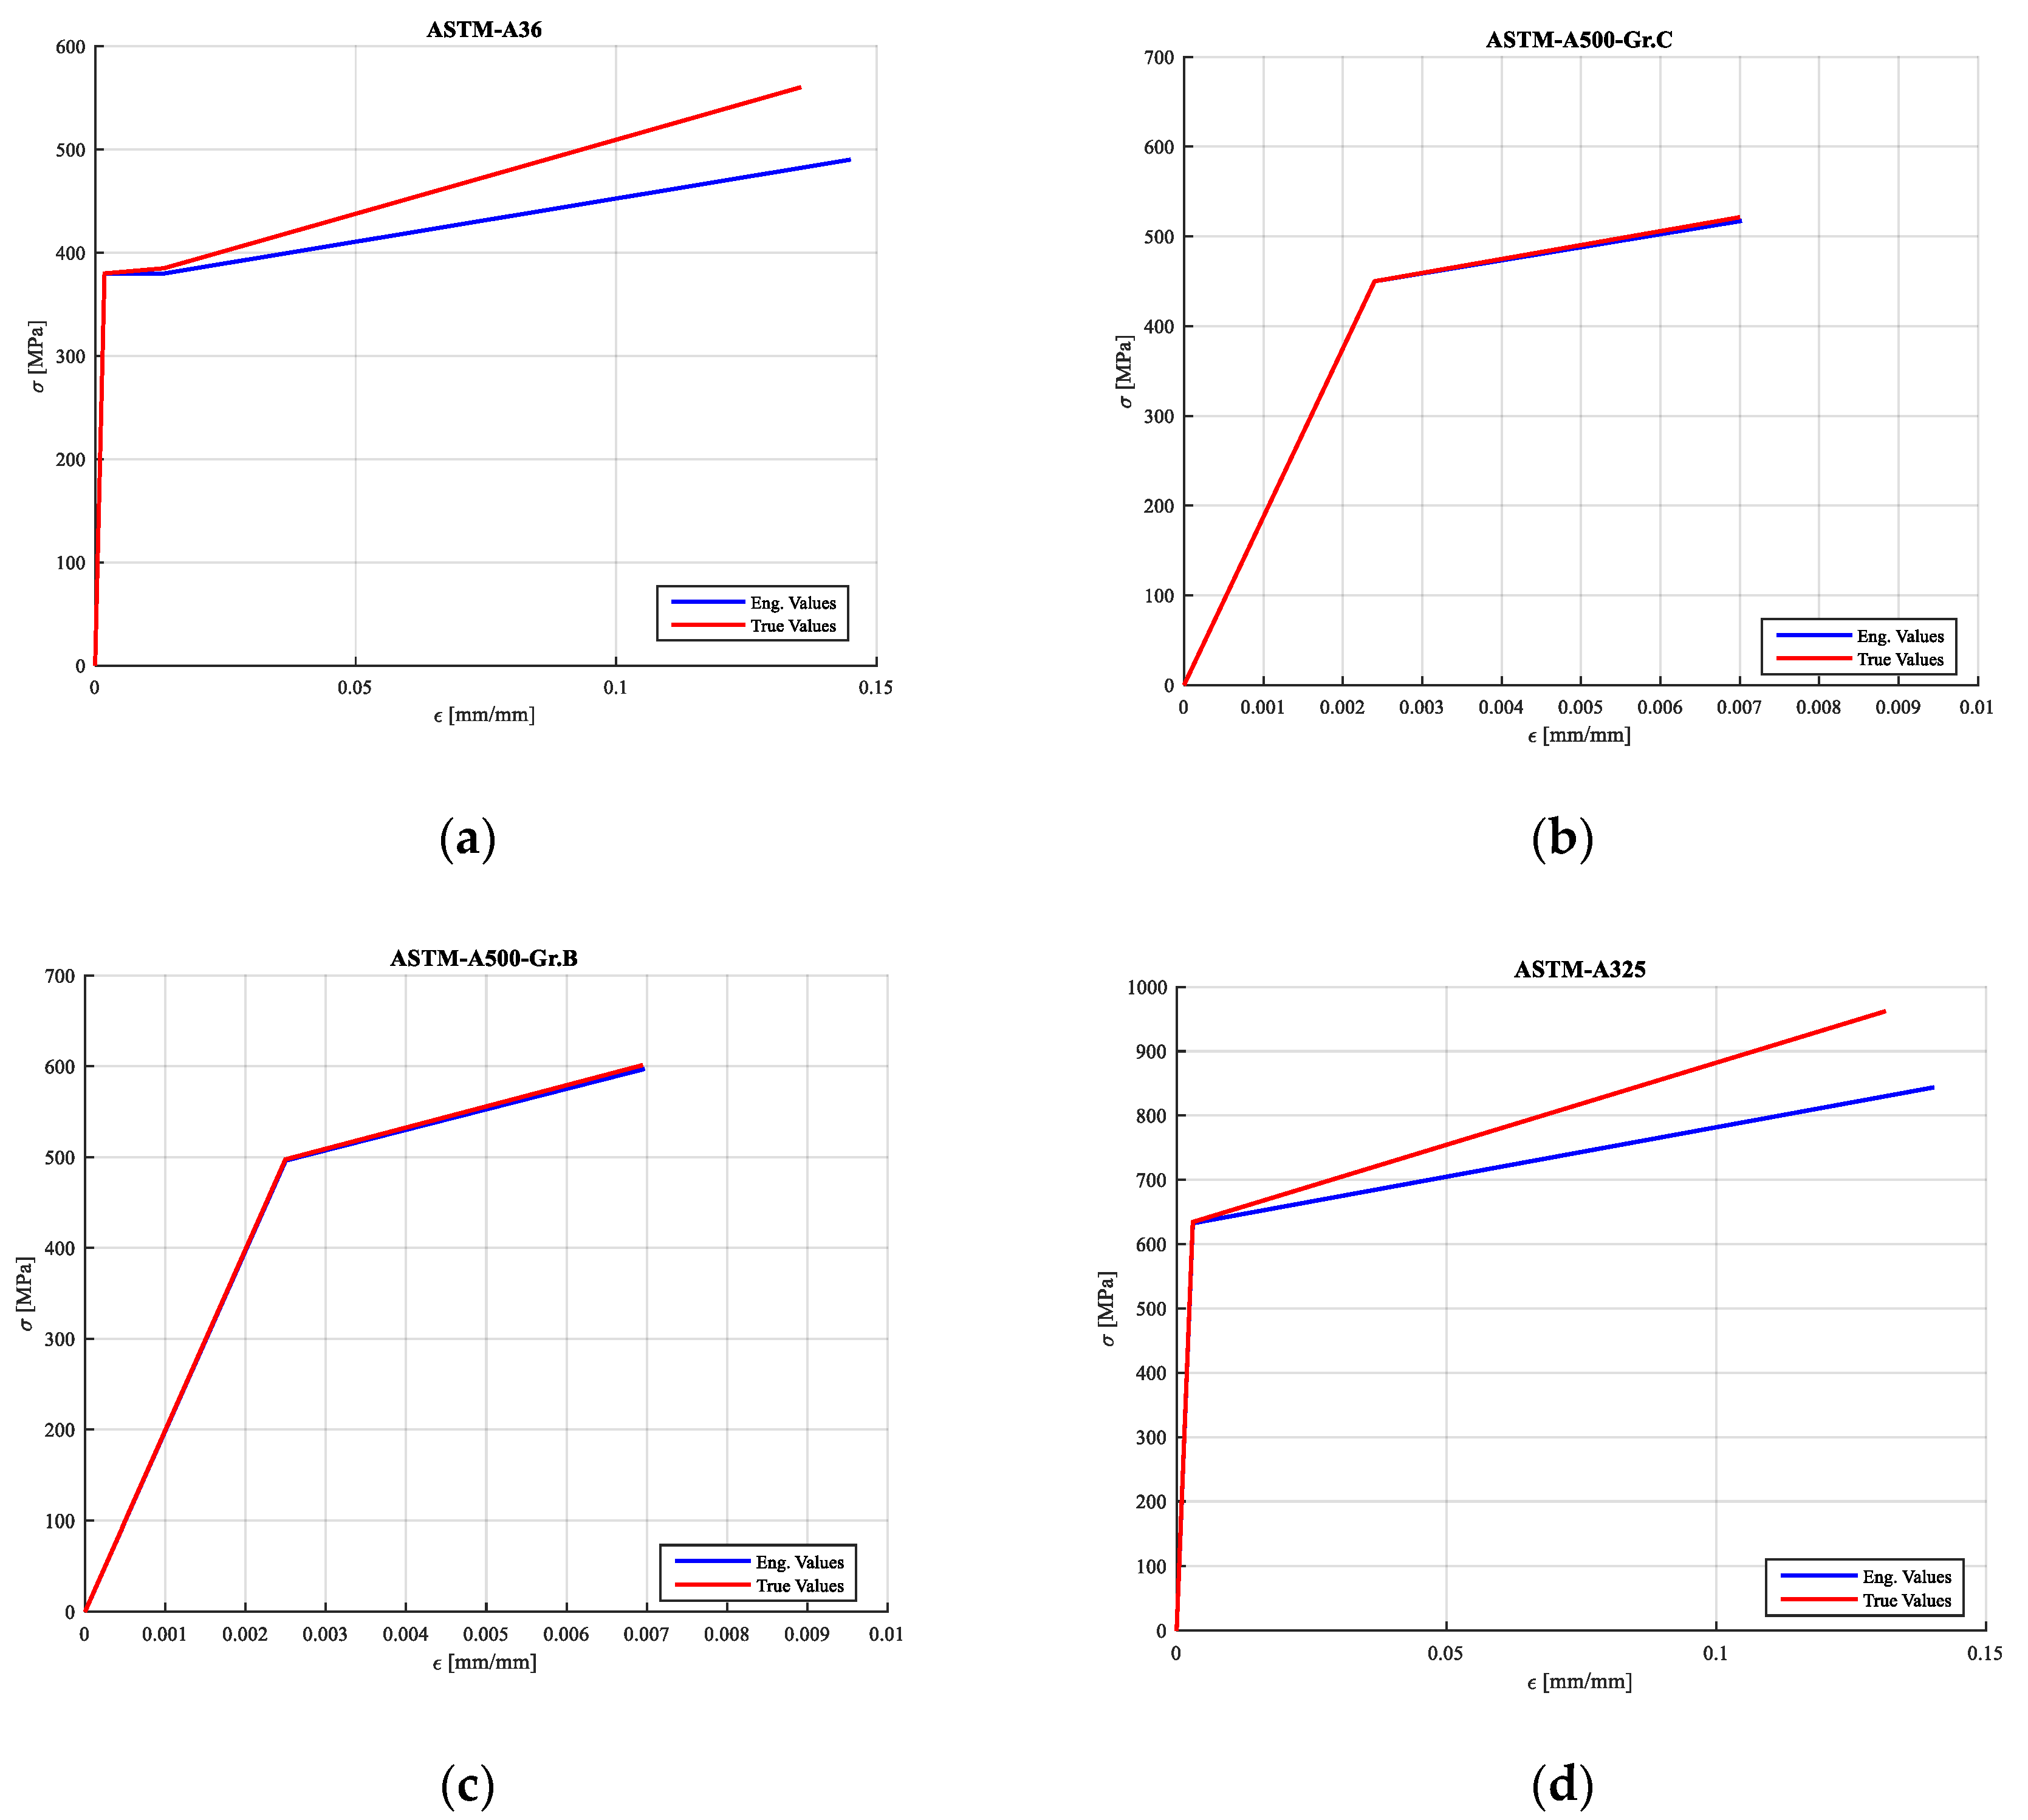
4.4. Material Modeling

The properties for steel were introduced through stress-strain relationships. A constitutive law-type multi-linear kinematic hardening with a von Mises yielding criterion was considered to simulate metal plasticity. Additionally, the material properties from the tensile coupon were converted and idealized to true stress and strain values (see Figure 12). The length of cover plate was taken into account to ensure the yielding in the beam or plate before weld fracture. Therefore, the criteria used for the weld was to use a strain consistent with the fracture strain from the materials tests, according to [34].

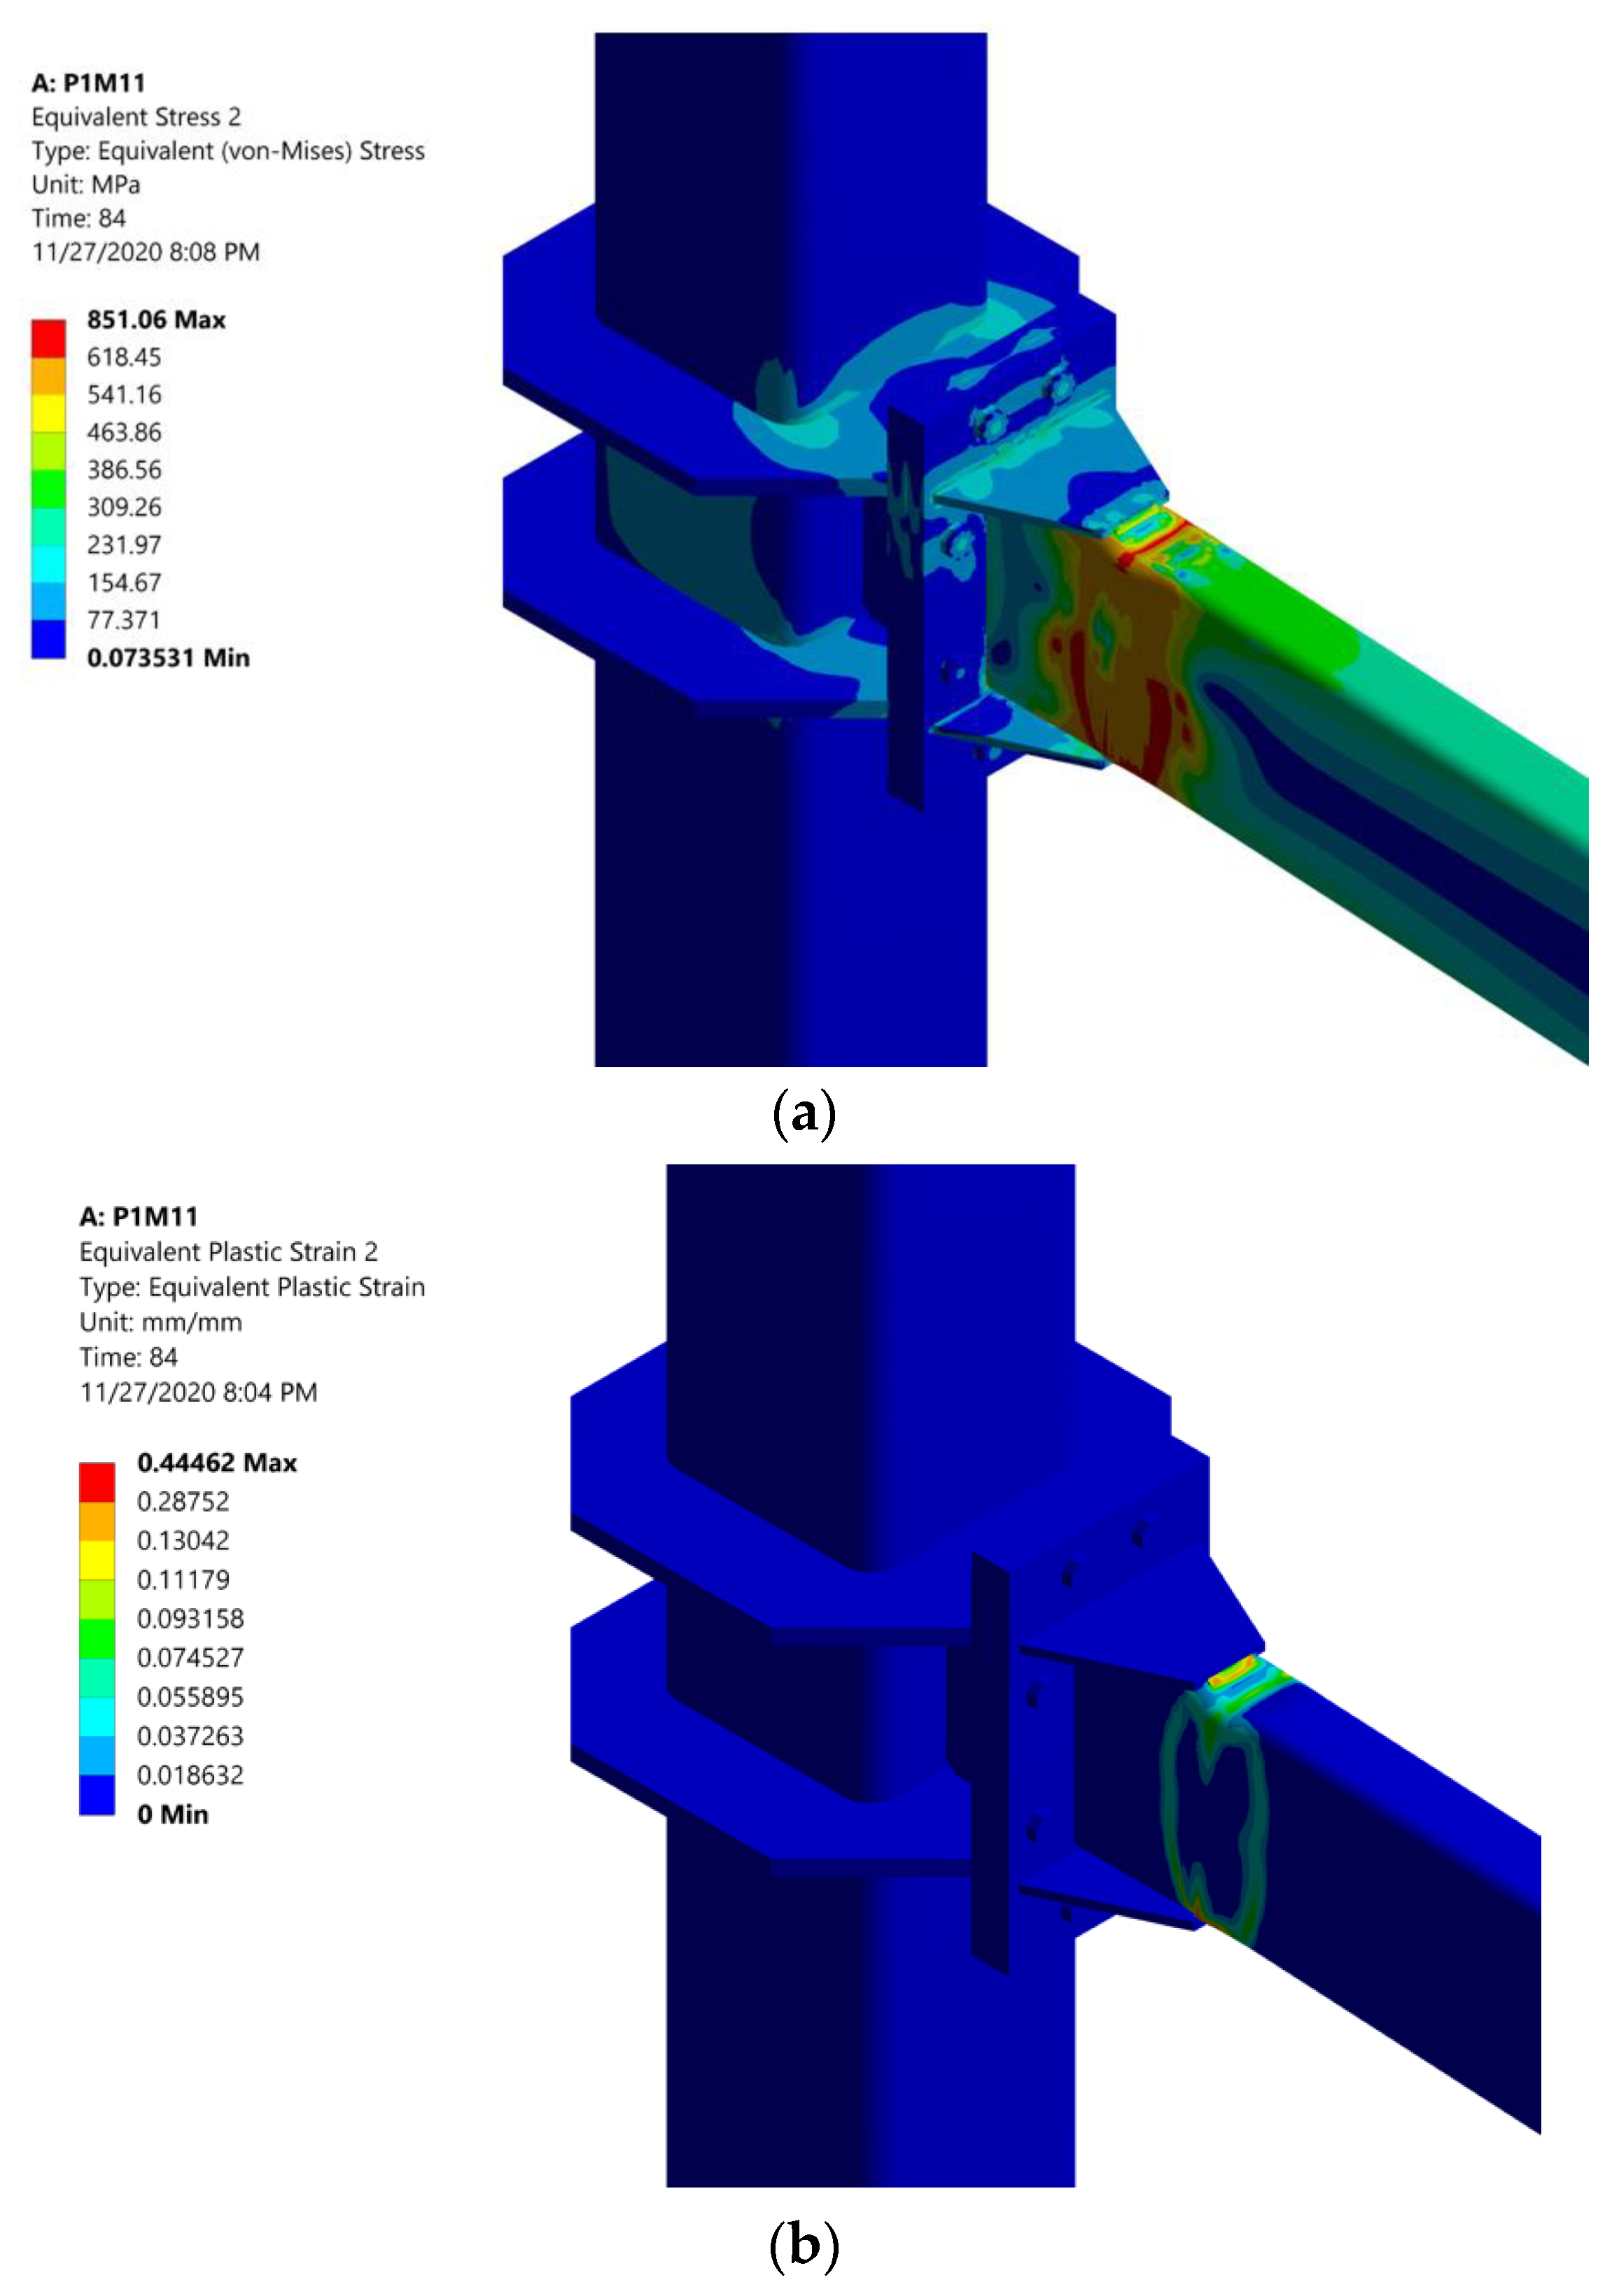
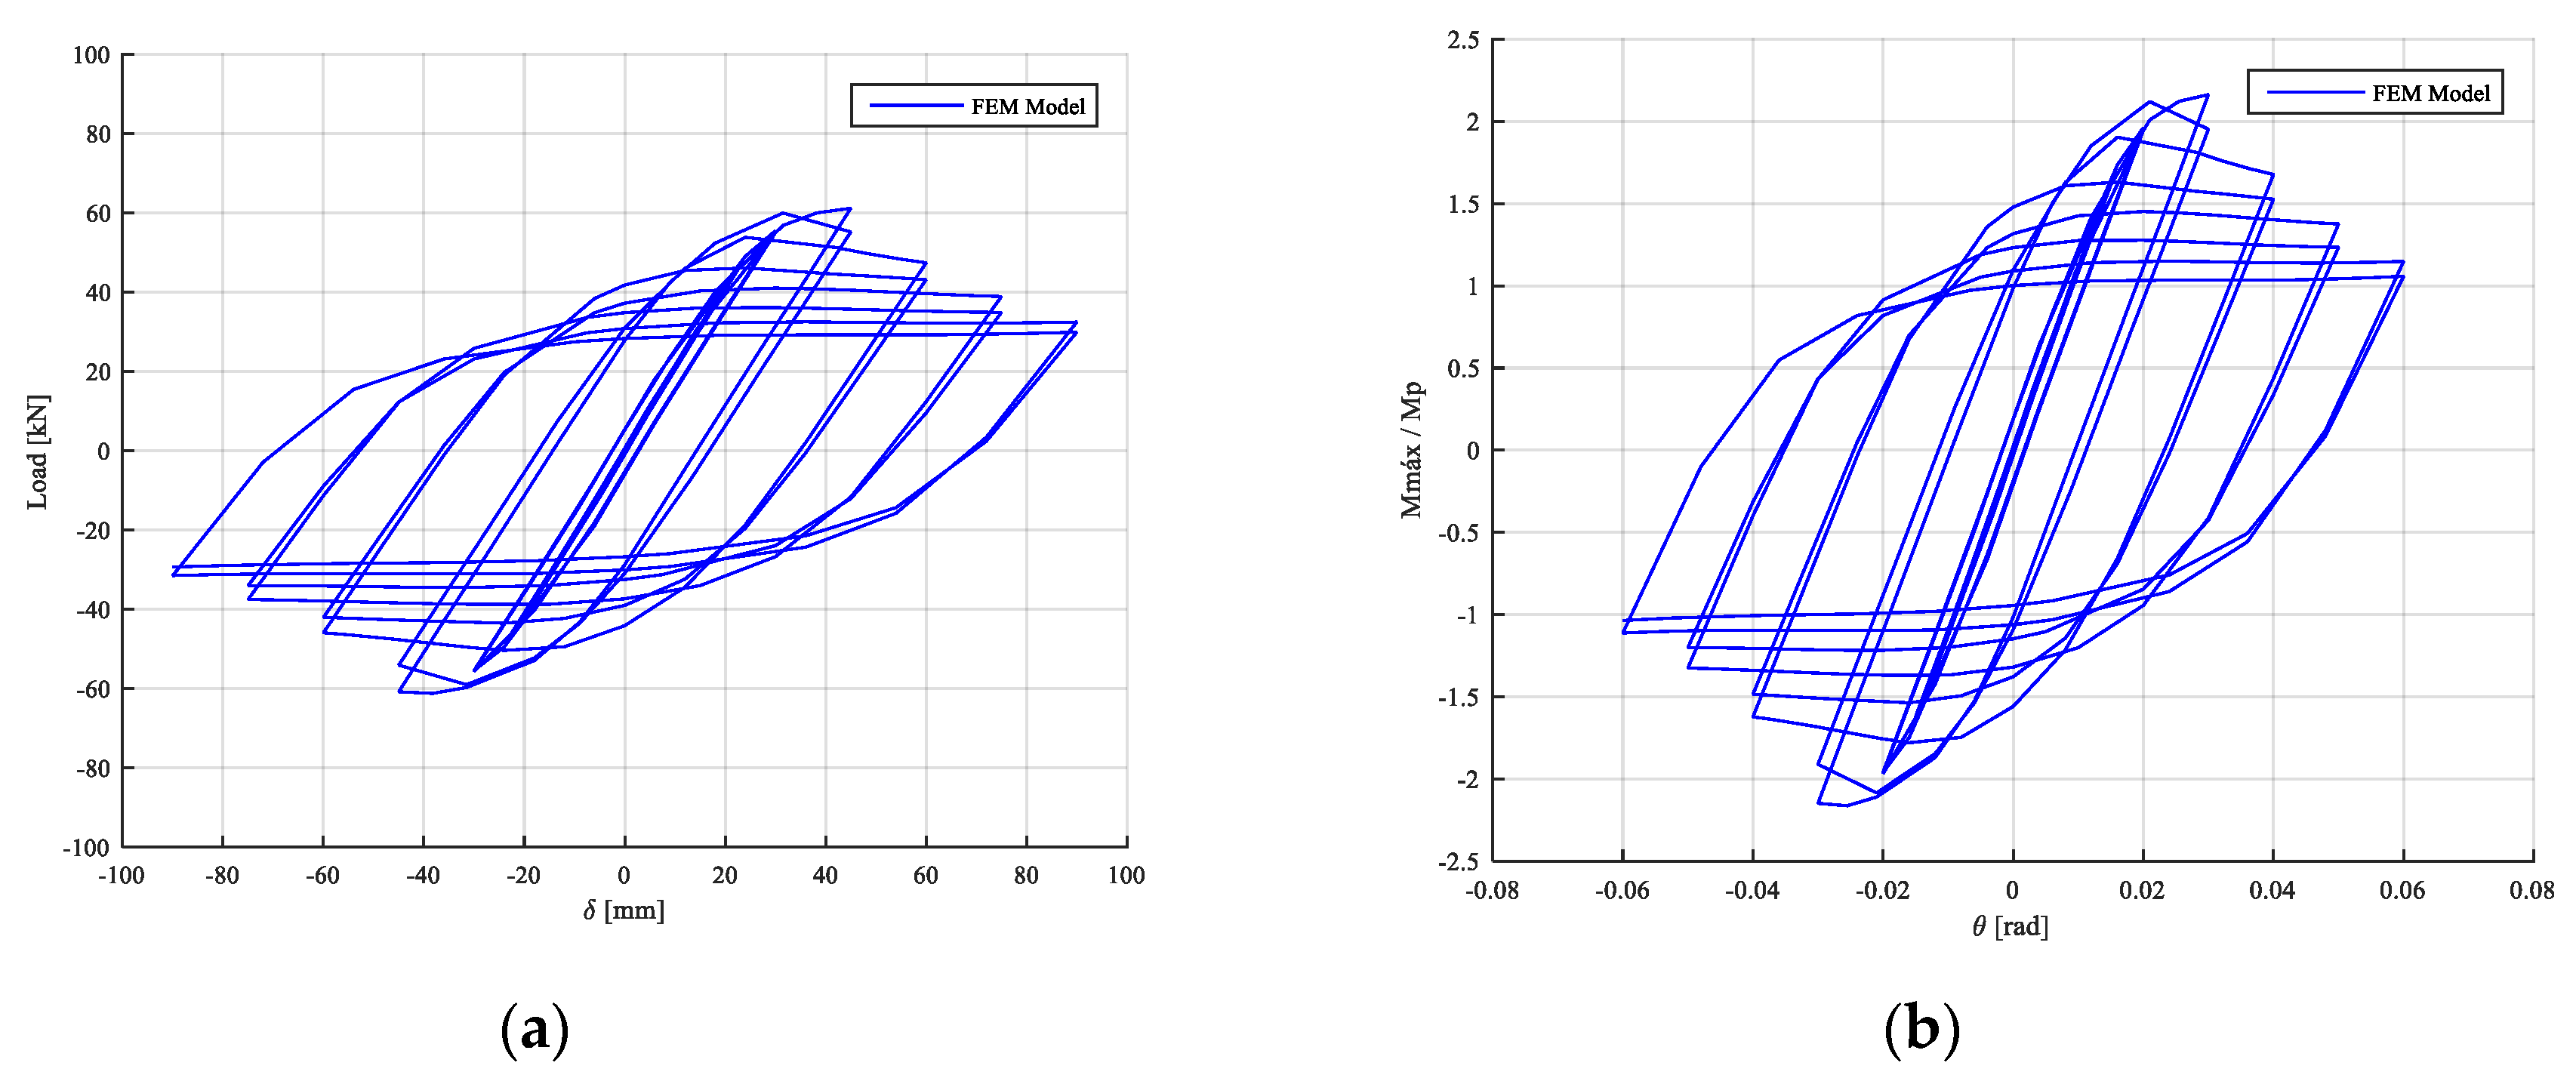
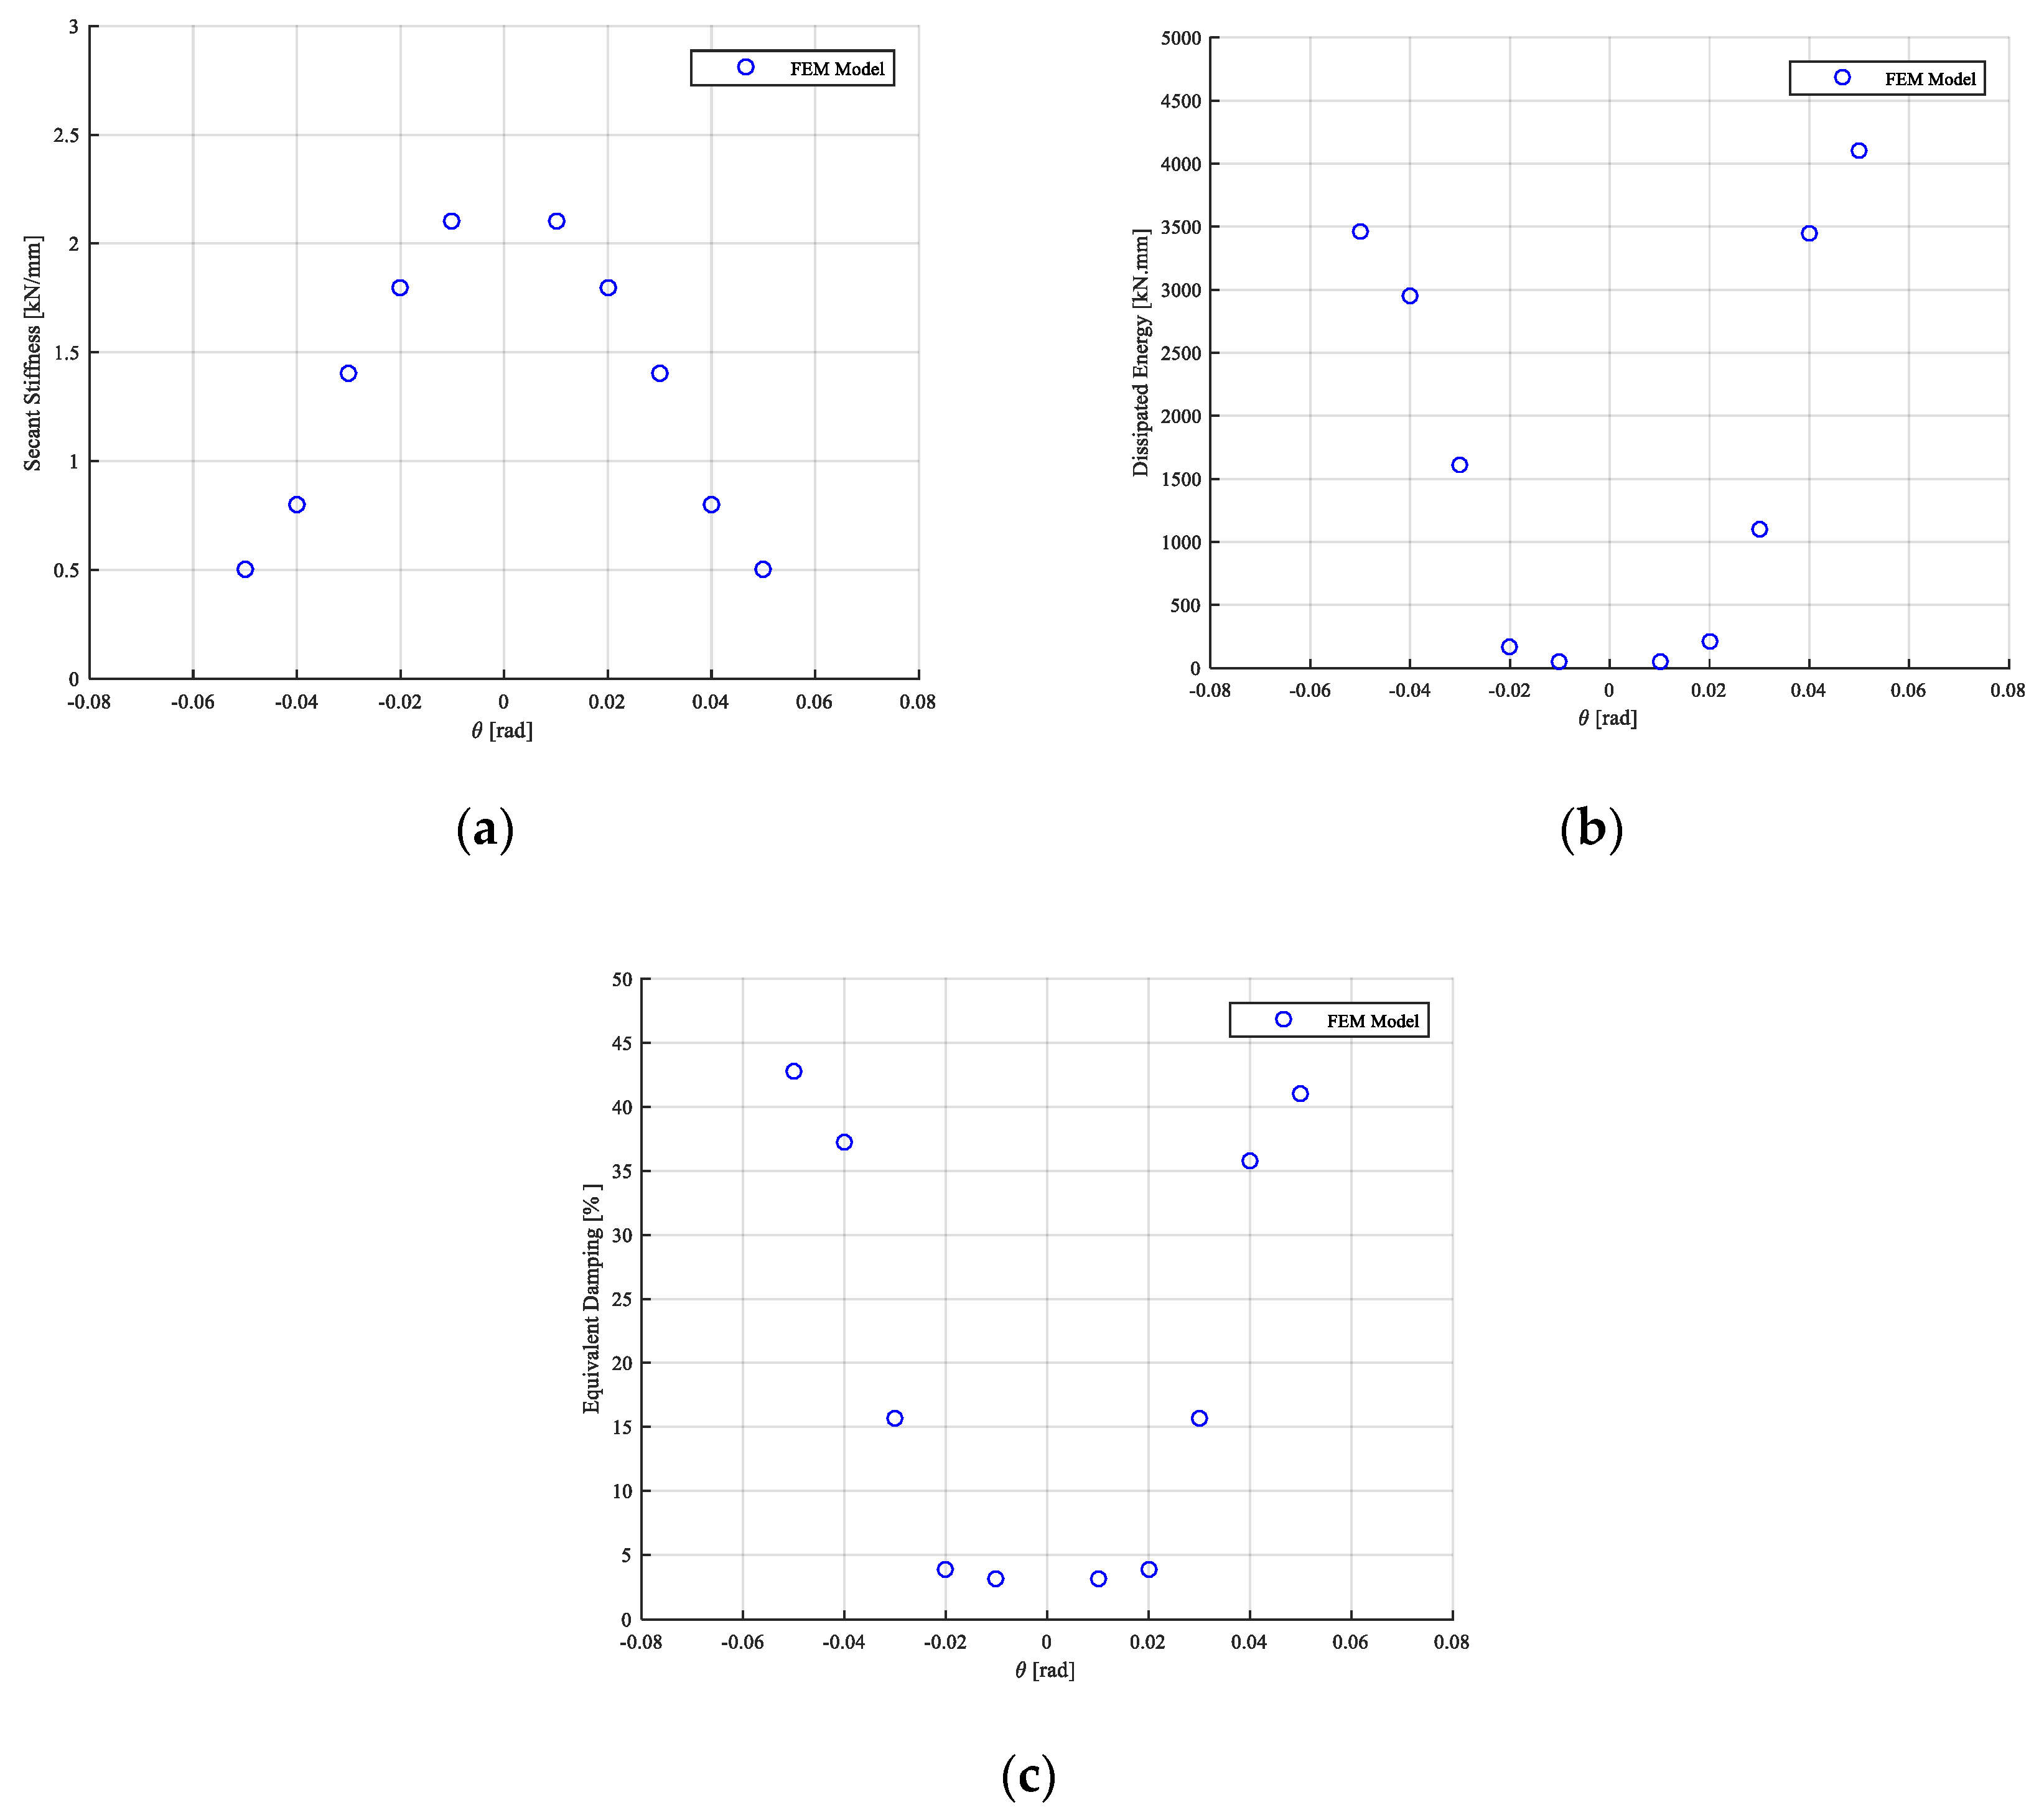
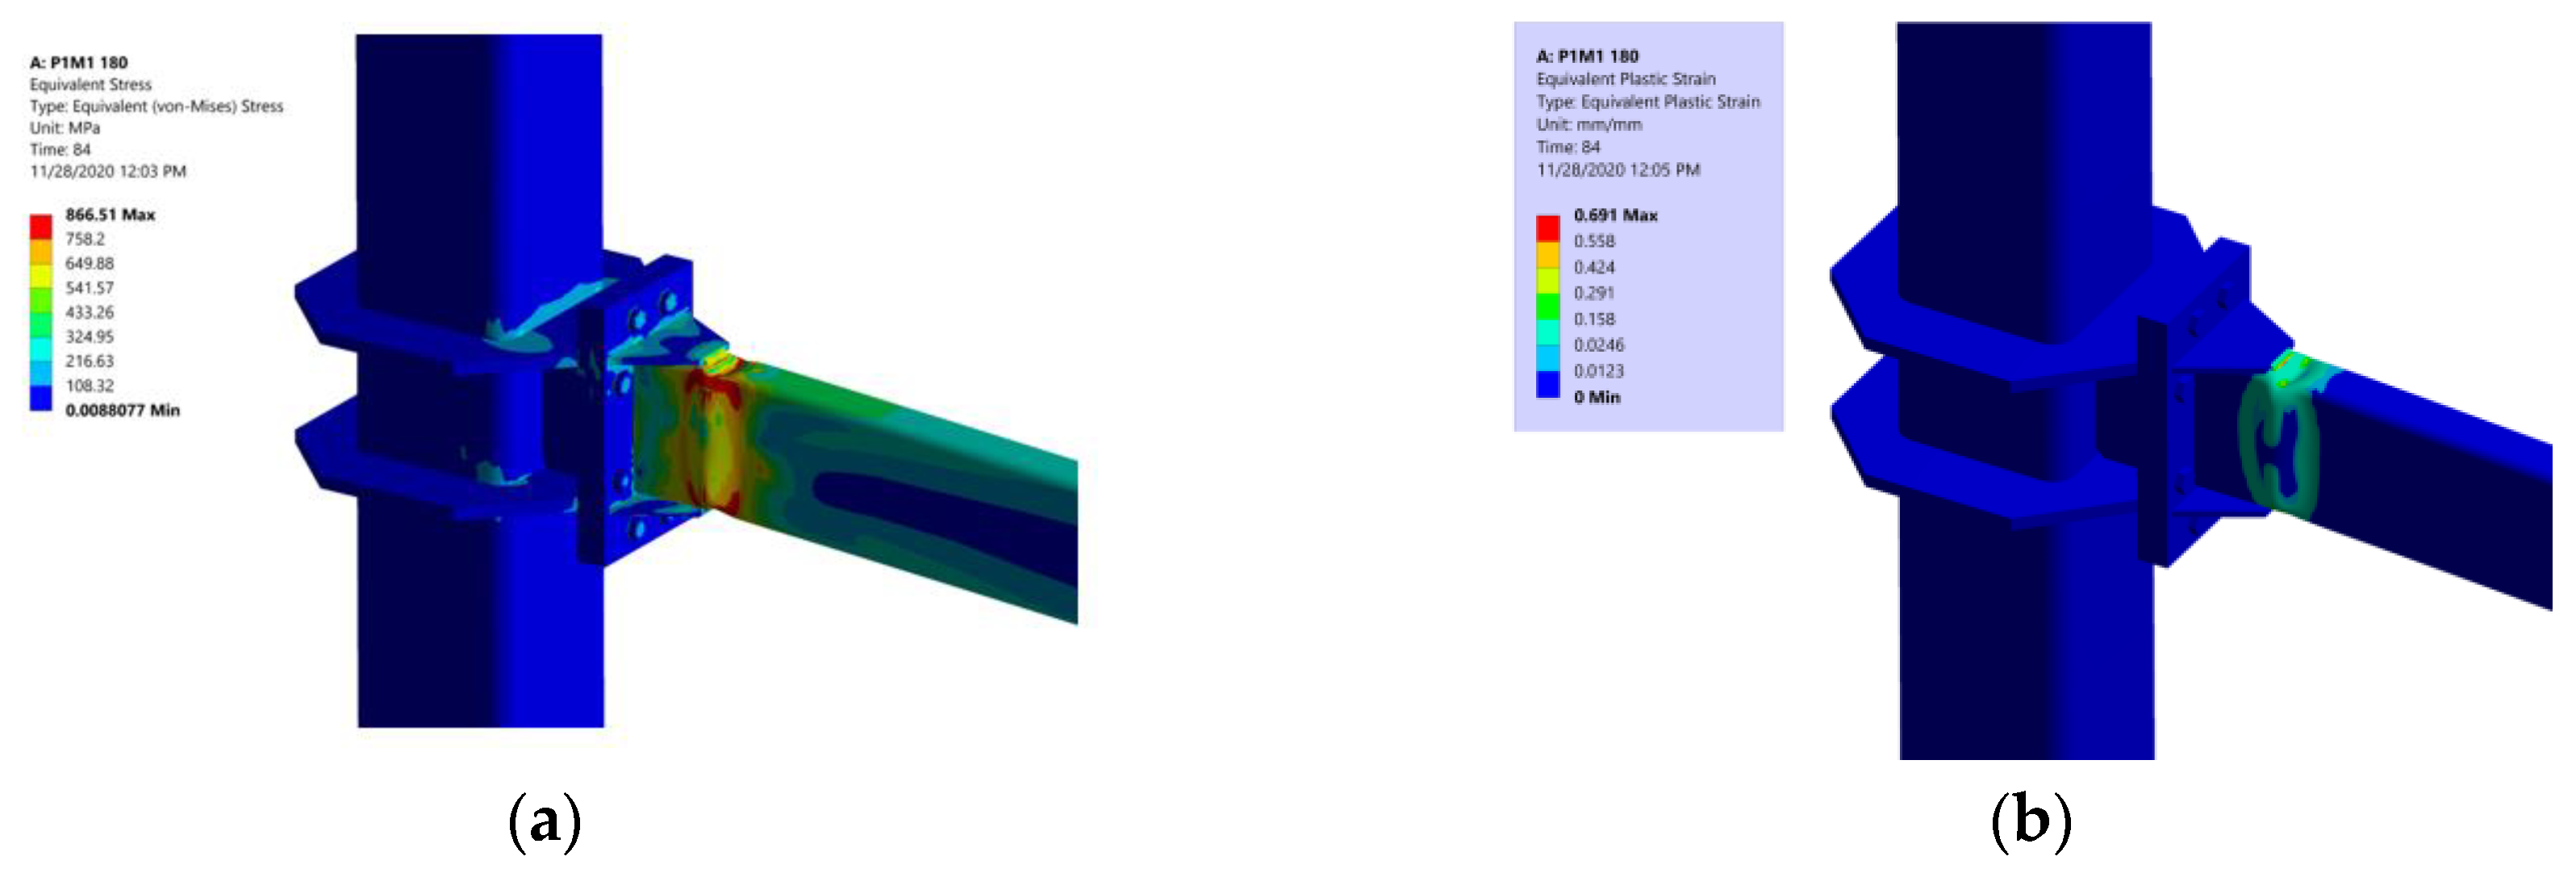
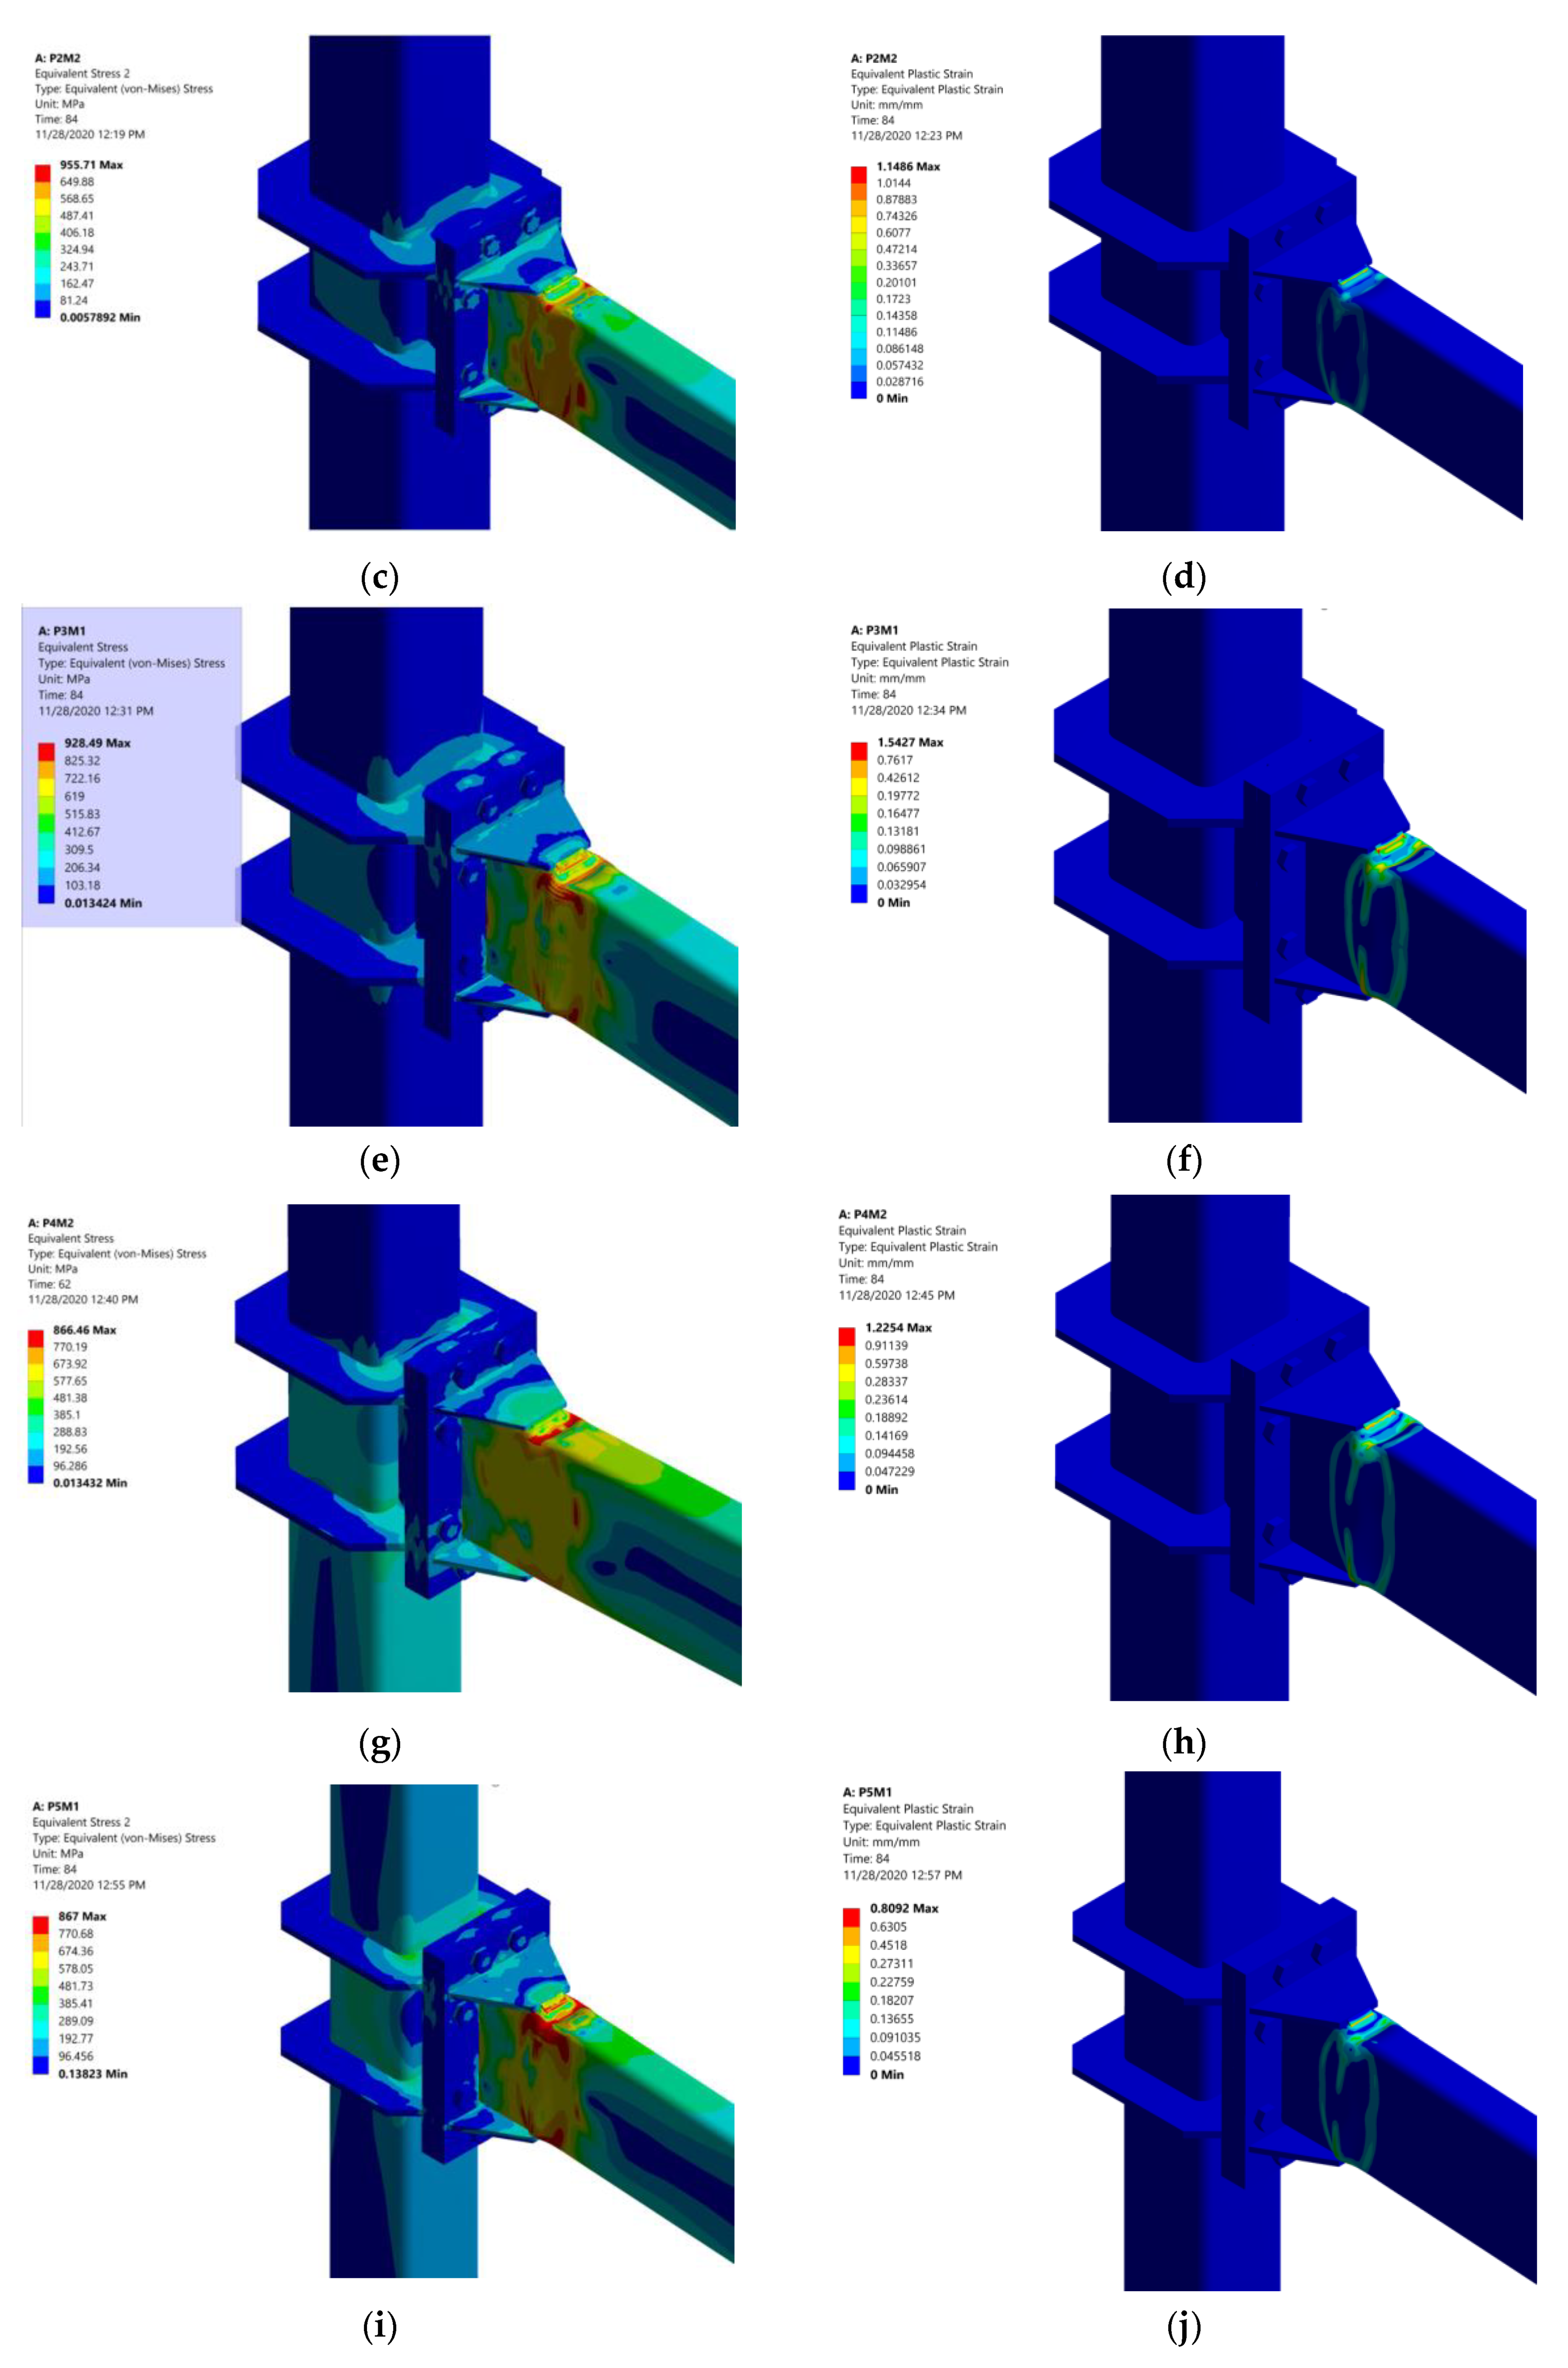
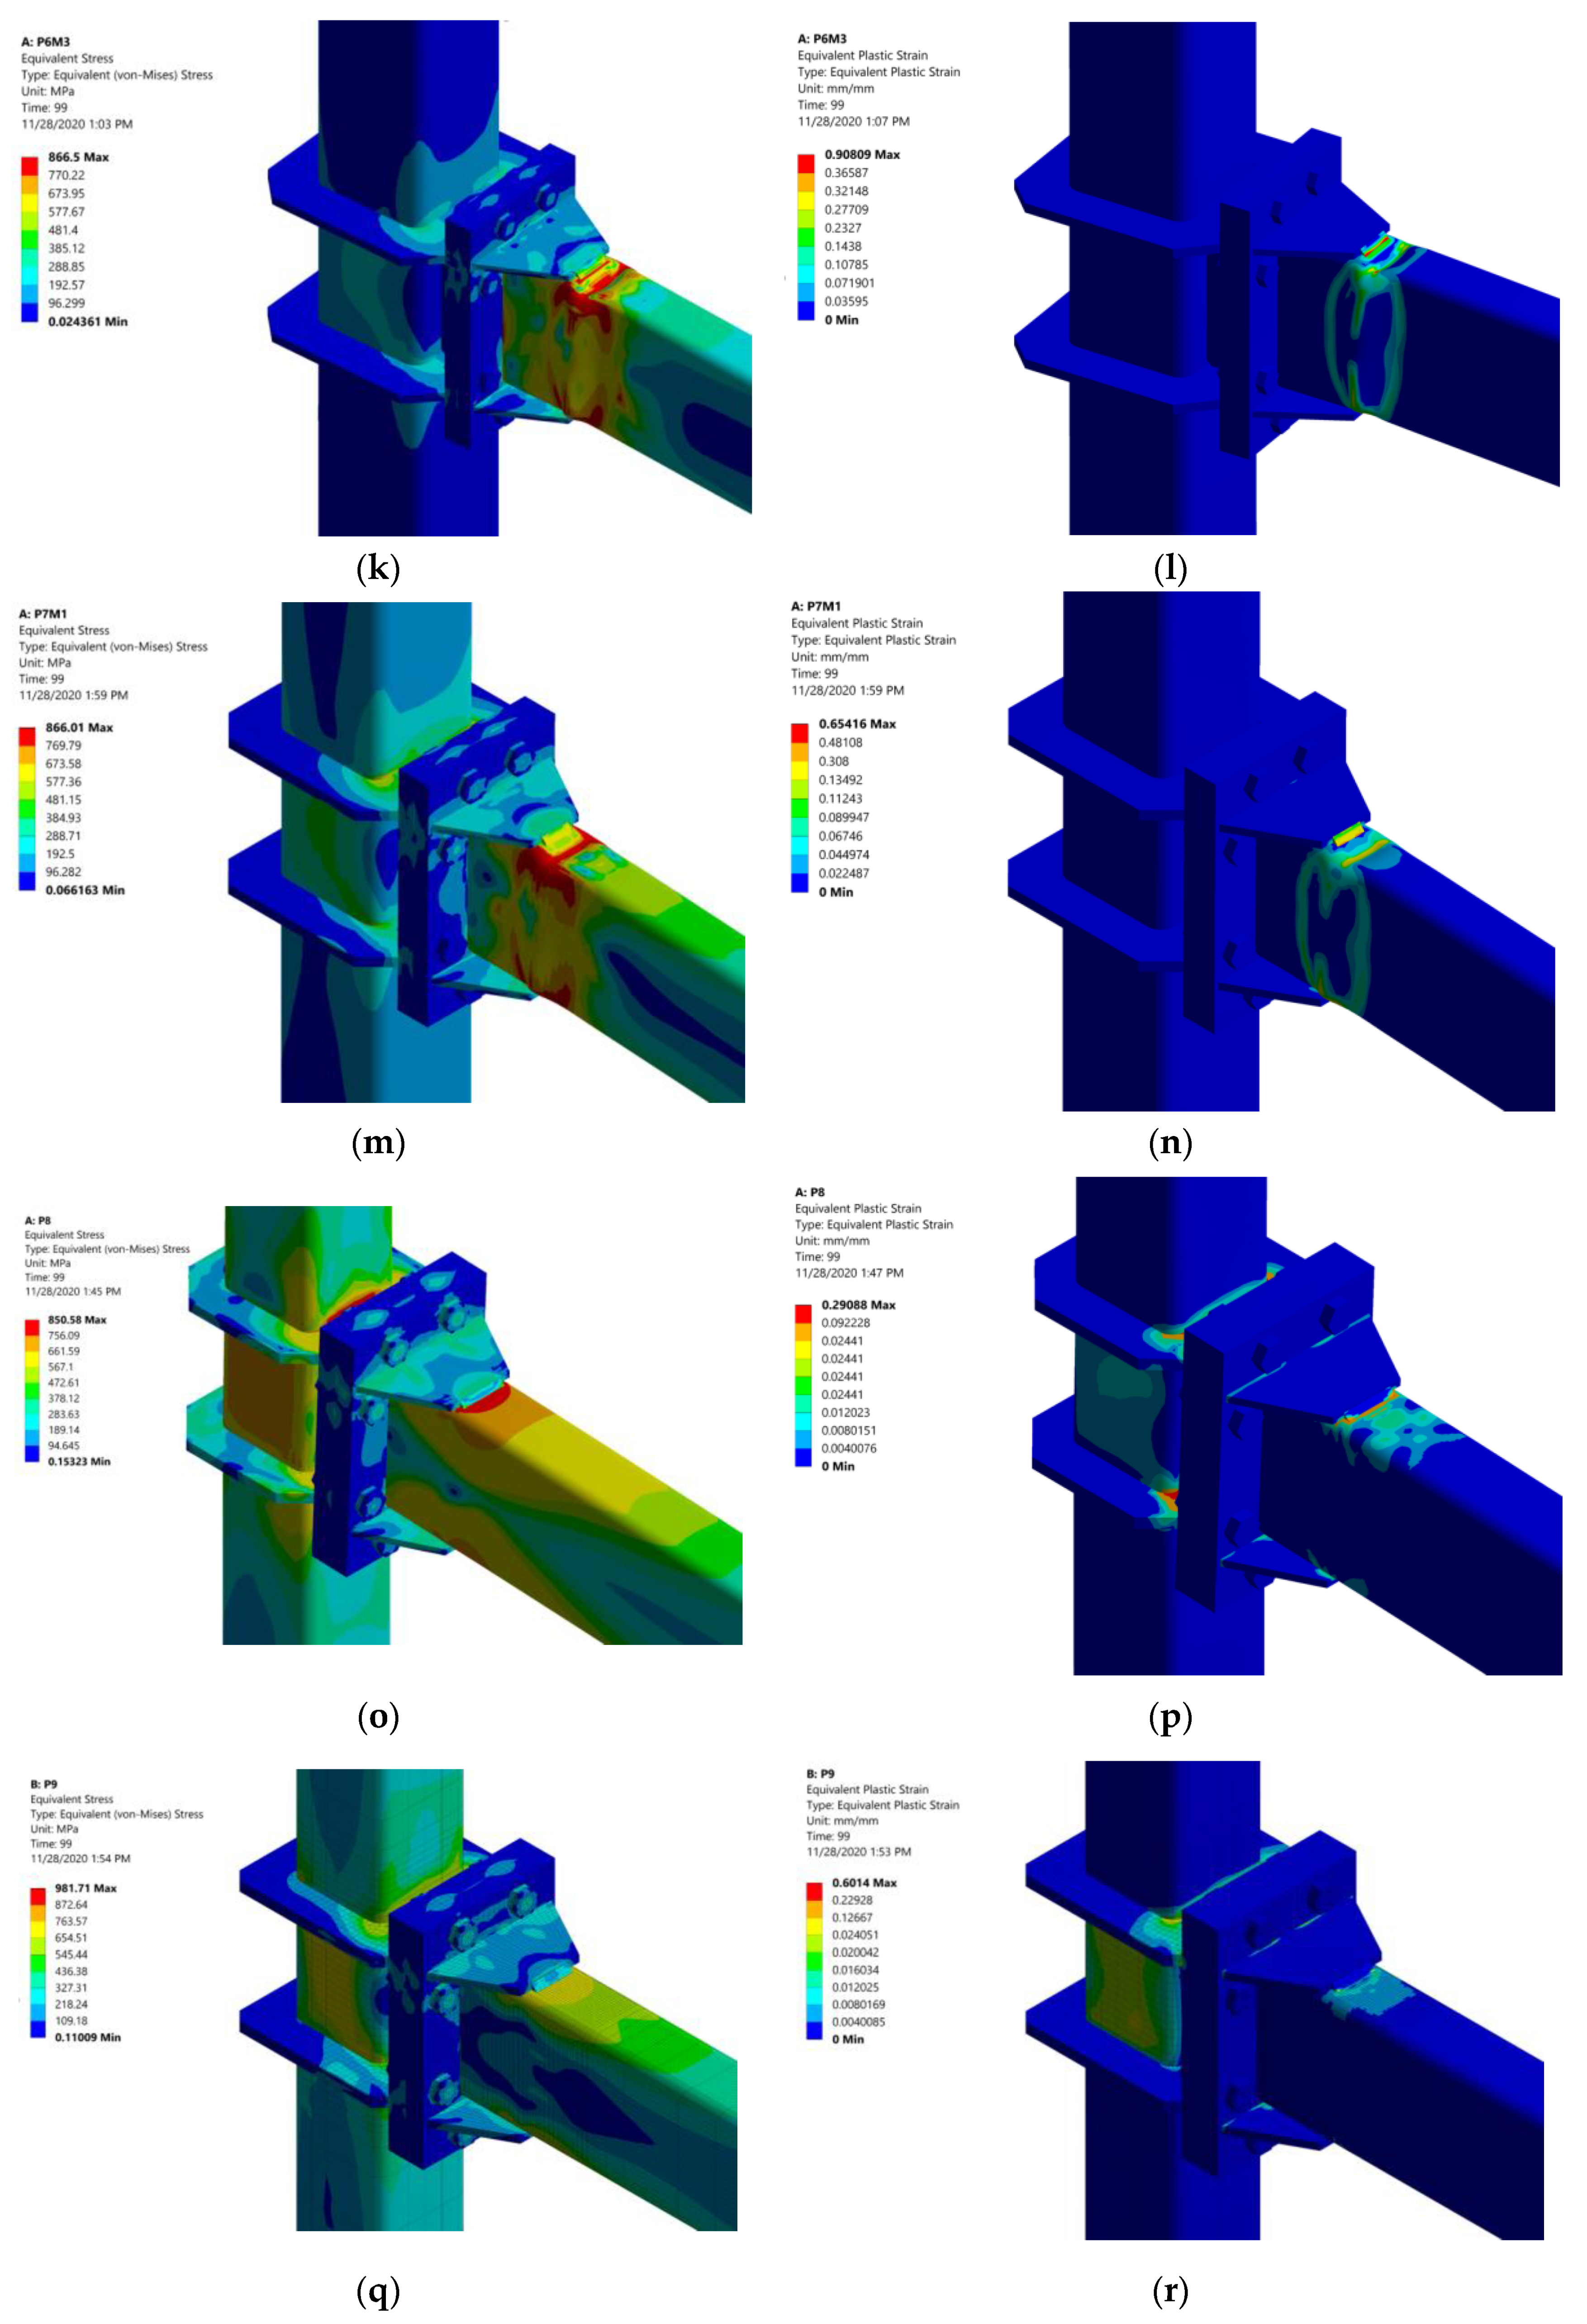
4.5. Results of Numerical Model

The results of the numerical study are shown according to load-displacement, normalized moment-rotation, secant stiffness-rotation, dissipated energy-rotation and equivalent damping-rotation curves. In order to evaluate the stress and deformation distribution, the von Mises equivalent stress distribution and plastic deformations at the point of maximum load are shown in Figure 13a,b, respectively. The equivalent stresses are mainly concentrated in the beam and the plastic strain developed uniquely in the beam. These results are similar to those obtained in experimental tests.
The numerical model reached a peak load of 61.18 [kN], a flexural resistance in the beam of 2.16 Mp, and maximum interstory drift angle of 0.06 [rad], as is reported in the Figure 14a,b. An acceptable adjust in the cyclic response of numerical model was obtained in comparison to the specimens tested. The FE (finite element) model was able to reproduce the loss of resistance and rigidity of moment connection studied.
The values of secant stiffness, dissipated energy and equivalent damping are shown in Figure 15a–c respectively. However, a symmetric response in the secant stiffness of the numerical model was obtained, which is different to the results obtained in the experimental study. Furthermore, a similar pattern of dissipated energy was obtained to 4% drift ratio; nevertheless, differences in the values from 4% were reported between the specimens tested and the numerical model. In the Figure 15c, a 4% of equivalent damping at 2% of drift ratio was reached.

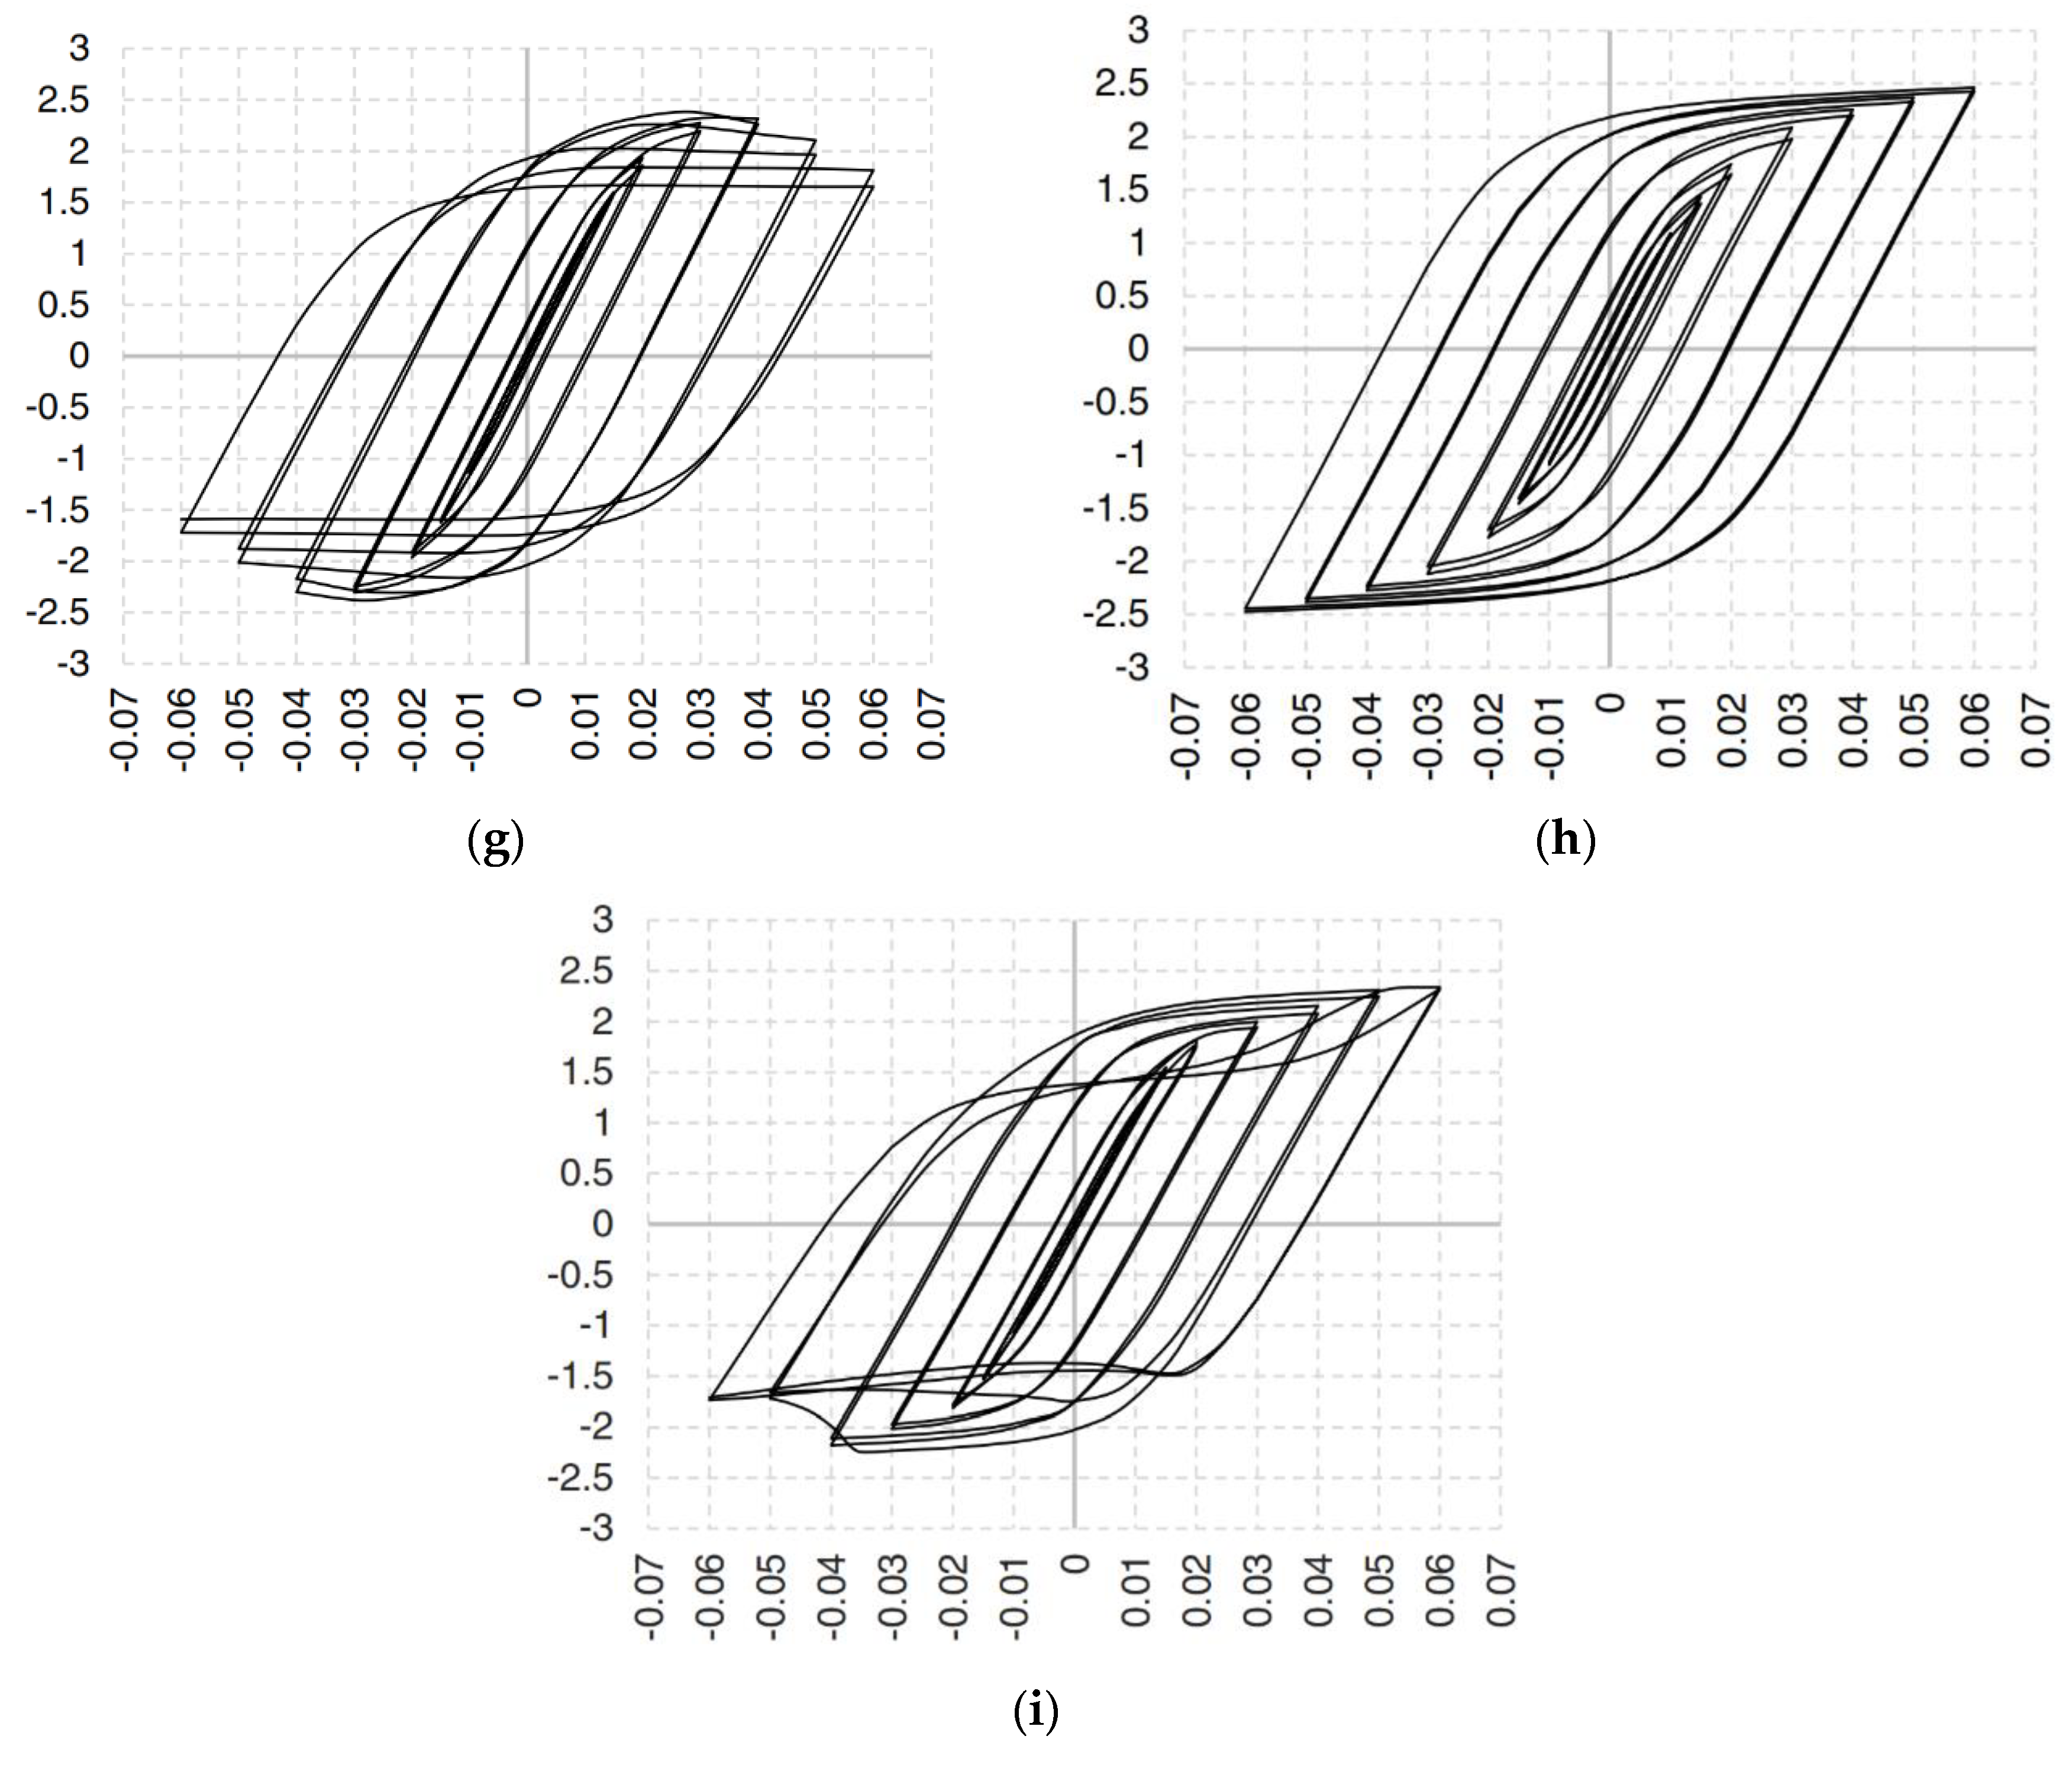
5. Cyclic Response of HSS Moment Connection with Other Configurations

In Table 7, the maximum load, maximum displacement, the normalized moment by plastic moment (Mp = Fy × Zx = 43.42 [kN·m]), maximum moment and maximum rotation reached in tests and numerical model are reported. Tests and the FE model reached a flexural resistance greater than nominal plastic moment according to [26,28]. In Figure 16, the normalized moment-rotation curves of the experimental and FE model are compared, obtaining an acceptable level of adjustment. Therefore, from the calibrated numerical model, other configurations with different sizes of beams and columns were studied.
In Table 8, several combinations of beams and columns commonly used in residential buildings located in South America are shown. The Model P0 is the numerical model calibrated from experimental tests.
In Figure 17, the equivalent stress and plastic strain distribution of each numerical model is shown. A similar behavior in comparison to specimens tested was obtained. The inelastic incursion is concentrated in the beam for all models except in the P8 and P9 models, where a combined failure mechanism was reached. However, the P9 model developed an important concentration of plastic strain in the column. The size of the beam plays an important role, specifically when the thickness of the wall tube is increased.
In Figure 18, normalized moment-rotation curves are shown for all numerical models indicated in Table 8. The cyclic response is comparable in terms of flexural strength for beams with thickness in a wall tube less than 7 [mm] (Model P1 to model P6). However, for higher thickness in a wall tube the behavior is modified. Furthermore, an excessive thickness in flanges of the beam cannot be desired, such as is observed in model P9 compared to model P8.

6. Conclusions

In this paper, the cyclic behavior of hollow section beam–column moment connection was studied. Three large-scale specimens were tested and a numerical model was calibrated, reaching a good adjustment. Later, several configurations of beams and columns were evaluated using FE models from the numerical model previously calibrated. Cyclic response in terms of flexural resistance, secant stiffness, dissipated energy and equivalent damping was assessed.
A flexural resistance higher 0.80 Mp at 0.04 [rad] was obtained for all cases studied. The specimens tested showed damage concentrated in the beam, while the column and elements of connections were not reported. However, once the peak load in the moment connection is reached, a rapid decrease of the flexural resistance is obtained. The ductility factor in the 3 specimens is lower than 2.5, therefore a non-ductile behavior is controlled in the connection. This aspect is very important although a 0.8 Mp at 0.04 [rad] is achieved. Furthermore, a new yield line mechanism was verified with a numerical model and validated with experimental tests.
The numerical study calibrated from experimental curves was performed. The degradation of stiffness and strength was captured by the FE model. The results revealed that the FE model was able to predict the structural performance of HSS moment connection. An enlargement of numerical study with variation in sizes of beams and columns from commercial sections was performed. The results obtained showed a similar behavior in the models analyzed without modification of non-ductile behavior.
Finally, the typical welded moment connection can be improved using the bolted HSS moment connection, which allows the concentration of inelastic incursion in the beam compared with the welded solution. However, a non-ductile behavior derived from local buckling in flanges of the tubular beam can affect the seismic performance.

Author Contributions

Conceptualization, F.G., E.N.; methodology, E.N.; software, N.B., F.G., E.N.; validation, E.N.; formal analysis, E.N.; investigation, E.N., R.T., R.P., N.G.; writing—original draft preparation, E.N., R.P.; writing—review and editing, E.N.; visualization, E.N.; supervision, E.N., R.P., N.G. All authors have read and agreed to the published version of the manuscript.

Funding

This research received no external funding.

Acknowledgments

The HSS members were donated by INDUSTRIAS UNICON (Arcelor Mittal Company in Caracas, Venezuela) and fabrication of the specimens was performed by the RIGEL, C.A. Additionally, the authors thank Héctor Andrés Díaz Casado for support during the research and the Lisandro Alvarado University (UCLA-Venezuela) for experimental tests and project VIP FEDEQUIP2019-INRN-03.

Conflicts of Interest

The authors declare no conflict of interest.

Abbreviations

SymbolDefinition
bfFlange width of the beam
bpWidth of end-plate
dOverall depth of beam
deColumn bolt edge distance
FySpecified minimum yield stress of the yielding element
g1Horizontal distance (gage) between fastener lines
g2Horizontal distance (gage) between fastener lines below cover plate
hiDistance from centerline of compression flange to the centerline of the ith tension bolt row
hoDistance from centerline of compression flange to the tension-side outer bolt row in EP-HSS moment connection
lilength of yield line
mpplastic momento of beam
mpiplastic moment internal of beam
MMoment obtained
MfProbable maximum moment at face of column
MnNominal flexural strength of beam
MpPlastic moment of beam
pfiVertical distance from inside of a beam tension flange to nearest inside bolt row
pfoVertical distance from inside of a beam tension flange to nearest outside bolt row
sDistance from centerline of most inside or most outside tension bolt row to the edge of a yield line pattern
tpThickness of end-plate
WEExternal work
WiInternal work
YpEnd-plate yield line mechanism parameter
δ1Virtual displacement for yield line 2
δ2Virtual displacement for yield line 5
δ3Virtual displacement for yield line 3, 7 and 8
εuUltimate deformation
εyYielding deformation
ϕdResistance factor for ductile limit states
θRotation angle due to moment of beam
θiRotation internal
σuUltimate stress
σyYielding stress

References

  1. Sherman, D.R. Designing with structural tubing. Eng. J. AISC 1996, 33, 101–109. [Google Scholar]
  2. FEMA-355D. State of the Art Report on Connection Performance; Federal Emergency Management Agency: Washington, DC, USA, 2000.
  3. Wheeler, A.; Clarke, M.; Hancock, G.; Murray, T. Design model for bolted moment end-plate connections using rectangular hollow sections. In Report of Centre for Advanced Structural Engineering; Department of Civil Engineering, University of Sydney: Sydney, Australia, 1997. [Google Scholar]
  4. Guerrero, N.; Marante, M.E.; Picón, R.; Flórez-López, J. Model of local buckling in steel hollow structural elements subjected to biaxial bending. J. Constr. Steel Res. 2007, 63, 779–790. [Google Scholar] [CrossRef]
  5. Marante, M.; Picón, R.; Guerrero, N.; Flórez-López, J. Local buckling in tridimensional frames: Experimentation and simplified analysis. Lat. Am. J. Solids Struct. 2012, 9, 691–712. [Google Scholar]
  6. Fadden, M. Cyclic Bending Behavior of Hollow Structural Sections and Their Application in Seismic Moment Frame Systems. Ph.D. Thesis, University of Michigan, Ann Arbor, MI, USA, 2013. [Google Scholar]
  7. Fadden, M.; McCormick, J. Finite element model of the cyclic bending behavior of hollow structural section beam members. J. Constr. Steel Res. 2014, 94, 64–75. [Google Scholar] [CrossRef]
  8. Fadden, M.; McCormick, J. HSS-to-HSS seismic moment connection performance and design. J. Constr. Steel Res. 2014, 101, 373–384. [Google Scholar] [CrossRef]
  9. Esfandyary, R.; Razzaghi, M. and Eslami, A. A parametric investigation on the hysteretic behavior of CFT column to steel beam connections. Struct. Eng. Mech. 2015, 55, 205–228. [Google Scholar] [CrossRef]
  10. Faridmehr, I.; Osman, M.H.; Tahir, M.B.M.; Nejad, A.F.; Hodjati, R. Seismic and progressive collapse assessment of SidePlate moment connection system. Struct. Eng. Mech. 2015, 54, 35–54. [Google Scholar] [CrossRef]
  11. Ataollahi, S.; Banan, M.-R.; Banan, M.-R. Numerical cyclic behavior of T-RBS: A new steel moment connection. Steel Compos. Struct. 2016, 21, 1251–1264. [Google Scholar] [CrossRef]
  12. Saleh, A.; Zahrai, S.M.; Mirghaderi, S.R. Experimental study on innovative tubular web RBS connections in steel MRFs with typical shallow beams. Struct. Eng. Mech. 2016, 57, 785–808. [Google Scholar] [CrossRef]
  13. Yang, C.; Yang, J.F.; Su, M.S.; Liu, C.Z. Numerical study on seismic behaviors of ConXtech® ConXLTM biaxial moment connection. J. Constr. Steel Res. 2016, 121, 185–201. [Google Scholar] [CrossRef]
  14. ANSI/AISC 358-16. Prequalified Connections for Special and Intermediate Steel Moment Frames for Seismic Applications; ANSI: Washington, DC, USA, 2016. [Google Scholar]
  15. Liu, X.-C.; Yang, Z.; Wang, H.; Zhang, A.; Pu, S.; Chai, S.; Wu, L. Seismic performance of H-section beam to HSS column connection in prefabricated structures. J. Constr. Steel Res. 2017, 138, 1–16. [Google Scholar] [CrossRef]
  16. Nuñez, E.; Torres, R.; Herrera, R. Seismic performance of moment connections in steel moment frames with HSS columns. Steel Compos. Struct. 2017, 25, 271–286. [Google Scholar]
  17. Tahir, M.M.; Mohammadhosseini, H.; Poi-Ngian, S.; Effendi, M.K. I-beam to square hollow column blind bolted moment connection: Experimental and numerical study. J. Constr. Steel Res. 2018, 148, 383–398. [Google Scholar] [CrossRef]
  18. Wang, J.; Lü, J.; Zhang, H.; Zhao, C. Experimental investigation on seismic performance of endplate composite joints to CFST columns. J. Constr. Steel Res. 2018, 145, 352–367. [Google Scholar] [CrossRef]
  19. Ali, A.M.; Masmoudi, R. Experimental and analytical investigation of new concrete filled FRP tube beam-column connections. Eng. Struct. 2019, 191, 311–322. [Google Scholar] [CrossRef]
  20. Eslami, M.; Namba, H.; Kodur, V.; Mahamid, M.; Morovat, M.A. Seismic behavior of composite beam connected to HSS column with large width-to-thickness ratio. Eng. Struct. 2019, 183, 423–442. [Google Scholar] [CrossRef]
  21. Kishiki, S.; Lee, D.-S.; Yamada, S.; Ishida, T.; Jiao, Y. Low-cycle fatigue performance assessment of current Japanese steel beam-to-column connections determined by ductile fracture. Eng. Struct. 2019, 182, 241–250. [Google Scholar] [CrossRef]
  22. Yang, Y.; Wang, Y.; Yang, F.; An, Q. Influence of weld details on fracture behavior of connections using high-strength steel. J. Constr. Steel Res. 2019, 153, 578–587. [Google Scholar] [CrossRef]
  23. Jiang, J.; Chen, S. Experimental and numerical study of double-through plate connections to CFST column. J. Constr. Steel Res. 2019, 153, 385–394. [Google Scholar] [CrossRef]
  24. Ye, J.; Mojtabaei, S.M.; Hajirasouliha, I. Seismic performance of cold-formed steel bolted moment connections with bolting friction-slip mechanism. J. Constr. Steel Res. 2019, 156, 122–136. [Google Scholar] [CrossRef] [Green Version]
  25. Liu, X.-C.; Cui, F.Y.; Zhan, X.X.; Yu, C.; Jiang, Z.Q. Seismic performance of bolted connection of H-beam to HSS-column with web end-plate. J. Constr. Steel Res. 2019, 156, 167–181. [Google Scholar] [CrossRef]
  26. ANSI/AISC 341-16. Seismic Provisions for Structural Steel Buildings; American Institute of Steel Construction: Chicago, IL, USA, 2016. [Google Scholar]
  27. Johansen, K.W. Brudlinieteorier; Gjellerup Forlag: Copenhagen, Denmark, 1943. [Google Scholar]
  28. ANSI/AISC 360-16. Specification for Structural Steel Buildings; American Institute of Steel Construction: Chicago, IL, USA, 2016. [Google Scholar]
  29. Chopra, A.K. Dynamics of Structures: Theory and Applications to Earthquake Engineering; Prentice-Hall: Englewood Cliffs, NJ, USA, 2007. [Google Scholar]
  30. ANSYS. Multiphysics version 17.2; ANSYS Inc.: Canonsburg, PA, USA, 2017. [Google Scholar]
  31. Díaz, C. Diseño de Uniones Semirrígidas Mediante Simulación Numérica y Modelos Kriging. Ph.D. Thesis, Universidad Politécnica de Cartagena, Cartagena, Spain, 12 April 2010. (In Spanish). [Google Scholar]
  32. Kim, T.S.; Kuwamura, H. Finite element modeling of bolted connections in thin-walled stainless steel plates under static shear. Thin Walled Struct. 2007, 45, 407–421. [Google Scholar] [CrossRef]
  33. Diaz, C.; Victoria, M.; Martí, P.; Querin, O.M.; Martí, P. FE model of beam-to-column extended end-plate joints. J. Constr. Steel Res. 2011, 67, 1578–1590. [Google Scholar] [CrossRef]
  34. Bravo, M.A.; Herrera, R. Performance under cyclic load of built-up T-stubs for Double T moment connections. J. Constr. Steel Res. 2014, 103, 117–130. [Google Scholar] [CrossRef]
Figure 1. View of hollow structural section (HSS) moment connection.
Metals 10 01608 g001
Figure 2. (a) View of end-plate yield line mechanisms of HSS moment connection, (b) lateral view of connection to calculate the conditions of plastic moment and deformation using the virtual work performed.
Metals 10 01608 g002
Figure 3. (a) Dimensions of end-plate [mm], (b) lateral view of the HSS moment connection [mm], (c) plan view of HSS moment connection [mm].
Metals 10 01608 g003aMetals 10 01608 g003b
Figure 4. (a) Schematic view of test assembly, units in [mm] and (b) location of linear variable differential transformer (LVDT) in test assembly.
Metals 10 01608 g004
Figure 5. (a) Load vs. displacement hysteresis curve of test 1, (b) view of damage in test 1, (c) load vs. displacement hysteresis curve of test 2, (d) view of damage in test 2, (e) load vs. displacement hysteresis curve of test 3, (f) view of damage in test 3.
Metals 10 01608 g005aMetals 10 01608 g005b
Figure 6. Normalized moment rotation hysteresis curves: (a) test 1, (b) test 2 and (c) test 3. Note: Mmax, is the maximum moment reached in the test and Mp, is the plastic moment.
Metals 10 01608 g006
Figure 7. Comparison of normalized moment vs. rotation curve between test 1, test 2 and test 3.
Metals 10 01608 g007
Figure 8. (a) Secant stiffness vs. rotation curve of test 1, (b) Secant stiffness vs. rotation curve of test 2, (c) Secant stiffness vs. rotation curve of test 3.
Metals 10 01608 g008
Figure 9. (a) Dissipated energy vs. rotation curve of test 1, (b) equivalent damping vs. rotation curve of test 1, (c) dissipated energy vs. rotation curve of test 2, (d) equivalent damping vs. rotation curve of test 2, (e) dissipated energy vs. rotation curve of test 3, (f) equivalent damping vs. rotation curve of test 3.
Metals 10 01608 g009aMetals 10 01608 g009b
Figure 10. Mesh used in numerical model.
Metals 10 01608 g010
Figure 11. Boundary conditions in numerical model.
Metals 10 01608 g011
Figure 12. Relation stress-strain of materials used in experimental and numerical study: (a) ASTM-A-36 material (stiffeners and end-plates), (b) ASTM-A-500 Gr. C material (beam), (c) ASTM-A-500 Gr. B material (column) and (d) ASTM-A-325 material (bolts).
Metals 10 01608 g012
Figure 13. (a) Distribution of von Mises stress and (b) plastic strain, at maximum displacement of numerical model.
Metals 10 01608 g013
Figure 14. (a) Load vs. displacement curve, (b) normalized moment vs. rotation curve in numerical model.
Metals 10 01608 g014
Figure 15. (a) Secant stiffness vs. rotation curve, (b) dissipated energy vs. rotation curve, (c) equivalent damping vs. rotation in numerical model.
Metals 10 01608 g015
Figure 16. Comparison of normalized moment vs. rotation curve between tests and FE model.
Metals 10 01608 g016
Figure 17. Equivalent stress distribution: (a) P1 model, (c) P2 model, (e) P3 model, (g) P4 model, (i) P5 model, (k) P6 model, (m) P7 model, (o) P8 model, (q) P9 model, and Plastic strain distribution: (b) P1 model, (d) P2 model, (f) P3 model, (h) P4 model, (j) P5 model, (l) P6 model, (n) P7 model, (p) P8 model, (r) P9 model.
Metals 10 01608 g017aMetals 10 01608 g017bMetals 10 01608 g017c
Figure 18. Normalized moment vs. rotation curves: (a) P1 model, (b) P2 model, (c) P3 model, (d) P4 model, (e) P5 model, (f) P6 model, (g) P7 model, (h) P8 model, (i) P9 model.
Metals 10 01608 g018aMetals 10 01608 g018b
Table 1. Virtual rotations (θ) and yield line lengths (l).
Yield LineLength (li)Rotation (θi)
1 b p θ
2 ( b p b f ) / 2 θ ( h i / s )
3 p f i + s 2 θ ( h i ( g 2 b f ) )
4 ( b p b f ) / 2 θ ( h i p f i )
5 b p θ ( h o p f o )
6 b p θ ( h o p f o 1 )
7 l 7 θ h i l 7 ( g 2 b f 2 s + 2 s g 2 b f )
8 l 8 θ h i l 8 ( g 2 b f 2 p f i + 2 p f i g 2 b f )
9 ( b p g 2 ) / 2 θ ( h i p f i + h i s )
Table 2. Tensile coupon specimen properties.
ElementDesignationΣy [MPa]εyσu [MPa]εu
Stiffeners, End-platesASTM-A-363800.00185750.20
Beam 200 × 70 × 4.3ASTM-A-500 Gr. C4500.00245170.007
Column 220 × 220 × 9ASTM-A-500 Gr. B4960.00255970.01
BoltASTM-A-3256340.00368480.14
Notes: (σy), Yield stress, (εy), Yield strain, (σu), Ultimate stress, (εu), Ultimate strain.
Table 3. Load protocol of tests and finite element model (FEM).
No.No. of CyclesDrift Angle (θ) [rad]
160.00375
260.005
360.0075
440.01
520.015
620.02
720.03
820.04
Note: continue loading at increments of θ = 0.01 [rad], with two cycles of loading at each step.
Table 4. Summary of maximum values obtained in tests.
SpecimenLmax [kN]Dmax [mm]M/MpMmax [kN.m]Rmax [rad]
Test 160.2475.172.1290.350.05
Test 262.2575.182.2093.370.05
Test 360.8675.172.1591.300.05
Notes: (Lmax) Maximum load, (Dmax) Maximum displacement, (M/Mp) Normalized Moment, (Mmax) Maximum moment obtained and (Rmax) Maximum rotation obtained.
Table 5. Elements and nodes in numerical model.
ComponentNumber of ElementsNumber of Nodes
End-plates460024,975
Column296019,128
Beam626443,411
Bolts10,61918,948
Vertical Stiffener1321042
Horizontal Stiffener225013,444
Table 6. Type of contacts used in the numerical models.
Elements ConnectionContactMovement in Normal DirectionMovement in Tangential Direction
Column-Horizontal StiffenersBondedNo separationNo slip
Column-Vertical StiffenersBondedNo separationNo slip
Vertical Stiffeners-Horizontal StiffenersBondedNo separationNo slip
End-plate-Horizontal StiffenersBondedNo separationNo slip
End-plate-Vertical StiffenersBondedNo separationNo slip
End-plate-End-plateFrictionalSeparation allowedSlip allowed
Beam-End-plate, Bolt-NutBondedNo separationNo slip
Bolt- End-plate, Nut-End-plateFrictionlessSeparation allowedSlip allowed
Table 7. Summary of maximum values obtained in tests and finite element (FE) model.
SpecimenLmax [kN]Dmax [mm]M/MpMmax [kN.m]Rmax [rad]
Test S-0160.2475.172.1290.350.05
Test S-0262.2575.182.2093.370.05
Test S-0360.8675.172.1591.300.05
FEM Model61.18902.1691.770.06
Notes: (Lmax) Maximum load, (Dmax) Maximum displacement, (M/Mp) Normalized Moment, (Mmax) Maximum moment obtained and (Rmax) Maximum rotation obtained.
Table 8. Matrix of simulation with different sizes of beams and columns.
Numerical ModelDimension of Column [mm]Dimension of Beam [mm]
P0220 × 220 × 9200 × 70 × 4.3
P1220 × 220 × 9180 × 65 × 4
P2220 × 220 × 9220 × 90 × 4.5
P3220 × 220 × 9260 × 90 × 5.5
P4220 × 220 × 9300 × 100 × 5.5
P5220 × 220 × 9300 × 100 × 7
P6260 × 260 × 11320 × 120 × 7
P7260 × 260 × 11320 × 120 × 9
P8260 × 260 × 11350 × 170 × 9
P9260 × 260 × 11350 × 170 × 11
Publisher’s Note: MDPI stays neutral with regard to jurisdictional claims in published maps and institutional affiliations.

