Article

Prediction of Leidenfrost Temperature in Spray Cooling for Continuous Casting and Heat Treatment Processes

1
Heat Transfer and Fluid Flow Laboratory, Brno University of Technology, 61669 Brno, Czech Republic
2
Department of Mechanical and Aerospace Engineering, School of Engineering for Matter, Transport and Energy, Arizona State University, Tempe, AZ 85281, USA
3
Department of Power Engineering, Faculty of Mechanical Engineering, Technical University of Košice, 04200 Košice, Slovakia
*
Author to whom correspondence should be addressed.
Metals 2020, 10(11), 1551; https://doi.org/10.3390/met10111551
Submission received: 9 October 2020 / Revised: 5 November 2020 / Accepted: 16 November 2020 / Published: 22 November 2020
(This article belongs to the Section Metal Casting, Forming and Heat Treatment)

Abstract

:
Spray cooling of hot steel surfaces is an inherent part of continuous casting and heat treatment. When we consider the temperature interval between room temperature and for instance 1000 °C, different boiling regimes can be observed. Spray cooling intensity rapidly changes with the surface temperature. Secondary cooling in continuous casting starts when the surface temperature is well above a thousand degrees Celsius and a film boiling regime can be observed. The cooled surface is protected from the direct impact of droplets by the vapour layer. As the surface temperature decreases, the vapour layer is less stable and for certain temperatures the vapour layer collapses, droplets reach the hot surface and heat flux suddenly jumps enormously. It is obvious that the described effect has a great effect on control of cooling. The surface temperature which indicates the sudden change in the cooling intensity is the Leidenfrost temperature. The Leidenfrost temperature in spray cooling can occur anywhere between 150 °C and over 1000 °C and depends on the character of the spray. This paper presents an experimental study and shows function for prediction of the Leidenfrost temperature based on spray parameters. Water impingement density was found to be the most important parameter. This parameter must be combined with information about droplet size and velocity to produce a good prediction of the Leidenfrost temperature.

1. Introduction

The Leidenfrost temperature, TL, is of paramount importance to metal alloy quenching since it marks the transition from very poor heat transfer in film boiling to the far superior heat transfer associated with transition boiling [1]. The above sentence defines the purpose of the study presented in this paper well.
The Leidenfrost point is defined as the point where the film boiling curve experiences the minimum flux. Below this temperature, surface wetting increases heat flux rapidly. Even if the Leidenfrost point is clearly defined it is (in spray cooling cases) difficult to read it automatically from experiment data.
Yao [2] says: “The large scatter in the Leidenfrost temperature is due to the difficulty in selecting the exact point of minimum heat flux. As the Wes increases, the sharpness of the transition point decreases”. Al-Ahmadi [3] proposes identification of the Leidenfrost point in the same way that is used in this study: The Leidenfrost point is identified from the surface temperature versus time. This happens at the moment when the negative slope of the cooling curve suddenly becomes steeper, which means the cooling rate starts to increase.
Figure 1 shows an example of a cooling experiment where a hot steel pate is cooled by a water jet. The surface temperature records show a rapid change in the cooling rate 80 s into the experiment. At the same time, a rapid change in the heat transfer coefficient can be observed. A film boiling regime with heat transfer coefficient (HTC) of about 400 W·m−2·K−1 changes at 80 s into a nucleate boiling regime with HTC of about 4000 W·m−2·K−1. The Leidenfrost temperature is about 800 °C. The results of the experiment shown in Figure 1 demonstrate the great importance of knowledge of the Leidenfrost temperature for design and control of cooling.
The nature of the Leidenfrost temperature is documented in Figure 2. The results of the cooling experiment in the author’s laboratory are shown here. All of the measured data were obtained for one mist nozzle used in continuous casting. The only variable parameter is the flowrate. The Leidenfrost temperature grows as water impingement density increases and the values obtained are from 500 °C to over 1200 °C. The example shown in Figure 2 effectively documents how different cooling intensities for the mist nozzle with spray pressure settings can be. For example, for the surface temperature 800 °C the heat transfer coefficient can be between 200 W·m−2·K−1 and 13,000 W·m−2·K−1.
There are a number of papers where the Leidenfrost temperature is studied for single droplets. That is not the case with industrial sprays in metallurgy. Typical Leidenfrost temperatures for single droplets are in the range 100–300 °C. The authors of this paper fully agree with the statement of the reputable expert in the field, Professor Mudawar (Purdue University), published in 1992, that “experiments performed with single droplets seem to be of little or no value in characterizing the Leidenfrost temperature for sprays”.
Some fundamental findings from the studies with single droplets are mentioned below to help to understand the nature of the subject.
In [5] interesting information is presented about the influence of droplet velocity on TL. TL here is 180 °C for a velocity of 1 m·s−1 and 320 °C for a velocity of 20 m·s−1. This result shows how the droplet velocity is even important in sprays.
The same paper [5] gives data for spray volumetric fluxes (from 0.58 to 2.98 l·s−1·m−2). TL is shown here for the spray and the influence of the surface roughness. For a constant droplet velocity of 14 m·s−1 TL is 280 °C for polished aluminium and 240 °C for particle blasted aluminium. The above temperatures are given for spray but are much lower than in other papers.
Yao [3] studied the spray cooling of stainless steel in water impingement density from 7 to 21 l·m−2·s−1 and proposed a function for TL:
TL = 536.8 G0.116
where G is liquid impingement density in kg·m−2·s−1.
The Weber number (We) is a frequently used parameter for correlation of the Leidenfrost temperature.
The Weber number for droplets is defined as
We = ρ·v2·d/σ
where ρ is density in kg·m−3, v is droplet velocity in m·s−1, d is droplet diameter and σ is surface tension in N·m−1.
Yao [2] uses the Reynolds and Weber numbers related to spray:
ReS = G·d/µ
WeS = G2·d/ρ·σ
where G is liquid mass flux in kg·m−2·s−1 and µ is dynamic viscosity kg·m−1·s−1.
For TL relationship Yao [2] suggests
TL = 1400 WeS0.13
The results presented in this paper are for relative motion between the spray and a cooled surface. A velocity of 1 m·min−1 is used because it is considered a good example for continuous casting. There are not many references in the literature for moving surfaces and spray cooling. Zhang [6] published a description of an experimental technique for an experimental study of cooling in continuous casting. Gradeck [7] shows the influence of velocity in a range from 0.5 to 1.25 m·s−1 and reports a significant influence on cooling intensity both above and below TL but only [8] a minor effect on TL. Raudensky [4] gives data for a stationary experiment in contrast to the cooled surface at velocities of 2 m·min−1 and 5 m·min−1. The same paper shows the Leidenfrost temperature for three sizes of mist nozzles used in continuous casting (3, 4.5 and 7 mm) operating in a water pressure range of 0.5 bar to 7 bar and a constant air pressure of 2 bar. The Leidenfrost temperature is almost exactly 600 °C for all three nozzles for a pressure of 0.5 bar. The differences grow as feeding pressure increases. For a water pressure of 7 bar TL = 710 °C for a 3 mm nozzle, TL = 770 °C for a 4.5 mm nozzle and TL = 1170 °C for a 7 mm nozzle.
Sinha [8] studied the influence of surface roughness on the Leidenfrost temperature for immersion cooling and reported that roughness (from 1.3 µm to 6.6 µm) had a significant influence. Brozova [9] studied spray cooling for a flat nozzle with a spray angle of 80°. The flow rate at 0.2 MPa was 1.9 l·min−1; the nozzle moved at a velocity of 4 m·min−1 under the static test sample and the spray height was 300 mm. Brozova reported small differences in TL for surface roughness when Rz is between 2.2 and 35 µm and Ra is between 0.4 and 7.3 µm. Bigger differences were found for high levels of roughness (Rz over 50 µm) but the reading of TL was difficult because the dependence of the heat flux on the surface temperature was very flat, as described in [2].
Describing the influence of the oxide layer on the Leidenfrost temperature is not simple. Chabicovsky [10,11] reports that the change in surface roughness with oxidation is an important factor. There is no change in the Leidenfrost temperature when we study the cooling of an oxide surface or steel surface with equal roughness. The change in the cooling intensity of steel under the oxide layer can be enormous. The physical explanation is based on the major difference between the surface temperature of the oxide and the surface temperature of the steel under the oxide layer. The surface temperature of the oxide drops rapidly and quickly falls below the Leidenfrost temperature. The cooling of the sprayed oxide surface suddenly becomes very intensive and this effect can intensify the cooling of the steel and can cause a shift in the effective Leidenfrost temperature. Chabicovsky [11] uses the expression “effective” Leidenfrost temperature, which is related to the surface temperature of the steel and not to the sprayed surface of the scale. The fact that the oxide layer can intensify spray cooling in some metallurgical processes was reported in 2012 [12]. Fukuda [13] recently presented a study on spray cooling (water flow density 0.00167 m3/m2·s) where a defined layer of Al2O3 is formed on the steel substrate. Experiments with scale thickness from 50 µm to 210 µm again showed more intensive cooling with a thicker layer of oxides, a significantly higher Leidenfrost temperature. The same paper gives a graphical comparison of experiments with water cooling and air cooling. For air cooling the scale layer only acts as a thermal barrier which decreases the intensity of heat transfer. No effects with intensification of cooling typical for liquid spray cooling can be observed for air cooling. The study presented in this paper uses samples made of rolled austenitic steel and the presence of the oxides on the surface is not considered.
The temperature of the cooling water is another factor which can shift the Leidenfrost temperature. Hnizdil [14] describes a study motivated by an inexplicable change in cooling intensity at a continuous casting plant in summer when the cooling water was warmer. Measurements confirmed a decrease in the Leidenfrost temperature of 140 °C caused by an increase in the water temperature of 20 °C. This effect was observed only for the highest flowrates studied. For soft cooling the effect was significant only when the water temperature increased by 30 °C or more. Changes in cooling intensity in the film boiling area dependent on water temperature were reported in the same paper. The heat transfer coefficient increased by 13% when the temperature of the cooling water increased from 20 °C to 60–80 °C.
Yigit [15] studied spray cooling and the Leidenfrost effect using full cone mist nozzles with a narrow spray angle under stationary conditions without surface movement. The measurements considered two major parameters: liquid mass flux (from 2 to 12 kg·m−2·s−1) and air flow velocity (from 25 to 50 m·s−1). In this study the cooling effect is divided into two independent parts: the effect of the water jet and the effect of the air jet. Increases in droplet velocity due to air flow are not considered. The Leidenfrost temperature grows with growing air velocity. The results for a liquid mass flow of 7 kg·m−2·s−1 give a Leidenfrost temperature of 515 °C for an air velocity of 25 m·s−1 and TL 547 °C for an air velocity of 45 m·s−1.
The results presented in this paper are obtained for water sprays, steel surfaces of a natural character, and relative movement of the cooled surface under the spray. A typical example of industrial application is secondary cooling in continuous casting.

2. Laboratory Measurements

2.1. Plan of Experiments

Typical nozzles for use in the secondary cooling area in continuous casting, which are made by five leading global nozzle producers, were used in this study. The experiments used 8 mist nozzles and 2 water-only nozzles, see Table 1 for details. The water flowrate was parameter-set for experiments. The mist nozzles used an air pressure of 2 bar in experiments 1 to 6. Both experiments 7 and 8 were done with the same nozzle and had an identical water flowrate but different pressure settings. In experiment 7 the air pressure was 0.5 bar and in experiment 8 it was 1.5 bar. Similarly, experiment 9 used an air pressure of 1.5 bar and experiment 10 an air pressure of 3 bar. All of the nozzles used had a flat jet. In all the experiments the velocity of the cooled surface was 1 m·min−1.

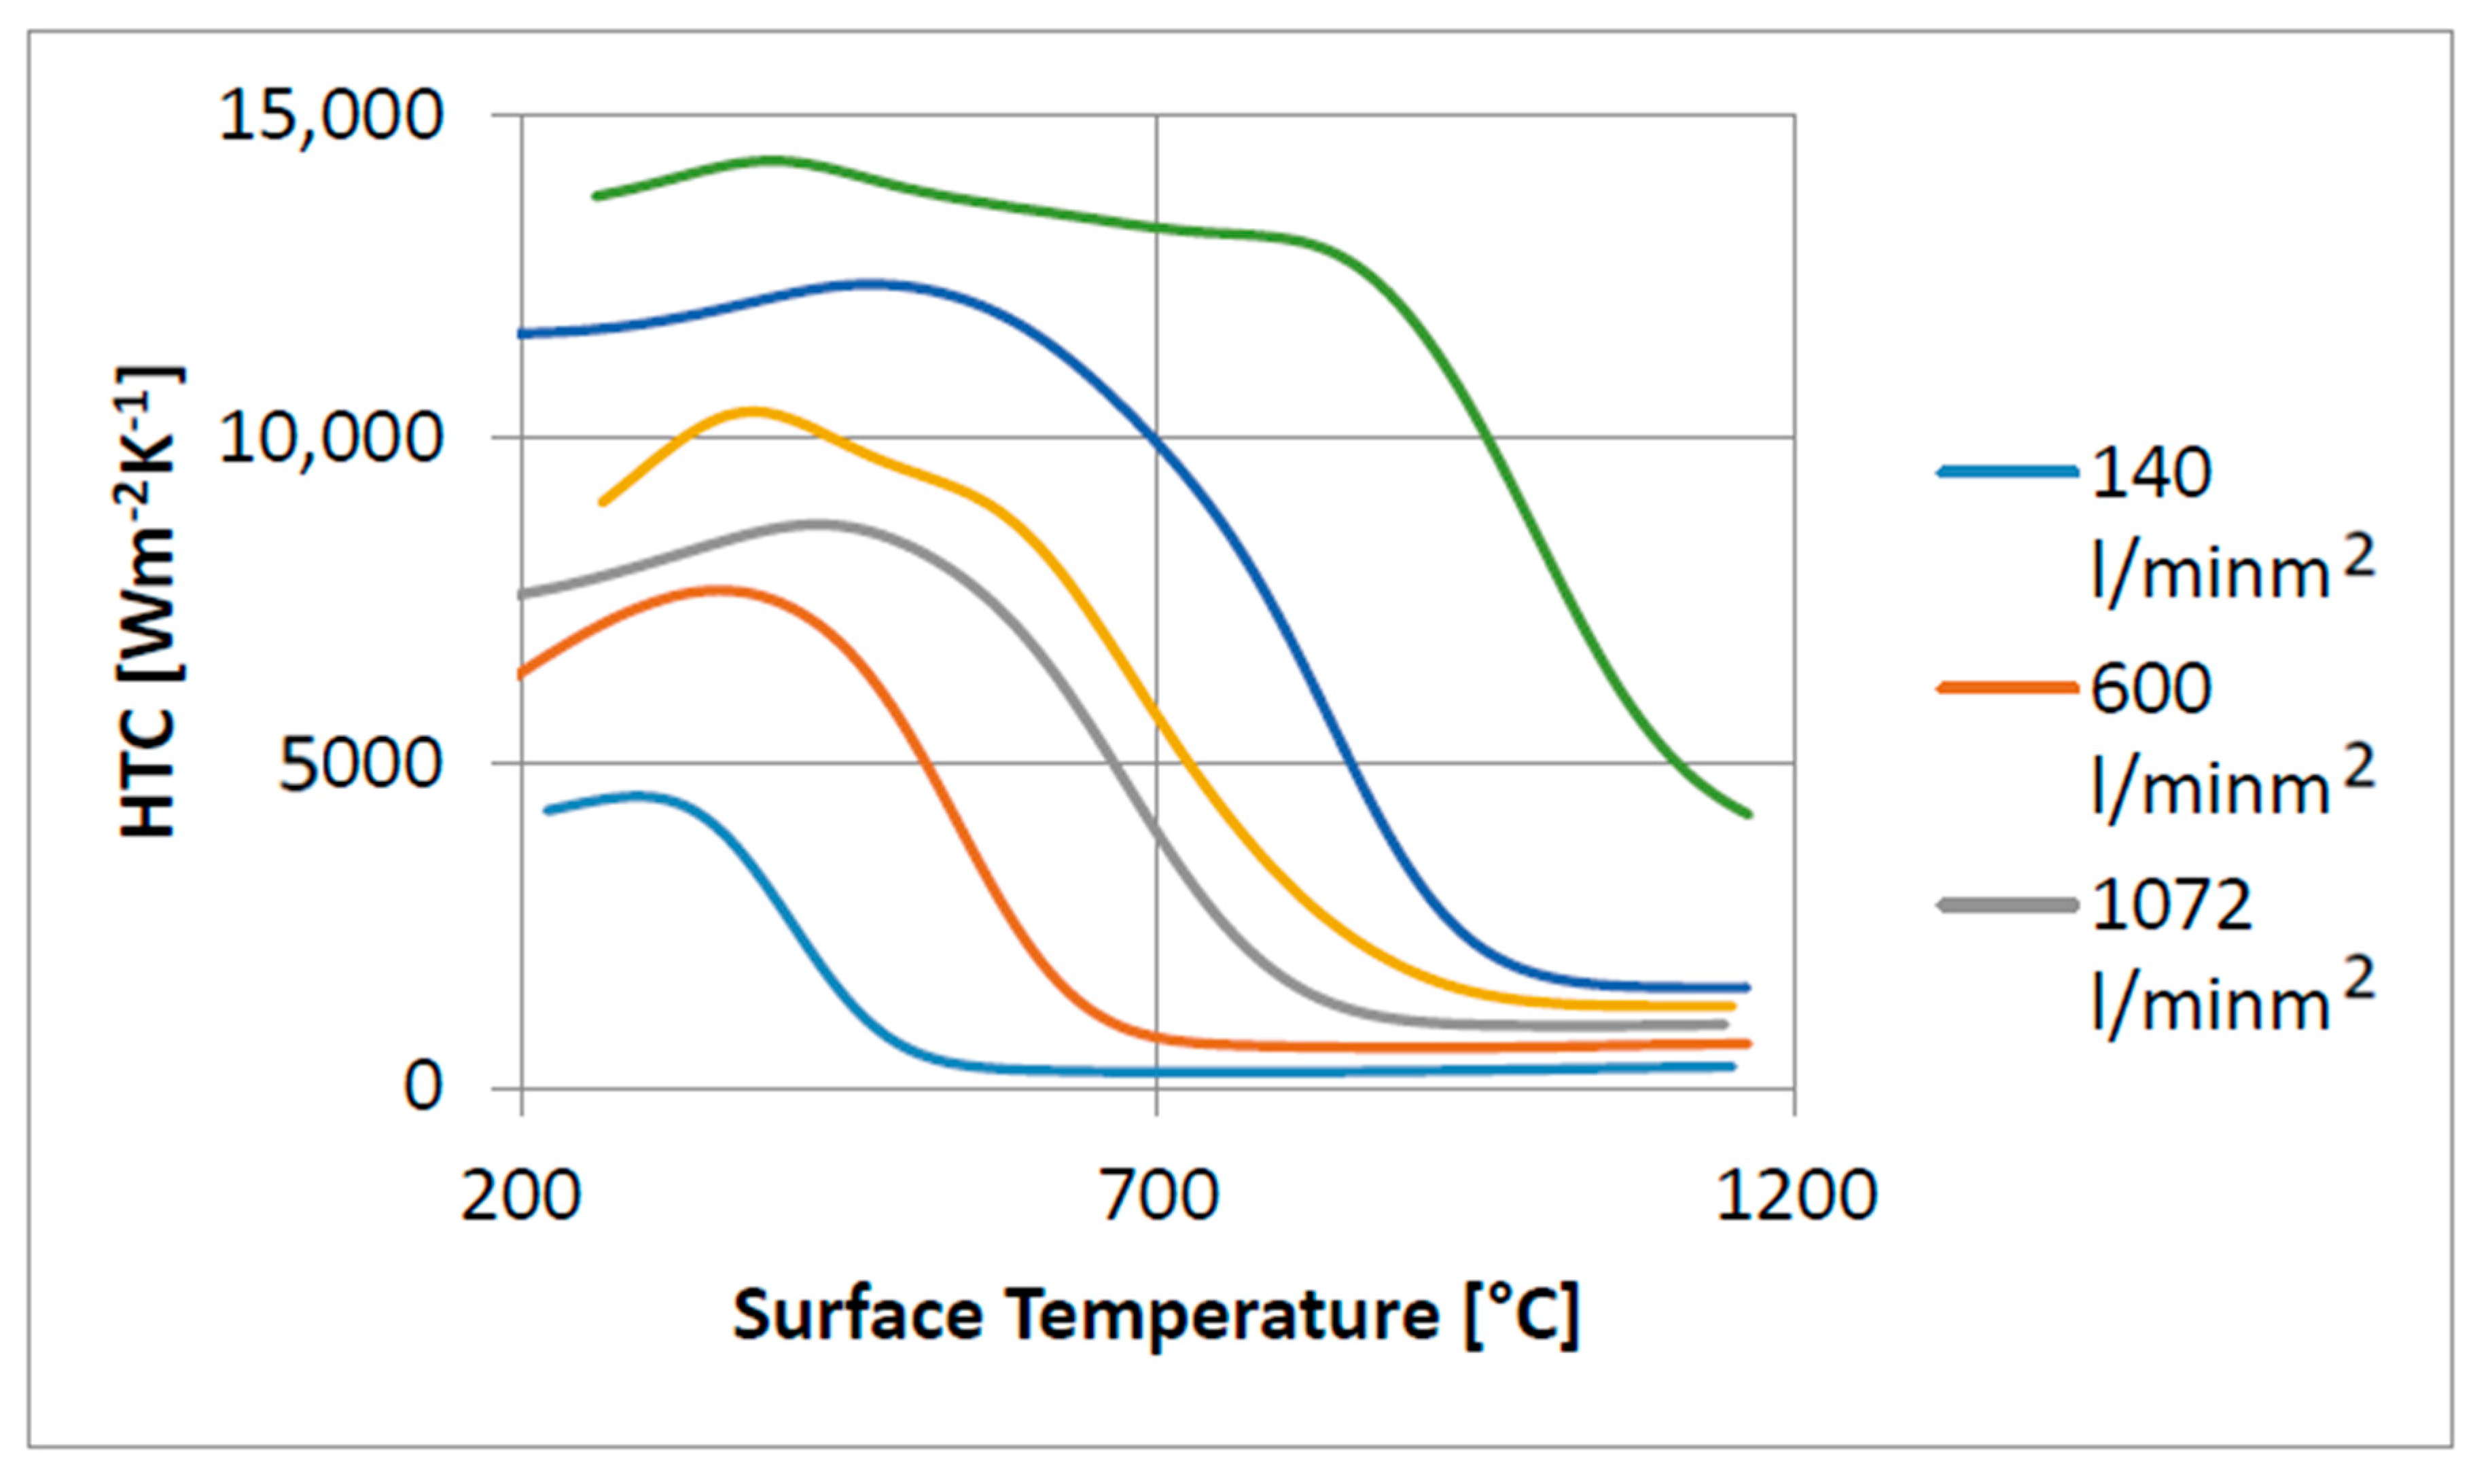
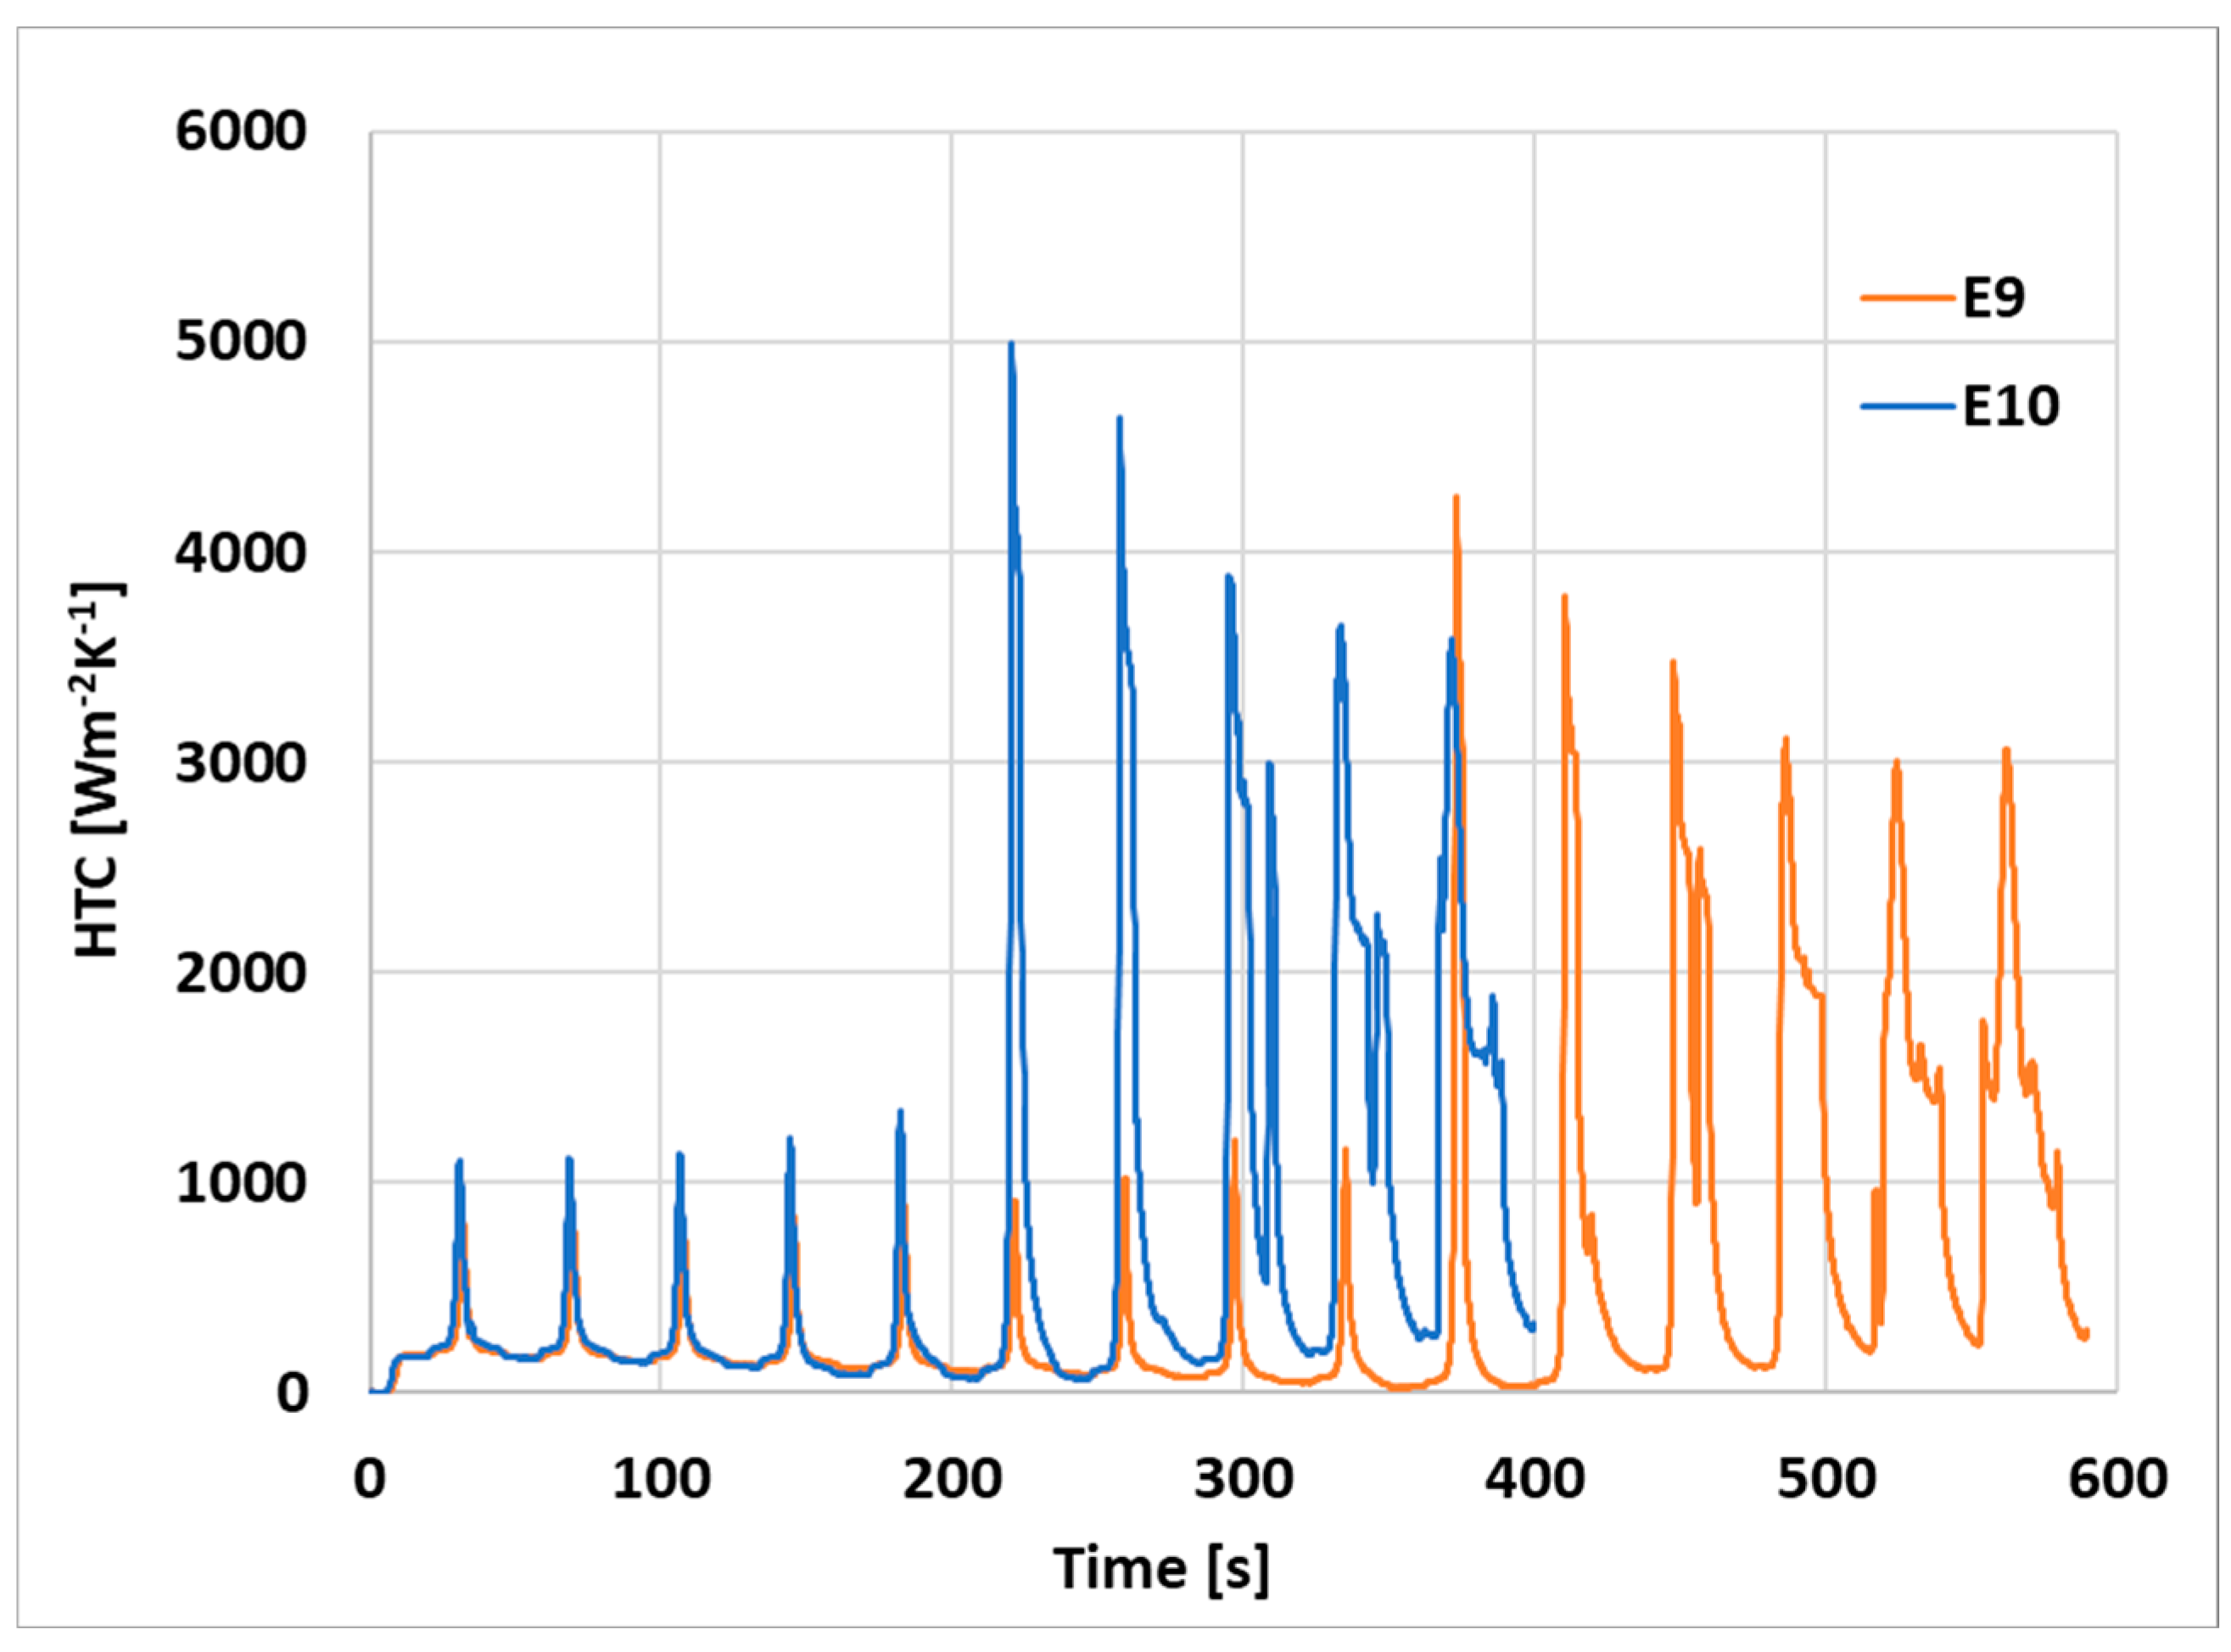
2.2. Heat Transfer Coefficient and Leidenfrost Temperature Measurement

Heat transfer tests were done on a test bench using relative movement of the nozzle and the cooled surface (Figure 3). The nozzle being tested was placed under the test plate on a moving trolley. The test plate was heated before the experiment to an initial temperature of 1250 °C. A pneumatically driven deflector can be placed between the nozzle orifice and the test plate. The deflector opens when the nozzle goes forward and the test plate is cooled by the spray. The deflector closes when the nozzle returns. This experiment arrangement covers a wide range of surface temperatures because the nozzle runs under the test plate many times with a gradually decreasing surface temperature. The velocity was set to 1 m·min−1 in this study. The test plate is insulated from all sides except the sprayed surface and is made of austenitic steel to protect the surface from oxidation. K-type shielded thermocouples were positioned inside the plate with the tip at a distance of 2 mm from the cooled surface. The distribution of thermocouples allowed us to monitor the temperature field in the cooled plate (Figure 3). A computer with a data acquisition system monitored the heating process, controlled the experiment and recorded the data from the thermocouples and position sensor.
The experimental data (temperatures measured) are used as input into the inverse heat conduction problem (IHCP) that gives HTC, surface temperature and heat flux over time. More about the IHCP used in this study can be found in [16,17] and the general principles of IHCP are in [18]. The use of an inverse task is necessary because the conclusions can be drawn only from surface temperatures, not from temperatures measured at a depth of 2 mm.
An example of a surface temperature record in the nozzle axis position is shown in Figure 4. The temperature drops in the records indicate the time when the nozzle sprays the centre of the test plate where the thermocouples are located. Figure 4 shows data for experiments E9 and E10. The surface temperatures measured and computed of the position of the nozzle axis are plotted here. It should be noted that experiments E9 and E10 use identical nozzles and an identical flowrate. The only difference is in the pressure setting. Experiment E9 uses water pressure of 4.0 bar and air pressure of 1.5 bar. Experiment E10 uses water pressure of 5.2 bar and air pressure of 3.0 bar. Both of these settings provide an identical water flowrate of 11 l·min−1.
The temperature records shown in Figure 4 clearly indicate the difference between soft cooling above the Leidenfrost temperature and intensive cooling below it. After several runs under the spray the surface temperature falls below the Leidenfrost temperature and drops in temperature are suddenly much steeper.
Figure 5 shows HTC history for the temperatures measured in Figure 4. The differences between cooling intensity above and below the Leidenfrost temperature are obvious. It should be noted that HTC above the Leidenfrost temperature slowly grows with a decrease in the surface temperature. Another aspect visible in Figure 5 is that HTC below the Leidenfrost temperature cover an increasingly wide area on the cooled surface (the HTC impulses become wider as the surface temperature falls).

2.3. Water Impingement Density Measurement

The real water flow along the nozzle axis in the y direction was measured by use of a patternator with 10 mm wide slots. The chamber is placed at a distance equal to the experimental spray height of 250 mm. The water impingement density along the nozzle axis is determined in l·m−2 ·s−1.

2.4. Impact Pressure Measurement

A force sensor is used for impact pressure measurement. For a given nozzle configuration, the force sensor moves under the spraying nozzle and data are recorded together with the sensor position. Data are processed by the computer and produces the field of impact pressures in kPa (Figure 6). The impact pressures are later averaged for correlation purposes.

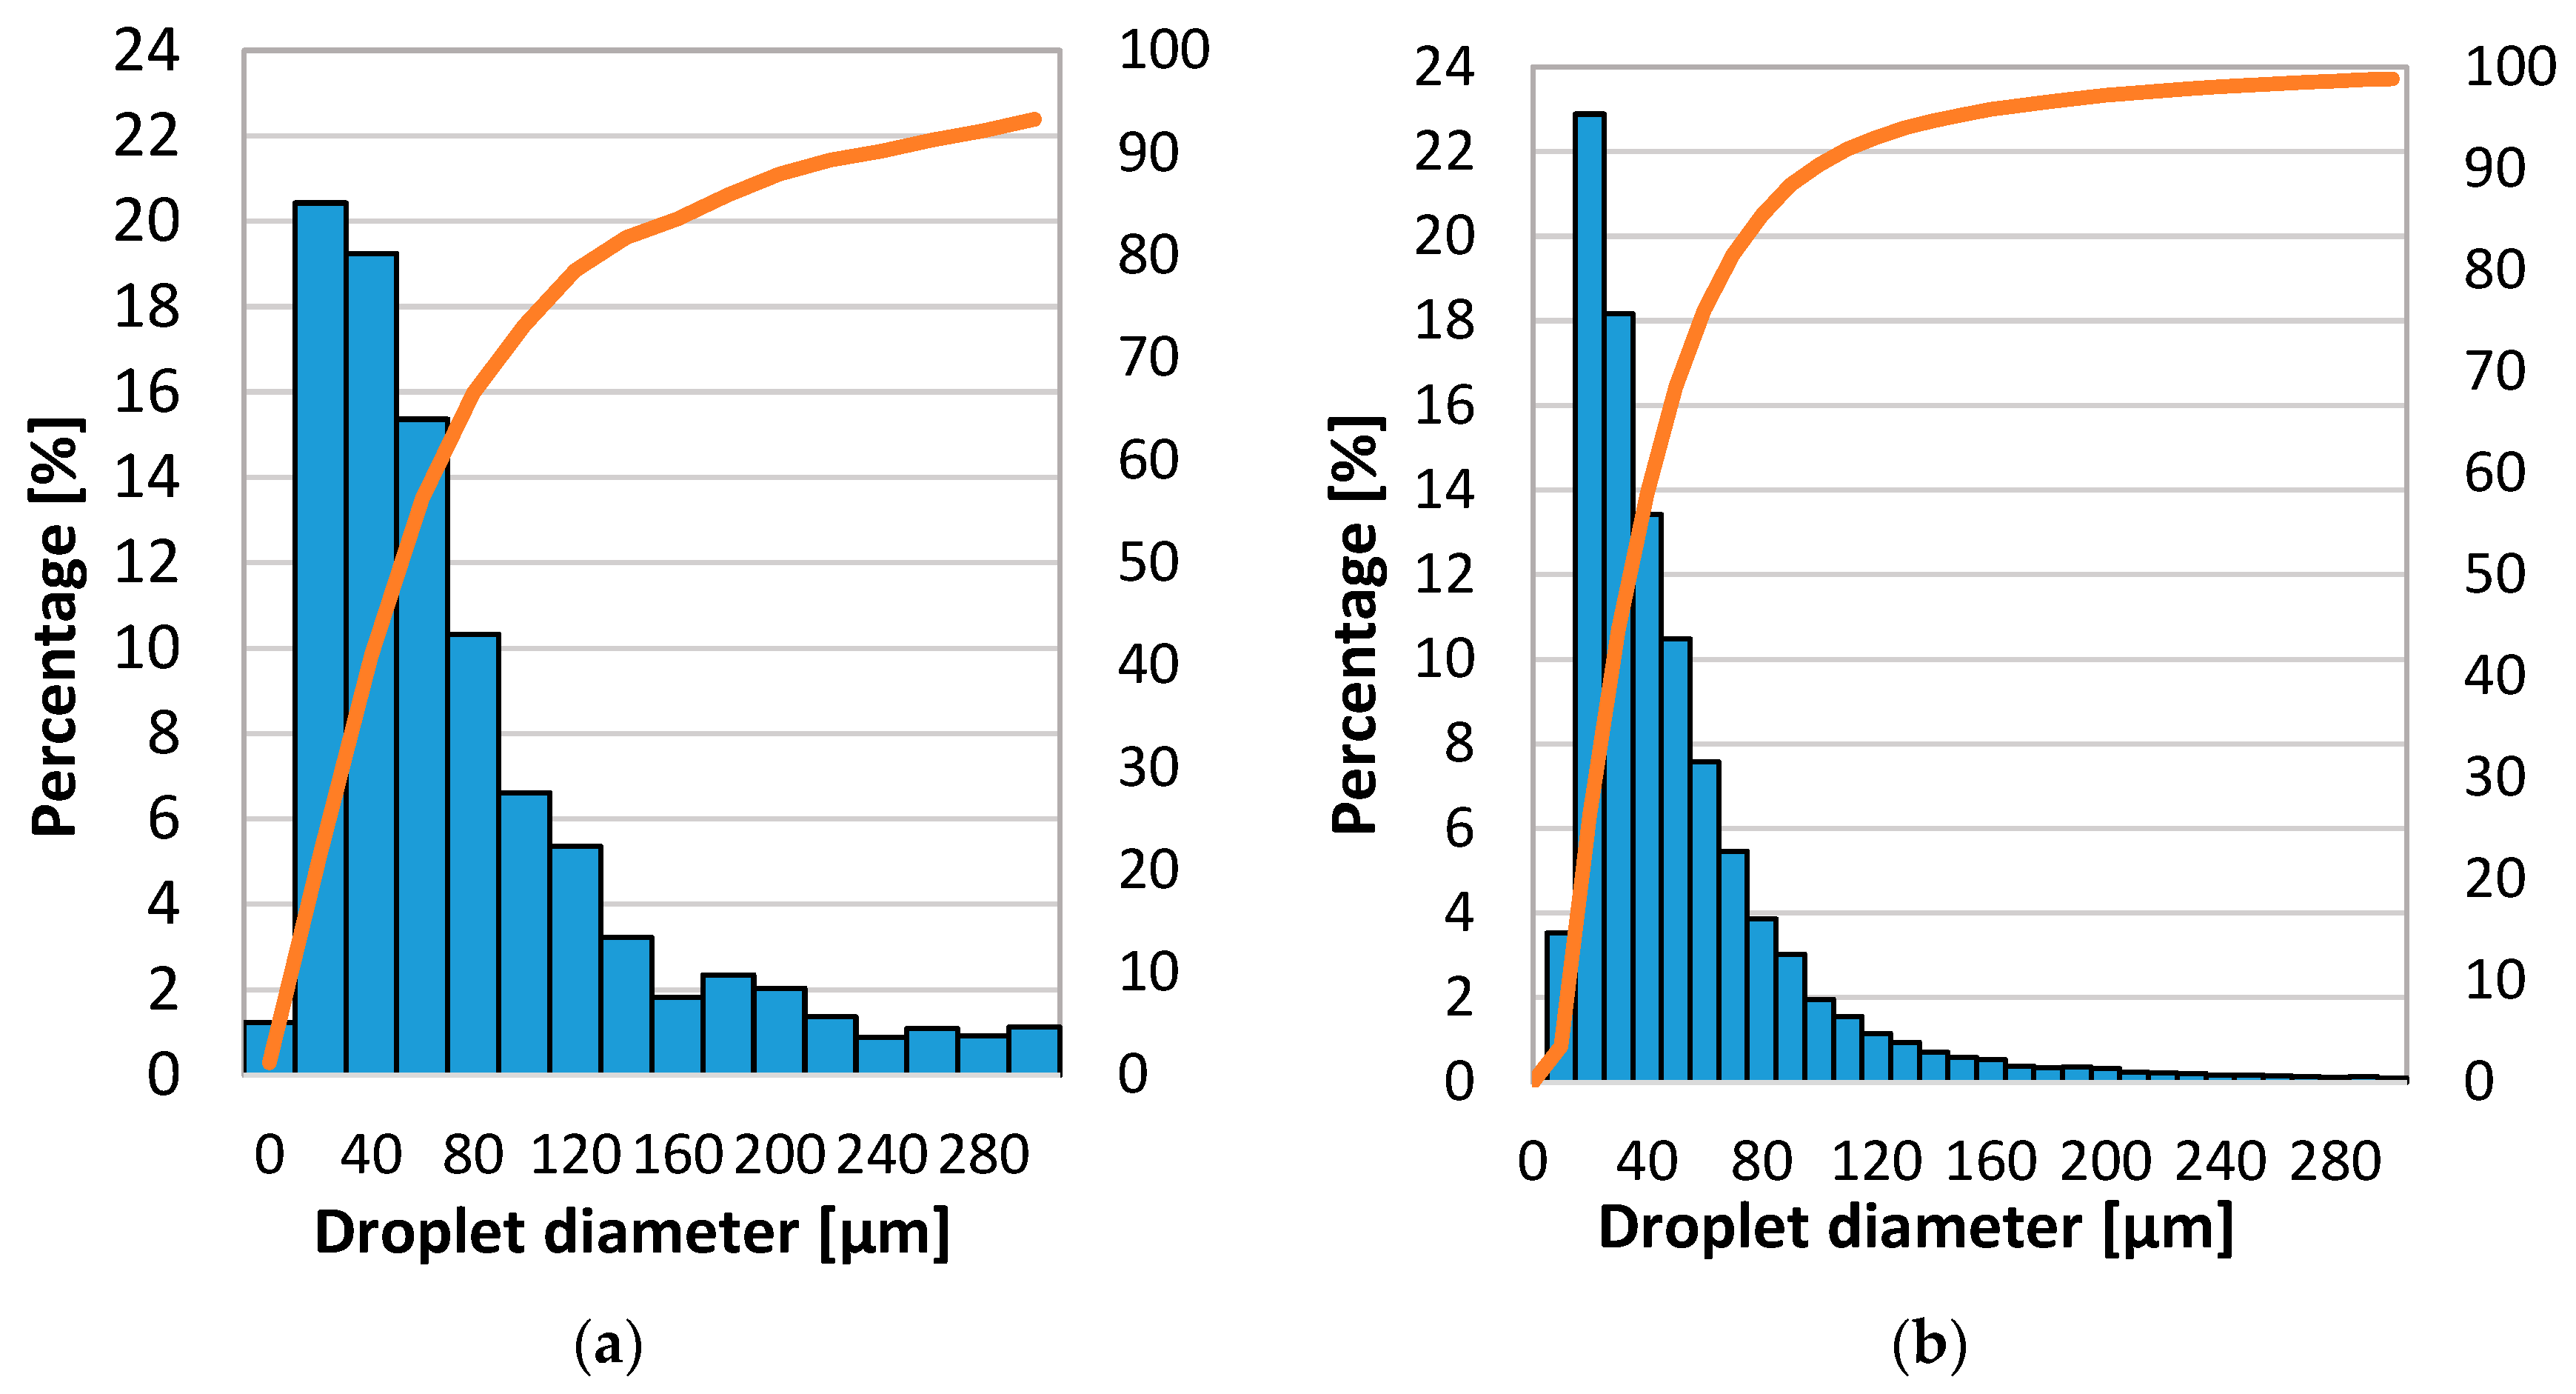
2.5. Droplet Size and Velocity

Droplet size and velocity were measured in a position listed in Table 1. The jet structure and velocity field were measured in cooperation with the Institute of Geonics of the Czech Academy of Sciences using optical imaging. The method used is the shadowgraph technique combined with PIV (particle image velocimetry) processing algorithms.
The spray is filmed by a high speed and high-resolution CCD camera with double frame mode and is synchronized with the pulsed laser by means of a PTU controller. The double frame camera means that a pair of photos are taken. In the measurement the pairs of photos were taken at a frequency of 15 Hz. In total four hundred pairs of photos were used. Mathematical software is able to identify the same droplets in two sequential photos. Each pair of photos had a time shift of 5 ms. After a droplet is identified, the software measures its diameter and calculates its velocity. An example of the measured distribution of droplet size and velocity is shown in Figure 7 and Figure 8. The data of all identified droplets are statistically evaluated and the mean values of the spray are calculated (D10—mean diameter, D32—Sauter mean diameter, VP—absolute mean velocity, VPx mean velocity on x axis, VPy mean velocity on y axis). For correlation purposes Sauter mean diameter and absolute mean velocity are used in this study. The Sauter mean diameter (d32) is defined as the diameter of a sphere that has the same volume/surface area ratio as a particle of interest. The value of the diameter d32 is far from the average diameter. For experiment E9 the diameter d32 is 316 µm and for experiment E10 the diameter d32 is 132 µm (compare with Figure 7). The mean velocity for experiment E9 is 7.71 m·s−1 and for experiment E10 it is 15.4 m·s−1.

3. Correlations

The goal of the study is to suggest a suitable correlation for computation of the Leidenfrost temperature based on spray parameters. The study should answer the question what parameter or combination of parameters is the best for reliable estimation of TL. The following parameters are available for correlations.
Measured parameters:
Qi (l·m−2·s−1) water impingement density;
v (m·s−1) mean droplet velocity;
d32 (m) Sauter droplet diameter;
Im (Pa) impact pressure;
Derived parameters:
N = Qi·10−3/(π/6·d323) (m−2·s−1) number of drops per square meter per second,
E = ρ·π/12·d323·v2 (J) kinetic energy of droplet (for droplet with average size and speed),
H = (kg·m·s−1) droplet momentum,
Re = ρ·v·d32/η (-) Reynolds number.
The above data are available for 24 measured cases.
The most frequent equation for correlations used in the literature has following shape and is used in this study:
T L = C 0 · X 1 C 1 · X 2 C 2 · X 3 C 3 , where C 0 ,   C 1 , C 2 , C 3 are constant and X 1 , X 2 , X 3 are some of the listed parameters.
A total of 10 combinations of measured spray parameters were selected and constants for correlation functions were computed. A complete list of the correlation functions created is shown in Table 2. The last column “Res2” gives the average square difference between the measured HTC and the correlated HTC. R e s 2 = 1 N ( T L , m e a s u r e d T L , c o r e l a t e d ) 2 , where N is the number of HTC values used. R e s 2 for each tested equation is also shown in Figure 9. Not all used parameters are independent. For example, Equations (1) and (2) are equivalent to each other because the number of droplets N (used in Equation (2)) can be expressed by Qi and d32 (used in Equation (1)). Both are mentioned due to the different difficulty of obtaining the required parameters.

4. Conclusions

Generally, it can be stated that better results in prediction of the Leidenfrost temperature can be obtained when using spray parameters related to energy than when using parameters related to coolant quantity. An example is Equation (9), which only uses impact pressure for computation TL in comparison to Equation (10), which uses water impingement density. If the relative residue for Equation (10) is 100 % then the residue for Equation (9) is 57 %.
Figure 10 shows a comparison between the best and worst correlation. The best results were obtained when using a combination of three parameters: droplet diameter and velocity with water impingement density. The worst results are obtained when only water impingement density is used and the error is about double (see Figure 9). The prediction using only water impingement density has the wrong trend shown in Figure 10. The explanation is obvious when using the measured data shown in Figure 4. Both experiments E9 and E10 use identical nozzles and an identical flowrate. The difference is in pressure setting and in production of droplets with a different diameter and velocity (see Figure 7 and Figure 8). The Leidenfrost temperature for experiment E9 is 568 °C and for experiment E10 it is 645 °C. It can be stated that the difference of 77 °C is small, but the measurements prove how the cooling rate and cooling time are significantly different in the end.
The recommended correlation for prediction of the Leidenfrost temperature in spray cooling of steel surfaces has the following shape
T L = 351 · Q i 0.111 · v 0.174 · d 32 0.006
where, Qi is water impingement density in l·m−2·s−1, v is mean droplet velocity in m·s−1, and d32 is Sauter droplet diameter in m.

Author Contributions

Formal analysis, J.K.; Investigation, M.H. and M.C. (Maria Carnogurska); Project administration, M.R.; Resources, M.C. (Martin Chabicovsky); Validation, T.-W.L. All authors have read and agreed to the published version of the manuscript.

Funding

This research was funded by the Ministry of Education, Youth and Sports of the Czech Republic under OP RDE grant number CZ.02.1.01/0.0/0.0/16_019/0000753 “Research centre for low-carbon energy technologies” and under the program INTER-EXCELLENCE, within the project LTAUSA19053.

Conflicts of Interest

The authors declare no conflict of interest.

References

  1. Liang, G.; Mudawar, I. Review of spray cooling—Part 2: High temperature boiling regimes and quenching applications. Int. J. Heat Mass Transf. 2017, 115, 1206–1222. [Google Scholar] [CrossRef]
  2. Yao, S.C.; Cox, T.L. A General Heat Transfer Correlation for Impacting Water Sprays on High-Temperature Surfaces. Exp. Heat Transf. 2002, 15, 207–219. [Google Scholar] [CrossRef]
  3. Al-Ahmadi, H.M.; Yao, S.C. Spray Cooling of High Temperature Metals Using High Mass Flux Industrial Nozzles. Exp. Heat Transf. 2008, 21, 38–54. [Google Scholar] [CrossRef]
  4. Raudensky, M.; Horsky, J. Secondary cooling in continuous casting and Leidenfrost temperature effects. Ironmak. Steelmak. 2005, 32, 159–164. [Google Scholar] [CrossRef]
  5. Bernardin, J.; Mudawar, I. A leidenfrost point model for impinging droplets and sprays. J. Heat Transf. Trans. ASME 2004, 126, 272–278. [Google Scholar] [CrossRef]
  6. Zhang, Y.; Wen, Z.; Zhao, Z.; Bi, C.; Guo, Y.; Huang, J. Laboratory Experimental Setup and Research on Heat Transfer Characteristics during Secondary Cooling in Continuous Casting. Metals 2019, 9, 61. [Google Scholar] [CrossRef] [Green Version]
  7. Gradeck, M.; Kouachi, A.; Lebouché, M.; Volle, F.; Maillet, D.; Borean, J.L. Boiling curves in relation to quenching of a high temperature moving surface with liquid jet impingement. Int. J. Heat Mass Transf. 2009, 52, 1094–1104. [Google Scholar] [CrossRef] [Green Version]
  8. Sinha, J. Effects of Surface Roughness, Oxidation Level, and Liquid Subcooling on the Minimum Film Boiling Temperature. Exp. Heat Transf. 2003, 16, 45–60. [Google Scholar] [CrossRef]
  9. Brožová, T.; Chabičovský, M.; Horský, J. Influence of the surface roughness on the cooling intensity during spray cooling. In Proceedings of the 25th Anniversary International Conference on Metallurgy and Materials, Brno, Czech Republic, 25–27 May 2016; pp. 41–46. [Google Scholar]
  10. Chabičovský, M.; Resl, O.; Raudenský, M. Impact of oxide layer on spray cooling intensity and homogeneity during continuous casting of the steel. In Proceedings of the 27th International Conference on Metallurgy and Materials, Brno, Czech Republic, 23–25 May 2018; pp. 69–74. [Google Scholar]
  11. Chabičovský, M.; Hnízdil, M.; Tseng, A.A.; Raudenský, M. Effects of oxide layer on Leidenfrost temperature during spray cooling of steel at high temperatures. Int. J. Heat Mass Transf. 2015, 88, 236–246. [Google Scholar] [CrossRef]
  12. Raudensky, M.; Hnizdil, M.; Kotrbacek, P. Why oxides intensify spray cooling? In Proceedings of the the 30th International Steel Industry Conference, Paris, France, 28–29 December 2020; pp. 92–93. [Google Scholar]
  13. Fukuda, H.; Nakata, N.; Kijima, H.; Kuroki, T.; Fujibayashi, A.; Takata, Y.; Hidaka, S. Effects of Surface Conditions on Spray Cooling Characteristics. ISIJ Int. 2016, 56, 628–636. [Google Scholar] [CrossRef] [Green Version]
  14. Raudensky, M.; Hnizdil, M.; Hwang, J.Y.; Lee, S.H.; Kim, S.Y. Influence of the water temperature on the cooling intensity of mist nozzles in continuous casting. Mater. Tehnol. 2012, 46, 311–315. [Google Scholar]
  15. Yigit, C.; Sozbir, N.; Yao, S.C.; Guven, H.; Issa, R. Experimental measurements and computational modeling for the spray cooling of a steel plate near the leidenfrost temperature. Isi Bilimi Tek. Derg. J. Therm. Sci. Technol. 2011, 31, 27–36. [Google Scholar]
  16. Ondrouskova, J.; Pohanka, M.; Vervaet, B. Heat-flux computation from measured-temperature histories during hot rolling. Mater. Tehnol. 2013, 47, 85–87. [Google Scholar]
  17. Komínek, J.; Pohanka, M. Estimation of the number of forward time steps for the sequential Beck approach used for solving inverse heat-conduction problems. Mater. Tehnol. 2016, 50, 207–210. [Google Scholar] [CrossRef]
  18. Beck, J.V.; Woodbury, K.A. Inverse heat conduction problem: Sensitivity coefficient insights, filter coefficients, and intrinsic verification. Int. J. Heat Mass Transf. 2016, 97, 578–588. [Google Scholar] [CrossRef] [Green Version]
Figure 1. Example of typical record of spray cooling experiment where the Leidenfrost temperature is reached (reproduced from [4], with permission from authors, 2005).
Metals 10 01551 g001
Figure 2. Example of HTC for one mist nozzle with different flowrate settings, Leidenfrost temperature in a range from 500 °C to over 1200 °C.
Metals 10 01551 g002
Figure 3. Test bench for HTC tests, insulated upper surface of test plate with thermocouples (left), nozzle on moving trolley spraying test plate, deflector is open (right).
Metals 10 01551 g003
Figure 4. Temperatures measured at a depth of 2 mm and computed surface temperatures, data for experiments E9 and E10 at position of nozzle axis.
Metals 10 01551 g004
Figure 5. HTC record for experiments E9 and E10, data for position of the nozzle axis.
Metals 10 01551 g005
Figure 6. Impact pressure distribution for experiment E9. 3D chart (a); 2D chart (b).
Metals 10 01551 g006
Figure 7. Droplet diameter distribution for experiments E9 and E10, identical nozzle, identical water flowrate, air pressure 1.5 bar left (a), air pressure 3.0 bar right (b), cumulative percentage orange line.
Metals 10 01551 g007
Figure 8. Droplet velocity distribution for experiments 9 and 10, identical nozzle, identical water flowrate, air pressure 1.5 bar left (a), air pressure 3.0 bar right (b), cumulative percentage orange line.
Metals 10 01551 g008
Figure 9. Comparison of Equations (1)–(10) based on relative residue Res2. The parameters which were used are written under each column.
Metals 10 01551 g009
Figure 10. Correlation between measured TL and calculated TL for three selected equations.
Metals 10 01551 g010
Table 1. List of experiments.
ExperimentNozzle TypeStandoff (mm)Water Flowrate (l·min−1)
E1mist3604
E2mist2007
E3mist19020
E4mist1459
E5mist3455
E6mist20010
E7/E8mist2506
E9/E10mist25011
E11water2506
E12water25011
Table 2. List of correlations.
Correlation NumberFormulaRes2
Equation (1) T L = 351 · Q i 0.111 · v 0.174 · d 32 0.006 2096
Equation (2) T L = 706 · N 0.111 · v 0.174 · d 32 0.341 2096
Equation (3) T L = 219 · R e 0.118 · Q i 0.063 3724
Equation (4) T L = 608 · E 0.014 · Q i 0.116 4382
Equation (5) T L = 410 · E 0.098 · N 0.089 2126
Equation (6) T L = 287 · H 0.026 · Q i 0.184 4206
Equation (7) T L = 294 · H 0.136 · N 0.145 2175
Equation (8) T L = 825 · I m 0.174 · Q i 0.020 2521
Equation (9) T L = 868 · I m 0.186 2546
Equation (10) T L = 474 · Q i 0.141 4445
Publisher’s Note: MDPI stays neutral with regard to jurisdictional claims in published maps and institutional affiliations.

