A New Method for Determining the Brittle-to-Ductile Transition Temperature of a TiAl Intermetallic


Abstract
:1. Introduction
2. Materials and Methods
3. Results
4. Discussion
4.1. Mechanical Behavior of the Material in Different Temperature Regimes
4.2. Determining the BDTT by a New Method
4.3. Effect of Different Load Strategies Used in This Study on the BDTT Determined by the New Method
5. Conclusions
Author Contributions
Funding
Acknowledgments
Conflicts of Interest
References
- Herrmann, J.; Inden, G.; Sauthoff, G. Deformation behaviour of iron-rich iron-aluminium alloys at high temperatures. Acta Mater. 2003, 51, 3233–3242. [Google Scholar] [CrossRef]
- Risanti, D.; Deges, J.; Falat, L.; Kobayashi, S.; Konrad, J.; Palm, M.; Pöter, B.; Schneider, A.; Stallybrass, C.; Stein, F. Dependence of the brittle-to-ductile transition temperature (BDTT) on the Al content of Fe-Al alloys. Intermetallics 2005, 13, 1337–1342. [Google Scholar] [CrossRef]
- Booth, A.S.; Roberts, S.G. The brittle-ductile transition in γ-TiAl single crystals. Acta Materialia 1997, 45, 1045–1053. [Google Scholar] [CrossRef]
- Kim, Y.-W. Intermetallic alloys based on gamma titanium aluminide. JOM 1989, 41, 24–30. [Google Scholar] [CrossRef]
- Imayev, V.M.; Imayev, R.M.; Salishchev, G.A. On two stages of brittle-to-ductile transition in TiAl intermetallic. Intermetallics 2000, 8, 1–6. [Google Scholar] [CrossRef]
- Lin, D.; Wang, Y.; Liu, J.; Law, C.C. The effects of temperature, strain rate and minor boron on tensile properties of wrought Ti-47Al-2Mn-2Nb alloy. Intermetallics 2000, 8, 549–558. [Google Scholar] [CrossRef]
- Appel, F.; Wagner, R. Microstructure and deformation of two-phase γ-titanium aluminides. Mater. Sci. Eng. R Rep. 1998, 22, 187–268. [Google Scholar] [CrossRef]
- Lipsitt, H.A.; Shechtman, D.; Schafrik, R.E. The deformation and fracture of TiAl at elevated temperatures. Metall. Trans. A 1975, 6A, 1991–1996. [Google Scholar] [CrossRef]
- Kim, Y.-W.; Dimiduk, D.M. Progress in the understanding of gamma titanium aluminides. JOM 1991, 43, 40–47. [Google Scholar] [CrossRef]
- Noebe, R.D.; Cullers, C.L.; Bowman, R.R. The effect of strain rate and temperature on the tensile properties of NiAl. J. Mater. Res. 1992, 7, 605–612. [Google Scholar] [CrossRef]
- Kim, Y.-W.; Kim, S.-L. Effects of microstructure and C and Si additions on elevated temperature creep and fatigue of gamma TiAl alloys. Intermetallics 2014, 53, 92–101. [Google Scholar] [CrossRef]
- Adilović, A. Untersuchung des Materialverhaltens von Titanaluminiden für den Einsatz im Abgasturbolader. Ph.D. Thesis, Karlsruhe Institute of Technology, Karlsruhe, Germany, 2016. [Google Scholar]
- Fröbel, U.; Appel, F. Strain aging in γ(TiAl)-based and α2(Ti3Al) titanium aluminides. Intermetallics 2006, 14, 1187–1193. [Google Scholar] [CrossRef]
- Morris, M.A. Dislocation configurations in two-phase Ti-Al alloys III. Mechanisms producing anomalous flow stress dependence on temperature. Philos. Mag. A 1994, 69, 129–150. [Google Scholar] [CrossRef]
- Hashimoto, K.; Nobuki, M.; Tsujimoto, T.; Suzuki, T. Deformation behaviour of TiAl base alloy containing manganese at elevated temperatures. ISIJ Int. 1991, 31, 1154–1160. [Google Scholar] [CrossRef]
- Umakoshi, Y.; Nakano, T. Plastic behaviour of TiAl crystals containing a single set of lamellae at high temperatures. ISIJ Int. 1992, 32, 1339–1347. [Google Scholar] [CrossRef]
- Molénat, G.; Couret, A.; Caillard, D. Peierls friction stresses and dynamic strain ageing in TiAl and Fe-30at.% Al alloys. Mater. Sci. Eng. A 1997, 234–236, 600–663. [Google Scholar] [CrossRef]
- Christoph, U.; Appel, F.; Wagner, R. Dislocation dynamics in carbon-doped titanium aluminide alloys. Mater. Sci. Eng. A 1997, 239, 39–45. [Google Scholar] [CrossRef]
- Kroll, S.; Mehrer, H.; Stolwijk, N.; Rosenkranz, R.; Frommeyer, G. Titanium self-diffusion in the intermetallic compound γ-TiAl. Zeitschrift fuer Metallkunde 1992, 83, 591–595. [Google Scholar] [CrossRef]
- Herzig, C.; Przeorski, T.; Mishin, Y. Self-diffusion in γ-TiAl: An empirical study and atomistic calculations. Intermetallics 1999, 7, 389–404. [Google Scholar] [CrossRef]
- Chan, K.S.; Shih, D.S. Fatigue and fracture behavior of a fine-grained lamellar TiAl alloy. Metall. Mater. Trans. A 1997, 28A, 79–90. [Google Scholar] [CrossRef]
- Schwaighofer, E.; Clemens, H.; Mayer, S.; Lindemann, J.; Klose, J.; Smarsly, W.; Güther, V. Microstructural design and mechanical properties of a cast and heat-treated intermetallic multi-phase γ-TiAl based alloy. Intermetallics 2014, 44, 128–140. [Google Scholar] [CrossRef]
- Zhang, S.Z.; Zhao, Y.B.; Zhang, C.J.; Han, J.C.; Sun, M.J.; Xu, M. The microstructure, mechanical properties, and oxidation behavior of beta-gamma TiAl alloy with excellent hot workability. Mater. Sci. Eng. A 2017, 700, 366–373. [Google Scholar] [CrossRef]
- Brotzu, A.; Felli, F.; Marra, F.; Pilone, D.; Pulci, G. Mechanical properties of a TiAl-based alloy at room and high temperatures. Mater. Sci. Technol. 2018, 34, 1847–1853. [Google Scholar] [CrossRef]


| Experiment A and B | Experiment C |
|---|---|
| - | room temperature |
| - | 100 °C |
| - | 200 °C |
| - | 300 °C |
| - | 400 °C |
| 500 °C | 500 °C |
| 550 °C | 550 °C |
| 600 °C | 600 °C |
| 650 °C | 650 °C |
| 700 °C | 700 °C |
| 750 °C | 750 °C |
| 800 °C | 800 °C |
| 850 °C | 850 °C |
| 900 °C | 900 °C |
| Temperature in °C | Strain Rate | Maximum Stress in MPa | Plastic Strain Amplitude in % |
|---|---|---|---|
| 500 | 0.46 × 10⁻⁴ s−1 | 268 | 0.034 |
| 500 | 9.2 × 10⁻⁴ s−1 | 262 | 0.037 |
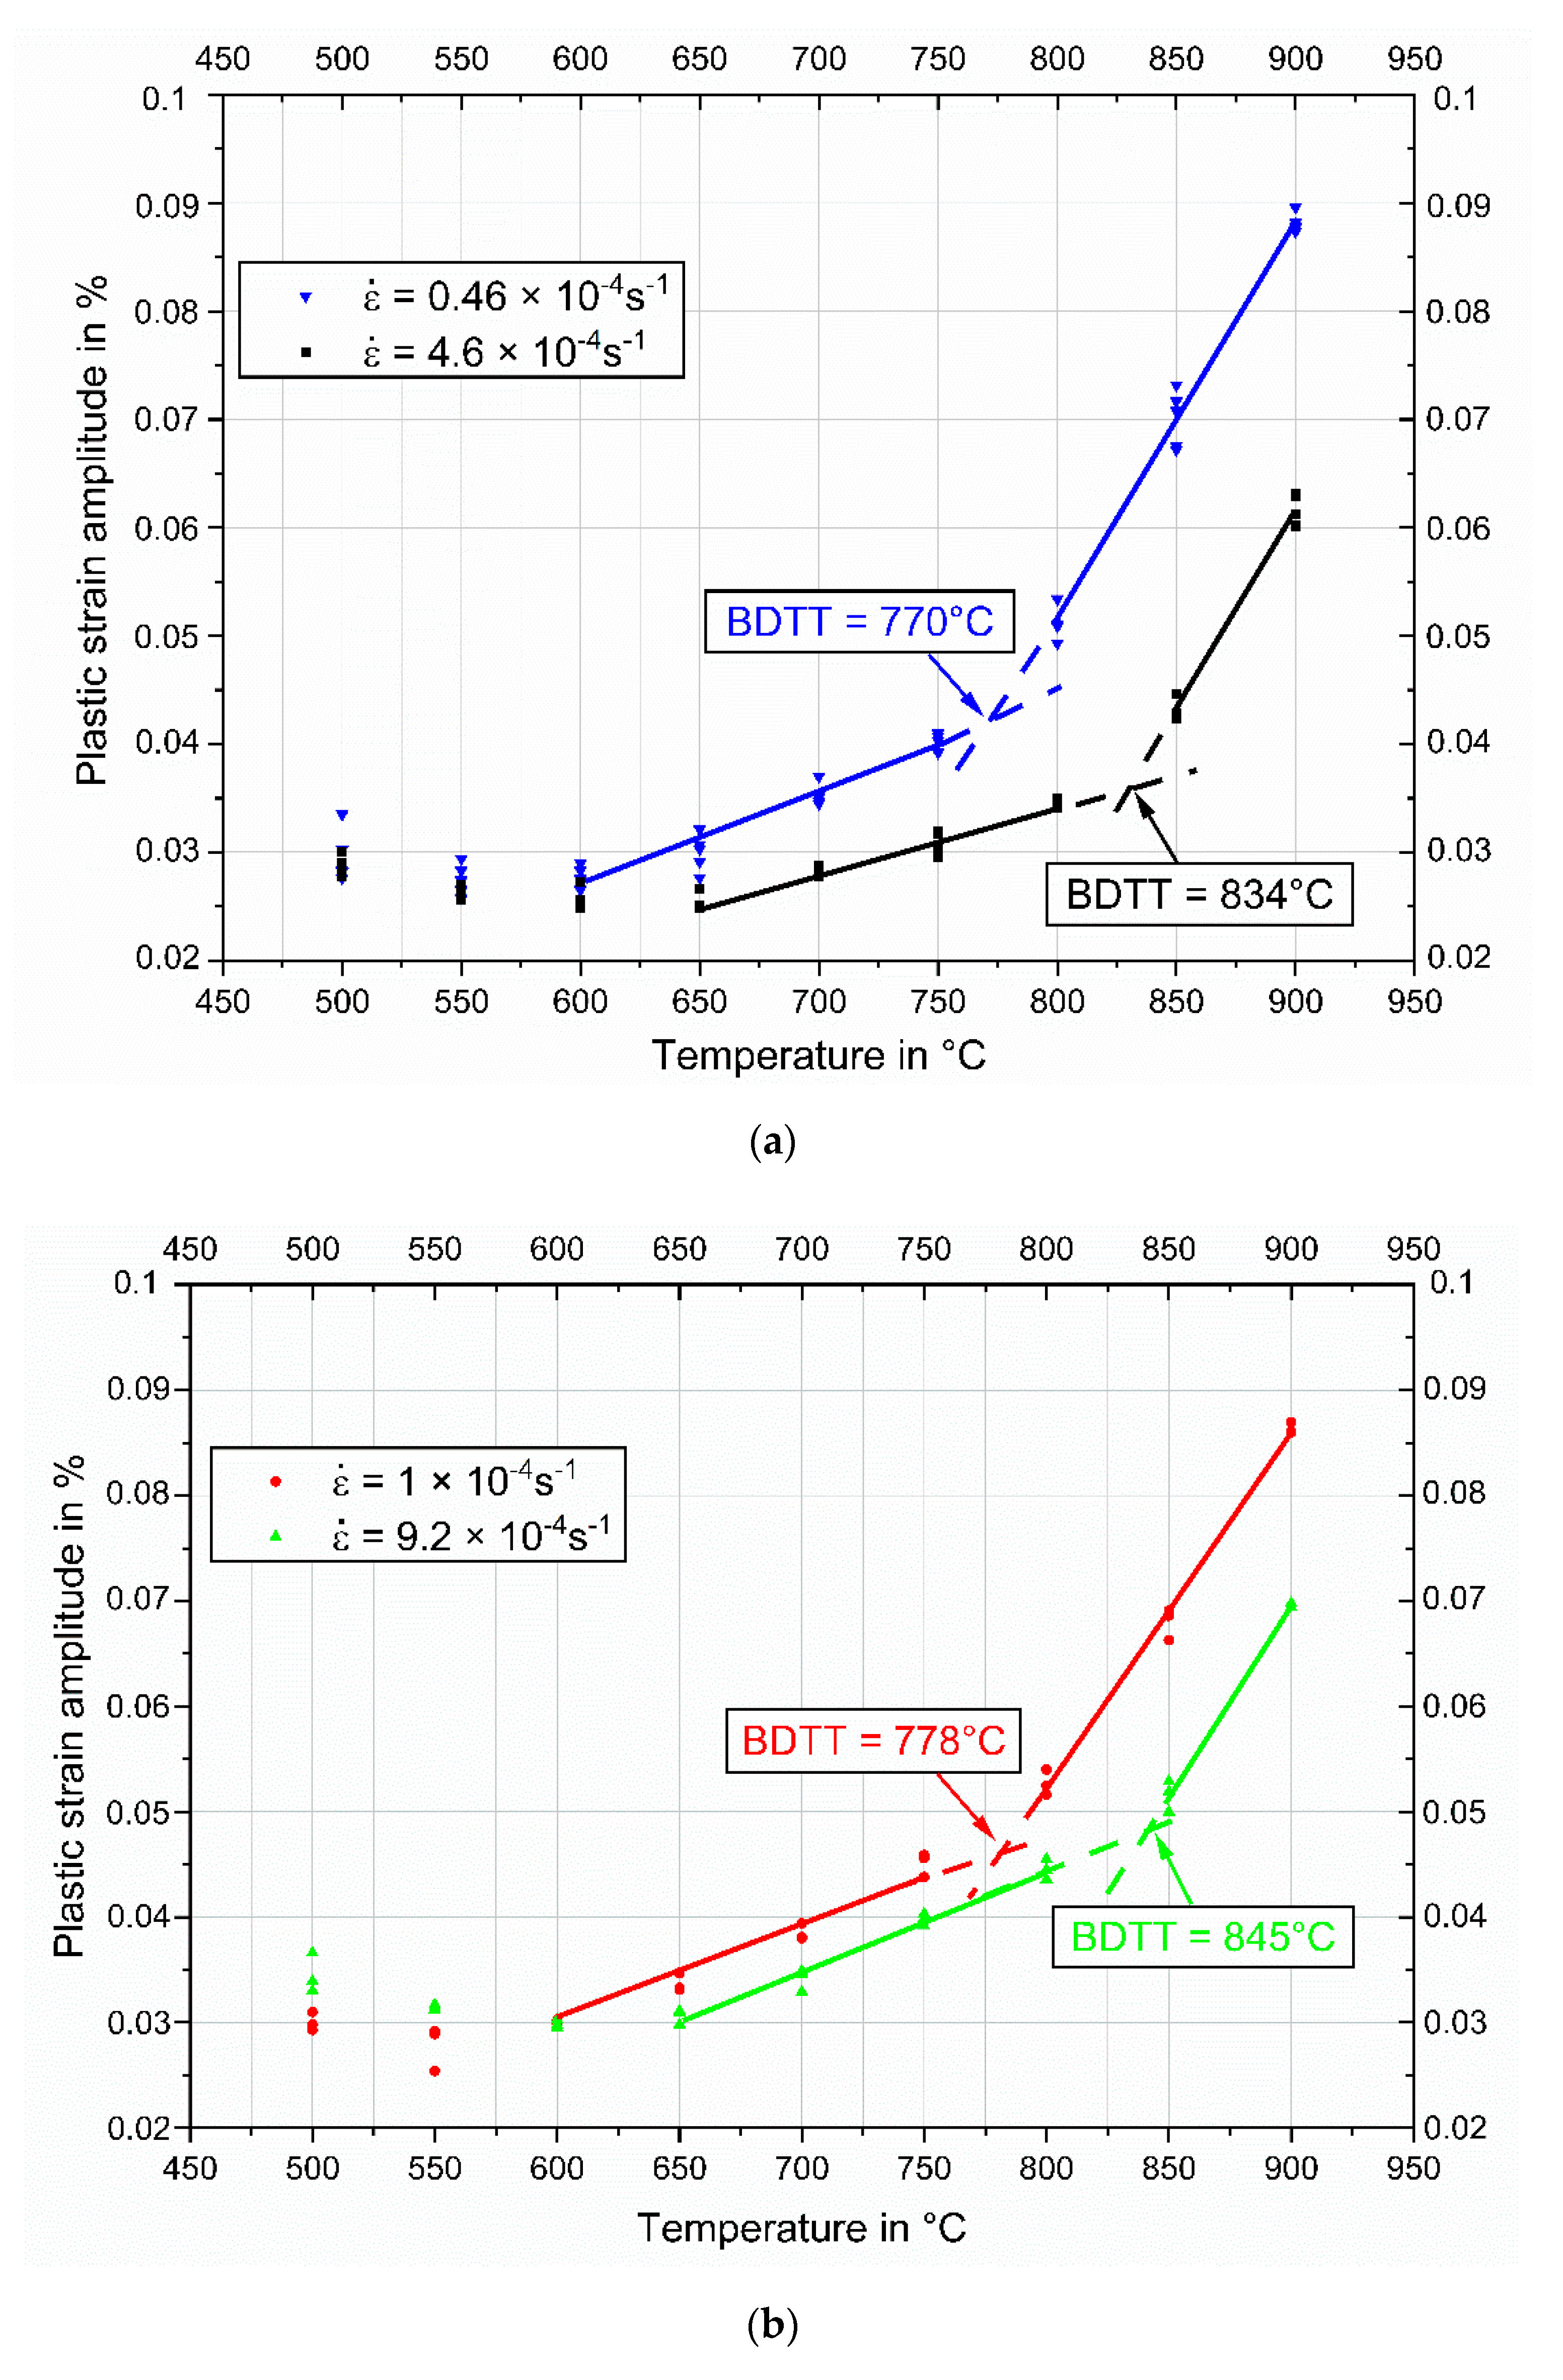
| Strain Rate | BDTT |
|---|---|
| 0.46 × 10⁻⁴ s−1 | 770 °C |
| 1 × 10⁻⁴ s−1 | 778 °C |
| 4.6 × 10⁻⁴ s−1 | 834 °C |
| 9.2 × 10⁻⁴ s−1 | 845 °C |
| Material | Microstructure | Strain Rate in 10−4 s−1 | BDTT (°C) | BDTT Evaluation by | Reference |
|---|---|---|---|---|---|
| Ti-48Al-2Nb-0,7Cr-0.3Si | Fully lamellar | 0.46–9.2 | 770–845 | Method presented in this study | This study |
| Ti-48Al-2Nb-0,7Cr-0.3Si | Fully lamellar | 1 | 750–800 | Tensile tests, see Figure 4 in this study | [12] |
| TiAlMnNb | Nearly lamellar | 0.1–100 | 750–1000 | Tensile tests | [6] |
| TiAlMnNbB | Nearly lamellar | 0.1–100 | 612–837 | Tensile tests | [6] |
| Ti-46Al-3Nb-2Cr-0.2W | Fully lamellar | 1–20 | 800–870 | Tensile tests | [11] |
| Ti-46Al-3Nb-2Cr-0.2W | Duplex | 1–20 | 700–780 | Tensile tests | [11] |
| TiAl | L + segregated γ | 1 | 800 | Tensile tests | [7] |
| TiAl | - | - | 700–800 | Tensile tests | [8] |
| Ti-47Al-2Cr-2Nb-0.2B | Fully lamellar | 5 | 800 | Tensile tests | [21] |
| Ti-43.5Al-4Nb-1Mo-0.1B (TNM alloy) | Nearly lamellar γ | 0.8 | 700–800 | Tensile tests | [22] |
| Ti-44Al-4Nb-4V-0.3Mo-Y (novel β-γ TiAl alloy) | Nearly lamellar | 1 | 800–850 | Tensile tests | [23] |
| Ti-47Al-3Cr-3Nb | Duplex | - | 700–800 | Four-point bending tests | [24] |
Publisher’s Note: MDPI stays neutral with regard to jurisdictional claims in published maps and institutional affiliations. |
© 2020 by the authors. Licensee MDPI, Basel, Switzerland. This article is an open access article distributed under the terms and conditions of the Creative Commons Attribution (CC BY) license (http://creativecommons.org/licenses/by/4.0/).
Share and Cite
Nizamoglu, S.; Lang, K.-H.; Guth, S.; Heilmaier, M. A New Method for Determining the Brittle-to-Ductile Transition Temperature of a TiAl Intermetallic. Metals 2020, 10, 1550. https://doi.org/10.3390/met10111550
Nizamoglu S, Lang K-H, Guth S, Heilmaier M. A New Method for Determining the Brittle-to-Ductile Transition Temperature of a TiAl Intermetallic. Metals. 2020; 10(11):1550. https://doi.org/10.3390/met10111550
Chicago/Turabian StyleNizamoglu, Sarper, Karl-Heinz Lang, Stefan Guth, and Martin Heilmaier. 2020. "A New Method for Determining the Brittle-to-Ductile Transition Temperature of a TiAl Intermetallic" Metals 10, no. 11: 1550. https://doi.org/10.3390/met10111550
APA StyleNizamoglu, S., Lang, K.-H., Guth, S., & Heilmaier, M. (2020). A New Method for Determining the Brittle-to-Ductile Transition Temperature of a TiAl Intermetallic. Metals, 10(11), 1550. https://doi.org/10.3390/met10111550