1. Introduction
High entropy alloys (HEA) CoCrFeNiAl
x attract much attention due to their tunable microstructural, mechanical, electrical, and magnetic behavior [
1,
2]. When compared to conventional stainless steel and other alloys, HEAs in many cases showed better corrosion and erosion resistance in different media, owing to their strong passivation and relatively higher hardness [
3]. The most common method for production of such materials is the arc melting followed by casting. The phase constitution of cast CoCrFeNiAl
x alloys depends on Al content
x: the Face-Centered Cubic (FCC) phase transforms into the Body-Centered Cubic (BCC) one upon an increase in
x [
3]. Formation of single FCC phase was observed for
x = 0–0.3; that of FCC + BCC mixture, for
x = 0.5–0.8; and that of sole BCC phase, for
x = 0.9–3.0 [
4]. Equiatomic cast CoCrFeNiAl alloys consist of FCC dendrites and BCC interdendritic phase [
5]. Remelted and slowly cooled down alloys consist basically of the BCC phase, while the FCC phase dominates in the samples annealed at 1400 K for 50 h [
6]. At temperatures above 873 K, the cast equiatomic BCC phase of CoCrFeNiAl is transformed into the FCC one, with the simultaneous precipitation of B2 and σ phase inclusions [
7].
Less data are available concerning the CoCrFeNiAlx HEAs produced by powder metallurgy methods. According to Meshi et al. [
8], mechanical alloying in a planetary ball mill for 18–30 h was required for obtaining metastable CoCrFeNiTiAl supersaturated solid solution powder which transformed into two BCC phases and one minor FCC phase upon consolidation by spark plasma sintering (SPS) at 600–800 °C. A single-phase CoCrFeNiTiAl alloy with a BCC structure was obtained via planetary ball mill during 30–60 h at 250 rpm in Ar atmosphere [
9]. Mechanical alloying for 45 h (planetary ball mill, 300 rpm) was used to obtain Co
0.3CrFeNiAl
0.7 HEA with a BCC structure [
10]. This alloy decomposed into two BCC phases with nearly the same lattice parameter and one FCC phase that appeared after subsequent SPS. A single-phase CoCrFeNiAl
0.3, major BCC + minor BCC phases of CoCrFeNiAl
0.6, and major BCC + minor FCC phases of CoCrFeNiAl were formed after 15 h of milling of respective elementary mixtures [
11,
12]. Precipitations of the
B2 (ordered BCC), L1
2 (ordered FCC), and σ phases were found in the mechanically alloyed CoCrFeNiAl
x alloys after high-temperature annealing [
10,
11,
12,
13]. Thus, after 1-h annealing at 1073 K of mechanically alloyed CoCrFeNiAl, the BCC solid solution almost completely transformed into partially disordered the B2 phase [
13,
14]. Equiatomic CoCrFeNiAl alloy was also reportedly produced by spark plasma sintering at 1200 °C for 20 min (under a pressure of 30 MPa) directly from the elemental metal powders that were mechanically mixed for 5 h without mechanical alloying [
15]. The consolidated alloy consisted of one FCC and two BCC (ordered and disordered) phases. Finally, a free vacuum sintering with simultaneous synthesis from elemental powder mixtures of CoCr
yFeNiAl alloys (
y = 0–1.5) required quite a long time period: 1 day at 500 °C plus two weeks at 1000 °C [
16]. Multiphase nature of the Cr
xAlFeCoNi HEA was approved both for mechanically alloyed and cast materials [
17].
This work aimed at gaining a deeper insight into the dynamics of microstructural and phase transformations taking place during the mechanical alloying by means of high-energy ball milling (HEBM) and consolidation by means of spark plasma sintering (SPS), which would afford the optimization of methods for and approaches to fabricating structural and functional materials based on CoCrFeNiAl high-entropy alloy.
2. Materials and Methods
Commercial powders of Co (purity >99.35%, mean particles size <71 μm), Cr (>98.5%, <125 μm), Fe (>97%, 1.5–6.0 μm), Ni (>99.5%, ~150 μm) and Al (99.7%, 10 μm) were mixed in equimolar proportions and placed in steel jars of a water-cooled planetary ball mill AGO-2 (ISSC SB RAS, Kemerovo, Russia) together with steel balls (200 g, 9 mm in diameter). A ball to powder mass ratio was 20:1. HEBM was performed in air for 90 min, at a rotating speed 912 rpm (for mill) that corresponded to 2220 rpm for jar. The jar was hermetically closed and contained 124 cm3 of air at normal pressure, which corresponds to 0.037 g of oxygen. Thus, possible oxidation of the alloy during HEBM was negligible. Initial powders, as well as synthesized alloy powders, were not pyrophoric at room temperature. Phase constitution and crystal structure of mechanically alloyed powders were characterized by XRD (Fe-Kα radiation, DRON-3M diffractometer, Burevestnik, Russia) and SEM/EDS (Ultra Plus microscope Carl Zeiss, Oberkochen, Germany) equipped with an energy dispersive INCA Energy 350 XT spectrometer (Oxford Instruments, Abingdon, UK).
As-synthesized powders were SPS-consolidated in a Labox 650 installation (SinterLand, Niigata, Japan). Powders were placed in a graphite press mold, warmed-up in vacuum (15–20 Pa, at a rate of 100 deg/s) to 800 °C or 1000 °C, and sintered at these temperatures for 10 min under a uniaxial load of 50 MPa. Disc-shaped samples 15 mm in diameter and 2–7 mm thick were mechanically polished and cut into specimens for use in appropriate tests. For SEM and EDS analysis, the SPS-consolidated samples and steel milling balls with stocked powder layers were cross-cut by means of diamond saw; then the cross-sections were polished according to standard procedure using SiC abrasive papers (KLINGSPOR, Heiger, Germany) and diamond pastes (Kemet Int. Ltd., Maidstone, UK and Struers, Copengagen, Denmark), and cleaned with ethanol (“Ethanol spirit” Ltd., Voronez, Russia) and deionized water.
Electrical resistivity was measured by four-point method for 15 mm × 7 mm × 1 mm or 15 mm × 2 mm × 1 mm plates cut out from sintered samples. Vickers microhardness was measured with a PMT3 tester (LOMO, St. Petersburg, Russia) under a load of 50 g.
3. Results and Discussion
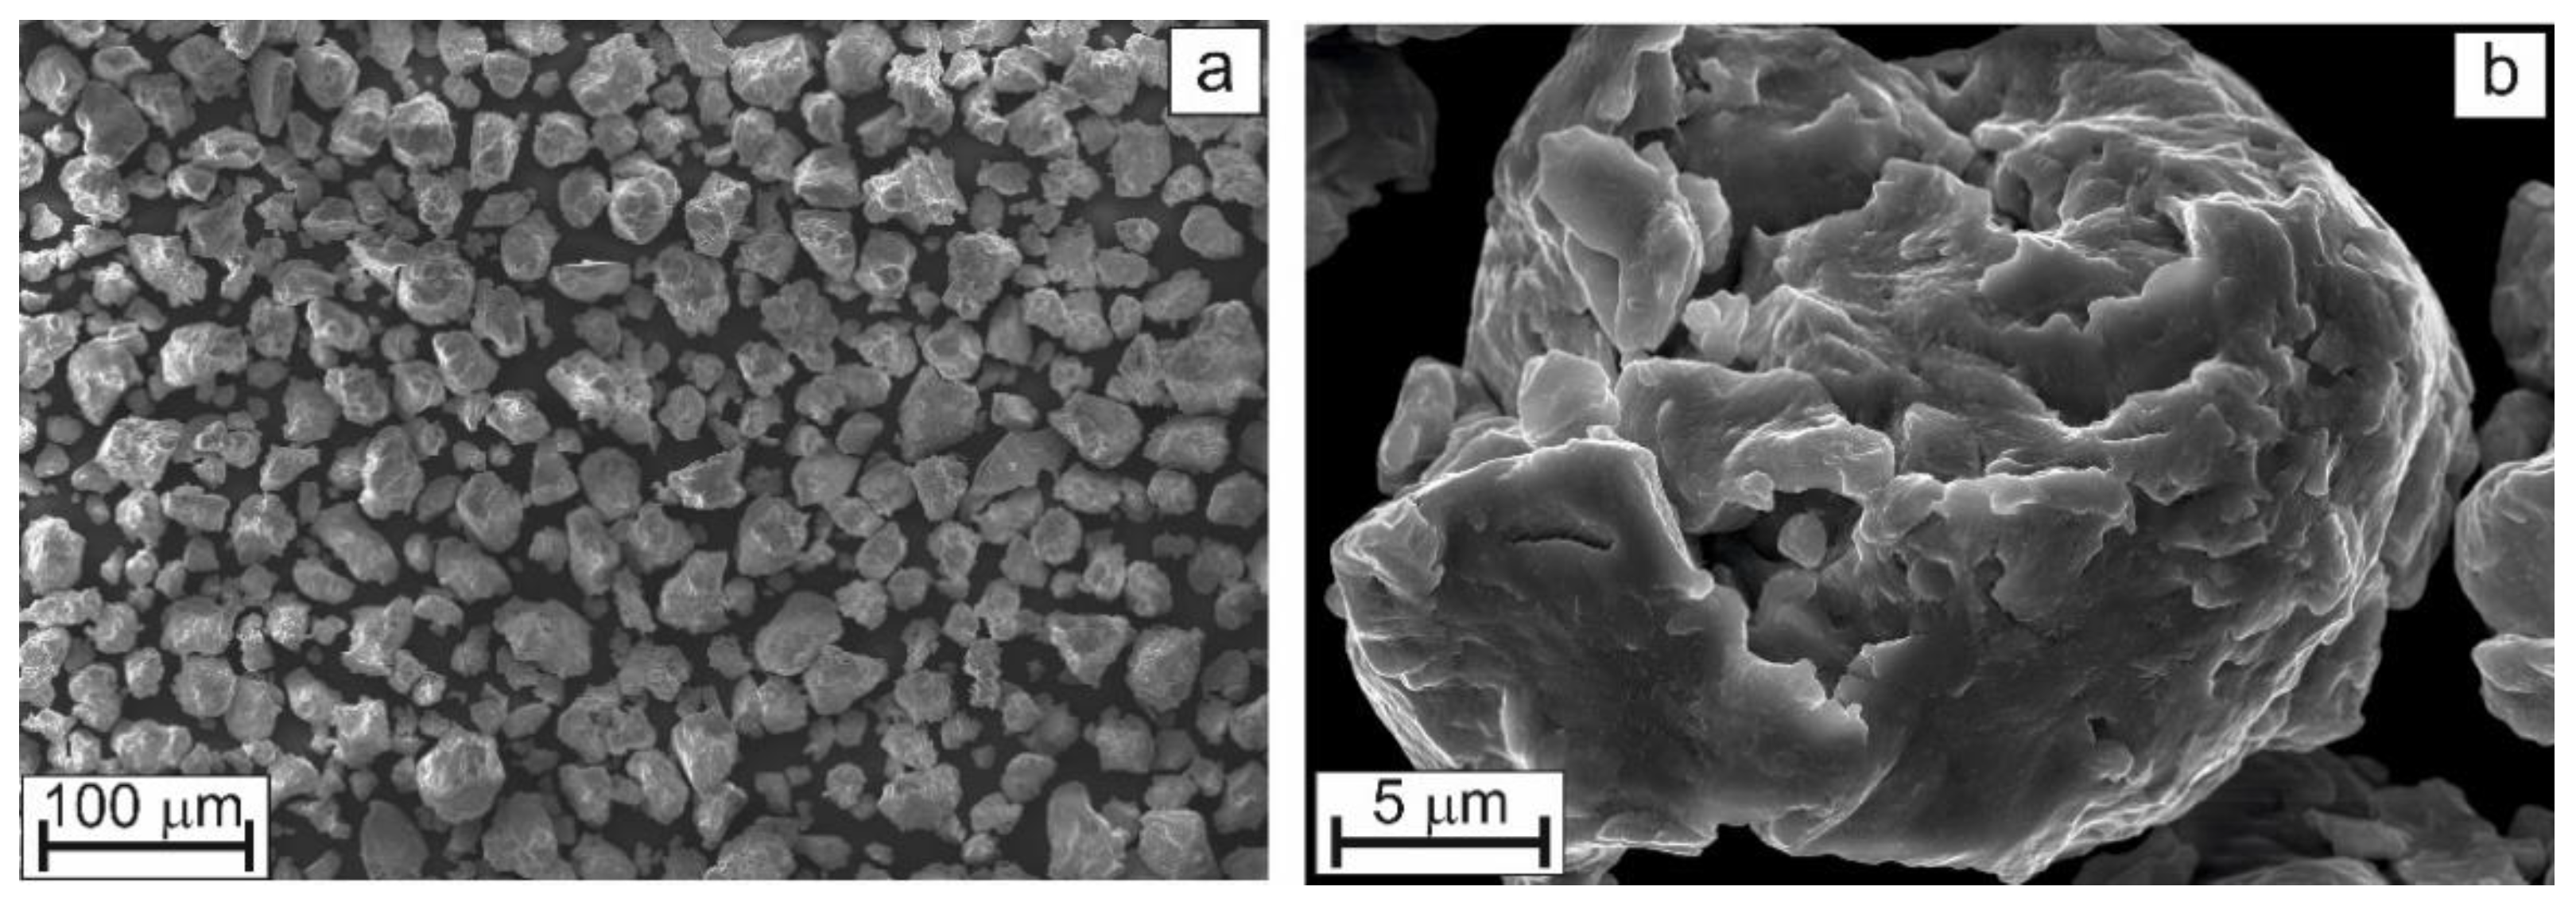
Figure 1 shows the external view of mechanically alloyed powder after 90 min of high-energy ball milling. It follows that the HEBM processing of starting mixtures formed by powders with strongly different particle size results in the formation of powder with a nearly uniform particle size distribution (
Figure 1a). Each individual particle (
Figure 1b) bears the traces of multiple plastic deformations.
The quinary alloy under consideration can be represented as Co
aCr
bFe
cNi
dAl
e, where
a,
b,
c,
d, and
e stand for respective stoichiometric coefficients indicating a relative mole fraction of each metal (
a +
b +
c +
d +
e = 5). It follows that, in case of equiatomic alloy,
a =
b =
c =
d =
e = 1. The results of EDS analysis averaged over 15 randomly selected individual particles (
Table 1) suggest that, on aggregate, the measured values of coefficients
a–e for alloyed powder particles are more or less close to unity (see first line in
Table 1). The particle surface is seen to be enriched in Cr and Fe and strongly deficient in Al. Moreover, the analysis also showed the presence of carbon and oxygen on the surface of alloyed particle, which can be associated with the presence of adsorbed gases (CO, CO
2) and formation of oxide films.
The EDS results for cross sections of alloyed powder particles (see
Table 1) and their SEM images (
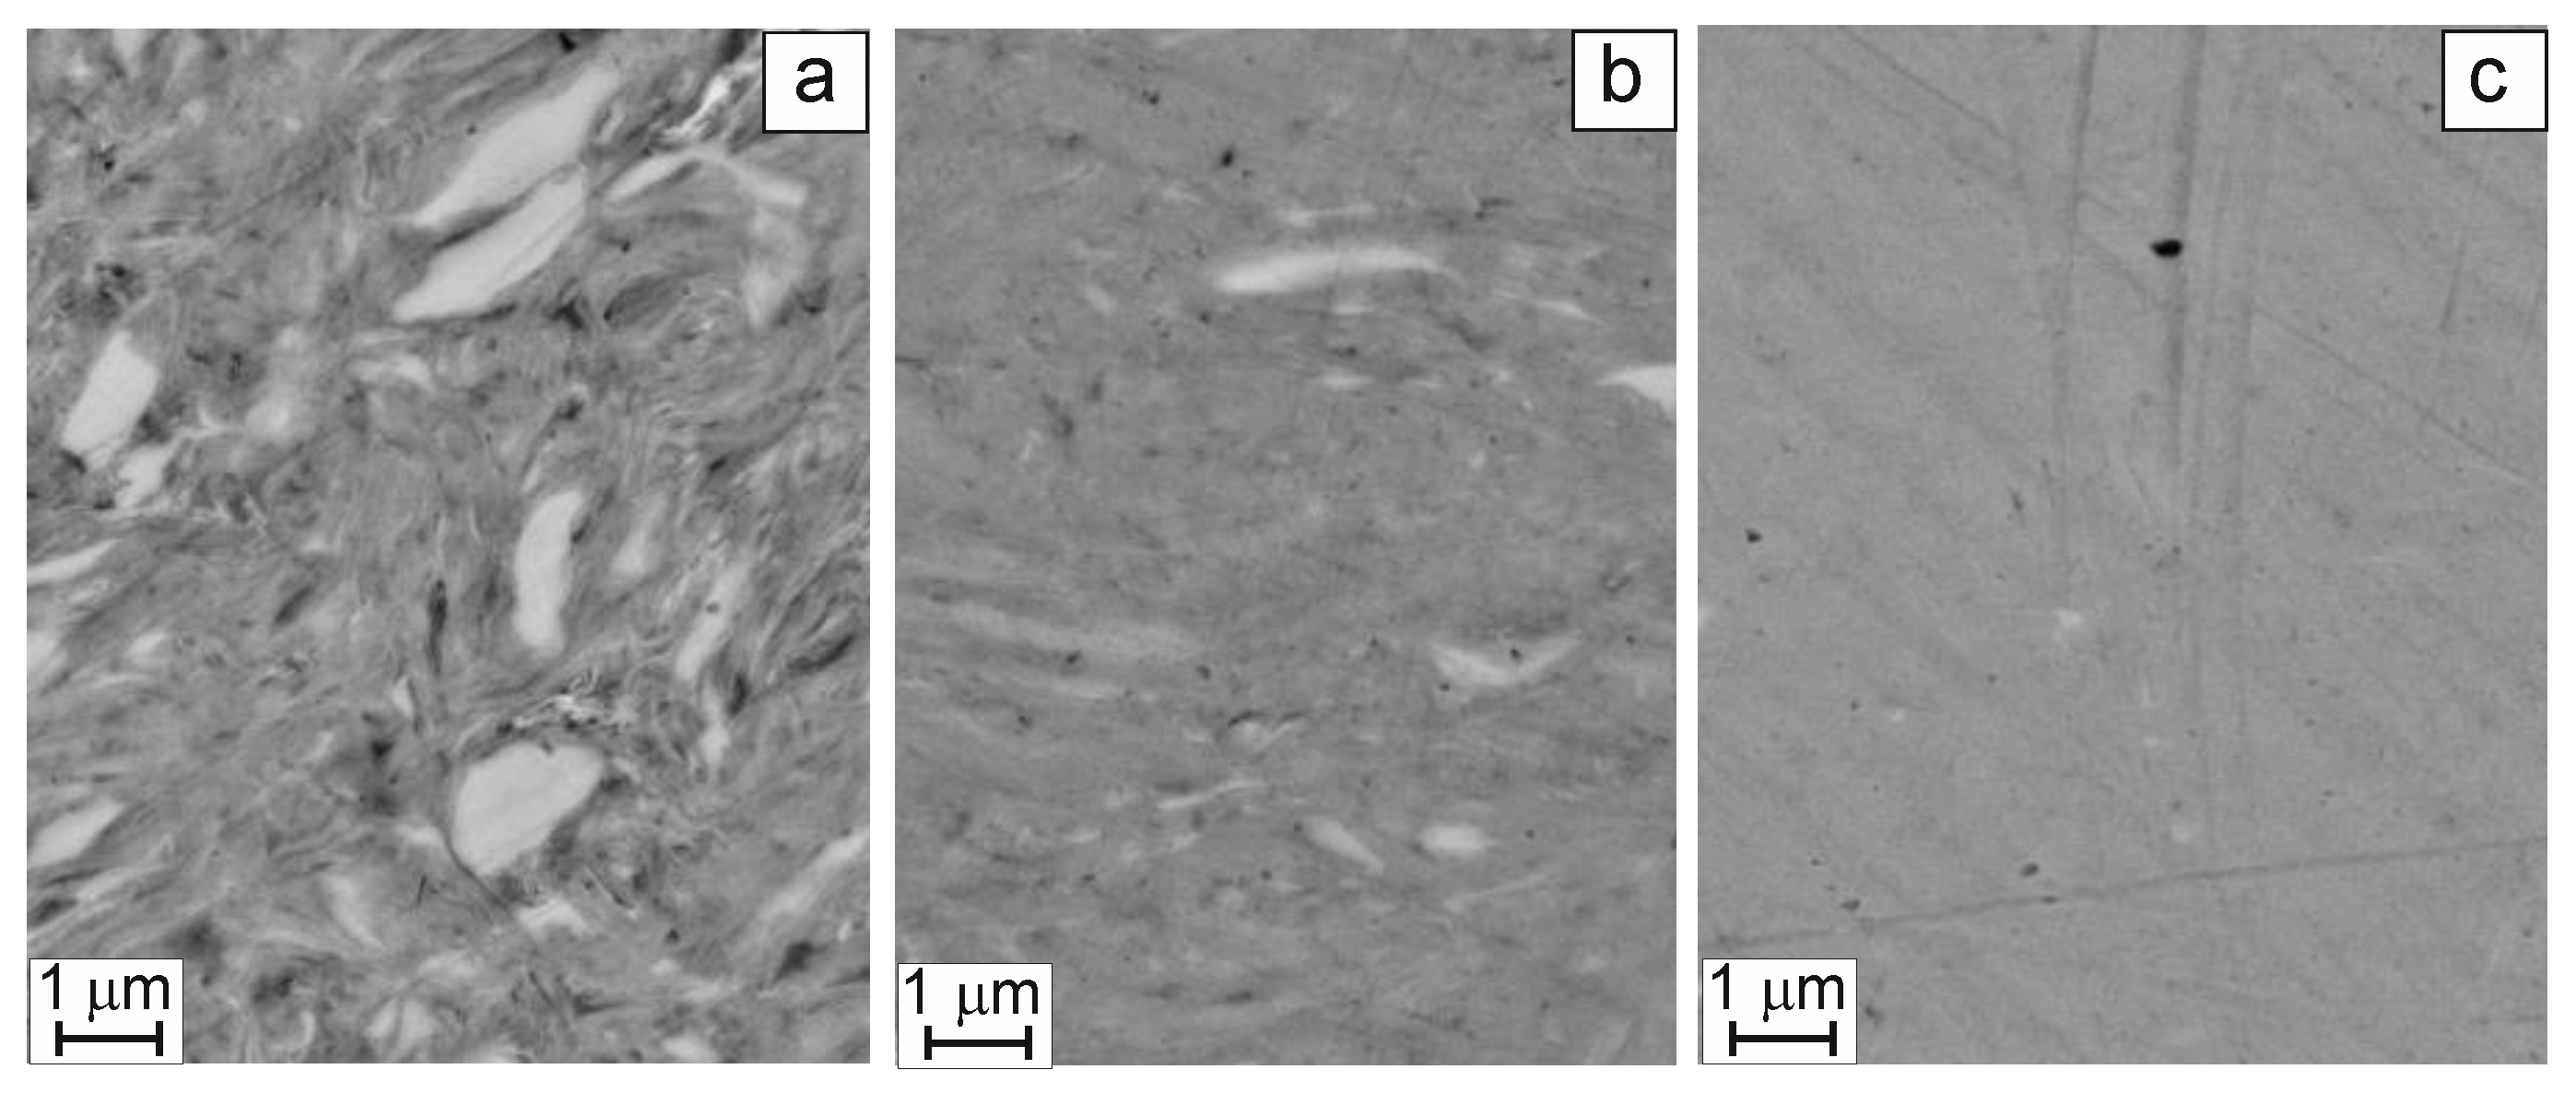
Figure 2) shed some light on the dynamics of changes in the alloy microstructure and chemical composition in the course of the HEBM process. Within 30 min of HEBM processing, we observe the formation of a nano-heterogeneous matrix of thin metal layers (grey areas in
Figure 2a) with micro-sized inclusions (white areas in
Figure 2a). The EDS results suggest that the composition of the matrix phase is nearly equiatomic, while Fe is predominant within the white inclusions (see also
Table 1). After 60 min of mechanical alloying (
Figure 2b), the amount of white inclusions steeply decreases, whereas the matrix becomes practically homogeneous. After 90 min of ball milling, we come to a homogeneous alloy (
Figure 2c) whose Fe content is slightly above unity (
Table 1) at the expense of lower Co and Fe contents. An excessive amount of Fe can be explained by its abrasive milling from the surface of steel milling bodies.
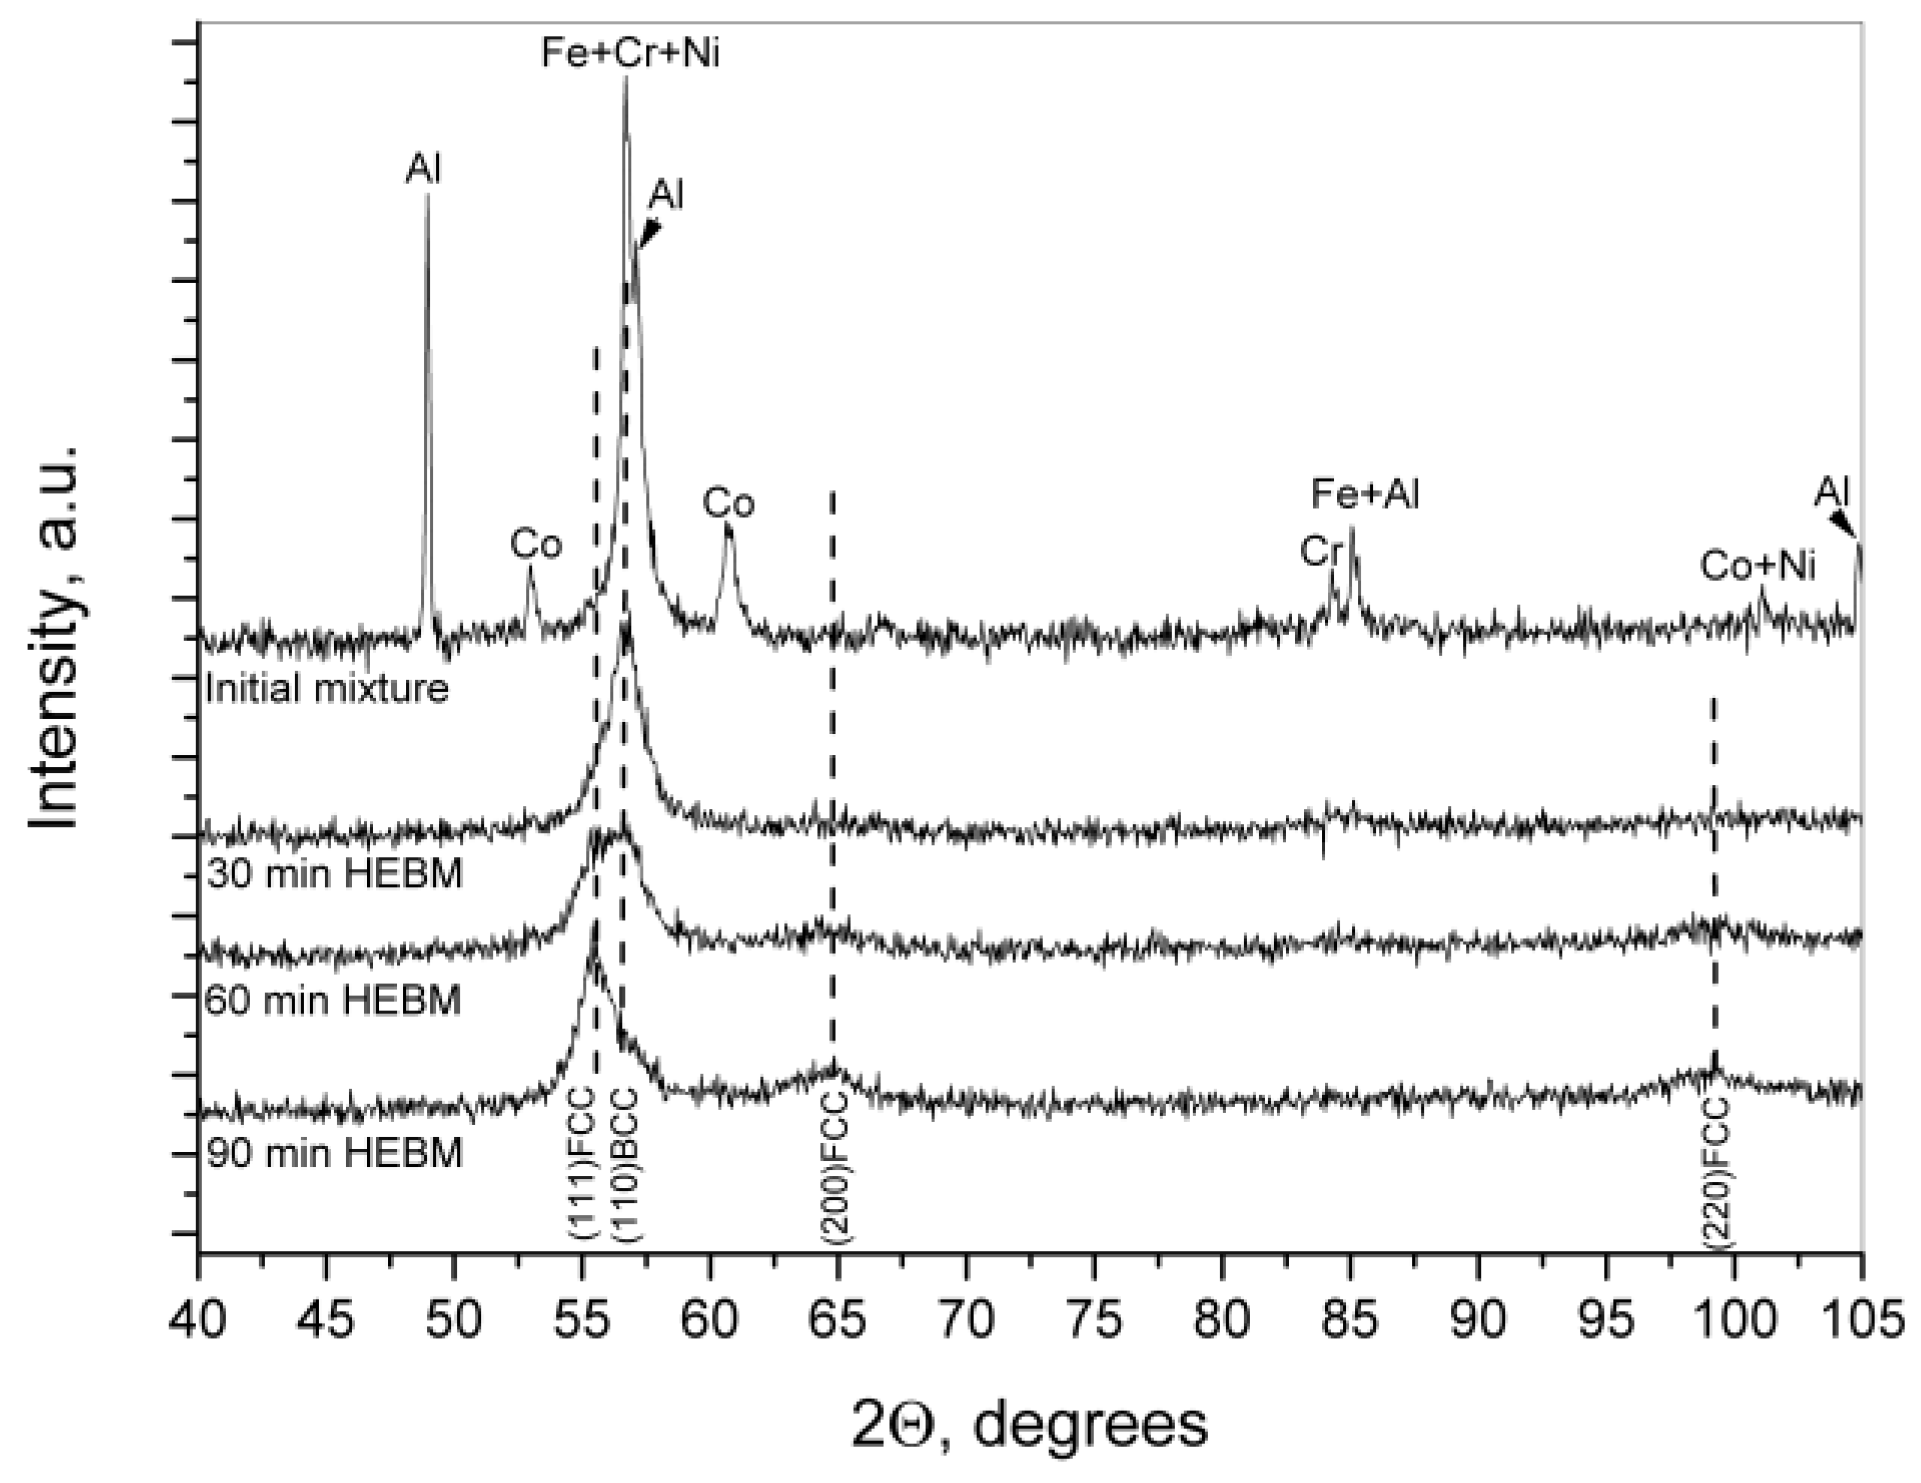
Figure 3 presents the diffraction patterns of CoCrFeNiAl mixtures before (upper curve) and after HEBM for 30, 60, and 90 min. The behavior of phase composition as derived from
Figure 3 well agrees with that described above. The XRD pattern of starting powder mixture exhibits the peaks (partially overlapping) from all constituent metals. Partial overlapping could be expected since the atoms of Fe, Ni, and Cr have close atomic radii and crystallize in cubic structures (BCC for Fe and Cr, and FCC for Ni). Already at the first stages of mechanical alloying (<30 min), a solid solution based on the BCC structure of α-Fe type is formed. Then follows a gradual BCC → FCC transformation, although the line (110) of BCC phase remain to manifest itself as the asymmetry of the main peak, which is a superposition of (111) FCC and (110) BCC lines, until 90 min of milling (lower curve in
Figure 3). Simultaneously, we observe the formation of a new BCC phase of solid solution. As a result, the resultant alloy gets consisted of two (BCC and FCC) solid solutions, which agrees with literature data on the structure of the CoCrFeNiAl
x alloys prepared by both casting and powder metallurgy methods (see
Section 1). The specific feature of our alloy is that it is almost amorphous: peaks’ widening attains a value of around 1.5–1.8°. Therefore, a crystalline size can be evaluated (using Scherrer’s equation) as 7–8 nm.
As mentioned above, earlier mechanosyntheses of CoCrFeNiAl alloy in ball mills required several dozen hours of milling. The fact that in our case it required only 90 min can be explained by a higher energy intenseness of our mill: in our experiments, the rotational speed was 900 rpm compared to previously used 250–300 rpm. Accordingly, it can be concluded that the efficiency of mechanical alloying depends on speed of rotation in a non-linear way: a triple increase in rotational speed affords for a tenfold decrease in milling time. The morphology and microstructure of our alloy particles are indicative of the leading role played by friction and shear deformation in the formation of solid solution, as declared in recent review [
18].
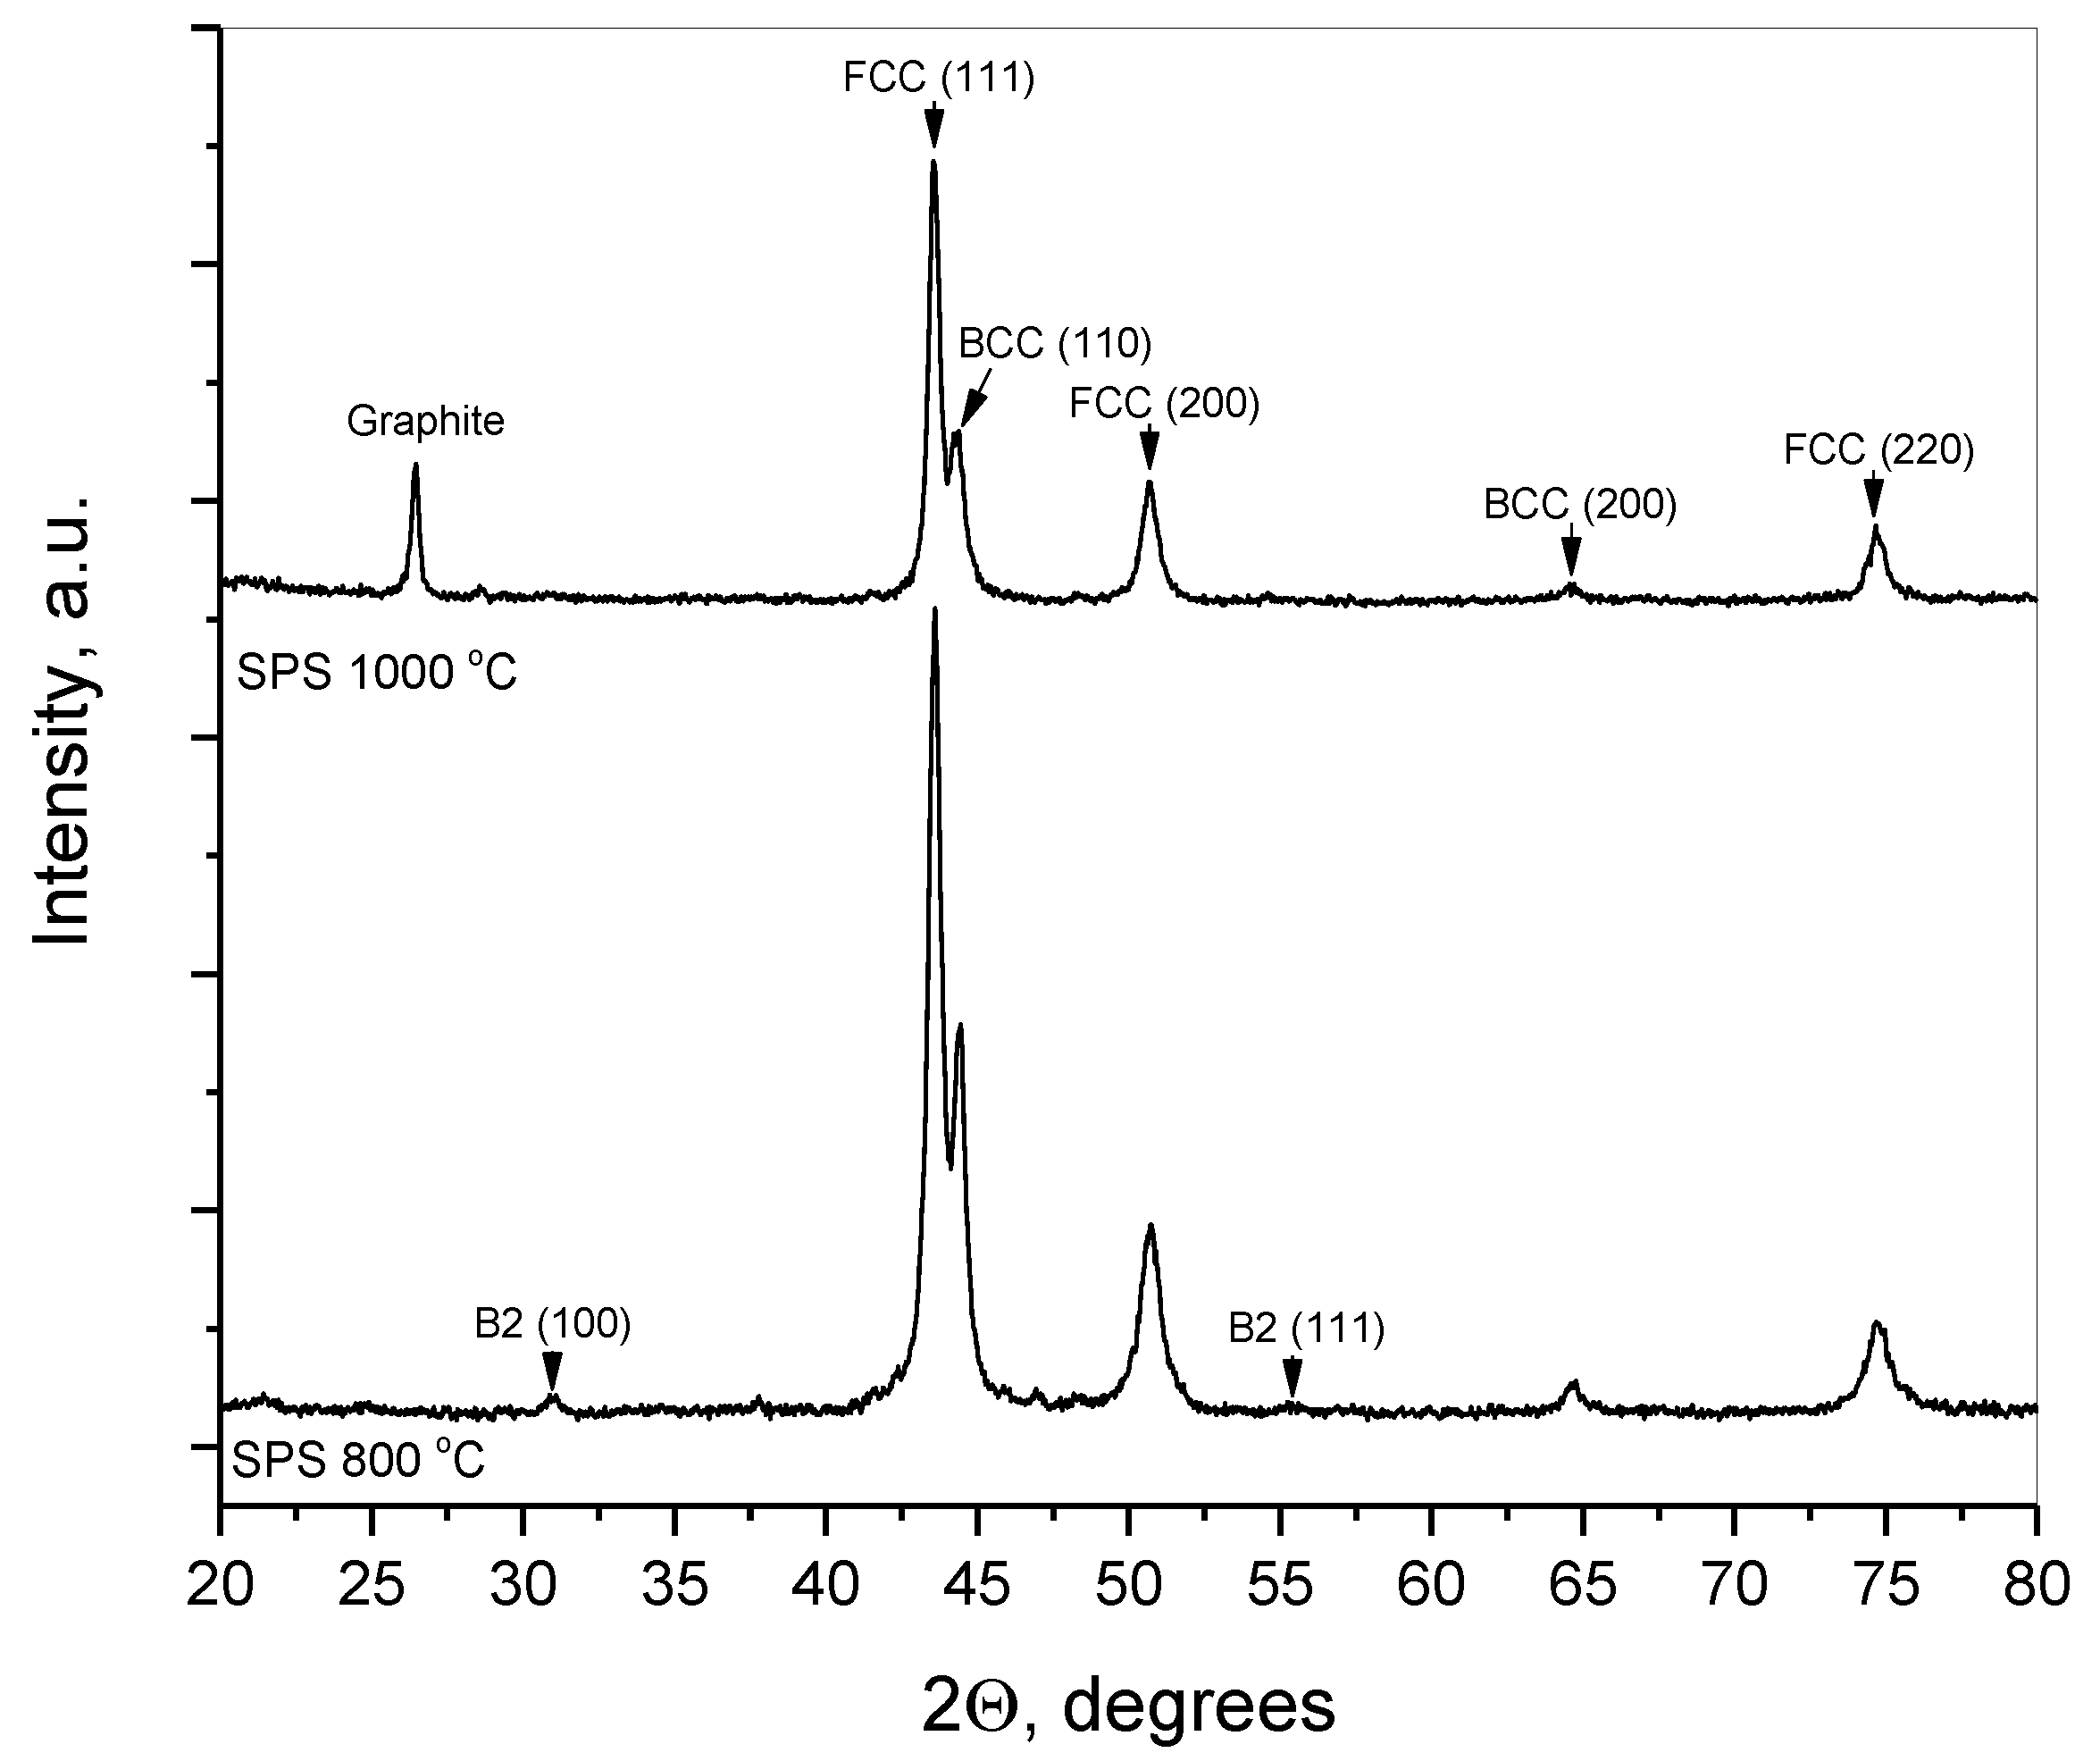
After SPS consolidation, the initially amorphized FCC and BCC phases crystallize to a greater extent, so that their diffraction peaks get narrower and stronger in intensity (
Figure 4). SPS consolidation at 800 °C gives rise to the ordering of initially disordered BCC solid solution, which is indicated by the appearance of small peaks from a B2 structure (lower curve in
Figure 4). Upon SPS consolidation at 1000 °C, there are no B2 peaks but there appears a diffraction peak from graphite tentatively due to the contamination of the sintered material by carbon from press-mold at high temperature.
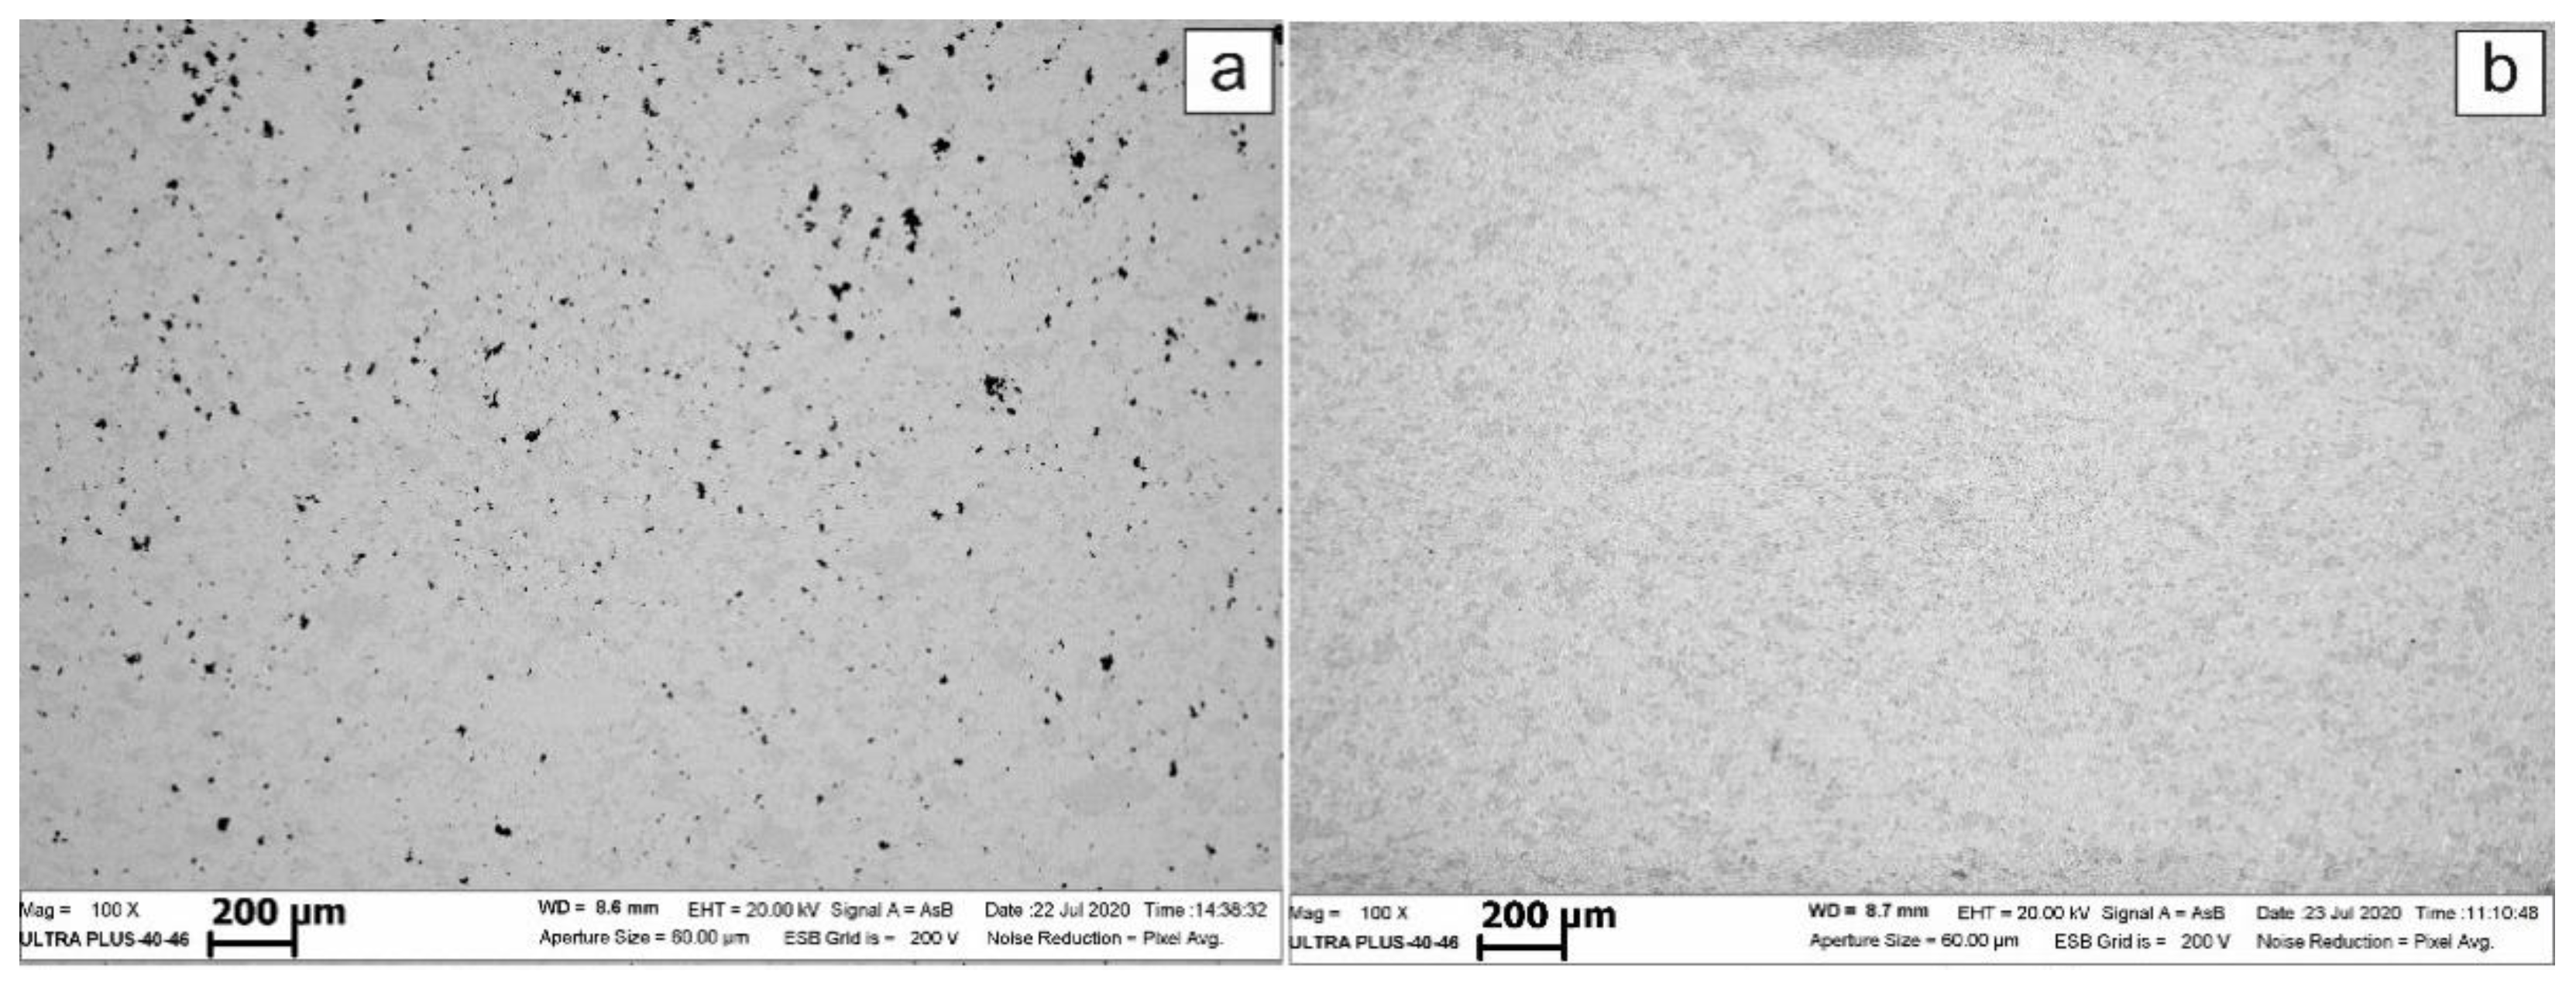
Two phases can be distinguished in the microstructure of SPS-consolidated materials (
Figure 5). Since a contrast in the SEM images taken in backscattered electrons is defined by a mean atomic number of a given phase, we may deduce that the light-grey phase has a higher mean atomic mass compared to that of the dark-grey phase. The sample SPS-consolidated at 800 °C exhibited also residual porosity (black). Metallographic measurements of the residual porosity, using a random square mesh, showed that the sample sintered 800 °C has residual porosity up to 8.2%, while the sample sintered at 1000 °C is practically pore-free.
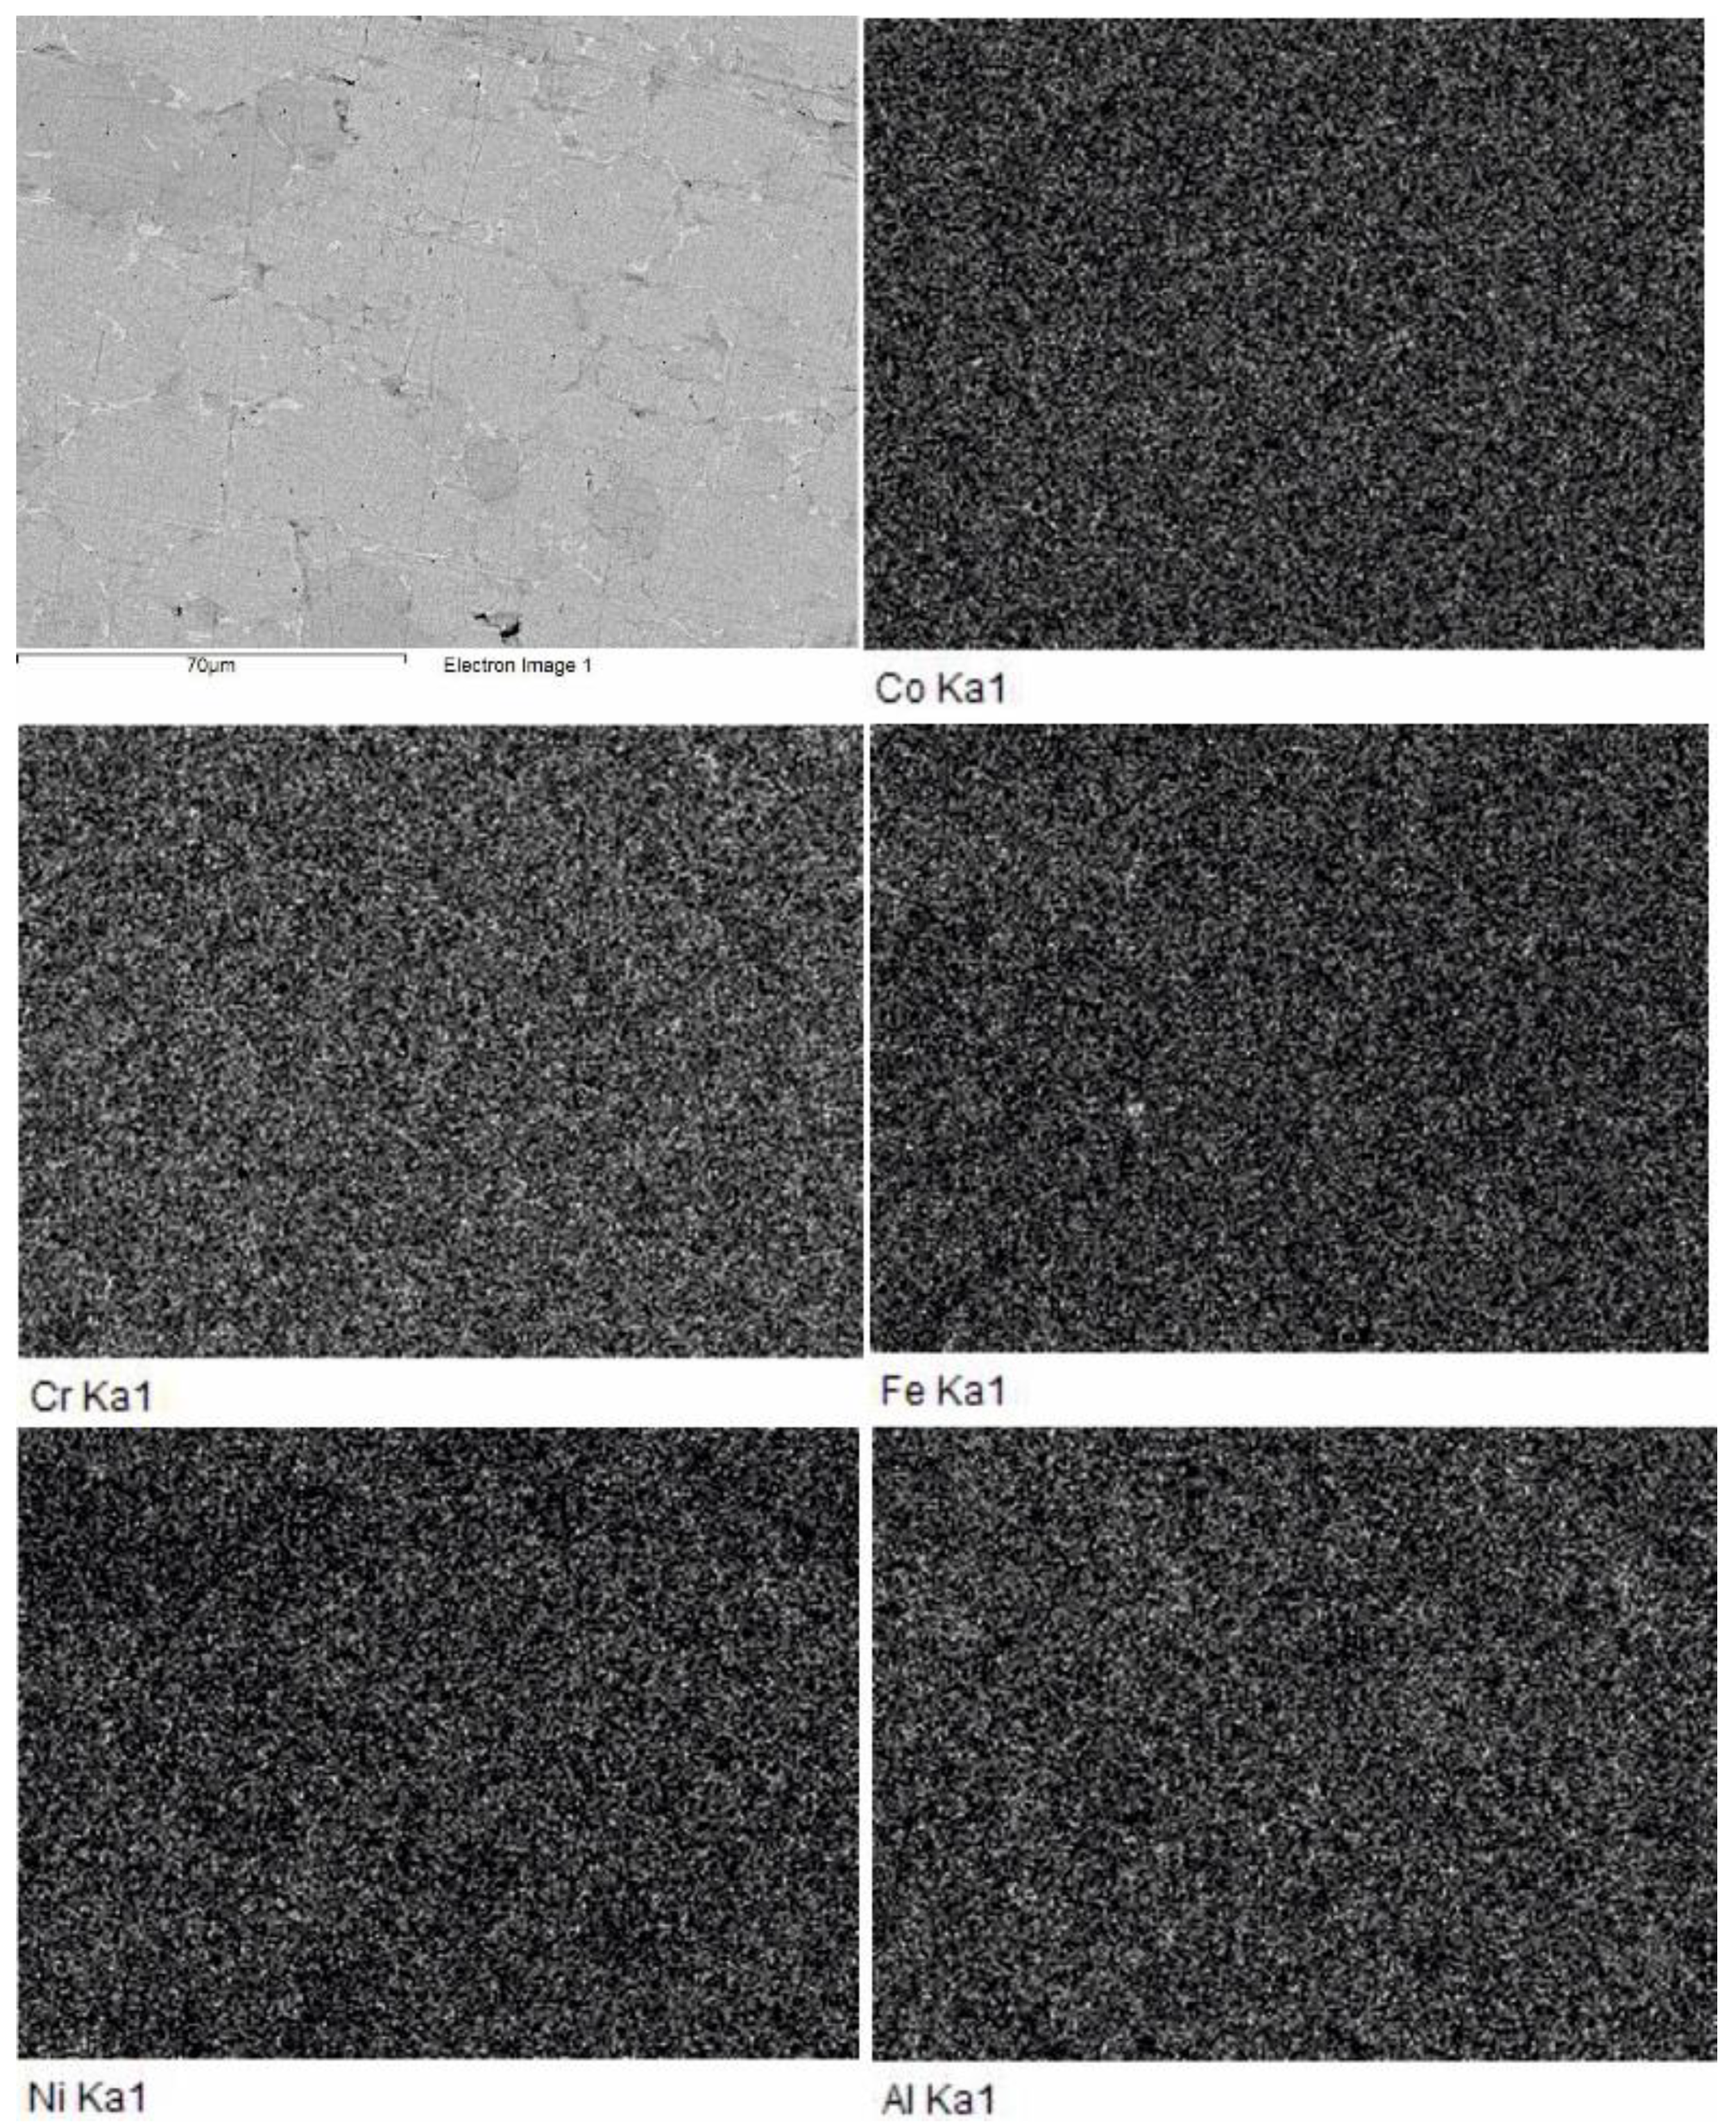
The SEM image taken at higher magnification (upper left picture in
Figure 6) reveals that the material sintered at 800 °C consists of brighter and darker grey grains and white intergranular phase. Meanwhile, the elemental maps in
Figure 6 show no difference between the bright and dark areas.
The results of qualitative EDS analysis for the above phases are presented in
Table 1. These results suggest that the bright and dark areas correspond to two quinary phases of close composition. Since the bright grains contain more Ni (atomic weight 58.69) while the dark ones, more Fe (atomic weight 55.85)—it can be assumed that, in the SEM images taken in backscattered electrons, the grains containing more Ni look brighter than those containing more Fe. However, the mean atomic mass of metals in the bright and dark grains is practically the same: 50.515 and 50.587, respectively. Therefore, the shade of grains in SEM images are not determined by metal contents, because both main phases contain all five metals in roughly equal atomic fractions. Apparently, the observed shade difference can be attributed to differences in the amount of lightweight impurities. According to the results of chemical analysis, our alloys contained around 3 at. % of impurity oxygen. Accurate determination of oxygen in individual grains is hard to conduct, nevertheless, semi-qualitative EDS microanalysis has shown that the oxygen content of dark grains is higher than that of bright ones by a factor of 1.5–2.5. Even a small admixture of such a light element as oxygen (atomic weight 16) can noticeably decrease the mean atomic mass of alloy. As is seen in
Table 1, the intergrain phase contains much Fe and a little Al.
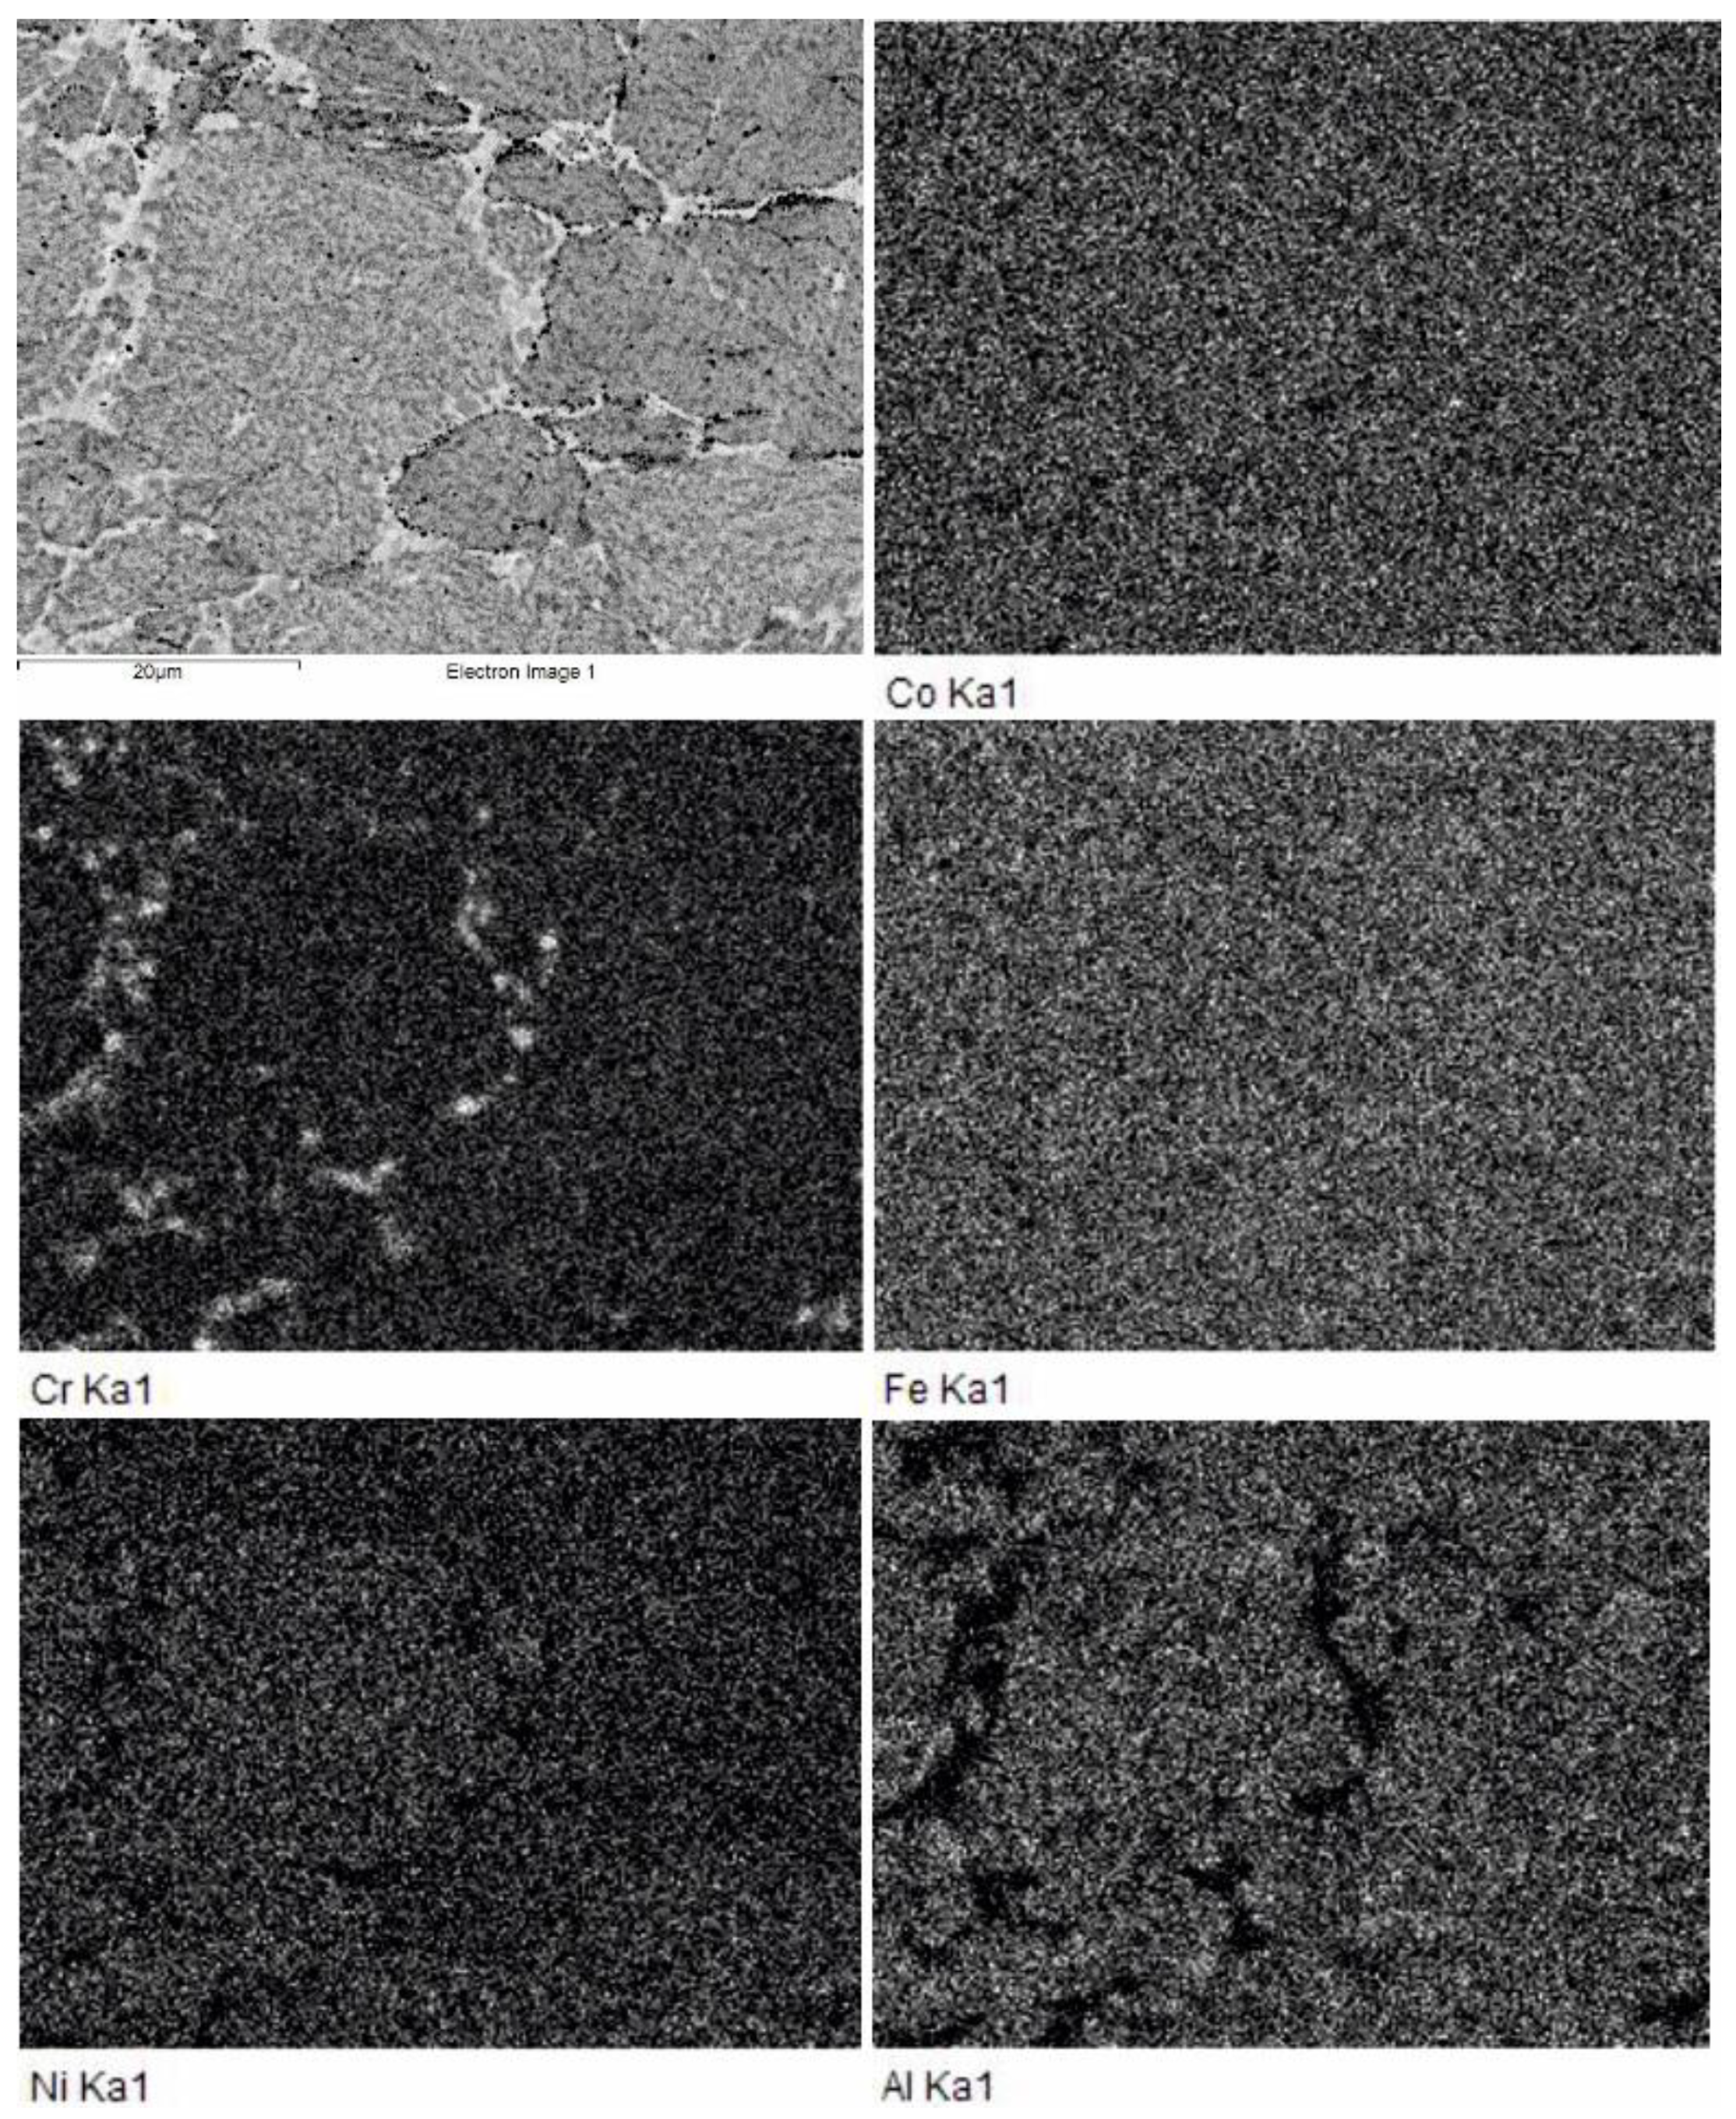
In samples consolidated at 1000 °C, we observe (
Figure 7) some concentration inhomogeneities within the grains and growth of the intergrain phase. Grain compositions are essentially the same as those sintered at 800 °C (
Table 1), differences between the bright and dark grains being smaller. At the same time, the appearance of fine structure inside the grains allow us to admit the occurrence of the spinodal decomposition of intergranular phases similar to that observed in [
15] for the SPS-consolidation of elemental powder mixtures at 1200 °C.
In the Al-lean intergrain phase, we observe the agglomeration of Cr-based inclusions (
Figure 7). The chains of small black inclusions into the intergrain space can be identified as the graphite inclusions visible in the upper diffraction pattern in
Figure 4.
The values of Vickers hardness HV measured at different points of the alloy sintered at 800 °C showed two groups of strongly different results—3080 ± 310 MPa and 6063 ± 541 MPa (
Supplementary Materials Figures S1 and S2)—which should be associated with the presence of two phases (FCC and BCC) and two kinds of grains (bright and dark ones). Apparently, higher HV values can be assigned to the BCC grains while smaller ones (higher ductility), to the FCC grains. Different concentration of oxygen in the grains, as well as presence of small pores, can also increase spreading of the results. A sample sintered at 1000 °C possesses more uniform microhardness equal to 4360 ± 165 MPa. The specific density of the samples increases with sintering temperature. The samples sintered at 800 °C have specific weight 6.53 g/cm
3, sintered at 1000 °C–7.02 g/cm
3. Theoretical density, calculated on the base of X-ray diffraction measurements of the unit cell parameters, is about 7.2 g/cm
3 for FCC and 7.0 g/cm
3 for BCC phases. Comparing these values and taking into account that the SPS-consolidated samples consist of FCC and BCC phases, we can conclude that the samples consolidated at 800 °C have porosity about 8%, while porosity of the samples consolidated at 1000 °C is about 1% or less. These results are in a good agreement with the metallographic measurements. The electric resistivity of synthesized alloys showed little or no dependence on sintering temperature: 0.21 mΩ⋅cm and 0.20 mΩ⋅cm for the alloys sintered at 800 °C and 1000 °C, respectively.
Co-existence of the BCC and FCC phases is typical both for cast and mechanically alloyed CoCrFeNiAl. It is known that formation of BCC or FCC phases in HEA depends on the average valence electron concentration (
VEC) of the alloy that can be calculated by equation [
19]:
where
n denotes the total number of elements in the alloy (
n = 5 in our case);
ci—stoichiometric coefficient in the chemical formula, e.g., for the Co
aCr
bFe
cNi
dAl
e i = a, b, c, d or
e (see
Table 1);
(VEC)i is the valence electron concentrations for all elements. For example,
(VEC)Co = 9,
(VEC)Cr = 6,
(VEC)Fe = 8,
(VEC)Ni = 10, and
(VEC)Al = 3 [
19]. An empirical
VEC rule states that FCC solid solutions form at
VEC ≥ 8.0, BCC solid solution phases at
VEC < 6.87, and a mixture of FCC and BCC phases at 6.87 ≤
VEC < 8 [
19,
20]. Recently, application of this rough rule for the Co-Cr-Fe-Ni-Al system has been revisit using HT-CALPHAD calculations [
21]. A conclusion was made that BCC structures form when 5.7 ≤
VEC ≤ 7.2, and FCC structures when
VEC ≥ 8.4. A common trend is that a higher
VEC favors the FCC type solid solutions, and a lower
VEC favors the BCC type solid solutions. Equimolar CoCrFeNiAl has
VEC = 7.2, which is on the boundary between pure BCC and two-phase composition. Using the stoichiometric coefficients from
Table 1, we obtain
VEC = 7.15–7.18 for light-gray grains,
VEC = 7.13–7.16 for dark-gray grains, and
VEC = 7.53 for intergranular phase. Thus, according to the
VEC rule, the HEAs under study should be two-phase alloy with prevailing BCC (grains) and minor FCC (intergranular) phases. We have two-phase alloy with FCC major phase (
Figure 4). Therefore, the
VEC rule should be applied carefully to this alloy, taking into account other factors, like crystal lattice distortions, atomic radii, and preparation routes. As it was mentioned before, the limits for BCC and FCC phases established by the
VEC rule can even vary for the same composition but prepared with different cooling rates [
20]. The precipitation of the Cr-rich phases (
Figure 7) increases the mean
VEC value of HEA matrix and favors the formation of the FCC phase during SPS. Also, the influence of light elements (O, C) dissolution on the mean
VEC value has not been studied yet. Further research could shed some light on the problem of phase selection and stability in the CoCrFeNiAl HEA produced by HEBM and SPS methods.
