Article

Deformation Behavior of C15E + C Steel under Different Uniaxial Stress Tests

1
Department of Engineering Mechanics, Faculty of Engineering, University of Rijeka, Vukovarska 58, 51000 Rijeka, Croatia
2
School of Materials Science and Engineering, Henan Polytechnic University, 2001 Century Avenue, Jiaozuo 454003, China
*
Author to whom correspondence should be addressed.
Main author.
Metals 2020, 10(11), 1445; https://doi.org/10.3390/met10111445
Submission received: 10 September 2020 / Revised: 26 October 2020 / Accepted: 26 October 2020 / Published: 29 October 2020
(This article belongs to the Section Metal Failure Analysis)

Abstract

:
In this paper, the mechanical properties of the material that define its mechanical behavior are experimentally investigated. All performed experimental tests and analyzes are related to C15E + C steel. The tested material was delivered as cold drawn round bar. It is usually used in mechanical engineering for design of low stressed components. Experimentally obtained results relate to the maximum tensile strength, yield strength, creep behavior, and uniaxial fully reversed high cyclic fatigue. Results representing mechanical properties are shown in the form of engineering stress–strain diagrams, while creep behavior of the material at different temperatures and different stress levels is displayed in the form of creep curves. Tests representing uniaxial cyclic fully reversed mechanical fatigue at constant stresses and room temperature in air are shown in the form of fatigue-life ( S N ) diagram. Some of the experimental results obtained are as follows: ultimate tensile strength ( σ m ( 20   ° C / 500   ° C ) = ( 598 / 230 )   MPa ) , yield strength ( σ 0.2 ( 20   ° C / 500   ° C ) = ( 580 /   214   )   MPa   ) , modulus of elasticity ( E ( 20   ° C / 500   ° C ) = ( 213 / 106 )   GPa ) , and fatigue limit ( σ f ( 20   ° C ,   R = 1 ) = 250.83   MPa ) . The fatigue tests were performed at frequency of 40 Hz and at room temperature (20 °C) in air, with stress ratio of R = 1 .

1. Introduction

In order to find the best solution according to the design requirement, a good knowledge of the behavior of material exposed to the conditions that will prevail in the actual exploitation of the structure is required. In accordance with the basic design rules, the primary assessment relating to the selected material, which had been used in the design of structure, is that it does not contain any failure as well as that the failures will not occur during the service lifetime of the construction. However, only partially this may be fulfilled. Namely, during the entire life of the structure, including stages such as design process, manufacturing of the structural elements, assembling of structural elements, maintenance of the structure, structure service life, etc., many failures can occur [1,2,3,4]. It is known that each failure has its own cause of appearance and the form of manifestation. Using failure analysis, as a new engineering tool, based on the recognition of the cause of failure appearance and form of the failure manifestation, it can be determined why and how some engineering element has failed [5].
Generally, throughout the entire history of the structure, two essential failure groups are recognized and that: pre-existing failures and failures occurring during the structure’s service life. In the first group can be counted, e.g., existing failures in the material, while in the second one, those failures such as creep, fatigue, impact, misuse, assembly errors, unforeseen operating conditions, inadequate control, failure due to using material at high temperatures, etc. This study considers some of the possible failures, namely, failures caused by the use of material at high temperatures and those caused by fatigue of the material. Expose the material to high temperature may cause large instantaneous temperature deformation, creep failure as well as failure due to creep-fatigue service regime. Fatigue of a structural element made of a specific material, can be due by various forms of cyclic loading, which, acting in different environmental conditions such as atmospheric air, corrosive media and the like, can cause the rupture of the structural element. All of details regarding the deformation due to mentioned failures, such as high temperature deformation, creep strains as well as deformation due to fatigue, which can lead to the rupture of the element, are discussed in the next parts of these investigations. Creep, as one of commonly observed mechanical failure modes in engineering practice [3,6], is usually defined as time-dependent deformation under constant level of stress (load) of a shaped material (i.e., engineering element), which causes its increase in length. Simplified, creep is a slow and progressive deformation of metals over time at constant stress. Creep occurs in metals at high temperature (thermal creep), although at certain materials, it occurs at relatively low temperatures [7], even at room temperature (e.g. lead and glass). Creep is actually a unique phenomenon that causes plastic deformation of the material, although the yield strength may not be reached. A common view in engineering practice is that creep is appreciable above 0.4 T m , where T m is melting point measured in Kelvin. Namely, the permanent deformation of materials subjected to loads can be plastic deformation or creep. At crystalline materials, when considered temperature is lower than 0.4 T m   , the permanent deformation is called plastic deformation, in contrast, i.e., when temperature is above 0.4 T m , the behavior (permanent deformation) is called creep [8]. At the other hand, in accordance with the American Society for Metals, for aluminum alloys, high temperature behavior is noticeable at 205 °C, for low alloy steels, it is 370 °C, etc., [9]. However, creep behavior of metals depends on the type of the material, temperature, and applied stress level, and usually, it is displayed graphically. Creep curve may be consisted of three parts, i.e., primary (instantaneous) creep, secondary (steady-state) creep, and tertiary (accelerating) creep. As another observed mechanical failure mode can be mentioned fatigue of the material. Fatigue of the material can be caused by fluctuations in externally applied stresses and it is termed as mechanical fatigue. Acting of cyclic load in association with high temperature is known as creep-fatigue. In addition, when material is subjected to repeated load in chemically aggressive media then process is termed corrosion fatigue, etc. The purpose of this research is to determine the mechanical behavior of the test material exposed to different loads and environmental conditions and to compare the obtained results with other available results. However, the results of studies that would be similar in content and volume to those presented here cannot be found in the literature for this material.
Relevant available research relating to the material under consideration that can be found in the literature are as follows. The behavior of bimetallic components during the cold upsetting process has been investigated and presented in [10]. At one of the considered components, a solid inner cylinder was made of steel C45E material surrounded by a softer C15E core. In [11], authors have paid the attention to High Velocity Oxygen Fuel (HVOF) thermal spraying method using which the progressive coatings are applied on basic C15E material (substrate). Results of adhesive wear showed high quality of coatings and their suitability to tribological conditions. Further, authors in [12] have investigated fatigue behavior in the very high-cycle regime of normalized carbon steel (Ck60, 0.61%C) and (Ck15, 0.15%C) at load ratio R = −1 and cycling frequency of 20 kHz. Both steels show a distinct change of slope in the S—N curves at approximately 10 7 cycles. In addition, fatigue behavior in high-cyclic fatigue and very high-cyclic fatigue regime (HCF/VHCF) of the steels C15E, C45E, and C60E with different ferritic-pearlitic microstructures was also investigated in [13]. In addition, damage evolution in such body-centered cubic low-alloyed steels was investigated. In [14], authors have investigated the influence of different microstructures on deformation and damage mechanisms in the HCF and VHCF regimes using three different plain carbon steels (C15E, C45E, and C60E) with different ferrite to pearlite ratios. The authors in Reference [15] have studied the behavior of middle carbon steel (1.1181; DIN: (C35E, Ck35); AISI 1038; JIS S38C) used for the axle of Japanese bullet train, which was subjected to fatigue tests performed at room temperature in air, where fatigue tests were load controlled. Load was of sinusoidal form and stress ratio was R = 1 , i.e., material was loaded in similar form as that in this investigation. Material chemical composition was: C (0.35–0.41), Si (0.15–0.35), Mn (0.6–0.9), P (0.03), and S (0.035), while yield strength and tensile strengths were 374 and 603 MPa, respectively. The series of high cycle fatigue tests were performed under the load frequency of 10 Hz, 400 Hz, and 19.8 kHz. Obtained results varied in fatigue limit in such a way that those at 10 and 400 Hz were almost equal (250 MPa), while that at 19.8 kHz was much higher (370 MPa). Explanation regarding results was that the difference might be due to load frequency, specimen geometries, etc. Based on the S—N curves, as it was presented, it is visible the difference in the cycles at the knee points for frequency of 10 and 400 Hz from one side and frequency of 19.8 Hz from another side. Crack initiated at the surface of the specimen for all of frequencies and fracture surface was ductile at lower frequencies, while at 19.8 kHz, it was some brittle (like the cleavage). Tested material contains 50% ferrite, which is body centered cubic, and in this case, mechanical properties depend on strain rate strongly. The explanation regarding the difference in the number of the cycles at frequencies 10 and 400 Hz and that of 19.8 kHz, was primary based on the existing difference between the lower yield strength at considered frequencies. Namely, in the fatigue test at 19.8 kHz, the increase in fatigue limit may be due to increase in lower yield strength by the rapid straining. Furthermore, sometimes it is useful to the mechanical behavior of the material under consideration with the mechanical behavior of similar material as well as the behavior at high temperatures and fatigue of the material. Regarding the mechanical properties, creep resistance and fatigue of the material, material considered in these investigations can be compared with one structural steel and one low-alloyed steel, results of which are presented in [16,17]. In this regard, the authors [16] have provided very useful data on the mechanical behavior of structural steel having a similar chemical composition and similar strength properties as the material in the present study. In addition, the authors in [17] have provided data related to creep resistance, hardness testing as well as fatigue testing performed at lower stress ratio than that in this investigation of the low-alloy steel, and these data can be compared with that of the material considered in this paper. In Ref. [18], the authors have investigated the damage behavior of the low-alloyed steel during ultrasonic fatigue. Comparison of fatigue behavior of steel C15 E with fatigue behavior of steel C15 performed at stress ratio of R = 0.1 can be made having an insight in investigation done by authors in [19], where fatigue tests were conducted on notch specimens. The dominant fracture mechanisms occurring in mechanical metallic components during industrial service conditions was considered in [20], including low carbon structural steel C15 and its fracture due to tensile overload. Mayer [21] has provided some explanations based on the experiments that have been made on C15E steel (1.1141) in cyclic tension–compression and cyclic torsion tests. The tests were performed regarding the influences of low load cycles on fatigue damage in the very high-cycle fatigue regime using ultrasonic fatigue testing equipment. In Ref. [22], the authors have made experimental investigations regarding the shear loading at different strain rates using carbon steels and stainless steels. Since shear load and ultimate tensile load are mutually dependent, comparison regarding there analyzed carrying capacities and carrying capacity of C15E + C steel can be made. At the end of this chapter, and before presenting the results, it should be emphasized that the main intention of this research is to provide in one place a complete insight into the behavior of the material under consideration in different environmental conditions and loads. In this regard, it should be emphasized that the results of research on material properties at different temperatures, research results on material creep behavior, and especially the results of material fatigue tests are presented in one place and represent a novelty regarding similar tests by other authors. Such results are useful in selecting a material for its particular uses.

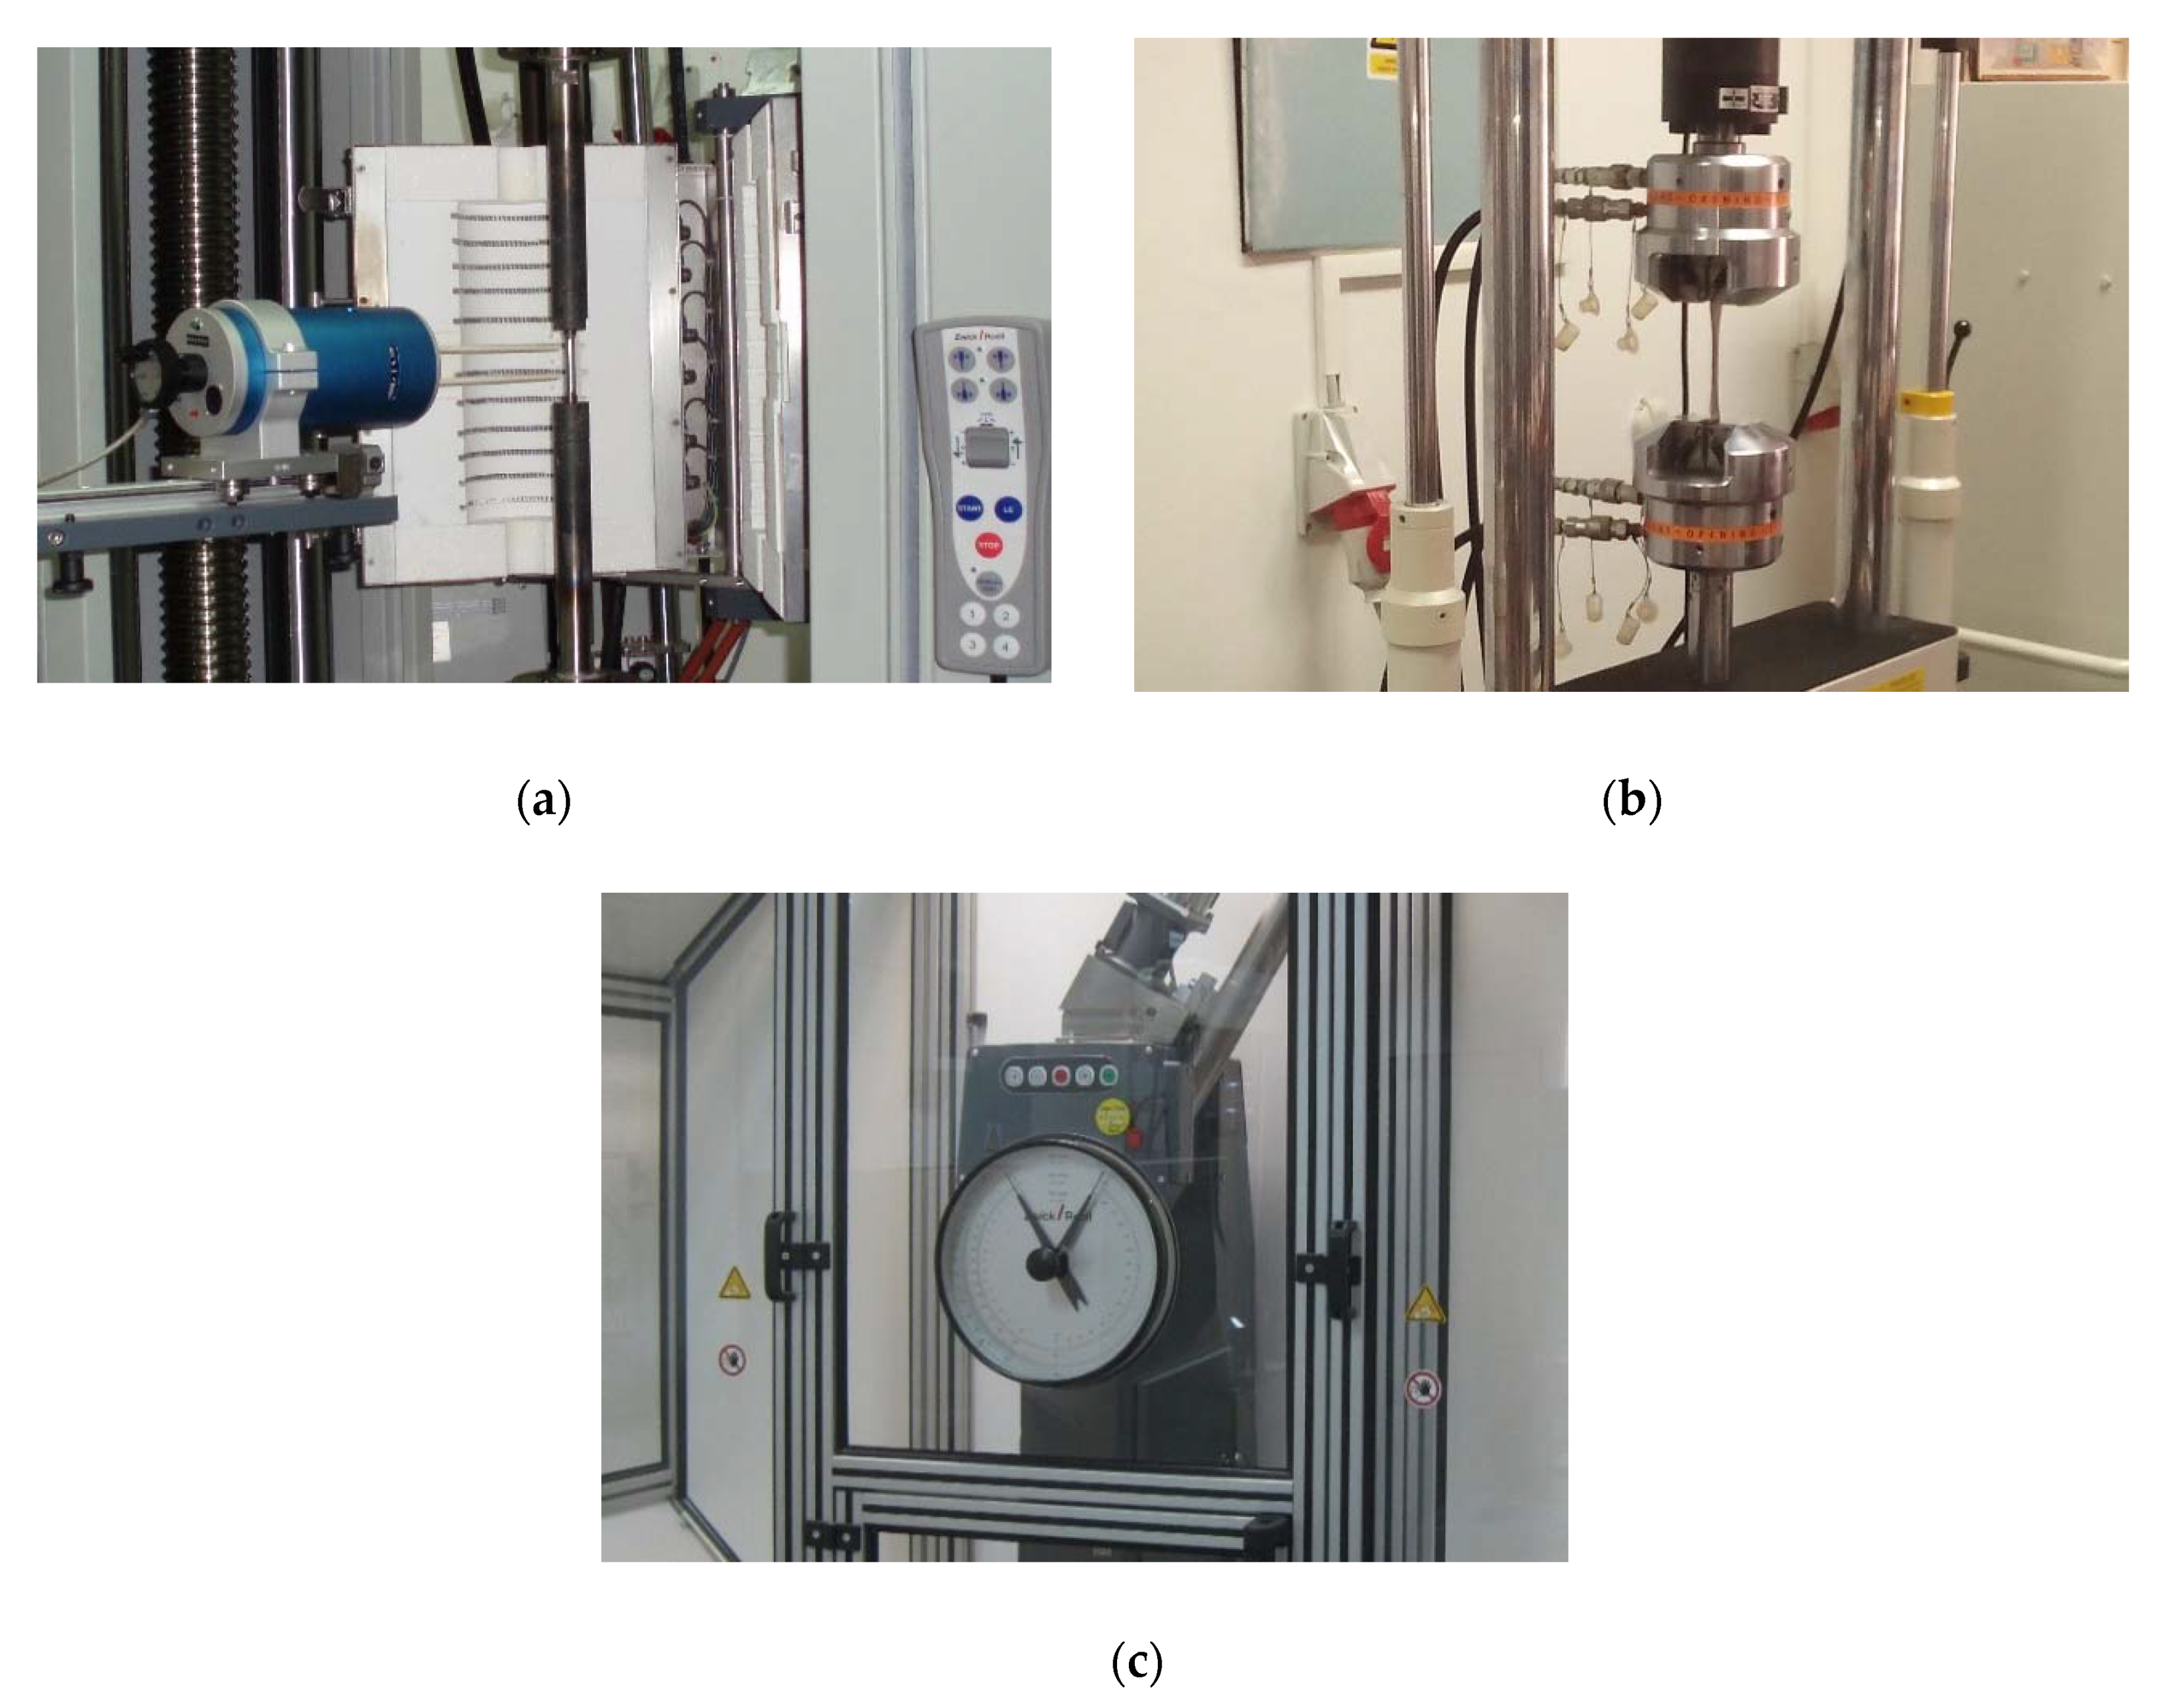
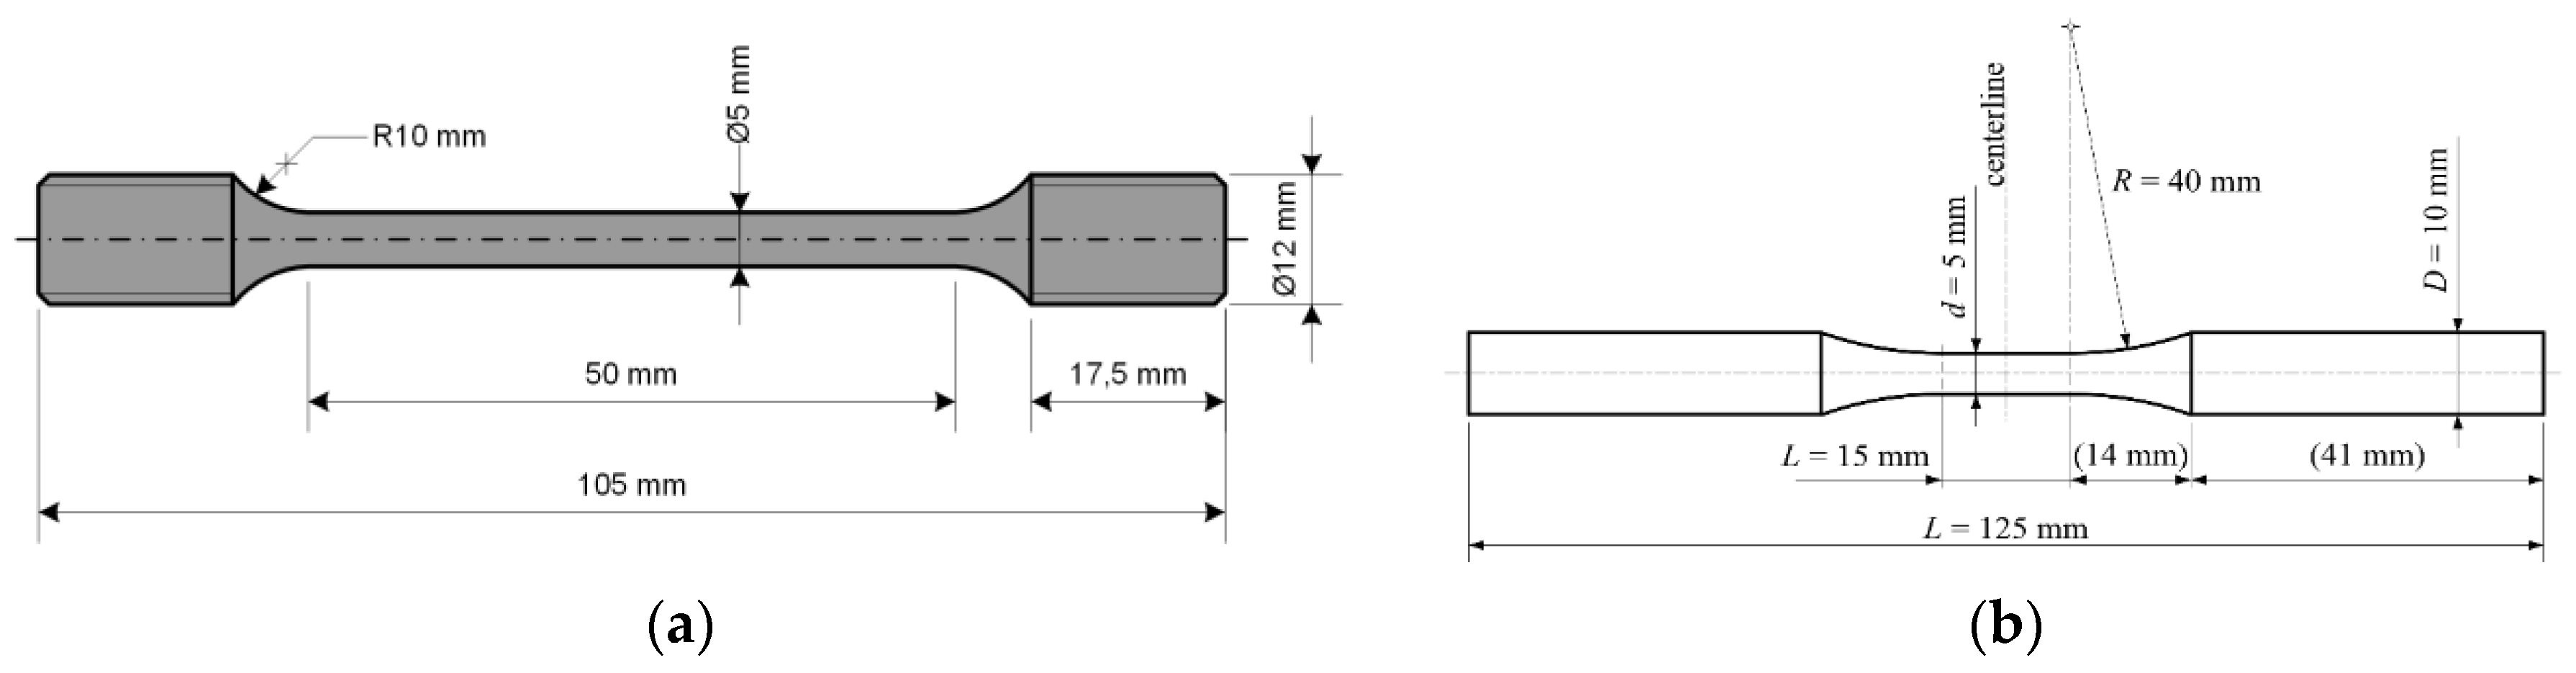
2. The Main Determinants of Research

Material—under consideration was cold-drawn round (15 mm) steel bar C15E + C (1. 1141). The steel grade C15E + C is the steel of lower phosphorus and sulfur content and belongs to the group of engineering steels. It is suitable for thermal treatment (case hardening) and is very well weldable. Machinability of C15E steel is good, especially in the cold drawn (cold worked) condition. It is the steel of relatively low strength but it may be quenched and tempered to increase strength. Generally, it can be termed as special nonalloyed case hardening steel (mild/low carbon steel/plain carbon steel): (0.05–0.3% C). Very good formability is a property that characterizes case-hardening grades and these steels are suitable for parts needing good wear resistance and can withstand extreme fatigue stress. The applications of considered steel can be found in the area of design and manufacturing of the low-stressed components in automotive industry and, in general, in mechanical engineering, e.g., in manufacturing of cranks, spindles, pins, bushings, bolts, shafts, fastenings, screws, clutch disks and other automotive components, etc. Chemical composition of C15 + E steel is given in Table 1.
Equipment, tests, and standards—depending on the type of test being performed, appropriate equipment is used. Since uniaxial tests and impact tests were conducted, the following equipment was used. In uniaxial tests dealing with determination of mechanical properties at room temperature (ASTM: E8M-16a standard, 2015) and high temperatures (ASTM: E21-17e1 standard, 2015), i.e., by showing engineering stress–strain diagrams and creep testing (ASTM: E139-11 standard, 2018), i.e., determination of creep curves, Zwick/Roell (Ulm, Germany) materials testing machine of 400 kN was used. The strain measurement at room temperature was performed by macroextensometer (Zwick/Roell, Ulm, Germany), while at high temperatures, strain measurement was performed by high-temperature extensometer (Maytec, Singen, Germany). However, all of ASTM standards can also be found in Annual Book of ASTM Standards (2015) [23]. In uniaxial fatigue testing, performed according ISO 12107 (2012) standard [24], Servopulser (Shimadzu) was used. Charpy impact machine (Zwick/Roell, Ulm, Germany) was used in impact energy determination tests. The equipment used in this study is visible in Figure 1.
Specimens and standards—different types of specimens regarding the shapes and dimensions were used depending on the test performed. In uniaxial tests dealing with mechanical properties, determination (engineering stress–strain diagrams) at room and high temperatures as well as at creep testing, specimens were manufactured in accordance with ASTM: E8M-16a standard (2015). Specimens used in Charpy impact testing were manufactured according to ASTM E23-18 standard (2015). The specimens used in fatigue testing were prepared according to ISO 12107 (2012) standard. Test specimens used in the research are visible in Figure 2.

3. Research Results

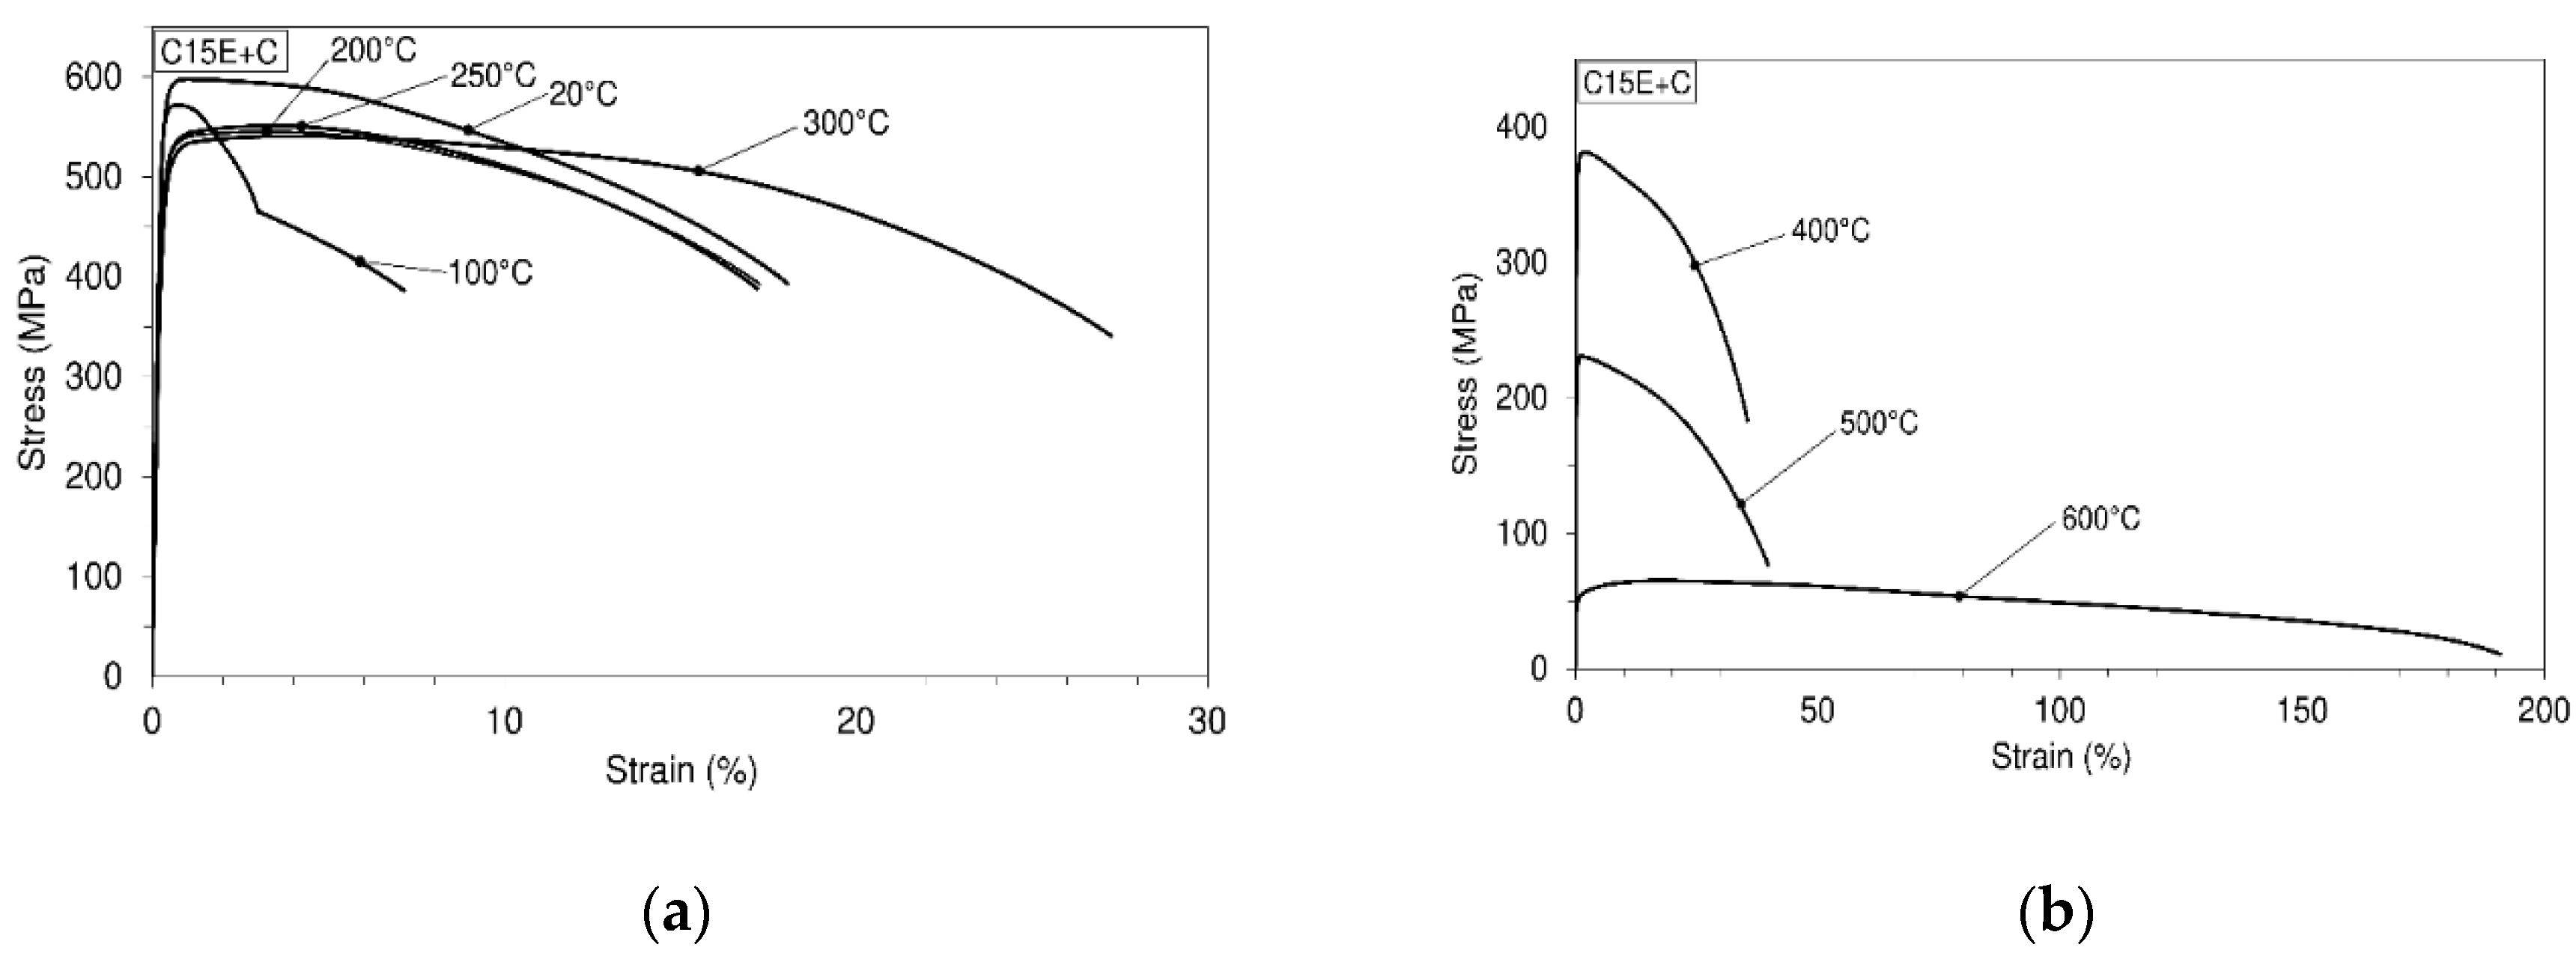
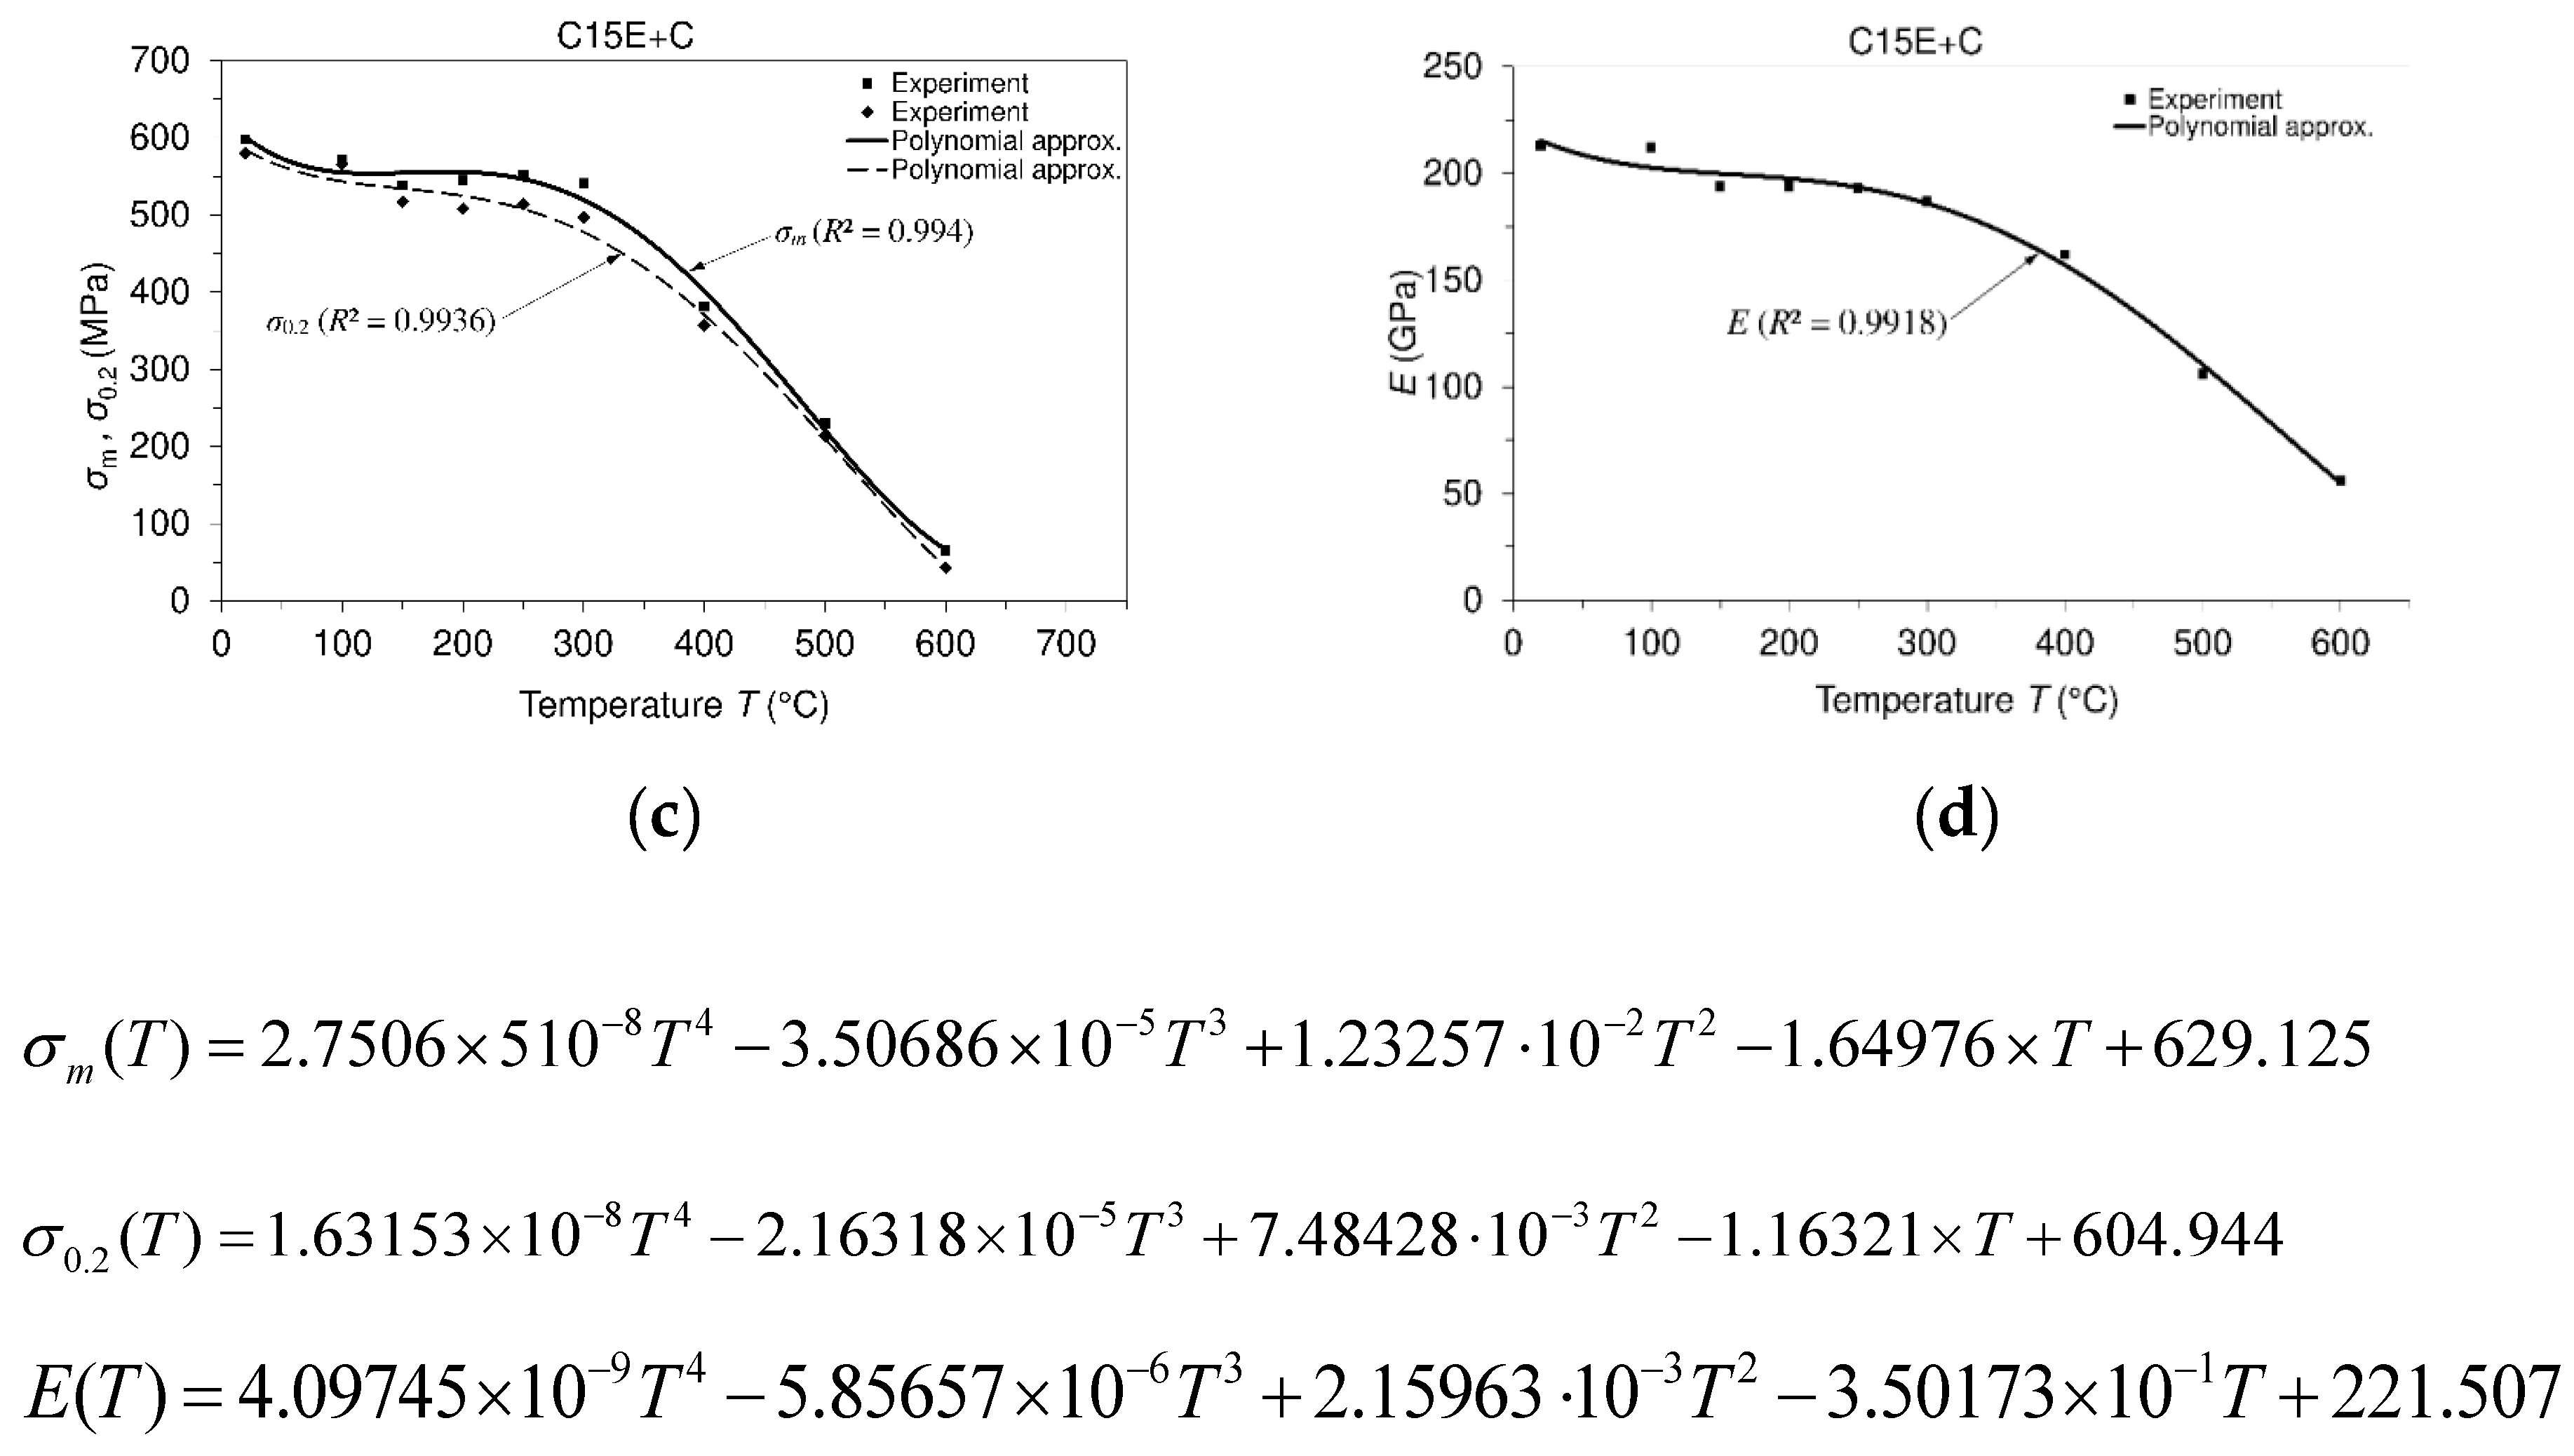
3.1. Mechanical Behavior of Material at Different Temperatures

Usually, it is the case with metallic materials, they change the shape of their engineering stress–strain diagrams depending on temperature. Based on the tests performed, it can be seen that the ultimate tensile strength and the yield strength of this steel at room temperature ((598/580) MPa) are appropriate for its industrial applications. Both of these mechanical properties decrease after room temperature to the temperature of 250 °C at which they reach a new relative maximum (551 MPa/514 MPa), Figure 3c. After the temperature of 250 °C, the mentioned properties decrease. Several tests were performed for each test temperature but obtained curves differ insignificantly. Figure 3a,b shows engineering stress–strain diagrams and temperature dependence of mechanical properties relating to the first test at each temperature. Modern engineering design requires the best choice of materials whose response will be most suitable to the set working conditions of the structure. In Figure 3c,d, relating to mechanical properties, experimentally obtained values are presented by discrete points while using polynomial approximations are represented continuous changes of these properties. These polynomial approximations (curves) representing continuous changes of the properties replace the real (experimental) data with a certain accuracy. As a measure of accordance of simulated and real (measured) values, a coefficient of determination ( R 2 ) is established giving information how fit a model is [25]. Some interesting researches regarding mechanical properties of different materials can be found in literature, such as those presented in References [26,27].

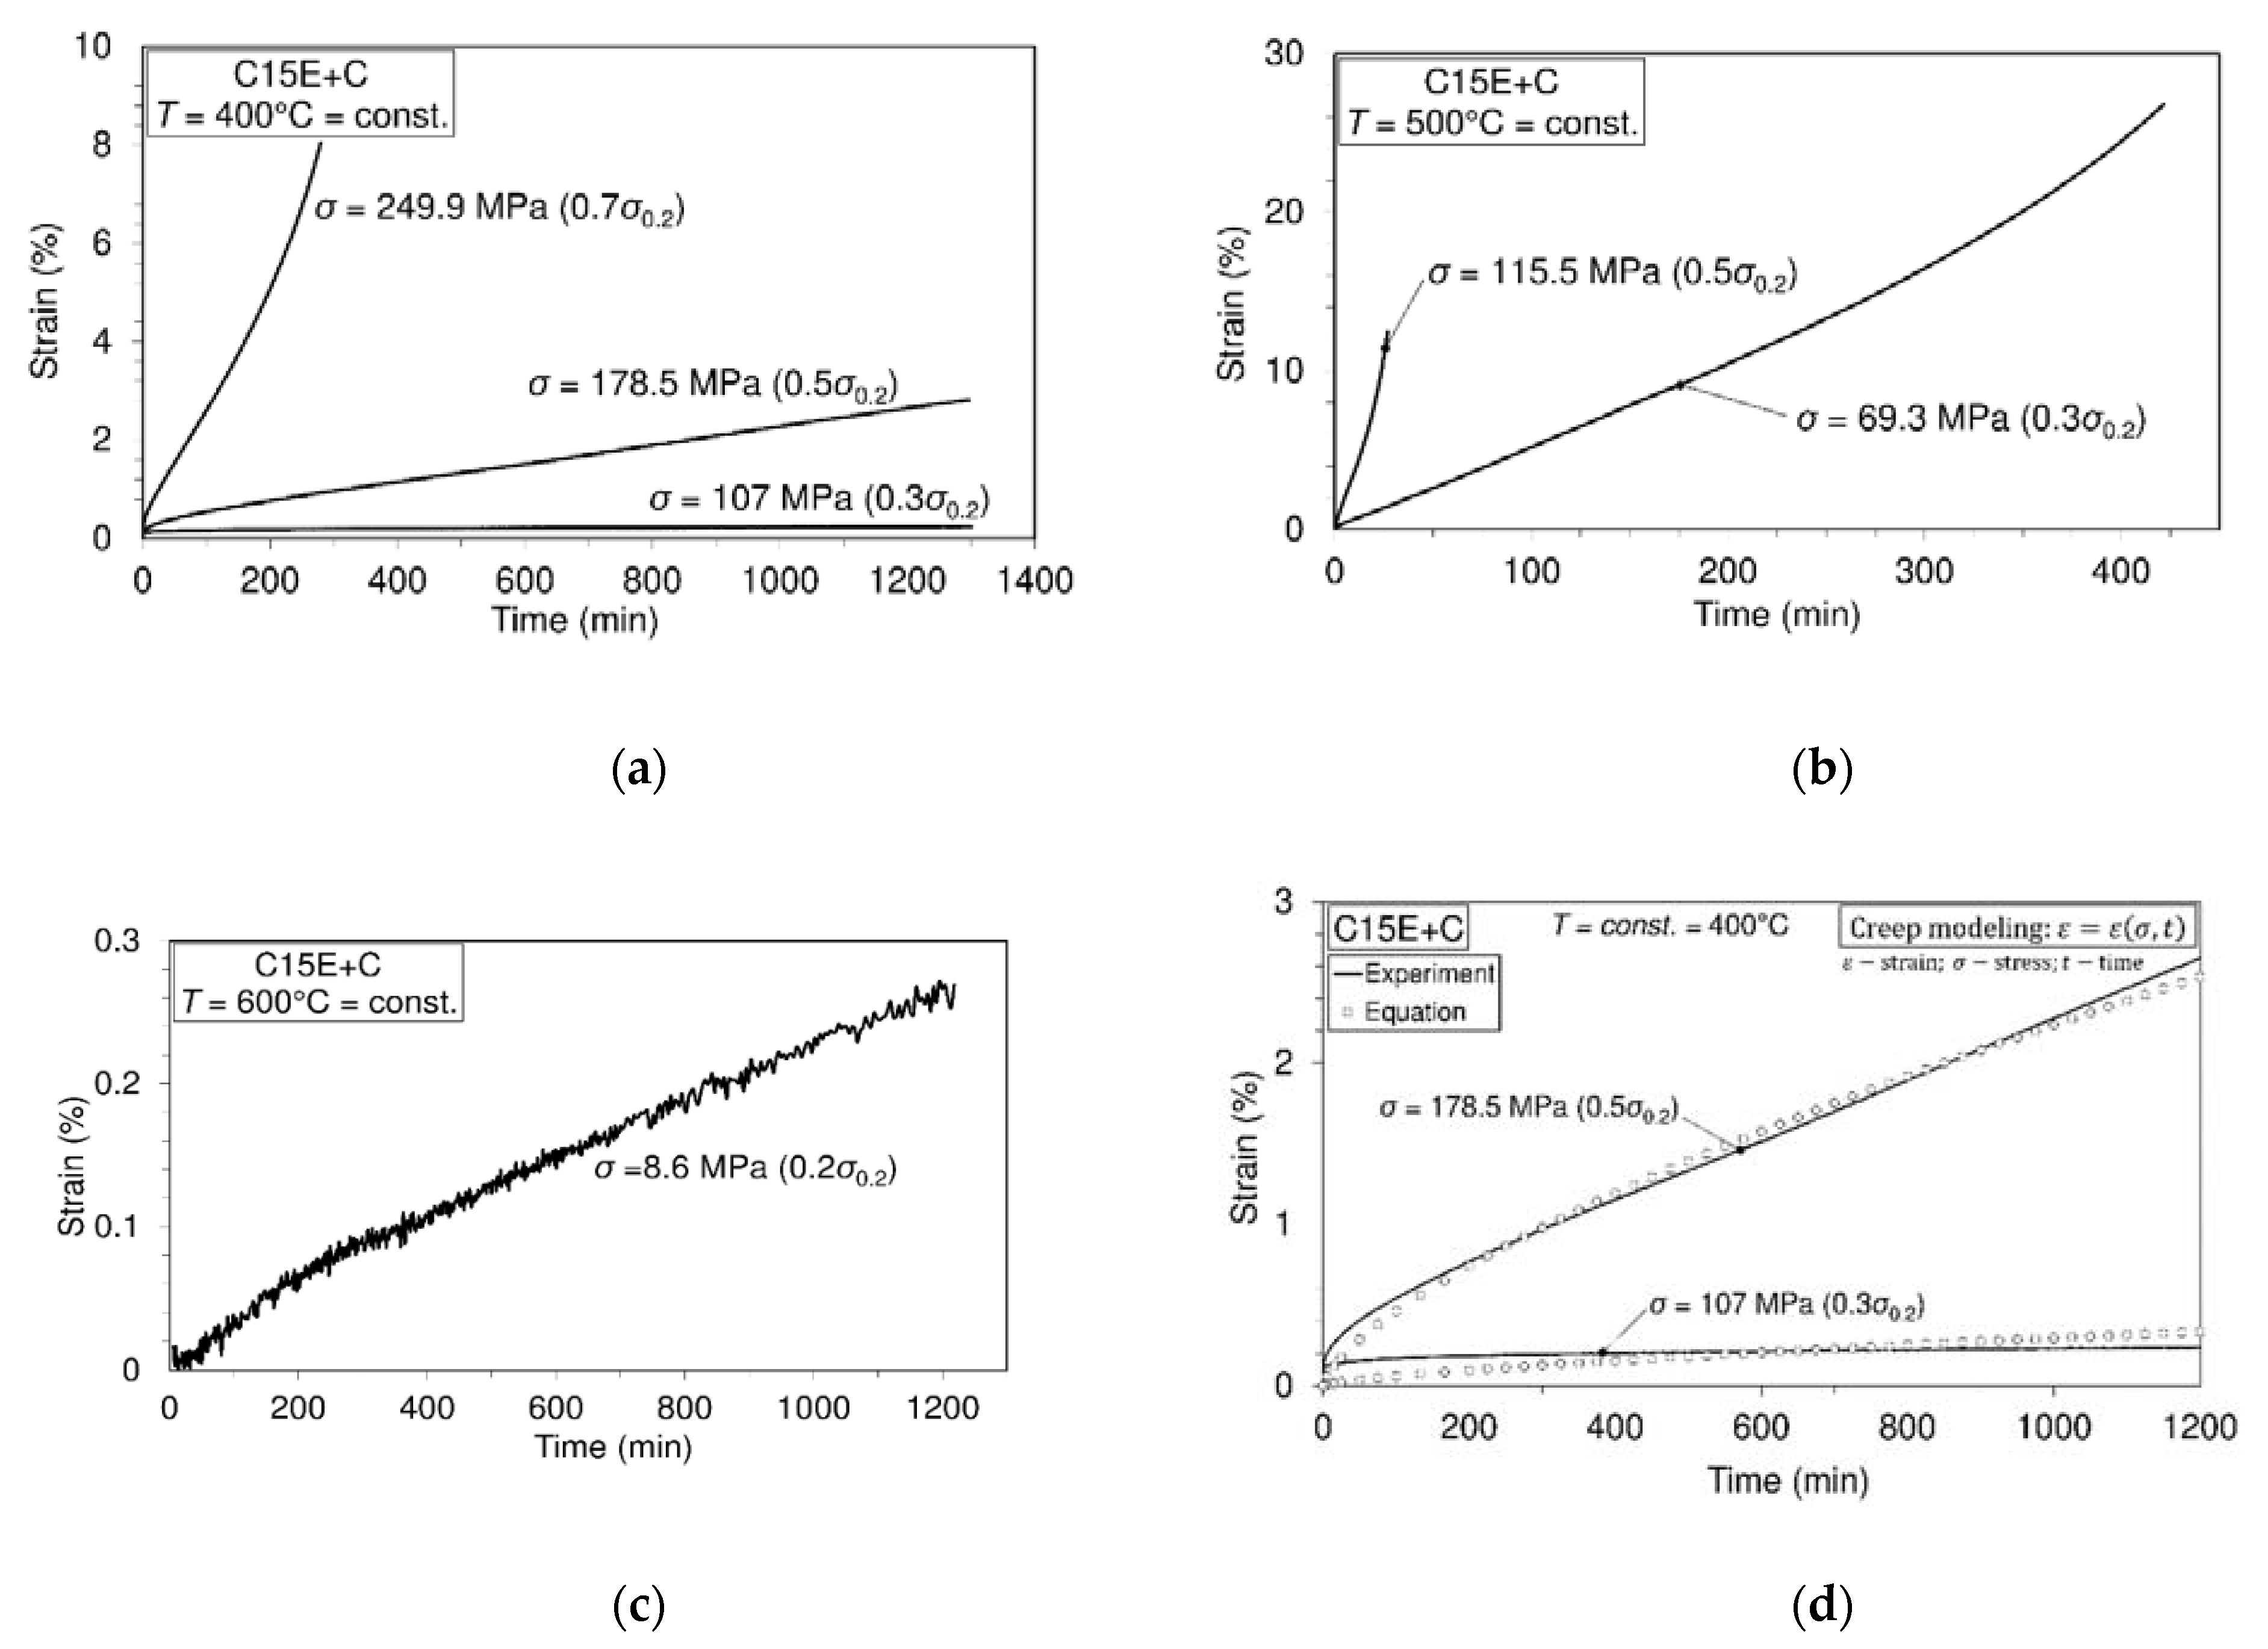
3.2. Short-Time Creep Tests and Creep Simulation

Creep failure (damage and rupture), which is commonly observed mechanical failure in engineering practice, represents one of the life-limiting factors for engineering components operating at high temperatures. Previously, some information has been mentioned regarding the behavior of the materials at creep and the importance of selecting of the materials for use at high temperatures in engineering practice. Creep resistance of a particular material that is used in design of engineering components operating at high temperatures, usually is determined experimentally. In these investigations, creep tests were conducted as short-time tests. Based on performed creep tests, it may be concluded that this material does not exhibit resistance to creep significantly, and in this sense, it is not used in industrial applications where creep at high temperature may be as dominant load. As seen from the experiment performed, at temperature of 400 °C and applied stress, which is lower than 50% of yield strength at considered temperature, this material may be treated as creep resistant. In the regimes of higher temperatures, only very low applied stress can be allowed. However, in a relatively short time and at both lower temperatures and lower stress levels, this material can withstand shorter time in the cases such as hazard, event of fire, sudden heating of structural element, etc. In any case, the deformation achieved during creep can be an obstacle to the further functioning of the element. Experimental inquiries into material resistance to creep represent quite sensitive and expensive processes, primarily because of the large number of trials and expensive equipment required. In order to avoid the problems with the procurement of materials, the manufacturing of test specimens, the use of expensive equipment, etc., in the cases when for already considered material, the new request is made regarding to its creep behavior, the new approach can be applied. Namely, in such situation, based on already known data about the behavior of material at creep, the new request regarding the particular behavior at creep can be solved using computer prediction (simulation and modeling) of creep behavior [5,28]. In the first of recently mentioned references, two of rheological models (Burgers model and Standard Linear Solid model/SLS) are mentioned as well as three possible analytical solutions of creep modeling are presented, while in second one, another creep modeling approach is shown. It is termed as additive creep rate model and serves to predict creep strain-time behavior of materials important to engineering creep design of components. In the mentioned analytical solutions, strain can be monitored depending on three parameters, i.e., time, stress, and temperature. Depending on how many parameters are selected as constant values, the following cases (expressions) can be distinguished: ε = ε ( t ) ,   σ = c o n s t . ,   T = c o n s t .   ; ε = ε ( t ,   σ ) ,   T = c o n s t .   ; ε = ε ( t ,   σ ,   T ) . In Figure 4a–c, some of creep processes (tests) are presented, while in Figure 4d, creep modeling (modeled creep curve) is displayed using analytical Formula (1) [5]:
ε ( t ) = D T σ p t r
The symbols in the above expressions, as well as those in the analytical Formula (1), have the meaning: ε strain, σ—stress, T—temperature, t—time, and D, p, and r—parameters. Data related to creep modelling are given in Table 2. Modeling was performed in accordance with the rule: ε = ε   ( t , σ )   and   T = c o n s t .

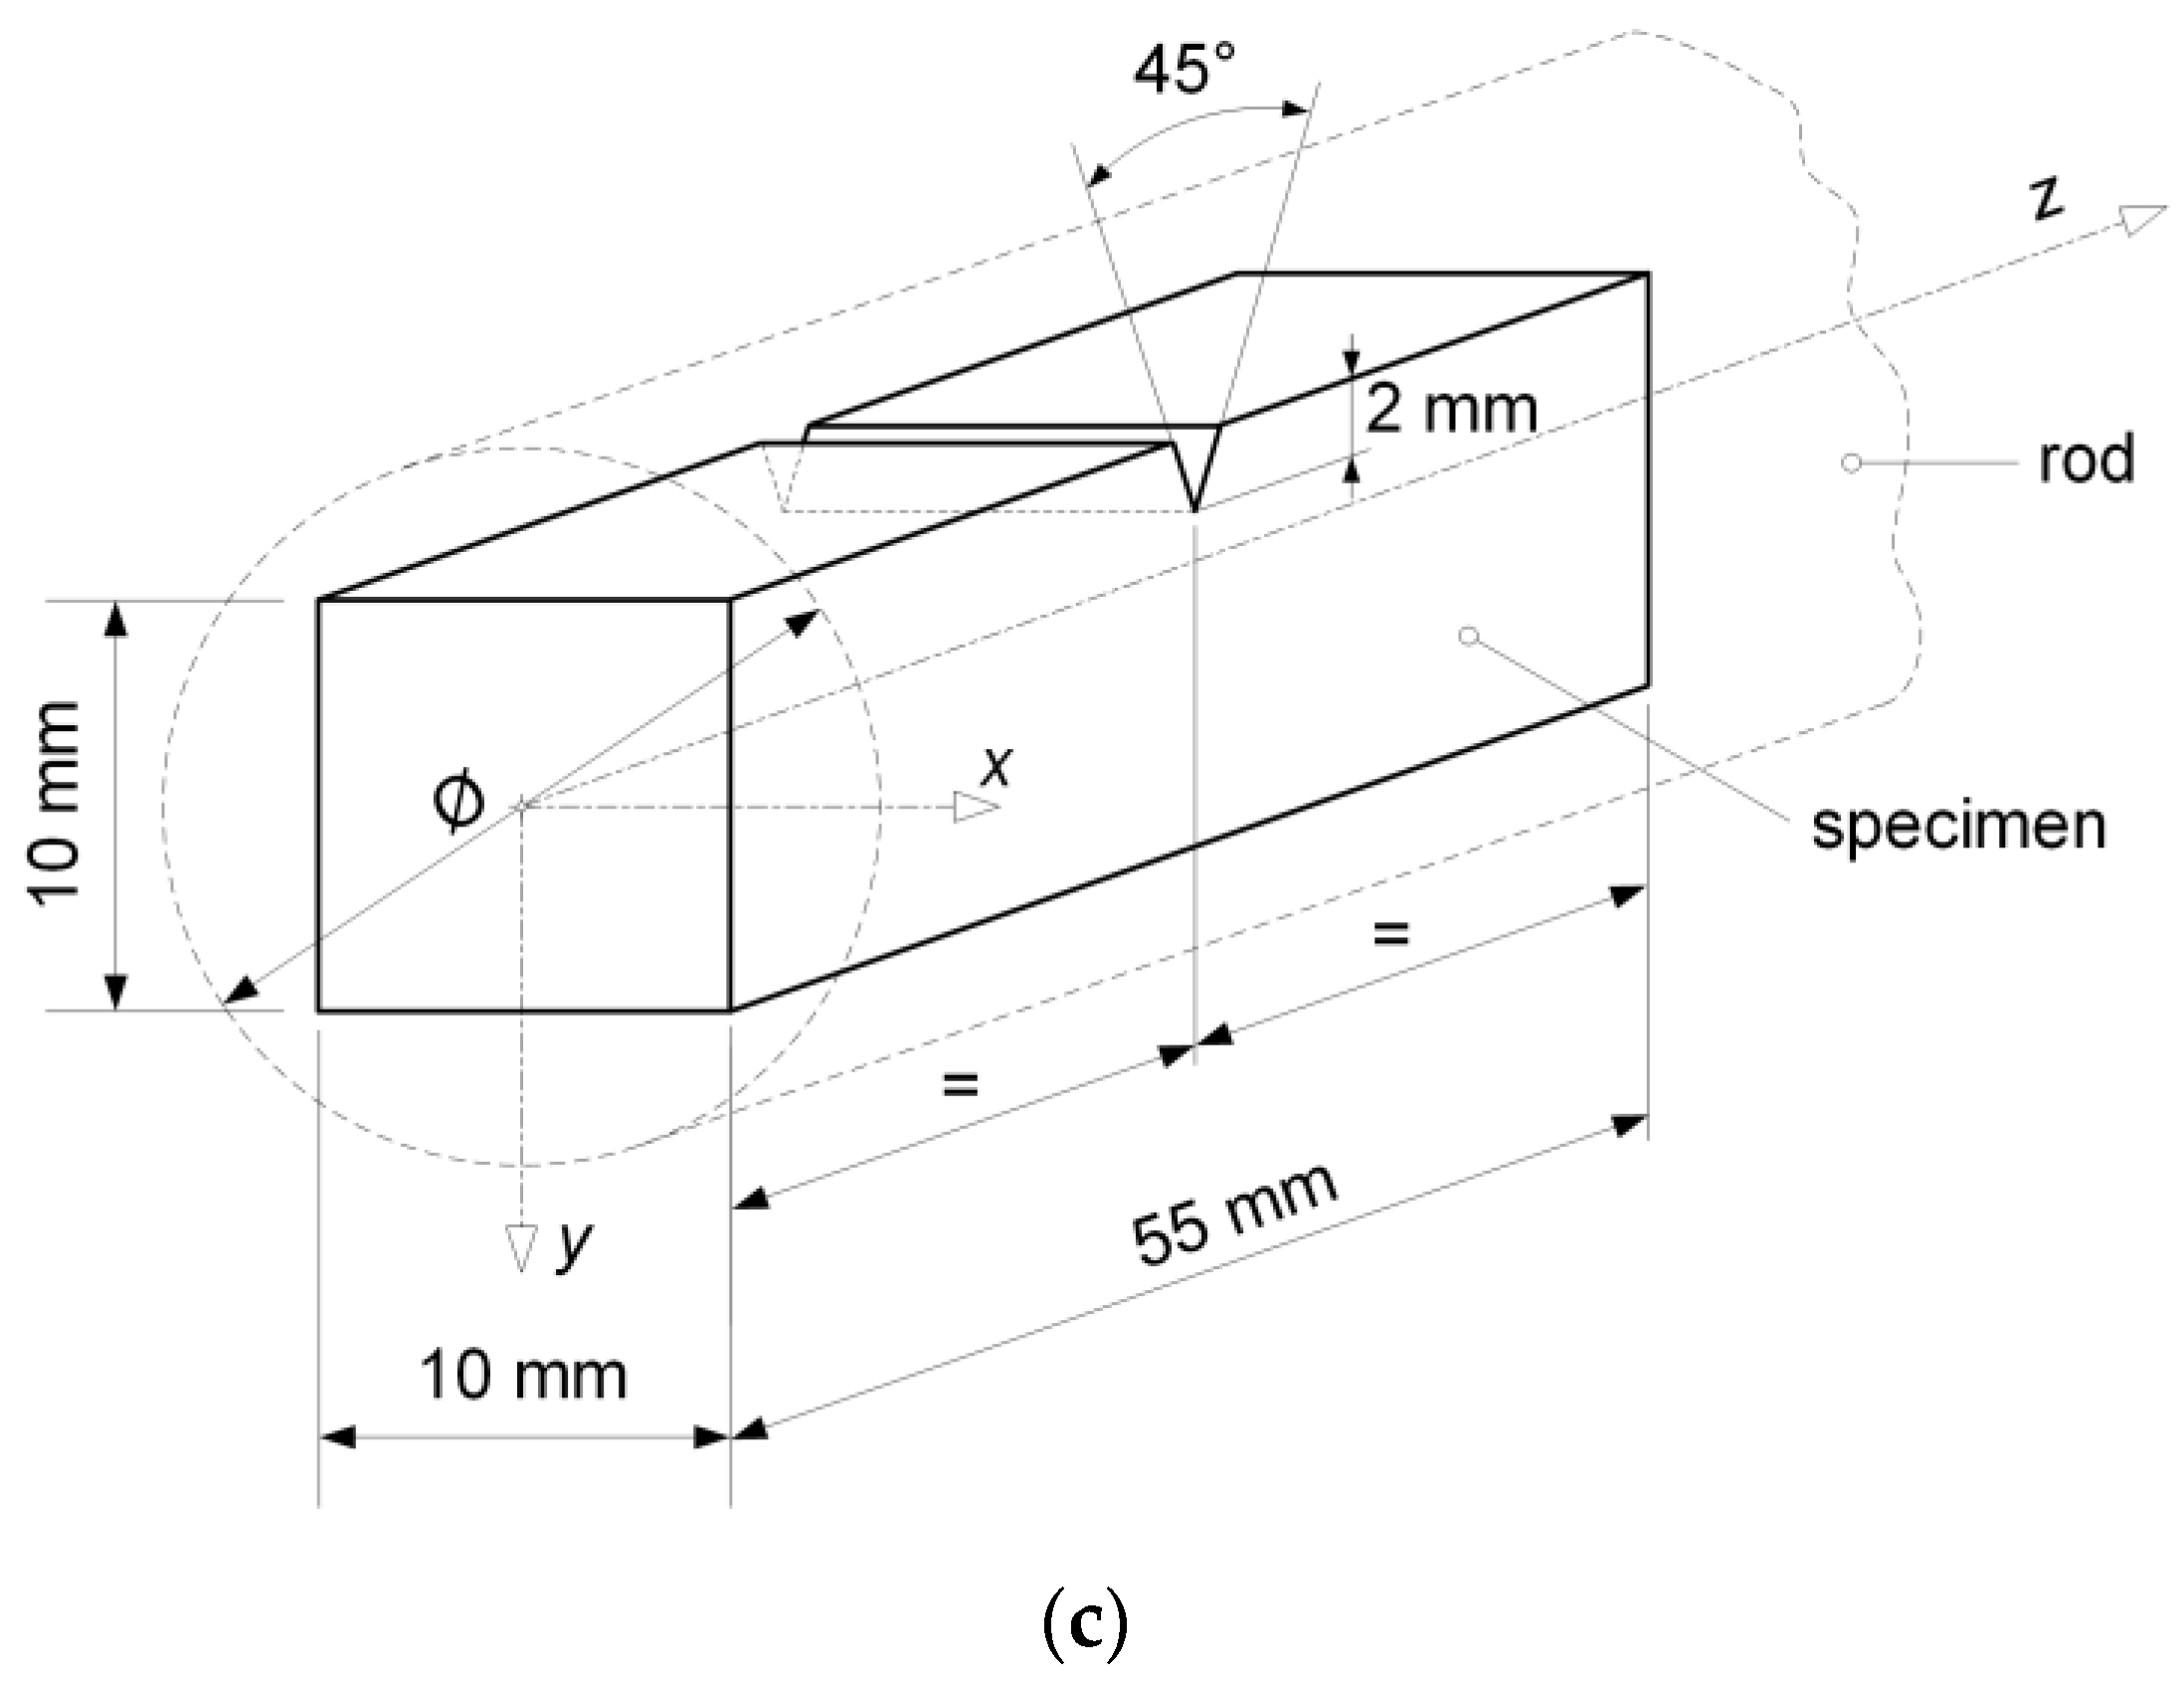
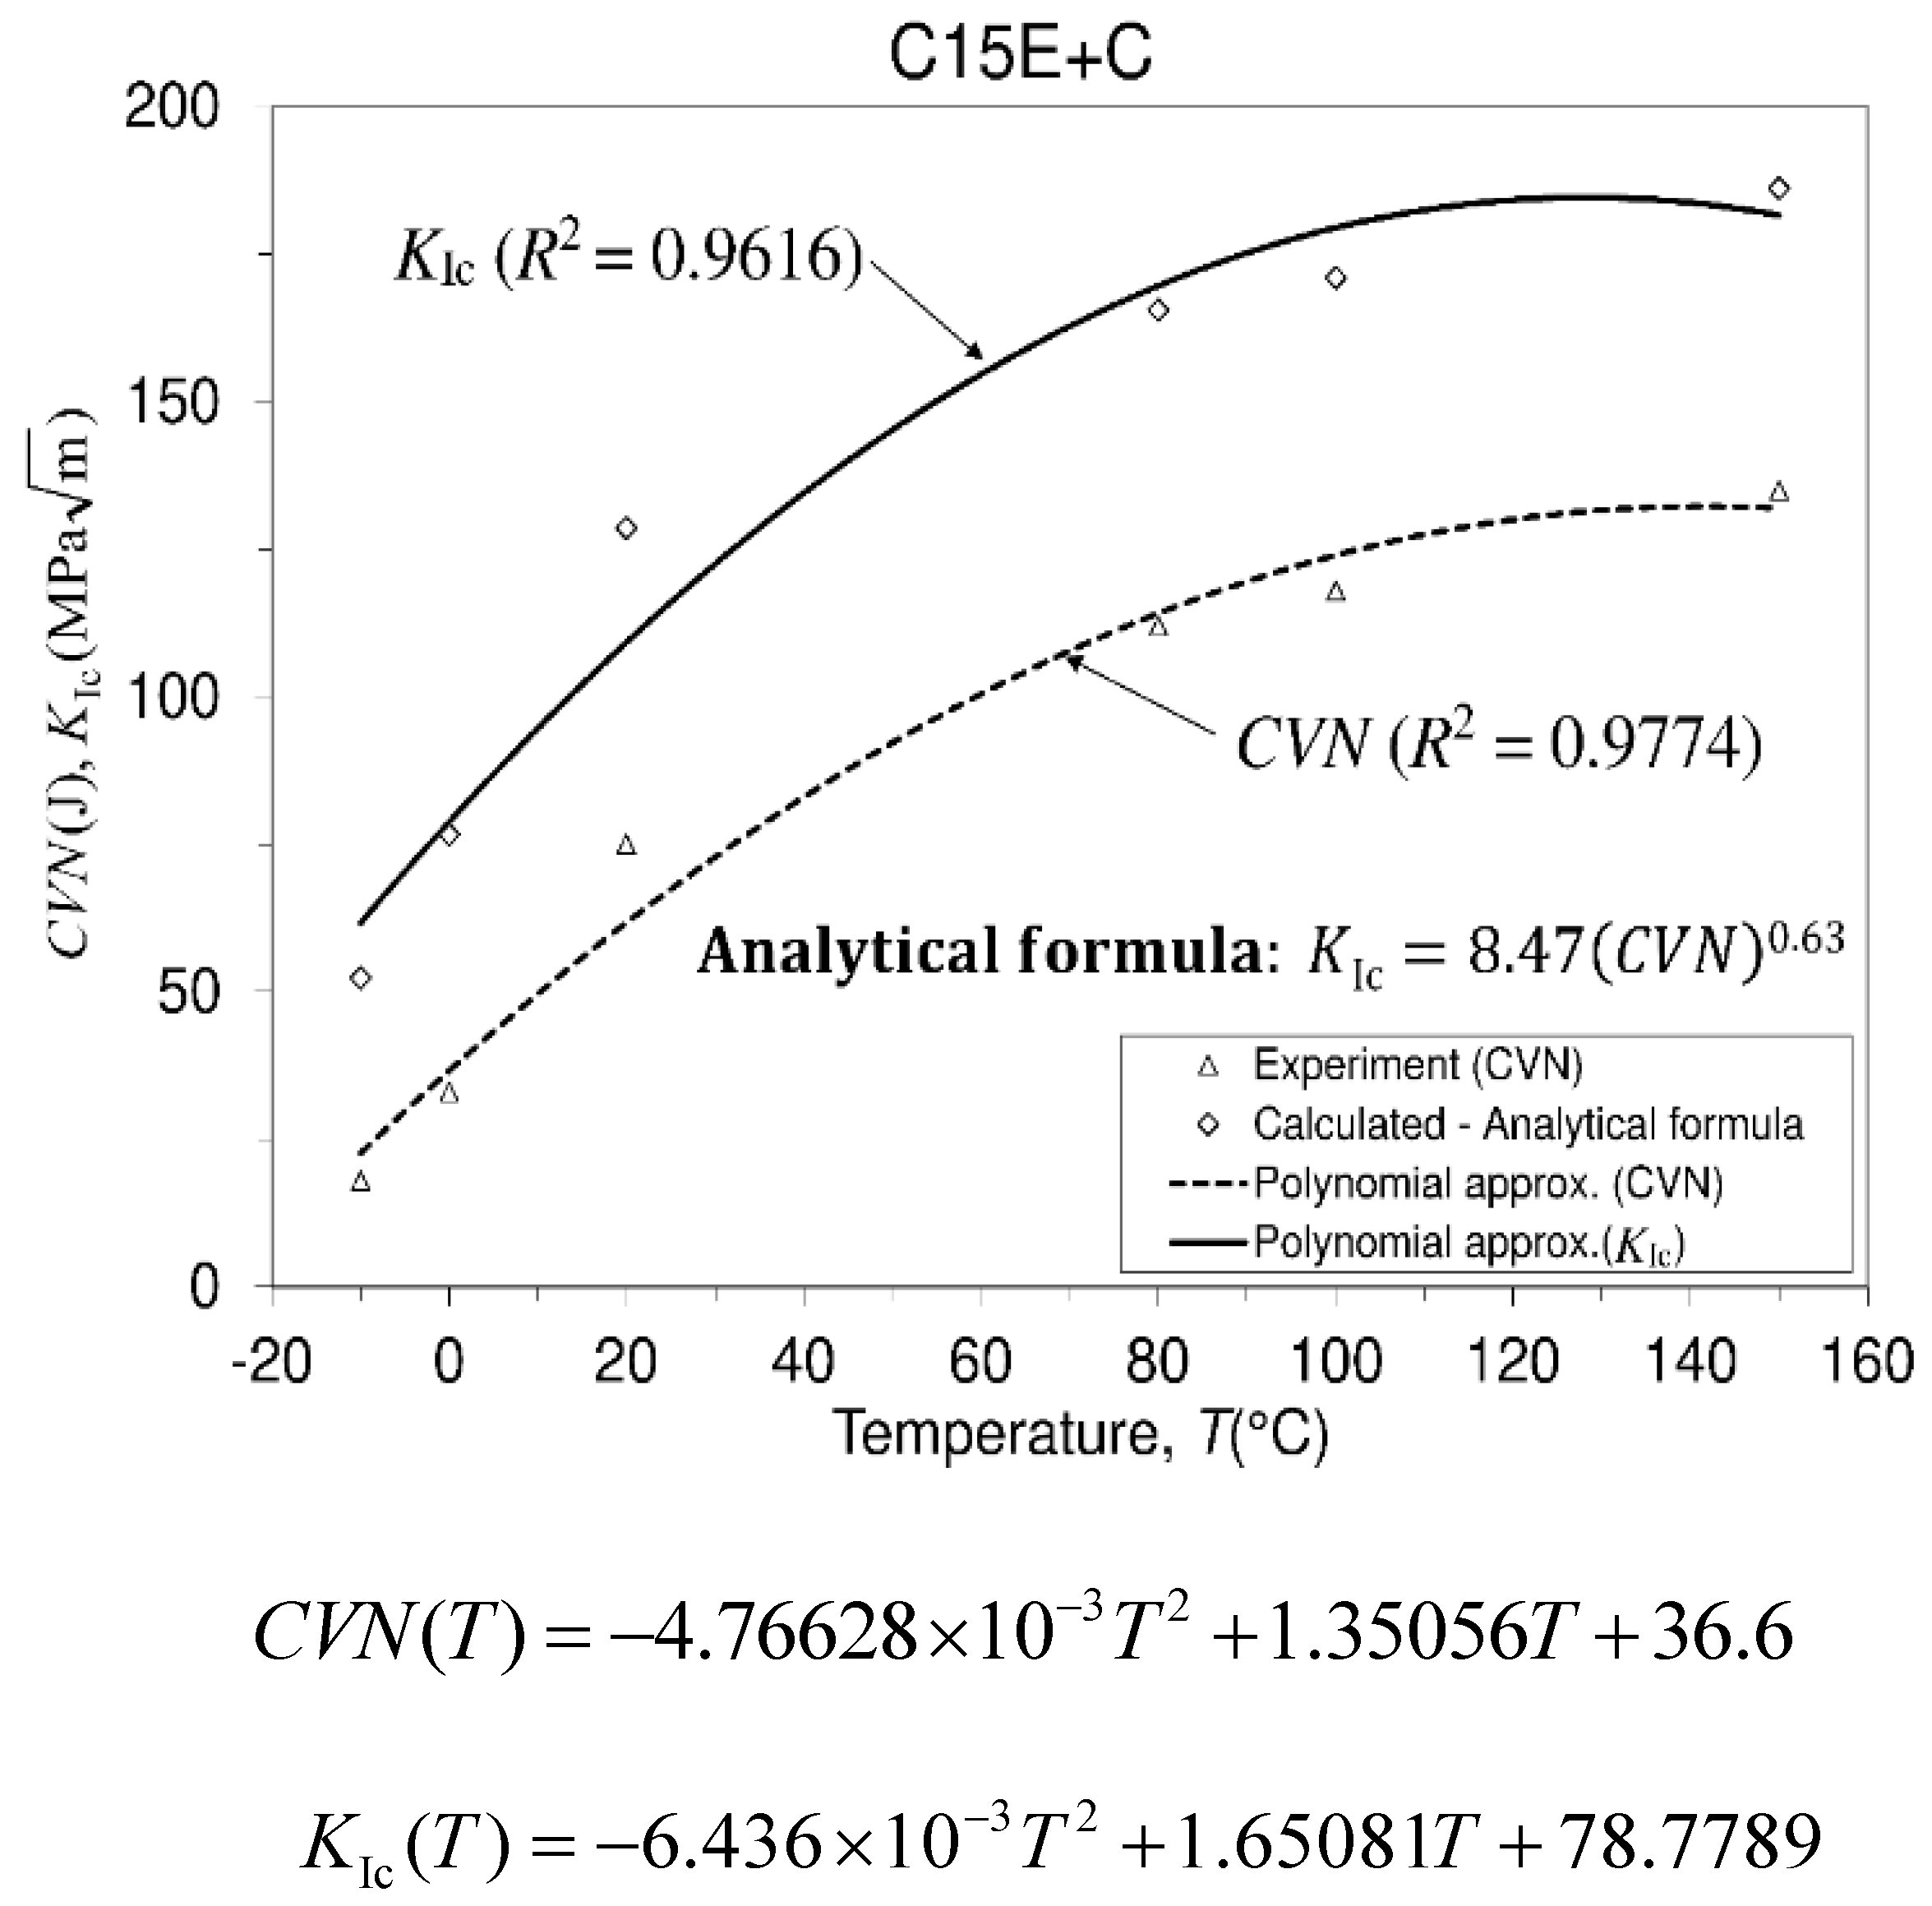
3.3. Testing the Energy of Impact Fracture of a Material and Fracture Toughness Assessment

As previously said, modern optimal engineering design is based on some parameters such as an appropriate material selection, numerical stress analysis, deformation, and lifetime assessment of the structure. Since these parameters need to be included in design procedure of the structure, it follows that two of the most important criteria in design, such as plasticity and rupture, become defined by two of the most important material properties such as yield strength (often referred to as: σ 0.2 = σ y = Y s ) and fracture toughness ( K I c ). Yield strength, as material property, defines material resistance against its plastic deformation, while fracture toughness (critical value of stress intensity factor /SIF) defines material resistance against crack propagation. On the other hand, fracture toughness can be defined as a property describing the ability of a material containing a crack to resist fracture. However, fracture toughness as a material property usually is experimentally determined, and in the case when around the crack tip plastic zone is considered very small, i.e., as long as the small-scale yielding assumption is valid. In this case, under consideration is the application of linear elastic fracture mechanics (LEFM). In the case of the analysis of crack propagation in the field of nonlinear material behavior, i.e., in the analysis of crack beyond the limits of linear fracture mechanics, that is, in elastic–plastic material behavior when around the crack tip greater plasticity is involved, then application of J-integral can be considered. In this case, under consideration is the application of elastic–plastic fracture mechanics (EPFM). The same types of specimens in experimental investigations of fracture toughness parameter may be used in both cases of testing K I c and J I c as critical value of J . Linear elastic fracture mechanics has been widely used in analysis of cracked structure [29]. To avoid problems with material procurement and test specimens manufacturing technology, an approximate but sufficiently correct method is available. Under consideration is testing the energy of impact fracture of a material, which is a measure of material toughness, and can be performed using Charpy’s impact machine (pendulum). This testing is known as the Charpy impact test (the Charpy V-notch test), and it is a high strain-rate test. On the basis of the experimentally determined impact fracture energy, using this device, the level of the fracture toughness of a material can be estimated/calculated, using the Roberts-Newton formula [30]:
K Ic = 8.47 ( C V N ) 0.63
In Equation (2), CVN is Charpy V-notch energy of impact fracture measured in Joules. The obtained result using this formula, representing fracture toughness, is temperature independent. Both, measured Charpy V-notch impact energy results as well as calculated fracture toughness results are displayed in Figure 5. The level of the Charpy V-notch impact fracture energy of this steel (known as engineering steel) is approximately three times less than that of structural steel 20MnCr5 at room temperature [31].

3.4. Uniaxial Fully Reversed Mechanical Fatigue of the Material

3.4.1. Different Types of Material Fatigue

Many studies are dedicated to the fracture behavior of engineering components subjected to monotonically increasing load. On the other hand, many structural and machine components that operate under fluctuating (repeated, cyclic) load, experience fracture, albeit the stress level of this load is much lower than the fracture stress corresponding to a monotonic tensile load. The mentioned engineering components, or let to say structures, such as aircraft, bridges, pumps, ships, offshore structures, etc., are operating under fluctuating (cyclic and repeated) stress/load. Consequently, these structures are subjected to process of cumulative damage known as fatigue, which is one of the common mechanical failure modes, and, as a phenomenon, it means “to tire” [32]. There are several forms of fatigue failures such as mechanical fatigue (considered in this study) caused by fluctuations in externally applied stress, then creep fatigue, caused by cyclic load accompanied with high temperature, corrosion fatigue, when repeated load is acting in chemically aggressive environment, [33], etc. The main task of experimental testing of material behavior during fatigue process is to determine the fatigue limit (endurance limit and dynamic strength) of the material at the prescribed number of fatigue cycles at which the observed element remains unfailed (unbroken). In engineering practice, usually 10 million cycles have been accepted for metallic materials as the number of cycles at which the element should remain unfailed (unbroken). This is also adopted in this investigation. This is considered that specimen after 10 million cycles has an infinite lifespan (lifetime). This assumption is convenient (economical) but not rigorous one. However, the intention is to shorten the time consumed for testing. Dimensions of the considered engineering element should be determined based on the experimentally obtained fatigue limit. In engineering practice, cyclic loading of the structures is almost random in nature varying in magnitude during their service life.

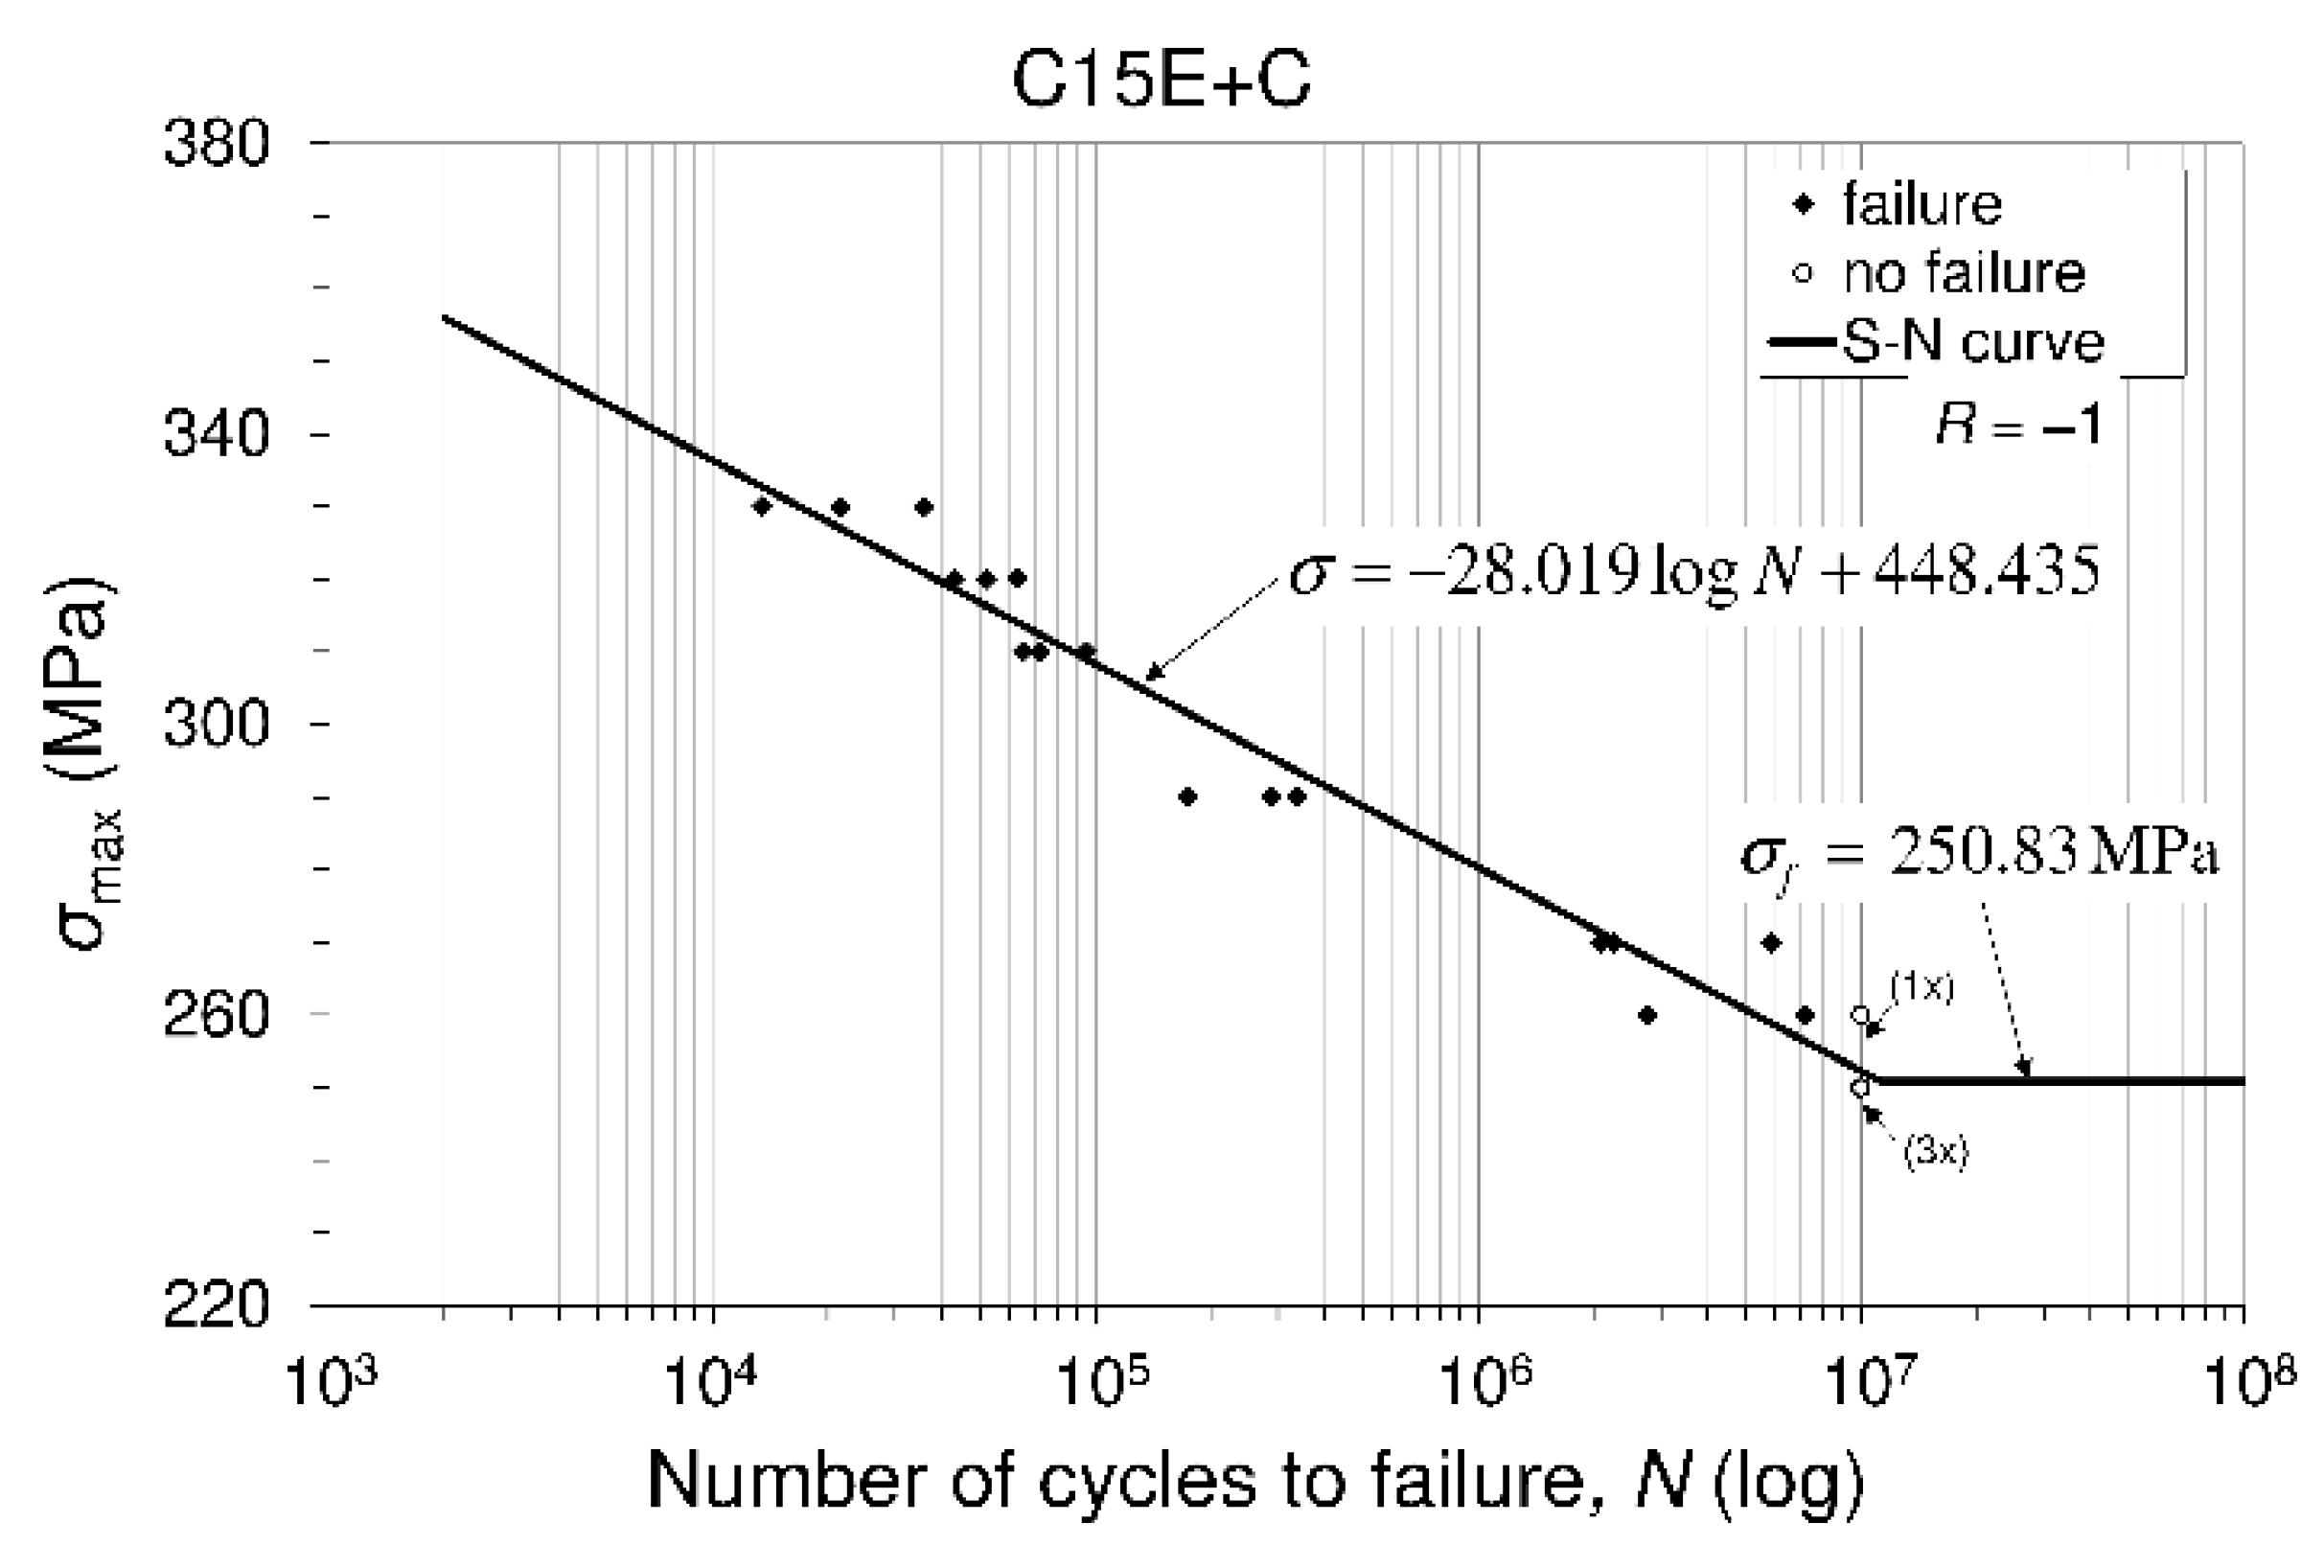
3.4.2. Fatigue-Life (S-N) Diagram Based on Fully Reversed Mechanical Fatigue Tests

In this investigation, instead of random loading, smooth unnotched specimens manufactured of C15E + C steel were subjected to sinusoidal cyclic loading (sinusoidal shape stress cycle possessing constant amplitude) under stress-controlled conditions. Such type of loading usually occurs in machine elements such as shafts, rods, etc., during steady-state rotation. In this sense, uniaxial fully reversed mechanical fatigue tests of the material, as sinusoidal cyclic loading form, performed at room temperature and at stress ratio of   R = 1 . Fatigue tests performed, in this case, belong to high-cycle fatigue regime with constant amplitude cyclic (fluctuating) loading, and consequently, the mean stress is constant. It is known that the failure mechanism is called high-cycle fatigue when failure in tested material occurs under large number of cycles and stresses and strains belong to the elastic range of the tested material [34]. In contrast, when the imposed stresses are outside the elastic limit and, consequently, the strains are significantly plastic, and the expected number of cycles to failure is small, the failure mechanism is called low-cycle fatigue. In general, it is known that fluctuating (or cyclic) load causes a failure to occur at a stress level that is much lower than fracture stress corresponding to the monotonic tensile stress. This means that static strength of the considered material under repeated (cyclic and fluctuating) load can be significantly reduced. Consequently, dynamically stressed engineering component, i.e., component subjected to repeated load is operating in the fatigue regime and its sizes must be determined using data related to fatigue limit instead of to monotonic tensile yield strength. Accordingly, it is necessary to determine the fatigue limit (endurance limit). The data regarding fatigue limit can be obtained based on fatigue—life (stress—life) diagram (S—N, i.e., σ N ), i.e., having S—N curve covering load spectrum, which is based on cumulative damage theory. Fatigue-life diagram related to fully reversed fatigue tests of the tested C15E + C material is displayed in Figure 6. On its ordinate, maximum applied stress ( σ m a x / MPa ) for particular fatigue test is displayed, while, for the same test, on the abscissa, the corresponding number of the cycles to failure (N) is displayed. Fatigue procedures were carried out in accordance with ISO standard, ISO 12107:2012 I (2012), and under decreasing stress regime. Since it is possible that test result regarding the applied stress can differ in the number of the cycles to the failure, for each applied stress level, several specimens were tested to their failures. However, each fatigue test, which includes a combination of the applied stress and the corresponding number of cycles to failure, has been recorded by one point in S—N diagram. Fatigue life and fatigue strength correspond to any point of the S—N diagram where maximum applied stress will cause failure. Fatigue life describes the life of the specimen which has failed by applied stress while fatigue strength describes achieved strength, which is equal to applied stress at that moment. Fatigue strength decreases as the number of cycles increases until the so-called fatigue limit. The point in the diagram, known as the fatigue limit, is reached when an unlimited number of fatigue stress cycles with a defined maximum stress at a prescribed stress ratio, can be applied to the specimen without causing failure. Fatigue limit indicates fatigue strength in previously described point of S—N diagram. Fatigue life in any point of S—N diagram is assessed based on the experimentally obtained data of the total number of the cycles to failure for the similar fatigue cycle shape in stressed structure. When this consideration is applied to the point defining fatigue limit, it characterizes the structure lifetime. The total fatigue life, in each of fatigue process, represents the sum of the crack initiation and crack propagation lives [35]. A comparison of fatigue-life curve in this investigation and that carried out for S550 high-strength steels under low-cycle fatigue at ( 60   ° C ) can be done having an insight in [36]. Since all of details regarding the fatigue tests (fully revised, R = 1 ), material (C15E + C), specimens (smooth unnotched), principle, and character of applying load to the specimens (decreasing applied stress; sinusoidal shape stress cycle), etc., are known, the obtained test data is entered into the coordinate system, and fatigue-life (S—N) diagram was constructed in its first phase, Figure 5. Each point in diagram represents the result of the particular test and this is recorded depending on whether specimen has failed (◆) or has remained unfailed (∘). Now, based on the entered tests data and using the modified staircase method, ISO standard (2012), the fatigue (endurance) limit can be determined. After this is done, the S—N (fatigue—life, stress—life, and Wohler curve) diagram is completed. As can be seen, the S—N diagram that belongs to stress—life model is made up of two areas, i.e., finite fatigue region (finite fatigue life) represented by inclined line, and infinite fatigue region (infinite fatigue life) represented by horizontal line, Figure 6. Procedure relating to the determination of fatigue limit is presented in the following part.

3.4.3. Determination of Fatigue Limit Based on Modified Staircase Method

The procedure used to determine the fatigue (endurance) limit according to the modified staircase method is shown in continuation. In this sense, data related to the failed (◆) and unfailed (○) specimens, which follow from fatigue tests, are given in Table 3. The analysis of data given in Table 3 is presented in Table 4, while constants A, B, C, and D are determined (calculated) and displayed in Table 5.
Fatigue limit ( σ f ) , was calculated according to ISO standard (ISO 12107, 2012), as follows:
σ f ( P ,   1 α ) = μ ¯ y k ( P , 1 α , ) = σ ¯ y .
The mean fatigue strength ( μ ¯ y ) , shown in Equation (3), was calculated as:
μ ¯ y = σ 0 + d ( A C 1 2 ) ,
where σ 0   is the lowest stress level and “d” is the stress step (i.e., the difference between the neighboring stress levels), see Table 4.
In order to determine the fatigue limit ( σ f ), according to Equation (3), two parameters need to be defined beforehand, namely:
  • k ( P , 1 α , ν ) , the coefficient for the one-sided tolerance limit for a normal distribution, and
  • σ ¯ y , the estimated standard deviation of the fatigue strength that can be calculated as:
    σ ¯ y = 1.62 × d ( D + 0.029 ) .
Based on recommendation of mentioned ISO standard, the value ν   = n 1 = 6 , where n is the number of items in a considered group. In addition, if a desired probability is P = 10 % and a confidence level ( 1 α ) = 90%, according to table B1 in ISO standard (2012), it is   k ( P , 1 α , ν )   = k ( 0.1 ; 0.9 ; 6 ) =   2.333 . Finally, according to Equation (4), it is:
  • for R = 1 μ ¯ y = σ 0 + d ( A C 1 2 ) = 250 + 10 (8/5 − 1/2) = 261 MPa,
    or, this can be obtained as (Table 3):
    for R = 1 μ ¯ y = (250 + 260 + 270 + 260 + 270 + 260 + 270)/7 = 262.86 MPa, whose amount is similar to previously obtained ones.
Now, in accordance with Equation (5), it is:
  • for R = 1 σ ¯ y = 1.62 × d ( D + 0.029 ) = 1.62 × 10 (0.24 + 0.029) = 4.36 MPa.
Finally, fatigue limit is Equation (3):
  • for R = 1 σ f ( 0.1 ; 0.9 ; 6 ) = μ ¯ y k ( P , 1 α , ν ) × σ ¯ y = 261 –2.333 × 4.36 = 250.83 MPa.
Calculated value of the fatigue limit, based on the fatigue testing at stress ratio of R = 1 , indicates that its value is 42% (= 250.83/598) compared with the ultimate monotonic tensile strength.
As it is visible, the fatigue tests performed in this investigation were based on the uniaxial fatigue tests, although in the literature can be found fatigue testing relating to multiaxial fatigue [37]. However, the available material fatigue testing equipment in this case does not allow the application of multiaxis fatigue testing.

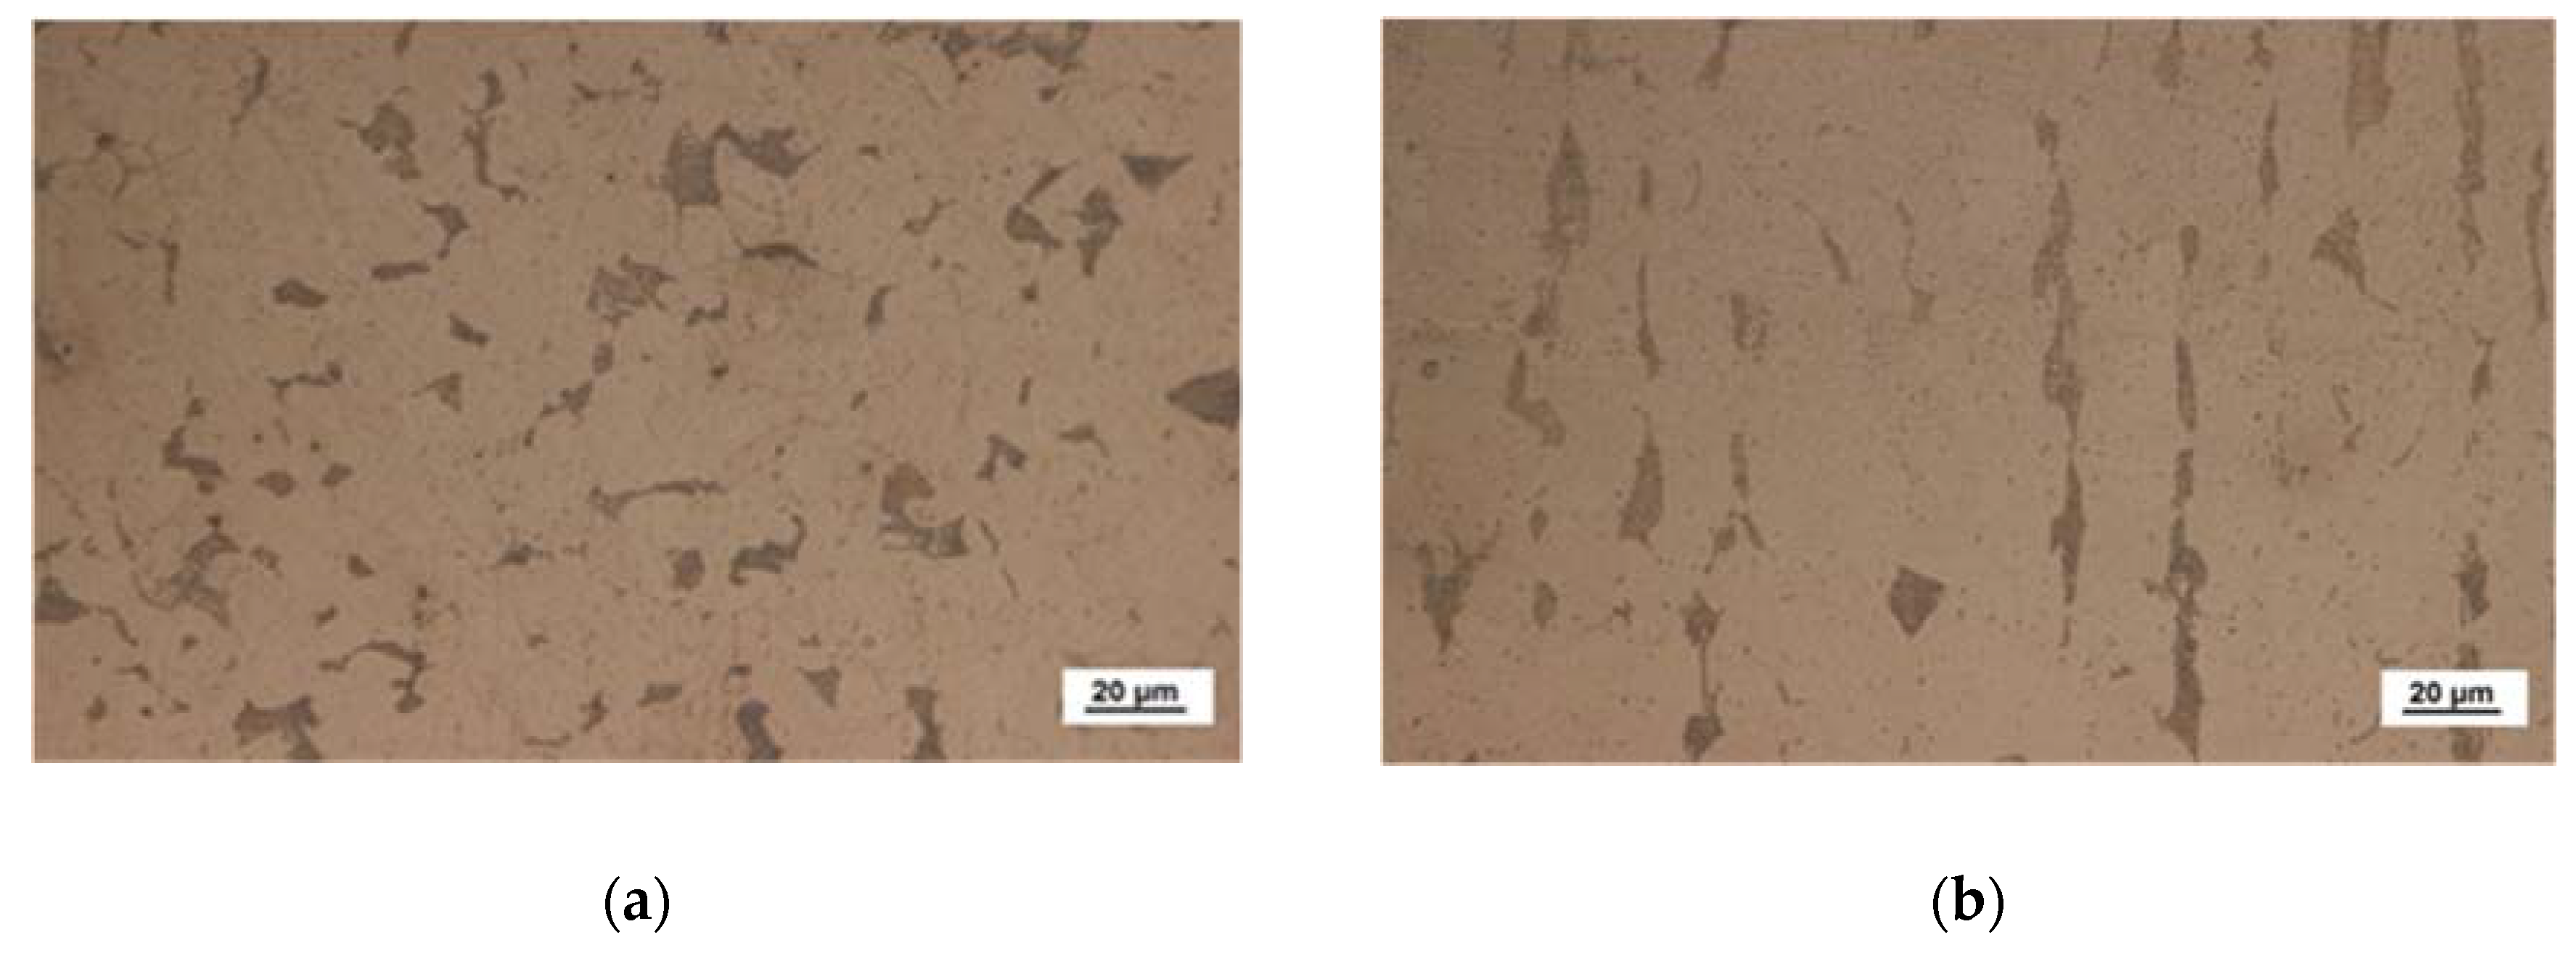
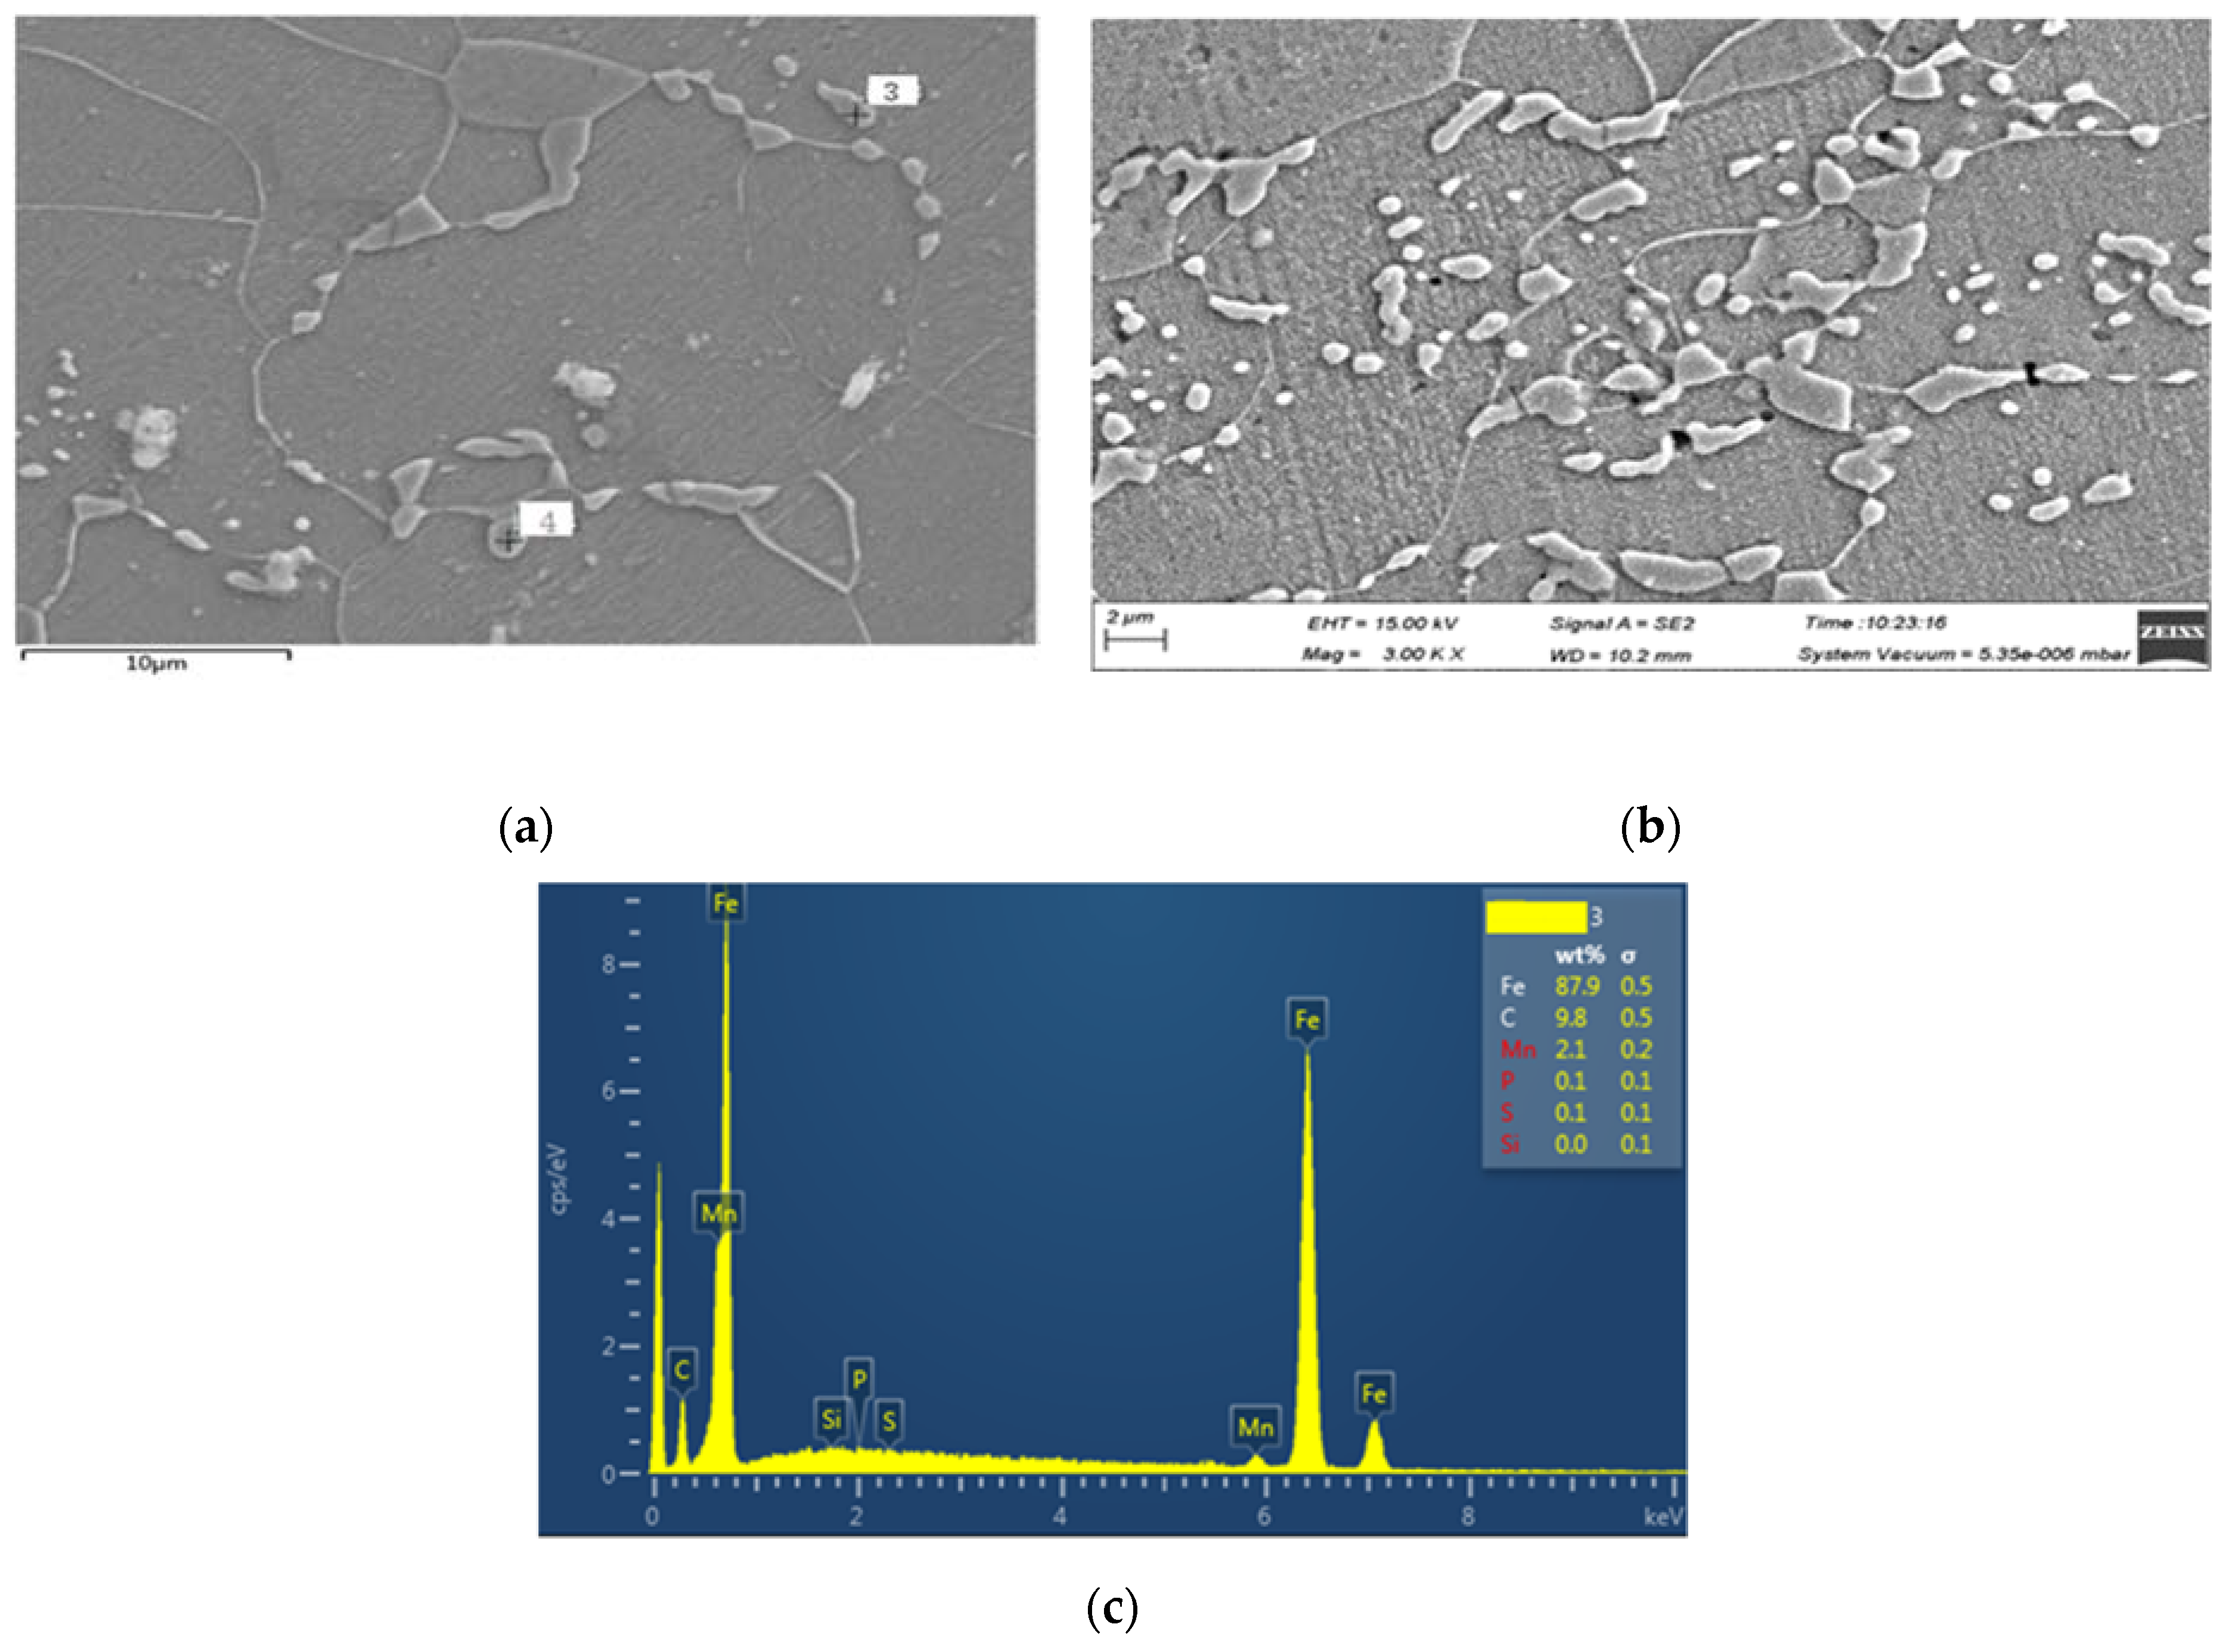
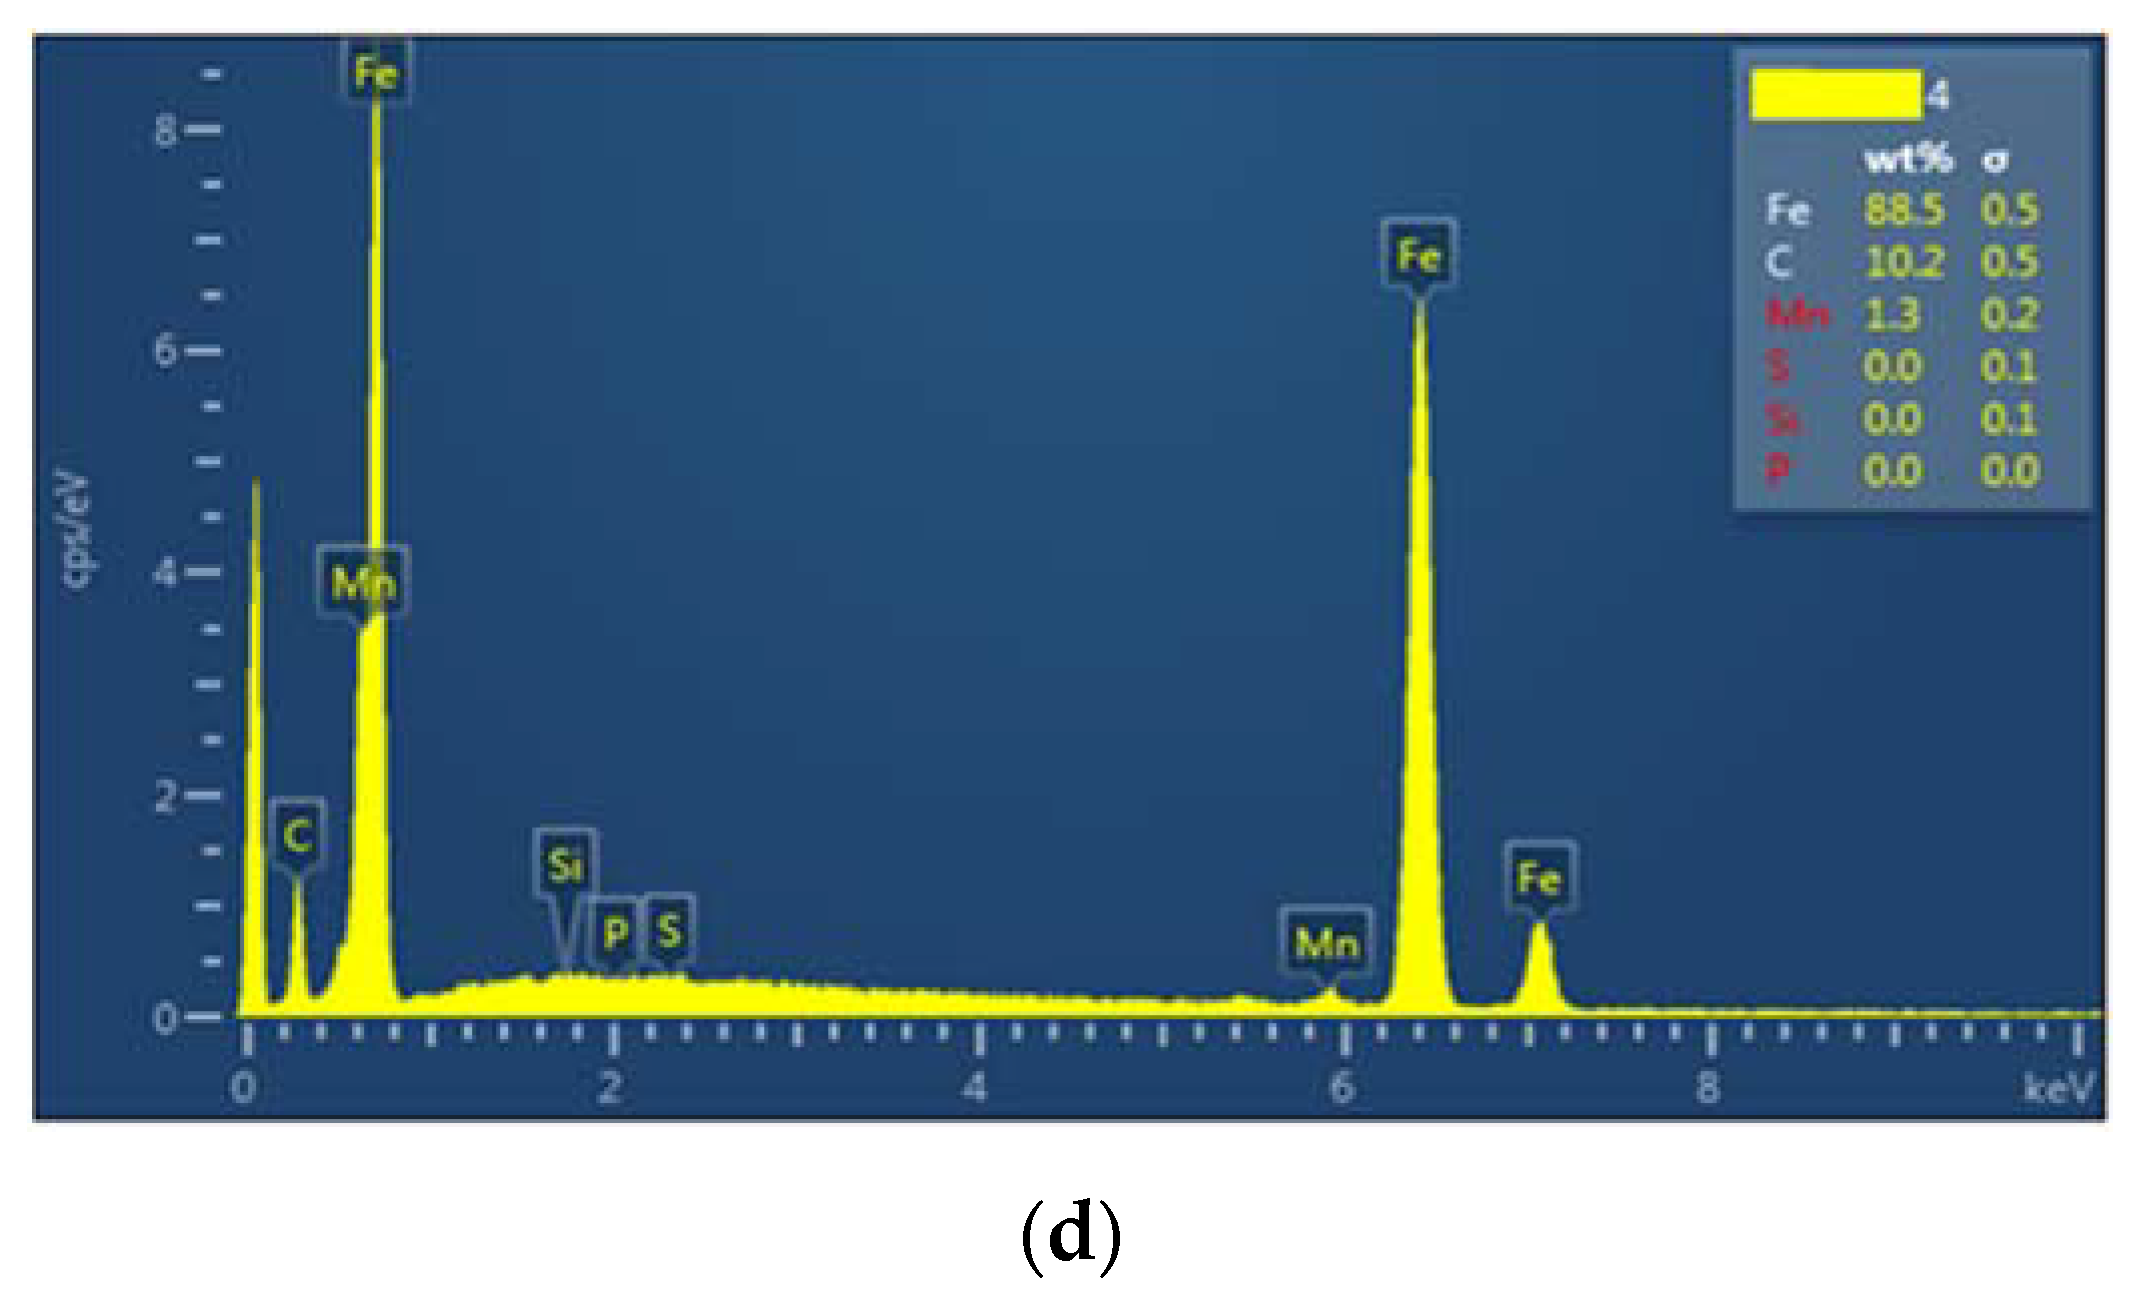
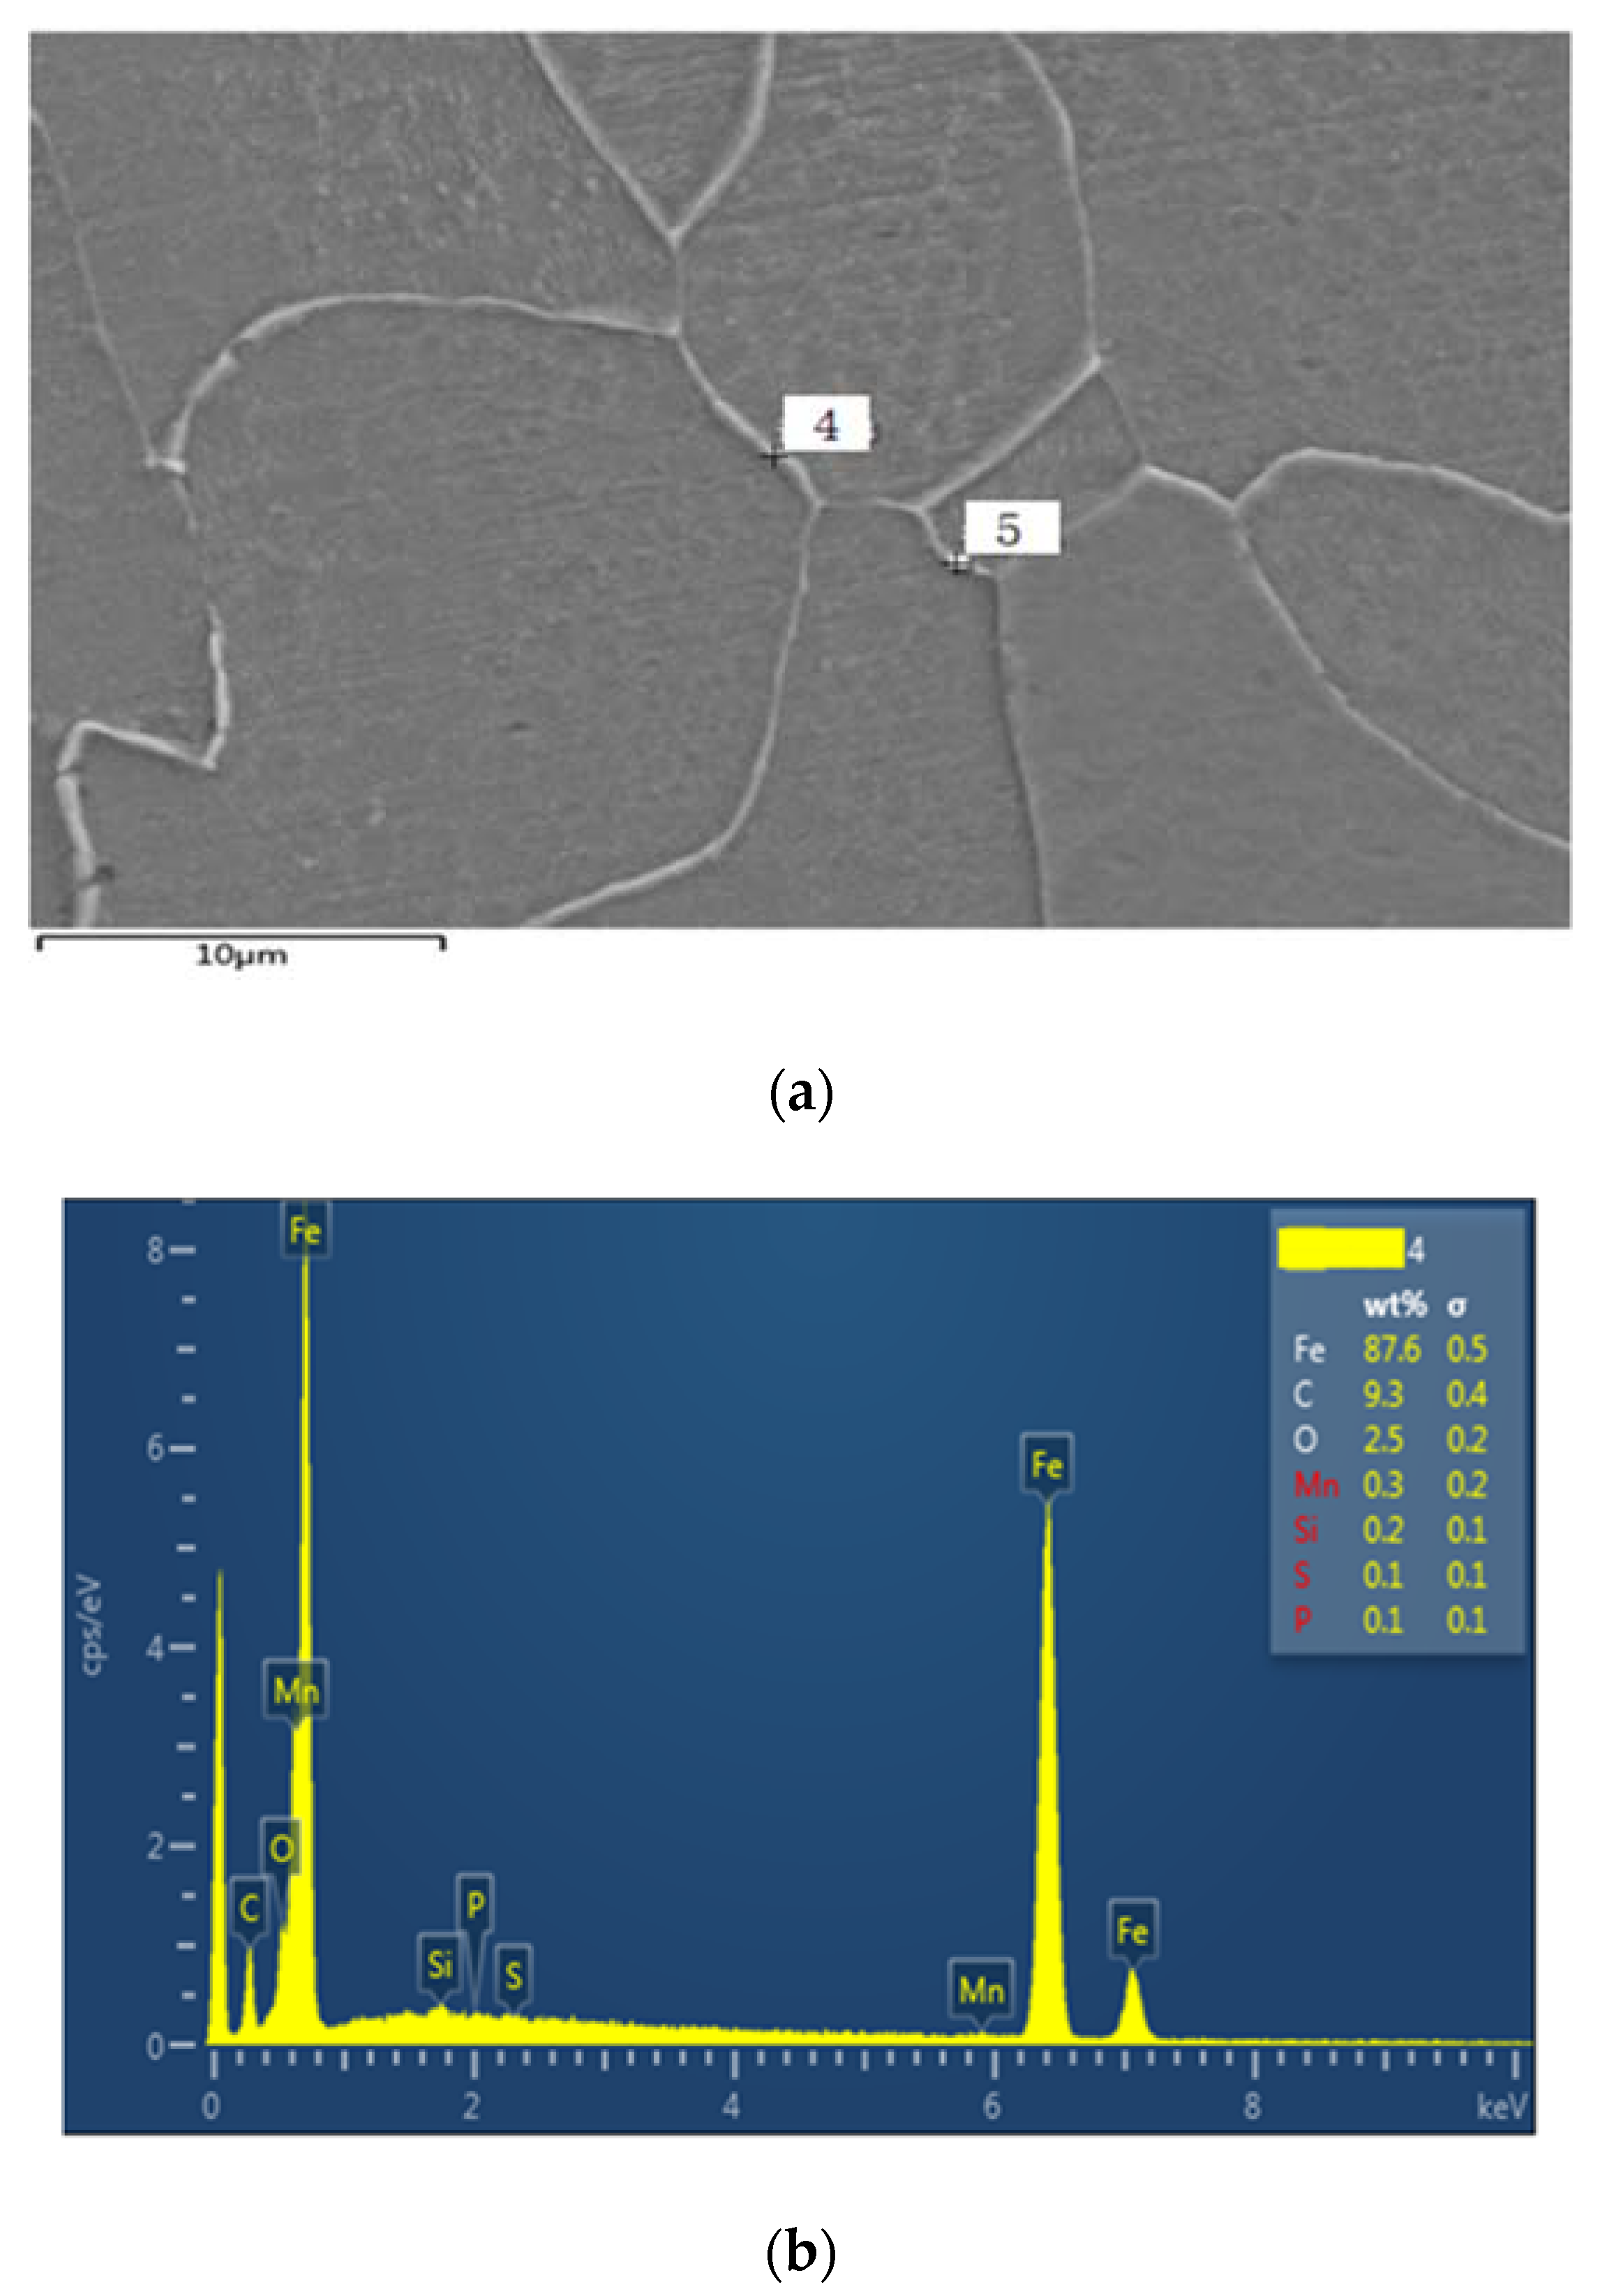
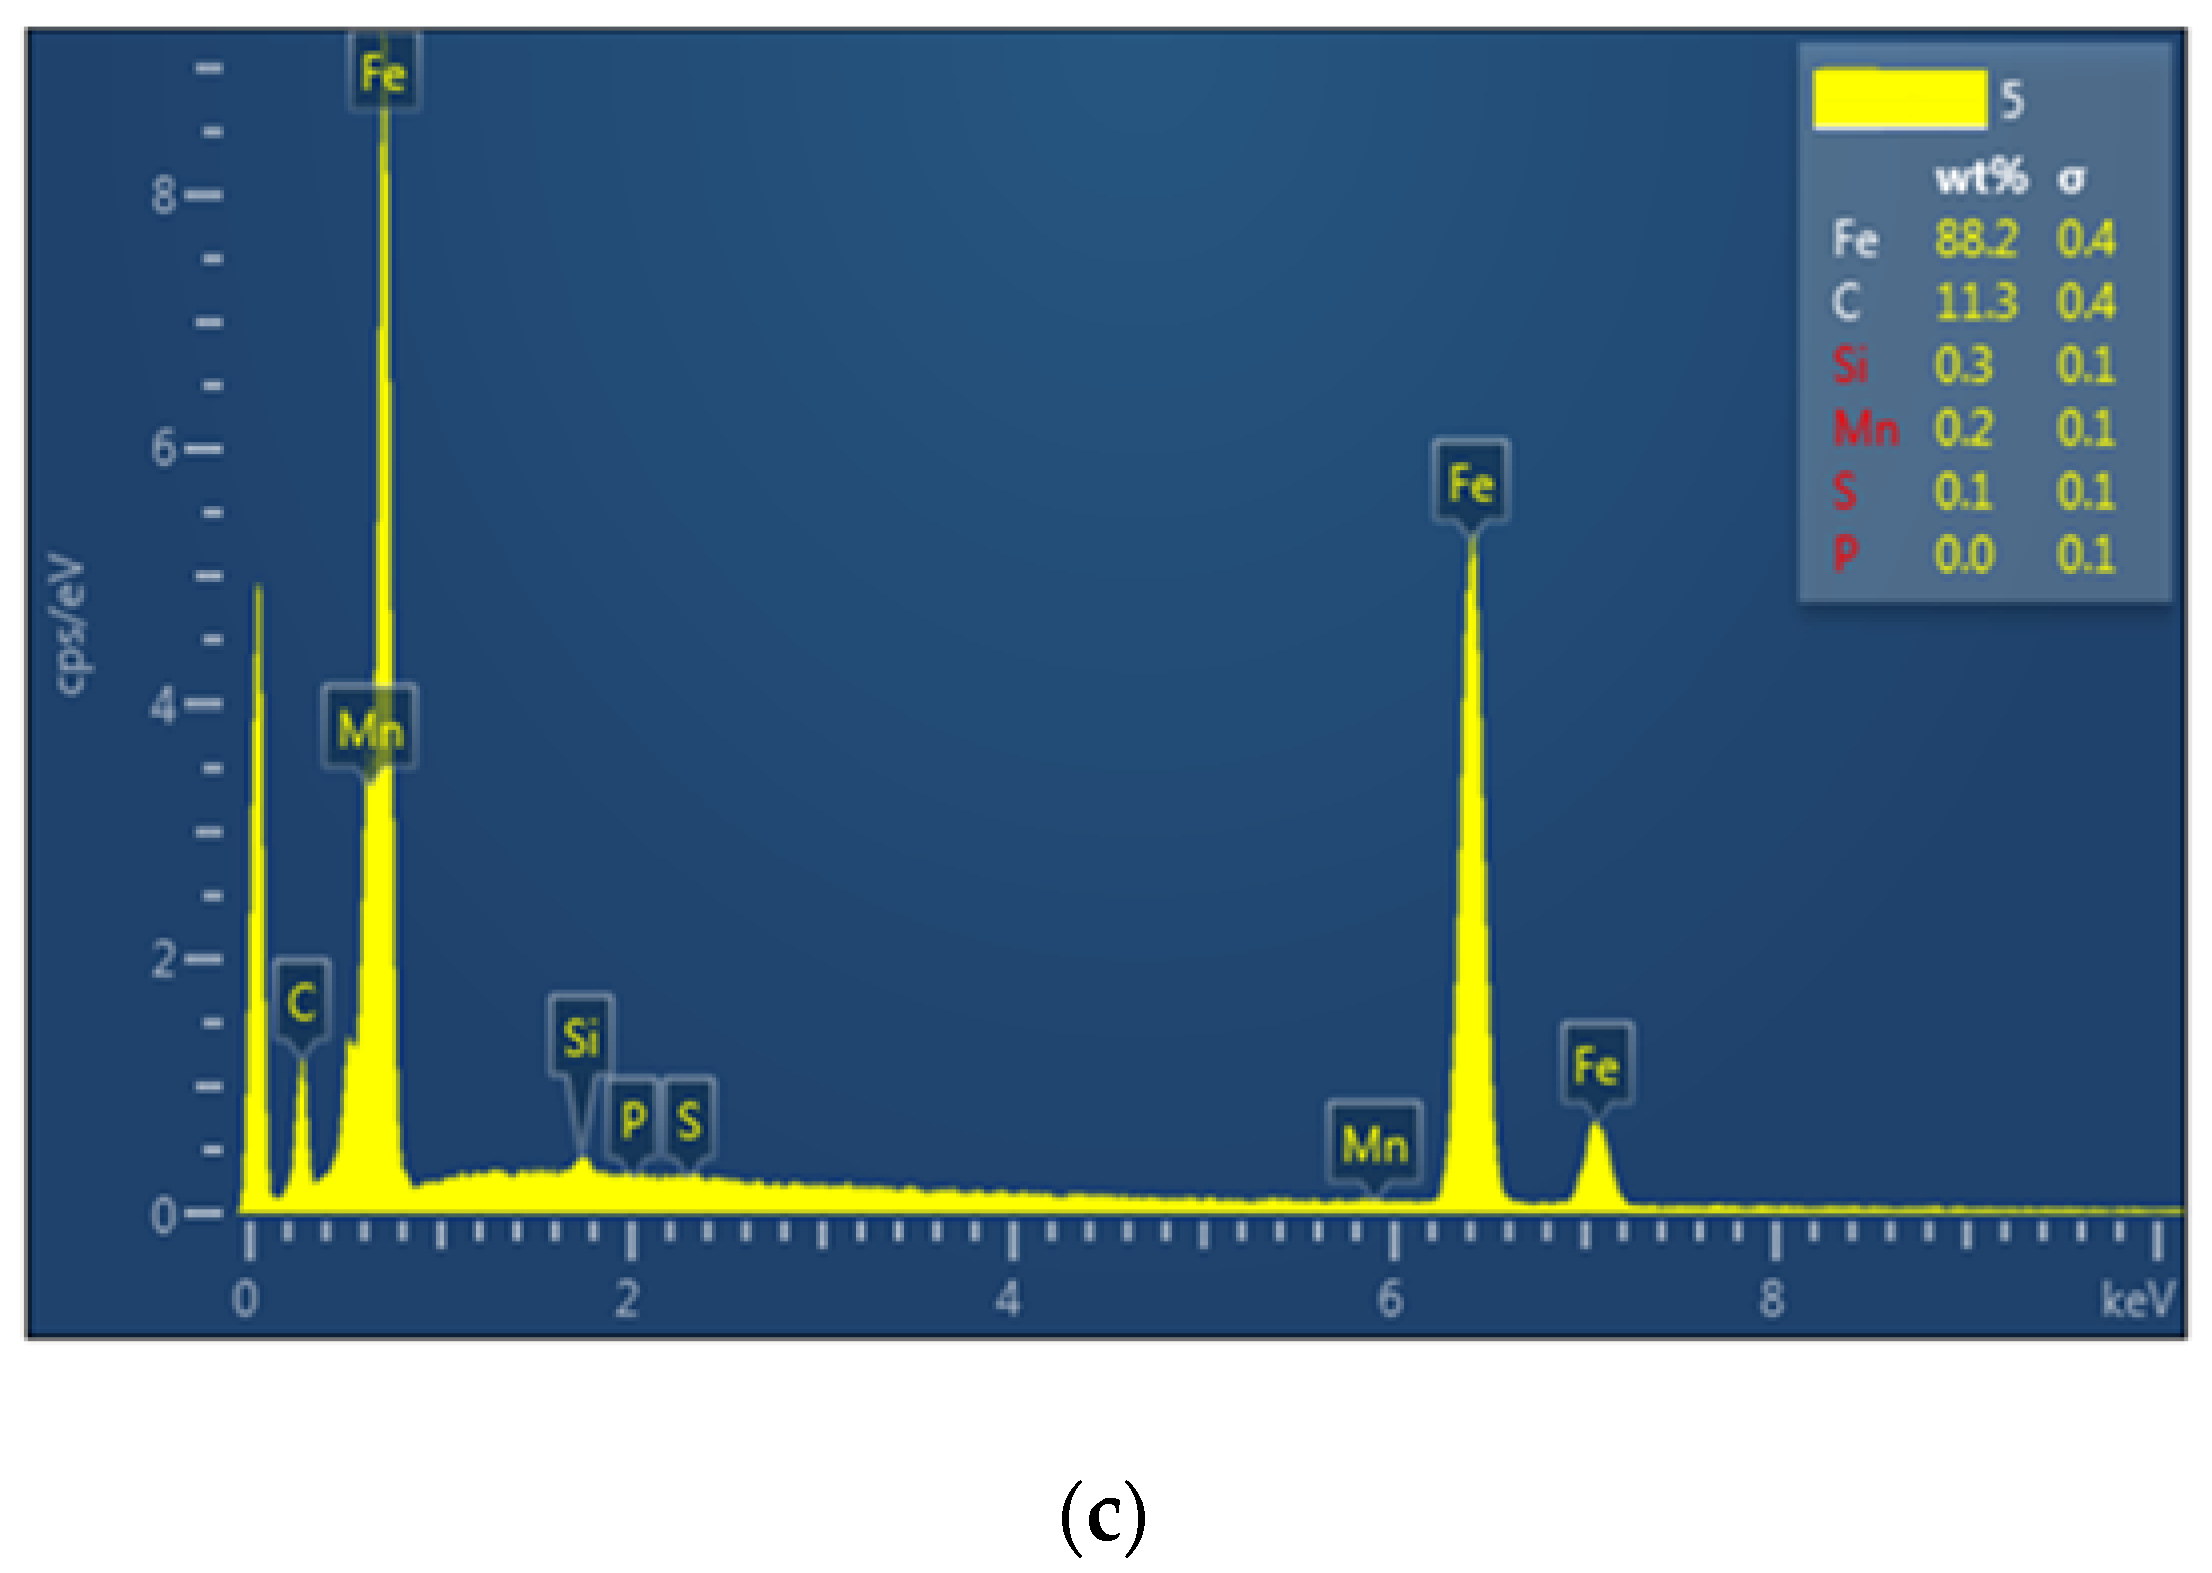
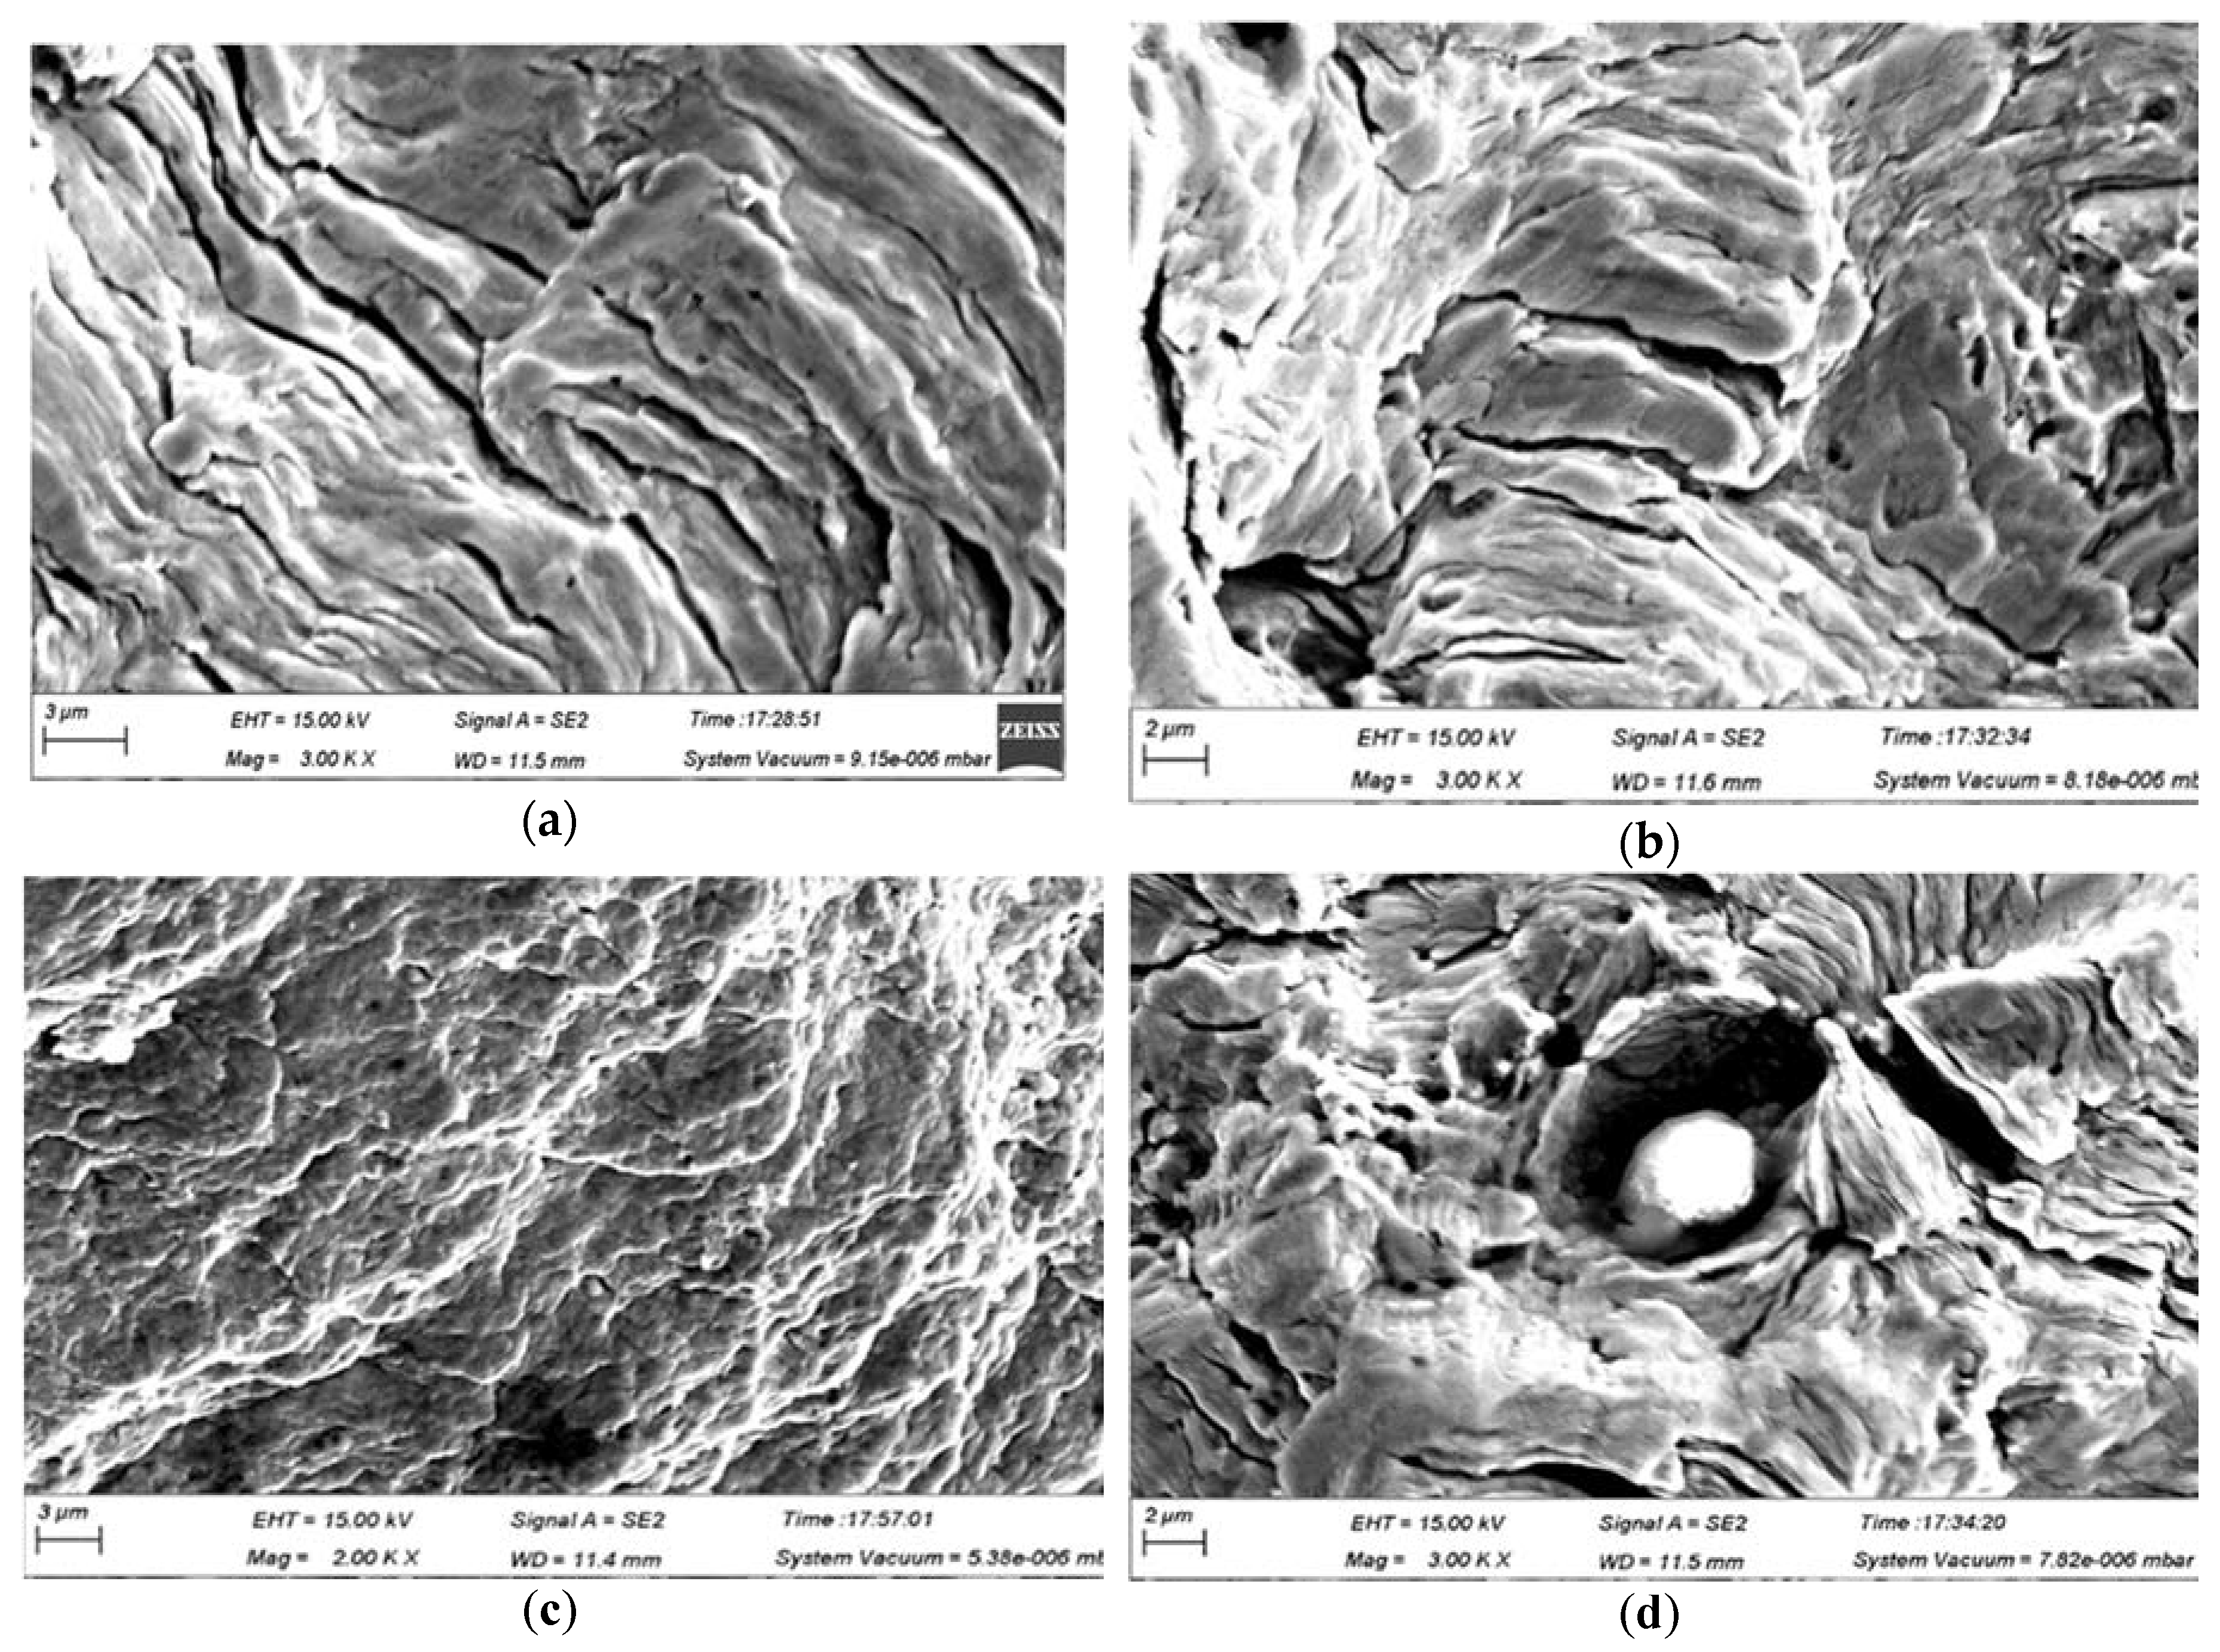
3.5. A Brief Analysis of the Microstructure of Material in State: As-Received, Previously Subjected to Creep, after Fracture Due to Fatigue

In addition to the studied mechanical behavior of the material under different circumstances, a brief analysis of the microstructure of the material corresponding to its condition in those circumstances was also made. In this sense, to microstructure analysis of as received material (specimen 1), material previously subjected to creep (specimen 2) and material fractured due to fatigue (specimen 3), an optical microscope (OM) and/or scanning electron microscope (SEM) was used. All of images made by the mentioned microscopes relating to certain state of the material are shown in Figure 7, Figure 8, Figure 9, and Figure 10 and then discussed.
As it is seen, some images representing microstructure of the examined material were made on the cross-sections of specimens, while some of them were made on the longitudinal sections of specimens. In Figure 7, representing the microstructure on the cross-section as well as on the longitudinal section of as-received material (specimen 1), it is found that a small amount of pearlite is distributed on the ferritic matrix. In addition, it was found that on the longitudinal section of the specimen is distributed in fibrous form on the ferritic matrix, i.e., along the longitudinal direction. Regarding the shown situation in Figure 8, representing the microstructure of the cross-section as well as of the longitudinal section of specimen previously subjected to creep (specimen 2), results show that a large number of second phases were precipitated at the grain boundaries during creep. It is also seen, taking in consideration all of parts of Figure 8, i.e., including Figure 8c,d, that at the grain boundaries, there are mainly Fe-C intermetallic compounds containing a small amount of Mn compounds. The mentioned precipitations of the second phase at grain boundaries will cause intergranular separation (intercrystallite cleavage/intergranular brittle fracture/intergranular cracking) and, consequently, reduce creep resistance. Analyzing microstructure of the specimen subjected to mechanical fatigue (specimen 3), Figure 9 and Figure 10, and comparing this image of microstructure with that representing of as-received material (specimen 1), it can be said that no significant differences are observed between them. The result of composition analysis shows that the segregation of carbon atoms and impurity elements at the grain boundaries can cause the intergranular propagation of the fatigue due to fatigue. Regarding Figure 10a, representing the observation of fatigue fracture morphology, it is visible that fatigue streaks appeared at the back of the fatigue fracture growth zone, and width of the fatigue streaks is 0.001–0.003 mm. Similar fracture morphology, Figure 10b, of the front part of the fatigue fracture growth zone is shown. There are many dimples in the last fracture zone, Figure 10c, whose existence indicates to the ductile fracture. In addition, a second phase particles can be observed at the crack source. Brittle phase particles are usually prone to crack formation. In addition, it is useful to have an insight into the fatigue behavior of other materials for the possibility of their application [38,39].

4. Conclusions

This research has yielded very useful and, at the same time, very reliable data on the behavior of material under certain environmental conditions. The aforementioned experimentally obtained data are of great use in the design of structures where this material is used. In this sense, experimentally obtained data relating to the ultimate tensile strength and yield strength of a material, and that correspond to the room temperature, are ( σ m ( 20   ° C ) / σ 0.2 ( 20   ° C ) = ( 598 / 580 )   MPa ) . Otherwise, the changes in mechanical properties versus temperature are also shown. In addition, data on the behavior of the material that is subjected to prescribed creep process that is defined by stress level and temperature were obtained, which makes it possible to evaluate its creep resistance. Based on short-time creep tests performed, results of which are displayed in the form of creep curves, it is visible that this material can be treated as creep resistant at temperature of 400 °C if applied stress is less than 50% of yield stress at this temperature. At temperatures of 500 and 600 °C, applied stress must be less than 30% of the yield stress at these temperatures, for the material to be considered as creep resistant. Using analytical formula, modeling of short time creep test is also presented. It is experimentally verified that at repeated (fluctuating) load, the fracture of the engineering element can occur at applied stress level that is significantly lower than fracture stress corresponding to the monotonic tensile stress. In view of this fact, based on uniaxial cyclic fatigue tests performed at constant stresses and at room temperature, a fatigue limit in amount of σf(20°C,R = −1) = 250.83MPa was determined. The strength of the material corresponding to the particular number of the cycles to failure can be monitored based on the stress—life (fatigue—life/ S N ) diagram, and it is commonly referred to as fatigue life.

Author Contributions

Conceptualization, J.B.; methodology, J.B. and S.K.; validation, M.B. and S.K.; investigation, J.B., M.B., and S.C.; writing—original draft preparation, J.B.; writing—review and editing, J.B., M.B., J.N., and Z.G.; visualization, S.K.; supervision, J.N., Z.G., and S.C.; funding acquisition, J.B. All authors have read and agreed to the published version of the manuscript.

Funding

This research received no external funding.

Acknowledgments

This work has been fully supported-supported in part by the Croatian Science Foundation under the project IP-2019-04-8615, as well as by the University of Rijeka within the projects: uniri-tehnic-18-42, uniri-tehnic-18-200, and, uniri-tehnic-18-37. The authors would like to thank all the funding received. Further, the authors of this paper would like to acknowledge Sijie Chen, from Henan Polytechnic University, School of Materials Science and Engineering, for the analysis of the microstructure and for the explanations provided.

Conflicts of Interest

The authors declare no conflict of interest. The funders had no role in the design of the study; in the collection, analyses, or interpretation of data; in the writing of the manuscript; or in the decision to publish the results.

References

  1. Stephens, R.I.; Fatemi, A.; Stephens, R.R.; Fuchs, H.O. Metal Fatigue in Engineering, 2nd ed.; John Wiley & Sons: New York, NY, USA, 2001; pp. 1–3. [Google Scholar]
  2. Brooks, C.; Choudhury, A. Failure Analysis of Engineering Materials; McGraw-Hill: New York, NY, USA, 2002; pp. 2–7. [Google Scholar]
  3. Collins, J.A. Failure of Materials in Mechanical Design, 2nd ed.; John Wiley & Sons: New York, NY, USA, 1993; pp. 6–15. [Google Scholar]
  4. Brnic, J. Analysis of Engineering Structures and Material Behavior; Wiley & Sons: Chichester, UK, 2018; pp. 209–222. [Google Scholar]
  5. Brnic, J.; Turkalj, G.; Niu, J.; Canadija, M.; Lanc, D. Analysis of experimental data on the behavior of steel S275JR—Reliability of modern design. Mater. Des. 2013, 47, 497–504. [Google Scholar] [CrossRef]
  6. Findley, W.N.; James, S.L.; Ksif, O. Creep and Relaxation of Nonlinear Viscoelastic Materials; Dover Publications, Inc.: New York, NY, USA, 1989; pp. 3–7. [Google Scholar]
  7. Gariboldi, E.; Spigarelli, S. Creep and high-temperature deformation of metals and alloys. Metals 2019, 9, 1087. [Google Scholar] [CrossRef] [Green Version]
  8. Raghavan, V. Materials Science and Engineering—A First Course, 6th ed.; PHI Learning, Private Limited: New Delhi, India, 2015; pp. 287–297. [Google Scholar]
  9. Boresi, A.P.; Schmidt, R.J.; Sidebottom, O.M. Advanced Mechanics of Material, 4th ed.; John Wiley & Sons: New York, NY, USA, 1993; pp. 655–691. [Google Scholar]
  10. Essa, K.; Kacmarcik, I.; Hartley, P.; Plancak, M.; Vilotic, D. Upsetting of bi-metallic ring billets. J. Mater. Process. Tech. 2013, 212, 817–824. [Google Scholar] [CrossRef]
  11. Brezinová, J.; Guzanová, A.; Draganovská, D.; Egri, M. Assessment tribological properties of coatings applied by HVOF technology. Acta Mech. Autom. 2013, 7, 135–139. [Google Scholar] [CrossRef] [Green Version]
  12. Zettl, B.; Mayer, H.; Ede, C.; Tschegg, S.S. Very high cycle fatigue of normalized carbon steels. Int. J. Fatigue 2006, 28, 1583–1589. [Google Scholar] [CrossRef]
  13. Bach, J.; Göken, M.; Höppel, H.W. Fatigue of low-alloyed carbon steels in the HCF/VHCF-regimes. In Fatigue of Materials at Very High Numbers of Loading Cycles; Christ, H.J., Ed.; Springer Fachmedien Wiesbaden GmbH: Wiesbaden, Germany, 2018; pp. 1–23. [Google Scholar]
  14. Bach, J.; Göken, M.; Höppel, H.W. Stages of fatigue damage of plain carbon steels at the transition from the high cycle fatigue to the very high cycle fatigue regime. In Proceedings of the VHCF7-Seventh International Conference on Very High Cycle Fatigue, Dresden, Germany, 3–5 July 2017; Zimmermann, M., Christ, H.J., Eds.; University Siegen: Dresden, Germany, 2017; pp. 154–159. [Google Scholar]
  15. Nonaka, I.; Setowaki, S.; Ichikawa, Y. Effect of load frequency on high cycle fatigue strength of bullet train axle steel. Int. J. Fatigue 2014, 60, 43–47. [Google Scholar] [CrossRef]
  16. Brnic, J.; Turkalj, G.; Canadija, M. Mechanical testing of the behavior of steel 1.7147 at different temperatures. Steel Compos. Struct. 2014, 17, 549. [Google Scholar] [CrossRef]
  17. Brnic, J.; Canadija, M.; Turkalj, G.; Krscanski, S.; Lanc, D.; Brcic, M.; Gao, Z. Short-time creep, fatigue and mechanical properties of 42CrMo4-low alloy structural steel. Steel Compos. Struct. 2016, 22, 875. [Google Scholar] [CrossRef]
  18. Krewerth, D.; Weidner, A.; Biermann, H. Investigation of the damage behavior of cast steel 42CrMo4 during ultrasonic fatigue by combination of thermography and fractography. Adv. Eng. Mater. 2013, 15, 1251–1259. [Google Scholar] [CrossRef]
  19. Torizuka, S.; Kuntz, M.; Furuya, Y.; Bacher-Hoechst, M. Effect of tensile strength and microstructure on notch-fatigue properties of ultrafine-grained steels. ISIJ Int. 2012, 52, 910. [Google Scholar] [CrossRef] [Green Version]
  20. Pantazopoulos, G.A. Short review on fracture mechanisms of mechanical components operated under industrial process conditions: Fractographic analysis and selected prevention strategies. Metals 2019, 8, 148. [Google Scholar] [CrossRef] [Green Version]
  21. Mayer, H. Fatigue damage of low amplitude cycles in low carbon steel. J. Mater. Sci. 2009, 44, 4919. [Google Scholar] [CrossRef]
  22. Cai, Y.; Young, B. Experimental investigation of carbon steel and stainless steel bolted connections at different strain rates. Steel Compos. Struct. 2019, 30, 551. [Google Scholar] [CrossRef]
  23. Annual Book of ASTM Standards, Metals-Mechanical Testing; Elevated and Low-Temperature Tests; Metallography; ASTM International: Baltimore, MD, USA, 2015; Volume 03.01.
  24. ISO 12107:2012 (E) (2012), Metallic Materials—Fatigue Testing—Statistical Planning and Analysis of Data; ISO: Geneva, Switzerland, 2012.
  25. Rawlings, J.O.; Pantula, S.G.; Dickey, D.A. Applied Regression Analysis—A Research Tool, 2nd ed.; Springer: Berlin/Heidelberg, Germany, 1998; pp. 220–222. [Google Scholar]
  26. Horňák, P.; KyzioL, D.; Kyzioł, K.; Trebuňová, M.; Majerníková, J.; Kaczmarek, Ł.; Trebuňa, J.; Hašuľ, J.; Paľo, M. Microstructure and Mechanical Properties of Annealed WC/C PECVD Coatings Deposited Using Hexacarbonyl of W with Different Gases. Materials 2020, 13, 3576. [Google Scholar] [CrossRef]
  27. Huang, T.; Song, Z.; Chen, F.; Guo, J.; Pei, Y.; Xing, B.; Xiang, N.; Song, K. Influence of the anisotropy on the microstructure and mechanical properties of Ti/Al laminated composites. Materials 2020, 13, 3556. [Google Scholar] [CrossRef]
  28. Christopher, J.; Choudhary, B.K. Modeling creep deformation and damage behavior of tempered martensitic steel in the framework of additive creep rate formulation. J. Press. Vessel Technol. 2018, 140, 051401. [Google Scholar] [CrossRef]
  29. Li, C.Q.; Fu, G.; Yang, W.; Yang, S. Derivation of elastic fracture toughness for ductile metal pipes with circumferential external cracks under combined tension and bending. Eng. Fract. Mech. 2017, 178, 39–49. [Google Scholar] [CrossRef] [Green Version]
  30. Roberts, R.; Newton, C. Interpretive report on small-scale test correlation with KIc data. Weld. Res. Counc. Bull. 1981, 65, 1–16. [Google Scholar]
  31. Brnic, J.; Turkalj, G.; Lanc, D.; Canadija, M.; Brcic, M.; Vukelic, G. Comparison of material properties: Steel 20MnCr5 and similar steels, J. Constr. Steel Res. 2014, 95, 81–89. [Google Scholar] [CrossRef]
  32. Suresh, S. Fatigue of Materials, 2nd ed.; Cambridge University Press: Cambridge, UK, 2003; pp. 1–35. [Google Scholar]
  33. Brnic, J.; Krscanski, S.; Brcic, M.; Geng, L.; Niu, J.; Ding, B. Reliable experimental data as a key factor for design of mechanical structures. Struct. Eng. Mech. 2019, 72, 245–256. [Google Scholar] [CrossRef]
  34. Farahmand, B.; Bockrath, G.; Glassco, J. Fatigue and Fracture Mechanics of High Risk Parts; Chapman & Hall: New York, NY, USA, 1997; pp. 13–102. [Google Scholar]
  35. Barson, J.M.; Rolf, S.T. Fracture and Fatigue Control in Structures, 3rd ed.; Butterworth-Heinemann: Philadelphia, PA, USA, 1999; pp. 163–181. [Google Scholar]
  36. Feng, L.; Qian, X. Rapid S-N type life estimation for low cycle fatigue of high-strength steels at a low ambient temperature. Steel Compos. Struct. 2019, 33, 777–792. [Google Scholar] [CrossRef]
  37. Papuga, J.; Fojtík, F. Multiaxial fatigue strength of common structural steel and the response of some estimation methods. Int. J. Fatigue 2017, 104, 27–42. [Google Scholar] [CrossRef]
  38. Brnić, J.; Brčić, M.; Kršćanski, S.; Lanc, D.; Niu, J.; Wang, P. Steel 51CrV4 under high temperatures, short-time creep and high cycle fatigue. J. Constr. Steel Res. 2018, 147, 468–476. [Google Scholar] [CrossRef]
  39. Christou, G.; Hegger, J.; Classen, M. Fatigue of clothoid shaped rib shear connectors. J. Constr. Steel Res. 2020, 171, 106133. [Google Scholar] [CrossRef]
Figure 1. Equipment used in research. (a) Materials testing machine, 400 kN. (b) Dynamic testing machine, ±50 kN. (c) Charpy impact machine, 300 J.
Metals 10 01445 g001
Figure 2. Test specimens used in research. (a) Type of the specimen used in determination of engineering stress–strain curves and creep curves. (b) Type of the specimen used in fatigue testing. (c) Type of the specimen used in Charpy V-notch testing.
Metals 10 01445 g002aMetals 10 01445 g002b
Figure 3. Engineering stress–strain diagrams and mechanical properties versus temperature. (a) Engineering stress–strain diagrams, temperatures: 20, 100, 200, 250, and 300 °C. (b) Engineering stress–strain diagrams, temperatures: 400, 500, and 600 °C. (c) Ultimate tensile strength and yield strength versus temperature. (d) Modulus of elasticity versus temperature.
Metals 10 01445 g003aMetals 10 01445 g003b
Figure 4. Sort-time creep tests of C15E + C (1.1141) steel and creep modeling. (a) Creep tests at 400 °C. (b) Creep tests at 500 °C. (c) Creep test at 600 °C. (d) Creep modeling.
Metals 10 01445 g004
Figure 5. Measured impact fracture energy (CVN) and calculated fracture toughness ( K I c ): C15E + C (1.1141) steel.
Metals 10 01445 g005
Figure 6. Fatigue life/stress-life (S—N) diagram; stress   ratio   R = 1 ; C15E + C (1.1141) steel.
Metals 10 01445 g006
Figure 7. Optical micrographs: As-received material (specimen 1), C15E + C (1.1141) steel, 3% nitric acid, and 97% alcohol, (500×). (a) Cross-section of the specimen. (b) Longitudinal section of the specimen.
Metals 10 01445 g007
Figure 8. SEM micrographs and the composition of the material at corresponding positions on SEM micrograph (3 and 4) marked in Figure 8a: Material previously subjected to creep (specimen 2), at 600 °C/8.6 MPa/1200 min, C15E + C (1.1141), steel, 3% nitric acid, and 97% alcohol. (a) Cross-section, 3000×. (b) Longitudinal section, 3000×. (c) Composition-position 3 on the SEM micrograph (a). (d) Composition-position 4 on the SEM micrograph (a).
Metals 10 01445 g008aMetals 10 01445 g008b
Figure 9. SEM micrographs and the composition of the material at corresponding positions on SEM micrograph (4 and 5) marked in Figure 9a: Material fractured due to fatigue (specimen 3), fractured at 94979 cycles/ ± 310   MPa , C15E + C (1.1141) steel, 3% nitric acid, and 97% alcohol. (a) Cross-section, 3000×, (b) Composition-position 4 on the SEM micrograph. (c) Composition–position 5 on the SEM micrograph.
Metals 10 01445 g009aMetals 10 01445 g009b
Figure 10. Observation of fatigue fracture morphology, C15E + C (1.1141) steel. (a) Fatigue streaks-back of fatigue fracture growth zone, 2000×. (b) Front part of fatigue fracture growth zone, 3000×. (c) Dimples in the last fracture zone of the fatigue fracture, 3000×. (d) Brittle phase particles prone to crack formation, 3000×.
Metals 10 01445 g010
Table 1. Chemical Composition of C15E + C (1.1141) Steel.
Material: C15E + C Steel
(Special Nonalloyed-Case Hardening Steel)
Designation
Steel name (type, grade, and quality)/i.e., letter mark of steel in accordance with the norm (country code): (EN, DIN, and other norms)Steel number (Mat. No, W. Nr, and Mat. code)/i.e., numerical designation of steel
(EN)/(DIN): (10084 (2008))/(17210 (1986)):
C15E/C15, Ck15
England/ BS 080M15; France/AFNOR XC15; USA/AISI-ESA 1015
In accordance with above given norms that define technical delivery conditions, this steel belongs to the material group classified (named) as case hardening nonalloy special steels, which is confirmed by the below given chemical composition.
1.1141
Chemical composition, Mass (%)
CSiMnPSCrNi
0.1350.2330.380.010.0090.0840.06
MoCuAlWSnRest
0.0190.0270.0350.0060.00798.99
Table 2. Creep Modeling Data.
MaterialC15E + C (1.1141)
Time–Stress Dependence Model: ε ( t ) = ε ( σ , t ) ;
T = c o n s t
Equation
ε ( t ) = D T σ p t r and Time (min) = 1200
Creep processes were carried out at temperature and stresses listed below
Constant temperature/ T  °C400
Applied constant stress level σ   ( 10 6 Pa ) 107178.5
σ = x × σ 0.2 x = 0.3 x = 0.5
Parameters (according to Equation)Parameters ( D ,   p ,   r ) valid for
x = 0.3–0.5
D1.21913163202914
p3.96411487762191
r0.686440947878887
Table 3. Data for Modified Staircase Method.
Stress   Ratio   R = 1 ,   Steel   C 15 E   +   C   ( 1.1141 ) ,   Room   Temperature ,
Failed (◆), Unfailed (○)
Stress σ i , max (MPa)Specimen
1234567
270
260
250
Table 4. Data Analysis Related to Table 3.
Stress   Ratio   R = 1 ,   Steel   C 15 E   +   C   ( 1.1141 ) ,   F - Failed ,
Room Temperature
Stress σ i /MPaStress level, ifiifii2fi
27023612
2601222
2500000
f i ,   i f i ,   i 2 f i 5814
Table 5. A, B, C, and D constants, calculated (ISO 2012).
Stress   Ratio   R = 1
FormulaMaterial:
C15E + C (1.1141)
A = i × f i 8
B = i 2 × f i 14
C = f i 5
D = B × C A 2 C 2 0.24
Publisher’s Note: MDPI stays neutral with regard to jurisdictional claims in published maps and institutional affiliations.

