First Experimental Values for the Light Penetration Depth of Platinum and Iron Gases at 532 nm


1
INEI, University of Castilla-la Mancha, 37001 C. Real, Spain
2
Engineering School of Ciudad Real, University of Castilla-la Mancha, 37001 C. Real, Spain
3
Departamento de Física, Facultad de Ciencias Exactas, Universidad de Buenos Aires, Buenos Aires 1482, Argentina
4
INFIP, CONICET, Buenos Aires 1414, Argentina
*
Author to whom correspondence should be addressed.
†
These authors contributed equally to this work.
Metals 2020, 10(10), 1382; https://doi.org/10.3390/met10101382
Submission received: 18 September 2020
/
Revised: 6 October 2020
/
Accepted: 13 October 2020
/
Published: 16 October 2020
Abstract
:Light penetration depth is a fundamental property that has been researched extensively with a large amount of materials. Among those studies, different planetary atmospheres and material phases, like plasmas, had been previously addressed, both theoretically and experimentally. However, no experimental data are available for platinum and iron gases due to the difficulties for the creation of gas state from a solid metal material. This work present experimental penetration depths at 532 nm laser light for iron and platinum gases produced by a carefully tuned exploding wire system in atmospheric air. Iron presents a larger dispersion on the data than platinum, which is explained because of its large magnetic permeability value, that generates a less homogeneous gas than in the platinum case.
1. Introduction
Exploding wire systems basically consists in a high voltage capacitor bank connected to a metal conducting wire that can be triggered in a controllable way. They had been in use for a long time, as their first mention can be traced to a Bakerian lecture by Faraday [1], and have many scientific applications, from their use on Z-wires system to reach warm dense matter values [2], to create shock waves to scale explosions in laboratory experimental setups [3].
A less common use for exploding wire facilities is the formation of gases of different metals to study their fundamental properties. Recently, we have employed an exploding wire system to obtain the first experimental limits to the resistivity of platinum and iron gases [4]. It is important to note that usual experimental setups for exploding wires have very different characteristics of the one employed in these experiments. Therefore, other exploding wire arrangements explore a totally different material phase space, as it will be later described. In this work penetration depths of 532 nm laser light for platinum and iron gases had been measured by their light attenuation evolution in time on an exploding wire setup.
Light attenuation by a gas is a parameter of importance for a multitude of scientific and technical endeavors. Specifically, whenever any atmosphere is considered a medium that transmits any form of electromagnetic energy. Therefore, light attenuation values are important in a wide range of uses, from ecological modeling [5] to performance prediction for solar power plants [6] in Earth. This means that from some time already, attenuation or transmission data for Earth atmospheric gases are published [7,8], and even data for Martian atmosphere are available [9].
In addition, for the transparency or attenuation of different wavelengths in plasmas are bibliography already available. For example, Bogatyreva et al. [10] made some calculations for air plasmas, meanwhile Sheuer [11] presents absorption coefficient of plasmas for microwave frequencies of astronomical interest. More general results are given by Dawson and Oberman [12], as in their paper their calculated also the absorption coefficients for fully ionized plasmas, including frequencies close to the plasma frequency. In more recent works, iron plasma opacities in conditions closer to solar interiors, temperatures in the order of millions Kelvin and electron densities from 0.7 to 4.0 × 10 per cubic centimetre, had been measured [13] or calculated in similar iron conditions [14], or different ones [15].
Notice that in all the cited works, either experimental measurements or calculations, are for conditions in which the iron metal is in an obvious plasma state, where collective effects being a salient characteristic, meanwhile in this work we are interested in conditions in which iron or platinum are pure gases, with a very low ionization level that do not produce collective effects up to a measurable level.
To the knowledge of the authors, the only previous work concerning the opacities of iron, copper and silver gases is the seminal work of Anderson [16], where the presence of opaque gas as a result of an exploding wire is established with parameters, for what it is possible to deduce from the short communication, similar to the ones employed in our experiments. Nevertheless, as Anderson literally writes, “the absorption coefficient has been shown to be fairly large but has not been measured”.
In this work we present the first experimental data on the measurement of the opacity of iron and platinum gases produced by an exploding wire system with data openly available in ‘Iron and platinum experiments raw data’ at http://doi.org/10.5281/zenodo.3648264.
2. Experimental Setup
Experiments were performed with the Alambre Explosivo (ALEX, exploding wire in Spanish) system, an exploding wire setup located at the INEI, University of Castilla-la Mancha, Spain. Metal wires of iron and platinum with fixed diameter and length, 125 m and 56.9 ± 0.01 mm respectively, were used, while the charging voltage of the capacitors was varied between 10, 15, and 20 kV. In order to improve results by error minimization, the same initial voltage was used 9 or 10 times, a sufficient number to reduce the statistical error without increasing to an unmanageable quantity the data to be processed.
ALEX is an exploding wire system, as Figure 1 indicates, with two capacitors of 1.1 F each in parallel giving a 2.2 F total capacity to the circuit. Capacitors are charged by the high voltage source connected also in parallel with them, and discharged in a controlled manner through the load metal wire thanks to the spark gap switch which is closed at will by a high current pulsed source, synchronized with the displayed trigger unit in Figure 1. magnitude of 142 nH has been measured using a closed circuit discharge shot. The electric potential difference through the wire is recorded by two resistive voltage dividers directly attached to the wire holders, not represented in the scheme.
A Rogowski coil designed, made, and calibrated in the laboratory was used in these experiments to observe the electrical current flowing through the wire and later produced gas or plasma. In the experiments here described, characterization of the current circulating during the dark pause was the main task of this probe. Dark pause consists of a sudden interruption of the current flow due to the conversion of wire metal wire into vapor [17]. Due to its much larger electrical resistivity, this vapor opens the circuit and inhibits the passage of a large portion of the electrons flowing through the system, halting the electrical current. Figure 2 presents a typical dark pause electrical current signal synchronized with the streak camera metal gas observation. Notice that current flow at later times of the experiment is not interesting for our measurements, as when the metal gas gets hot enough it starts to become plasma. Plasma starting was signaled very clearly by two different instruments on our configuration. First, the rise of the electrical current due to the diminution of resistivity of the plasma state respect the gas, and second, the optical emission in the streak camera at the end of the recorded time window.
We are interested in the current pause observation because in this moment of the discharge, part of the mass belonging to the metal wire is transformed in vapor, whose penetration depth at 532 nm laser light is the objective of this work.
Please notice that the capability of this setup to produce metal gas derived from the fact that it was a slower and less powerful exploding wire system than more usual setups employed in other works [18,19,20]. Contrary to other exploding wire configurations, either in vacuum or different surrounded media, the current ratio was never higher than 10 A/ns. For comparison, in the work of Sarkisov et al. [21], it is stated in the abstract than current ratios of 20 A/ns are already slow.
The same situation occurred with the electrical discharge period. This period can be approximated with the electrical circuit shorted, being then , with the circuit impedance and C the total circuit capacity, that can be well approximated by the capacitors bank capacitance value. The period on our setup reached an approximate value of 3.5 s, at least two or three times larger than in more usual systems. As these conditions are not standard for working with exploding wires, the usual assumptions about those machines did not apply to the results of this work. An interested reader on those more common conditions can go to the recent review about exploding wires in vacuum in these more standard conditions by Oreshkin and Baksht [22].
A laser light of 532 nm working on continuous mode is the light source of the imaging system, that is composed also by a streak camera, see Figure 3. Due to the small laser beam diameter, a beam expander with a magnification factor of 10 increases its initial diameter to approx. 1 cm. Later, a combination of two plane-concave lens increases further the beam diameter up to a value on the order of 10 cm in the plane of the wire. This two lens system has a misalignment in the focus to create an angular expansion of approx. 0.20 degrees in order to properly illuminate not only the wire but also its surroundings, so a large area is visible in the streak camera when focused on the wire by a commercial objective. In this way, images of the radial expansion of the wire materials over time, regardless of the material phase, can be obtained. These images record the light intensity to a two bytes digital scale, so maximum light intensity recorded by the camera is 65,536 counts in base 10 values of the bytes digitization.
3. Obtained Data
Before going into further detail, it is worth explaining the experiment and necessary conditions leading to the data. The gas state of metals is not easy to obtain, as in exploding wires the metals transforms in times of nanoseconds from solid, cold metal into plasma, due to the large and fast energy deposition, with powers on the order of 10 W or large. On the other hand, not enough energy per wire mass will not be able to vaporize the wire, creating liquid phases that will not evolve to metal gas at later times. Therefore, our setup has been carefully tuned in two main parameters: a current large enough as to vaporize a large fraction of the metal wire, but small enough as to not create the plasma too early, and energy delivery time large enough to delay the electrical power delivery to the wire, therefore creating metal gas states for times as large as 4 s. To maintain these metal gas states, it is also important that the mass is large enough as to enhance the electrical power delay obtained by current and energy delivery time tuning. Therefore, in these experiments the wires were a factor of two longer and wider than in more usual experiments performed with these devices.
In short, the exploding wire setup must provide enough current as to perform wire vaporization by Joule effect on the wire material, but maintaining the energy delivery slow so metal gas state has long duration that allow for the measurement of some magnitudes, like the optical attenuation object of this work.
Typical streak images that allow for the calculation of the metal gas attenuation, with current records similar to the one in Figure 2, are shown in Figure 4 and Figure 5 for all the initial voltages employed in the capacitors bank. Notice that all streak images have enhanced contrast and false color in order to facilitate its understanding. As it was previously stated, each voltage was used for a minimum of nine discharges, a number that had proved enough to reduce statistical error within 3%. As it is shown, both electrical discharge beginning and plasma formation were always recorded in the streak images. The start of electrical discharge was visible at the left of the streak by the dark line, marking the unaltered wire, starting its expansion, meanwhile plasma formation was visible by self emission light at the right side. In doing so, it was assured that the whole range of metal gas creation was always visible.
Light attenuation from metal gases is not total, as it is clear in both Figure 4 and Figure 5, because part of the laser light is visible in the metal gas expansion volume imagined in the streaks. This partial diminution of the light in regions occupied by the gas means that light camera sensibility is enough to capture all the attenuation induced by the gas. On the contrary, if metal gas attenuation would be so large as to not allow any laser light passing by, only minimal penetration depth limits could be presented, no absolute values as it is the case.
Platinum data showed a remarkable similarity among them in the generation of the gas phase, as the final expansion radius was very similar for all three cases, but time duration of gas phase was reduced as voltage in the charging capacitors grew. Such time reduction was expected because, as initial energy stored in the capacitors bank grew when voltage increased, time to reach plasma state had to shrink due to the larger and faster absorption of the electrical energy by the metal gas.
Differences on the iron wires due to energy were clearly larger than in platinum, as Figure 5 shows by the different length (vertical) scales needed in the figure. Air shock wave due to the high acceleration of the metal gas separated from the metal gas after some time, therefore borders between shock wave and metal gas volume appeared and increased over time, as vertical line in Figure 6 shows. Dynamics of the shock wave for iron and other metals in conditions similar to these experiments had been the object of previous research by the authors [23]; therefore, despite its interest, is not studied in this work. In any case, Figure 6 clearly shows how shock wave in air and metal gas expansion started at the same velocity, to be latter separated when the shock wave still maintained a supersonic velocity meanwhile the metal gas expansion slowed down. Metal gas occupied volume was marked by the inner border of the images, and as such was employed here as the limit for the metal gas attenuation region.
It is worth here mentioning the possibility that the streak images recorded a phase of the wire material, like over heated gas, a mixture of gas with liquid metal drops, etc. different from the quoted classical gas. It could be stated that the observed attenuation is due to the compressed air remaining behind the already mentioned shock wave. However, notice that at later times of the exploding wire process, when plasma appeared, the shock wave was detached from the dark region, and the inner part of the shock wave was transparent, not opaque. So in order to interpreter the dark expanding region of the streak images as compressed air due to the shock wave, one needs to admit that this compressed air started to be much less compressed when the plasma appeared, a highly unlikely possibility. On the other hand, due to the velocity of the shock wave, easily estimated from the Figure 4 and Figure 5 as a maximum of 2 Mach, the shock wave can be clearly classified as a weak shock wave. Then, the compression of air simply will not account for the lack of light observed, therefore one must conclude that was gas formed from the wire material, being this iron or platinum, which expanded over time. Concerning the possibility of a different phase from gas as the main component of the observed dark expansion, such as Warm Dense Mather (WDM), the power must be rather high, higher than the available power rate in our experiment. Indeed, exploding wires systems where such states can be produced, a power on the order of 10 W is needed, which is at least two orders of magnitude larger than that produced in our experiments. Precisely this low power experiment was designed to accommodate the phase space to a classical liquid-gas-plasma path with a long enough gas phase as to allow for its properties’ measurement.
Regarding the streak images, from them it is possible to obtain light intensity profiles at different times of the gas expansion, Figure 7. As it is shown, as the metal gas evolved in time and expanded, its attenuation, therefore penetration depth, also changed allowing its measurement. In order to do so, light intensity exiting the gas can be written following the Beer–Lambert law, assuming a monochromatic light beam of intensity illuminating a uniform cylinder of gas:
with as radius of the gas cylinder, y the transverse coordinate and its center, and the penetration depth, considered spatially uniform in the cylinder. Notice that this law will give information on the interaction of the light with the medium only for homogeneous and isotropic matter, a situation that does not correspond exactly with our experiments, therefore represents an average value instead.
In order to facilitate the calculations, dimensionless variable is defined as:
Therefore, it is possible to transform (1) in the following:
and therefore to fit each spatial profile of the intensity with this equation. Such an operation will give a value for the dimensionless parameter , later easily translated into the penetration depth .
Penetration depth depends on the interaction cross section and the density of the material, in this case, the metal gas, through the following expression:
where n is the gas density and the interactions cross section. As the metal gas expands in a cylindrical shape, its density can be written as:
N being the amount of gaseous atoms, the cylinder radius, and its length, which in these experiments coincide with the wire length, fixed at 56.9 ± 0.01 mm, as previously commented. Substituting Equation (5) in the expression for penetration depth yields:
This relation indicates that the penetration depth of these metal gases should be directly proportional to given N and constants. With attenuation changing over time in these experiments, see Figure 7, it is then possible to obtain penetration depth values over time.
As the metal gas absorbs electrical energy from the circuit due to Joule heating, gas energy evolution over time can be calculated from the measurement of both electrical current and voltage drop across the wire as:
where is the resistive value of the voltage, and the current flowing through the wire.
Generally, exploding wire setups measure electrical potential between the measuring point and ground pole, therefore needing the subtraction of voltage circulating through the lumped total circuit inductance, calculated by to obtain this resistive voltage. In the present experimental setup it was not necessary to perform such an operation, as the voltage was directly calculated as difference of the potentials at both ends of the wire, directly eliminating the common inductive term. Such a configuration reduced considerably the noise and uncertainty on the obtained voltage, which in turn allowed for reduced error in the absorbed energy over time. A representative example of energy temporal evolution is presented in Figure 8 for an iron wire when the capacitors bank is charged to 20 kV. Notice here that average power can be estimated as 10 Watts, a value far away from the necessary to produce phase mixture materials, as it was previously commented.
Current and voltage signals from this typical case clearly showed the dark pause, as the current diminished almost up to zero, and voltage maintained a quasi–constant level during about 1.5 s, between the 3.5 to 5 s experiment time. Initial current peak indicated the transformation of the wire metal into liquid, that after being evaporated by the Joule heating and transformed into vapor, increased the system resistance so much that forced the decay of electrical current to the almost zero value shown.
Thus, combining calculated penetration depths over time with energy temporal evolution proportionate curves of penetration depth as function of gas absorbed energy or radial expansion for iron and platinum gases, main results of this work.
4. Results and Discussion
Penetration depth of 532 nm light in metal iron gas is shown in Figure 9 as a function of the expansion radius of the metal gas squared for the three charging voltages employed in this work. Such choice of the radial expansion values is not fortuitous: as (6) shows, penetration depth increased linearly with squared radius. Penetration depth values should then follow a line, but in Figure 9 a different situation is visible. In addition, penetration depth values were strongly dependent on the initial charging voltages of the capacitors bank. Such variations are mainly related to the fact that N, i.e., the amount of metal gas particles, was not constant in our experiments and very difficult to calculate due to the inhomogeneities on the produced gas. In addition, as the total cross section of the light-gas interaction, , included elastic and inelastic processes, their relative weight changed in time following gas temperature. Therefore, penetration depth could not be constant but for the radial dependence, as both N and varied with time.
Nevertheless, iron penetration depth showed a curious behavior, as its larger measurements were given for charging voltages middle values. Notice also that its smaller penetration depth values were obtained when charging voltages were the largest explored. This is surprising, because it is reasonable to suppose that the attenuation should follow the energy of the capacitors bank, therefore its voltage, either positive or negatively. An argument for the positive trend is that more initial energy implies more kinetic energy for the metal gas. As this value increases, its penetration depth should follow the same trend; because of the ideal gas nature of the metal gas, as kinetic energy increases, also temperature and pressure grows larger, together with the gas density, enhancing the metal gas penetration depth. Nonetheless, the contrary situation can be also justified: If metal gas density decreases with the energy because of the larger expansion, this effect can preclude or even diminish the gas attenuation with the initial charging voltage, reducing then the penetration depth of the gas with time.
In order to assert which of these two effects prevails, it is important to know the fraction of mass wire converted into gas because of its direct relation with achieved gas density. Although, as the gas increased its internal energy with time, a monotonic increase with time was expected for the fraction of mass wire converted into gas, in our experimental setup it was not possible to give an accurate value for this fraction. On the other hand, none of these two trends followed experimental results of iron.
An explanation of the behavior of iron penetration depth can be found in iron large magnetic permeability compared with the platinum metal, 6.3 × 10 and 1.26 × 10 H/m, respectively. As it will be later developed, due to the large value of magnetic permeability, iron metal presented a much shorter skin depth than platinum, which affected negatively the uniformity that could be achieved by Joule heating due to electrical current. Therefore, iron metal gas will have a much less uniform radial density distribution, and as the penetration depth here presented was averaged over all the gas volume, its values varied in function of the charging voltage.
Platinum attenuation results are shown in Figure 10, and there are significant differences with the iron case. An obvious one is the reached length for the expansion radius, as maximum radius for the iron wires was around 7 cm, meanwhile for the platinum the magnitude it was approximately 2.8 cm. Such a difference is due to the much higher values for the platinum enthalpy of vaporization, which implies that the same amount of energy produced colder gas, and less mass than for the iron. In addition, due to the smaller value of platinum magnetic permeability, produced gas phase was more homogeneous across all energies. The fact that platinum penetration depth data were less dispersed than iron confirms that. Penetration depth depended on the gas density and temperature, which in metal gases here produced, depended strongly on the total initial energy. As platinum metal had less gas and was more homogeneously distributed, gas density and temperature changed less with charging voltages, and so did its penetration depth.
Our measurements show a marked dependence on the material, as for the iron oscillated between a maximum of approx. 15 cm and minimum of less than 5 cm after the squared radius reach 10 cm, meanwhile for the platinum these values were lower, as the measured interval was between 10 and 5 cm, except for some points at the maximum voltage. In addition, the dependence with radius and energy of the penetration depth was different for each metal. Iron started its penetration depth values with a minimum value, that increased with radial expansion, therefore following the energy absorbed by the metal. On the contrary, with platinum, penetration depth reached its largest values within the smaller radius. In addition, it is when the radius was smaller than platinum data dispersion was larger.
As penetration depth depends on the energy, it is more frequent to present their values as a function of this parameter, rather than one dimension of the gas occupied volume. In addition, for practical reasons, inverse of the penetration depth is depicted instead of its direct value. Therefore, a similar strategy has been followed in Figure 11 and Figure 12 for the platinum and iron gases, respectively, where inverse of penetration depth is plotted against energy absorbed by the metal. Due to differences in their attenuation, both graphs use different vertical scales. Platinum values displayed in this way were grouped around a narrow band of energies, except for the case when energy in the charging capacitors reached 20 kV. Then, as the energy of the metal gas increased, penetration depth values reached a plateau around 0.12 cm, but with a large spreading of the data, as the lower average values indicated.
A totally different situation presents the data of iron, given in Figure 12, where a large variation for their penetration depth values within a small interval of absorbed energies is visible. Due to the commented large dispersion of the data, at small quantities of the inverse penetration depth, its averaged curve exhibited a deviation to larger energies. A similar behavior was observed for the platinum data, where average inverse penetration depths for small absorbed energy values presented a tendency towards large values.
The fact that penetration depths of both metals showed a large variation within a narrow absorbed energy is counterintuitive: as energy of a gas is directly related to the density of the gas, as mentioned before, it is expected that small changes in the absorbed energy will be followed by small differences on the penetration depth. Then a different dependence of the penetration depth with the energy could be expected. This apparent contradiction rests in the fact that not all the absorbed energy was used into the conversion of wire mass into gas. An observed steep decline in the penetration depth with respect to the absorbed energy implies that metal gases obtained with this experimental method had a rather large dispersion in their density values, as large changes in this parameter were reflected directly in the penetration depths.
This steep decline is not present when the penetration depths are represented respect the radial expansion values, that show a more intuitive behavior of large variations linked to radial expansion, as it was commented a few paragraphs before, because the radial expansion of the gas followed more closely the gas density than its absorbed energy.
Finally, it is worth remarking that in the measurements of penetration depths for iron and platinum gas metals here presented, the main component of the interaction cross section is due to elastic dispersion, rather than inelastic processes, although their presence should be more important as the metal gas energy increased. In any case, at 532 nm of light wavelength inelastic processes were negligible. Again, notice that as gas density, n, and dispersion were not really constant due to the inhomogeneities of the metal gases, penetration depth values could not be linear with the radius. In fact, departures from the linear tendency in Figure 9 and Figure 10 were indicative of differences in the density and cross section with time, and a proxy of its variations with energy. Such a topic is worth exploring, but currently out of the scope of this work.
5. Conclusions
By using an exploding wire setup, and after careful adapting the experimental conditions, platinum and iron metal gases had been produced in a manner that allowed for the first experimental measurements of their optical penetration depths at the wavelength of 532 nm. Differences on the obtained data for both metals are clear, both in values of the attenuation depths and their dependence with radius and energy. Iron has a more marked dependence on the energy absorbed by the wire mass, here attributed to the density inhomogeneities of the metal gas produced, being larger for iron due to its magnetic permeability, that produces a much smaller skin depth for the electromagnetic waves in iron, leading therefore to different regions of the wire in its transformation from solid to gas phases. Conversely, as platinum skin depth is much larger, heating is also homogeneously distributed along the radius, generating a more uniform penetration depth values. Platinum penetration depth reaches a plateau value between 0.075 and 0.1 cm, meanwhile iron data do not present a plateau, but a steep, almost vertical, attenuation from 0.1 to 1.0 cm. This new way of measure the penetration depth values for metal gases can be extended to other metals, and it is planned to do so in future works.
Concerning the nature of the metal gases here probed, if they are monoatomic, molecular or other gas aggregated types, it is very difficult from our measurements to provide a straight answer. Nevertheless, previous experiments with the objective of provide limits to the resistivity of metal gases [4] use successfully the hypothesis of metal monoatomic gas. In addition, conditions to obtain different gas aggregates are far away from the ones presented in our experiments, fully compatible with monoatomic gas.
Author Contributions
Conceptualization, G.R.P. and L.B.; formal analysis, L.B.; investigation, G.R.P.; methodology, G.R.P., L.B.; software, L.B.; validation, G.R.P., L.B.; visualization, G.R.P., L.B.; writing—original draft, G.R.P., L.B.; writing—review and editing, G.R.P., L.B. All authors have read and agreed to the published version of the manuscript.
Funding
This research was funded by Ministerio de Ciencia, Innovación y Universidades of Spain grant number ENE2016-75703-R, named “MATERIA CON ALTA DENSIDAD DE ENERGIA EN FUSION POR CONFINAMIENTO INERCIAL”, and Junta de Comunidades de Castilla-la Mancha grant number SBPLY/17/180501/000264 named “HIDRODINAMICA DE LA MATERIA CON ALTA DENSIDAD DE ENERGIA”.
Acknowledgments
Authors would like to thank Roberto Piriz for the comments and suggestions on this work.
Conflicts of Interest
The authors declare no conflict of interest. The funders had no role in the design of the study; in the collection, analyses, or interpretation of data; in the writing of the manuscript, or in the decision to publish the results
References
- Faraday, M. The bakerian lecture: On the relations of gold and other metals to light. Proc. R. Soc. Lond. 1856, 8, 356–361. [Google Scholar]
- Knudson, M.D.; Desjarlais, M.P.; Becker, A.; Lemke, R.W.; Cochrane, K.R.; Savage, M.E.; Bliss, D.E.; Mattsson, T.R.; Redmer, R. Direct observation of an abrupt insulator-to-metal transition in dense liquid deuterium. Science 2015, 348, 1455–1460. [Google Scholar] [CrossRef]
- Liverts, M.; Ram, O.; Sadot, O.; Apazidis, N.; Ben-Dor, G. Mitigation of exploding-wire-generated blast-waves by aqueous foam. Phys. Fluids 2015, 27, 076103. [Google Scholar] [CrossRef]
- Bilbao, L.; Prieto, G.R. Experimental determination of the resistivity limits for platinum and iron metal gases using an exploding wire. Metals 2020, 10, 424. [Google Scholar] [CrossRef] [Green Version]
- Brock, T.D. Calculation solar irradiation for ecological studies. Ecol. Model. 1981, 14, 1–19. [Google Scholar] [CrossRef]
- Polo, J.; Ballestrín, J.; Carra, E. Sensitivity study for modelling atmospheric attenuation of solar radiation with radiative transfer models and the impact in solar tower plant production. Sol. Energy 2016, 134, 219–227. [Google Scholar] [CrossRef]
- Idso, B.S. Atmospheric attenuation of solar radiation. J. Atmos. Sci. 1969, 26, 1088–1095. [Google Scholar] [CrossRef]
- Meyerott, R.E.; Sokoloff, J.; Nicholls, R.W. Absorption coefficients of air. Geophys. Res. Pap. 1960, 60, 68. [Google Scholar]
- Romanov, G.S.; Stankevich, Y.A.; Stanchits, L.K.; Stepanov, K.L. Thermodynamic and optical properties of gases in a wide range of parameters. Int. J. Heat Mass Transf. 1995, 38, 545–556. [Google Scholar] [CrossRef]
- Bogatyreva, N.; Bartlova, M.; Aubrecht, V. Mean absorption coeficients of air plasmas. J. Phys. Conf. Ser. 2009, 275, 012009. [Google Scholar] [CrossRef]
- Scheuer, P.A.G. The absorption coefficient of a plasma at radio frequencies. Mon. Not. R. Astron. Soc. 1960, 120, 231–241. [Google Scholar] [CrossRef] [Green Version]
- Dawson, J.; Oberman, C. High frequency conductivity and the emission and absorption coefficients of a fully ionized plasma. Phys. Fluids 1962, 5, 517–524. [Google Scholar] [CrossRef]
- Bailey, J.E.; Nagayama, T.; Loisel, G.P.; Rochau, G.A.; Blancard, C.; Colgan, J.; Cosse, P.; Faussurier, G.; Fontes, C.J.; Gilleron, F.; et al. A higher-than-predicted measurement of iron opacity at solar interior temperatures. Nature 2015, 517, 56–59. [Google Scholar] [CrossRef] [PubMed]
- Fontes, C.J.; Fryer, C.L.; Hungerford, A.L.; Hakel, P.; Colgan, J.; Kilcrease, D.P.; Sherrill, M.E. Relativistic opacities for astrophysical applications. High Energy Density Phys. 2015, 16, 53–59. [Google Scholar] [CrossRef] [Green Version]
- Iglesias, C.A. Iron-group opacities for b stars. Mon. Not. R. Astron. Soc. 2015, 450, 2–9. [Google Scholar] [CrossRef]
- Anderson, J.A. The spectral energy distribution and opacity of wire explosion vapors. Proc. Natl. Acad. Sci. USA 1922, 8, 231–232. [Google Scholar] [CrossRef] [Green Version]
- Nash, C.P.; McMillan, W.G. On the mechanism of exploding wires. Phys. Fluids 1961, 4, 911–917. [Google Scholar] [CrossRef]
- Thomas, R.J.; Hearst, J.R. An electronic scheme for measuring exploding wire energy. Instrum. Meas. IEEE Trans. 1967, 16, 51–62. [Google Scholar] [CrossRef]
- Sinars, D.B.; Shelkovenko, T.A.; Pikuz, S.A.; Hu, M.; Romanova, V.M.; Chandler, K.M.; Greenly, J.B.; Hammer, D.A.; Kusse, B.R. The effect of insulating coatings on exploding wire plasma formation. Phys. Plasmas 2000, 7, 429–432. [Google Scholar] [CrossRef]
- Tkachenko, S.I.; Mingaleev, A.R.; Romanova, V.M.; Ter-Oganes‘yan, A.E.; Shelkovenko, T.A.; Pikuz, S.A. Distribution of matter in the current—Carrying plasma and dense core of the discharge channel formed upon electrical wire explosion. Plasma Phys. Rep. 2009, 35, 798–818. [Google Scholar] [CrossRef]
- Sarkisov, G.S.; Struve, K.W.; McDaniel, D.H. Effect of current rate on energy deposition into exploding metal wires in vacuum. Phys. Plasmas 2004, 11, 4573. [Google Scholar] [CrossRef]
- Oreshkin, V.I.; Baksht, R.B. Wire explosion in vacuum. IEEE Trans. Plasma Sci. 2020, 48, 1214–1248. [Google Scholar] [CrossRef]
- Prieto, G.R.; Bilbao, L.; Milanese, M.M. Dynamics of a shock wave with time dependent energy release generated by an exploding wire in air. Phys. Plasmas 2018, 25, 112113. [Google Scholar] [CrossRef]
Figure 1.
(Color online) experimental setup. PH1 signals the photodiode, C the capacitors bank, the lumped inductance, 142 nHr, and the resistance; both of the whole setup circuit.
Figure 1.
(Color online) experimental setup. PH1 signals the photodiode, C the capacitors bank, the lumped inductance, 142 nHr, and the resistance; both of the whole setup circuit.
Figure 2.
(Color online) typical current signal for these experiments. Insert on the lower left part is a false color streak image at the same time scale. Notice how the initial current instead of expanding a gas, creates it, so in the streak no large expansion is observed.
Figure 2.
(Color online) typical current signal for these experiments. Insert on the lower left part is a false color streak image at the same time scale. Notice how the initial current instead of expanding a gas, creates it, so in the streak no large expansion is observed.
Figure 3.
(Color online) optical configuration of the streak camera and CW laser illumination system. (1) CW 532 nm laser head, (2) beam expander X10, (3) two lenses combination, (4) exploding wire and (5) streak camera and objective.
Figure 3.
(Color online) optical configuration of the streak camera and CW laser illumination system. (1) CW 532 nm laser head, (2) beam expander X10, (3) two lenses combination, (4) exploding wire and (5) streak camera and objective.

Figure 4.
(Color online) typical platinum streak images at (a) 10 kV, (b) 15 kV and (c) 20 kV of charging voltage in the capacitors bank. Notice the different times scale in the last case. Space (vertical dimension) scale is the same in all the images.
Figure 4.
(Color online) typical platinum streak images at (a) 10 kV, (b) 15 kV and (c) 20 kV of charging voltage in the capacitors bank. Notice the different times scale in the last case. Space (vertical dimension) scale is the same in all the images.
Figure 5.
(Color online) typical iron streak images at (a) 10 kV, (b) 15 kV and (c) 20 kV of charging voltage in the capacitors bank. Notice the different scales.
Figure 5.
(Color online) typical iron streak images at (a) 10 kV, (b) 15 kV and (c) 20 kV of charging voltage in the capacitors bank. Notice the different scales.
Figure 6.
(Color online) streak image from an iron experiment with 10 kV in the capacitors bank. Inset shows the border between the shock wave and metal gas increase at the end of its live.
Figure 6.
(Color online) streak image from an iron experiment with 10 kV in the capacitors bank. Inset shows the border between the shock wave and metal gas increase at the end of its live.

Figure 7.
(Color online) streak image from an iron experiment with 15 kV in the capacitors bank. Superimposed graph shows the intensity traces at the approximate positions marked by the arrows. There are differences not only in width, but also in attenuation, with the latter getting larger as the metal gas expands and absorb more electrical energy from the capacitors.
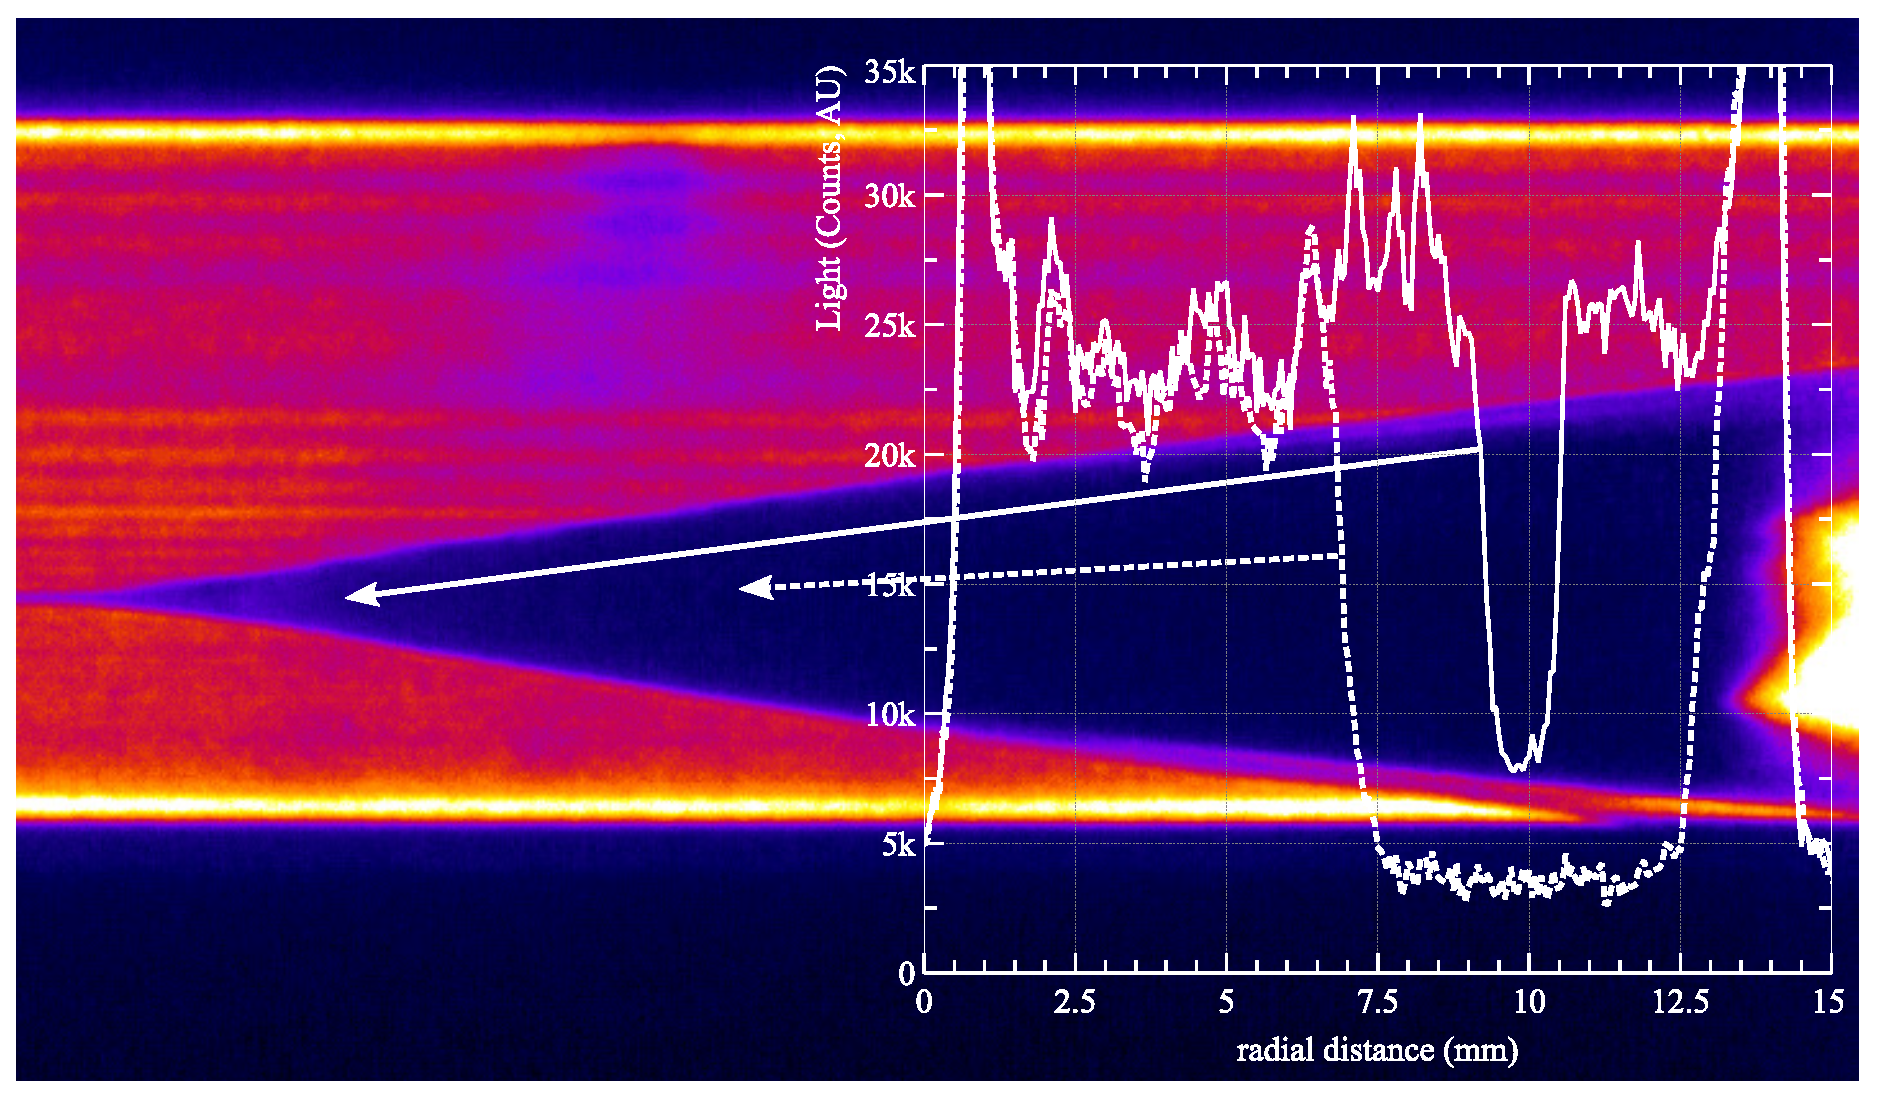
Figure 8.
(Color online) energy absorbed (– –), voltage(- -), and current(—) flowing through an iron wire when charging voltage was 20 kV.
Figure 8.
(Color online) energy absorbed (– –), voltage(- -), and current(—) flowing through an iron wire when charging voltage was 20 kV.

Figure 9.
(Color online) iron metal gas penetration depth aggregated by the charging voltages on the capacitors bank as function of the expansion radius squared.
Figure 9.
(Color online) iron metal gas penetration depth aggregated by the charging voltages on the capacitors bank as function of the expansion radius squared.
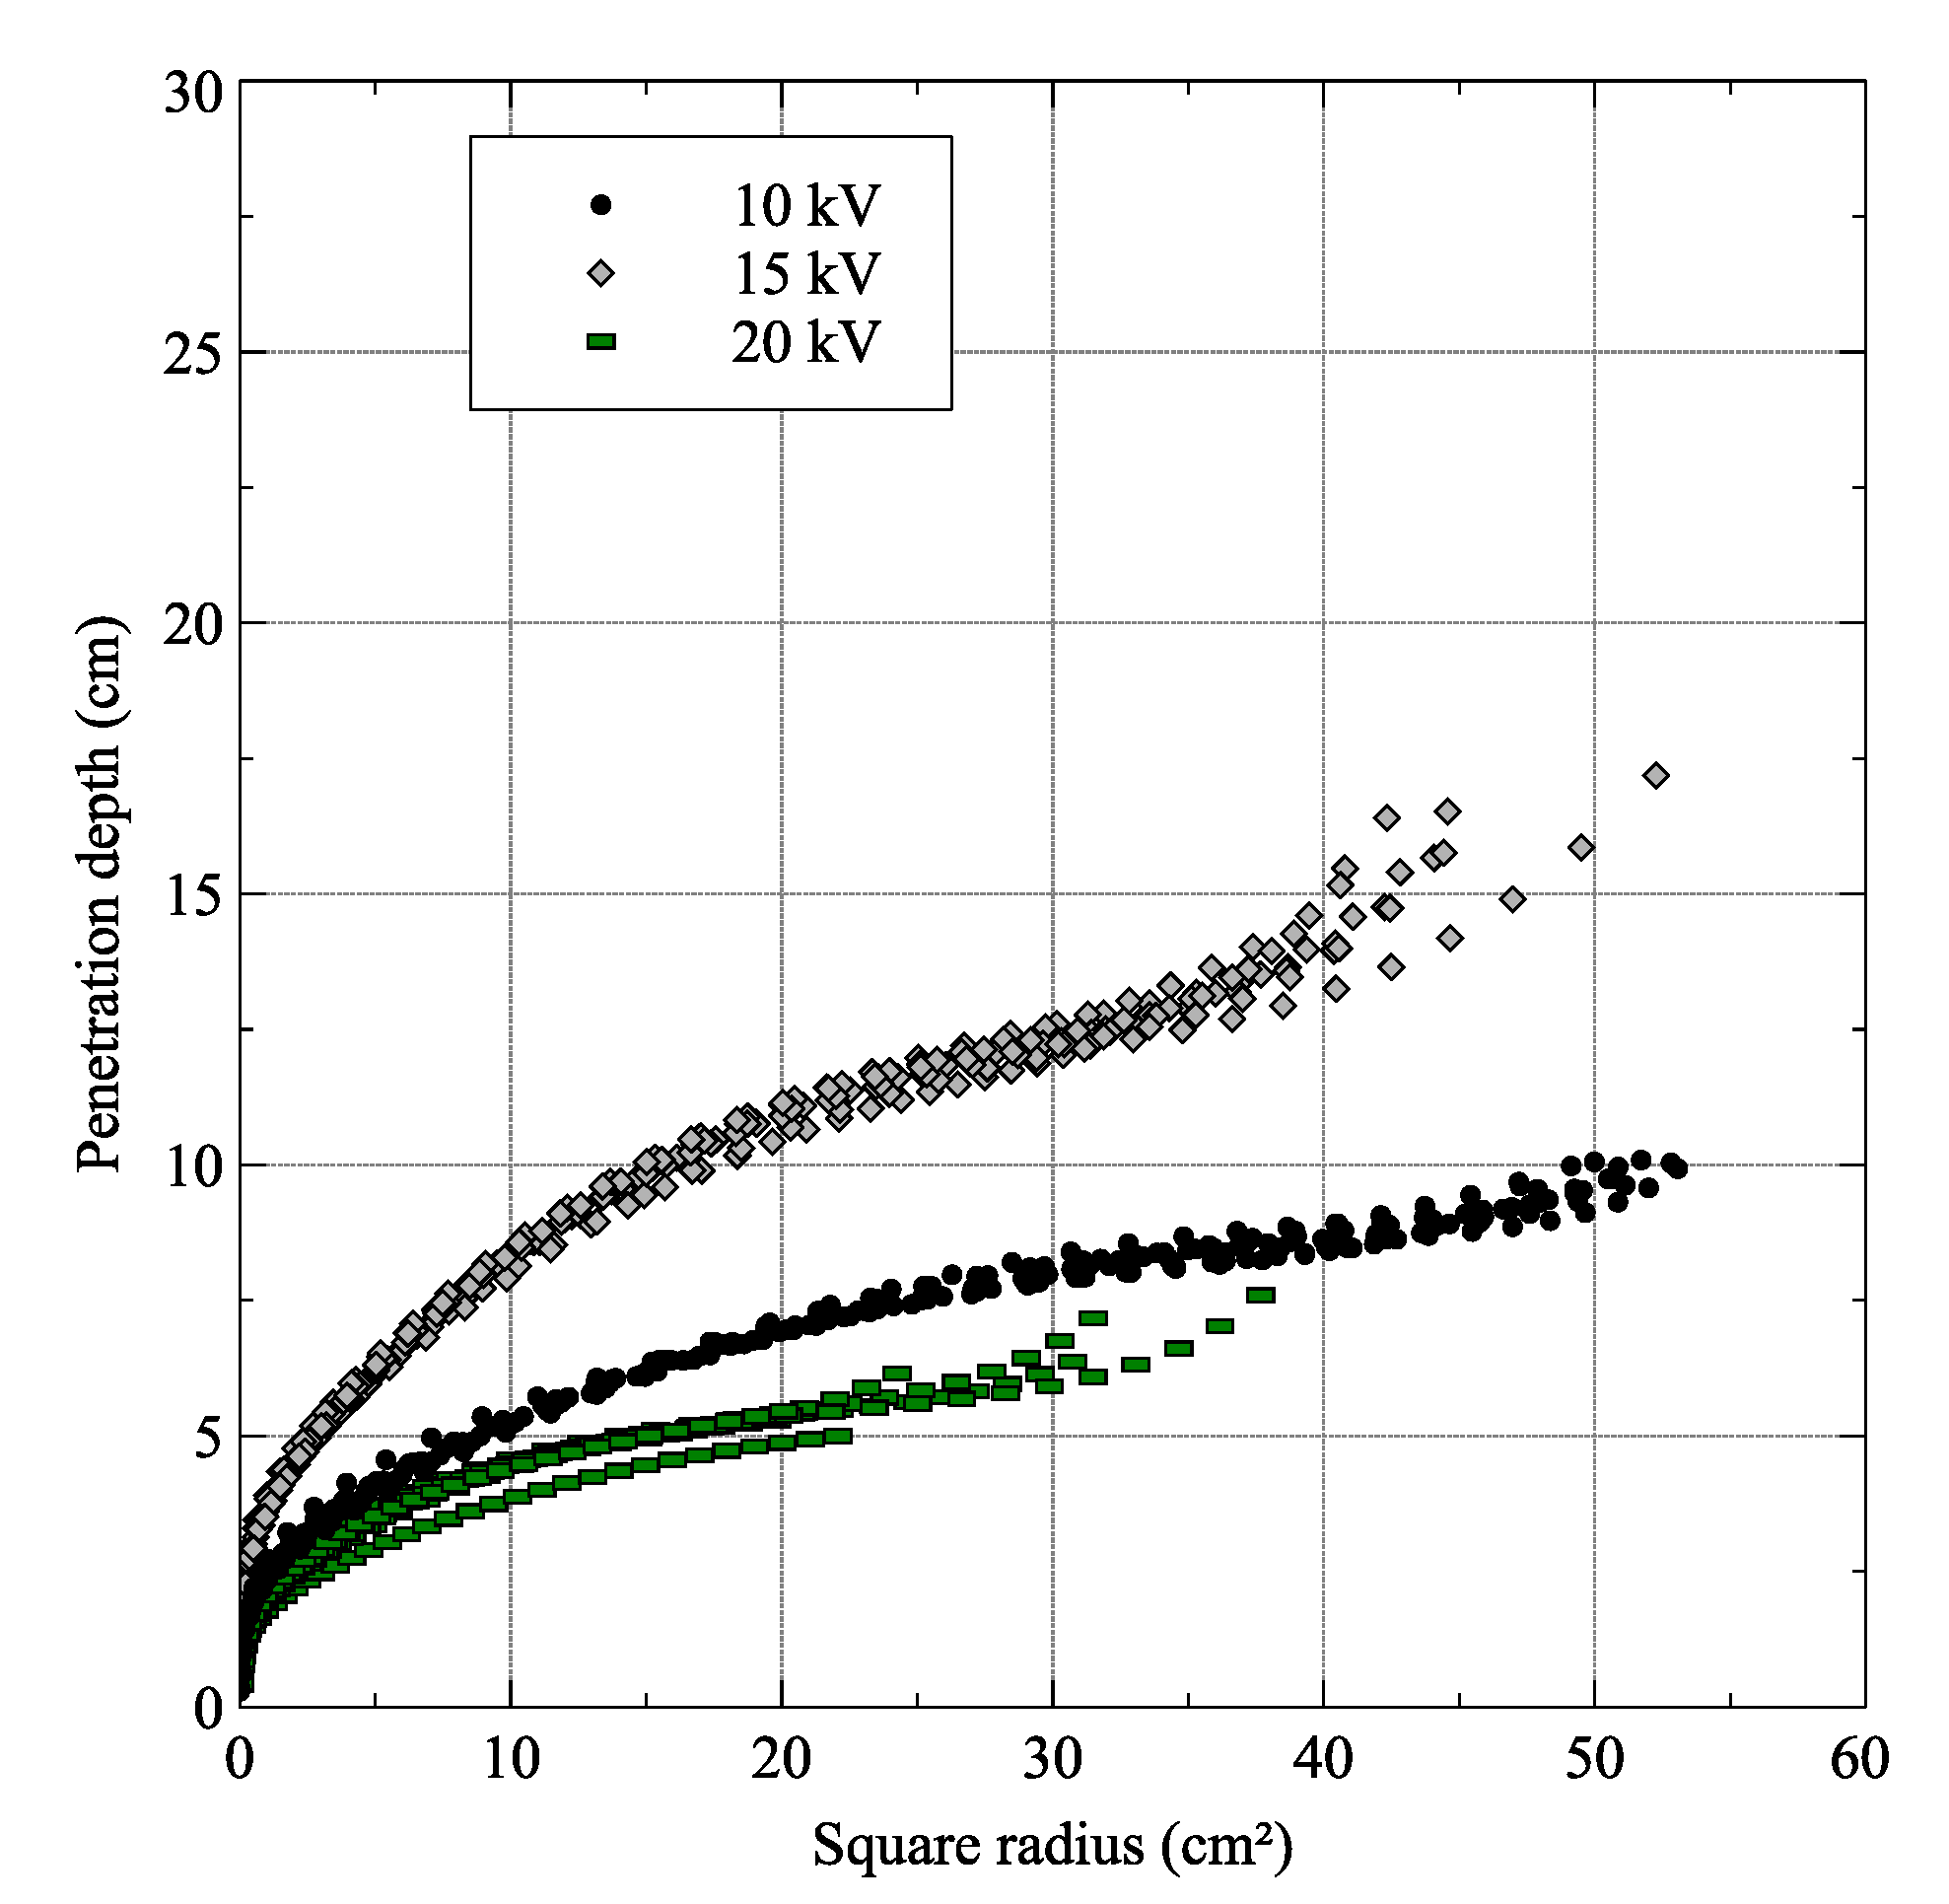
Figure 10.
(Color online) penetration depth of platinum metal gas, also aggregated by charging voltages.
Figure 10.
(Color online) penetration depth of platinum metal gas, also aggregated by charging voltages.
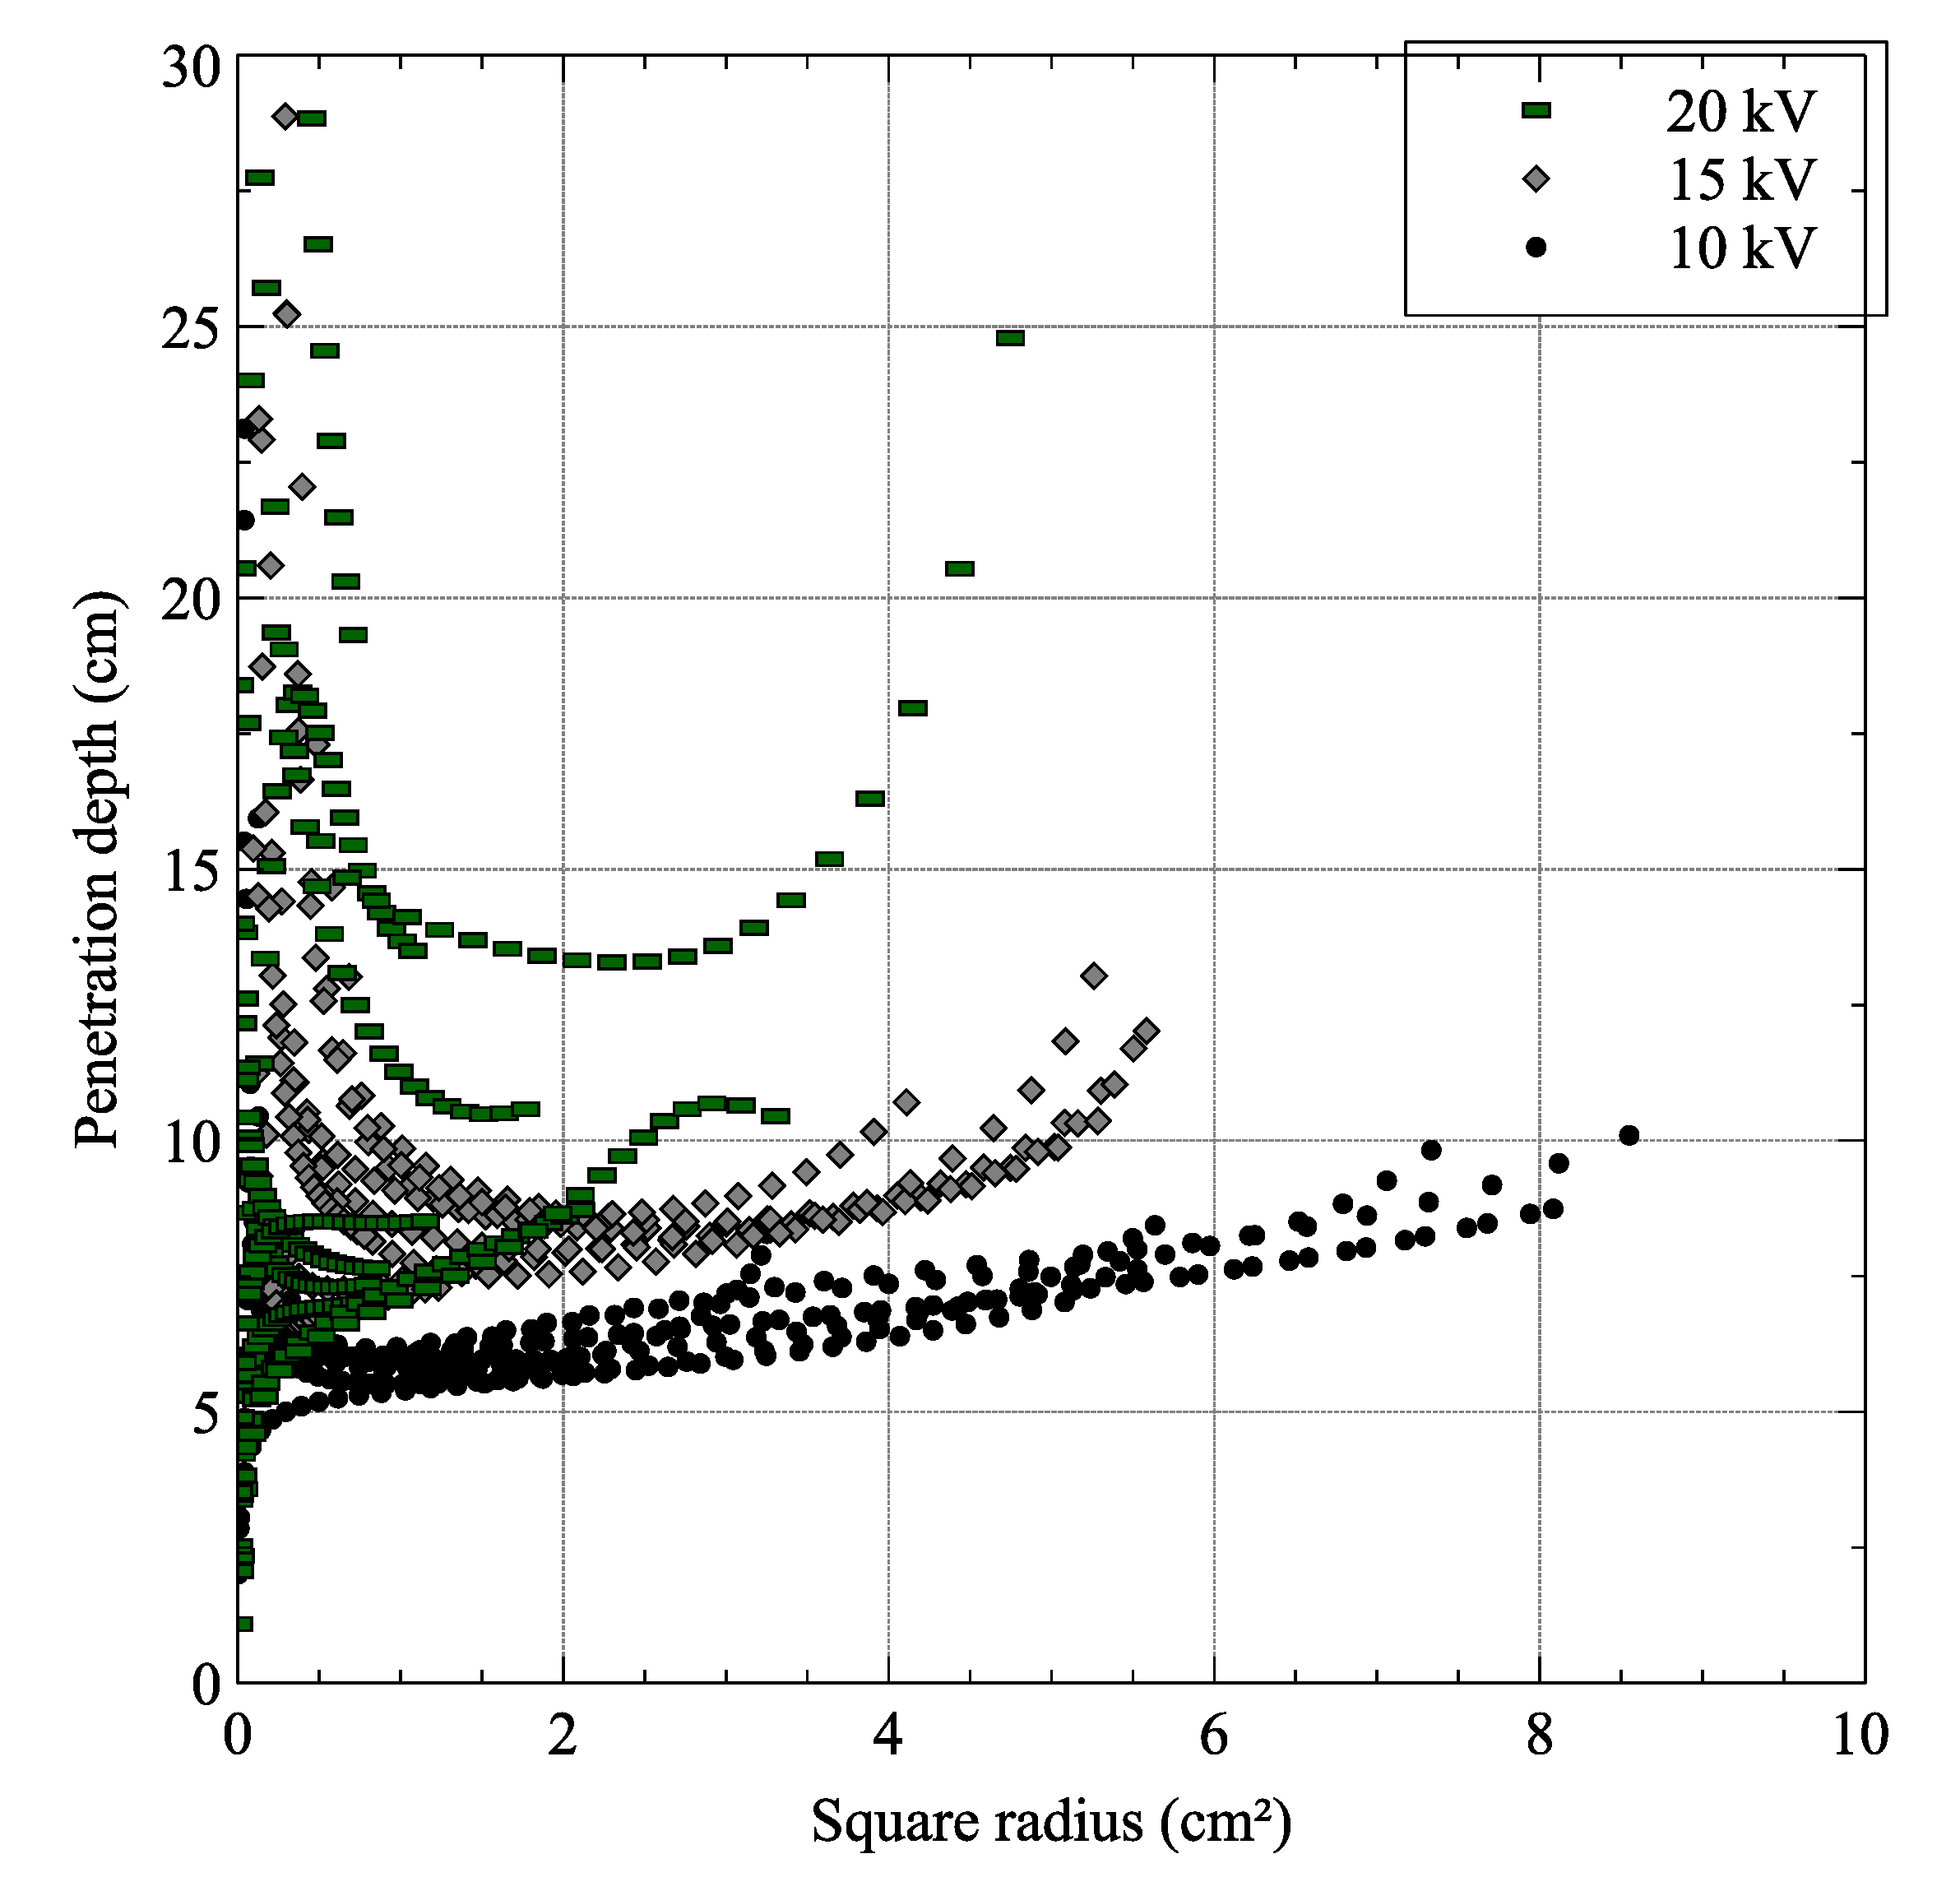
Figure 11.
(Color online) penetration of platinum metal gas as a function of the metal absorbed energy. Average values are shown as a guide to the eye.
Figure 11.
(Color online) penetration of platinum metal gas as a function of the metal absorbed energy. Average values are shown as a guide to the eye.
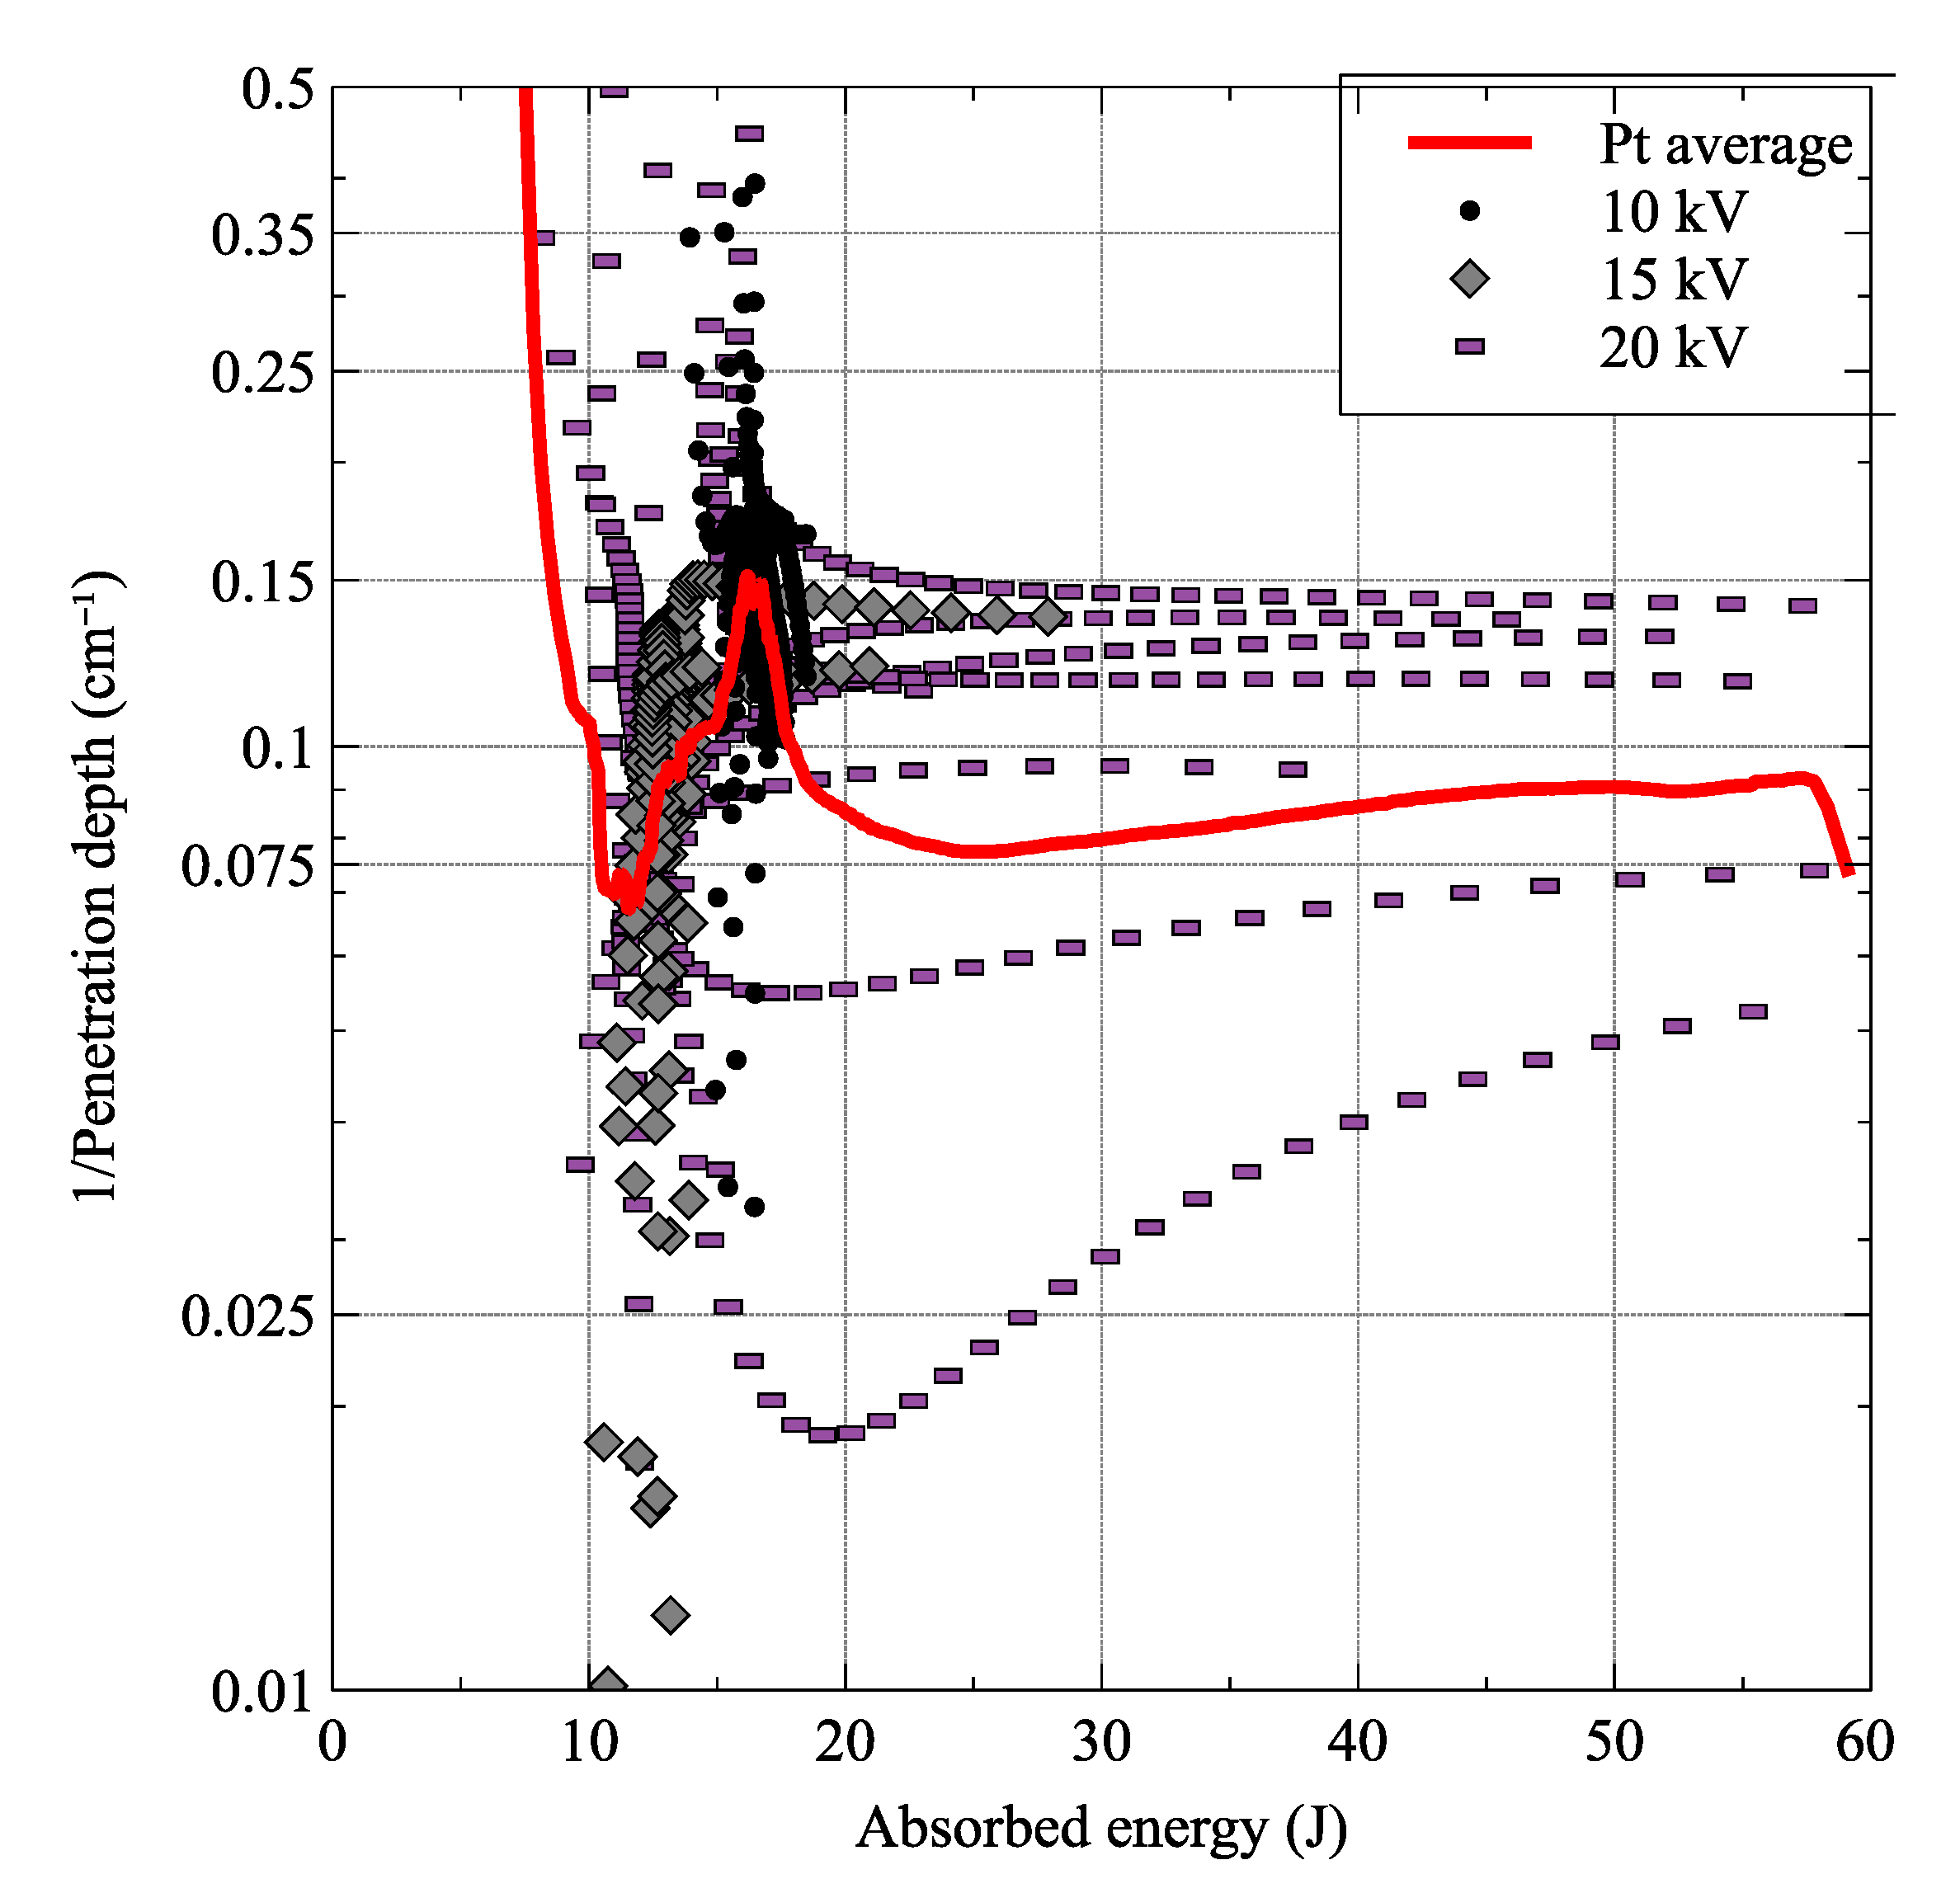
Figure 12.
(Color online) iron metal gas penetration depth depending on the absorbing energy. As in the platinum case, the average of all the available data is shown.
Figure 12.
(Color online) iron metal gas penetration depth depending on the absorbing energy. As in the platinum case, the average of all the available data is shown.
Publisher’s Note: MDPI stays neutral with regard to jurisdictional claims in published maps and institutional affiliations. |
© 2020 by the authors. Licensee MDPI, Basel, Switzerland. This article is an open access article distributed under the terms and conditions of the Creative Commons Attribution (CC BY) license (http://creativecommons.org/licenses/by/4.0/).
Share and Cite
MDPI and ACS Style
Rodríguez Prieto, G.; Bilbao, L. First Experimental Values for the Light Penetration Depth of Platinum and Iron Gases at 532 nm. Metals 2020, 10, 1382. https://doi.org/10.3390/met10101382
AMA Style
Rodríguez Prieto G, Bilbao L. First Experimental Values for the Light Penetration Depth of Platinum and Iron Gases at 532 nm. Metals. 2020; 10(10):1382. https://doi.org/10.3390/met10101382
Chicago/Turabian StyleRodríguez Prieto, Gonzalo, and Luis Bilbao. 2020. "First Experimental Values for the Light Penetration Depth of Platinum and Iron Gases at 532 nm" Metals 10, no. 10: 1382. https://doi.org/10.3390/met10101382
Note that from the first issue of 2016, this journal uses article numbers instead of page numbers. See further details here.