Article

Devitrification of Zr55Cu30Al15Ni5Bulk Metallic Glass under Heating and HPT Deformation

1
Institute of Solid State Physics RAS, 142432 Chernogolovka, Russia
2
Ufa State Aviation Technical University, 12 K. Marx str., 450008 Ufa, Russia
3
Institute of Molecule and Crystal Physics, Ufa Federal Research Center RAS, P. October 151 Ufa, Russia
4
National Research University Higher School of Economics, 101000 Moscow, Russia
*
Author to whom correspondence should be addressed.
Metals 2020, 10(10), 1329; https://doi.org/10.3390/met10101329
Submission received: 9 September 2020 / Revised: 1 October 2020 / Accepted: 2 October 2020 / Published: 5 October 2020
(This article belongs to the Special Issue Recent Advancements in Metallic Glasses)

Abstract

:
The nanocrystal formation in Zr55Cu30Al15Ni5 bulk metallic glass was studied under heat treatment and deformation. The activation energy of crystallization under heating is 278 kJ/mol. Different crystalline phases were found to be formed during crystallization under heating and deformation. At the first crystallization stage, the metastable phase with a hexagonal structure (lattice of space group P63/mmc with the parameters a = 8.66 Å, c = 14.99 Å) is formed under heat treatment. When the temperature rises, the metastable phase decays with the formation of stable crystalline phases. The crystalline Zr2Cu phase with the lattice of space group Fd3m is formed during crystallization under the action of deformation. It was determined that during deformation nanocrystals are formed primarily in the subsurface regions of the samples.

Graphical Abstract

1. Introduction

The first metallic glass was produced in 1960 [1]. Since this moment, these materials have been provoking great interest as both non-crystalline metallic materials and the basis for the creation of composite amorphous-nanocrystalline materials. A special group of metallic glasses is bulk amorphous alloys, many of which have good mechanical properties. Among these alloys are high-strength Zr-based bulk amorphous alloys, which, in particular, can be used for medical applications such as struts for cardiovascular stents [2,3]. Zr-based bulk alloys were studied in a number of works [4,5,6]. The processes of crystallization of Zr-based bulk amorphous alloys were investigated mainly under heat treatment. At an initial stage of the devitrification of these alloys, the formation of metastable crystalline [7,8] and quasi-crystalline [9,10] phases was observed. Under heating or annealing, after the completion of the first crystallization stage alloys have an amorphous-nanocrystalline structure, with the fraction of the crystalline phase depending on heat treatment conditions. Another method of impact on the structure of bulk metallic glasses is severe plastic deformation. One of its main methods is high-pressure torsion. This action also leads to crystal formation in the amorphous phase, with crystal formation starting in the regions of plastic deformation localization, i.e., shear bands or their vicinity. Crystal formation in the places of plastic deformation localization is caused by an increase in the free volume fraction and, correspondingly, by enhanced values of diffusion coefficients in these regions [11,12,13]. The fraction of the nanocrystalline phase under plastic deformation also depends on treatment conditions, i.e., the value of applied pressure, the rate, duration, and temperature of deformation. In turn, the properties of a produced material depend on the formed structure and the fraction of the crystalline phase. Plastic deformation is realized by the formation and propagation of shear bands. At that stage, nanocrystals being present in the structure can have an inhibitory action on the propagation of the bands [14].
In some studies of the processes of metallic glass crystallization, it was shown that the structure formed under crystallization depends significantly on the conditions of production of an amorphous alloy [15], as well as on the conditions of treatments (heat or deformation ones) of the amorphous structure both in the limit of an amorphous state and at early crystallization stages [15,16]. However, despite active studies of the processes of the devitrification of Zr-based alloys, treatment parameters necessary for the formation of an amorphous-nanocrystalline structure remain unknown. Therefore, the present work aims at carrying out a comparative study of devitrification processes of Zr55Cu30Al15Ni5 bulk alloy under heat treatment and deformation.

2. Materials and Methods

The samples of Zr55Cu30Al15Ni5 amorphous alloy were produced by melting and quenching into a copper mold. They were rods with a diameter of 8 mm. The thermal analysis of the alloy was performed by differential scanning calorimetry (DSC) (Perkin-Elmer DSC-7). The Zr55Cu30Al15Ni5 bulk amorphous alloy was heated to the preset temperatures (up to 848 K), then cooled to room temperature in the calorimeter with Ar flow. The use of an argon atmosphere avoided oxidation of the sample. The heating rates (β) were 5, 10, 20, and 40 K/min. The kinetic characteristics of the crystallization reaction were determined by the obtained series of DSC curves. The error in the measurement of activation energy (Ea) and temperature was 1.9 kJ/mol and 3 K, respectively.
The samples were deformed by high-pressure torsion (HPT). The samples of an initial alloy were cut into disks with a thickness of 0.5 mm and polished before deformation. They were deformed at a rate of 1 rotation per minute, with deformation at 1, 5, and 10 rotations being used. The deformation was carried out at a pressure of 6 GPa at room temperature. The deformation degree was estimated by the formula:
e =   l n ( 1 + ( φ · r h ) 2 ) 0.5 +   l n ( h 0 h ) )
where: r is the radius of a sample, u is the angle of the punch rotation, h0 is the thickness of an initial sample, h is the thickness of a deformed sample [17]. Thus, e = 4.8, 6.4, 7.1 for 1, 5, and 10 rotations, respectively. The deformation degree was determined for the middle of the sample radius. The diameter of the sample was 8 mm. All the subsequent measurements were performed for a sample region which was in the middle of the deformed sample radius. The deformation of the samples was carried out at room temperature. No oxide layer was found on the surface after deformation. The structural studies were carried out by X-ray diffraction (using Co Kα and Mo Kα radiations), high-resolution transmission electron microscopy (HREM), scanning electron microscopy (SEM), and X-ray microanalysis (EDS). A focused ion beam (FIB) was used to prepare electron microscope foils from certain regions of the deformed samples.

3. Resultsand Discussion

The structure of the samples after the production was amorphous. Figure 1 shows an X-ray diffraction pattern of the alloy. It contains only broad diffuse halos from the amorphous phase. No reflections from the crystalline phases are observed.

3.1. Analysis of Devitrification under Heating

The amorphous alloy crystallizes under heating. DSC curves for the Zr55Cu30Al10Ni5 alloy under investigation are presented in Figure 2. One can see in Figure 2 that the temperatures of phase transitions occurring in the samples depend on the heating rate. The crystallization temperature rises as the heating rate increases. Table 1 provides crystallization temperatures depending on the heating rate.
The feature of the first exothermic peak is its double shape (Figure 2). This thermogram is typical of alloys of Zr-Cu-Al-Ni system. The material remained amorphous under heating below the crystallization temperature: no indication of the presence of phase transitions was observed in the thermograms of the corresponding samples. The temperatures of crystallization start (start of the first crystallization stage) of an initial Zr55Cu30Al10Ni5 alloy are Tx~730 K, 740 K, and 755 K for a heating rate of 5, 10, and 20 K/min, respectively (Table 1).
Based on the analysis of the shift of DSC curves depending on the heating rate, the activation energy of crystallization (Ea) was determined using the Kissinger method. Ea was determined in the temperature range corresponding to the first peak in the curves since this peak corresponds to the process of primary crystallization of this alloy. Figure 3 shows the corresponding Kissinger plot for the determination of the activation energy of Zr55Cu30Al10Ni5 alloys by a series of DSC scans at heating rates of 5, 10, and 20 K/min.
The activation energy of crystallization for the alloy, determined by this plot, was 278 kJ/mol. This value of activation energy agrees with the known values for alloys of similar composition. The activation energy of crystallization for this alloy, determined in other work, is in the range between 230 and 315 kJ/mol [18,19,20,21].
In the temperature range under study, DSC curves have a peak with a complex shape. This peak shape indicates the successive formation of several crystalline phases.
The X-ray diffraction patterns of heated samples are presented in Figure 4. The temperature of 738 K corresponds to the start of the DSC curve peak. The temperature of 750 K is between the peaks forming the peak with a complex shape. It is clear that the complex shape of the peak is related to the successive formation of several crystalline phases. This treatment was performed to produce a sample with a great amount of primary formed phase without a significant amount of the second phase (assuming that only one, not several phases are formed at the first stage).
Curve 1 (black) corresponds to the sample heated in the calorimeter before the start of the first peak (738 K). Curve 2 (blue) corresponds to the sample after the completion of the first peak in the DSC curve. According to the literature [22,23], the metastable phase is formed under crystallization which then transits to the equilibrium Zr2Cu phase. The authors of the works above assumed that the metastable phase has a lattice of the distorted tetragonal Zr2Ni phase with space group I4/mcm.
The analysis of diffraction reflections in Figure 4 showed that under heat treatment of the alloy under study, the metastable phase is formed at the first crystallization stage. Its structure can be described by a hexagonal lattice with space group P63/mmc with the parameters a = 8.66 Å, c = 14.99 Å. When the temperature rises, the metastable phase decays with the formation of stable crystalline phases (Figure 5).
One can see in Figure 5 that additional lines appear along with reflections from the metastable phase, marked with crosses. Besides the partially conserved metastable phase, the observed diffraction pattern indicates the possible presence of the following well-known crystalline phases: Zr2Cu with the lattice of space group I4/mmm with the parameters a = 3.22 Å, c = 11.18 Å, Zr5Al3 with the lattice of space group P63/mmc (a = 8.18 Å, c = 5.70 Å) or I4/mcm (a = 11.04 Å, c = 5.39 Å), or Zr2Al with the lattice of space group I4/mmm (a = 6.853 Å, c = 5.50 Å). At that, a small amount of the amorphous phase remains in the sample, too. All these phases are found in the alloys of the studied system. Since nanocrystals are formed at initial stages of the crystallization of an amorphous structure, broad diffraction lines are present in the X-ray diffraction patterns; in some cases, these lines overlap each other, and the accuracy of determination of phase composition is low at this stage. It is important to note that only one metastable phase is formed at an initial stage of the decay of Zr55Cu30Al15Ni5 bulk amorphous alloy. Consequently, this alloy crystallizes by the primary mechanism.

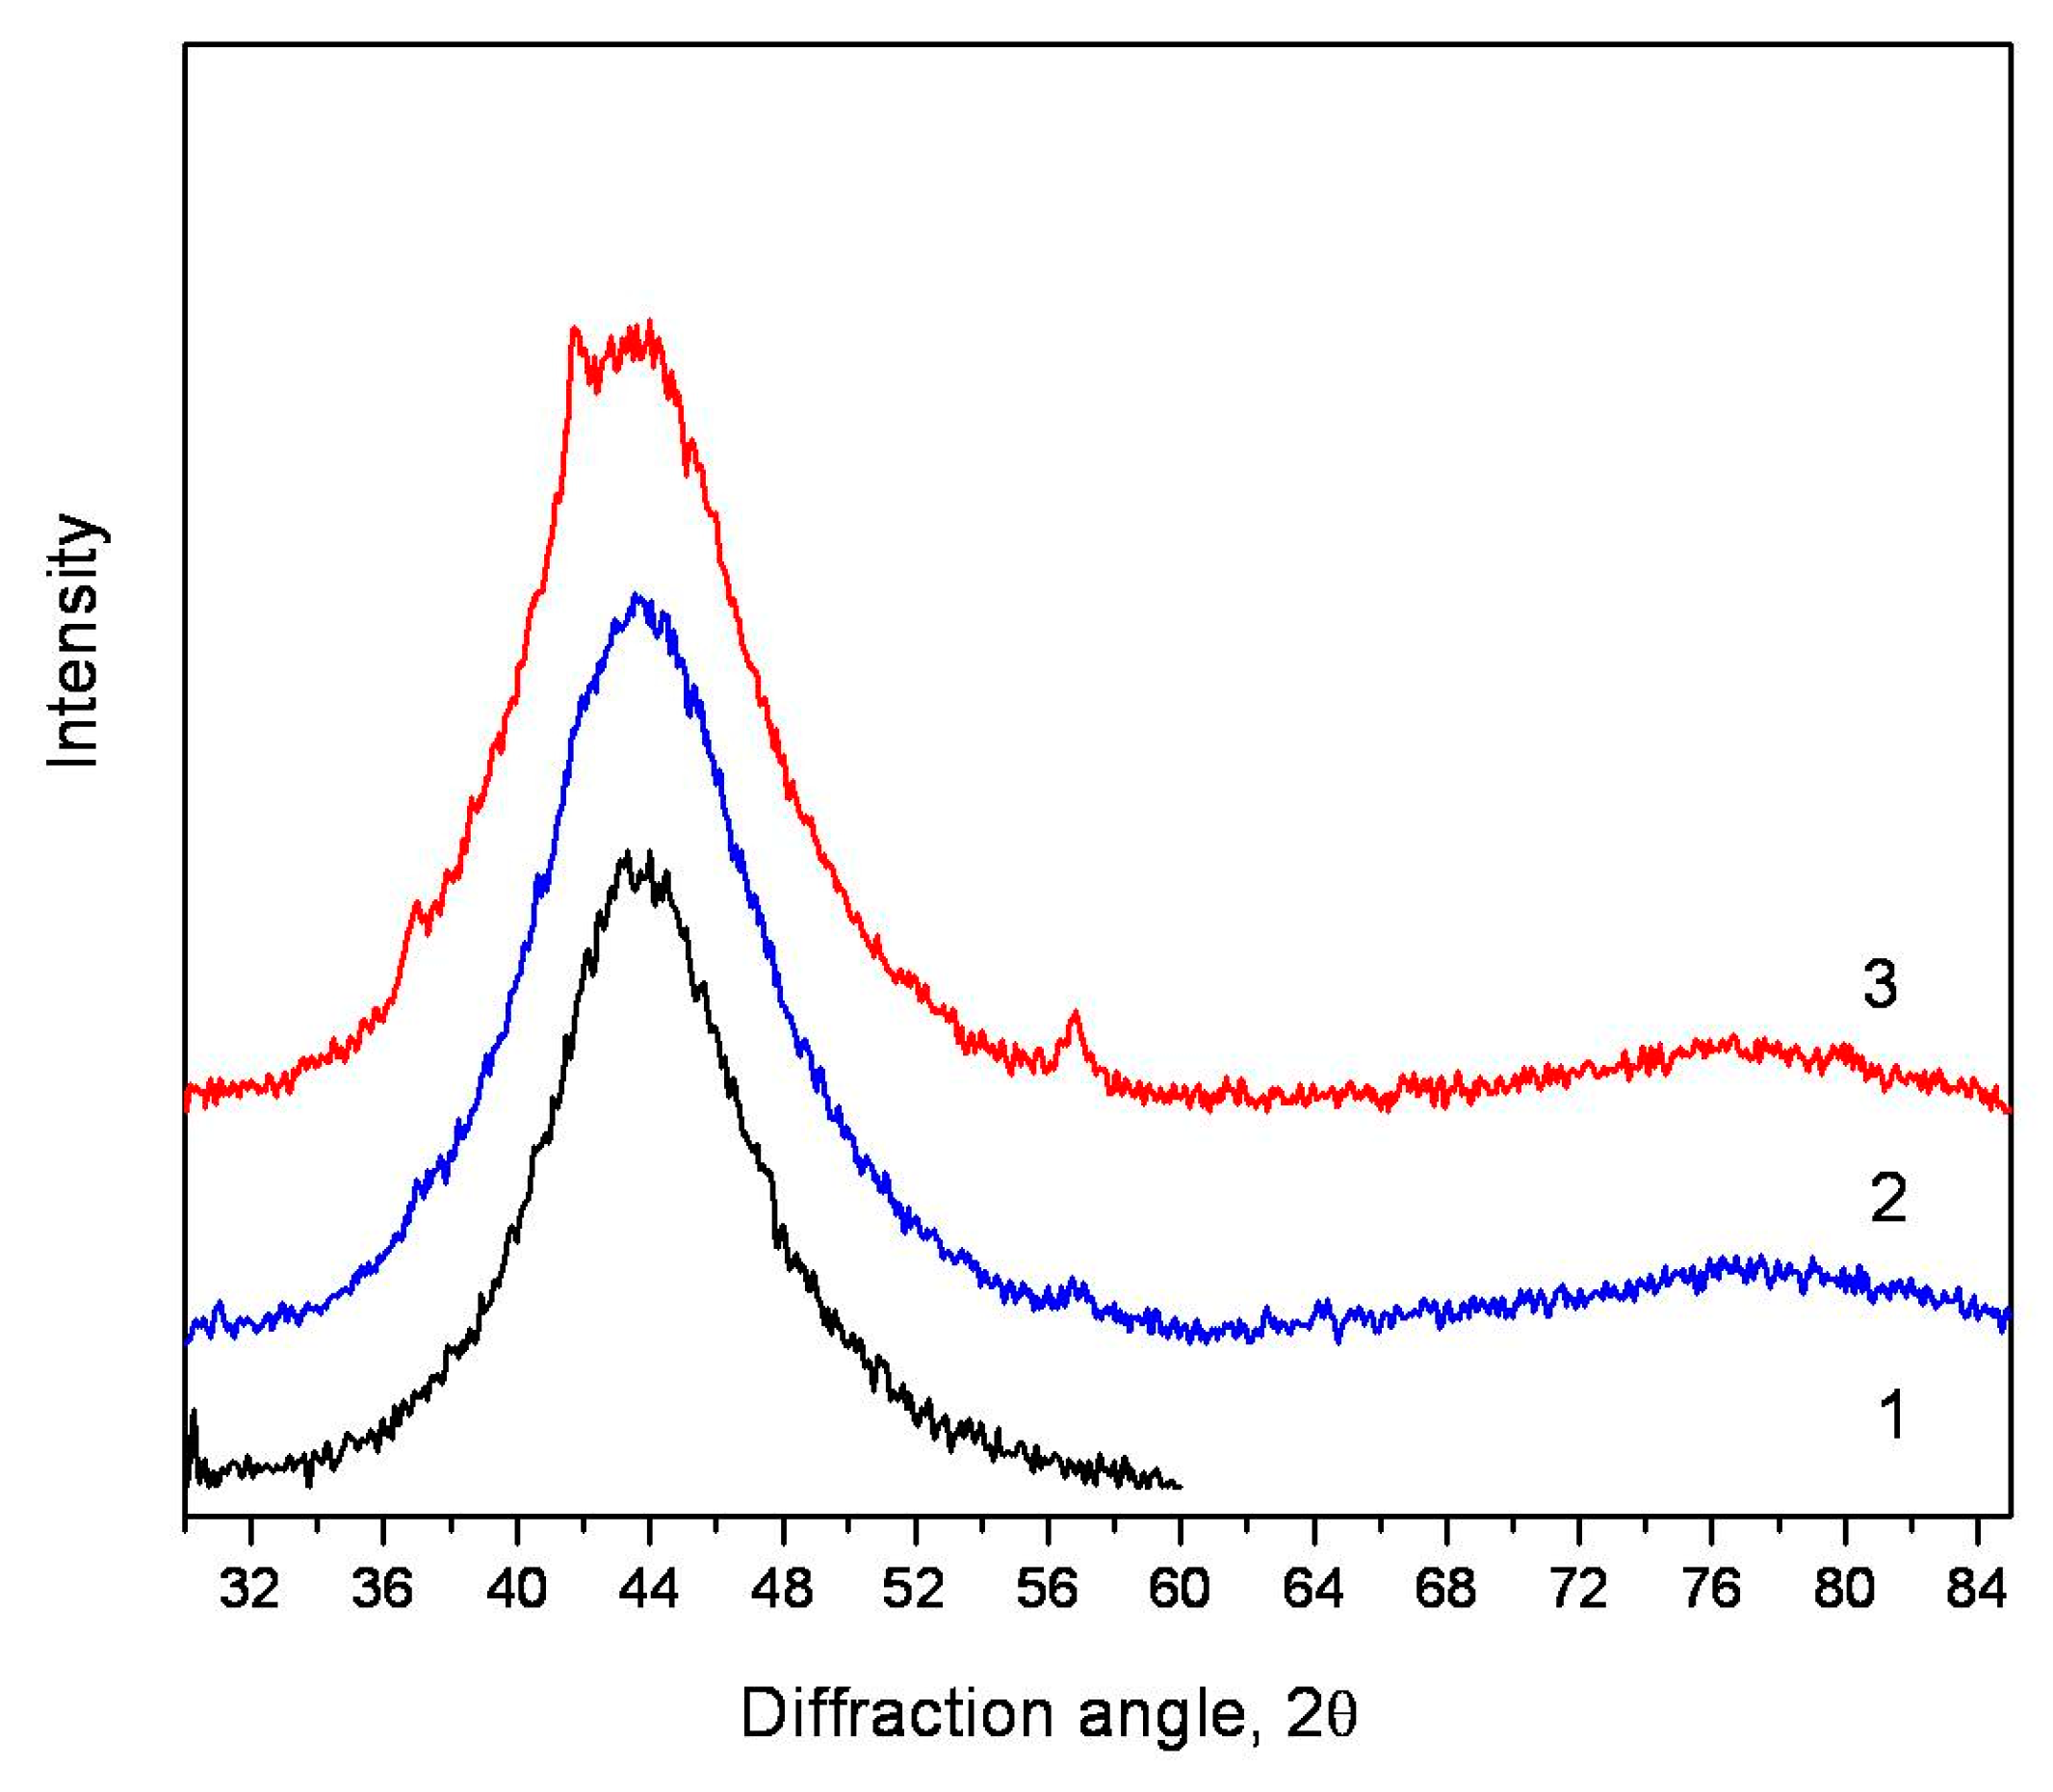
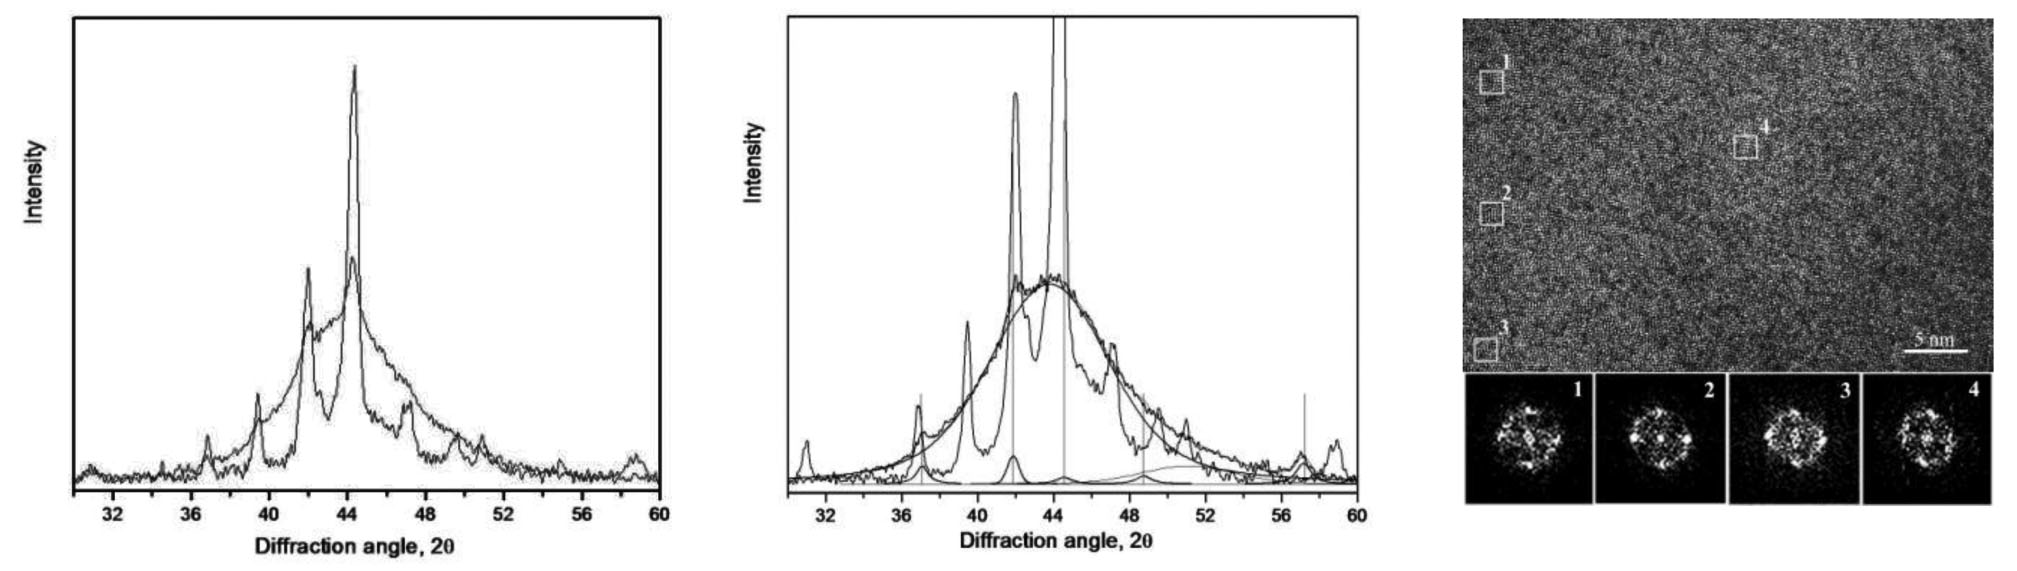
3.2. Crystallization of the Alloy during Deformation

Devitrification of the amorphous phase also occurs under the deformation of the alloy by high-pressure torsion (HPT). The fraction of the crystalline phase increases as the deformation degree increases. Figure 6 demonstrates X-ray diffraction patterns of the alloy after deformation. No crystalline phases are observed in the sample deformed by 4.8 (one rotation). Reflections from the crystalline phases arise in the samples deformed by 6.4 and 7.1. The intensity of reflections from crystals remains low. Figure 7 shows experimental curve (1), diffuse halo from the amorphous phase (3), set of diffraction peaks, and summation curve (2). The observed seven reflections agree well with the known crystalline Zr2Cu phase with the lattice of space group Fd3m.
Thus, the crystalline phases formed under heating and deformation turn out to be different. For comparison, Figure 8 demonstrates X-ray diffraction patterns (the region of the most intense reflections) of the samples after HPT (1) and heating in the calorimeter (2) to 750 K (the temperature corresponding to the completion of the first DSC peak). For illustration purposes, the positions of diffraction reflections from the Zr2Cu phase are marked with vertical lines. One can see in the figure that at an initial crystallization stage the phase compositions of the deformed and heated samples are different. There are some additional reflections (for example, intense lines corresponding to angles of ~31.1, 39.5, 47 degrees, etc.) in the X-ray diffraction pattern; other lines (~36.9, 42 degrees) are shifted.
Note that the formation of different structures under the heating and deformation of the amorphous phase was observed earlier in metallic glasses of an Fe-B system. In amorphous alloys of an Fe-B system of eutectic and hypereutectic compositions, crystallization resulted in the formation of eutectic colonies consisting of α-Fe and Fe3B. If crystallization occurred during deformation, only nanocrystals of α-Fe(Si) solid solution were formed [24].
The peaks corresponding to the crystalline phase, which was formed under deformation, are broad that conforms to nanocrystals. However, the low intensity of these reflections does not allow the correct determination of their size. Since deformation under HPT is non-uniformly distributed over the sample section, one can assume that the crystalline phases are formed primarily in a subsurface region which is deformed more strongly under HPT. In this case, their distribution over the sample section is non-uniform, and their largest amount is near the surface. To check this assumption, the X-ray diffraction patterns of the deformed sample (e = 6.4) were recorded using harder radiation (Mo). According to the performed calculations, the depth of penetration of X-ray Mo Kα radiation into the regions of wave vectors corresponding to the diffuse maximum is 15 µm. The corresponding value for Co Kα radiation is about 5 µm. Figure 9 illustrates a section of the X-ray diffraction pattern in the region of a diffuse halo for Mo Kα radiation.
There are no reflections from the crystalline phases in this X-ray diffraction pattern; only a diffuse halo from the amorphous phase is present. It is obvious that the fundamental difference between the X-ray diffraction patterns recorded in Co and Mo radiations (Figure 7 and Figure 9), is related to the different depths of X-ray beam penetration into the sample. When using Mo Kα radiation, a thicker layer of the sample takes part in scattering (due to different depths of X-ray beam penetration into the sample). As was mentioned above, the depth of X-ray beam penetration in the region of the main diffuse maximum is 5 and 15 µm for Co and Mo radiations, respectively. If the crystalline phases are formed primarily in subsurface regions, their fraction in the volume of a material, which is analyzed using Mo Kα radiation, will be significantly less. In this case, method sensitivity can be not enough to detect them. In principle, such a non-uniform distribution in the sample section distribution of phases formed under HPT was observed [25,26].
To obtain more information on the morphology and structure of the deformed sample, an electron microscope foil was prepared by the method of a focused ion beam. The electron microscope foil was prepared from a subsurface region of the deformed sample. Figure 10 shows a sample microstructure after deformation. In the image, one can see an amorphous structure, to which the mazy contrast corresponds, and ordered regions in it which correspond to nanocrystals. The size of these regions is 1–3 nm. The number of nanocrystals is huge. The images of some (by no means all) nanocrystals are marked with a box. The results of the fast Fourier transformation (FFT) of the marked regions are provided under the image of the structure. Figure numbers at the bottom correspond to the numbers of the marked regions. Reflections corresponding to the crystals can be seen along with the diffuse halo. For comparison, the HREM image of an as-cast amorphous sample is shown in Figure 11. In this image, only mazy contrast is seen. Thus, the data of electron microscopy agree with the results of X-ray studies on nanocrystal formation in the subsurface regions of theZr55Cu30Al10Ni5 sample under HPT.
Nowadays, the reasons for the formation of different crystalline phases under heating and deformation are not clear. As we stated above, the formation of different structures under the heating and deformation of the amorphous phase was observed in metallic glasses of an Fe-B system (the formation of α-Fe and Fe3B under heating and of only α-Fe(Si) solid solution under deformation [24]). A similar situation was observed also in alloys of Fe-Zr system [27] where the formation of α-Fe and Fe3Zr crystals was observed under heating, and only α-Fe crystals were formed under mechanical alloying. It is natural that under heating and deformation the amorphous phase crystallizes under different conditions. Nucleating crystals grow in a homogeneous amorphous matrix under heating, while stresses arise in the amorphous phase under deformation, which are inhomogeneously distributed over a sample. The deformation of amorphous alloys at low temperatures (significantly below the glass transition temperature) is localized and is carried out by the formation and propagation of shear bands. A lot of works [5,11,12,14,23,24,28,29,30,31] are devoted to the study of the processes of shear band formation and crystallization under deformation. Nanocrystal formation in shear bands and their vicinity is caused by an enhanced value of the diffusion coefficient in these regions. The reasons for diffusion acceleration are usually related to either a local significant but short-term (~30 ps) temperature rise in the region of deformation localization [32,33] or a decrease in the material density (an increase in the free volume fraction) in a shear band [34,35]. In a number of works, for example, in [30], it is shown that not only shear bands but also compressed and extended regions are formed under deformation. The authors of [30] explained the formation of these regions in the following way. A significant amount of excess free volume is concentrated in these regions during the nucleation of shear bands [36,37]. This is caused by a stretching effect. As a result, viscosity decreases significantly in shear bands and reaches the values typical of a supercooled liquid [38]. Thus, in addition to shear bands, regions are formed under deformation, which include tens of atoms and are characterized by their collective motion. These regions were called shear transformation zones (STZ) [39,40]. The accumulation of excess free volume results in viscous flow. However, since there is an undeformed amorphous matrix around shear bands and STZ, their neighboring regions turn to be under the action of compressive stresses. It was demonstrated in [30] that the rate of homogeneous nanocrystal nucleation in the compressed regions of an amorphous matrix is significantly higher than that in the extended regions. As we stated above, in our work rolling deformation was carried out at room temperature; under rolling, the deformation of subsurface regions is higher than that deeper in a sample. It is these regions where the formation of a larger number of nanocrystals was observed. The nanocrystals formed have the sizes of several nanometers, and their number is large (Figure 10). This corresponds to a high nucleation rate. The formation of small nanocrystals is typical of deformation-induced nanocrystallization [15]. Such a small size of nanocrystals may be related to the fact that they are located close to STZ. Since the STZ size does not exceed several nanometers, the size of compression regions caused by these regions has probably the same scale. Far from STZ, the characteristics of an amorphous matrix change, and the conditions favorable for crystal nucleation and growth disappear. High STZ concentration provides the nucleation of a large number of nanocrystals in compression regions. Such nucleation has similarities with heterogeneous nucleation [41,42], and in this case compression regions are the places of facilitated crystal nucleation.
It was shown earlier that different crystalline phases are formed under the heating and deformation of the investigated alloy. The Zr2Cu phase with a cubic lattice is the first to be formed under deformation. The formation of a phase of this type (big cube) under deformation of different types was observed earlier, for example, in [28,43], so this is not surprising. It is surprising that the other phase—the metastable phase with a hexagonal lattice—is formed under heating. In principle, this difference may be related to different atomic mobility in the heated and deformed samples. One can assume that due to lower atomic mobility in the sample deformed at room temperature, the composition of the formed crystals is close to that of an amorphous matrix since long-range atom shifts are hindered (polymorphous crystallization-type transformation). A different situation is observed under heating. The crystallization temperature of the alloy is quite high, and atomic mobility is significantly higher at this temperature. Under such conditions, diffusion paths will be significantly longer. In fact, nanocrystals are formed from the state of a supercooled liquid; there are no compression regions that facilitate crystal nucleation. It is natural that the crystallization mechanism should change. One can assume in this case that the metastable hexagonal phase is formed by the primary crystallization mechanism, and its composition differs from that of an amorphous matrix. The formation of several crystalline phases with different compositions at the consequent crystallization stages is the evidence of this assumption. These issues require further research.

4. Conclusions

A comparative study of the processes of devitrification of Zr55Cu30Al15Ni5 bulk alloy under heat treatment and deformation has been carried out.
The activation energy of crystallization, determined by the Kissinger method, is 278 kJ/mol.
It has been shown that different crystalline phases are formed during crystallization under heating and deformation. At the first crystallization stage, the metastable phase with a hexagonal structure (lattice of space group P63/mmc with the parameters a = 8.66 Å, c = 14.99 Å) is formed under heat treatment. When the temperature rises, the metastable phase decays with the formation of stable crystalline phases. The well-known crystalline Zr2Cu phase with the lattice of space group Fd3m is formed during crystallization under the action of deformation.
It has been determined that during deformation, nanocrystals are formed primarily in the subsurface regions of the samples. The nanocrystal size is several nanometers.

Author Contributions

Conceptualization, A.A.; sample preparation, D.G.; X-ray diffraction experiments, G.A. and B.G.; deformation, heat treatment, A.D. and B.M.; electron microscopy study, A.A., E.P. and D.M.; DTA experiments, I.S.; all authors analyzed the data, discussed the results and wrote the paper. All authors have read and agreed to the published version of the manuscript.

Funding

Russian foundation for Basic Research (partially).

Acknowledgments

The work was partially supported by RFBR (grants 19-03-00355 and 20-08-00497).

Conflicts of Interest

The authors declare no conflict of interest.

References

  1. Duwez, P.; Willens, R.H.; Klement, W. Continuous Series of Metastable Solid Solutions in Silver-Copper Alloys. J. Appl. Phys. 1960, 31, 1136. [Google Scholar] [CrossRef]
  2. Luo, Y.; Ke, H.; Zeng, R.; Liu, X.; Luo, J.; Zhang, P. Crystallization behavior of Zr60Cu20Fe10Al10 amorphous alloy. J. Non-Cryst. Solids 2020, 528, 119728. [Google Scholar] [CrossRef]
  3. Li, H.; Zheng, Y. Recent advances in bulk metallic glasses for biomedical applications. Acta Biomater. 2016, 36, 1–20. [Google Scholar] [CrossRef] [PubMed]
  4. Stoica, M.; Das, J.; Bednarcik, J.; Franz, H.; Mattern, N.; Wang, W.H.; Eckert, J. Strain distribution in Zr64.13Cu15.75Ni10.12Al10 bulk metallic glass investigated byin situtensile tests under synchrotron radiation. J. Appl. Phys. 2008, 104, 013522. [Google Scholar] [CrossRef] [Green Version]
  5. Stolpe, M.; Kruzic, J.; Busch, R. Evolution of shear bands, free volume and hardness during cold rolling of a Zr-based bulk metallic glass. Acta Mater. 2014, 64, 231–240. [Google Scholar] [CrossRef]
  6. Guo, W.; Shao, Y.; Saida, J.; Zhao, M.; Lü, S.; Wu, S. Rejuvenation and plasticization of Zr-based bulk metallic glass with various Ta content upon deep cryogenic cycling. J. Alloys Compd. 2019, 795, 314–318. [Google Scholar] [CrossRef]
  7. Abrosimova, G.E.; Aronin, A.S.; Kir’janov, Y.V.; Matveev, D.V.; Zver’kova, I.I.; Molokanov, V.V.; Pan, S.; Slipenyuk, A. The structure and mechanical properties of bulk Zr50Ti16.5Cu14Ni18.5 metallic glass. J. Mater. Sci. 2001, 36, 3933–3939. [Google Scholar] [CrossRef]
  8. Abrosimova, G.; Aronin, A.; Matveev, D.; Molokanov, V. Formation and structure of nanocrystals in bulk cтекле Zr50Ti16Cu15Ni19 metallic glass. Phys. Solid State 2004, 46, 2191–2195. [Google Scholar] [CrossRef]
  9. Saida, J.; Kato, H.; Inoue, A. Primary precipitation of icosahedral quasicrystal with rearrangement of constitutional elements in Zr65Al7.5Cu27.5 glassy alloy with low oxygen impurity. J. Mater. Res. 2005, 20, 303–306. [Google Scholar] [CrossRef]
  10. Zhao, X.; Pang, S.; Ma, C.; Zhang, T. Precipitation of Icosahedral Phase in Zr-Ni-Nb-Cu-Al Metallic Glasses. Mater. Trans. 2009, 50, 1838–1842. [Google Scholar] [CrossRef] [Green Version]
  11. Wilde, G.; Rösner, H. Nanocrystallization in a shear band: An in situ investigation. Appl. Phys. Lett. 2011, 98, 251904. [Google Scholar] [CrossRef]
  12. Abrosimova, G.; Aronin, A.; Barkalov, O.; Matveev, D.; Rybchenko, O.; Maslov, V.; Tkach, V. Structural transformations in the Al85Ni6.1Co2Gd6Si0.9 amorphous alloy during multiple rolling. Phys. Solid State 2011, 53, 229–233. [Google Scholar] [CrossRef]
  13. Aronin, A.; Louzguine-Luzgin, D.V. On nanovoids formation in shear bands of an amorphous Al-based alloy. Mech. Mater. 2017, 113, 19–23. [Google Scholar] [CrossRef]
  14. Glezer, A.M.; Permyakova, I.E.; Manaenkov, S.E. Plasticizing effect in the transition from an amorphous state to a nanocrystalline state. Dokl. Phys. 2008, 53, 8–10. [Google Scholar] [CrossRef]
  15. Abrosimova, G.; Matveev, D.; Pershina, E.; Aronin, A. Effect of treatment conditions on parameters of nanocrystalline structure in Al-based alloys. Mater. Lett. 2016, 183, 131–134. [Google Scholar] [CrossRef]
  16. Aronin, A.; Matveev, D.; Pershina, E.; Tkatch, V.; Abrosimova, G. The effect of changes in Al-based amorphous phase structure on structure forming upon crystallization. J. Alloys Compd. 2017, 715, 176–183. [Google Scholar] [CrossRef]
  17. Zhilyaev, A.; Langdon, T. Using high-pressure torsion for metal processing: Fundamentals and applications. Prog. Mater. Sci. 2008, 53, 893–979. [Google Scholar] [CrossRef]
  18. Liu, L.; Wu, Z.; Zhang, J. Crystallization kinetics of Zr55Cu30Al10Ni5 bulk amorphous alloy. J. Alloys Compd. 2002, 339, 90–95. [Google Scholar] [CrossRef]
  19. Tariq, N.; Iqbal, M.; Shaikh, M.; Akhter, J.I.; Ahmad, M.; Ali, G.; Xu, M. Evolution of microstructure and non-equilibrium phases in electron beam treated Zr55Cu30Al10Ni5 bulk amorphous alloy. J. Alloys Compd. 2008, 460, 258–262. [Google Scholar] [CrossRef]
  20. Tao, P.J.; Yang, Y.Z.; Bai, X.J.; Mu, Z.X.; Li, G. Non-Isothermal Crystallization Behavior in Zr55Cu30Ni5Al10 Bulk Metallic Glass. Adv. Mater. Res. 2010, 146, 560–564. [Google Scholar] [CrossRef]
  21. Gao, Y.-L.; Shen, J.; Sun, J.-F.; Wang, G.; Xing, D.-W.; Xian, H.-Z.; Zhou, B.-D. Crystallization behavior of ZrAlNiCu bulk metallic glass with wide supercooled liquid region. Mater. Lett. 2003, 57, 1894–1898. [Google Scholar] [CrossRef]
  22. Yavari, A.; Le Moulec, A.; Botta, W.J.; Inoue, A.; Rejmankova, P.; Kvick, A. In Situ crystallization of Zr55Cu30Al10Ni5 bulk glass forming from the glassy and undercooled liquid states using synchrotron radiation. J. Non-Cryst. Solids 1999, 247, 31–34. [Google Scholar] [CrossRef]
  23. Yavari, A.; Le Moulec, A.; Inoue, A.; Botta, W.J.; Vaughan, G.; Kvick, A. Metastable phases in Zr-based bulk glass-forming alloys detected using a synchrotron beam in transmission. Mater. Sci. Eng. A 2001, 304–306, 34–38. [Google Scholar] [CrossRef]
  24. Aronin, A.; Abrosimova, G.; Matveev, D.; Rybchenko, O. Structure and properties of nanocrystalline alloys prepared by high pressure torsion. Rev. Adv. Mater. Sci. 2010, 25, 52–57. [Google Scholar]
  25. Ubyivovk, E.V.; Boltynjuk, E.; Gunderov, D.; Churakova, A.A.; Kilmametov, A.; Valiev, R. HPT-induced shear banding and nanoclustering in a TiNiCu amorphous alloy. Mater. Lett. 2017, 209, 327–329. [Google Scholar] [CrossRef]
  26. Abrosimova, G.; Aronin, A. Nanocrystal formation in Al- and Ti-based amorphous alloys at deformation. J. Alloys Compd. 2018, 747, 26–30. [Google Scholar] [CrossRef]
  27. Trudeau, M.L. Deformation induced crystallization due ti instability in amorphous FeZr alloys. Appl. Phys. Lett. 1994, 64, 3661–3663, doiorg/101063/1111953. [Google Scholar] [CrossRef]
  28. El-Eskandarany, M.S.; Saida, J.; Inoue, A. Room-temperature mechanical induced solid-state devitrification od glassy Zr65Al7.5Ni10Cu12.5Pd5 alloy. Acta. Mater. 2003, 51, 4519–4532. [Google Scholar] [CrossRef]
  29. Yavari, A.R.; Georgarakis, K.; Antonowicz, J.; Stoica, V.; Nishiyama, N.; Vaughan, G.; Chen, M.; Pons, M. Crystallization during Bending of a Pd-based metallic glass detected by X-ray microscopy. Phys. Rev. Lett. 2012, 109, 085501. [Google Scholar] [CrossRef]
  30. Yan, Z.H.; Song, K.; Hu, Y.; Dai, F.; Chu, Z.; Eckert, J. Localized crystallization in shear bands of a metallic glass. Sci. Rep. 2016, 6, 19358. [Google Scholar] [CrossRef]
  31. Abrosimova, G.; Aronin, A.; Fokin, D.; Orlova, N.; Postnova, E. The decrase of Young’s modulus in shear bands of amorphous Al87Ni8Gd5 alloy. Mater. Lett. 2019, 252, 114–116. [Google Scholar] [CrossRef]
  32. Lewandowski, J.J.; Greer, A.L. Temperature rise at shear bands in metallic glasses. Nat. Mater. 2006, 5, 15–18. [Google Scholar] [CrossRef]
  33. Georgarakis, K.; Aljerf, M.; Li, Y.; LeMoulec, A.; Charlot, F.; Yavari, A.R.; Chornokhvostenko, K.; Tabachnikova, E.; Evangelakis, G.A.; Miracle, D.B.; et al. Shear band melting and serrated flow in metallic glasses. App. Phys. Lett. 2008, 93, 031907. [Google Scholar] [CrossRef]
  34. Schmidt, V.; Rösner, H.; Peterlechler, M.; Wilde, G. Quantitative Measurement of Density in a Shear Band of Metallic Glass Monitored Along its Propagation Direction. Phys. Rev. Lett. 2015, 115, 035501. [Google Scholar] [CrossRef]
  35. Greer, A.L.; Cheng, Y.Q.; Ma, E. Shear bands in metallic glasses. Mater. Sci. Eng. 2013, 74, 71–132. [Google Scholar] [CrossRef]
  36. Flores, K.M.; Suh, D.; Dauskardt, R.H. Characterization of free volume in a bulk metallic glass using positron annihilation spectroscopy. J. Mater. Res. 2002, 17, 1153–1161. [Google Scholar] [CrossRef]
  37. Kanungo, B.P.; Gladeb, S.C.; Asoka-Kumarb, P.; Floresa, K.M. Characterization of free volume changes associated with shear band formation in Zr- and Cu-based bulk metallic glasses. Intermetallics 2004, 12, 1073–1080. [Google Scholar] [CrossRef] [Green Version]
  38. Huo, L.S.; Ma, J.; Ke, H.B.; Bai, H.Y.; Zhao, D.Q.; Wang, W.H. The deformation units in metallic glasses revealed by stress-induced localized glass transition. J. Appl. Phys. 2012, 111, 113522. [Google Scholar] [CrossRef]
  39. Tang, X.P.; Geyer, U.; Busch, R.; Johnson, W.L.; Wu, Y. Diffusion mechanisms in metallic supercooled liquids and glasses. Nature 1999, 402, 160–162. [Google Scholar] [CrossRef]
  40. Bokeloh, J.; Divinski, S.V.; Reglitz, G.; Wilde, G. Tracer measurements of atomic diffusion inside shear bands of a bulk metallic glass. Phys. Rev. Lett. 2011, 107, 235503. [Google Scholar] [CrossRef]
  41. Foley, J.C.; Allen, D.R.; Perepezko, J.H. Analysis of nanocrystal development in Al-Y-Fe and Al-Sm glasses. Scr. Mater. 1996, 35, 655–669. [Google Scholar] [CrossRef]
  42. Abrosimova, G.E.; Aronin, A.S. Effect of the Concentration of a rare-earth component on the parameters of the nanocrystalline structure in aluminum-based alloys. Phys. Solid State 2009, 51, 1765–1771. [Google Scholar] [CrossRef]
  43. El-Eskandarany, M.S.; Inoue, A. Solid-state crystalline-glassy cyclic phase transformations of mechanically alloyed Cu33Zr67 powders. Met. Trans. A 2002, 33, 135. [Google Scholar] [CrossRef]
Figure 1. X-ray diffraction pattern of glassy Zr55Cu30Al15Ni5 sample.
Metals 10 01329 g001
Figure 2. Differential scanning calorimetry (DSC) curves of Zr55Cu30Al10Ni5 alloy heated to 848 K at a constant rate of 5 (a), 10 (b) and 20 (c) K/min.
Metals 10 01329 g002
Figure 3. The Kissinger plot of Zr55Cu30Al10Ni5.
Metals 10 01329 g003
Figure 4. X-ray diffraction patterns of the samples heated in the calorimeter to 738 (1) and 750 (2) K (Co Kα).
Metals 10 01329 g004
Figure 5. X-ray diffraction patterns of the alloy after annealing at 750 (1) and 873 K (2) (Co Kα).
Metals 10 01329 g005
Figure 6. X-ray diffraction patterns of initial (1) and deformed samples of Zr55Cu30Al10Ni5 alloy (2–1 rotation, 3–10 rotations) (Co Kα).
Metals 10 01329 g006
Figure 7. Result of the expansion of the X-ray diffraction pattern of the sample after deformation at 5 rotations: 1(black)–experimental spectrum, 2 (red)–summation curve, 3 (blue)–diffuse halo from the amorphous phase (reflections corresponding to the crystalline phase (green) are marked with asterisks).
Metals 10 01329 g007
Figure 8. X-ray diffraction patterns of the samples after high-pressure torsion (HPT) (1) and heating in the calorimeter (2, wine) to the temperature corresponding to the completion of the first crystallization stage (Co Kα). Decomposition of curve 1: 1(black)–experimental spectrum, 2 (red)–summation curve, 3 (blue)–diffuse halo from the amorphous phase (reflections corresponding to the crystalline phase (green) are marked with asterisks).
Metals 10 01329 g008
Figure 9. X-ray diffraction pattern of the deformed sample (e = 6.4), (Mo Kα).
Metals 10 01329 g009
Figure 10. High-resolution transmission electron microscopy (HREM) image of the deformed structure. Bottom of the figure: results of the fast Fourier transformation (FFT) of the marked regions. Figure numbers at the bottom correspond to the numbers of the marked regions.
Metals 10 01329 g010
Figure 11. HREM image of an as-prepared amorphous sample.
Metals 10 01329 g011
Table 1. Crystallization temperatures for different heating rates.
Heating Rate β, K/minTemperature of Crystallization Start Ts, K
5730
10740
20755

