Dynamic Steady State by Unlimited Unidirectional Plastic Deformation of Crystalline Materials Deforming by Dislocation Glide at Low to Moderate Temperatures


Abstract
1. Introduction
2. Small to Moderate Plastic Strains ()
2.1. Statistical Dislocation Storage
- (a)
- a macroscopic finite strain increment of amountwhere b is the modulus of the Burgers vector of the mobile dislocation (the shear displacement increment ) and is the texture-dependent orientation factor relating tensile strain with crystallographic slip shear. As deformation texture evolves the value of the orientation factor changes. However, in general, the influence of such a change is not as important as that of the other strain-induced structural changes. Reference [9] treats in detail the evolution of the orientation factor through several strain paths.
- (b)
- an increment of the stored dislocation length per unit volume that, from geometrical reasons, scales with (geometrical similitude implies that the dislocation length stored per unit area swept by the dislocation, , is proportional to the forest dislocation density piercing the slip plane, , times a characteristic length of such density, ):
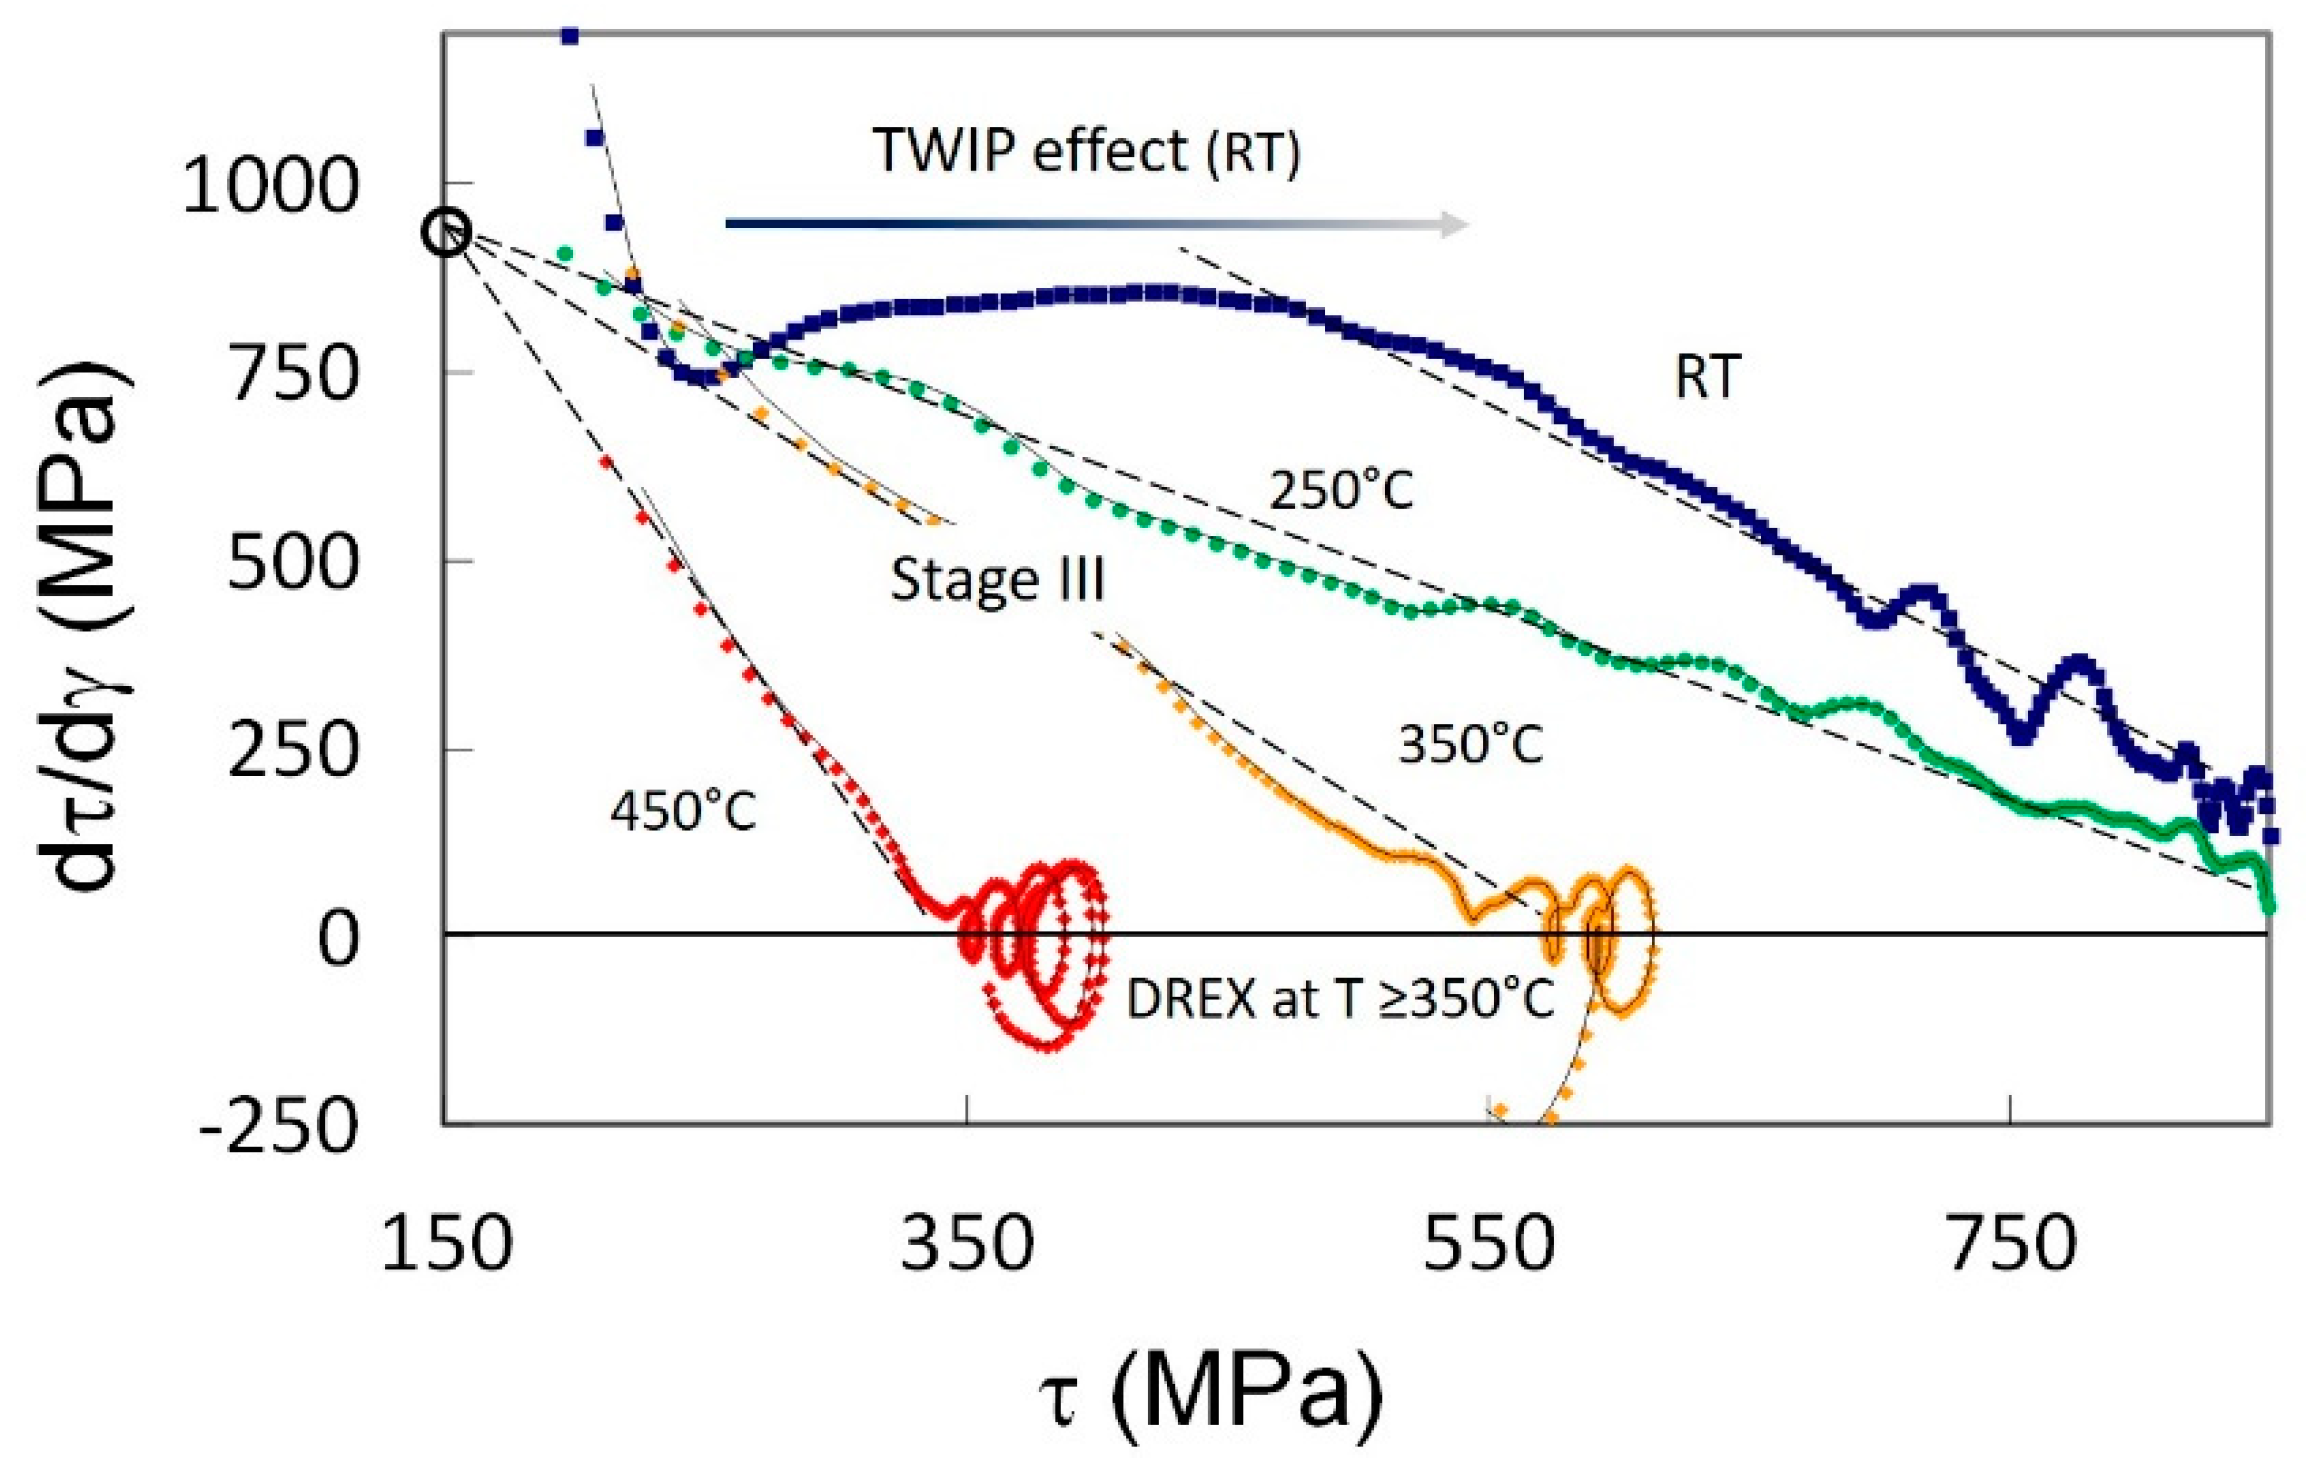
2.2. Dynamic Recovery
3. “Large” Strains ()
- Continuous accumulation of debris (e.g., dipolar debris) ancillary to the main process of statistical storage and the dynamic recovery of dislocations (the interaction of mobile dislocations with the current total dislocation density present and with other defects of any dimension) [13],
4. The Case of Large Strains by Axisymmetric Elongation of BCC and HCP Polycrystals
5. SPD, “Severe Plastic Deformations” ()
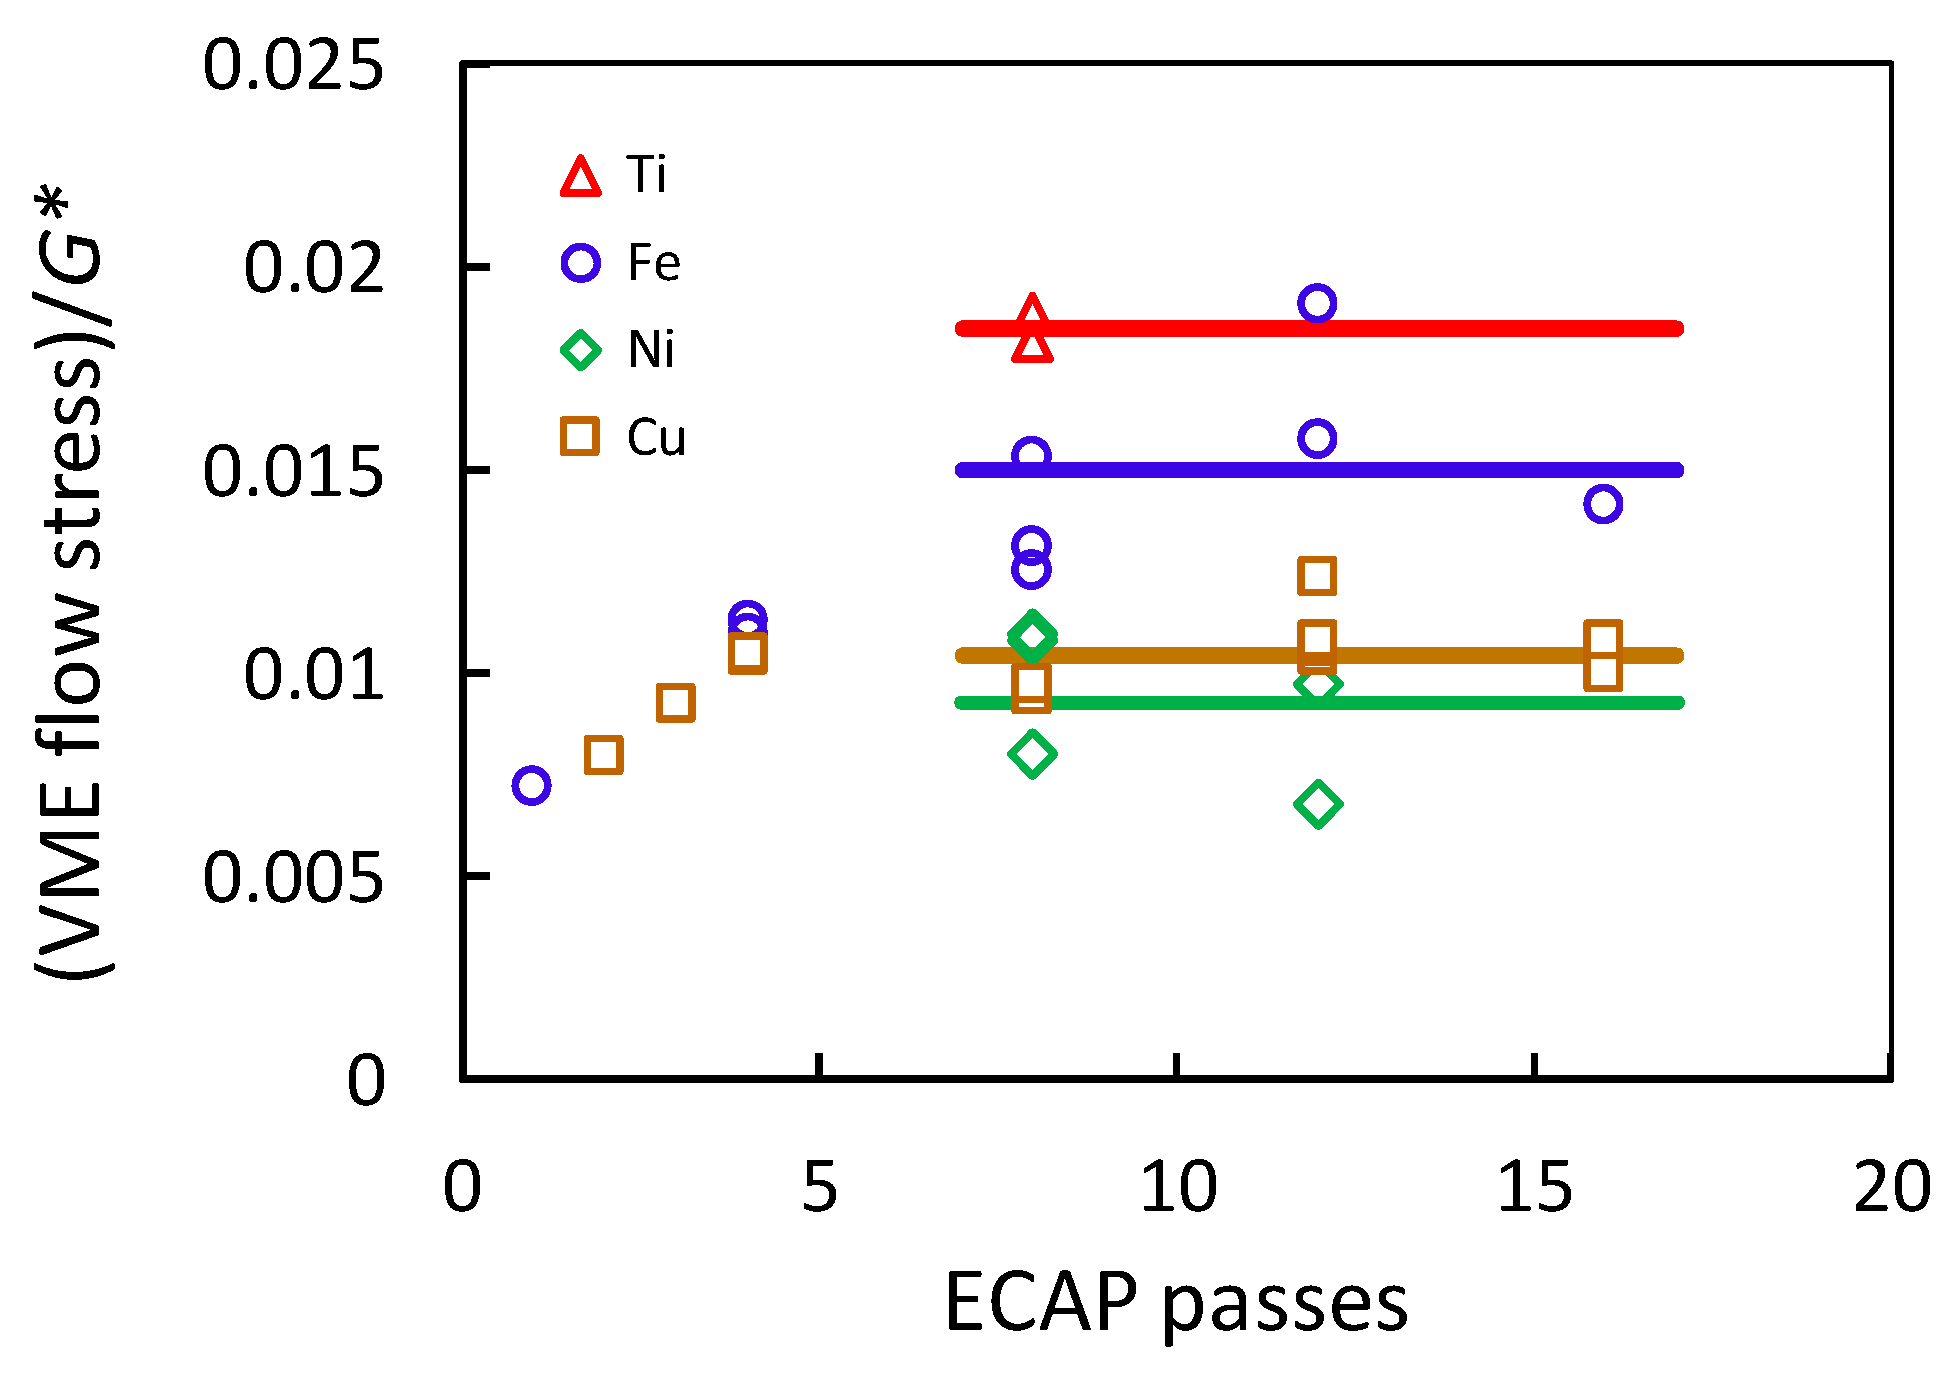
5.1. ECAP
5.2. HPT
6. Ultra-SPD, “Ultra-Severe Plastic Deformations” ()
- An artefact of the HPT process: as told before, the simple shear of disks by HPT develops a macroscopic gradient of shear strain. The accommodation of such a gradient requires a continuous storage of a density of redundant GND. The gradient is enormous after > 500. The gradient can be avoided by using rings of appropriate geometry (as used by Erbel [48]).
- Hardening from accumulation of an increasing density of point defects or their clusters arising by the interaction of gliding dislocations with other dislocation lines or from the processes of dynamic recovery of dislocation lengths. Such point-like defects, i.e., vacancy clusters, represent weak obstacles for gliding dislocations.
- A sudden transition from a laminar shear plastic flow to a turbulent one at the mesoscopic microstructural level; it would trigger the accumulation of a density of GND until reaching some new steady state.
- A transition from the control of the flow stress by the average dislocation density to its control by the current grain size (refined by fragmentation and by the imposed deformation, counteracted by specific recovery mechanisms). The transition would take place at some critical size of the grains.
7. Beyond Current Ultra-SPD?
- (a)
- About the strengthening by statistically stored dislocations in the absence of macroscopic (externally imposed) plastic strain gradients, we have the athermal limits of dislocation density and flow stress given by Equations (12) and (13). Those values are extrapolations of experimental results. Experimental values of dislocation densities obtained after plastic deformation in conditions close to athermal are in the same range: 1016 m−2 after shock experiments or 1017 m−2 after deformation at 4.2 K. Similarly, atomistic simulations of shock deformation of pure Cu or Ni show peak non-equilibrium dislocation densities up to 1018 m−2 that decrease to 1016 m−2 after relaxation (for references, see [21]). Thus, the figures given by Equations (12) and (13) are reasonably confirmed.
- (b)
- Non-redundant geometrically necessary dislocation density is immune to most of the recovery mechanisms to which statistically stored dislocation density is vulnerable (mechanisms involving the annihilation of dislocation segments of opposite sign). However, the GND density can also be absorbed and digested in high-angle grain boundaries to the price of a change in their defect structure and associated intergranular misorientation. Disregarding such possible recovery, an absolute “natural” limit to dislocation density of any kind, redundant or not, is inherent to the discrete, atomistic constitution of the crystals. Surprisingly, a variety of different criteria for establishing such limits (geometric, mechanical, thermodynamic) yield a very narrow interval for its value [21]:i.e., about 4 × 10¹⁸ m−2 for the metals considered in this paper. From Equation (3) with the α value adequate to the high figure of the dislocation density, the maximum athermal flow stress associated to such dislocation density would beHowever, remember that as explained above, such a limit cannot be reached by the plastic deformation of single-phase crystalline materials developing Stage IV because of the emergence of a nanograin structure after large strains and its control of the flow stress (Figure 9).What should we expect to happen in an alloy where the saturation of Stage IV does not occur? The obvious answer is amorphization. It does not seem casual that the absolute limit value given above for the flow stress coincides with the ideal strength for the irreversible deformation of metallic glasses [21].
- (c)
- However, increasing the dislocation density does not seem to be the actual microstructural path for amorphization by deformation. Amorphization by deformation is experimentally observed in many alloys with a high glass-forming ability as a transition from a nanograined to a disordered glassy structure.
8. Conclusions
- SPD processes have extended the experimental study of deformation of materials to levels of VME strains unimaginable half a century ago: from 1 to 105 VME strain.
- The effect of plastic deformation on the flow stress and internal structure of materials is path-dependent. One must be aware that both ECAP and HPT, the most performant SPD processes for attaining very large strains in bulk samples, impart simple shear deformation (similar to conventional torsion tests). It is convenient to compare the ECAP or HPT results with results from other more traditional processes imparting large strains, such as rolling (plane-strain elongation, equivalent to pure shear) and wire drawing (axisymmetrical elongation).
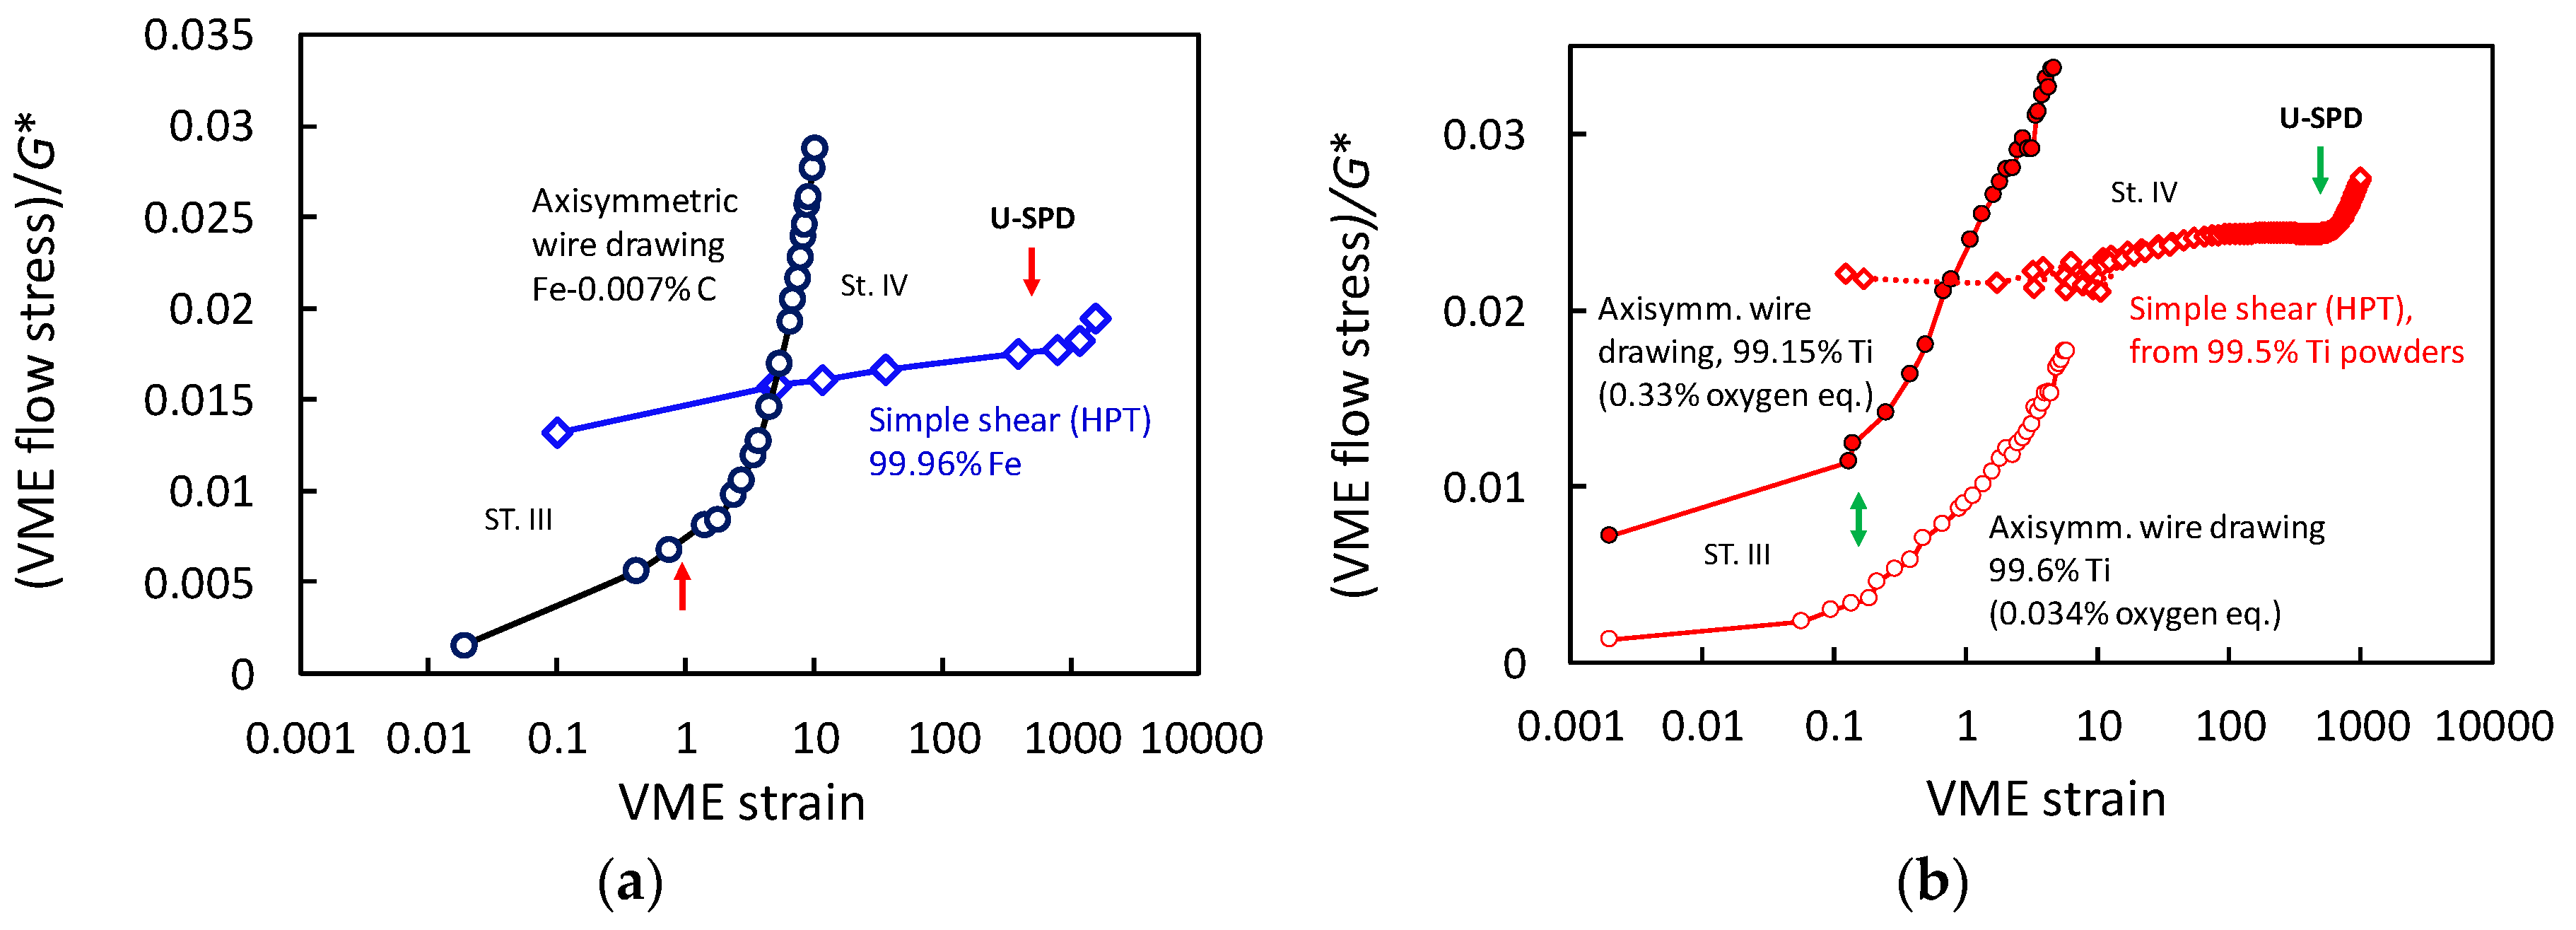
- For bcc or hcp materials, wire drawing is much more effective at strengthening or structural refining than SPD processes, because of the unique internal mesoscopic strain pattern associated to a texture that strongly favors internal plane strain elongation, requiring grain interfolding. Ultra-SPD strained Fe or Ti by HPT to a VME of 4000 do not achieve the strength levels obtained by drawing to a VME strain of 10.
- The results of SPD processes applied to metals refute the existence of a true deformation Stage V, prematurely putting an end to the slow progression of Stage IV toward its alleged steady state. Under the high hydrostatic pressures of SPD processes, such progression continues its path much further than expected from the behavior observed in conventional tension or torsion tests.
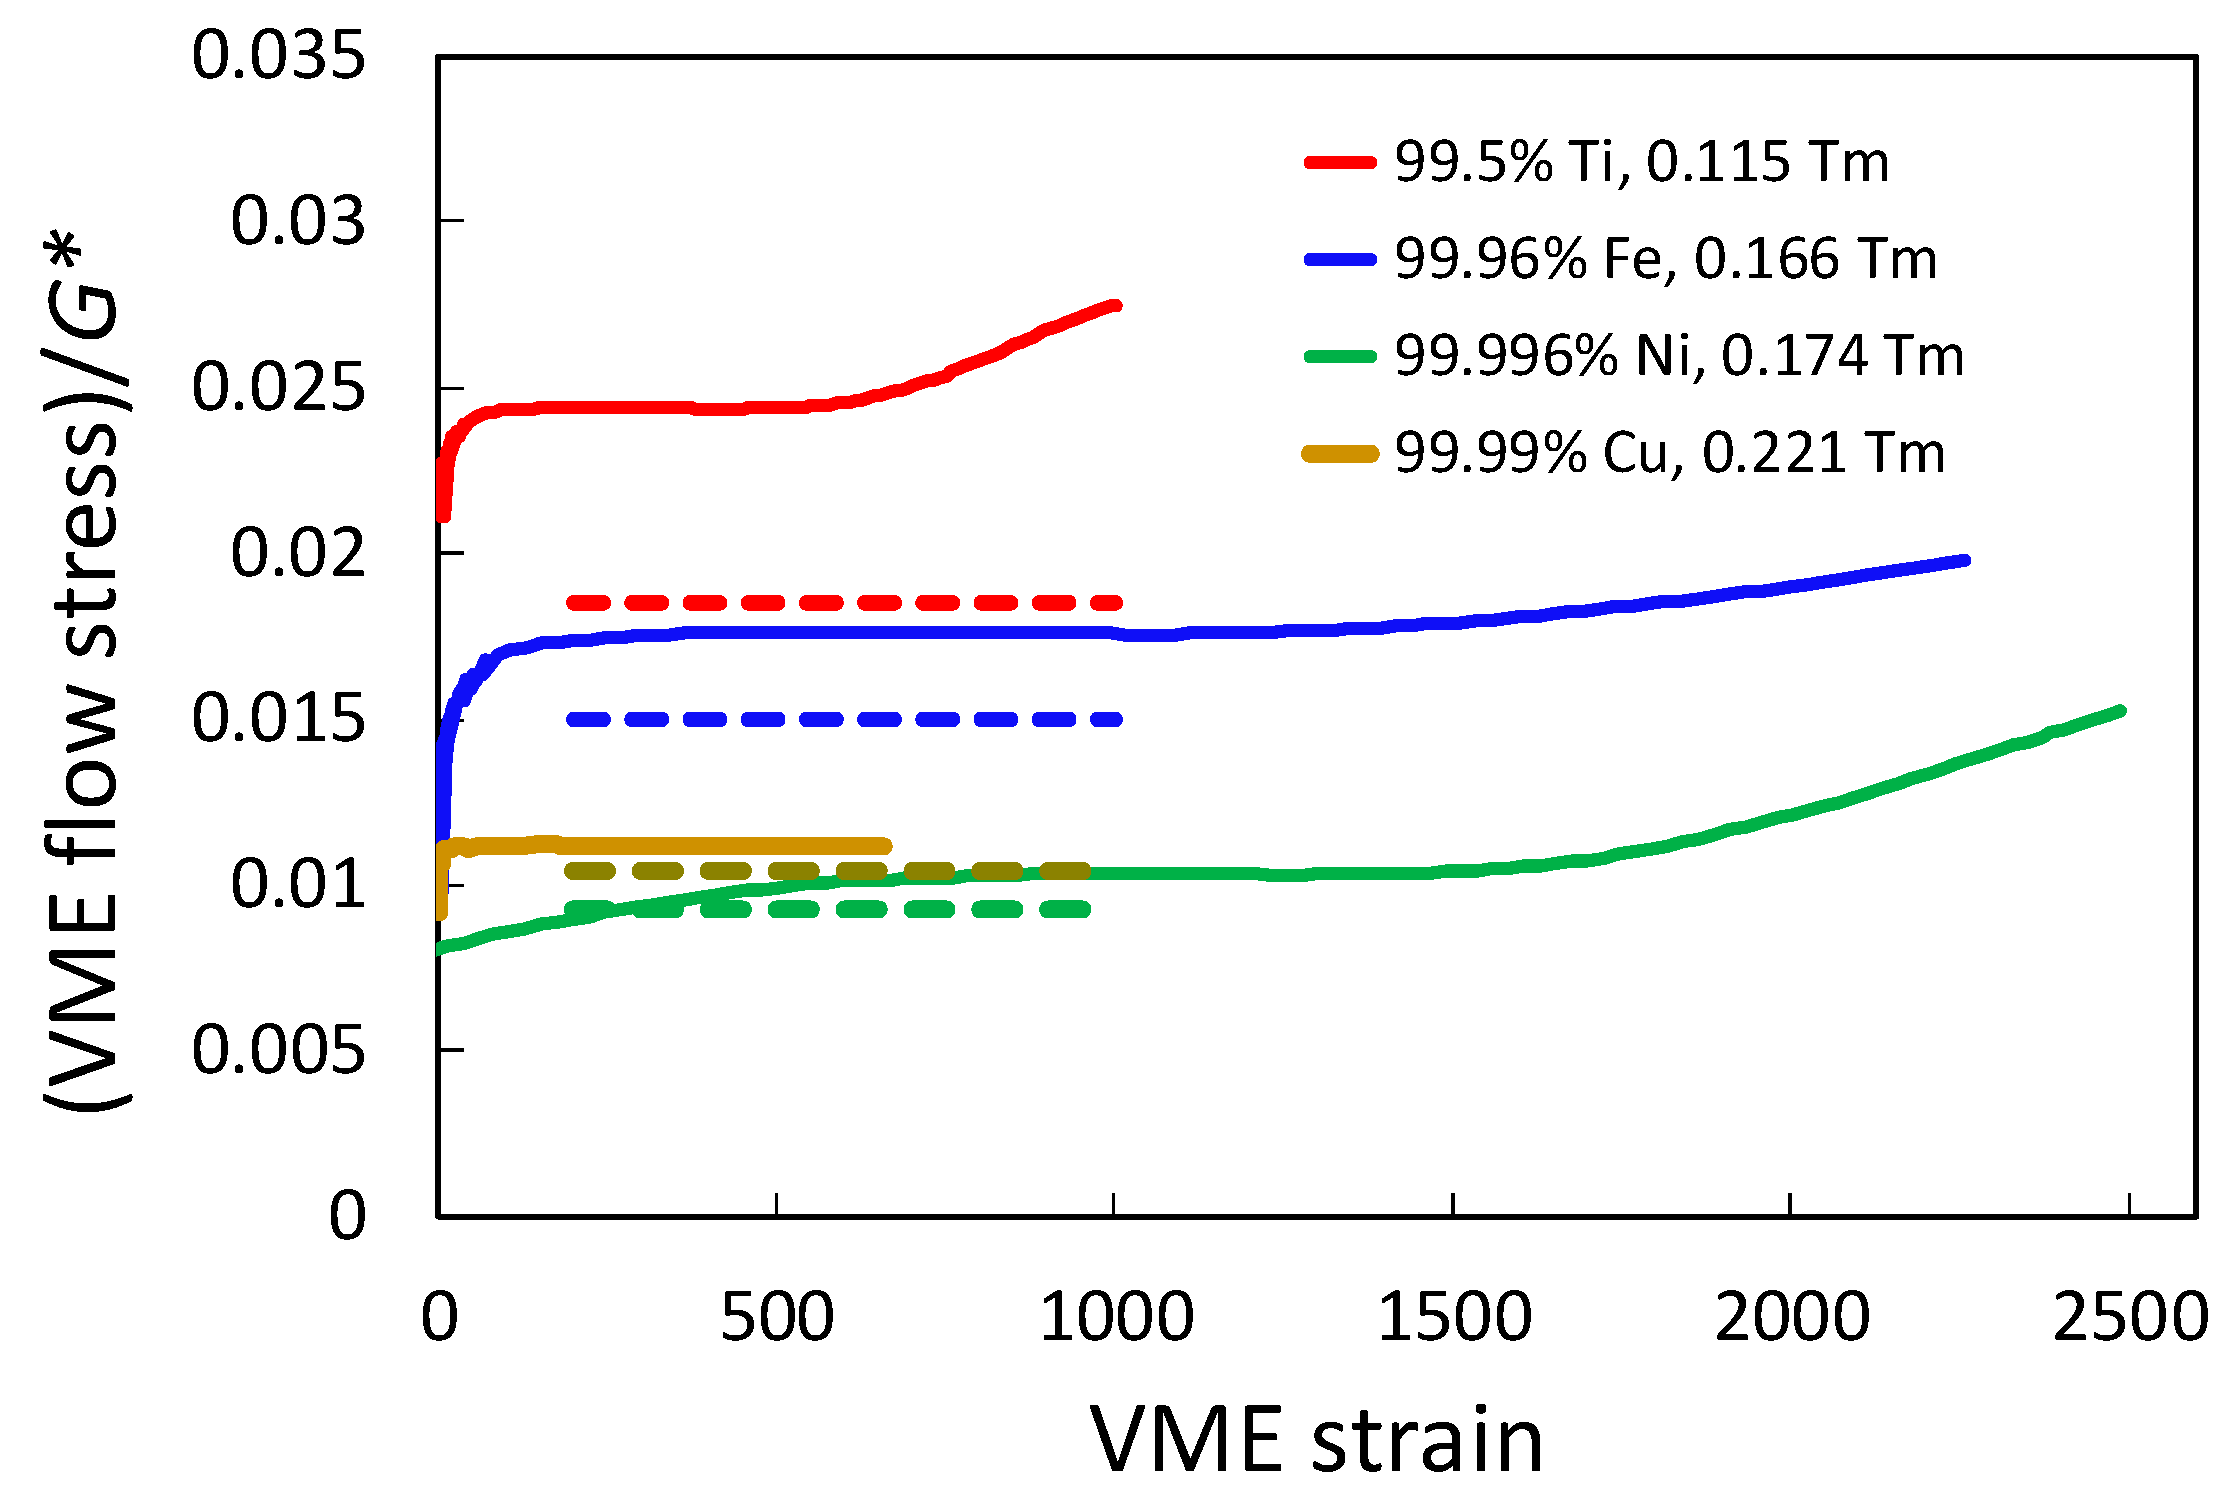
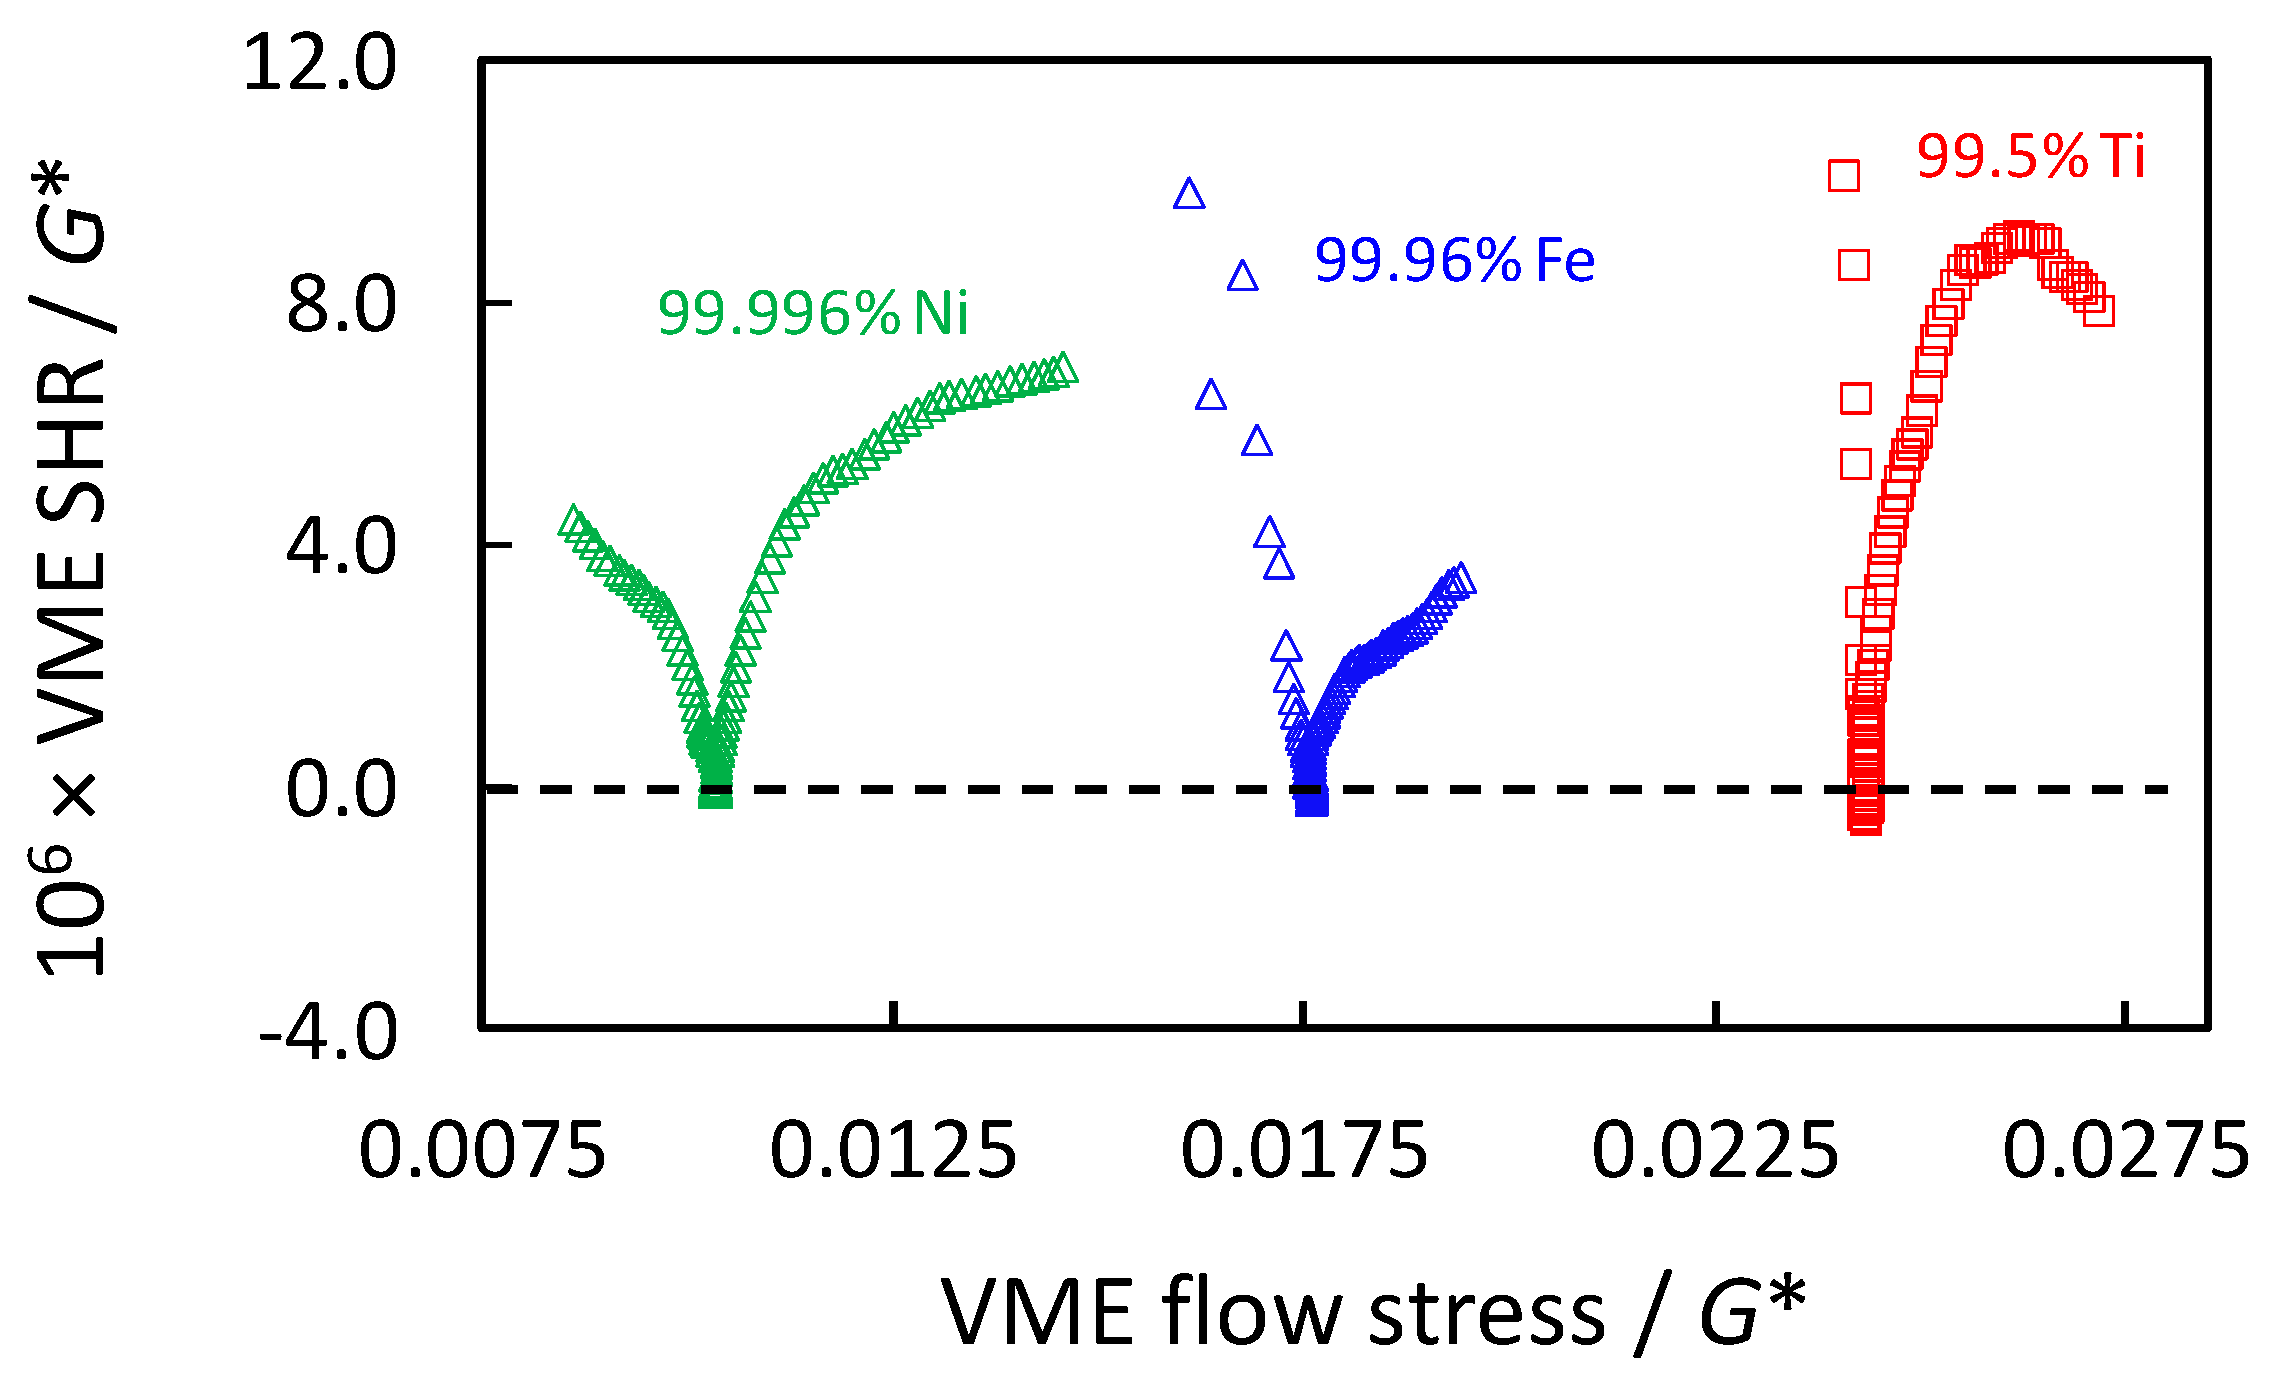
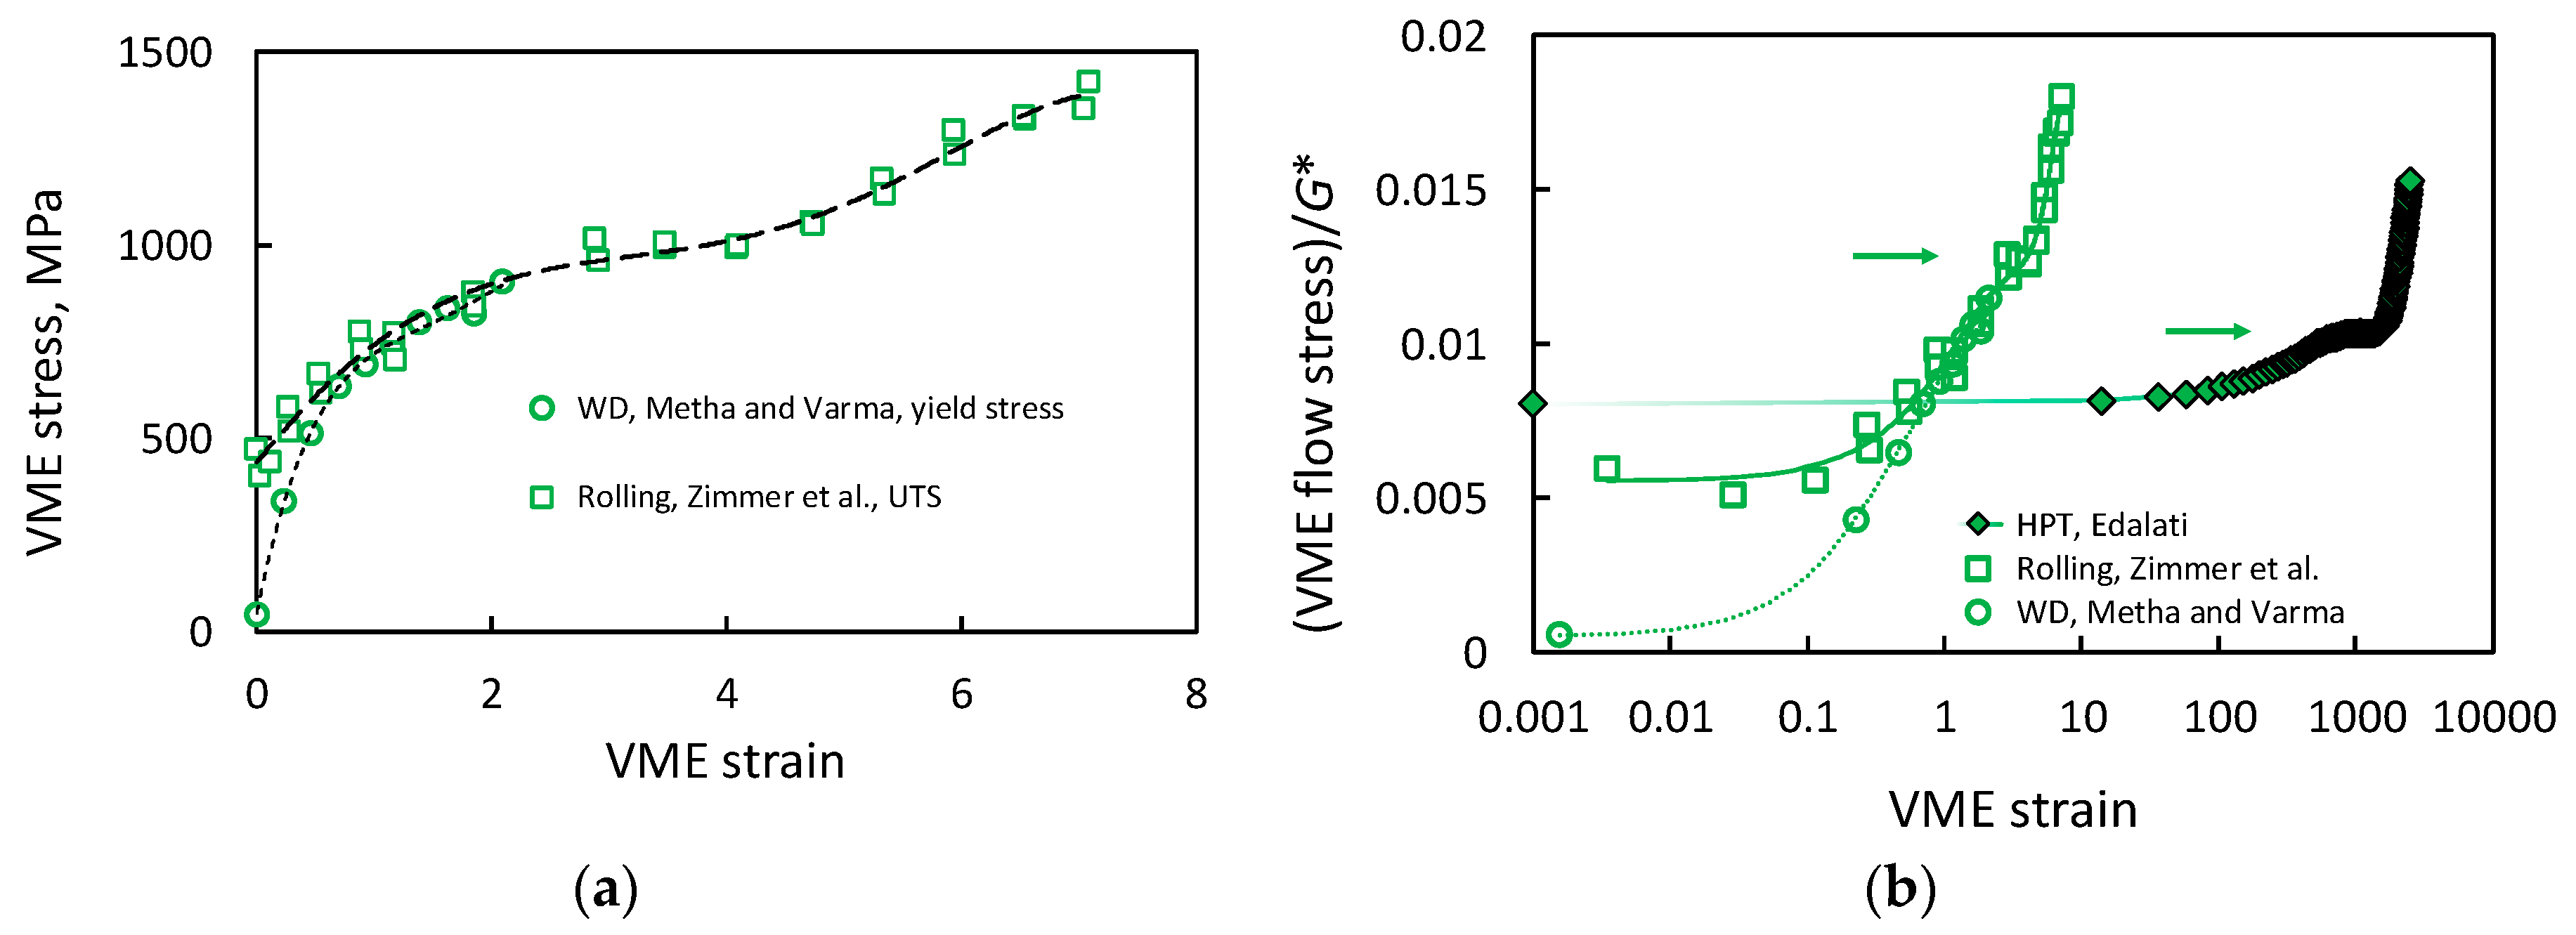
- Recently published results of ultra-SPD stress–strain behavior of several pure metals show that a hardening transition occurs after a very large plateau of constant flow stress. The SHR of the new deformation stage is very weak, but after enormous shear strains of the order of 103, the flow stress significantly increases above the plateau stress of Stage IV. If the authenticity and generality of the new stage is confirmed, it will offer the possibility of strengthening bulk materials by HPT to unforeseen levels.
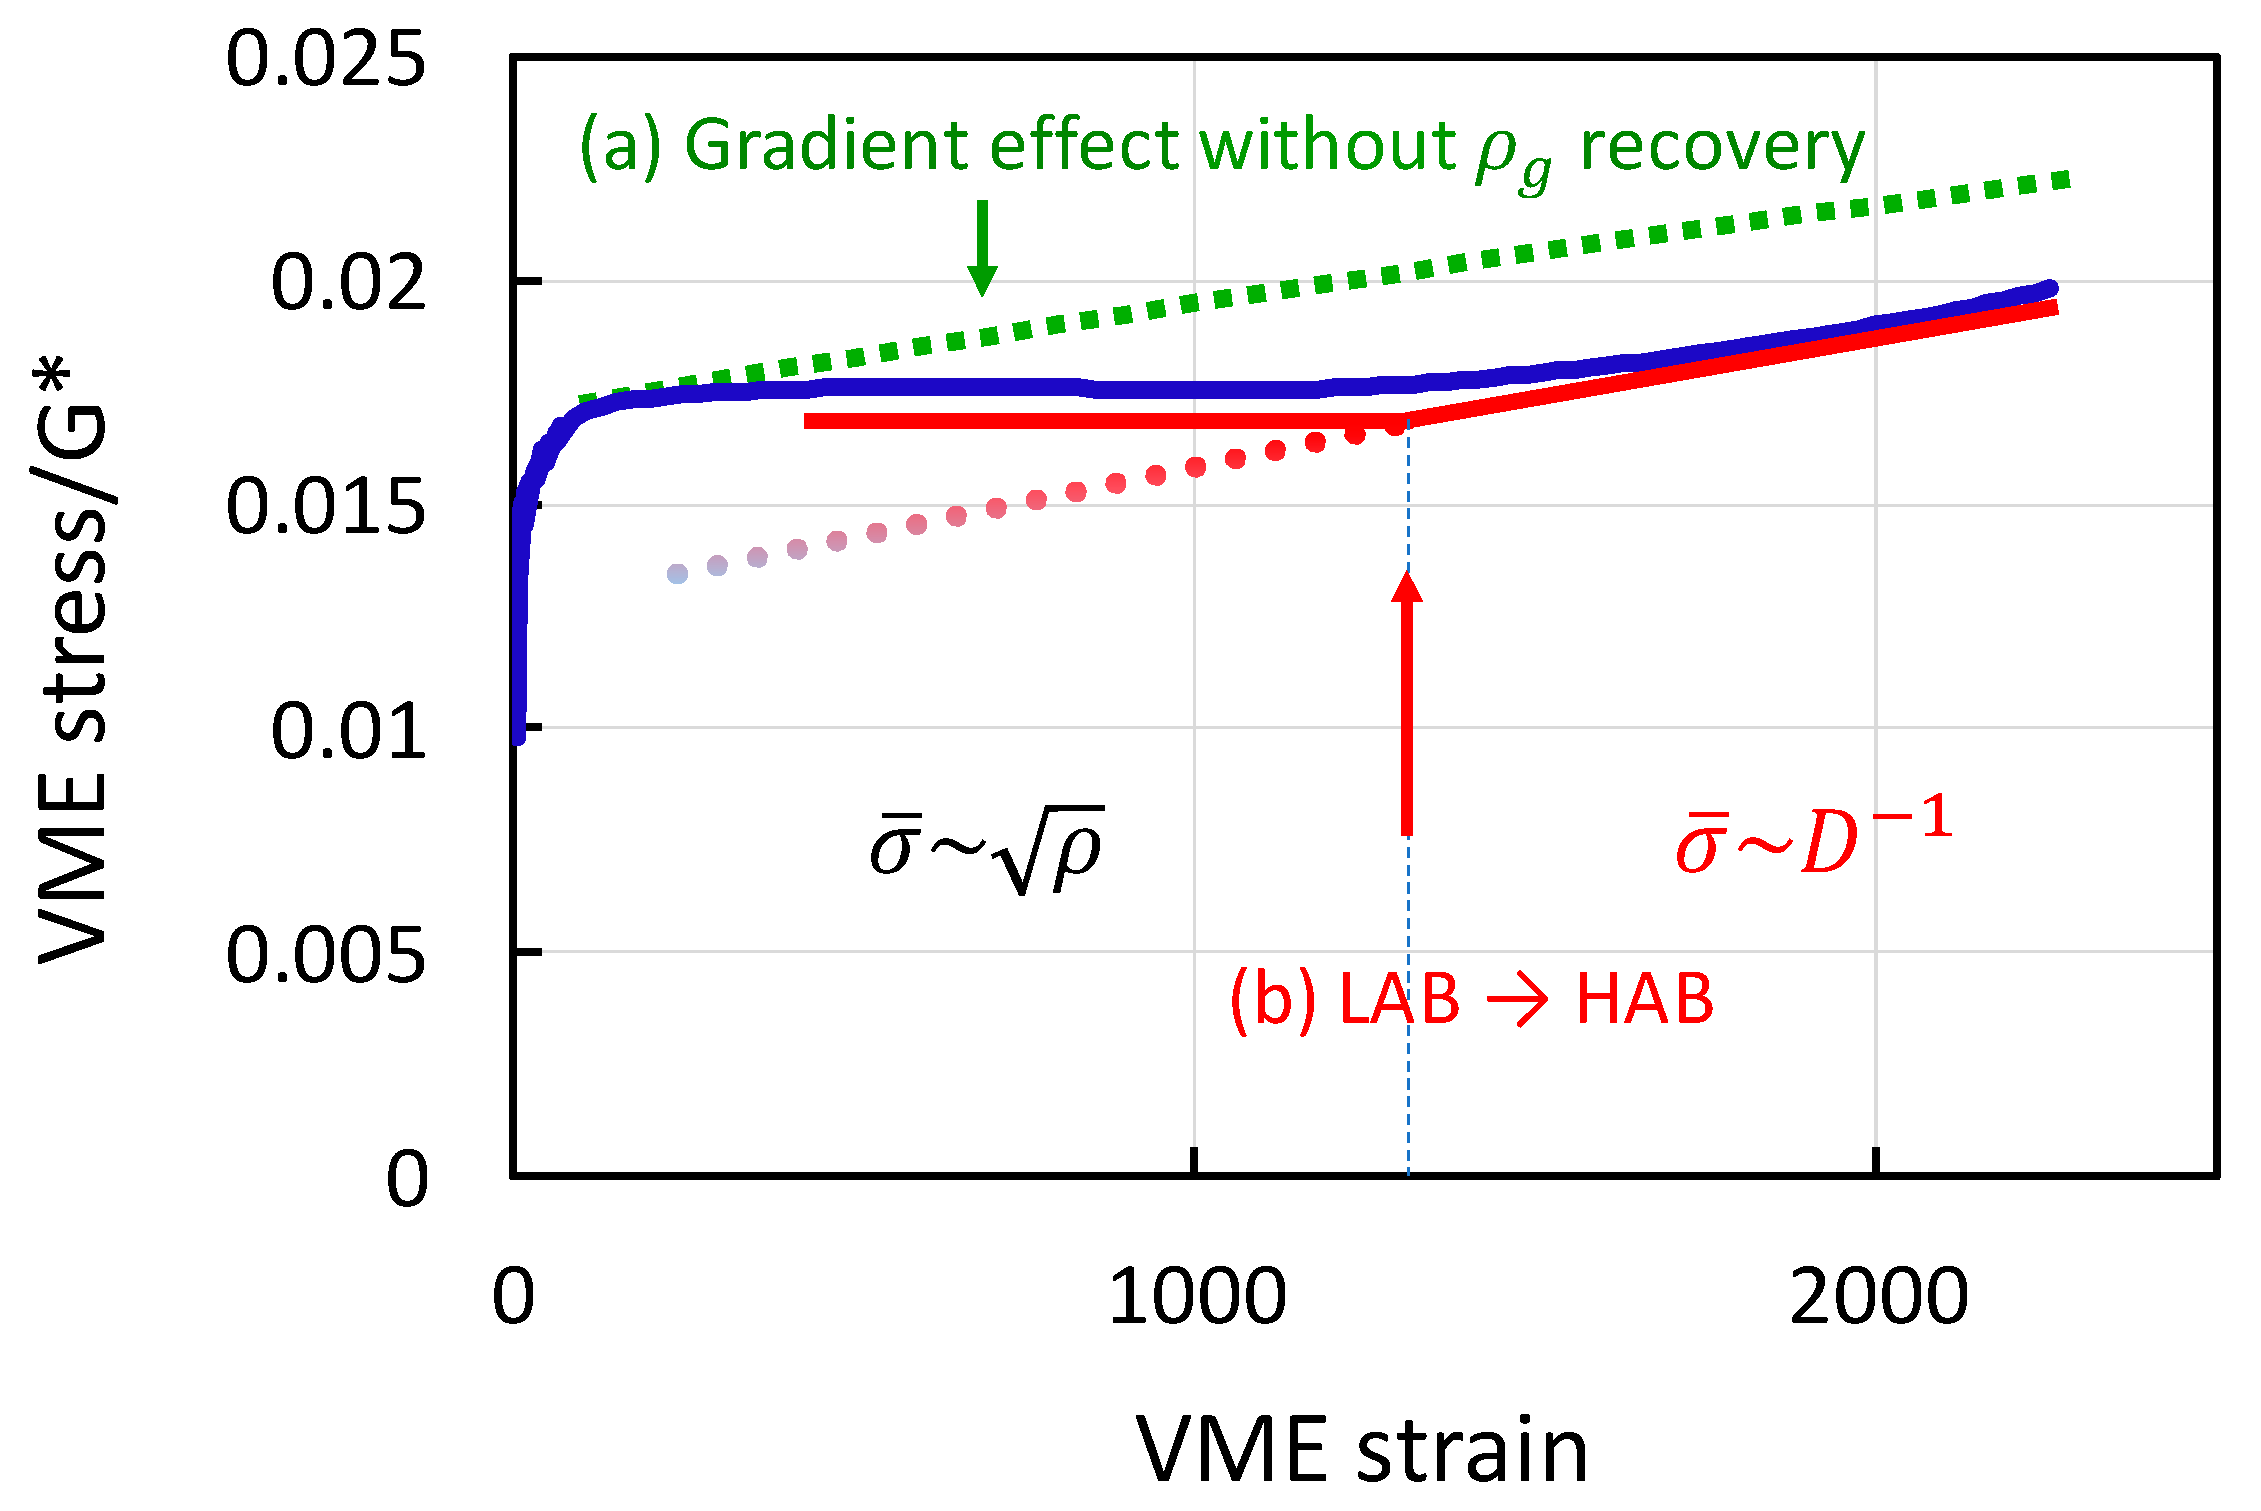
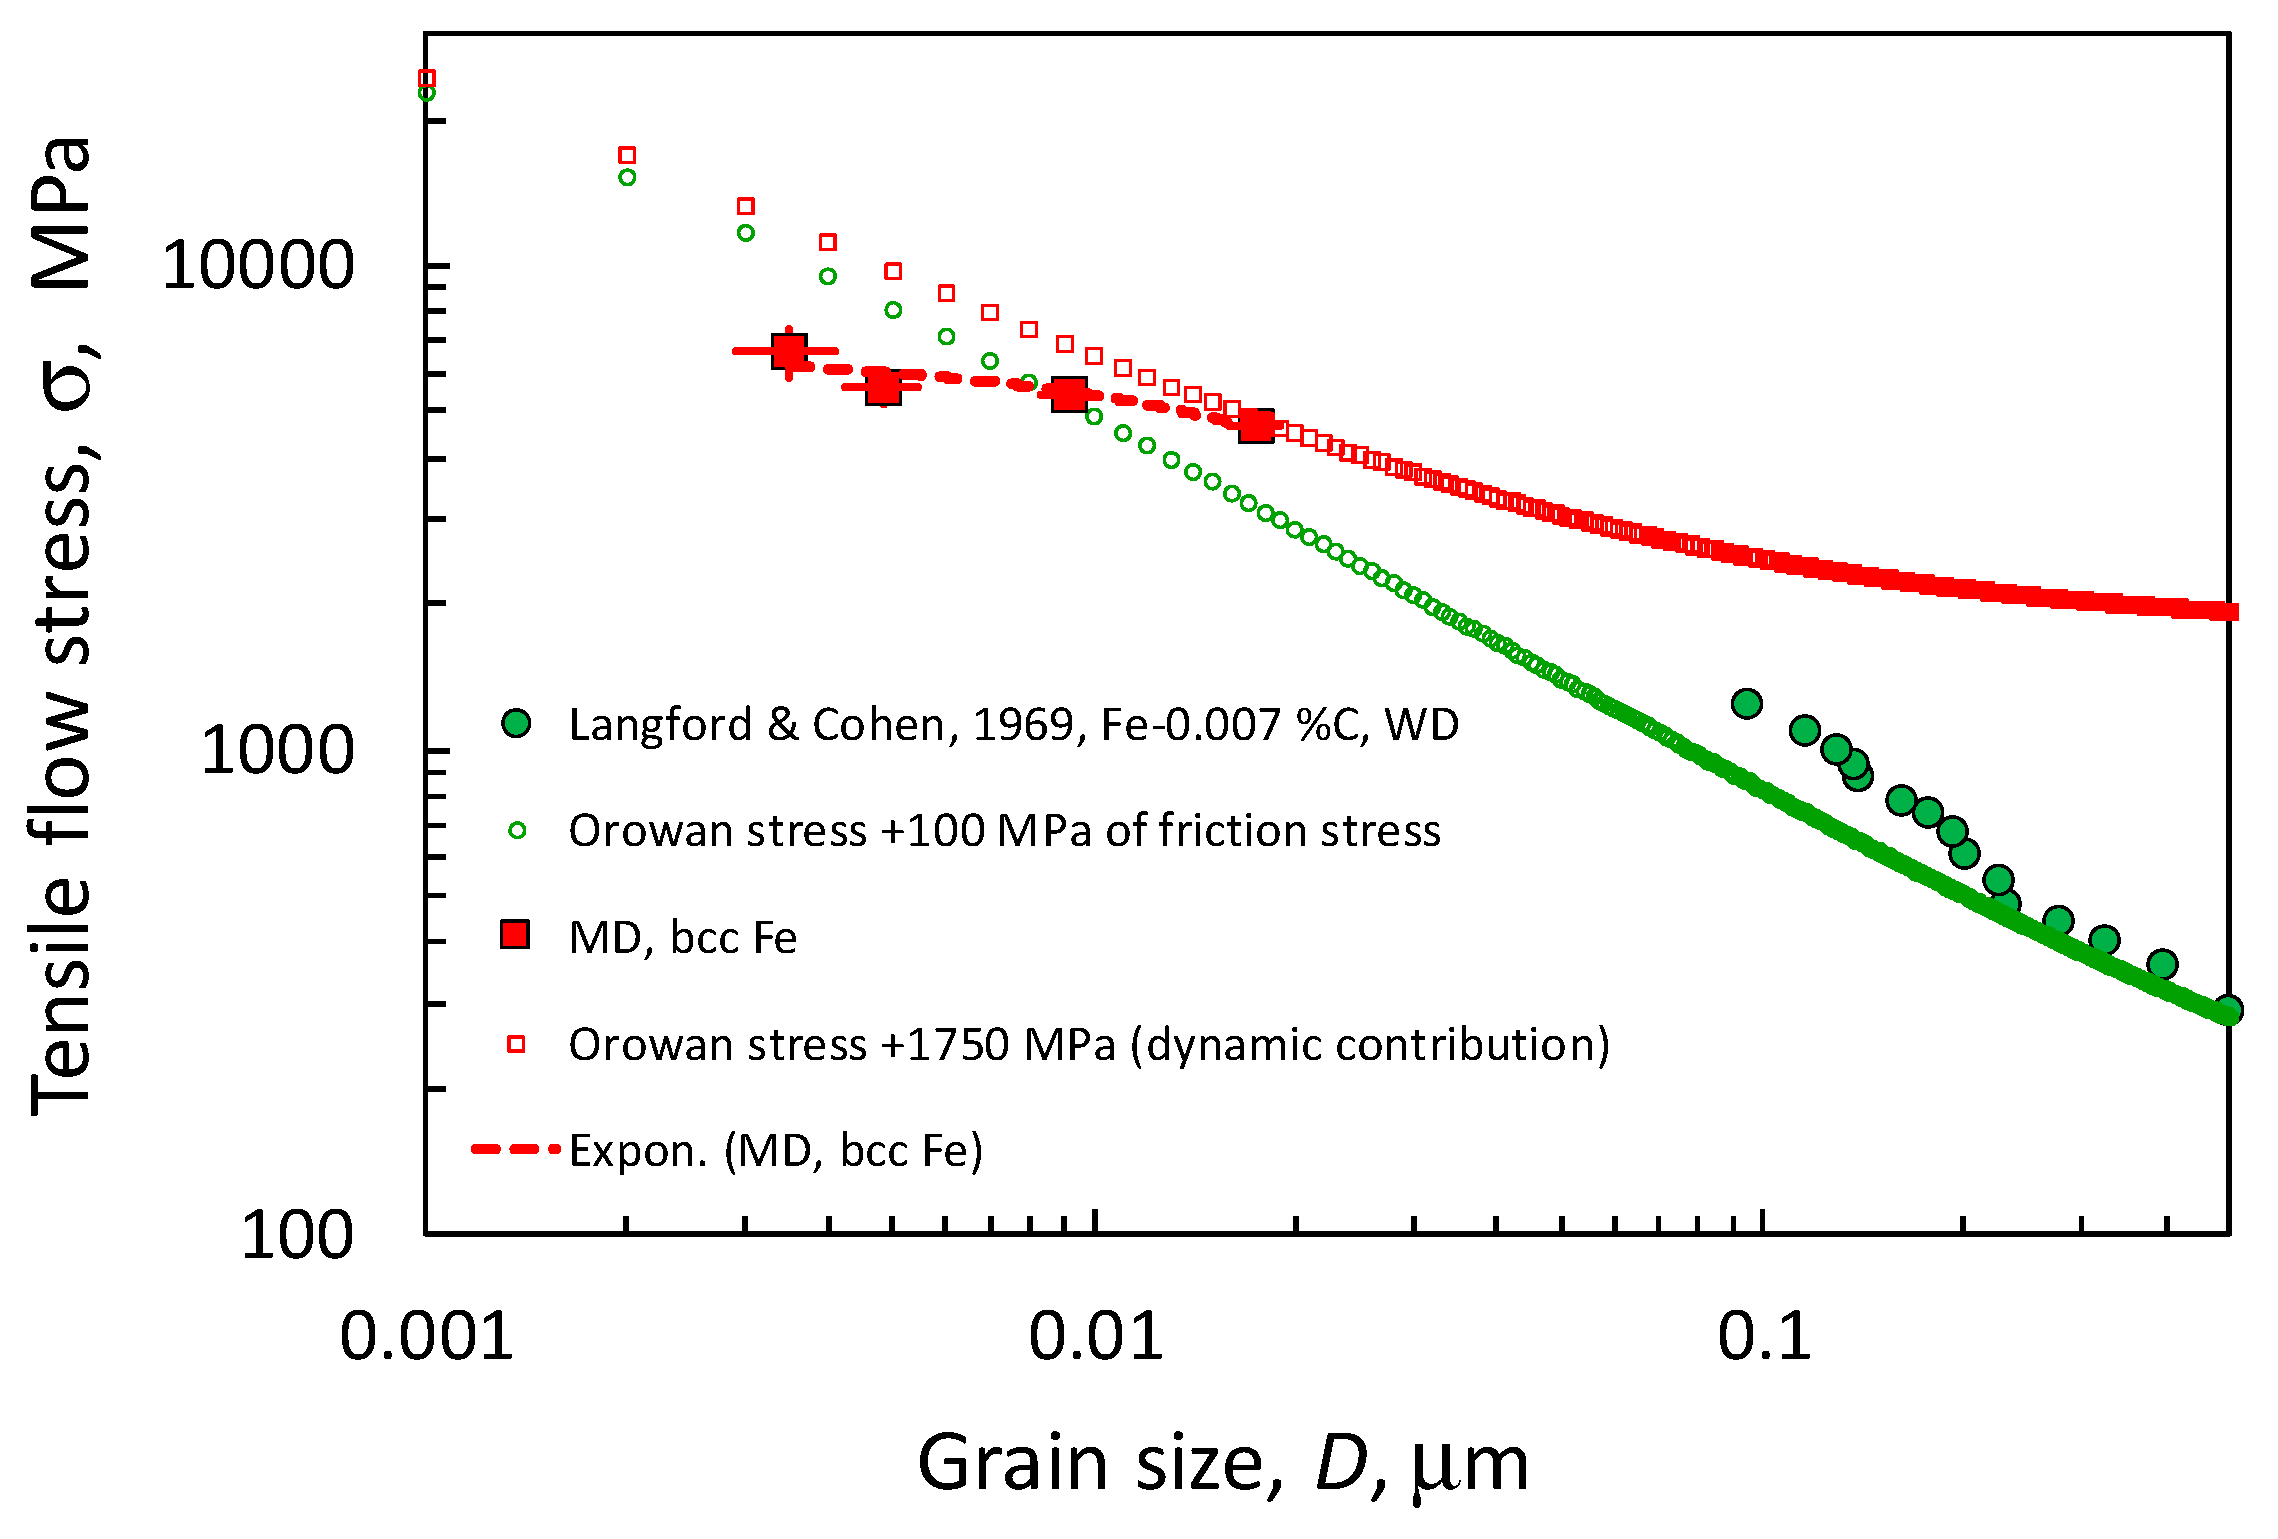
- One plausible explanation (among others) for the ultra-SPD transition has been proposed in this paper: In Stage IV, the previous cellular and subgrain structure evolves to a near-exclusively grain structure of shrinking average size as deformation goes on. Inside the grains, the dislocation density is limited to the maximum value allowed in Stage IV as far as its crossing requires a curvature of the gliding dislocations larger than the average curvature of the encircling grain cross-section. Beyond that point, fully crossing the whole grain section requires a flow stress that exceeds the critical stress for cutting through the intragranular dislocation density unable to increase its value, i.e., the grain size takes control of the flow stress. In wire drawing, the reduction of the grain cross-section is very rapid and the SHR is very high; in HPT, the decline is very weak, and the SHR is very small.
9. Suggestions for Further Research Work
- (a)
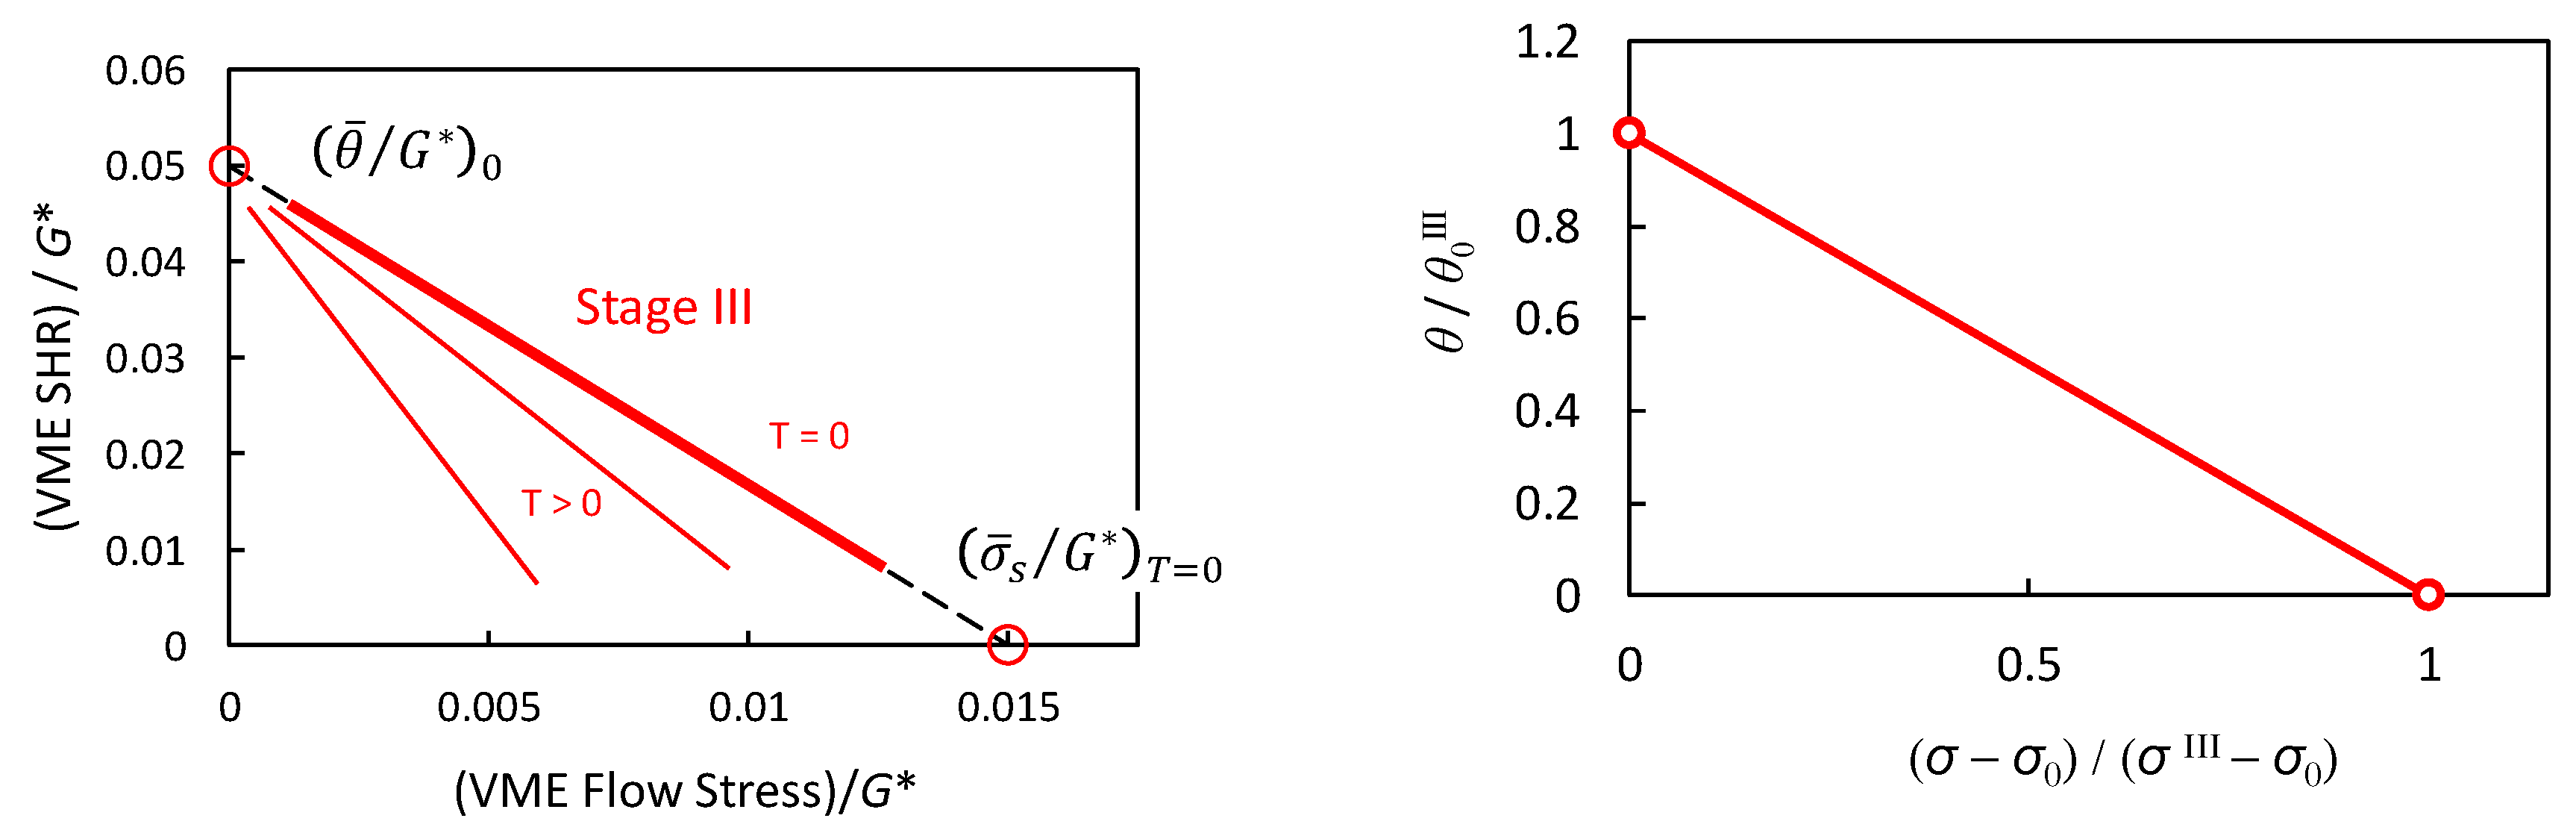
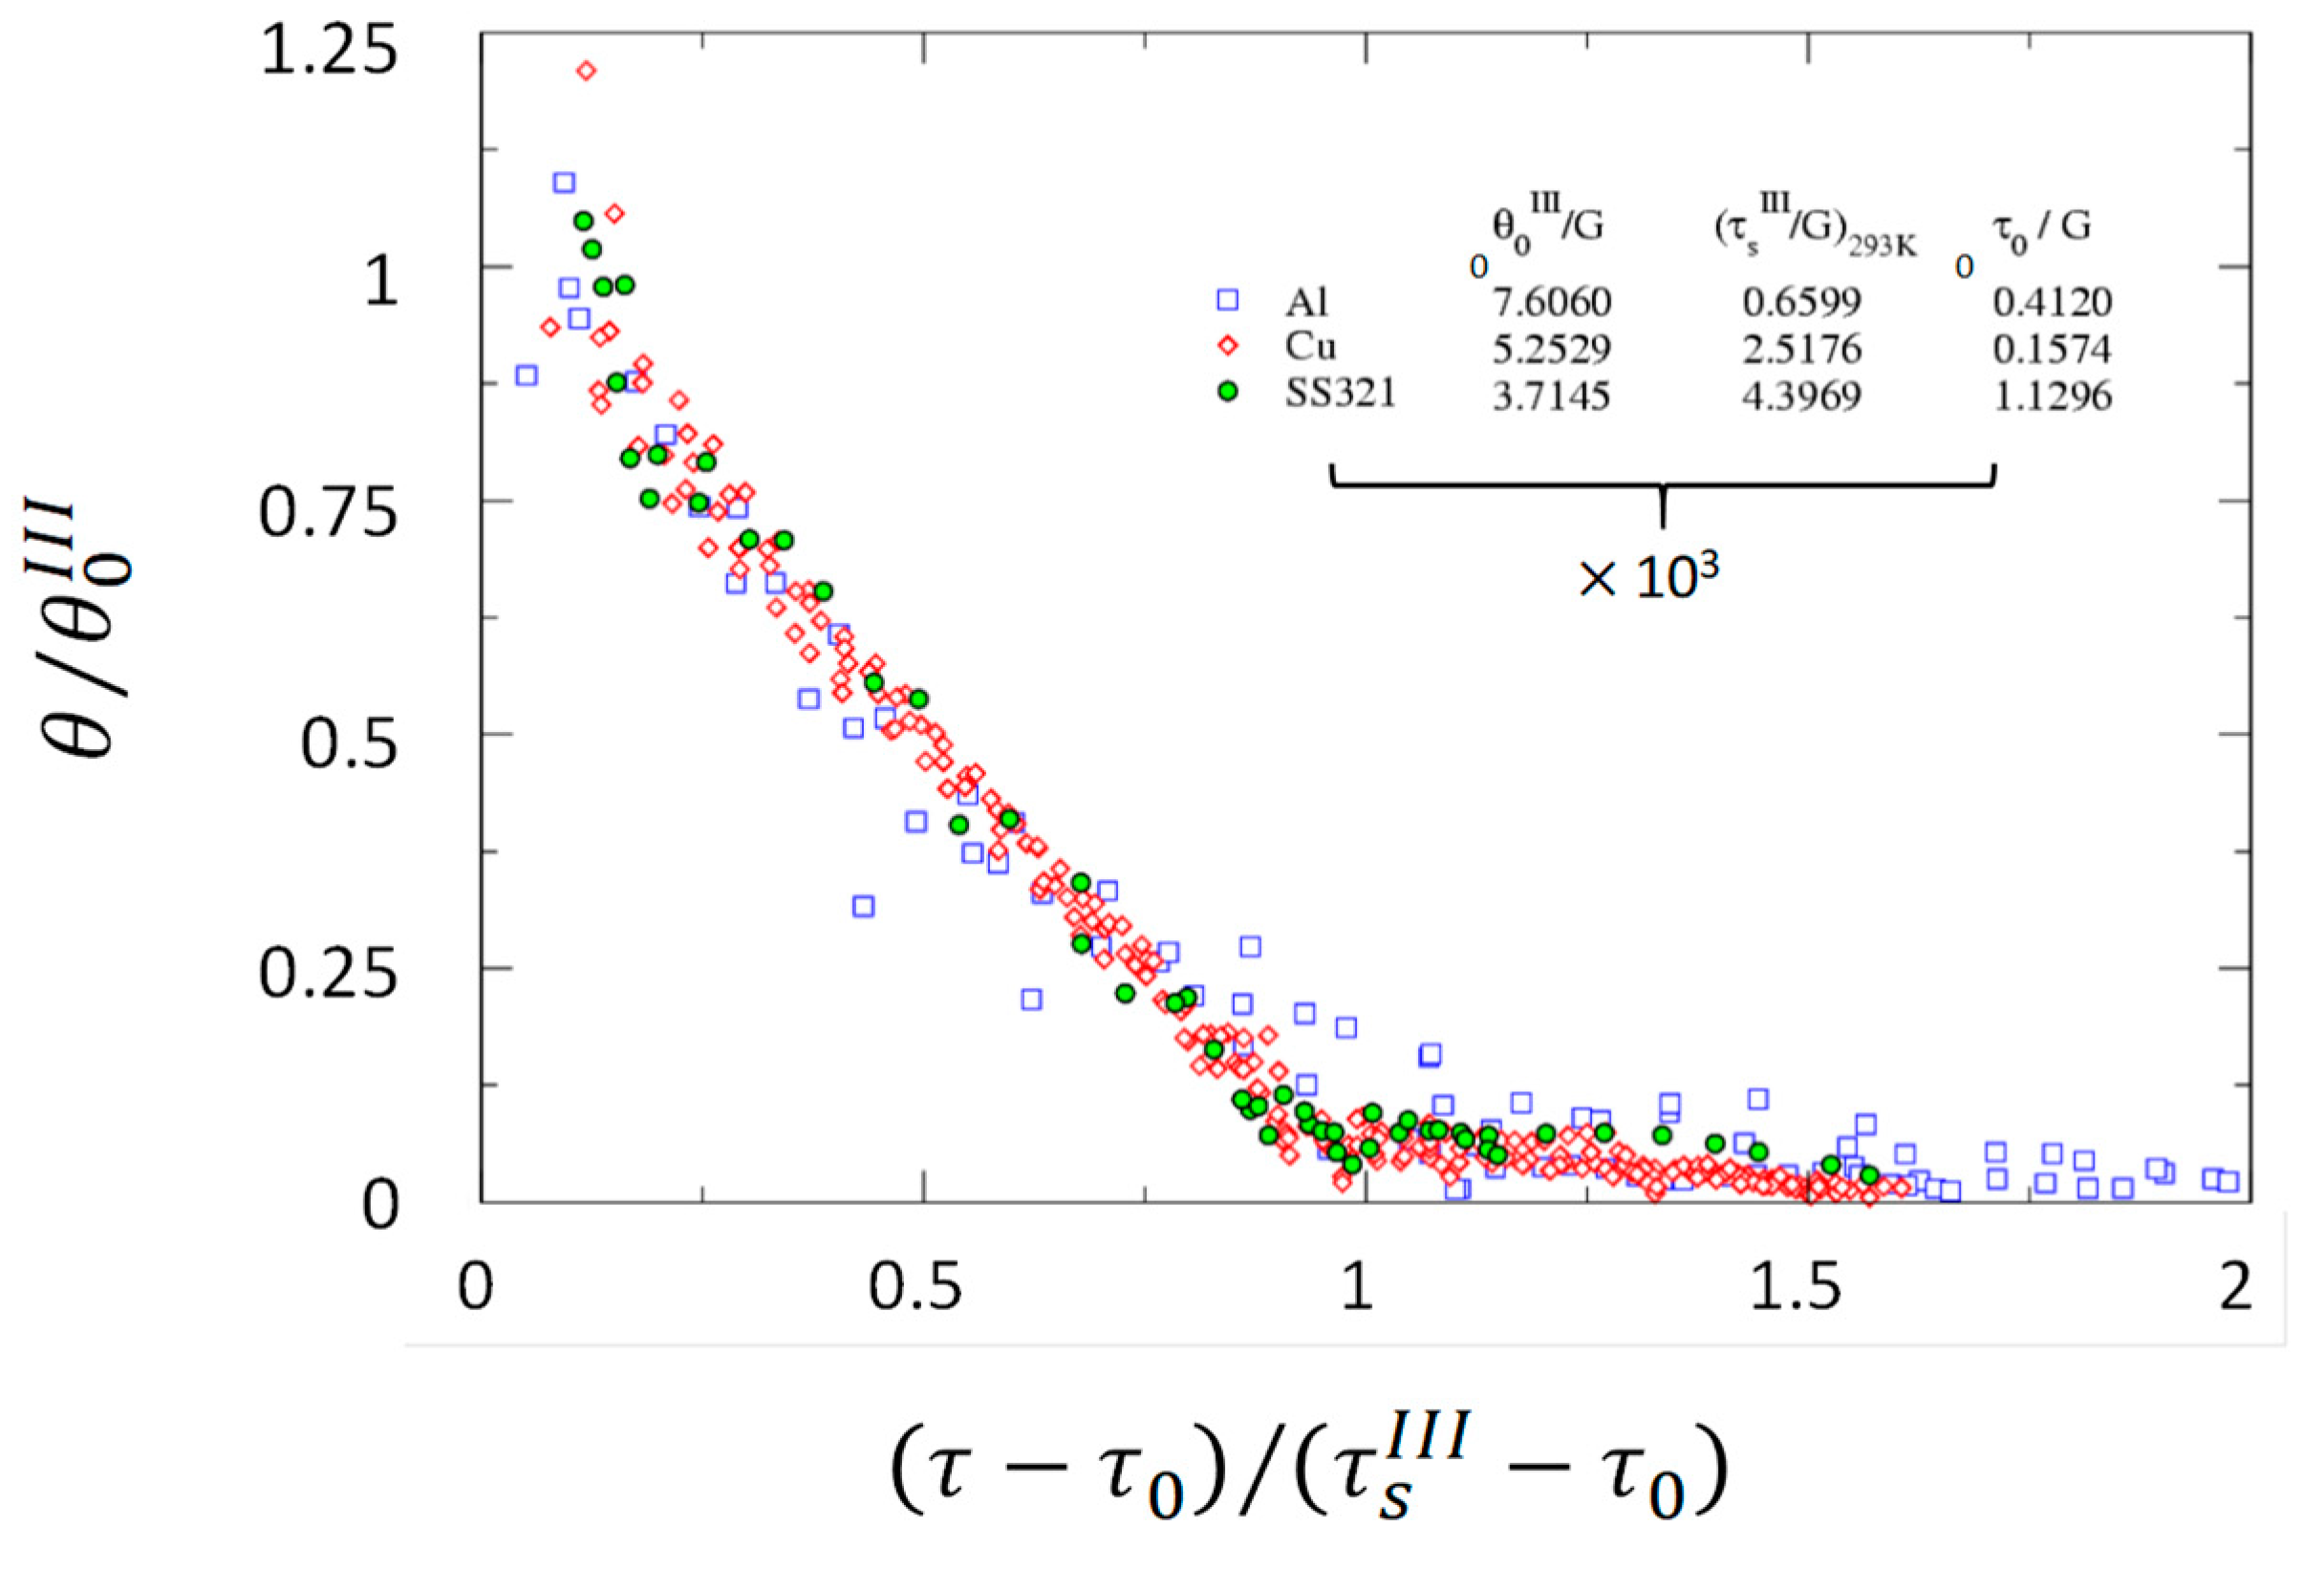
- The detailed mechanistic explanation of the recovery processes of Stage III responsible for the validity of the Voce stress–strain equation;
- (b)
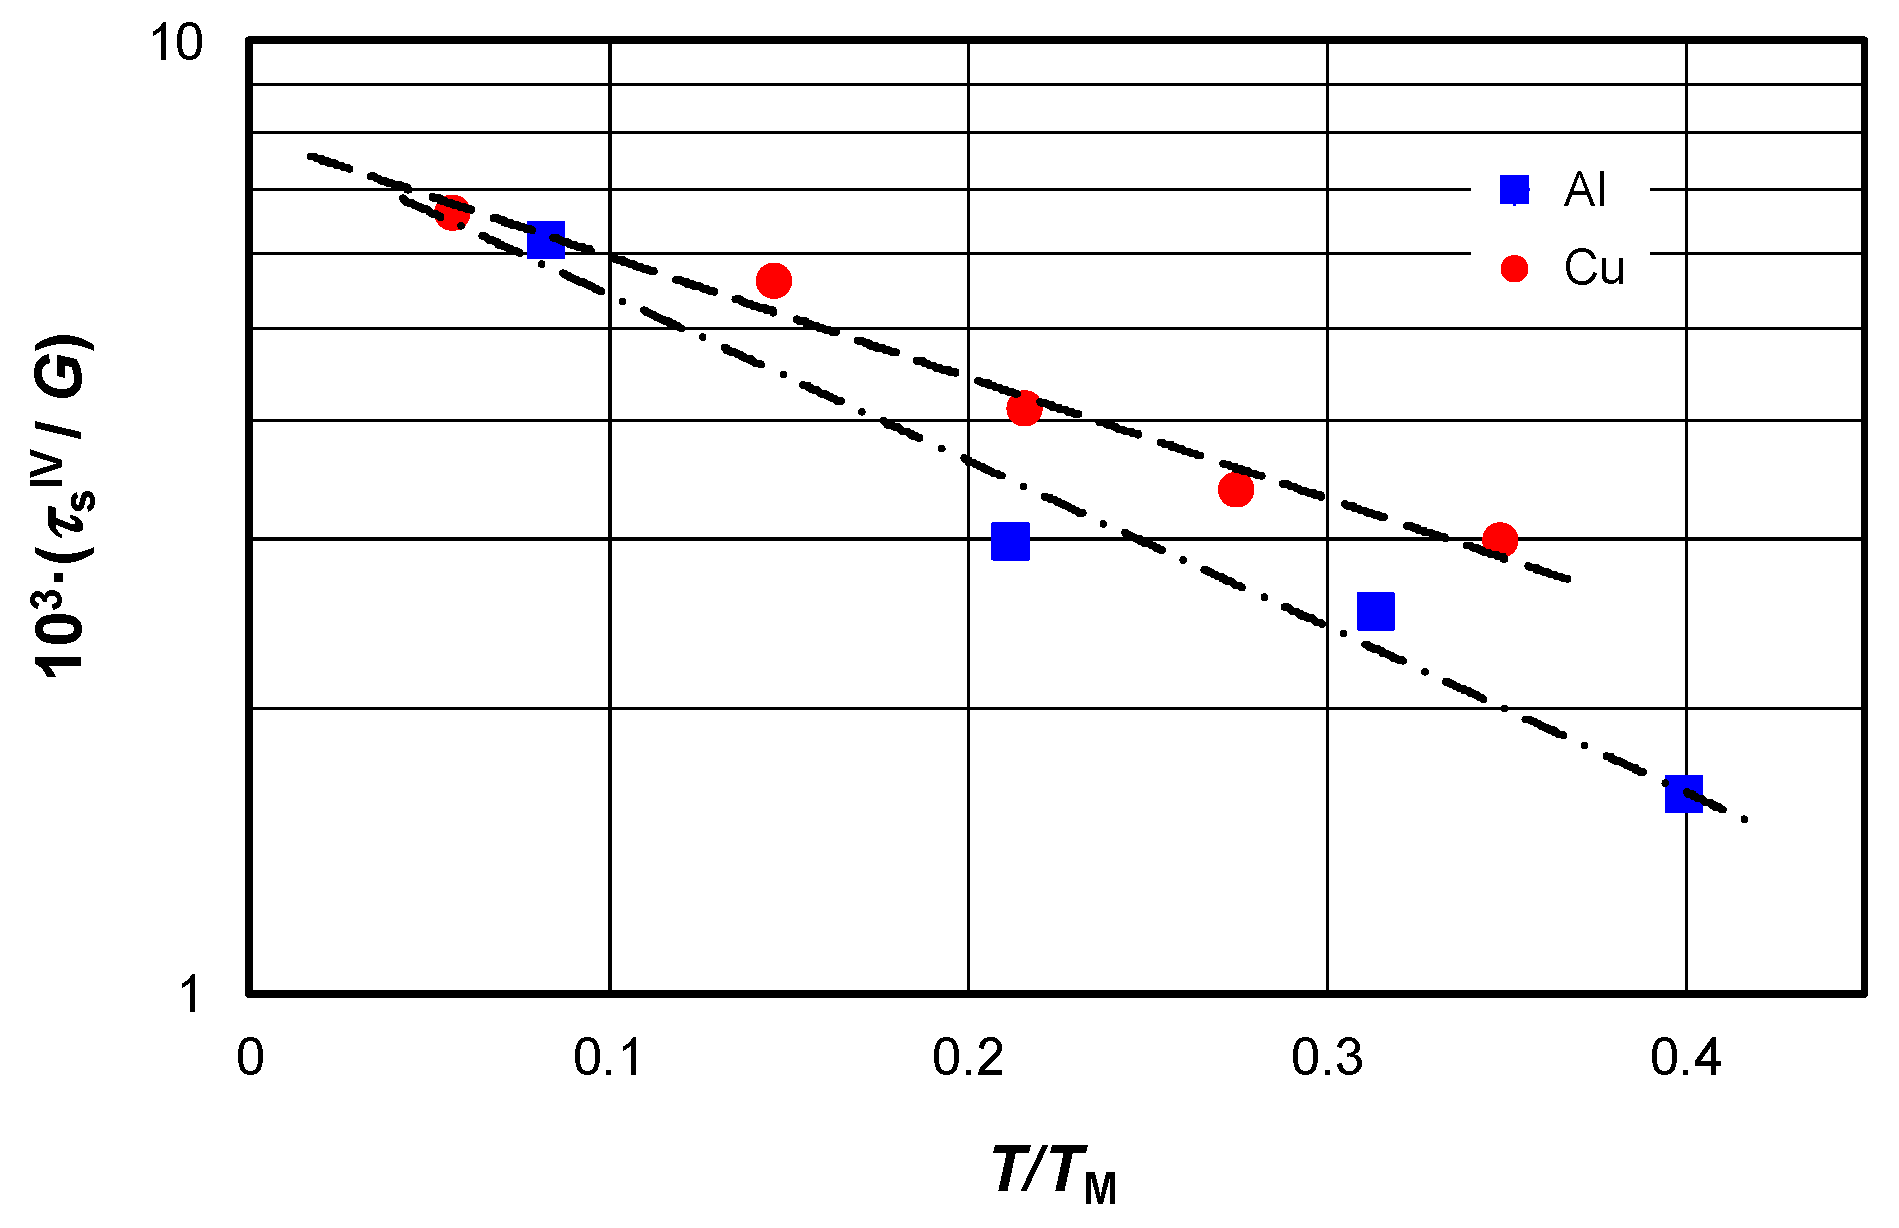
- The systematic study and characterization of the structural basis of Stage IV and its dependence of on temperature, strain rate, and SFE;
- (c)
- Confirmation of the authenticity of the recently proposed ultra-SPD stage and study of its micromechanistic origin is, of course, crucial.
- (d)
- If the authenticity of the new stage is confirmed, its full characterization will be an excellent research opportunity. The influence of chemical composition on this hardening transition should be indeed addressed; the influence of both purity and alloying also call for study. Similarly, the influence of the homologous deformation temperature, strain rate, and SFE on the emergence as well as the stability of the strength after the strains imparted would merit a the research effort.
Funding
Acknowledgments
Conflicts of Interest
References
- Basinski, S.J.; Basinski, Z.S. Plastic Deformation and Work Hardening. In Dislocations in Solids; Nabarro, F.R.N., Ed.; Amsterdam-Oxford: North Holland, The Netherlands, 1979; Volume 4, pp. 261–362. [Google Scholar]
- Gil Sevillano, J. Flow Stress and Work Hardening. In Materials Science and Technology. A Comprehensive Treatment; Cahn, R.V., Haasen, P., Kramer, R.J., Mughrabi, H., Eds.; Plastic Deformation and Fracture of Materials; VCH: Weinheim, Germany, 1993; Volume 4. [Google Scholar]
- Kocks, U.F.; Mecking, H. Physics and phenomenology of strain hardening: The FCC case. Prog. Mater. Sci. 2003, 48, 171–273. [Google Scholar] [CrossRef]
- Kubin, L.P. Dislocations, Mesoscopic Simulations and Plastic Flow; Oxford Series on Materials Modelling; Oxford University Press: Oxford, UK, 2019. [Google Scholar]
- Cordero, Z.C.; Knight, B.E.; Schuh, C.A. Six Decades of the Hall–Petch Effect—A Survey of Grain-Size Strengthening Studies on Pure Metals. Int. Mater. Rev. 2016, 61, 495–512. [Google Scholar] [CrossRef]
- De las Cuevas, F.; Gil Sevillano, J. Effects of temperature and strain rate in strain hardening in torsion of a twinning-induced plasticity steel. Mater. Sci. Technol. 2019, 35, 669–679. [Google Scholar] [CrossRef]
- Rohatgi, A.; Vecchio, K.S.; Gray, G.T., III. The influence of stacking fault energy on the mechanical behaviour of Cu and Cu-Al alloys: Deformation twinning, work hardening and dynamic recovery. Metall. Mater. Trans. A 2001, 32, 135–145. [Google Scholar] [CrossRef]
- Salem, A.A.; Kalidindi, S.R.; Doherty, R.D.; Semiatin, S.L. Strain hardening due to deformation twinning in alpha-titanium: Mechanisms. Metall. Mater. Trans. A 2006, 37, 259–268. [Google Scholar] [CrossRef]
- Gil Sevillano, J.; Van Houtte, P.; Aernoudt, E. Large strain work hardening and textures. Prog. Mater. Sci. 1980, 25, 69–412. [Google Scholar] [CrossRef]
- Backofen, W.A. Deformation Processing; Addison Wesley: Boston, MA, USA, 1972. [Google Scholar]
- Alberdi Garitaonandia, J.M. Grandes Deformaciones Plásticas en Frío en Policristales de Cobre y Aluminio (torsión). Ph.D. Thesis, Faculty of Sciences, University of Navarra, San Sebastián, Spain, 1984. [Google Scholar]
- Zehetbauer, M.; Seumer, V. Cold work hardening in stages IV and V in F.C.C. metals—I. Experiments and interpretation. Acta Metall. Mater. 1993, 41, 577–588. [Google Scholar] [CrossRef]
- Rollett, A.D.; Kocks, U.F. A review of the stages of work hardening. In Dislocations 93; Rabier, J., George, A., Bréchet, Y., Kubin, L.P., Eds.; Solid State Phenomena; Trans Tech Publications Ltd.: Baech, Switzerland, 1993; Volume 35–36, pp. 1–18. [Google Scholar]
- Siethoff, H.; Schroeter, W.; Metallkunde, Z. New phenomena in the plasticity of semiconductors and FCC metals at high temperatures. I.-Theoretical Models. Z. Metallkd. 1984, 75, 475–481. [Google Scholar]
- Aldazabal, J.; Alberdi, J.M.; Gil Sevillano, J. Stage IV: Microscopic or mesoscopic effect? In Nanomaterials by Severe Plastic Deformation: Proceedings of the Conference Nanomaterials by Severe Plastic Deformation-nanoSPD2, Vienna; Zehetbauer, M., Valiev, R.Z., Eds.; Wiley-VCH: Weinhein, Germany, 2004; pp. 65–71. [Google Scholar]
- Kok, S.; Beaudoin, A.J.; Tortorelli, D.A. On the development of stage IV hardening using a model based on the mechanical threshold. Acta Mater. 2002, 50, 1653–1667. [Google Scholar] [CrossRef]
- Estrin, Y.; Toth, L.S.; Molinari, A.; Bréchet, Y. A dislocation-based model for all hardening stages in large strain deformation. Acta Mater. 1998, 46, 5509–5522. [Google Scholar] [CrossRef]
- Gil Sevillano, J.; Matey Muñoz, L.; Flaquer Fuster, J. Ciels de Van Gogh et propriétés mécaniques. J. Phys. IV 1998, 8, Pr4-Pr155–Pr4-Pr165. [Google Scholar] [CrossRef]
- Gil Sevillano, J.; González, D.; Martínez-Esnaola, J.M. Heterogeneous deformation and internal stresses developed in BCC wires by axisymmetric elongation. Mater. Sci. Forum 2007, 550, 75–84. [Google Scholar] [CrossRef]
- Young, C.M.; Anderson, L.J.; Sherby, O.D. On the steady state flow stress of iron at low temperature and large strains. Metall. Trans. 1974, 5, 519–520. [Google Scholar] [CrossRef]
- Gil Sevillano, J. On the limits of strain hardening by plastic deformation. In Proceeding International Symposium on Plastic Deformation and Texture Analysis Alcoy (Spain) 2012; Amigó Borrás, V., Ed.; Editorial Universitat Politècnica de València: Valencia, Spain, 2012; pp. 1–15. [Google Scholar]
- Gil Sevillano, J.; Aldazabal, J.; Aldazabal, I. Elasto-plastic behaviour of a columnar structure of nanocrystalline iron with sharp ‹011› texture. Materialia 2018, 2, 218–230. [Google Scholar]
- Segal, V.M. Invention Certificate of the USSR, No. 575,892 (1977) and Methods of investigation of strain-deformed state in processes of plastic change of shape. Ph.D. Thesis, Physico-Technical Institute of Acad. Sci. of Belorus, SSR, Minsk, Russia, 1974. [Google Scholar]
- Segal, V.M.; Reznikov, V.I.; Drobyshevkij, A.E.; Kopylov, V.I. Plastic treatment of metals by plastic shear. Russ. Metall. 1981, 1, 115–123. [Google Scholar]
- Valiev, R.Z.; Kaibyshev, O.A.; Kuznetsov, R.I.; Musalimov, R.S.; Tsenev, N.K. Low-temperature superplasticity of metallic materials. Dokl. Akad. Nauk. SSSR 1988, 301, 864–866. [Google Scholar]
- Valiev, R.Z.; Krasilnikov, N.A.; Tsenev, N.K. Plastic deformation of alloys with submicron-grained structure. Mater. Sci. Eng. A 1991, 137, 35. [Google Scholar] [CrossRef]
- Valiev, R.Z.; Islamgaliev, R.K.; Alexandrov, I.V. Bulk nanostructured materials from severe plastic deformation. Prog. Mater. Sci. 2000, 45, 103–189. [Google Scholar] [CrossRef]
- Valiev, R.Z.; Langdon, T.G. Principles of equal-channel angular pressing as a processing tool for grain refinement. Prog. Mater. Sci. 2006, 51, 881–981. [Google Scholar] [CrossRef]
- Estrin, Y.; Vinogradov, A. Extreme grain refinement by severe plastic deformation: A wealth of challenging results. Acta Mater. 2013, 61, 782–817. [Google Scholar] [CrossRef]
- Dalla Torre, F.H.; Pereloma, E.V.; Davies, C.H.J. Strain hardening behaviour and deformation kinetics of Cu deformed by equal channel angular extrusion from 1 to 16 passes. Acta Mater. 2006, 54, 1135–1146. [Google Scholar] [CrossRef]
- Figueiredo, R.B.; Langdon, T.G. The development of superplastic ductilities and microstructural homogeneity in a magnesium ZK60 alloy processed by ECAP. Mater. Sci. Eng. A 2006, 430, 151–156. [Google Scholar] [CrossRef]
- Vinogradov, A.; Suzuki, T.; Hashimoto, S.; Kitagawa, K.; Kuznetsov, A.; Dobatkin, S. Structure and mechanical properties of submicrocrystalline copper produced by ECAP to very high strains. Mater. Sci. Forum 2006, 503–504, 971–976. [Google Scholar] [CrossRef]
- Wang, Y.L.; Lapovok, R.; Wang, J.T.; Qi, Y.S.; Estrin, Y. Thermal behaviour of copper processed by ECAP with and without back pressure. Mater. Sci. Eng. A 2015, 628, 21–29. [Google Scholar] [CrossRef]
- Valiev, R.Z.; Alexandrov, I.V.; Zhu, Y.T.; Lowe, T.C. Paradox of strength and ductility in metals processed by severe plastic deformation. J. Mater. Res. 2002, 17, 5–8. [Google Scholar] [CrossRef]
- Mishra, A.; Kad, B.K.; Gregori, F.; Meyers, M.A. Microstructural evolution in copper subjected to severe plastic deformation: Experiments and analysis. Acta Mater. 2007, 55, 13–28. [Google Scholar] [CrossRef]
- Kulczyk, M.; Pachla, W.; Swiderska-Sroda, A.; Krasilnikov, N.; Diduszko, R.; Mazur, S.A.; Lojkowski, W.; Kurzydlowski, K.J. Combination of ECAP and Hydrostatic Extrusion for UFG Microstructure Generation in Nickel. Solid State Phenom. 2006, 114, 51–56. [Google Scholar] [CrossRef]
- Zhilyaev, A.P.; Nurismalova, G.V.; Baró, M.; Valiev, R.Z.; Langdon, T.G. Thermal stability and microstructural evolution in ultra-fined nickel after equal-channel angular pressing (ECAP). Metall. Mater. Trans. A 2002, 33, 1865–1868. [Google Scholar] [CrossRef]
- Raju, K.M.; Krishna, M.G.; Padmanabhan, K.A.; Muraleedharan, K.; Gurao, N.P.; Wilde, G. Grain size and grain boundary character disribution in ultra-fine grained (ECAP) nickel. Mater. Sci. Eng. A 2008, 491, 1–7. [Google Scholar] [CrossRef]
- Liu, F.; Yuan, H.; Goel, S.; Liu, Y.; Wang, J.T. Bulk nanolaminated nickel: Preparation, microstructure, mechanical property, and thermal stability. Metall. Mater. Trans. A 2017, 49, 576–594. [Google Scholar] [CrossRef]
- Muñoz Bolaños, J.A.; Higuera Cobos, O.F.; Cabrera Marrero, J.M. Strain hardening behavior of ARMCO iron processed by ECAP. IOP Conf. Ser. Mater. Sci. Eng. 2014, 63, 1–8. [Google Scholar]
- Muñoz, J.A.; Higuera, O.F.; Cabrera, J.M. Microstructural and mechanical study in the plastic zone of ARMCO Iron processed by ECAP. Mater. Sci. Eng. 2017, 697, 24–36. [Google Scholar] [CrossRef]
- Han, B.Q.; Lavernia, E.J.; Mohamed, F.A. Dislocation structure and deformation in iron processed by equal-channel-angular pressing. Metall. Mater. Trans. A 2004, 35, 1343–1350. [Google Scholar] [CrossRef]
- Segal, V.M.; Reznikov, V.I.; Kopylov, V.I.; Pavlik, D.A.; Malyshev, V.F. Protsessy Plasticheskogo Strukturoobrazovaniya Metallov; Nauka i Tekhnika: Minsk, Russia, 1994; p. 232. [Google Scholar]
- Sus-Ryszkowska, M.; Wejrzanowski, T.; Pakieła, Z.; Kurzydłowski, K.J. Microstructure of ECAP severely deformed iron and its mechanical properties. Mater. Sci. Eng. 2004, 369, 151–156. [Google Scholar] [CrossRef]
- Vinogradov, A.Y.; Stolyarov, V.V.; Hashimoto, S.; Valiev, R.Z. Cyclic behavior of ultrafine-grain titanium produced by severe plastic deformation. Mater. Sci. Eng. A. 2001, 318, 163–173. [Google Scholar] [CrossRef]
- Zhao, X.; Fu, W.; Yang, X.; Langdon, T.G. Microstructure and properties of pure titanium processed by equal-channel angular pressing at room temperature. Scr. Mater. 2008, 59, 542–545. [Google Scholar] [CrossRef]
- Bridgman, P.W. Studies in Large Plastic Flow and Fracture. With Special Emphasis on the Effects of Hydrostatic Pressure; Harvard Univ. Press: Cambridge, MA, USA, 1952. [Google Scholar]
- Edalati, K.; Horita, Z. A Review on High-Pressure Torsion (HPT) from 1935 to 1988. Mater. Sci. Eng. A 2016, 652, 325–352. [Google Scholar] [CrossRef]
- Erbel, S. Mechanizm Zmian Własności Metali Poddanych Wielkim Odkształceniom; Wydawnictwa PW: Warszawa, Poland, 1976. [Google Scholar]
- Bryla, K.; Edalati, K. Historical studies by Polish scientist on ultrafine-grained materials by severe plastic deformation. Mater. Trans. 2019, 60, 1553–1560. [Google Scholar] [CrossRef]
- Pippan, R.; Wetscher, F.; Hafok, M.; Vorhauer, A.; Zhyliaev, I.S. The limits of refinement by severe plastic deformation, the limits of refinement by plastic deformation. Adv. Eng. Mater. 2006, 8, 1046–1056. [Google Scholar] [CrossRef]
- Zhyliaev, A.P.; Langdon, T.G. Using high-pressure torsion for metal processing: Fundamentals and applications. Prog. Mater. Sci. 2008, 53, 893–979. [Google Scholar] [CrossRef]
- Starink, M.J.; Cheng, X.; Yang, S. Hardening of pure metals by high-pressure torsion: A physically based model employing volume-averaged defect evolutions. Acta Mater. 2013, 61, 183–192. [Google Scholar] [CrossRef]
- Kawasaki, M. Different models of hardness evolution in ultrafine-grained materials processed by high-pressure torsion. J. Mater. Sci. 2013, 49, 18–34. [Google Scholar] [CrossRef]
- Balasubramanian, N.; Langdon, T.G. The strength–grain size relationship in ultrafine-grained metals. Metall. Mater. Trans A 2017, 47, 5827–5838. [Google Scholar] [CrossRef]
- Edalati, K. Metallurgical Alchemy by ultra-severe plastic deformation via high-pressure torsion process. Mater. Trans. 2019, 60, 1221–1229. [Google Scholar] [CrossRef]
- Edalati, K.; Cubero-Sesin, J.M.; Alhamidi, A.; Mohamed, I.F.; Horita, Z. Influence of severe plastic deformation at cryogenic temperature on grain refinement and softening of pure metals: Investigation using high-pressure torsion. Mater. Sci. Eng. A 2014, 613, 103–110. [Google Scholar] [CrossRef]
- Langford, G.; Cohen, M. Strain hardening of iron by severe plastic deformation. Trans. ASM 1969, 62, 623–638. [Google Scholar]
- Pippan, R.; Scheriau, S.; Taylor, A.; Hafok, M.; Hohenwarter, A.; Bachmaier, A. Saturation of fragmentation during severe plastic deformation. Annu. Rev. Mater. Res. 2010, 40, 319–343. [Google Scholar] [CrossRef]
- Edalati, K.; Horita, Z. High-pressure torsion of pure metals: Influence of atomic bond parameters and stacking fault energy on grain size and correlation with hardness. Acta Mater. 2011, 59, 6831–6836. [Google Scholar] [CrossRef]
- Edalati, K.; Horita, Z. Significance of homologous temperature in softening behavior and grain size of pure metals processed by high-pressure torsion, Mater. Sci. Eng. 2011, 528, 7514–7523. [Google Scholar] [CrossRef]
- Edalati, K.; Akama, D.; Nishio, A.; Lee, S.; Yonenaga, Y.; Cubero-Sesin, J.M.; Horita, Z. Influence of dislocation-solute atom interactions and stacking fault energy on grain size of single-phase alloys after severe plastic deformation using high-pressure torsion. Acta Mater. 2014, 69, 68–77. [Google Scholar] [CrossRef]
- Gil Sevillano, J.; Aldazabal, I.; Luque, A.; Aldazabal, J. Atomistic simulation of the elongation response of a 〈011〉 oriented columnar nano-grain bcc Fe polycrystalline sample. Meccanica 2016, 51, 401–413. [Google Scholar] [CrossRef]
- Langford, G.; Cohen, M. Calculation of cell-size strengthening of wire-drawn iron. Metall. Trans. 1970, 1, 1478–1480. [Google Scholar] [CrossRef]
- Biswas, C.P. Strain Hardening of Titanium by Severe Plastic Deformation. Ph.D. Thesis, Massachusetts Institute of Tecnology, Cambridge, MA, USA, 1973. [Google Scholar]
- Edalati, K.; Horita, Z.; Fujiwara, H.; Ameyama, K. Cold consolidation of ball-milled titanium powders using high-pressure torsion. Metall. Mater. Trans. A 2010, 41, 3308–3317. [Google Scholar] [CrossRef]
- Rack, H.J.; Cohen, M. Strain hardening of iron–titanium alloys at very large strains. Mater. Sci. Eng. 1970, 6, 320–326. [Google Scholar] [CrossRef]
- Hosokawa, A.; Ii, S.; Tsuchiya, K. Work hardening and microstructural development during high-pressure torsion in pure iron. Mater. Trans. 2014, 55, 1097–1103. [Google Scholar] [CrossRef]
- Mehta, S.; Varma, S.K. Structure-sensitive properties during room-temperature wire drawing at various speeds in nickel 200. J. Mater. Sci. 1992, 27, 3570–3574. [Google Scholar] [CrossRef]
- Nuttall, J.; Nutting, J. Structure and properties of heavily cold-worked fcc metals and alloys. Metal Sci. 1978, 12, 430–438. [Google Scholar] [CrossRef]
- Zimmer, W.H.; Hecker, S.S.; Rohr, D.L.; Murr, L.E. Large strain plastic deformation of commercially pure nickel. Met. Sci. 1983, 17, 198–208. [Google Scholar] [CrossRef]
- Zepeda-Ruiz, L.A.; Stukowski, A.; Oppelstrup, T.; Bulatov, V.V. Probing the limits of metal plasticity with molecular dynamics simulations. Nature 2017, 550, 492–495. [Google Scholar] [CrossRef]
- Frost, H.J.; Ashby, M.F. Deformation Mechanism Maps: The Plasticity and Creep of Metals and Ceramics; Pergamon Press: Oxford, UK, 1982. [Google Scholar]


| Stage | Comments | ||
|---|---|---|---|
| III | 0.015 | 1016 | Limited by max. disloc. density |
| IV | 0.024 | 2.6 × 10¹⁶ | |
| ultra-SPD | Probably ≤ 0.08 | 2.6 × 10¹⁶ | Limited by sat. grain size, 3 nm |
| bcc and hcp wire-drawing | 0.08 | 2.6 × 10¹⁶ | |
| absolute ideal limit | 0.3 | 4 × 10¹⁸ | Limited by amorphization |
© 2020 by the author. Licensee MDPI, Basel, Switzerland. This article is an open access article distributed under the terms and conditions of the Creative Commons Attribution (CC BY) license (http://creativecommons.org/licenses/by/4.0/).
Share and Cite
Gil Sevillano, J. Dynamic Steady State by Unlimited Unidirectional Plastic Deformation of Crystalline Materials Deforming by Dislocation Glide at Low to Moderate Temperatures. Metals 2020, 10, 66. https://doi.org/10.3390/met10010066
Gil Sevillano J. Dynamic Steady State by Unlimited Unidirectional Plastic Deformation of Crystalline Materials Deforming by Dislocation Glide at Low to Moderate Temperatures. Metals. 2020; 10(1):66. https://doi.org/10.3390/met10010066
Chicago/Turabian StyleGil Sevillano, Javier. 2020. "Dynamic Steady State by Unlimited Unidirectional Plastic Deformation of Crystalline Materials Deforming by Dislocation Glide at Low to Moderate Temperatures" Metals 10, no. 1: 66. https://doi.org/10.3390/met10010066
APA StyleGil Sevillano, J. (2020). Dynamic Steady State by Unlimited Unidirectional Plastic Deformation of Crystalline Materials Deforming by Dislocation Glide at Low to Moderate Temperatures. Metals, 10(1), 66. https://doi.org/10.3390/met10010066