Article

Self-Reduction Behavior of Bio-Coal Containing Iron Ore Composites

by
Asmaa A. El-Tawil
1,*,
Hesham M. Ahmed
1,2,
Lena Sundqvist Ökvist
1,3 and
Bo Björkman
1
1
Department of Civil, Environmental and Natural Resources Engineering, Minerals and Metallurgical Engineering, MiMeR, Luleå University of Technology, 97187 Luleå, Sweden
2
Central Metallurgical Research and Development Institute, P.O Box 87, Helwan, 11421 Cairo, Egypt
3
Swerim AB, 971 25 Luleå, Sweden
*
Author to whom correspondence should be addressed.
Metals 2020, 10(1), 133; https://doi.org/10.3390/met10010133
Submission received: 19 December 2019 / Revised: 10 January 2020 / Accepted: 14 January 2020 / Published: 16 January 2020
(This article belongs to the Special Issue Advances in Pyrometallurgy)

Abstract

:
The utilization of CO2 neutral carbon instead of fossil carbon is one way to mitigate CO2 emissions in the steel industry. Using reactive reducing agent, e.g., bio-coal (pre-treated biomass) in iron ore composites for the blast furnace can also enhance the self-reduction. The current study aims at investigating the self-reduction behavior of bio-coal containing iron ore composites under inert conditions and simulated blast furnace thermal profile. Composites with and without 10% bio-coal and sufficient amount of coke breeze to keep the C/O molar ratio equal to one were mixed and Portland cement was used as a binder. The self-reduction of composites was investigated by thermogravimetric analyses under inert atmosphere. To explore the reduction progress in each type of composite vertical tube furnace tests were conducted in nitrogen atmosphere up to temperatures selected based on thermogravimetric results. Bio-coal properties as fixed carbon, volatile matter content and ash composition influence the reduction of iron oxide. The reduction of the bio-coal containing composites begins at about 500 °C, a lower temperature compared to that for the composite with coke as only carbon source. The hematite was successfully reduced to metallic iron at 850 °C by using bio-coal, whereas with coke as a reducing agent temperature up to 1100 °C was required.

1. Introduction

Ore-based ironmaking via the blast furnace (BF) dominates the metal supply for steel making [1]. For every ton of steel produced, on average 1.83 tons of CO2 was emitted in 2017. According to the World Steel Association, the iron and steel industry accounts for approximately 7% to 9% of total world CO2 emission [2]. Coke and coal as main reducing agents in the BF are the main contributors to CO2 emitted during iron and steel making. The European Union (EU) has set a target to cut 80% of the CO2 of fossil carbon, by 2050 [3]. In several studies the possible decrease in fossil CO2 emissions by using biomass is reported [4,5,6].
The use of raw biomass as a reducing agent in the BF is difficult due to high moisture content, low content of fixed carbon (Cfix) as well as a high content of volatile matter (VM) and oxygen [7,8]. Different pretreatment technologies like pyrolysis [9], torrefaction [10], etc. can convert biomass into products with properties suitable for metallurgical applications. Pretreated biomass (bio-coals) has higher content of Cfix, lower contents of VM and oxygen, higher calorific value and can be pulverized without the formation of high ratio of fibers, properties which overall correspond more to the ones of injection coal [10,11]. It was reported that 70% of mass yield is retained as a solid product (char) during torrefaction process while 30% of mass is converted to gases [12]. The opposite is found for highly pretreated biomass, which is characterized by low char yield (~38% mass yield) as a big part of VM was removed during process [13]. It can be an advantage to use torrefied product as reducing agent in composites containing iron oxide if remaining volatile contribute to the reduction. To select suitable bio-coals for use in composites with iron oxide an improved knowledge on the effect from bio-coal properties is required.
Swedish industry aims to reduce the CO2 emission by different means and in the short term, this includes, e.g., improving the energy efficiency of the process, replacing fossil coal with reactive carbonaceous material like bio-coal (pretreated biomass) and in the longer term to use hydrogen. The use of biomass resources is a possible alternative in Sweden, as there are biomass resources available from forestland, areas estimated to be 28.1 million hectares [14]. The use of bio-coal as part of top charged briquettes also containing iron oxide has the potential to lower the thermal reserve zone temperature (TRZ) of the BF and thereby give a high replacement ratio to coke due to improved gas efficiency [15].
Partial replacement of coke by bio-coals and raw biomass in self-reducing mixtures or composites is reported in the literature [16,17,18,19,20,21,22,23,24,25,26,27]. The effect of the C/O molar ratio on the reduction behavior of iron ore has been studied earlier [16,24,25]. Najmi et al. [16] found that the reduction of iron oxide was enhanced when using pyrolized bio-coal in a composite tested isothermally at 1550 °C when compared to composites containing only coke. Liu et al. [24] studied the reduction behavior of bio-coal containing iron oxide composite pellets. The reduction was done isothermally at 1000–1300 °C in samples with different C/O molar ratio, it was found that as the C/O ratio increased the reduction rate also increased. Zuo et al. [25] compared the reduction behavior of iron oxide by using bio-coal, coal and coke. Self-reducing mixtures were reduced in a non-isothermal test procedure having a constant heating rate up to 1200 °C. It was found that bio-coal enhanced the reduction of hematite compared to coal and coke. Ubando et al. [27] found enhanced reduction using torrefied biomass in comparison to graphite in samples containing hematite to carbonaceous material in ratios of 2:1 and 1:1 heated non- isothermally up to 1200 °C.
Some of the recent research concerns bio-coals produced from similar original raw biomass pretreated at different temperatures and thereby getting different VM and ash content but having similar ash composition [19,23]. In isothermal reduction of iron ore containing composite in inert atmosphere at temperatures in the range of 800–1000 °C Hirokazu et al. [23] found that bio-coal having higher content of VM will enhance the reduction of iron ore more compared to bio-coal with lower VM content and the reduction rate of iron oxide was higher when bio-coal containing 18% VM was used in agglomerates compared to when coke was used. Ueda et al. [19] compared the reduction of composites containing carbon in CO/CO2 and in Ar atmosphere up to 1200 °C but the impact from VM was not evaluated. It was stated that bio-coals, in general, enhance the reduction in comparison to coke.
Except for the work by Hirokazu et al. [23], there is no study on the influences of properties (Cfix, VM and ash composition) for different types of pre-treated bio-coal on the reduction of iron ore. In the current study, different pre-treated biomasses with different properties, e.g., in terms of VM and ash content as well as ash composition was used as a reducing agent in iron ore containing composite prepared as briquettes, with the aim to understand their impact on the reduction of iron ore. VM present in bio-coals contained in the composites should preferably contribute to the reduction and not being released and lost with the BF top gas. Composites containing only coke breeze are used as reference.

2. Materials and Methods

2.1. Material and Characterization

Composites were produced from iron oxide, coke breeze and four different bio-coals with Portland cement as a binder. Carbonaceous materials used are stated in Table 1, their proximate and ultimate analysis as analyzed by ALS Scandinavia AB using standard methods are presented in Table 2 and the composition of other raw materials can be seen in Table 3. The ash composition in bio-coal materials was reported in detail in a previous study [28], c.f. Table 4. As can be seen TSD has highest content of VM but contains ash with the lowest content of basic oxides, whereas TFR has almost as high VM content but contains ash with substantial amounts of basic oxides. HTT and CC has ash with similar contents of CaO but in HTT is balance by the SiO2 content.
The blends from which the briquettes were produced are stated in Table 5. Coke breeze used is screened off fines of metallurgical coke in the raw material handling at the Swedish steel producer SSAB Europe in Luleå [29]. The torrefied materials (TSD, TFR and HTT) were received from BioEndev [30] and the commercial charcoal was from Vindelkol [31]. All carbon-bearing materials were pulverized then sieved and the fraction 75–150 µm was used in the composites. The temperature for biomass pre-treatment affects the contents of VM, oxygen and Cfix (fixed carbon). Biomass torrefied at low temperature (TFR and TSD) has high contents of VM and oxygen but low content of Cfix; the opposite is the case for biomass pre-treated at high temperature (HTT and CC). The added iron oxide is in the form of olivine pellet fines screened off at LKAB, and these consist mainly of hematite. The particle size distribution for iron ore was analyzed to d90 ~163 µm by laser diffraction-based particle size analyzer (CILAS 1064, Micromeritics Instrument Corporation, Orléans, France). Cement was used as it is a common binder in industrially produced briquettes.

2.2. Composite Preparation

The composites were prepared by mixing pulverized carbonaceous materials, iron ore and cement according to the recipes in Table 5. A total of 100 g of a homogenous mixture of each blend was prepared, water was added, and mixing continued for five minutes. Approximately 2.5 g of the blend was put in a cylindrical steel mold 10 mm in diameter and 14 mm in height. The blend was compacted for 2.5 min under a load of 1800 kg/cm2. Produced briquettes were covered by plastic sheets to maintain humidity and cured at 30–40 °C for 7 days. Cured briquettes were dried overnight at 105 °C before conducting a reduction test.
The carbon in carbonaceous material to oxygen bound to iron in hematite pellet fines was prepared aiming for Cfix/O molar ratio equal to one. Considering the total carbon to oxygen bound to hematite, the ratio will be larger due to the content of carbon in VM present in bio-coals. Chemical composition of composites shown in Table 6 was determined by Degerfors Laboratorium AB in Sweden using a Thermo ARL 9900 X-ray fluorescence (XRF) instrument (Thermo Fisher Scientific Inc, Waltham, MA, USA) operating a rhodium tube at 50 kV 50 mA. The sample was pressed in cellulose briquettes before analysis. Carbon and sulfur content for each composite was determined by using LECO CS-444 instrument (LECO Corporation, Lakeview Ave, St. Joseph, MI, USA). The calculated VM content in Table 6 is based on contents in each bio-coal and briquette recipes. FRC and SDC have a higher content of VM compared to other composites.

2.3. Thermogravimetric Analysis

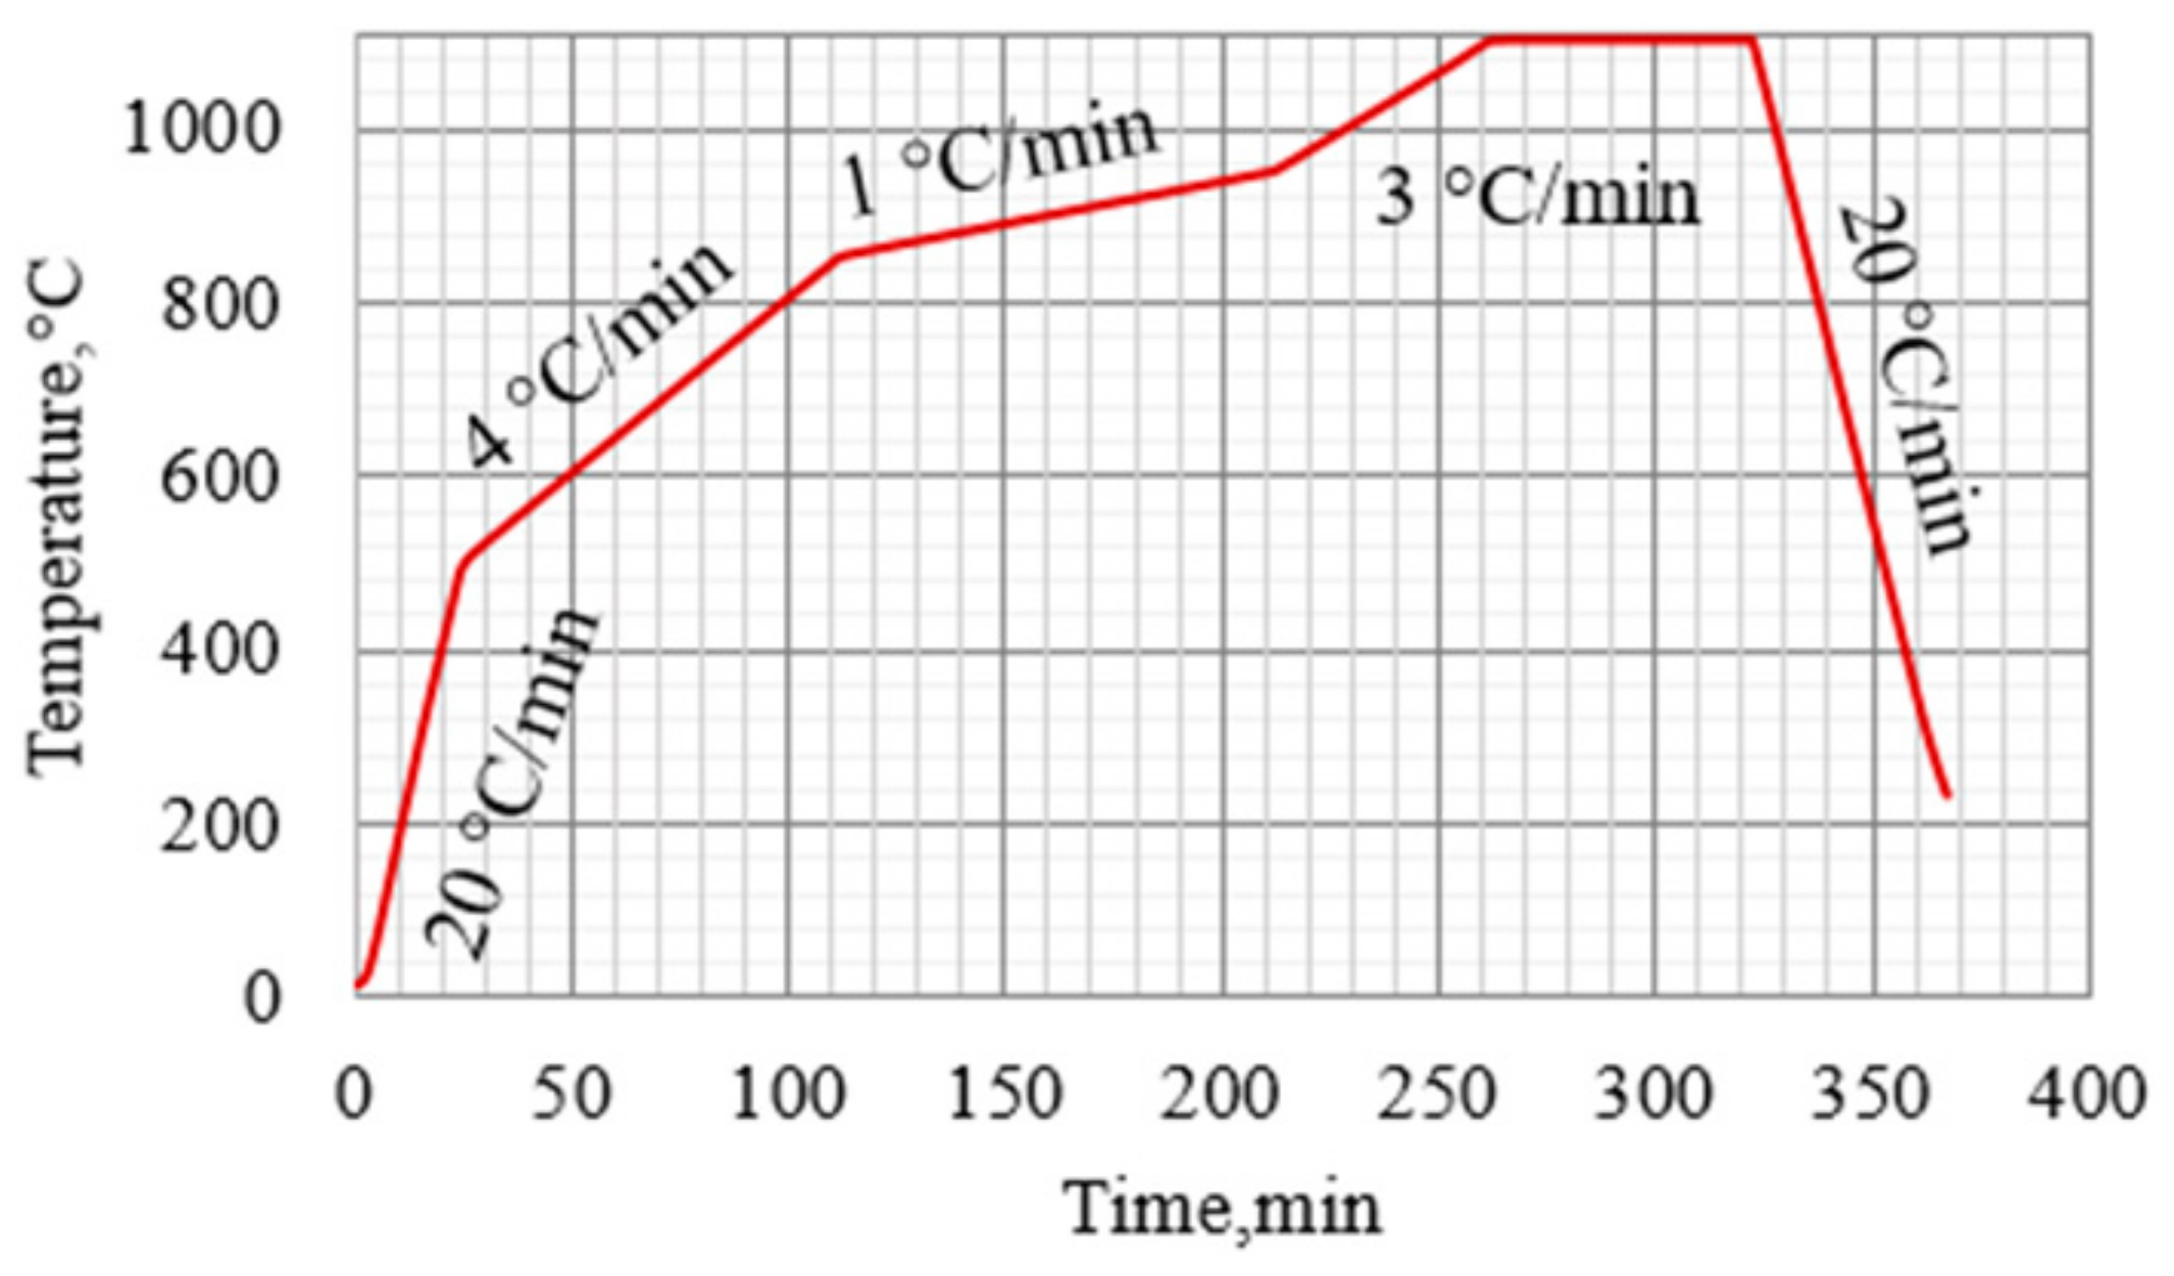
Reduction tests were conducted in the thermogravimetric analyzer, Netzsch STA 409, (sensitivity ±1 μg) attached to a Quadrupole Mass Spectrometer (QMS, Netzsch, Selb, Germany) to monitor the mass-loss and off-gas analysis, respectively. As reducing agents, the bio-coals specified in Table 1 and Table 2 were used. The thermogravimetric analyzer used in this study is described in detail earlier [32]. The heating rate during thermogravimetric analyses (TGA) was chosen to simulate a possible BF thermal profile as given in Figure 1 but under inert conditions with argon gas (99.999% purity) at a rate of 200 mL/min. The thermal profile and heating rates are 20 °C/min in the temperature range of 0–500 °C, 4 °C/min between 500–850 °C, 1 °C/min between 850–950 °C and 3 °C/min between 950–1100 °C. Finally, the sample was kept 1 h at 1100 °C before cooling with 20 °C/min to room temperature. To eliminate error from the buoyancy effect, correction measurements were carried out and each test was repeated three times to ensure the accuracy of results and the results were consistent without any significant variation. The samples were cooled down to room temperature at a rate of 20 °C/min and kept dry in a desiccator for subsequent characterization.

2.4. Interrupted Reduction Tests of Composites

Interrupted tests were carried out in N2 gas atmosphere (purity 99.996% and a flow rate of 5 L/min) introduced from the top in a tube furnace with a schematic layout as shown in Figure 2. Platinum/Platinum–Rhodium Type S thermocouples were used for measurement and control of temperature when heating the tube furnace with Super Kanthal heating elements. The sample was placed in an alumina crucible hanging in the hot zone of the 120 cm long alumina tube with an inner diameter of 8.65 cm. The sample was heated according to the thermal profile stated in Figure 1 to a predetermined temperature (500, 680, 740, 850, 950 °C). When the desired temperature was reached, the sample was transferred into the cooling chamber and the flow rate of N2 gas was increased to 10 L/min and 5 L/min from the top and into the cooling chamber, respectively. The samples were kept in a desiccator until characterization was carried out.

2.5. Characterization

2.5.1. Mineralogy

X-ray diffraction (XRD) was used to determine the phases present in reduced samples. All samples were ground in a mortar and analyzed using a Panalytical Empyrean X-ray diffractometer equipped with copper Kα radiation of 45 kV and 40 mA (Malvern Panalytical, Almeo, Netherlands). Diffraction patterns were measured in a 2θ range of 10° to 90° during 15 min for each sample.

2.5.2. Morphology

The textures of composites were investigated on polished samples mounted in epoxy using light optical microscope (LOM, Nikon ECLIPSE E600 POL, Minato/Tokyo, Japan) and scanning electron microscope Zeiss Gemini Merlin (FE-SEM, Carl Zeiss AG, Oberkochen, Germany) equipped with energy-dispersive X-ray spectroscopy (EDS) unit for elemental analysis. Prior to SEM investigation, the polished surface of mounted samples was coated with a thin layer of tungsten. For SEM, a beam operation voltage of 20 kV and current of 1.0 nA was used.

3. Results

3.1. TGA/QMS and DTG

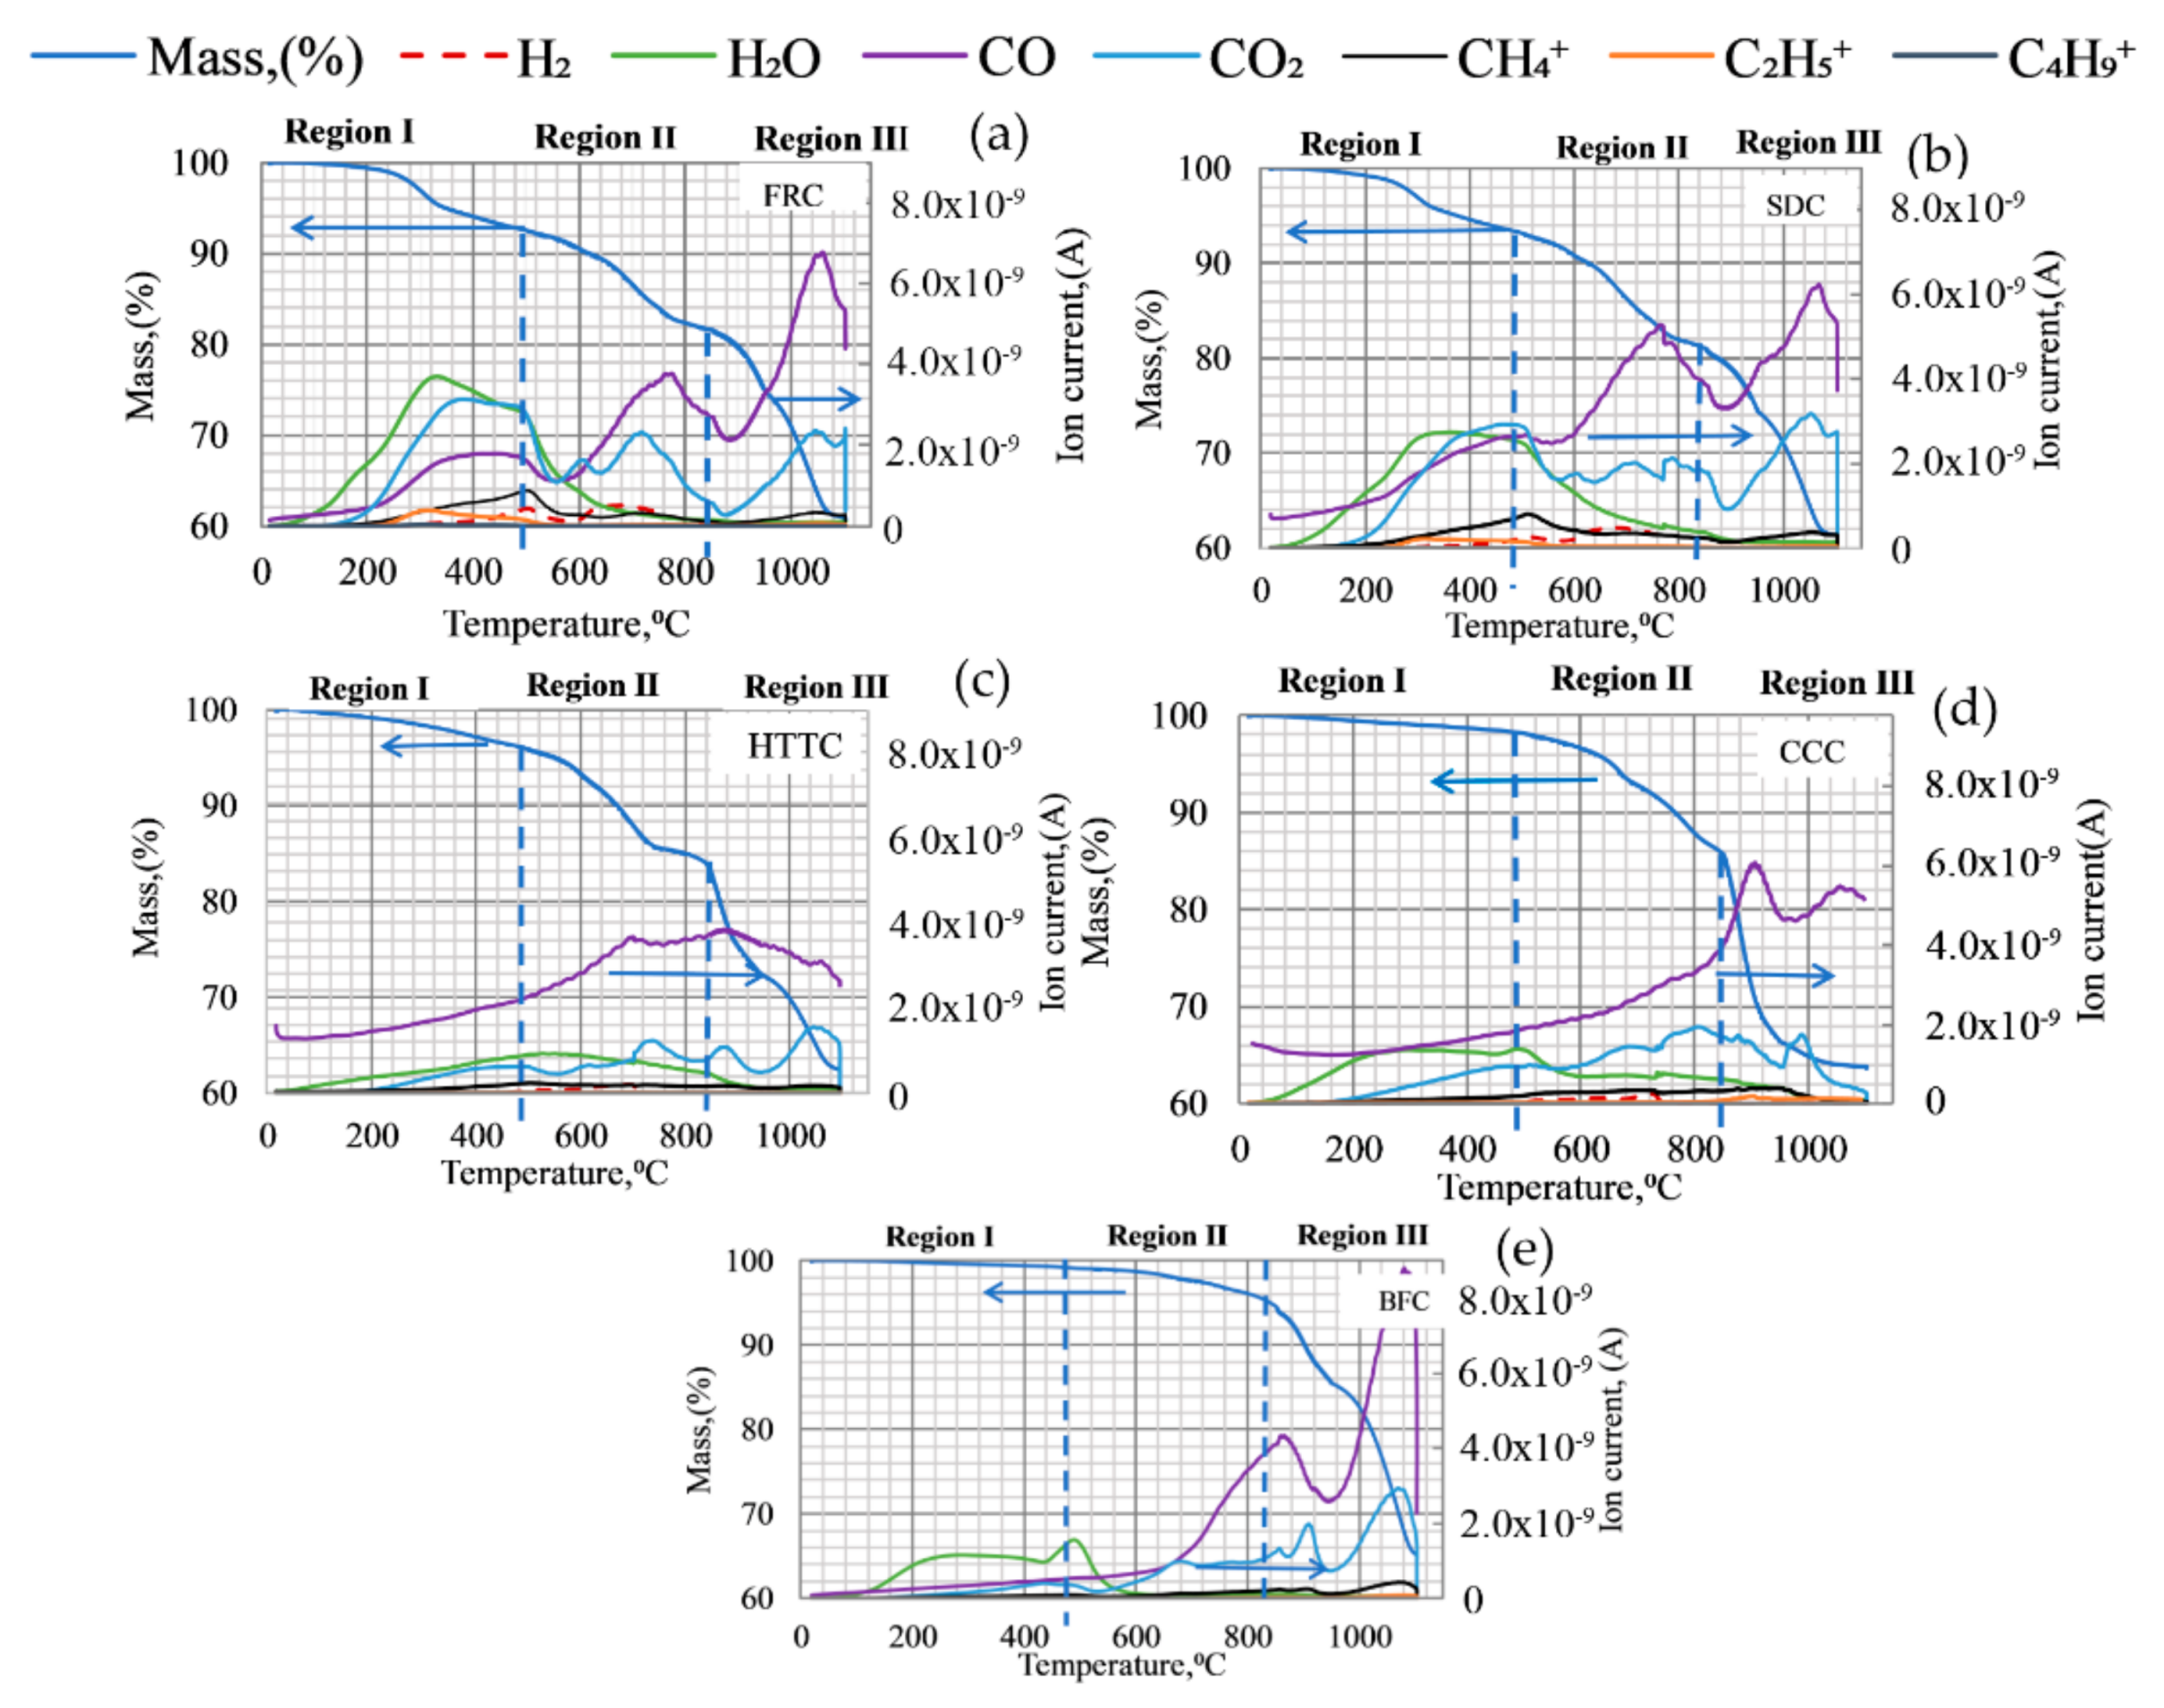
Figure 3 shows the TGA/QMS curves for bio-coal containing composites (BCC) and bio-coal free composites (BFC) using simulated BF thermal profile. The TG analysis shows that BCC has higher mass loss compared to BFC at lower temperatures and that the mass loss can be divided into three distinct regions, see Figure 3. The mass loss of FRC and SDC are quite similar, slightly higher for FRC and both are higher than for other composites as presented in Table 7. DTG (the first derivative of mass loss) analysis showed that FRC has a higher mass loss rate than SDC at ~300 °C as seen in the Region I in Figure 4. By increasing temperature up to 850 °C, the mass loss of FRC, SDC and HTTC increased and are higher than for CCC and BFC. At temperatures above 850 °C, the mass loss rate is high for CCC as seen in Figure 4. The mass-loss rate for all composites increased as seen in Region III (up to 1100 °C) while the main mass loss for CCC and BFC lies at 850–950 °C and 950–1100 °C, respectively.
The QMS analysis shows ionized hydrocarbons with one, two or four carbon atoms per molecule and gases (CO, CO2, and H2) in the off-gas during the reduction test. However, the lengths of carbon chains in the released hydrocarbon during bio-coal devolatilization were probably initially longer before thermal decomposition and excitation in the QMS. The release of hydrocarbons in the low-temperature region occurred at the lowest temperature for FRC and SDC as seen in Figure 3 with the highest mass loss rate for FRC as seen in Figure 4.

3.2. Interrupted Reduction Tests of Composites

The interrupted tests were conducted to determine the progress of reduction with different carbonaceous materials present in each composite. The temperatures for interruption of tests were selected based on the difference in mass loss curves seen from TGA in the three regions pointed out in Figure 3. Results on mass loss in interrupted tests conducted in a tube furnace are presented in Table 8.

3.3. XRD Analysis

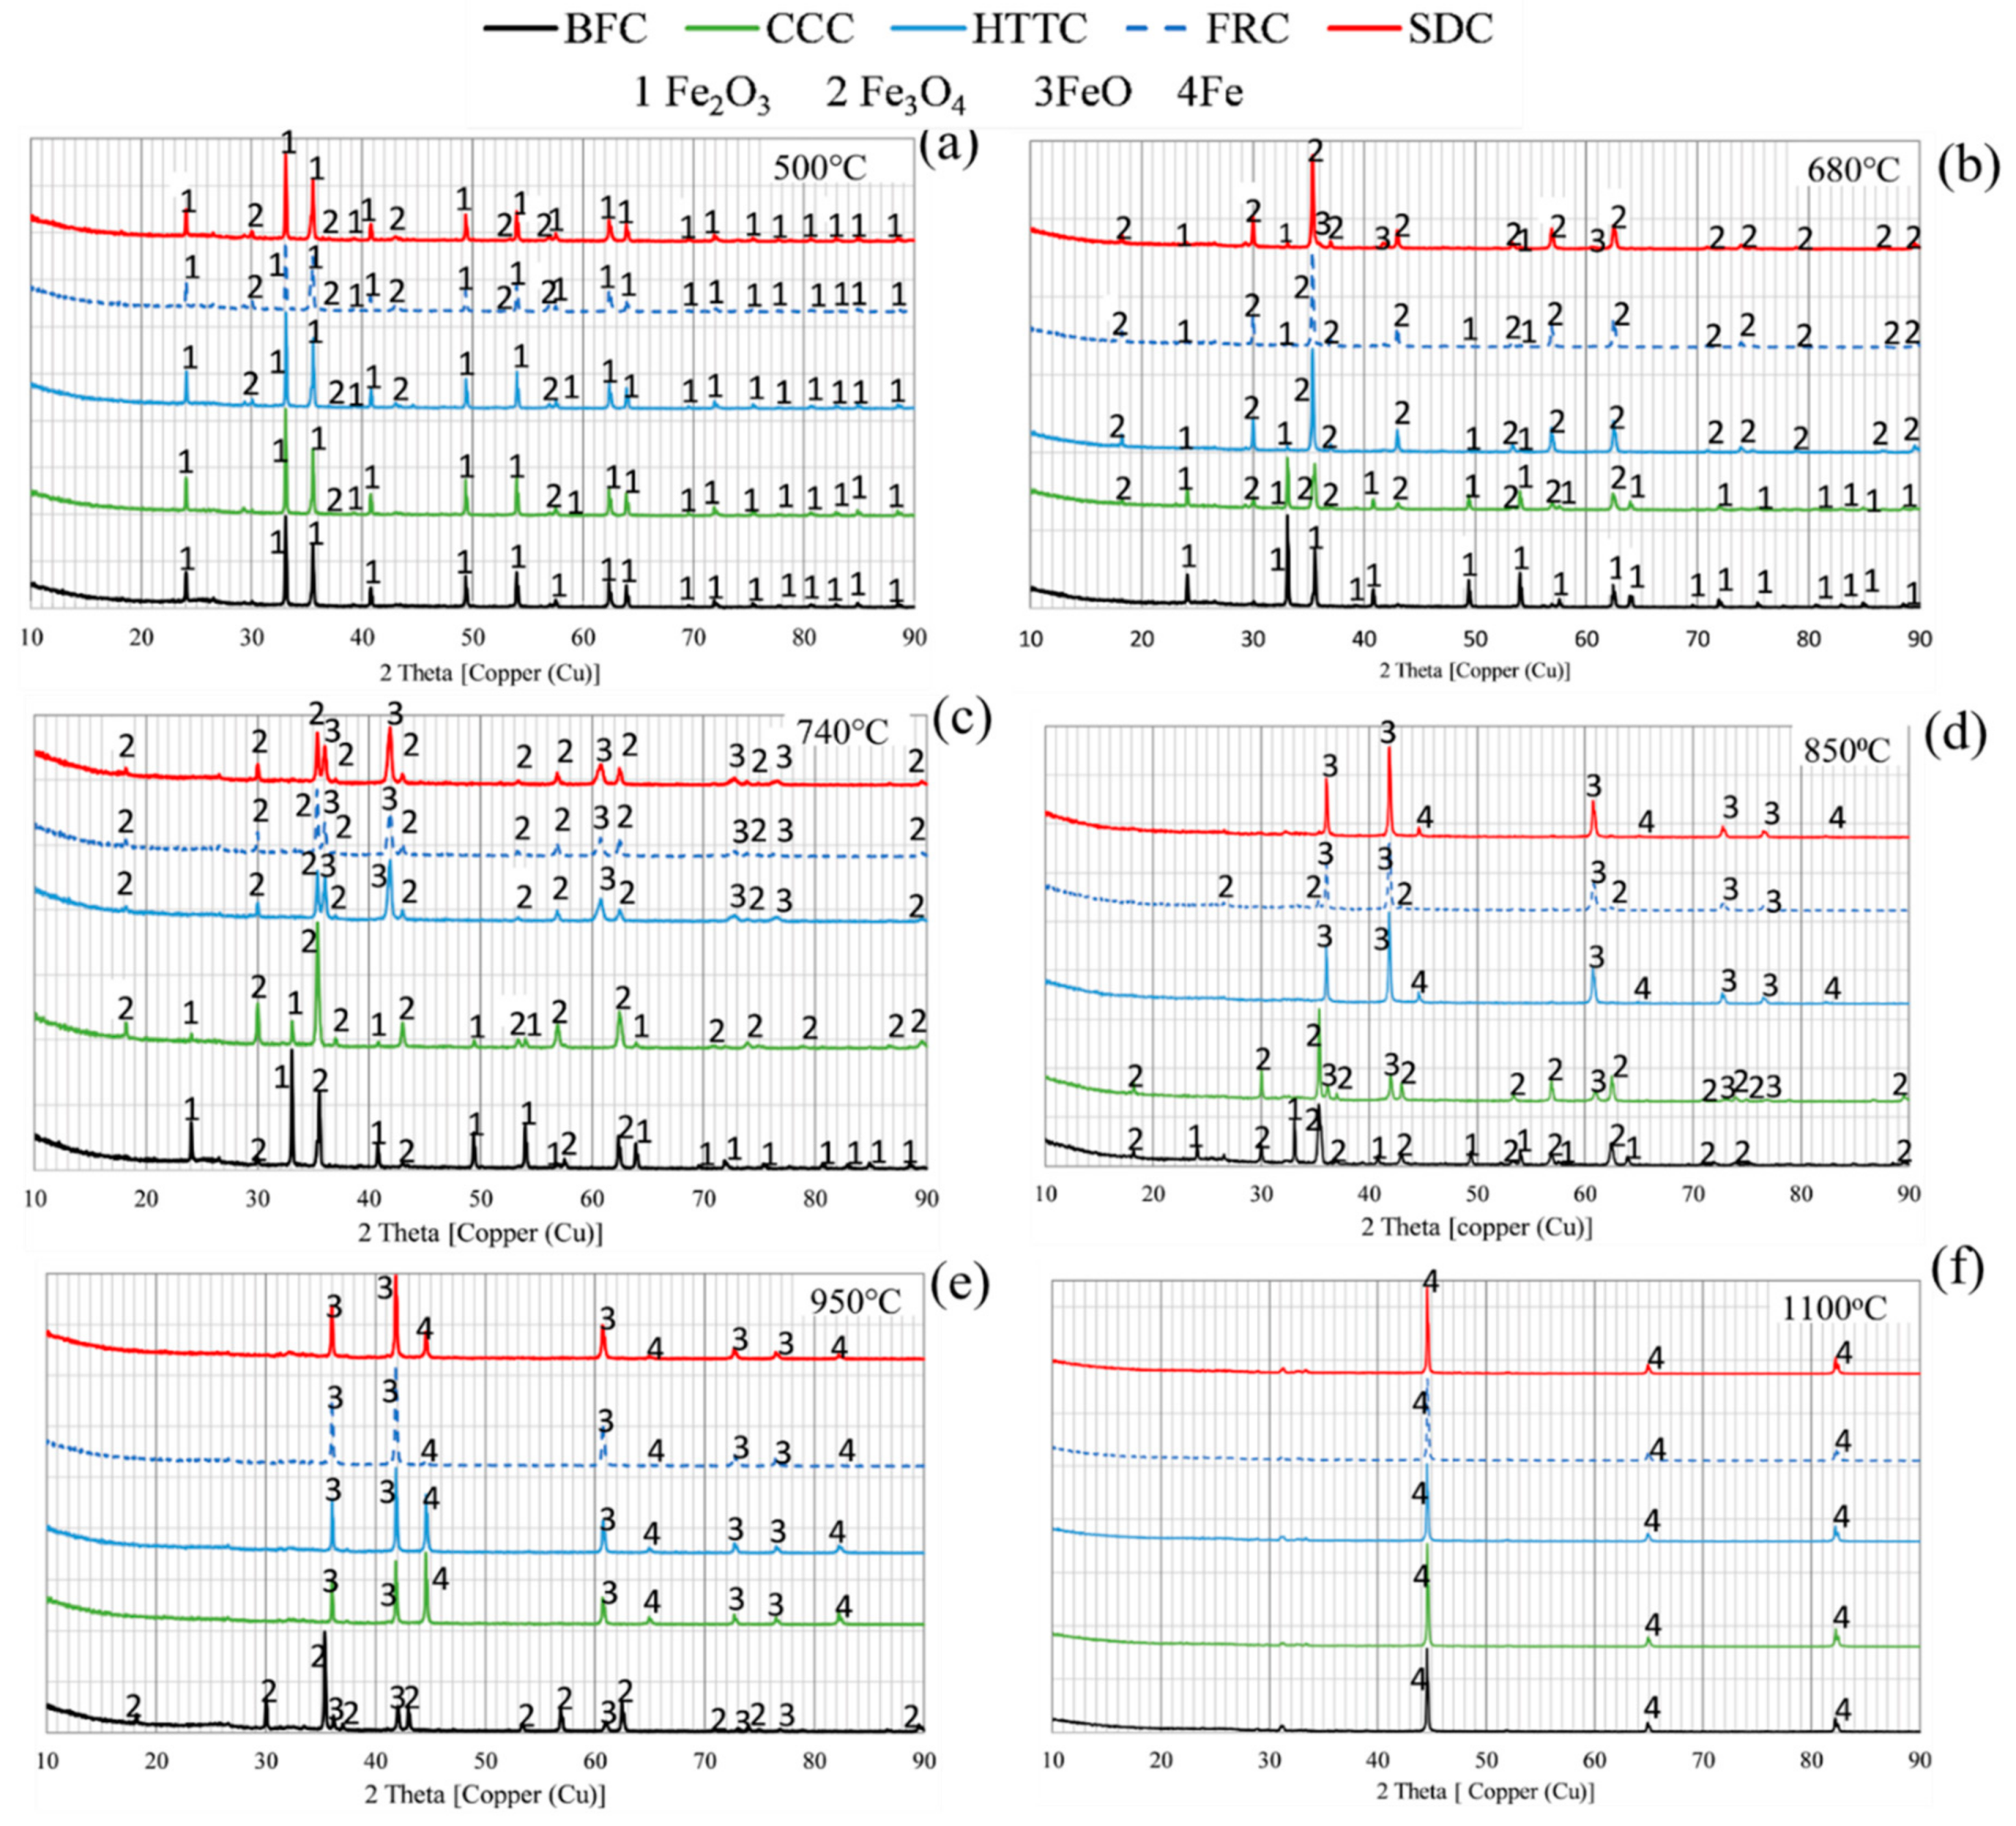
XRD analysis conducted for composites collected after interrupted tests in the tube furnace and finalized tests in TGA is shown in Figure 5. The following is observed;
-
Fe2O3 was detected in the BFC sample from the test interrupted at 500 °C.
-
Fe3O4 was detected in all bio-coal containing samples from tests interrupted at 500 °C, for BFC it was first detected at 740 °C.
-
FeO was detected in the samples from tests interrupted at 680 °C for SDC, at 740 °C for FRC and HTTC, at 850 °C in CCC and at 950 °C for BFC.
-
Fe was detected in samples from tests interrupted at 850 °C for SDC and HTTC, at 950 °C for FRC and CCC, at 1100 °C for BFC.

3.4. Evaluation of Composite Structure during Reduction

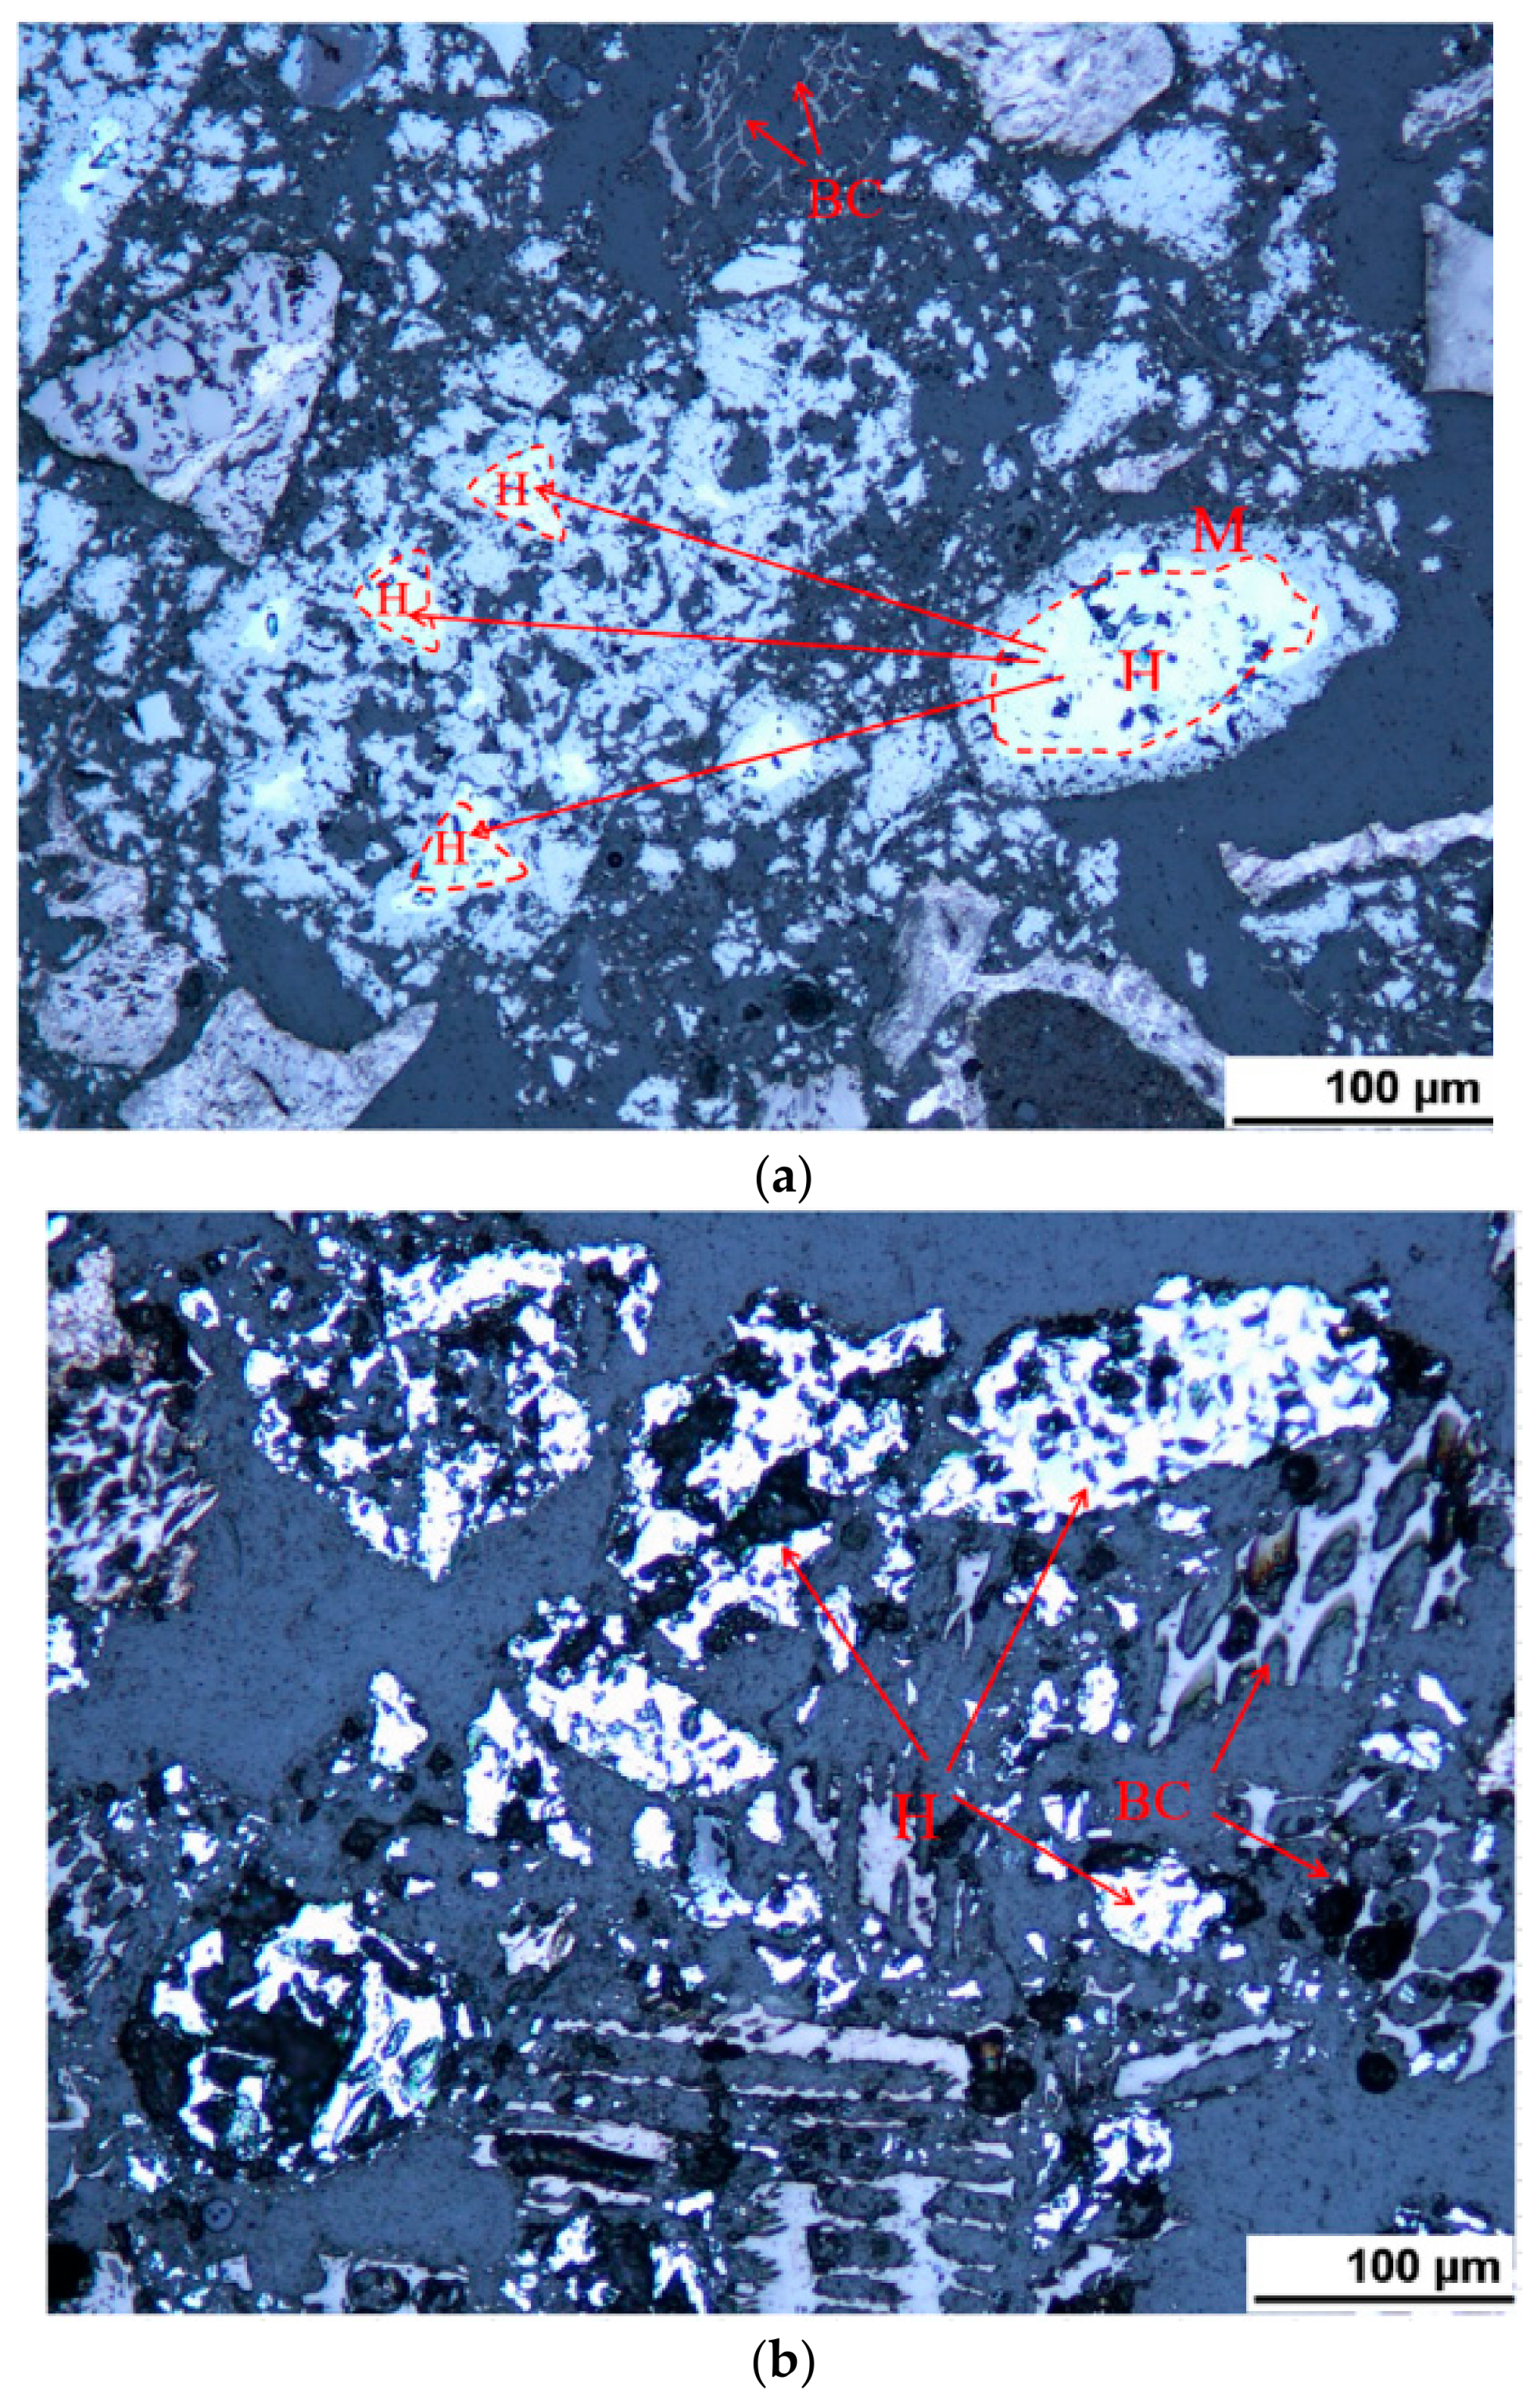
The structures of composites from interrupted tests were examined in LOM and SEM. Figure 6 presents the microstructures of two different types of composites collected after tests interrupted at 680 °C. The conversion of hematite to magnetite occurred initially at the outer layer of hematite particles in all bio-coal containing composites which can be seen for FRC in Figure 6a. In composites collected after tests interrupted at ~740 °C, the transformation of hematite to magnetite had proceeded further in SDC and a porous structure and cracks had been formed as seen in Figure 7a while the transformation of hematite to magnetite was still in the outer layer in HTTC as seen in Figure 7b. The duct structure of bio-coal was seen in FRC and quite clear in CCC as seen in Figure 6a and Figure 6b, respectively.

4. Discussion

The effect of different pre-treated biomass on the self-reduction of agglomerates containing iron oxide and coke breeze has been investigated. Composites were analyzed in TGA and treated in vertical tube furnace up to pre-defined temperatures. To evaluate the impact of bio-coal on reduction, samples from interrupted tests were investigated by XRD, LOM and SEM. The mass loss occurring in TGA is assumed to depend on partial devolatilization of VM ( b i o m a s s V o l a t i l e   ( g a s e s + t a r ) + b i o c h a r ) , gasification ( C f i x + C O 2   2 C O ) , and reduction of iron oxides ( F e 2 O F e O F e O F e ) . CO formed during devolatilization contributed to the reduction of iron oxides.
The TGA results and interrupted test up to 500 °C showed that FRC has higher mass loss than all other composites, and a higher mass-loss rate was clear from DTG analysis at ~300 °C. Although TSD and TFR have quite similar content of VM, the higher mass loss detected at low temperature for FRC could be due to the presence of higher contents of catalyzing components such as CaO and K2O in TFR than in TSD. This may affect the release of H2O during reaction as the ion current for H2O is highest for FRC although that the H-content is similar as for SDC. The impact of ash composition on the devolatilization behavior of bio-coals was indicated in a previous study [28] where bio-coal with a higher content of catalyzing components released the VM at lower temperature, and this may restrict its contribution to the reduction. High intensity of H2O followed by CO2 and H2 detected in QMS analyses for FRC indicates that some of the CO is consumed in the reaction. It is possible that this affects the contribution to reduction of iron oxide in FRC. From XRD analysis, it was seen that FeO had been formed in samples interrupted at 740 °C for FRC while it was detected in samples interrupted at 680 °C for SDC.
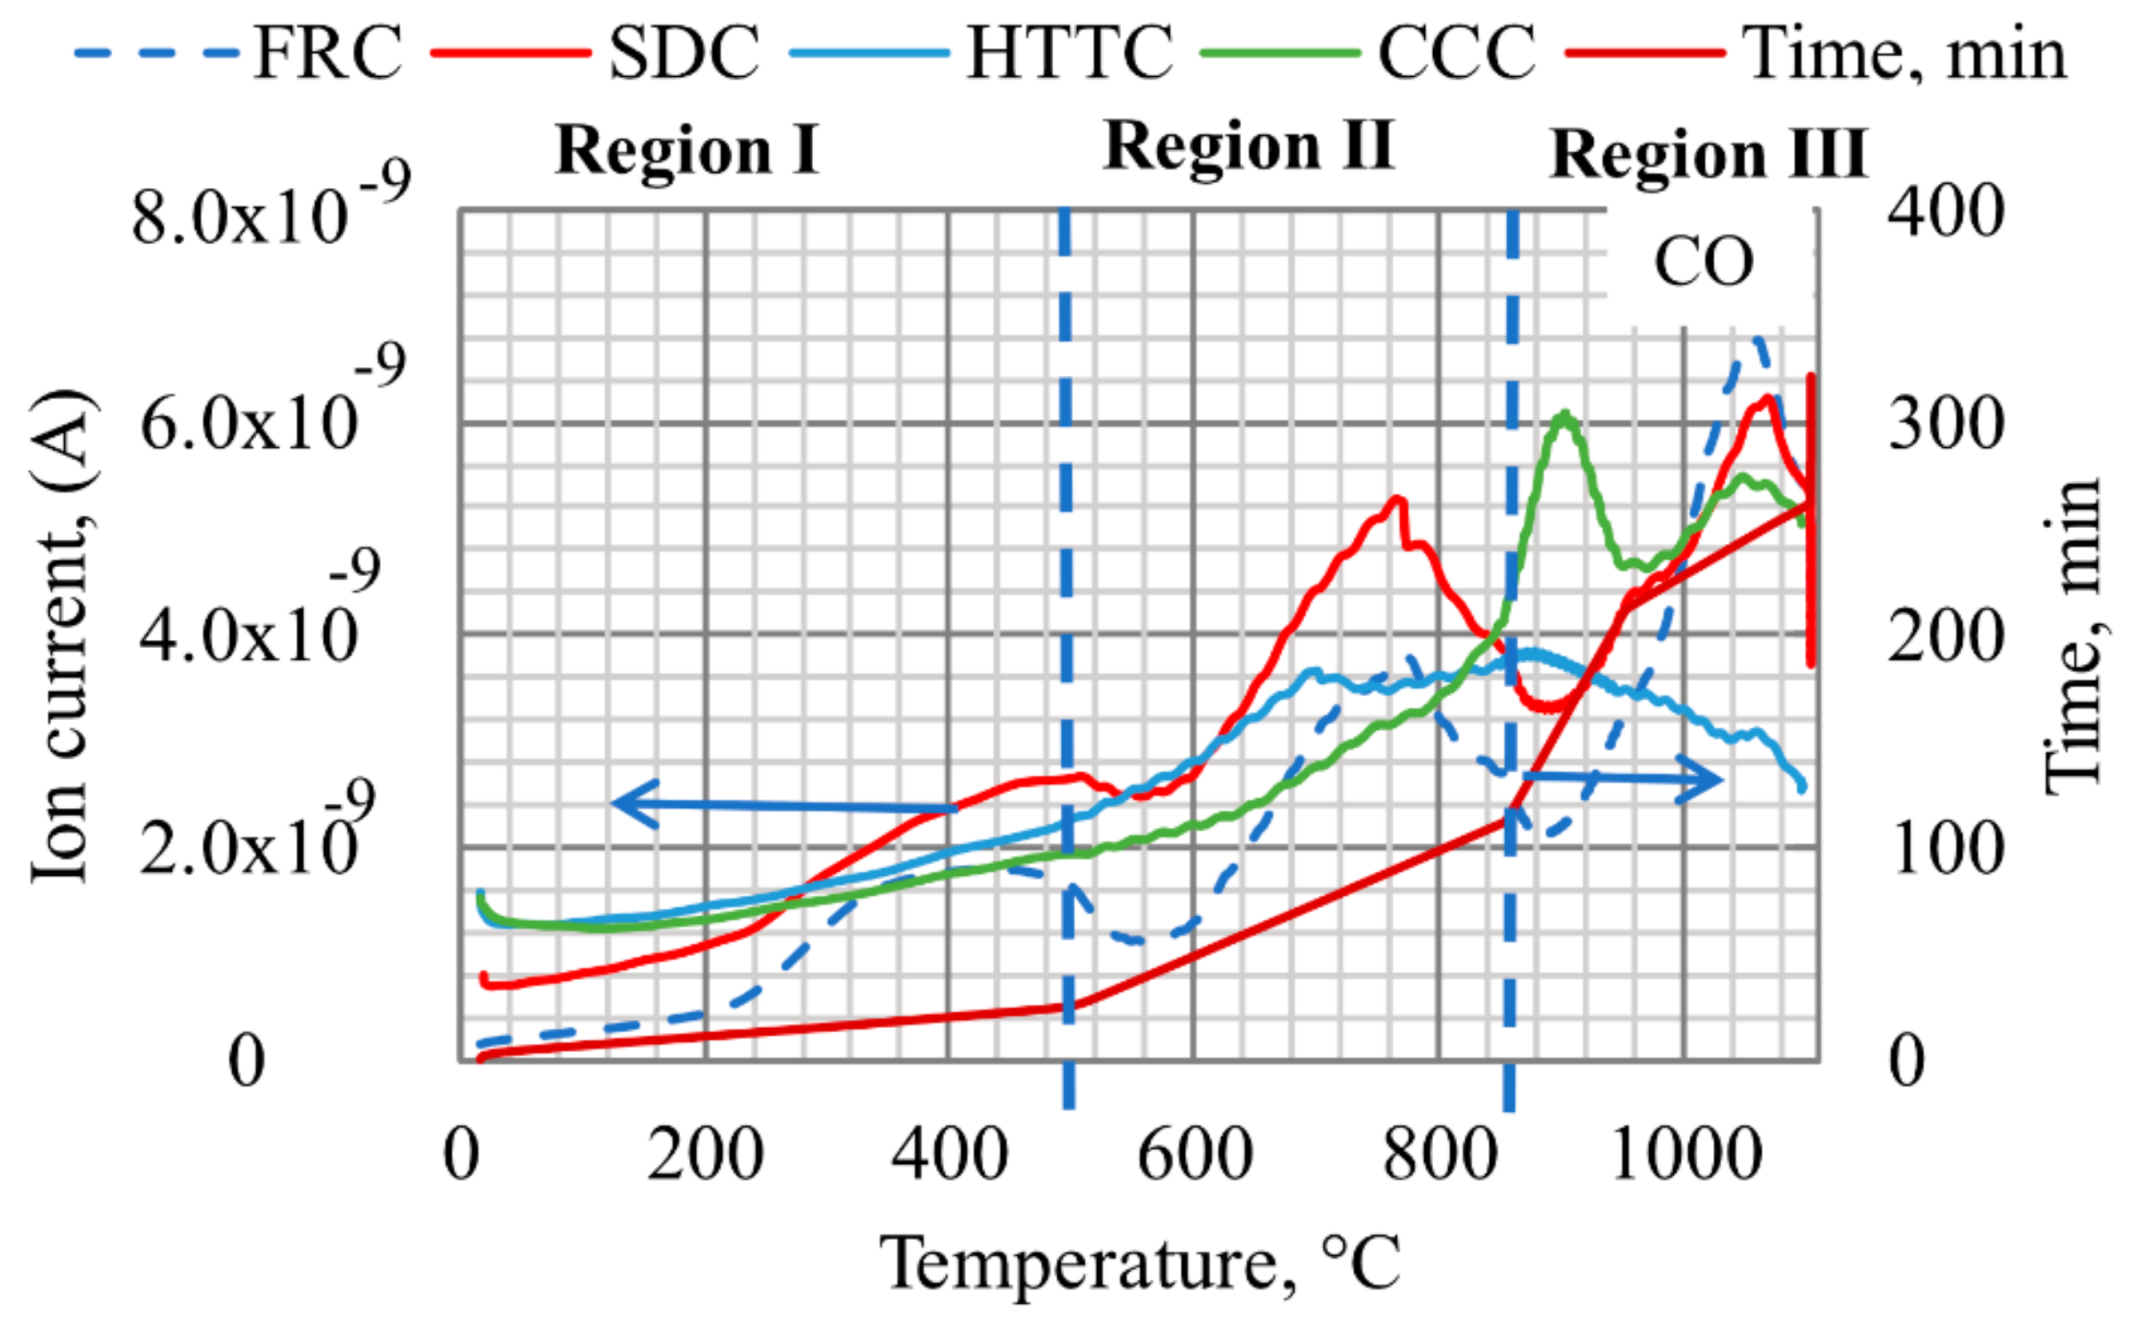
QMS analysis showed that the intensity of CO gas in regions I and II is highest for SDC, reaching a maximum at ~760 °C, as shown in Figure 8. Part of this CO gas might originate from thermal decomposition of VM as well as from the Boudouard reaction in which CO2 reacts with remaining carbon above 700 °C as reported by Butterman [33]. Furthermore, it is observed that FeO is formed in SDC at lower temperatures than for other composites and SDC has the highest mass loss rate in region II (up to 850 °C).
The progress of the reduction is indicated in LOM by more cracks in SDC samples interrupted at 740 °C while it was detected only in the outer layer for HTTC at the same temperature. Wustite was not detected in CCC samples interrupted below 850 °C. CO generation from CCC samples occurred mainly above 850 °C, likely due to Cfix starting to react, c.f. Figure 8, simultaneously with a higher mass loss rate for CCC. This can be compared with BFC in which wustite and iron were first detected by XRD in samples interrupted at 950 °C and in the final sample at 1100 °C, respectively. The higher intensity for CO seen in QMS results for BFC at temperatures above 950 °C is likely due to the transformation step from FeO to Femet and solution loss reactions taking place above 950 °C.
XRD analysis shows also that magnetite is formed in all BCC samples at 500 °C, but not in BFC composites. CO formed in Region I in all BCC, but not in BFC, may have contributed to the earlier start of reduction in BCC. It is shown that FeO is formed at a lower temperature in the composites containing more VM, indicating either that more reactive char is formed or that volatiles still existing above 500 °C, as in SDC, also contributes to the reduction. It is also shown that BFC containing coke breeze demand higher temperature for gasification reaction and reduction compared to BCC, in agreement with Ueda et al. [19].
The results show that if bio-coal with high volatile content is selected for use in a composite, a low content of catalyzing components is preferable as volatiles are released at higher temperatures and thereby could contribute to the reduction.
The investigated composites are potential innovative materials to be added to the BF together with coke. By energy consuming reactions, the thermal reserve zone temperature is reduced and the overall reduction efficiency of the BF improved. When selecting carbon source for the composites, the results show that coke breeze demands higher temperature for reaction compared to bio-coals. TSD could be the most suitable material to be utilized in composites in the BF. This material has higher content of volatile matter content with a lower content of catalyzing components, which means that the volatiles can be released at higher temperatures and thereby can contribute to the reduction. Additionally, outside the scope of this paper, it is known that the yield when producing bio-coal is high for products as TSD.
5. Conclusions

The reduction behavior of composites containing hematite and different bio-coals was studied and compared with bio-coal free composite (coke as carbon source). The following conclusion can be drawn:
-
Bio-coal present in an agglomerate enhances the reduction of hematite, in comparison with coke, and the reduction starts at a lower temperature.
-
Bio-coal with a high content of volatiles decreases the temperature for the formation of wustite more than bio-coal with lower content of volatiles.
-
The presence of ash components catalyzing the volatilization to occur at lower temperatures results in a higher temperature for the formation of wustite.

Author Contributions

A.A.E.-T. conceived and designed the experiments, performed the experiments, analyzed the data, wrote the first draft of the paper, reviewed and wrote the paper; L.S.Ö., B.B. and H.M.A. supervised, reviewed and contributed to the writing of the paper. All authors have read and agreed to the published version of the manuscript.

Funding

The research was funded by the Bio-agglomerate project, grant number 156334.

Acknowledgments

Financial support from the Swedish Energy Agency (Energimyndigheten) for research within the bio-agglomerate project is gratefully acknowledged. For additional support, the following companies and institutions are acknowledged: BioEndev, Swerim AB, SSAB Merox, LKAB and SSAB special steel. The research has been partly financed by CAMM, Center of Advanced Mining and Metallurgy at LTU.

Conflicts of Interest

The authors declare no conflict of interest.

References

  1. Geerdes, M.; Chaigneau, R.; Kurunov, I. Modern Blast Furnace Ironmaking: An. Introduction (2015), 3rd ed.; Ios Press: Amsterdam, The Netherlands; Holland, The Netherlands, 2015; pp. 1–215. [Google Scholar]
  2. World Steel Association. Steel’s Contribution to a Low Carbon Future and Climate Resilient Societies–Worldsteel Position Paper; World Steel Association: Brussels, Belgium, 2017; Available online: https://www.worldsteel.org/publications/bookshop/product-details~Steel-s-Contribution-to-a-Low-Carbon-Future--2018-update-~PRODUCT~Steel-s-Contribution-to-a-Low-Carbon-Future~.html (accessed on 14 April 2018).
  3. Wang, C.; Mellin, P.; Lövgren, J.; Nilsson, L.; Yang, W.; Salman, H.; Hultgren, A.; Larsson, M. Biomass as blast furnace injectant–Considering availability, pretreatment and deployment in the Swedish steel industry. Energy Convers. Manag. 2015, 102, 217–226. [Google Scholar] [CrossRef] [Green Version]
  4. Feliciano-Bruzual, C. Charcoal injection in blast furnaces (Bio-PCI): CO2 reduction potential and economic prospects. J. Mater. Res. Technol. 2014, 3, 233–243. [Google Scholar] [CrossRef] [Green Version]
  5. Babich, A.; Senk, D.; Fernandez, M. Charcoal behaviour by its injection into the modern blast furnace. ISIJ Int. 2010, 50, 81–88. [Google Scholar] [CrossRef] [Green Version]
  6. Mandova, H.; Leduc, S.; Wang, C.; Wetterlund, E.; Patrizio, P.; Gale, W.; Kraxner, F. Possibilities for CO2 emission reduction using biomass in European integrated steel plants. Biomass Bioenergy 2018, 115, 231–243. [Google Scholar] [CrossRef]
  7. Fick, G.; Mirgaux, O.; Neau, P.; Patisson, F. Using biomass for pig iron production: A technical, environmental and economical assessment. Waste Biomass Valoris 2014, 5, 43–55. [Google Scholar] [CrossRef] [Green Version]
  8. Chen, W.; Du, S.; Tsai, C.; Wang, Z. Torrefied biomasses in a drop tube furnace to evaluate their utility in blast furnaces. Bioresour. Technol. 2012, 111, 433–438. [Google Scholar] [CrossRef]
  9. Bridgwater, A. The production of biofuels and renewable chemicals by fast pyrolysis of biomass. Int. J. Global Energy Issues 2007, 27, 160–203. [Google Scholar] [CrossRef]
  10. Van der Stelt, M.J.C.; Gerhauser, H.; Kiel, J.H.A.; Ptasinski, K.J. Biomass upgrading by torrefaction for the production of biofuels: A review. Biomass Bioenergy 2011, 35, 3748–3762. [Google Scholar] [CrossRef]
  11. Shankar Tumuluru, J.; Sokhansanj, S.; Hess, J.R.; Wright, C.T.; Boardman, R.D. REVIEW: A review on biomass torrefaction process and product properties for energy applications. Ind. Biotechnol. 2011, 7, 384–401. [Google Scholar] [CrossRef] [Green Version]
  12. Bergman, P.C.A.; Boersma, A.R.; Zwart, R.W.R.; Kiel, J.H.A. Torrefaction for Biomass Co-Firing in Existing Coal-Fired Power Stations “BIOCOAL”; Technical Report; ECN: Petten, The Netherlands; Holland, The Netherlands, 2005; ECN-C--05-013. [Google Scholar]
  13. Hanif, M.U.; Capareda, S.C.; Kongkasawan, J.; Iqbal, H.; Arazo, R.O.; Baig, M.A. Correction: Effects of pyrolysis temperature on product yields and energy recovery from Co-feeding of cotton gin trash, cow manure, and microalgae: A simulation study. PLoS ONE 2016, 11, e0156565. [Google Scholar] [CrossRef] [Green Version]
  14. Official Statistics of Sweden. SKOGSDATA 2018; Technical Report; The Swedish University of Agricultural Sciences: Umeå, Sweden, May 2018; Available online: https://www.slu.se/en/Collaborative-Centres-and-Projects/the-swedish-national-forest-inventory/forest-statistics/skogsdata/ (accessed on 12 December 2018).
  15. Mousa, E.; Lundgren, M.; Sundqvist Ökvist, L.; From, L.; Robles, A.; Hällsten, S.; Sundelin, B.; Friberg, H.; El-Tawil, A. Reduced carbon consumption and CO2 emission at the blast furnace by use of briquettes containing torrefied sawdust. J. Sustain. Metall. 2019, 5, 391–401. [Google Scholar] [CrossRef] [Green Version]
  16. Najmi, N.H.; Yunos, M.; Diyana, N.F.; Othman, N.K.; Asri Idris, M. Characterisation of reduction of iron ore with carbonaceous materials. Solid State Phenom. 2018, 280, 433–439. [Google Scholar] [CrossRef]
  17. Machado, J.; Osorio, E.; Vilela, A.; Babich, A.; Senk, D.; Gudenau, H. Reactivity and conversion behaviour of Brazilian and imported coals, charcoal and blends in view of their injection into blast furnaces. Steel Res. Int. 2010, 81, 9–16. [Google Scholar] [CrossRef]
  18. Ng, K.W.; Giroux, L.; MacPhee, T.; Todoschuk, T. Combustibility of charcoal for direct injection in blast furnace ironmaking. Iron Steel Technol. 2012, 9, 70. [Google Scholar]
  19. Ueda, S.; Watanabe, K.; Yanagiya, K.; Inoue, R.; Ariyama, T. Improvement of reactivity of carbon iron ore composite with biomass char for blast furnace. ISIJ Int. 2009, 49, 1505–1512. [Google Scholar] [CrossRef] [Green Version]
  20. Strezov, V. Iron ore reduction using sawdust: Experimental analysis and kinetic modelling. Renew. Energy 2006, 31, 1892–1905. [Google Scholar] [CrossRef]
  21. Srivastava, U.; Kawatra, S.K.; Eisele, T.C. Production of pig iron by utilizing biomass as a reducing agent. Int. J. Miner. Process. 2013, 119, 51–57. [Google Scholar] [CrossRef]
  22. Guo, D.; Hu, M.; Pu, C.; Xiao, B.; Hu, Z.; Liu, S.; Wang, X.; Zhu, X. Kinetics and mechanisms of direct reduction of iron ore-biomass composite pellets with hydrogen gas. Int. J. Hydrogen Energy 2015, 40, 4733–4740. [Google Scholar] [CrossRef]
  23. Konishi, H.; Ichikawa, K.; Usui, T. Effect of residual volatile matter on reduction of iron oxide in semi-charcoal composite pellets. ISIJ Int. 2010, 50, 386–389. [Google Scholar] [CrossRef] [Green Version]
  24. Liu, Z.; Bi, X.; Gao, Z.; Liu, W. Carbothermal reduction of iron ore in its concentrate-agricultural waste pellets. Adv. Mater. Sci. Eng. 2018, 2018, 1. [Google Scholar] [CrossRef] [Green Version]
  25. Zuo, H.; Hu, Z.; Zhang, J.; Li, J.; Liu, Z. Direct reduction of iron ore by biomass char. Int. J. Miner. Metall. Mater. 2013, 20, 514. [Google Scholar] [CrossRef]
  26. Guo, D.; Li, Y.; Cui, B.; Chen, Z.; Luo, S.; Xiao, B.; Zhu, H.; Hu, M. Direct reduction of iron ore/biomass composite pellets using simulated biomass-derived syngas: Experimental analysis and kinetic modelling. Chem. Eng. J. 2017, 327, 822. [Google Scholar] [CrossRef]
  27. Ubando, A.T.; Chen, W.; Ong, H.C. Iron oxide reduction by graphite and torrefied biomass analyzed by TG-FTIR for mitigating CO2 emissions. Energy 2019, 180, 968. [Google Scholar] [CrossRef]
  28. El-Tawil, A.A.; Ökvist, L.S.M.; Ahmed, H.; Björkman, B. Devolatilization kinetics of different types of bio-coals using thermogravimetric analysis. Metals 2019, 9, 168. [Google Scholar] [CrossRef] [Green Version]
  29. Lundgren, M. Development of Coke Properties during the Descent in the Blast Furnace. Ph.D. Thesis, Luleå University of Technology, Luleå, Sweden, 2013. [Google Scholar]
  30. Bioendev. Technology. Available online: http://www.bioendev.se/technology/torrefaction/ (accessed on 19 September 2019).
  31. Vindelkol. Technology. Available online: http://www.vindelkol.se/ (accessed on 19 September 2019).
  32. Ahmed, H.M.; Persson, A.; Okvist, L.S.; Bjorkman, B. Reduction behaviour of self-reducing blends of in-plant fines in inert atmosphere. ISIJ Int. 2015, 55, 2082–2089. [Google Scholar] [CrossRef] [Green Version]
  33. Butterman, H.C.; Castaldi, M.J. CO2 as a carbon neutral fuel source via enhanced biomass gasification. Environ. Sci. Technol. 2009, 43, 9030–9037. [Google Scholar] [CrossRef] [PubMed]
Figure 1. Simulated BF thermal profile used in TGA and for tube furnace tests.
Metals 10 00133 g001
Figure 2. Schematic layout of the tube furnace.
Metals 10 00133 g002
Figure 3. TGA-QMS analysis of self- reducing composites (a) FRC; (b) SDC; (c) HTTC; (d) CCC and (e) BFC in Argon up to 1100 °C using BF simulated thermal profile.
Metals 10 00133 g003
Figure 4. DTG curves of self- reducing composites during TGA tests in Ar gas up to 1100 °C using simulated BF thermal profile.
Metals 10 00133 g004
Figure 5. XRD analysis of reduced composite treated in a tube furnace at (a) 500 °C; (b) 680 °C; (c) 740 °C; (d) 850 °C; (e) 950 °C and (f) final sample up to 1100 °C in TGA.
Metals 10 00133 g005
Figure 6. Typical textures observed in LOM (magnification 20x) in composites from tests interrupted at 680 °C. (a) FRC and (b) CCC. H = hematite (white-grey), M = magnetite (grey) and BC = bio-coal.
Metals 10 00133 g006
Figure 7. SEM image (magnification 1000×), of composites from tests, interrupted at 740 °C. (a) SDC, (b) HTTC, H = hematite, M = magnetite, and Ol = Olivine.
Metals 10 00133 g007
Figure 8. Off-gas analysis of CO for different types of bio-coal containing composites (BCC).
Metals 10 00133 g008
Table 1. Selected carbonaceous materials with abbreviations and their pretreatment temperatures and time.
Carbonaceous MaterialsTemperature, °CTime, minAbbreviation
Torrefied forest residue2866TFR
Torrefied sawdust2976TSD
High temperature torrefied3508HTT
Charcoal550-CC
Coke breezeUp to 1100-CB
Table 2. Proximate and ultimate analysis results for carbonaceous materials (dry base).
Carbonaceous MaterialsProximate Analysis (wt %)Ultimate Analysis (wt %)Net Calorific Value (MJ/Kg)
CfixVMAshCtotHNSO
TFR23.673.23.252.05.90.570.03535.221.4
TSD24.075.60.4557.15.90.120.00436.421.6
HTT60.838.21.075.34.90.100.00818.828.3
CC80.718.60.7087.03.40.25<0.0048.3032.6
CB88.20.711.187.3<0.11.230.127<0.1029.7
CFix Fixed carbon; VM volatile matter; Ctot Total carbon; H hydrogen; N nitrogen; S sulphur; O oxygen.
Table 3. Chemical composition of pellet fines and cement, (wt %).
SampleFeSSiO2Al2O3CaOMgONa2OK2OMnOV2O5
Pellet fines66.70.00281.920.340.421.350.040.020.060.23
Cement2.461.3720.13.4765.02.110.170.930.040.02
Table 4. Contents of metal oxides in the bio-coal materials (wt %, dry basis) [28].
Bio-CoalsAl2O3CaOSiO2Fe2O3K2OMgOMnONa2OP2O5TiO2
TFR0.0470.8720.6180.0440.2380.1240.0620.0140.1510.004
TSD0.0030.1220.0330.0110.0510.0460.0130.0030.0080.000
HTT0.0240.3100.3050.0790.1450.0610.0400.0230.0320.001
CC0.0060.3170.0280.009<0.0020.1120.044<0.0090.0060.001
Table 5. Recipes of self-reducing composites.
CompositeComposite Composition, (wt %)
Pellet FinesCoke BreezeBio- CoalCementAbbreviation
FR composite68.113.810.08.0FRC
SD composite68.113.810.08.0SDC
HTT composite71.510.510.08.0HTTC
CC composite73.38.6710.08.0CCC
Bio-coal free composite74.018.0-8.0BFC
Table 6. Chemical composition of self-reducing composites, (wt %).
Composite CtotCaOMgOSiO2Al2O3Na2OK2OP2O5SFe2O3ClVM*
FRC16.89.241.977.682.080.220.440.060.03859.70.017.4
SDC15.610.01.857.872.310.190.320.040.03660.0<0.017.7
HTTC16.58.971.867.052.190.140.540.050.03460.8-3.9
CCC15.28.411.927.102.090.260.52-0.03062.90.021.9
BFC15.27.112.399.513.480.290.270.060.04859.5<0.010.10
VM*: VM calculated from the recipe for each composite.
Table 7. Mass loss (wt %) of composites during TGA tests.
CompositesRegion IRegion IIRegion III
Up to 500 °CUp to 850 °C850–950 °C950–1100 °CIsothermal Part at 1100 °C
FRC7.4118.46.5914.10.30
SDC6.8319.06.3613.30.29
HTTC3.9916.810.710.10.49
CCC1.8314.219.22.670.17
BFC0.925.318.9920.40.68
Table 8. Mass loss (wt %) of composites during interrupted tests.
Temperature, °CFRCSDCHTTCCCCBFC
5007.396.553.481.550.54
68010.311.27.214.121.81
74014.315.613.07.071.83
85017.318.116.110.24.15
95019.620.121.219.86.62