Article

Mechanical Properties Characterization of Welded Automotive Steels

1
Fraunhofer Institute for Production Systems and Design Technology (IPK), 10587 Berlin, Germany
2
Institute for Machine Tools and Factory Management (IWF), Technical University of Berlin, 10587 Berlin, Germany
3
Federal Institute for Materials Research and Testing (BAM), 12205 Berlin, Germany
*
Authors to whom correspondence should be addressed.
Metals 2020, 10(1), 1; https://doi.org/10.3390/met10010001
Submission received: 20 November 2019 / Revised: 13 December 2019 / Accepted: 16 December 2019 / Published: 18 December 2019

Abstract

:
Among the various welding technologies, resistance spot welding (RSW) and laser beam welding (LBW) play a significant role as joining methods for the automobile industry. The application of RSW and LBW for the automotive body alters the microstructure in the welded areas. It is necessary to identify the mechanical properties of the welded material to be able to make a reliable statement about the material behavior and the strength of welded components. This study develops a method by which to determine the mechanical properties for the weldment of RSW and LBW for two dual phase (DP) steels, DP600 and DP1000, which are commonly used for the automotive bodies. The mechanical properties of the resistance spot weldment were obtained by performing tensile tests on the notched tensile specimen to cause an elongation of the notched and welded area in order to investigate its properties. In order to determine the mechanical properties of the laser beam weldment, indentation tests were performed on the welded material to calculate its force-penetration depth-curve. Inverse numerical simulation was used to simulate the indentation tests to determine and verify the parameters of a nonlinear isotropic material model for the weldment of LBW. Furthermore, using this method, the parameters for the material model of RSW were verified. The material parameters and microstructure of the weldment of RSW and LBW are compared and discussed. The results show that the novel method introduced in this work is a valid approach to determine the mechanical properties of welded high-strength steel structures. In addition, it can be seen that LBW and RSW lead to a reduction in ductility and an increase in the amount of yield and tensile strength of both DP600 and DP1000.

1. Introduction

One major challenge for automotive manufactures is to reduce car body weight and fuel consumption while improving crashworthiness [1,2]. As a solution, the automotive industry has started to replace traditional low carbon and high-strength low-alloy steel with dual phase steels such as DP600 and DP1000 [3]. DP steels offer exceptional strength and impact resistance combined with good formability that can improve the crash performance of the automobile [4]. RSW and LBW are the most commonly-used joining methods for DP steels in the automotive industry [5]. However, the characterization of the mechanical properties of the weld metal remains a critical concern to analyze the safety of automotive products [6]. Various investigations, therefore, deal with the fracture behavior of resistance spot-welded steel [7]. Manladan [8] investigated the mechanical properties of resistance spot welds for DP780 and 590R under quasi-static loading conditions. He showed that a large nugget diameter of the weldment led to high strength and improved energy absorption, and concluded that the nugget diameter has a critical influence on the mechanical performance of spot welds. Pouvranvari [9] studied the effect of the weld nugget size on the failure mode of resistance spot-welded DP steels. He concluded that overloading while applying the force needed for RSW reduces the weld nugget size and failure strength, and eventually changes the failure mode from pullout to interfacial. Furthermore, the mechanical properties of DP steel using tensile-shear or cross-tensile tests were evaluated [10]. Ramazani [1] characterized the weldment of DP600 after RSW. He pointed out that the load for failure for the cross-tensile samples was lower than for the tensile-shear samples with maximum values of 6.8 kN and 7.9 kN respectively. Nayak [11] researched the HAZ softening and tensile properties of DP600, DP780, and DP980 after RSW. He noted that higher grades of DP steels exhibited a stronger softening effect in the HAZ. Nonetheless, a lap-shear tensile test used for calculating the lap-shear tensile load-displacement curves showed that the energy absorption of DP980 was higher than those of DP600 and DP780. However, the mechanical properties of the weld nugget, such as the yield and tensile strength or fracture strain, have barely been investigated [12]. Those properties can be determined by performing uniaxial tensile tests on welded DP steel. Dancette [13] produced homogenous tensile specimens from resistance spot-welded DP450 and DP980 using a Gleeble 3500 thermomechanical simulator to reproduce the microstructure of the weld nuggets on a large plate. Specimens were obtained from this plate and used for tensile tests to determine the material parameters of welded DP steels for different sheet thicknesses and cooling rates. However, the Gleeble system requires extremely high cooling rates and only a few research institutes or industries have access to such systems. Another approach to determining mechanical properties is scaling the stress–strain curves of the base metal according to the hardness profile of the weld metal, as presented by Lee [14], Kong [15], and Yang [16]. Similarly, Gosh [17] used a ball indentation technique to obtain force-penetration depth-curves for the weld zone and HAZ of high-strength, low-alloy steel. The force-penetration depth-curves were used to calculate the corresponding true stress–strain curves and mechanical properties of the different zones. Murtey [18] used the same indentation technique to investigate the mechanical and failure properties of welded SA-533B steel for the base metal, the HAZ, and the weld metal.
This paper presents a method to determine the mechanical properties for the weldment of RSW and LBW for two dual phase steels (DP600 and DP1000). The mechanical properties of resistance spot-welded DP steel were characterized by firstly reproducing the microstructure of the weld nugget of RSW on one plate. Then, the notched tensile specimens were made to perform tensile tests. The notch is needed to force failure in the welded area. The material parameters of the welded material were then calculated considering the influence of the notch. The mechanical properties of laser beam welded DP steel were obtained by performing indentation tests on the welded zone to calculate the force-penetration depth-curve. A numerical simulation of the indentation test was used to determine the parameters of a nonlinear strain hardening material model to characterize the performance of the weldment. Using the same approach, material parameters for the HAZ of RSW were calculated. The influence of LBW and RSW on the mechanical properties and microstructures of DP steels are compared and discussed in this work.

2. Experimental Analysis

2.1. Material Characterization

In the experimental tests, cold rolled and zinc-coated steel plates of DP600 with a thickness of 1 mm and blank plates of DP1000 with a thickness of 2 mm were used. The chemical compositions of both materials are summarized in Table 1.

2.2. Resistance Spot Welding

For the RSW, a C-type servo motor spot weld gun with a frequency of 1000 Hz direct-current transformer was used. Since the RSW specimens are to be used for tensile tests, the microstructure of two resistance spot-welded plates must be reproduced in a single plate. Optimum welding parameters were investigated, as described in detail in [19]. Table 2 summarizes the welding parameters used.

2.3. Laser Beam Welding

The laser beam welding was carried out with a Yb:YAG disk laser. The beam source of the system has a maximum power of 16 kW and a wavelength of 1030 nm. Steel plates made of DP600 and DP1000 were welded to investigate their microstructures and material properties. The welding parameters for the laser beam process are summarized in Table 3.

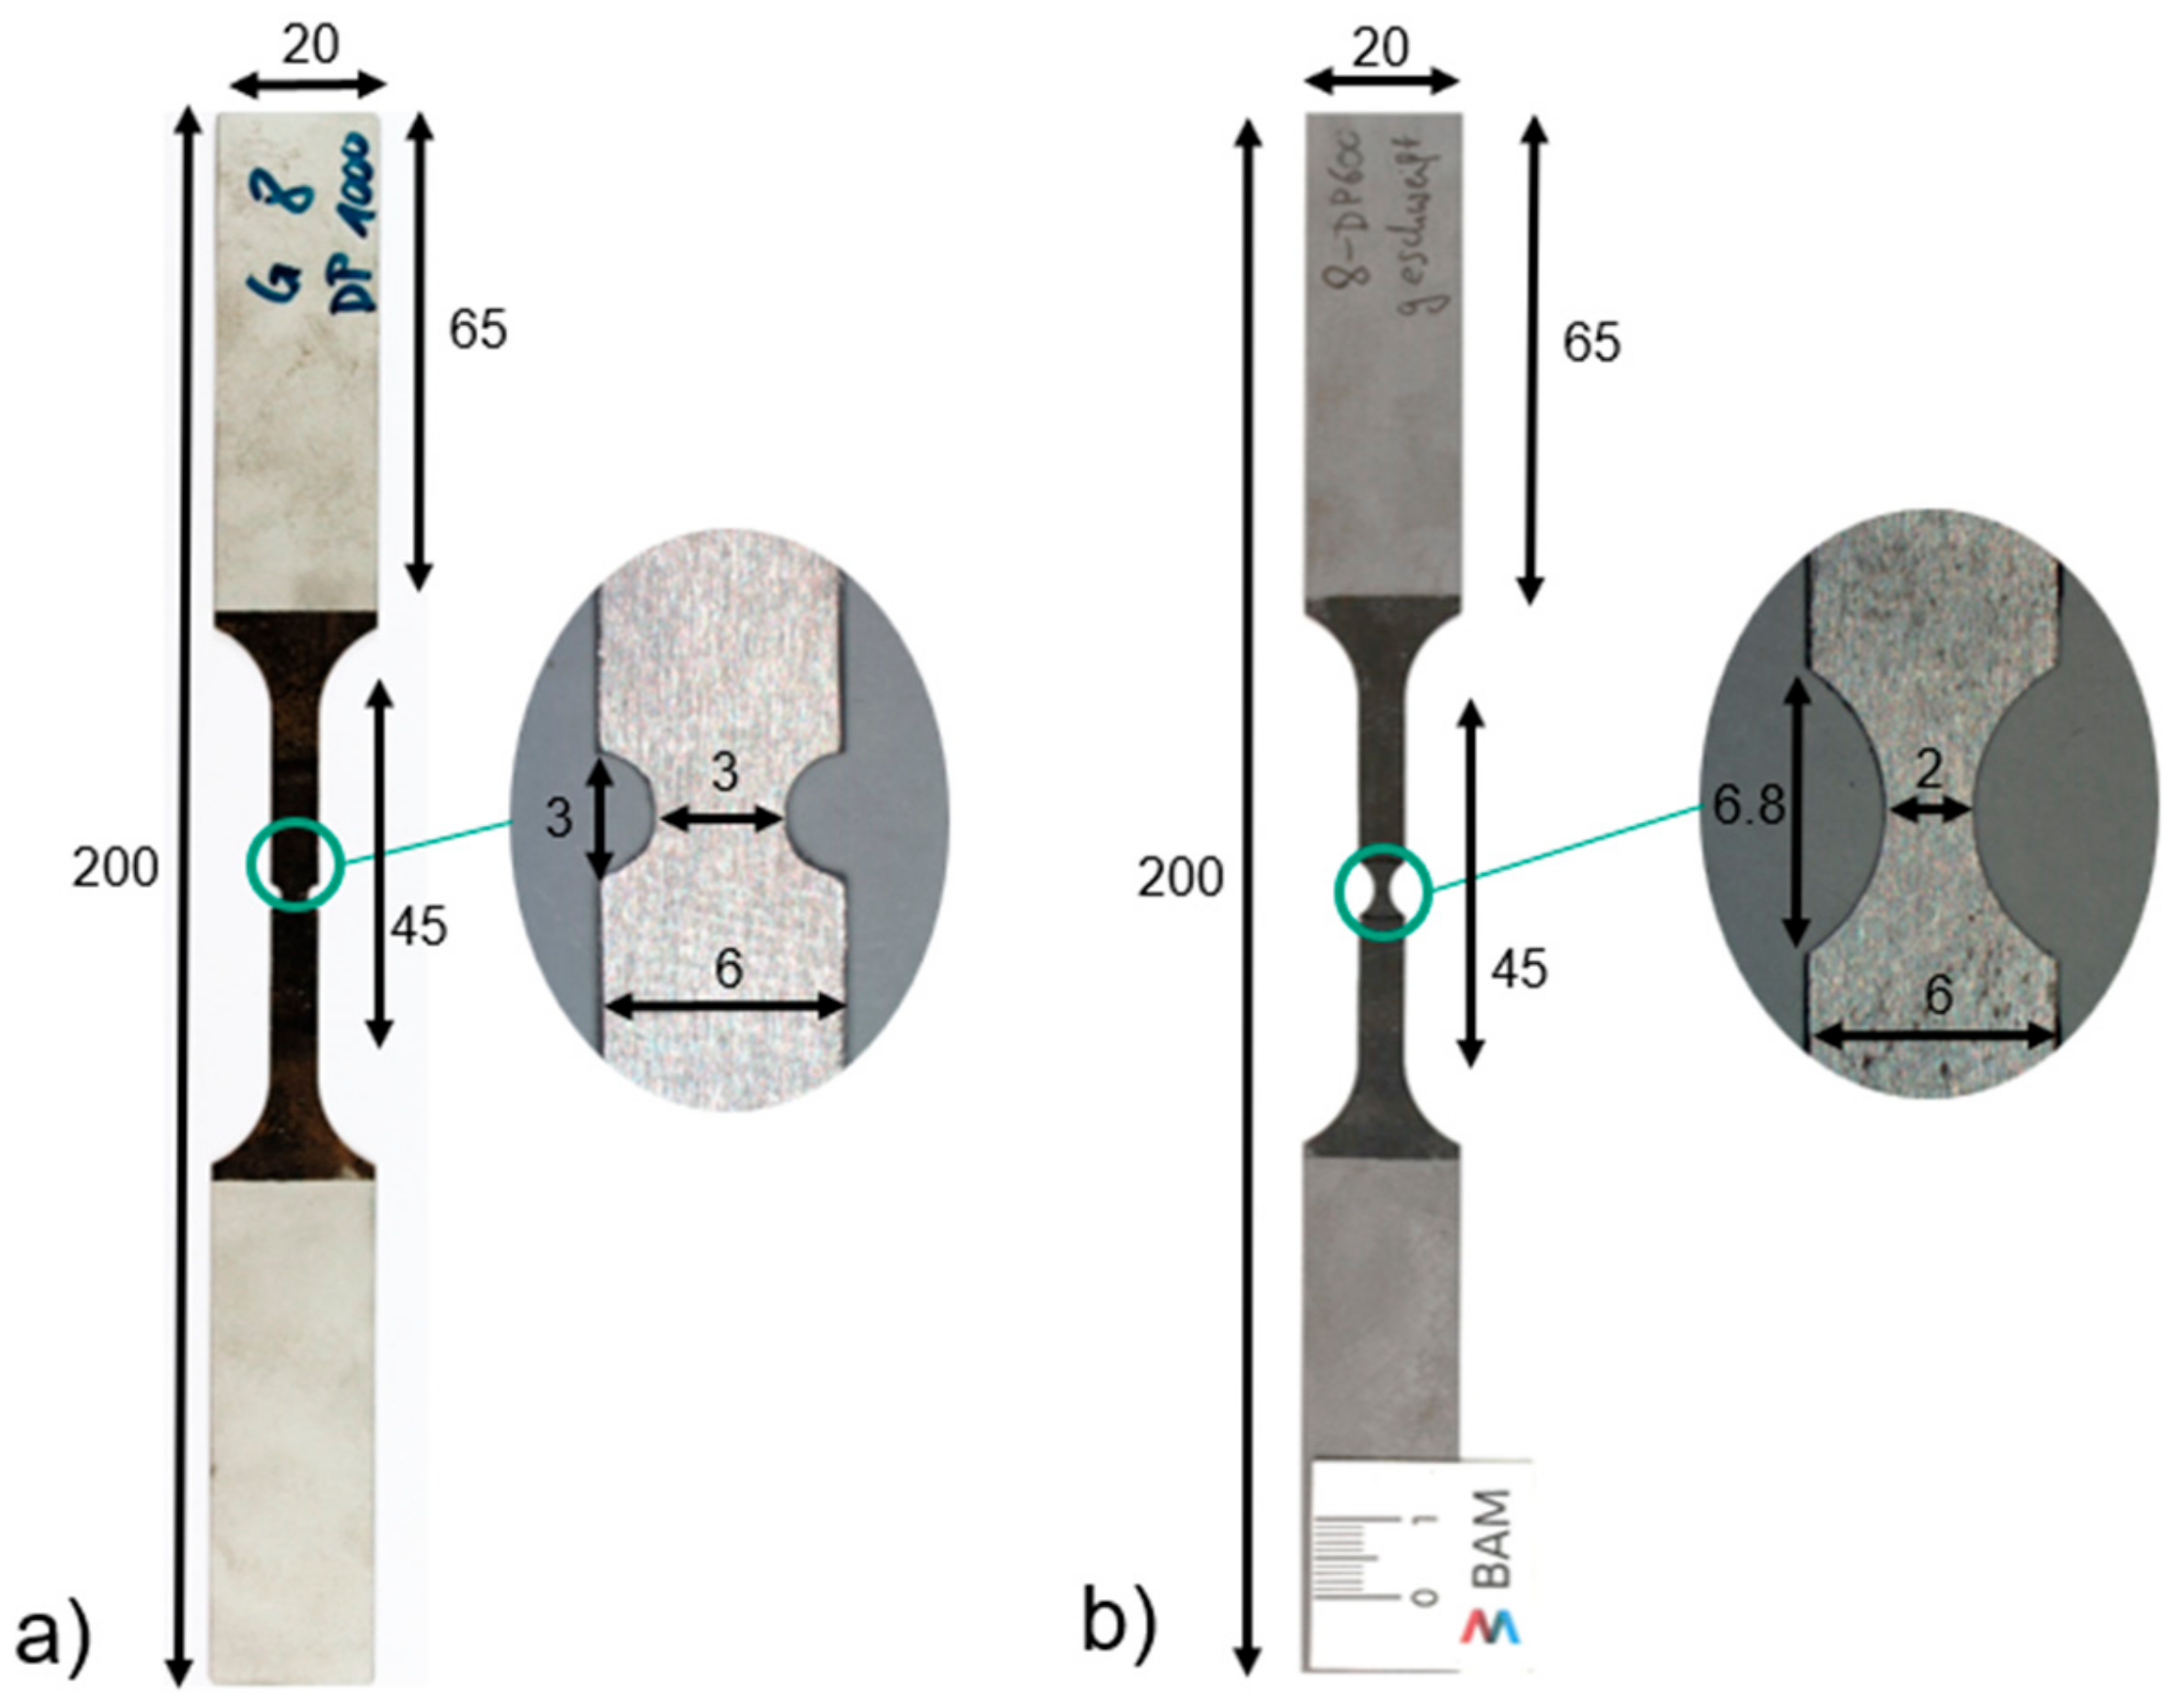
2.4. Tensile Specimen

The tensile tests were made to determine the mechanical properties of the base weld metal. The geometry was chosen according to [19], and is shown in Figure 1. For DP1000, a geometry with a distance D between the notches of 3 mm was chosen. Tensile tests have shown that this geometry for tensile specimens from DP600 leads to failure outside the notched and welded area. Therefore, a modified notch geometry with D = 2 mm was used for the DP600 specimens, where the material failure occurs in the welded area.
To produce the samples, steel plates of DP600 and DP1000 were provided with resistance spot welds. The rough dimensions of the tensile specimens were cut from the sheets using water jet cutting, and then finished by milling. Finally, the surface of the samples were ground to remove the area of the HAZ so that the sample in the welded area consisted exclusively of weld metal. The thickness of the DP1000 samples was thus reduced from 2 mm to 0.9 mm, and the thickness of the DP600 samples from 1 mm to 0.4 mm. The specimens were then sandblasted at the clamping points to increase the surface roughness locally and prevent slippage after clamping the specimens in the testing machine.
Tensile tests on the smooth and notched tensile specimens of the base material were carried out to compare the stress–strain curves and to calculate the geometry factor resulting from the notch. Furthermore, notched specimens were made from the welded material to force plastic deformation in the welded area. In this way, the mechanical properties of the weld metal could be investigated. The stress–strain curves of the notched and welded specimens were multiplied by the geometry factor to determine the stress–strain curves of the smooth and welded specimens and to calculate the material parameters of resistance spot-welded DP600 and DP1000.
A quasi-static tensile test was performed on all samples. The strain was measured using the 3D digital image correlation (DIC) system, GOM Aramis 4m. The accuracy and calibration of this system can be found in [19]. First, a tensile test of the smooth specimen of the base metal of DP600 and DP1000 was performed with a strain rate of 0.001 s−1. Using the DIC-system, a virtual extensometer length of 50 mm was used to measure the strain globally. Afterwards, tensile tests were carried out on the notched specimens of the base and weld metal of DP600 and DP1000 using a strain rate of 0.00004 s−1 and an extensometer length of 1 mm to measure the strain in the notched area. Measuring the strain with varying extensometer lengths of the DIC system helped us to determine the influence of the extensometer length on the stress–strain diagram. It is important to adjust the velocity of the strain rate to the width of the notched area of the specimens. Since the width of the notched tensile specimen is smaller than the width of the smooth specimen, the quasi-static tensile test on the notched samples was performed with a smaller strain rate compared to the smooth samples.

2.5. Indentation Test

Penetration tests were carried out with a ZHU2.5 machine (ZwickRoell, Kennesaw, GA, USA) and a diamond indenter with a tip radius of 0.2 mm. The maximum penetration depth of this indenter was 60 μm. To achieve a penetration depth of 8–12% of the nominal indenter radius of 0.2 mm, the maximum load was set to 120 N and the speed of the indenter to 0.05 mm/min. After reaching the maximum load and observing a waiting time of two seconds, the sample was relieved with a speed of 0.05 mm/min. For the DP600 and DP1000, two points each were tested in the base metal, i.e., in the HAZ and in the weld metal, for both the LBW and RSW specimens.

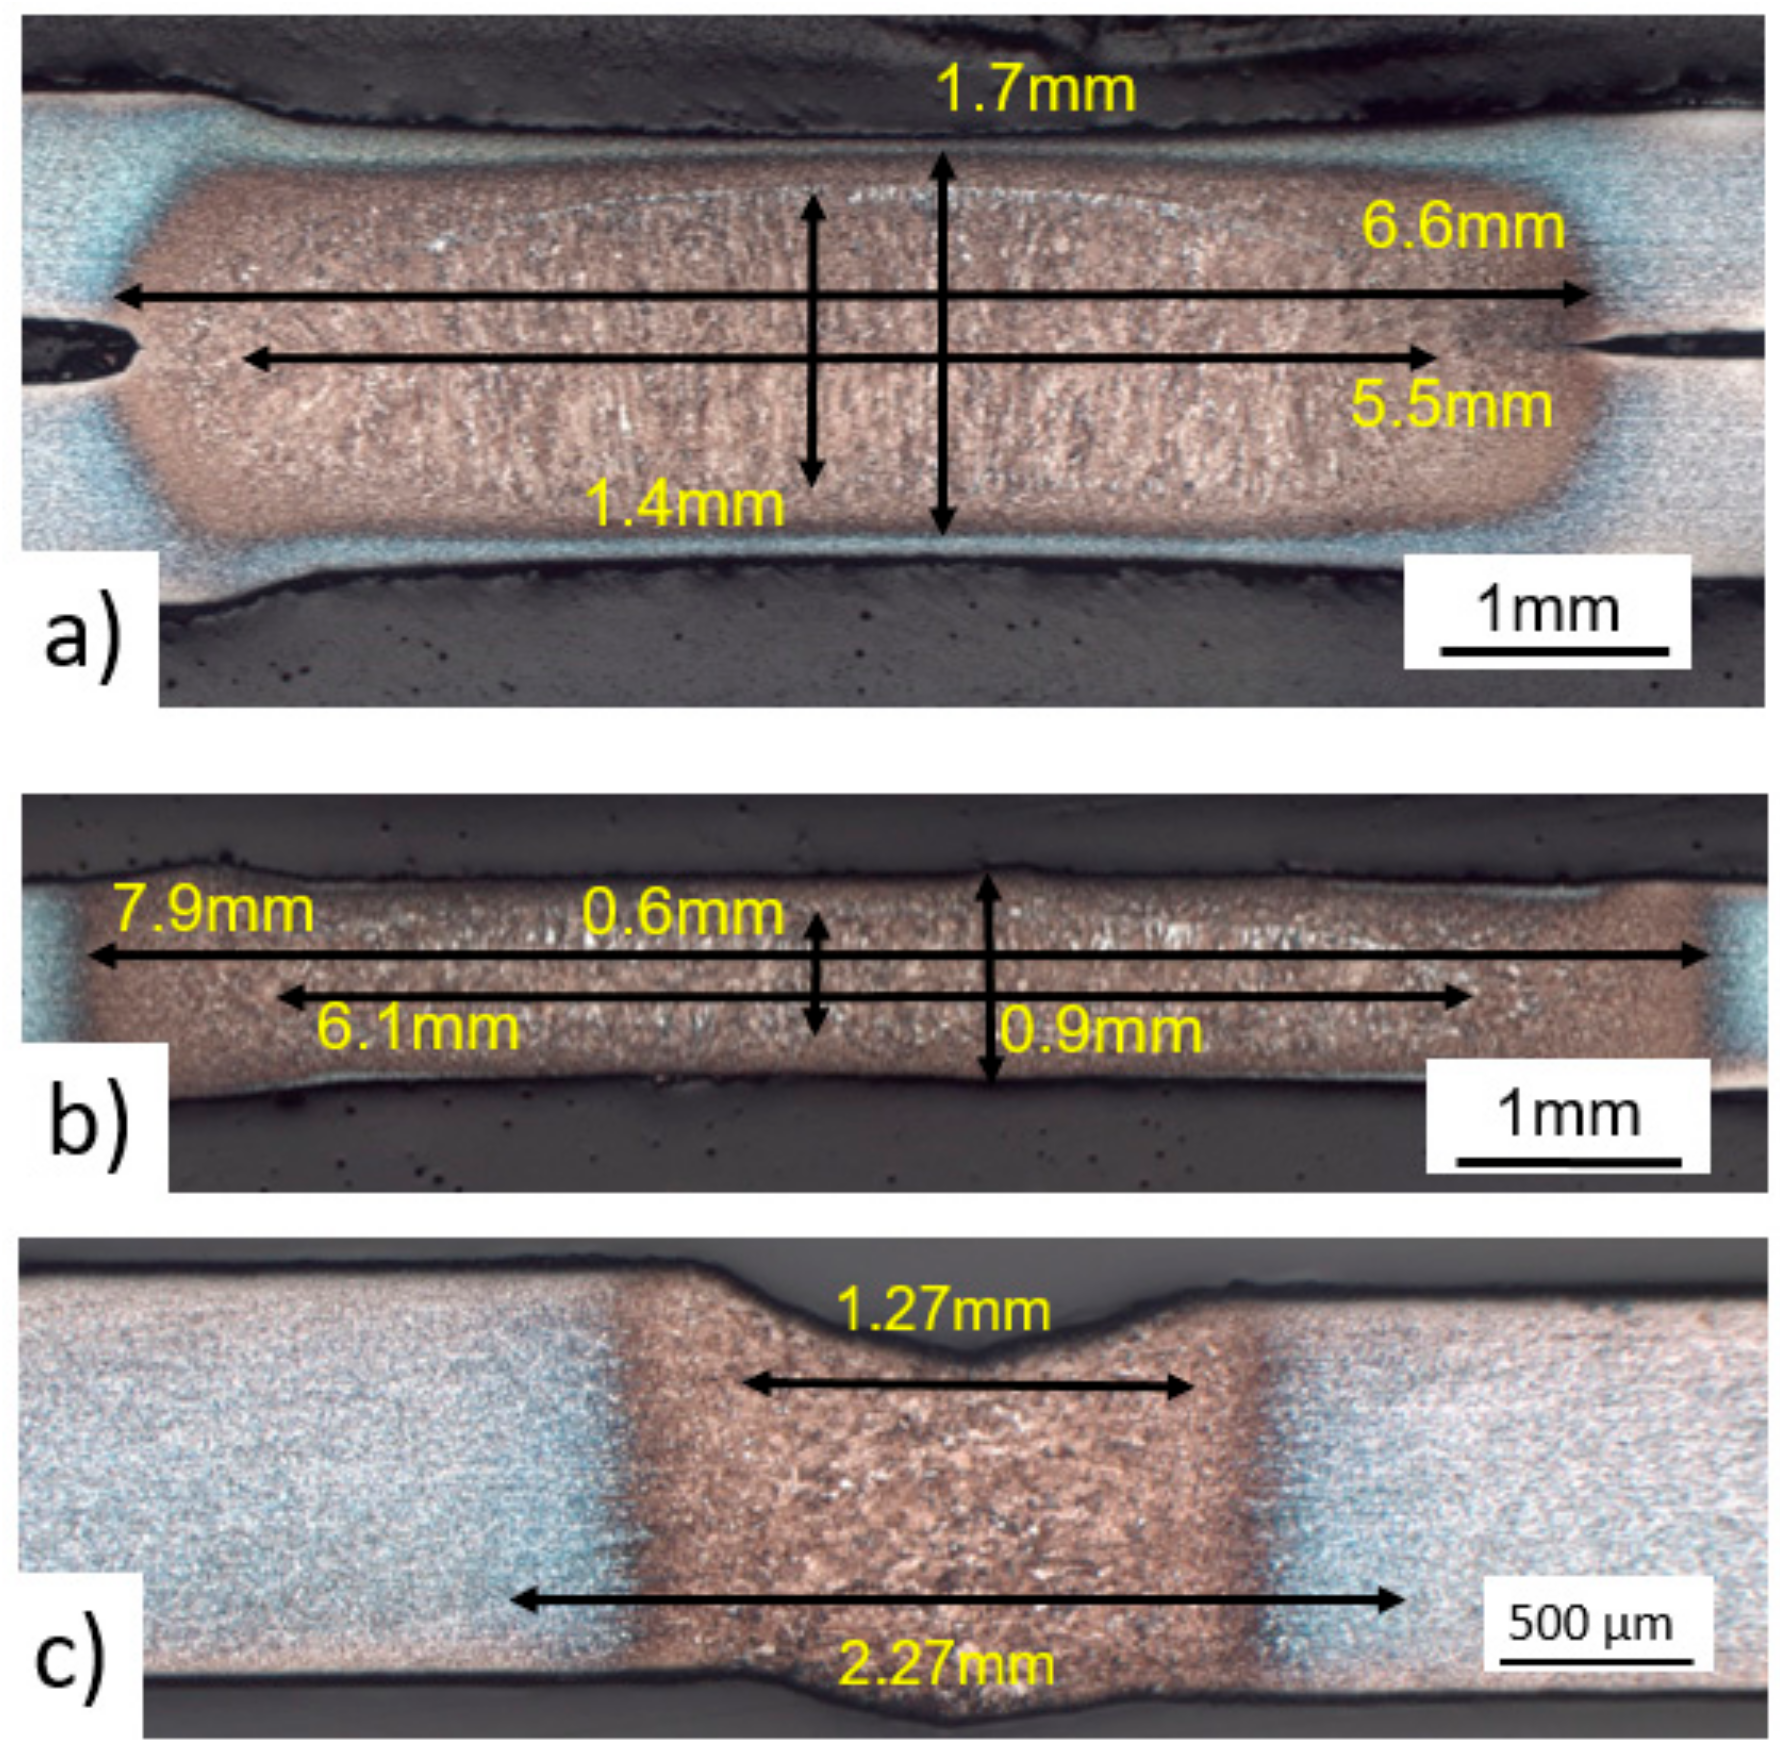
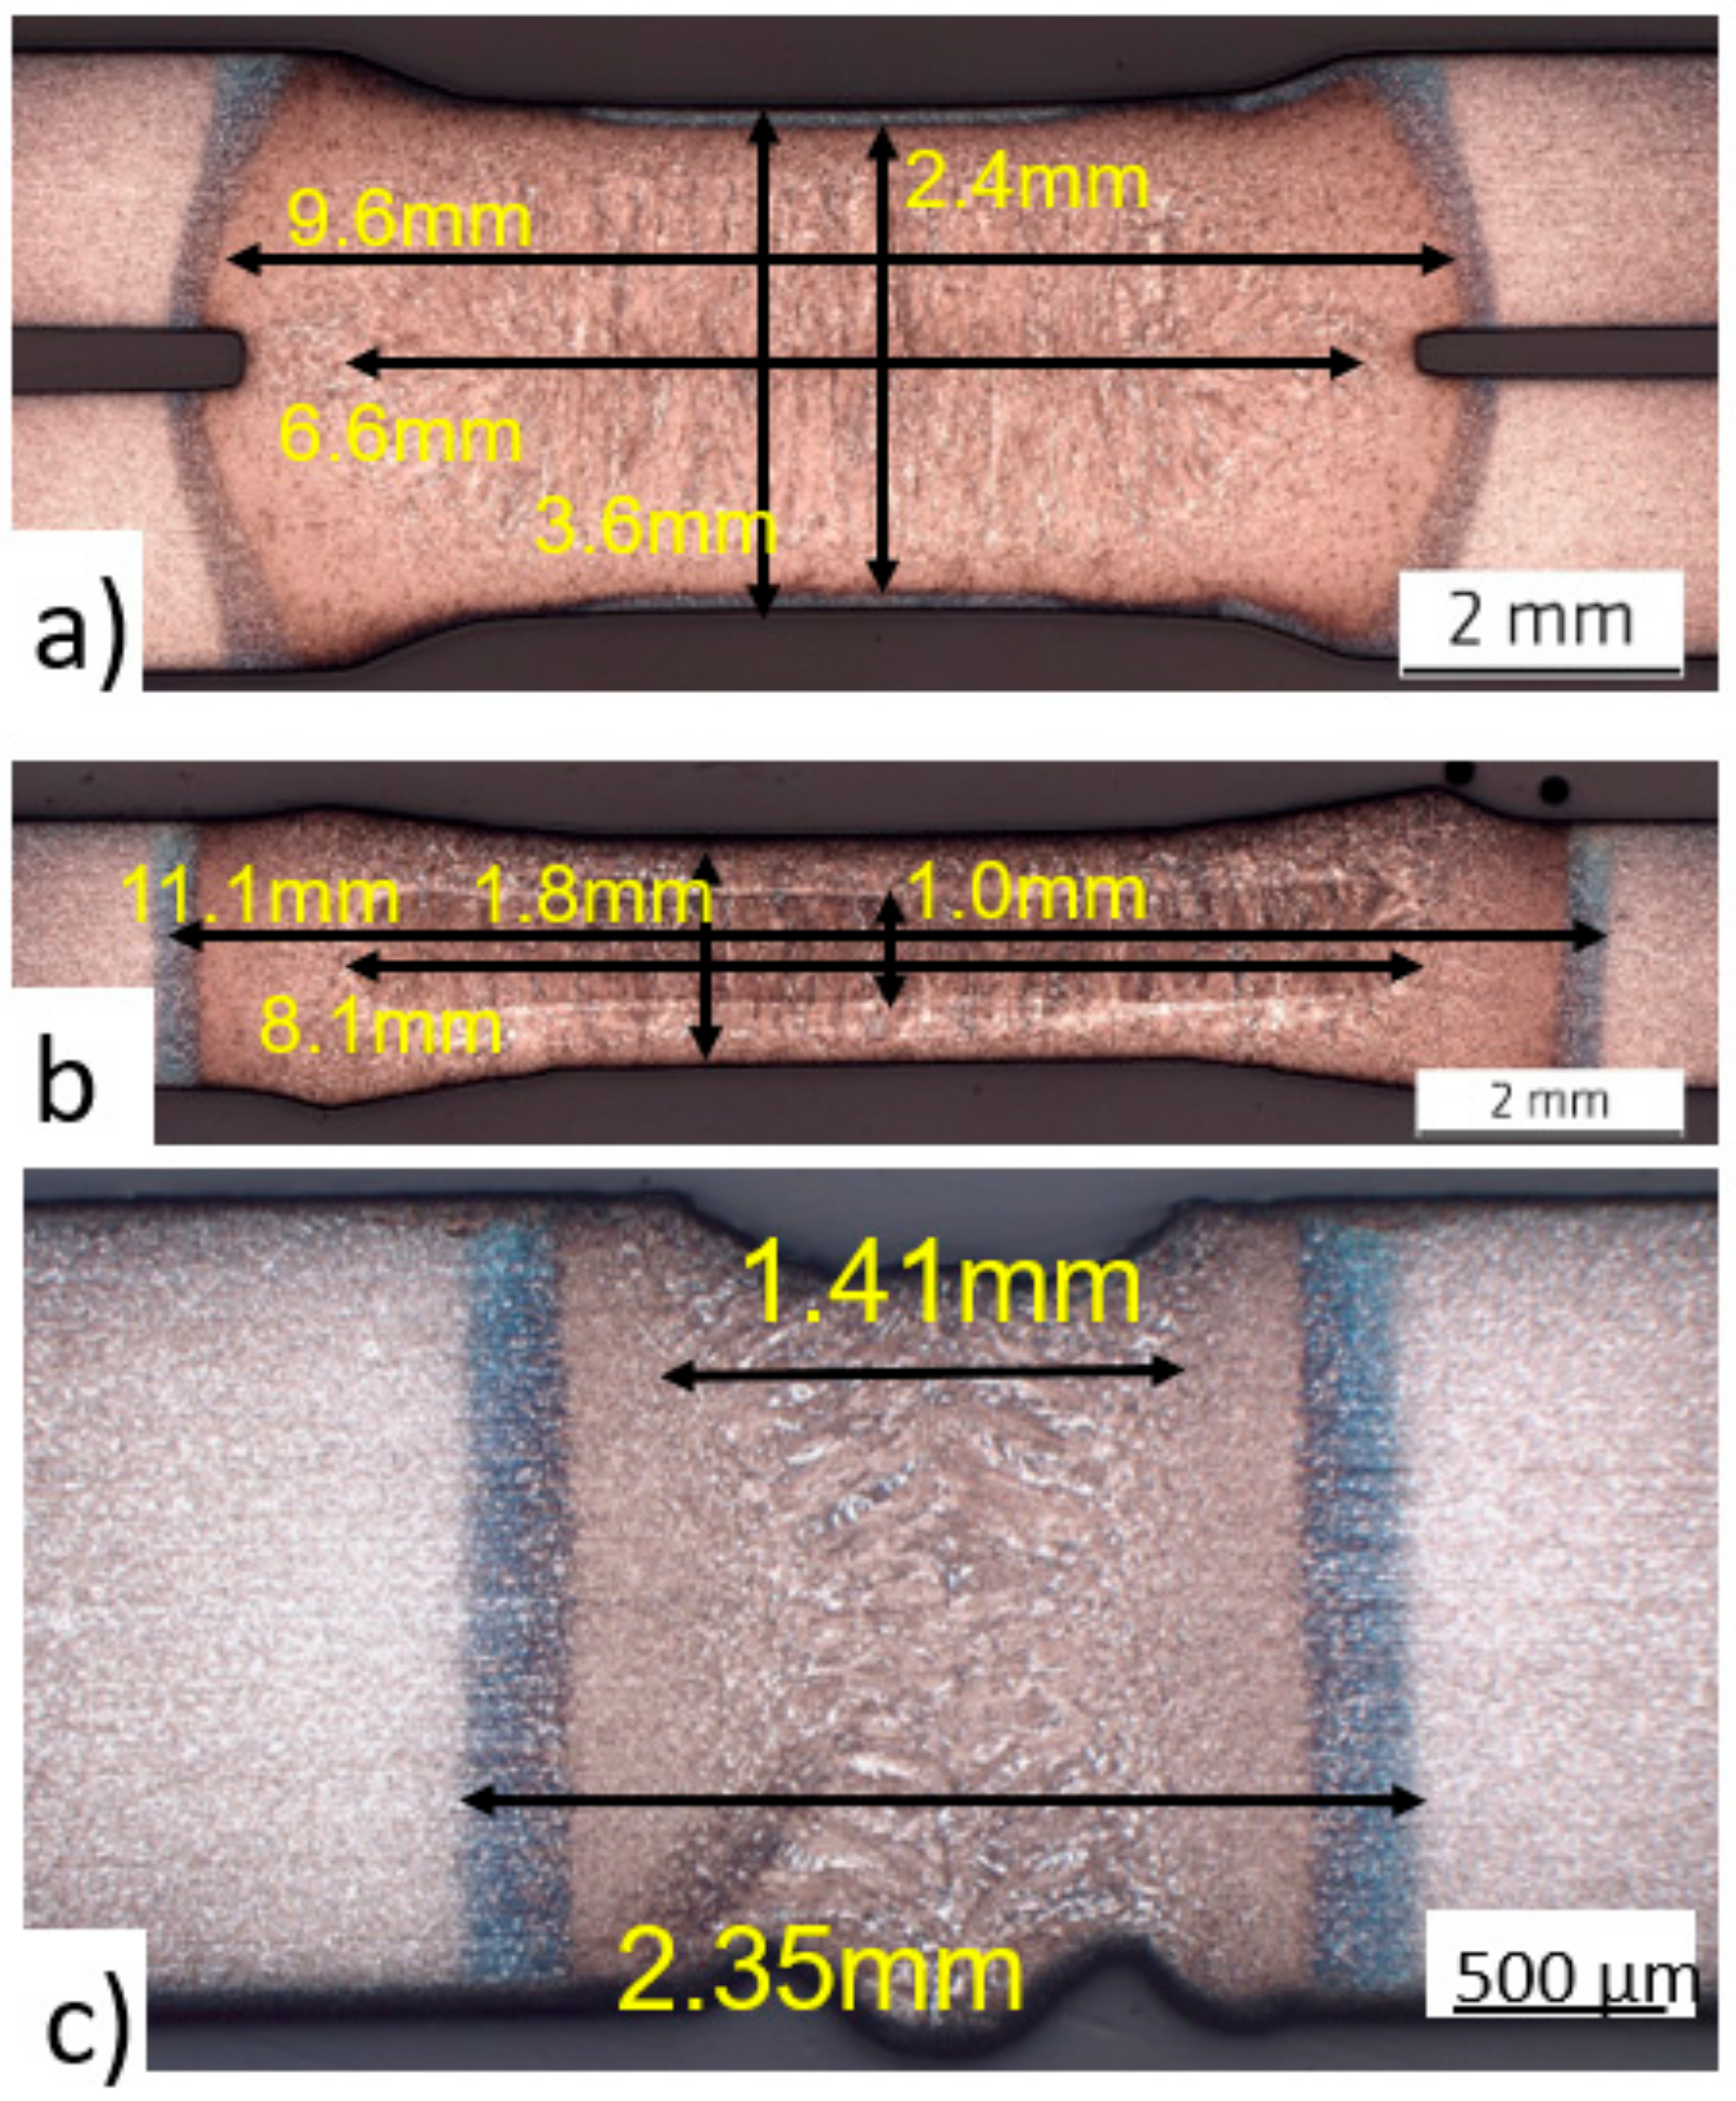
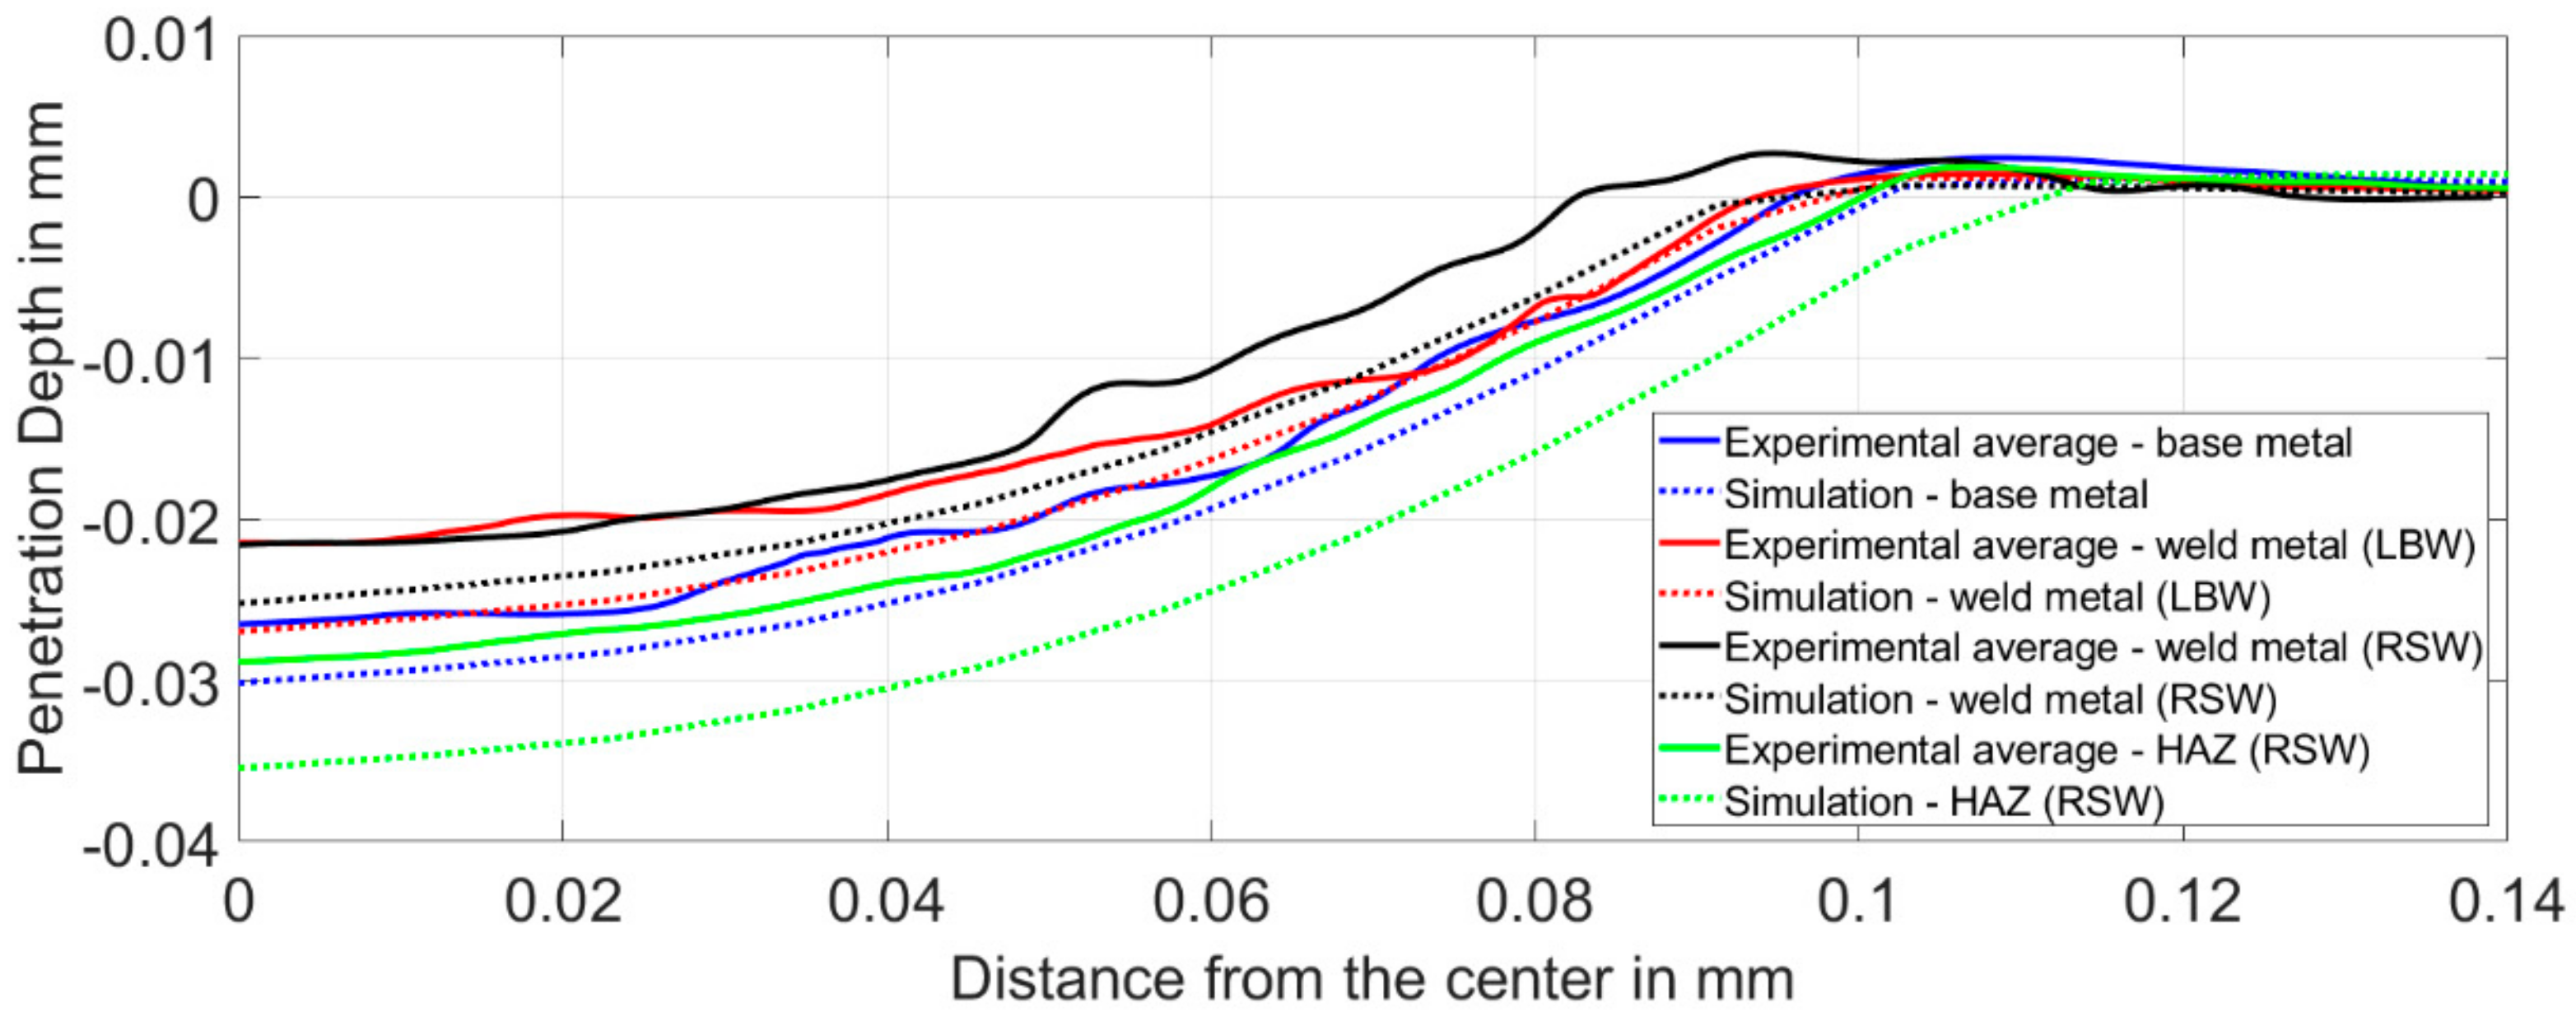
2.6. Analysis of the Penetration Profile

Optical analyses of the specimen after the indentation test were carried out using an Alicona Infinite Focus microscope (Alicona Imaging GmbH, Graz, Austria). Alicona is a high-resolution, optical 3-D measuring system that analyses the surface of a specimen to extract depth information. With this system, the penetration profile of the specimen can be determined and compared with the result from the numerical simulation to verify the calculated material properties of the weld metal of the investigated DP steels.

3. Numerical Approach
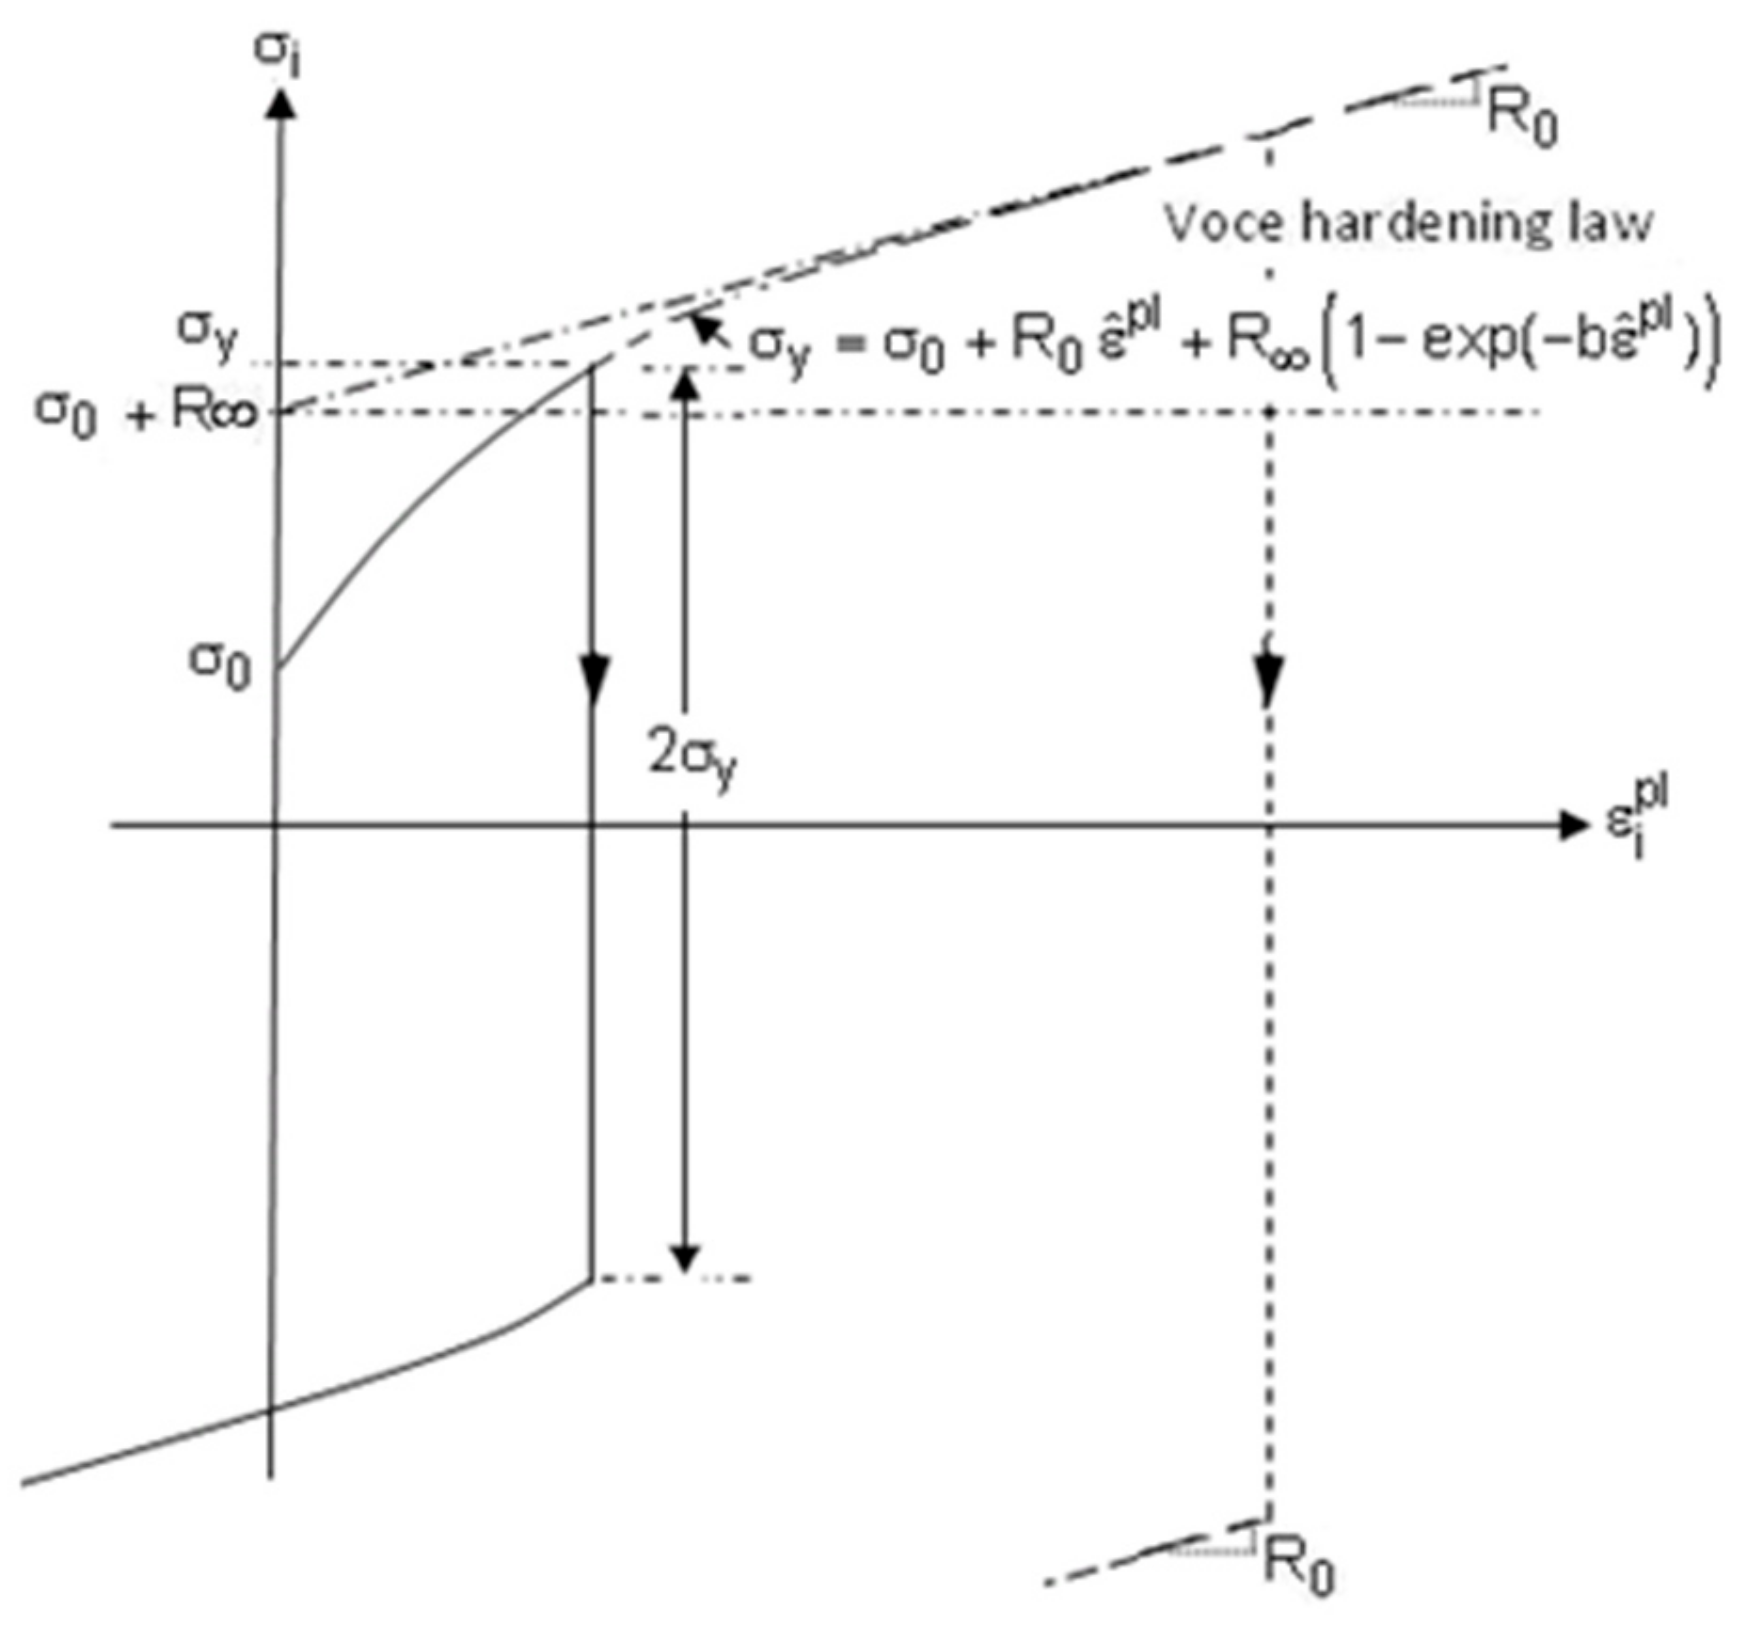
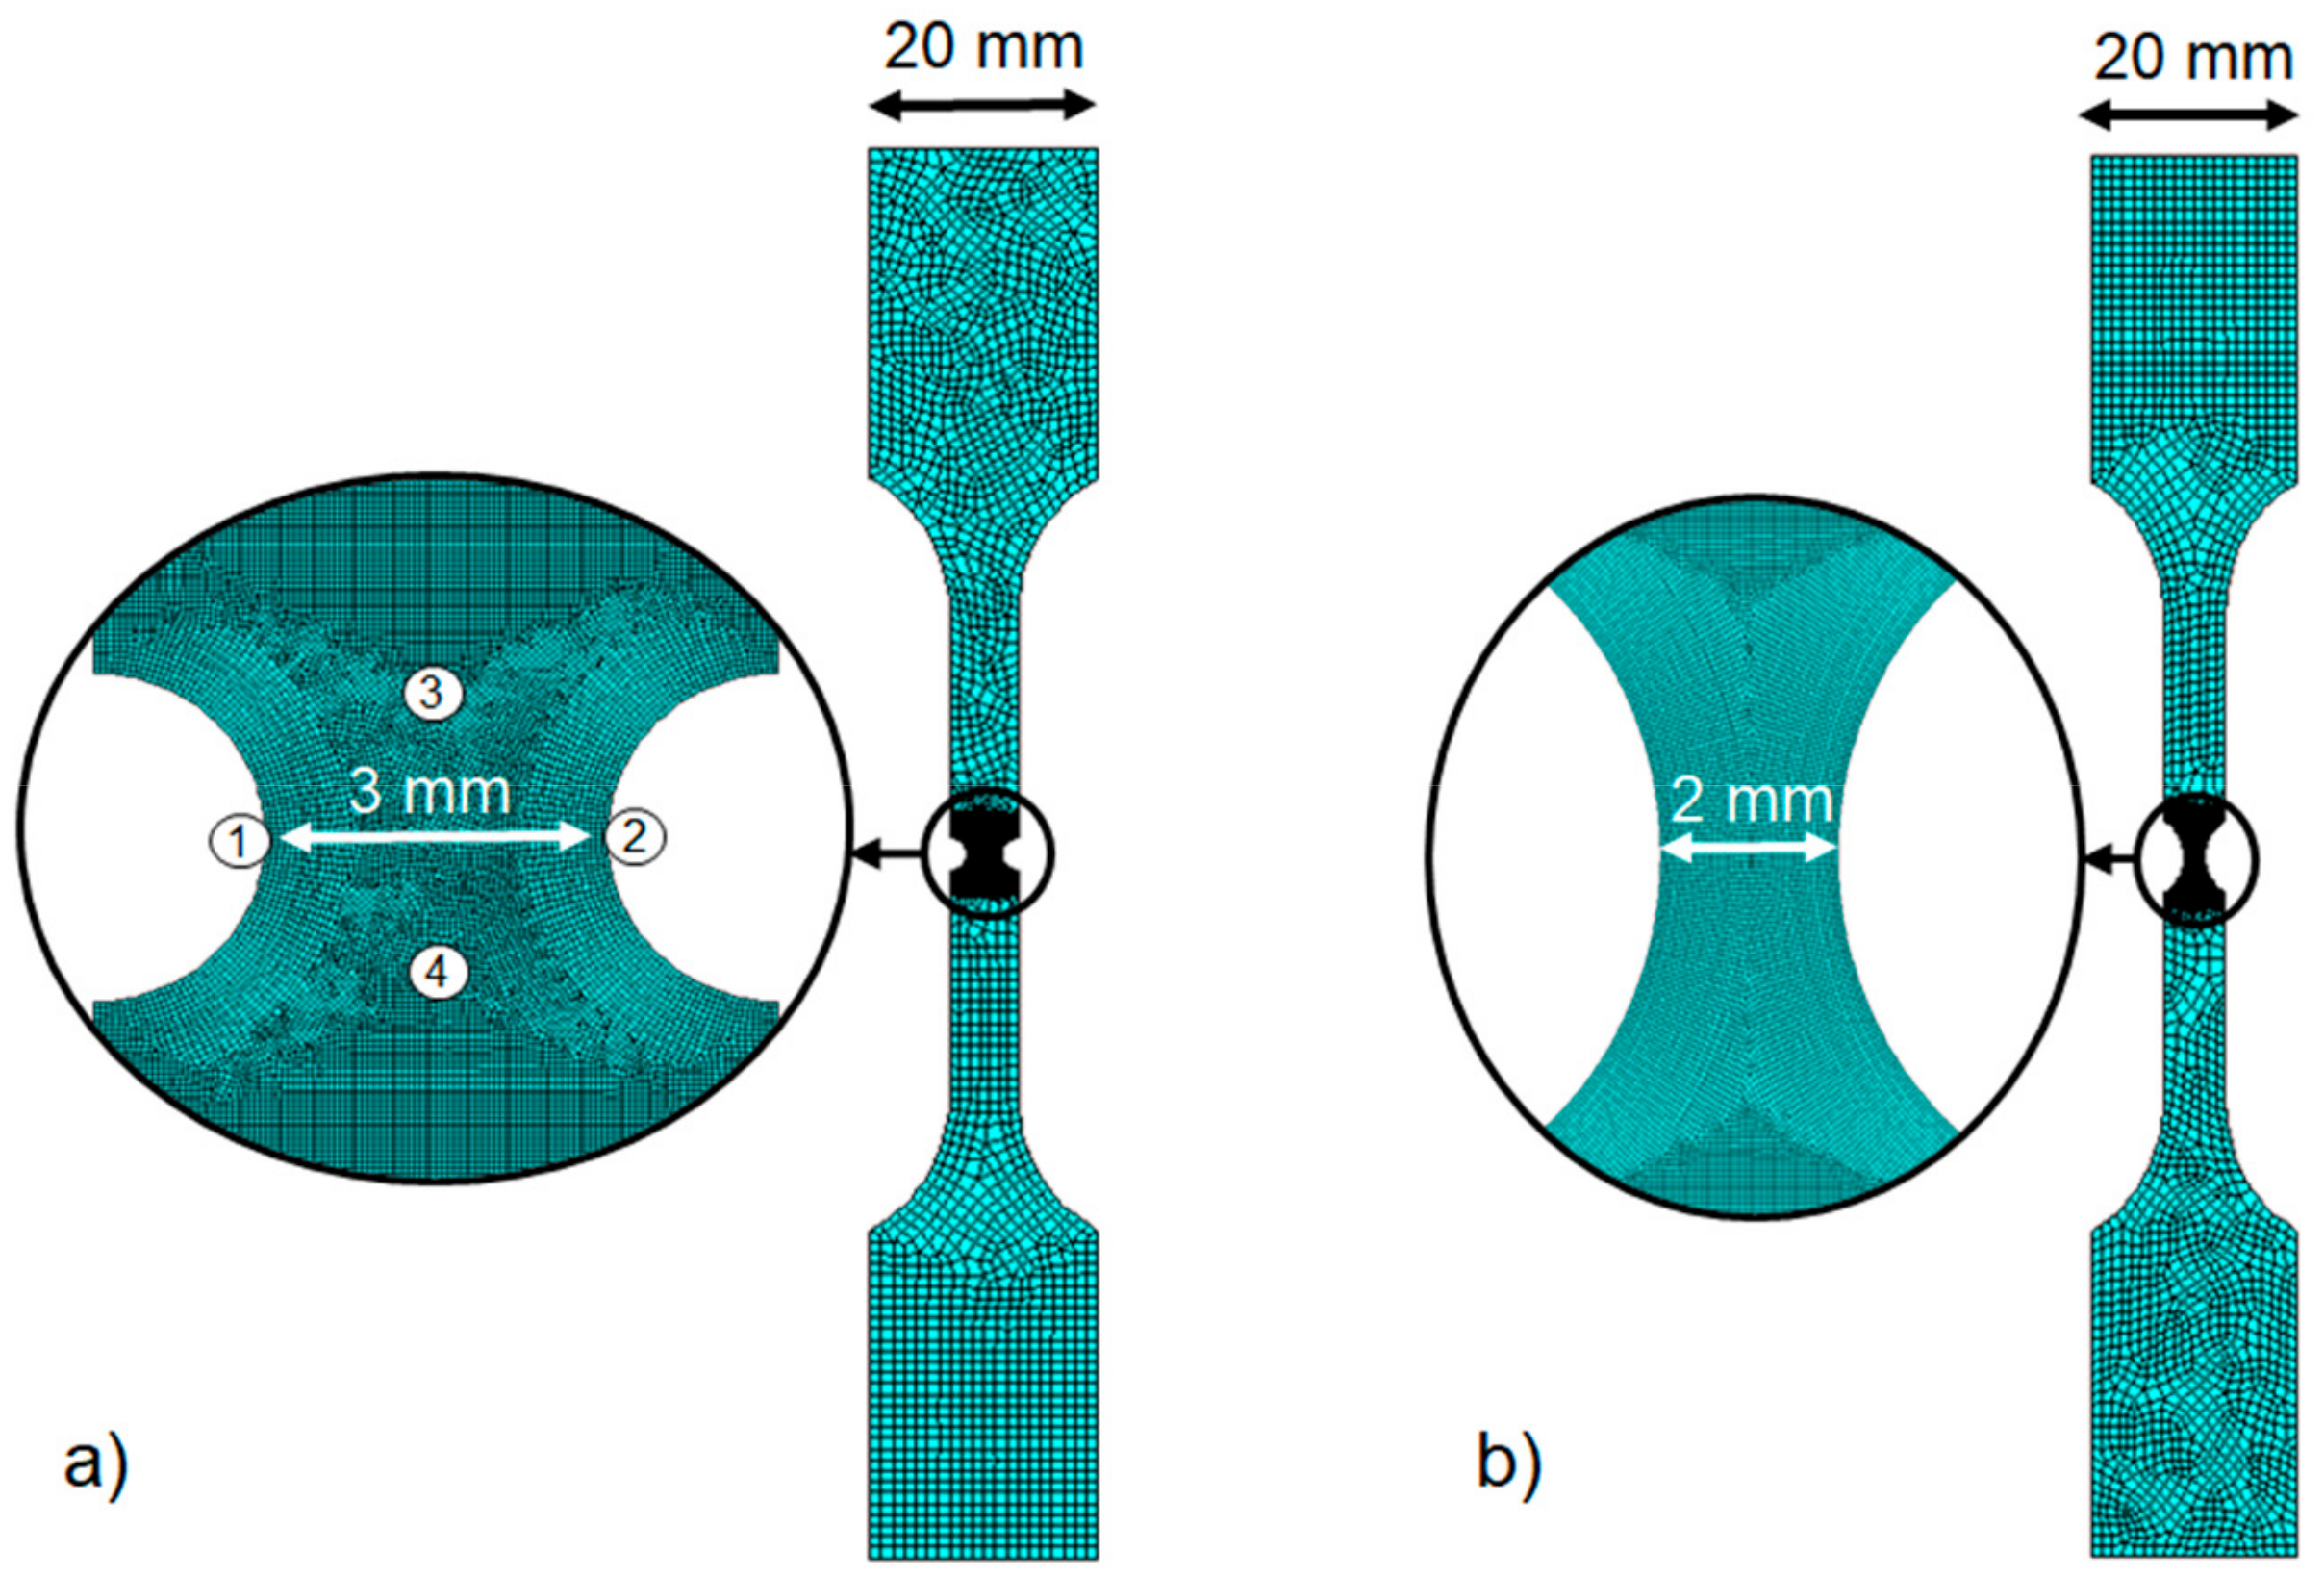
3.1. Tensile Test

Numerical simulations of the tensile tests of smooth and notched specimens were performed. In order to calculate the plastic stress–strain behavior of the investigated materials, the Voce nonlinear isotropic hardening model [20], shown in Equation (1), was used.
σ = σ 0 + R 0 · ε p l + R   ·   1 e b   ·   ε p l
where σ 0 stands for the yield strength, i.e., the stress at which the plastic deformation begins, R0 is the slope of the saturation stress, and Rinf is the difference between the initial yield strength and saturation stress. The parameter b is a hardening parameter that characterizes the saturation rate, and ε p l describes the plastic strain. Figure 2 illustrates this influence of the parameter on the stress–strain behavior.
Figure 3 shows the simulation models of the notched tensile specimens. The specimens were fixed on the bottom side and a load was continuously applied to the upper side of the sample. A two-dimensional simulation was carried out with four-node plane elements. A mesh size of 0.05 mm in the notch and 1 mm in the remaining tensile specimen was used. In order to calculate the local strain in the welded area, the displacement of four points in the notch was investigated, as schematically shown in Figure 3a.
Calculating the distance between point 1 and point 2 results in the changing cross-section of the specimen during the tensile test; this is necessary to determine the true stress. With the displacement of points 3 and 4, the strain of the specimen can be investigated locally in the notched area. This corresponds to the operating principle of virtual extensometers for evaluating tensile tests with the DIC system. The true stress–strain curves can be determined with the cross-sections, strains, and applied loads.
First, the material parameters for the smooth sample of the base material DP1000 can be determined by inverse simulation. This is done by simulating the tensile tests with varying material parameters randomly until there is a minimal Euclidean distance between the simulation and experimental results. With this approach, the material parameters for the smooth base metal of DP1000 are obtained. Subsequently, the notched specimen with the notch geometry shown in Figure 3a was simulated with the same material model parameters as those of the smooth base metal of DP1000 to only investigate the influence of this notch geometry on the stress–strain behavior. The geometry factor for DP1000 was calculated by comparing both of the aforementioned stress–strain curves. Afterwards, the material parameters for welded (RSW) and notched DP1000 can be determined by using the experimental data from the tensile tests and inverse simulation, as described above. Those material model parameters for welded and notched specimens of DP1000 are then multiplied by the geometric factors to calculate the material parameters for smooth and welded specimens from DP1000. Finally, the notched and welded specimen is simulated with the calculated model parameters for smooth and welded specimens, and compared with the results of the tensile tests to validate the simulation result.
The same procedure is used to calculate the material parameters for DP600. However, a modified notch geometry has to be used, because the tensile tests have shown that failure occurred outside the notched and welded (RSW) area of the DP600 specimen. This modified notch geometry is shown in Figure 3b. Consequently, new geometric factors for DP600 have to be determined using the same approach as explained above. The material model parameters for welded and notched DP600 are calculated by inverse simulation and multiplied with the geometry factor for the modified notch geometry to determine the material model parameters for smooth and welded DP600. Afterwards, the tensile test for the notched specimen is simulated using the material model parameters of smooth and welded specimens, and compared with the experimental results to validate the simulation model for DP600.

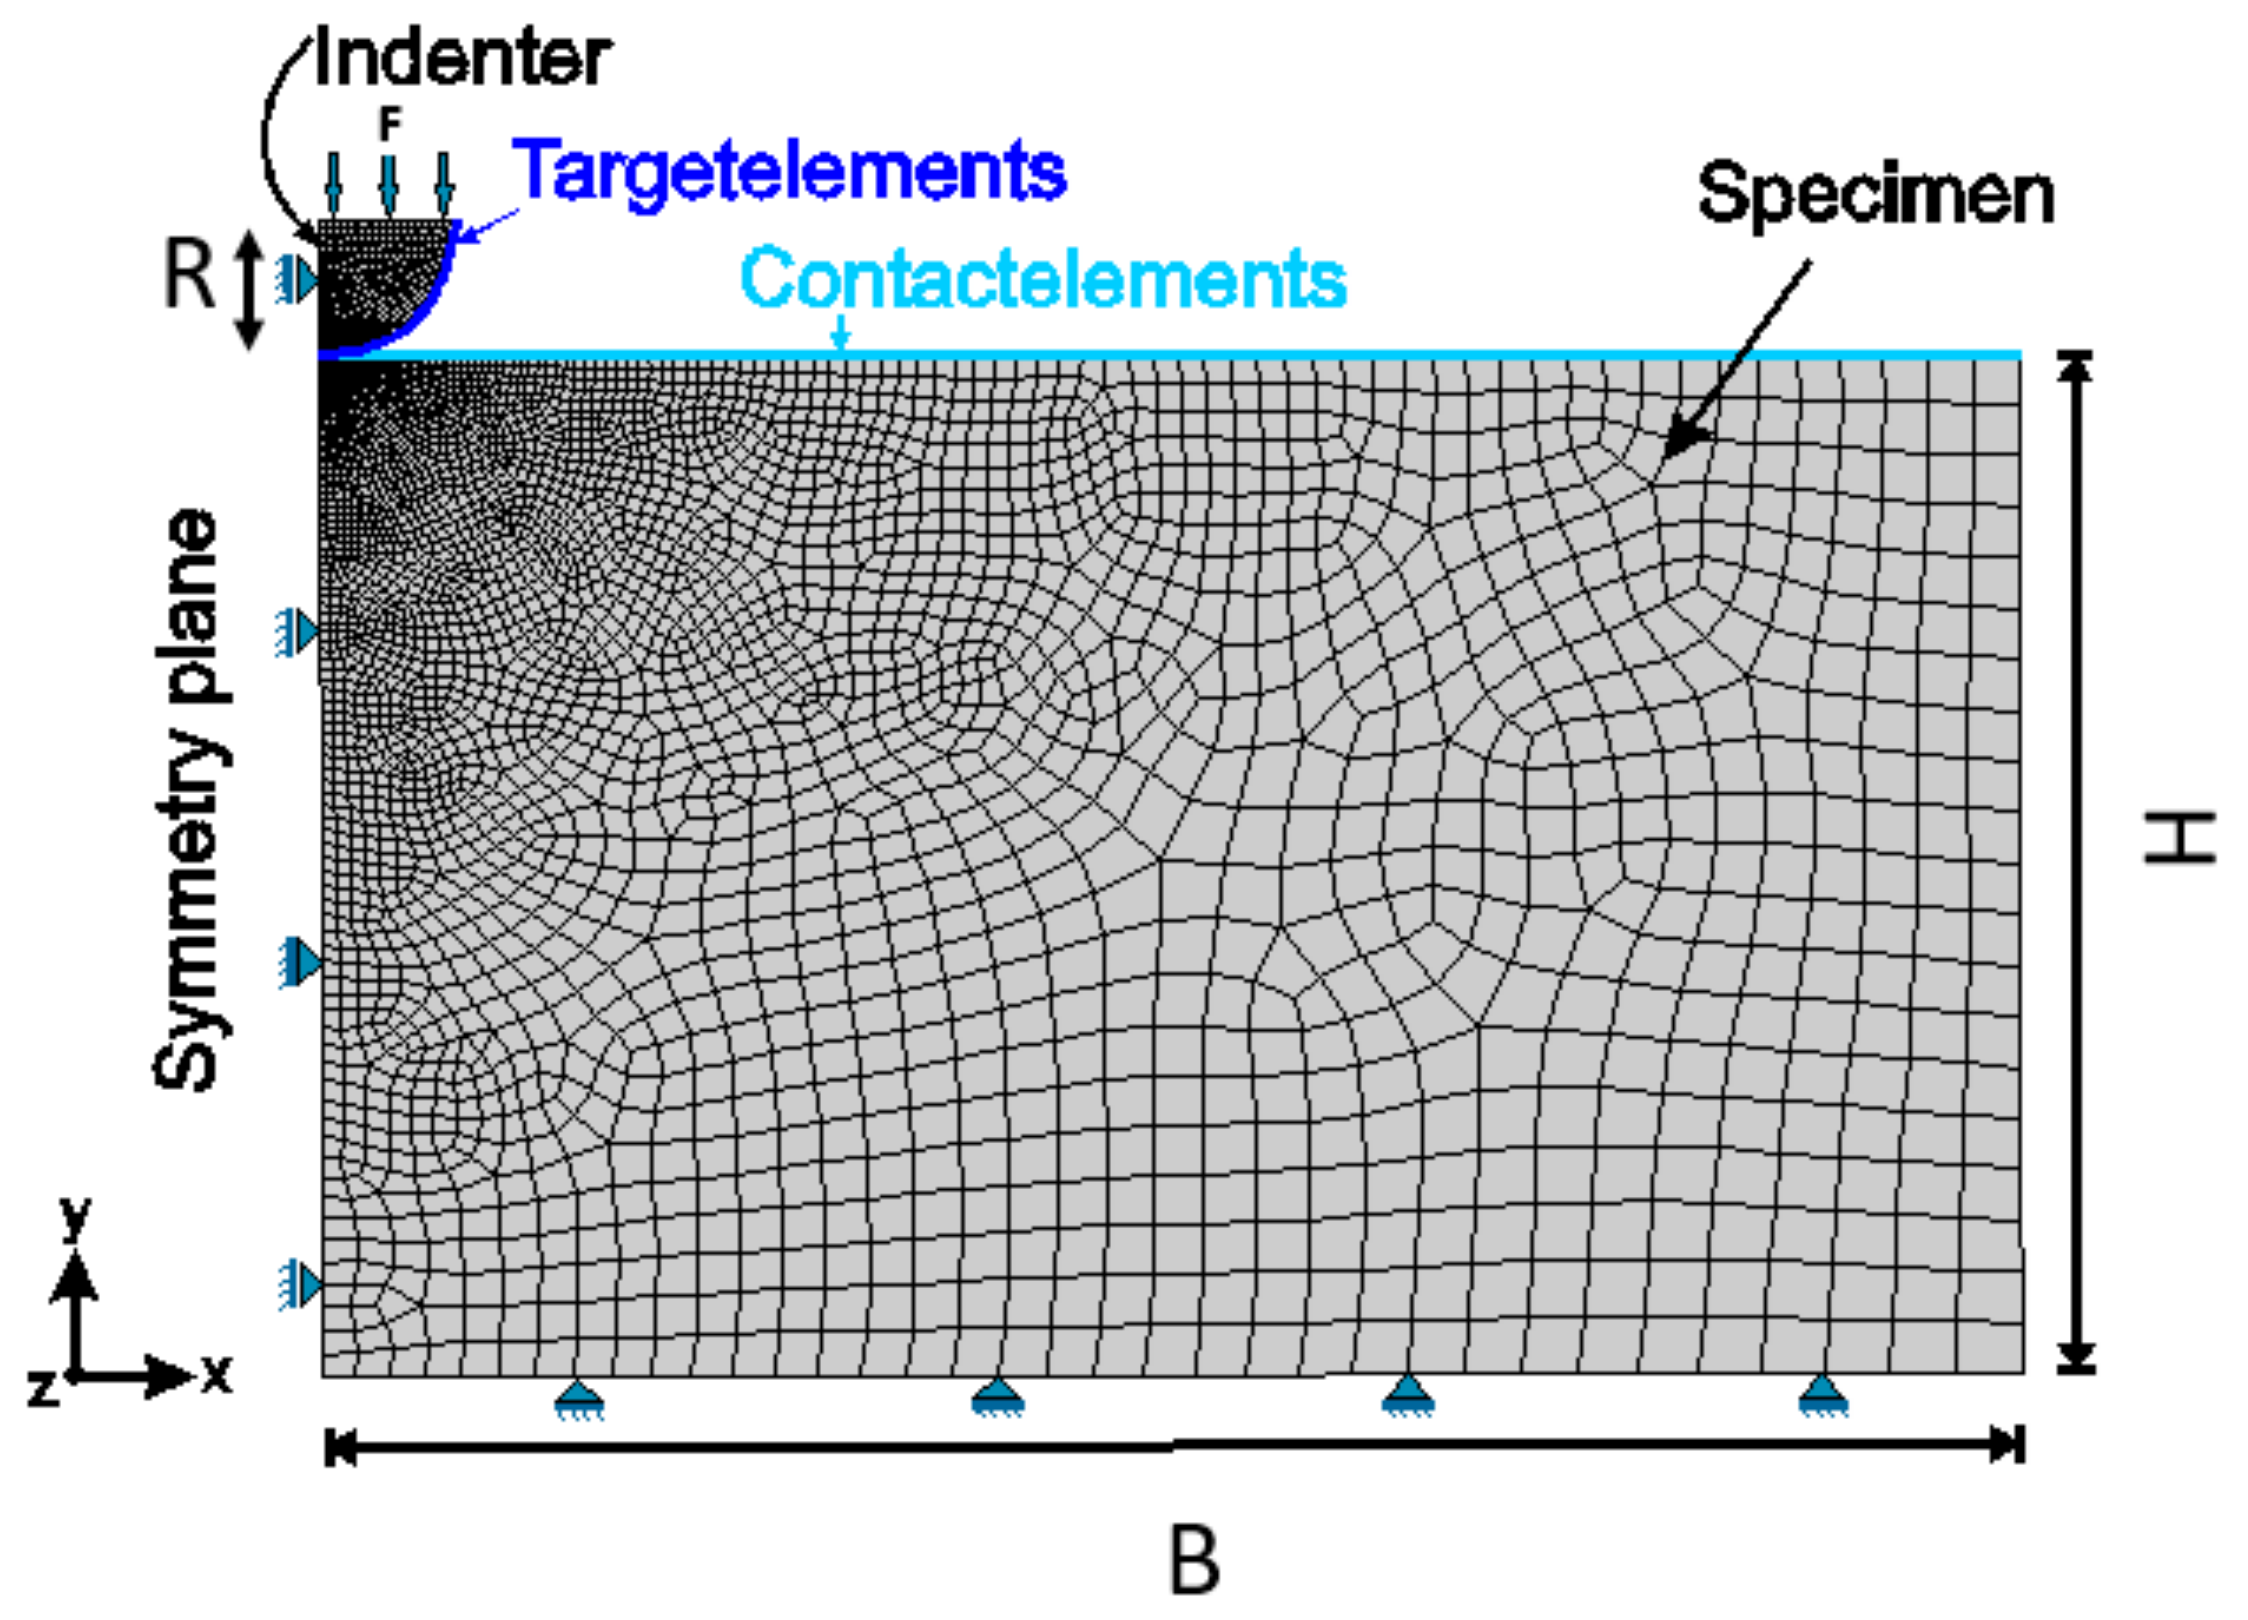
3.2. Indentation Test

A two-dimensional, numerical simulation was performed using eight-node elements. A linear-elastic material behavior was selected for the indenter with a Young’s modulus of 1140 GPa and a Poisson’s ratio of 0.07. For the specimen, a nonlinear isotropic strain hardening material model, as described in Section 3.1, is used. The geometry and dimensions of the simulation model are shown in Figure 4 and Table 4. A mesh size of 0.0057 mm in the area of the contact between the indenter and specimen, and 0.018 mm in the remaining specimen, was used.
The model was constructed to be axially symmetrical to the y-axis, and the bottom of the sample was fixed. A load (F) of 120 N was applied to the upper edge of the indenter. A flexible-to-flexible contact pair between the indenter (target) and the specimen (contact) was defined. For the contact between a diamond indenter and a steel sample, a coefficient of friction of 0.15 according to [21] was selected.
To determine the load-indentation depth curve, the displacement and the load of a node in the middle of the contact between the indenter and the specimen were investigated. Furthermore, the penetration profile of the indenter was simulated by calculating the displacements of the nodes on the surface of the sample after applying the load. The material parameters for welded DP600 and DP1000 could be determined by inverse simulation. For this approach, in the first step, the indentation test was simulated with random values for the material parameters σ 0 ,   R 0 ,   R , and b, as given in Equation (1). In the next step, the material parameters were adjusted until there was a minimal Euclidean distance between the simulation and the experimental results of the indentation tests. Using this approach, the difference of the simulation results and the experimental data was minimal, and therefore, the material parameters for the base and weld metal of LBW, and for the HAZ of RSW, were obtained. In addition, numerical simulations were carried out with the material parameters for the base metal and weld metal of RSW, as already determined from the tensile tests, to validate the results.

4. Results and Discussion

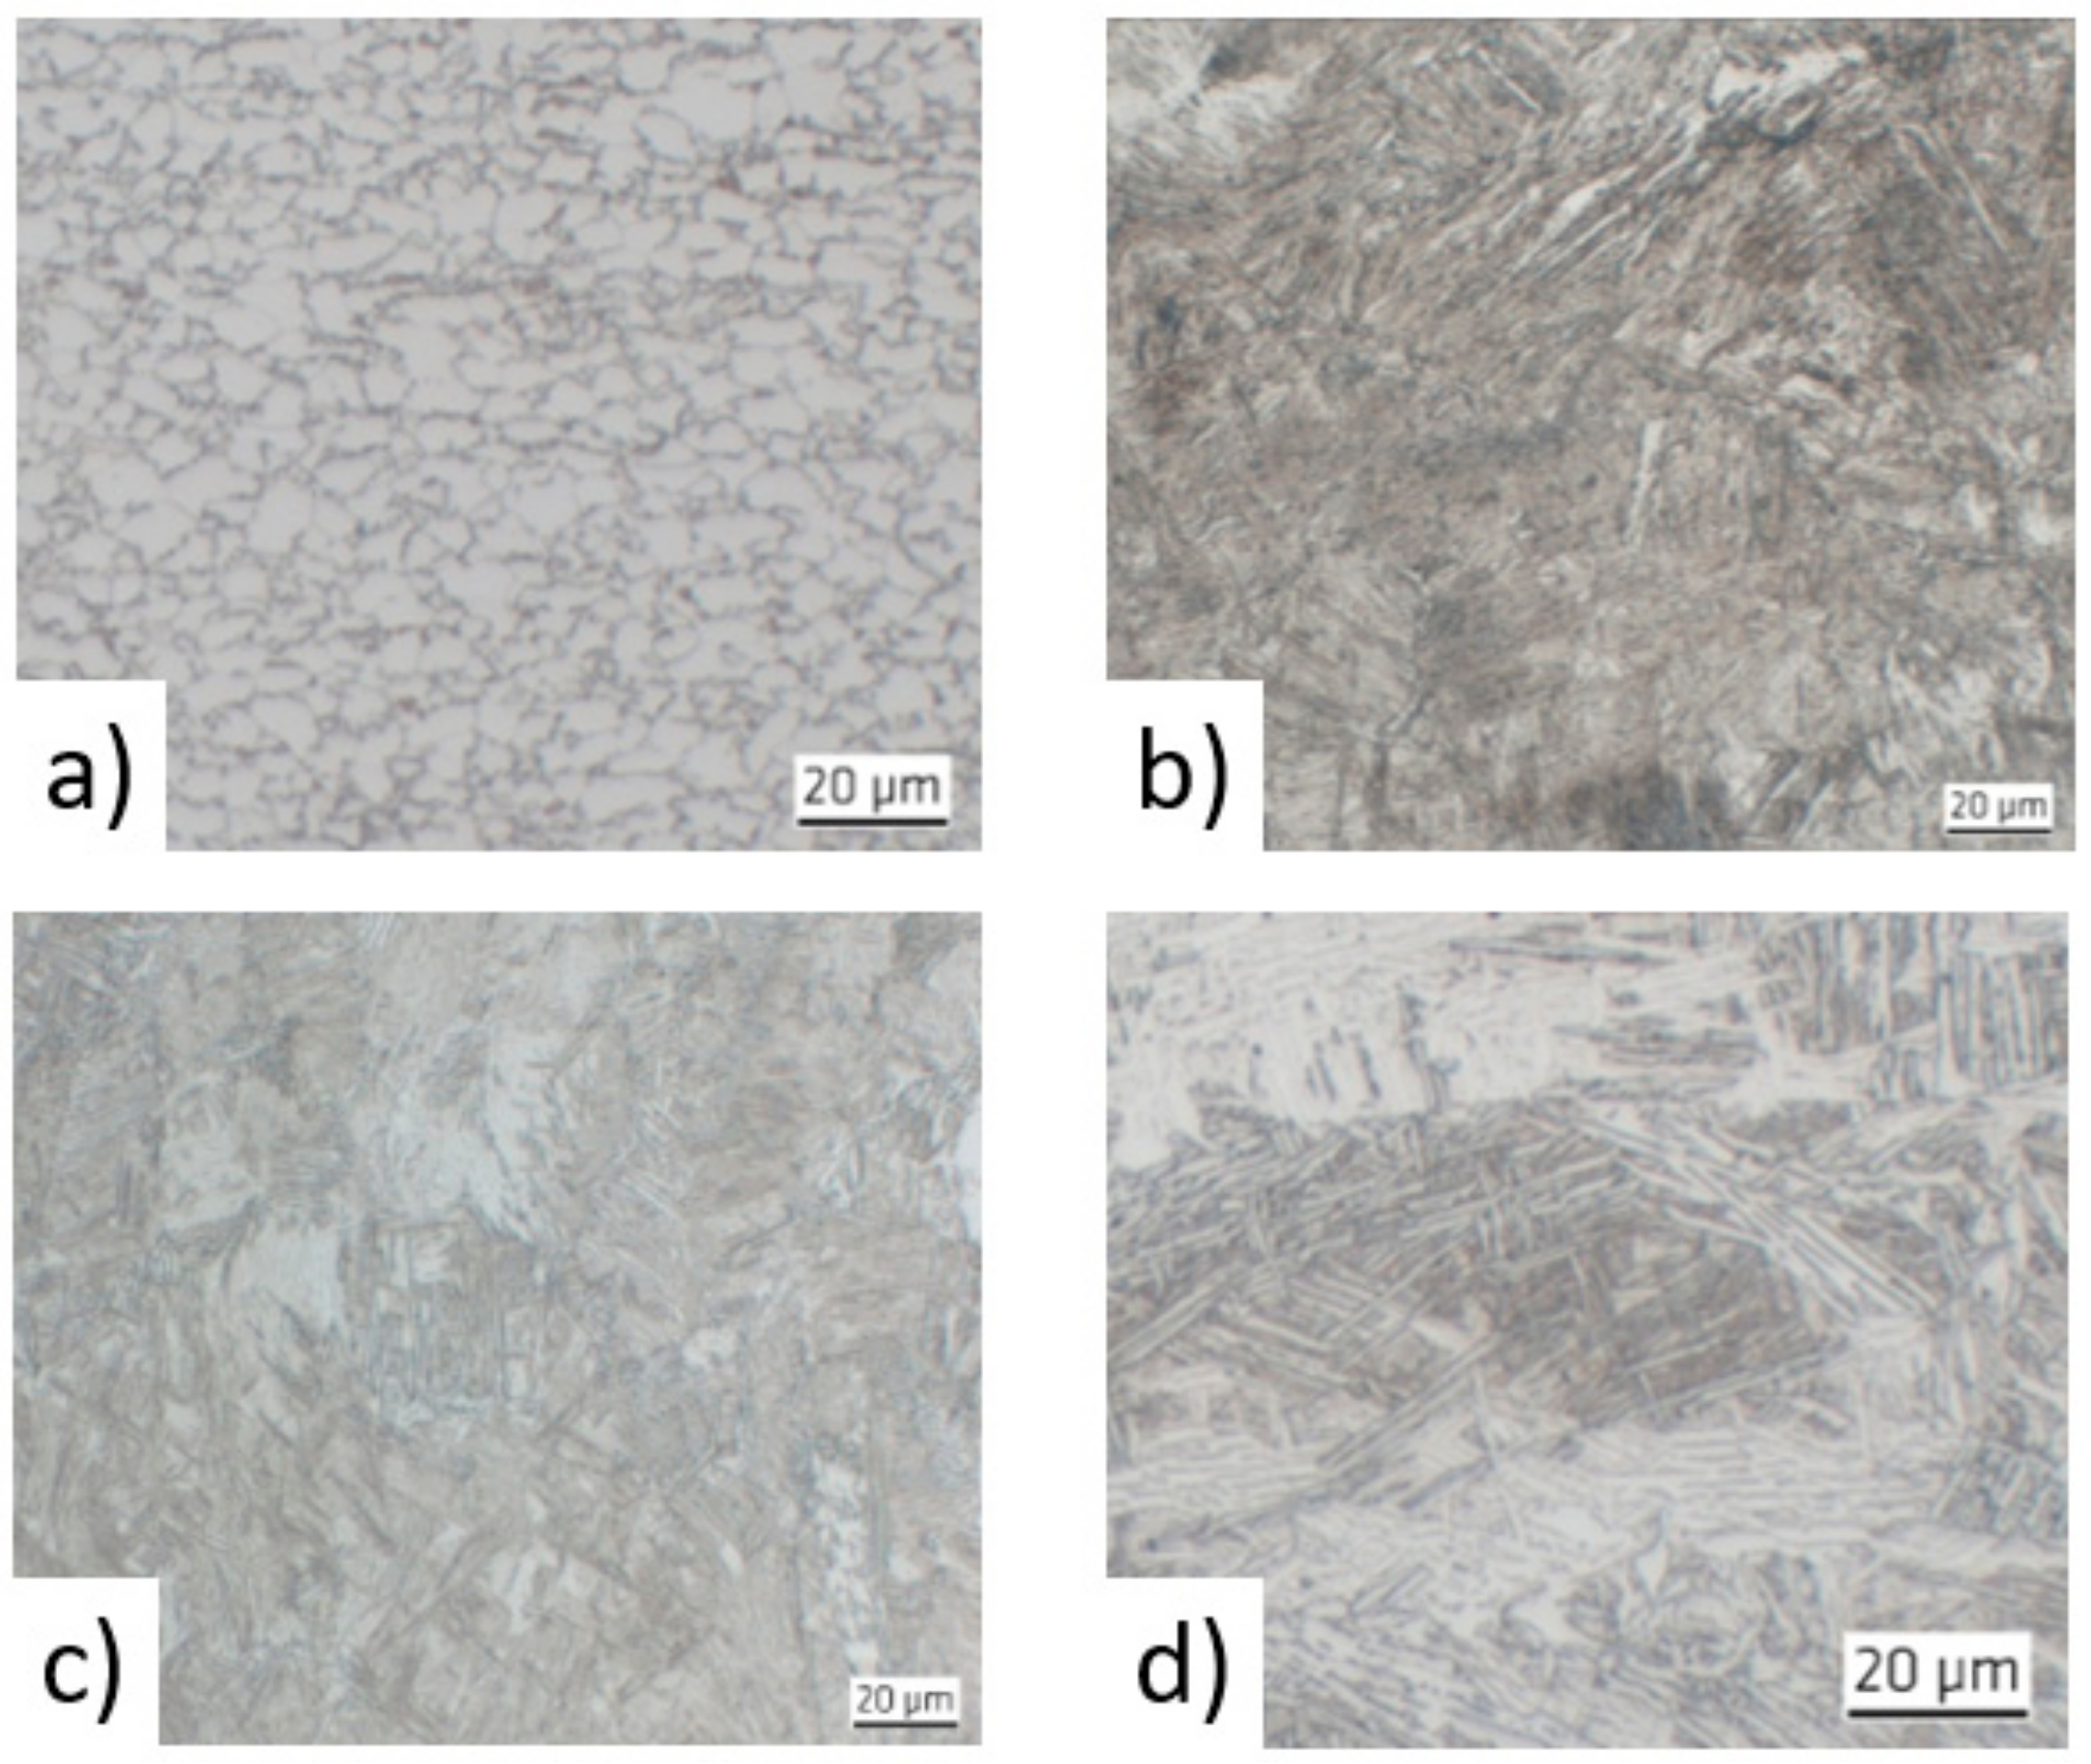
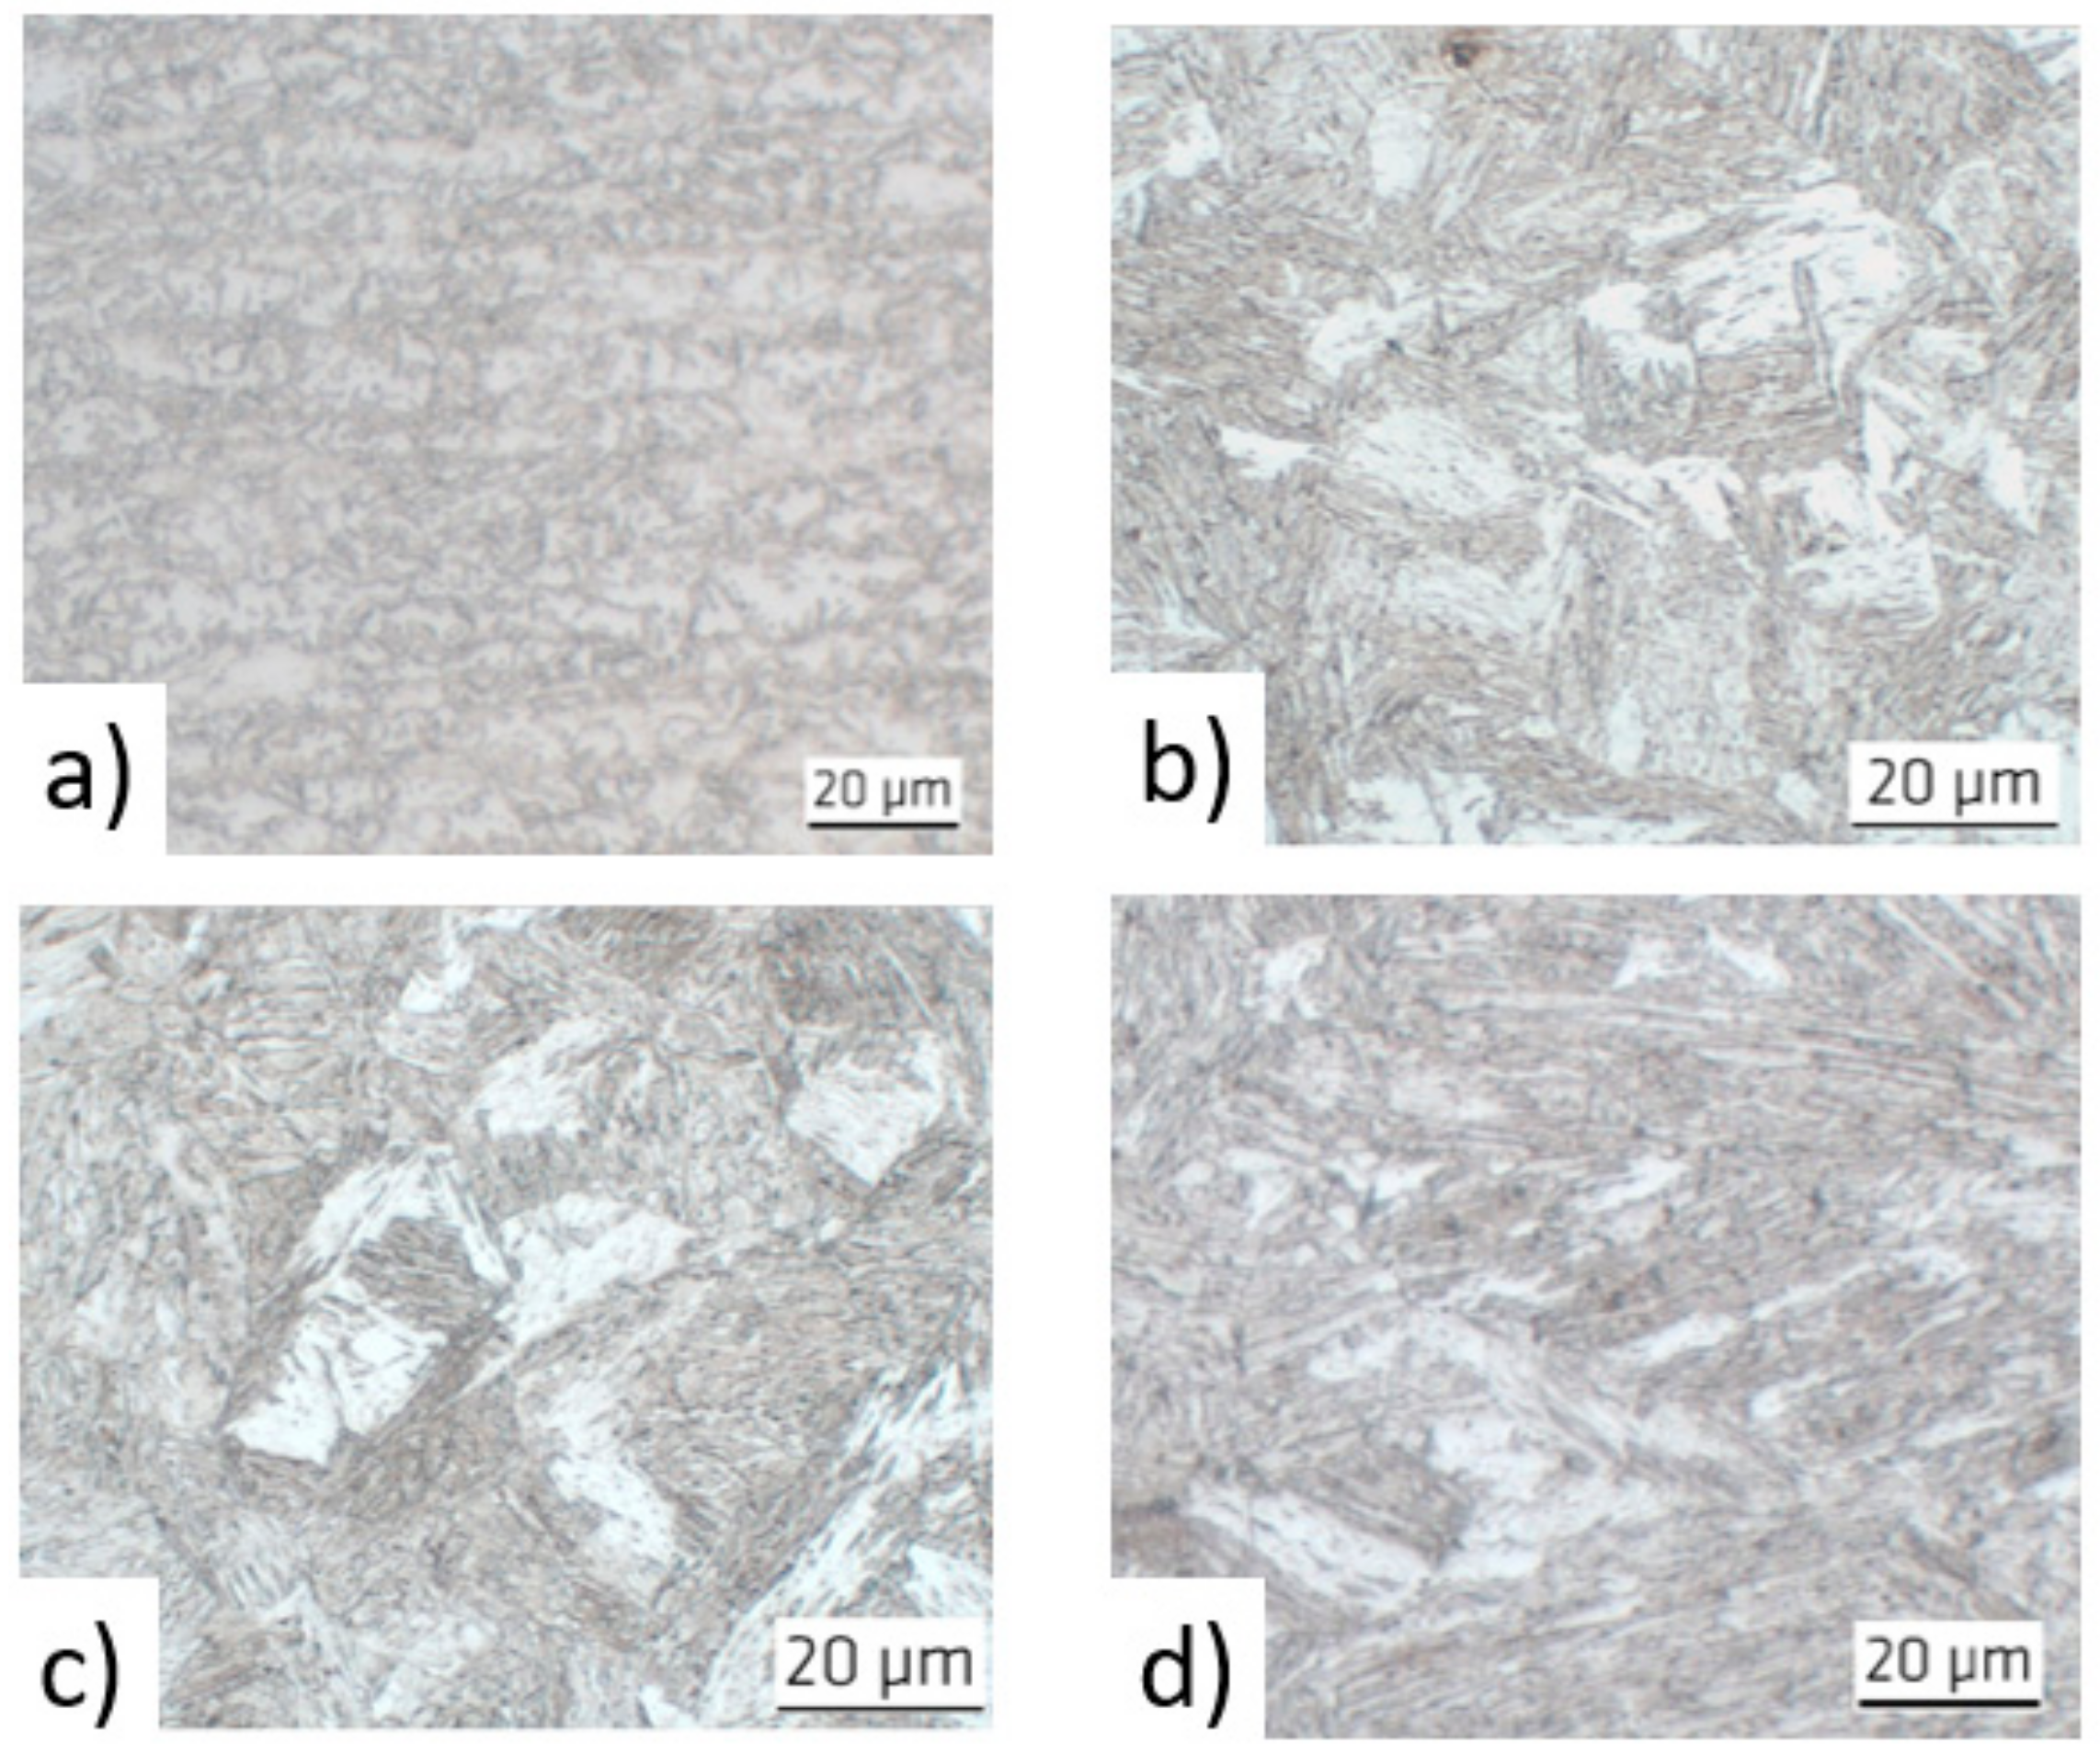
4.1. Metallographic Analysis
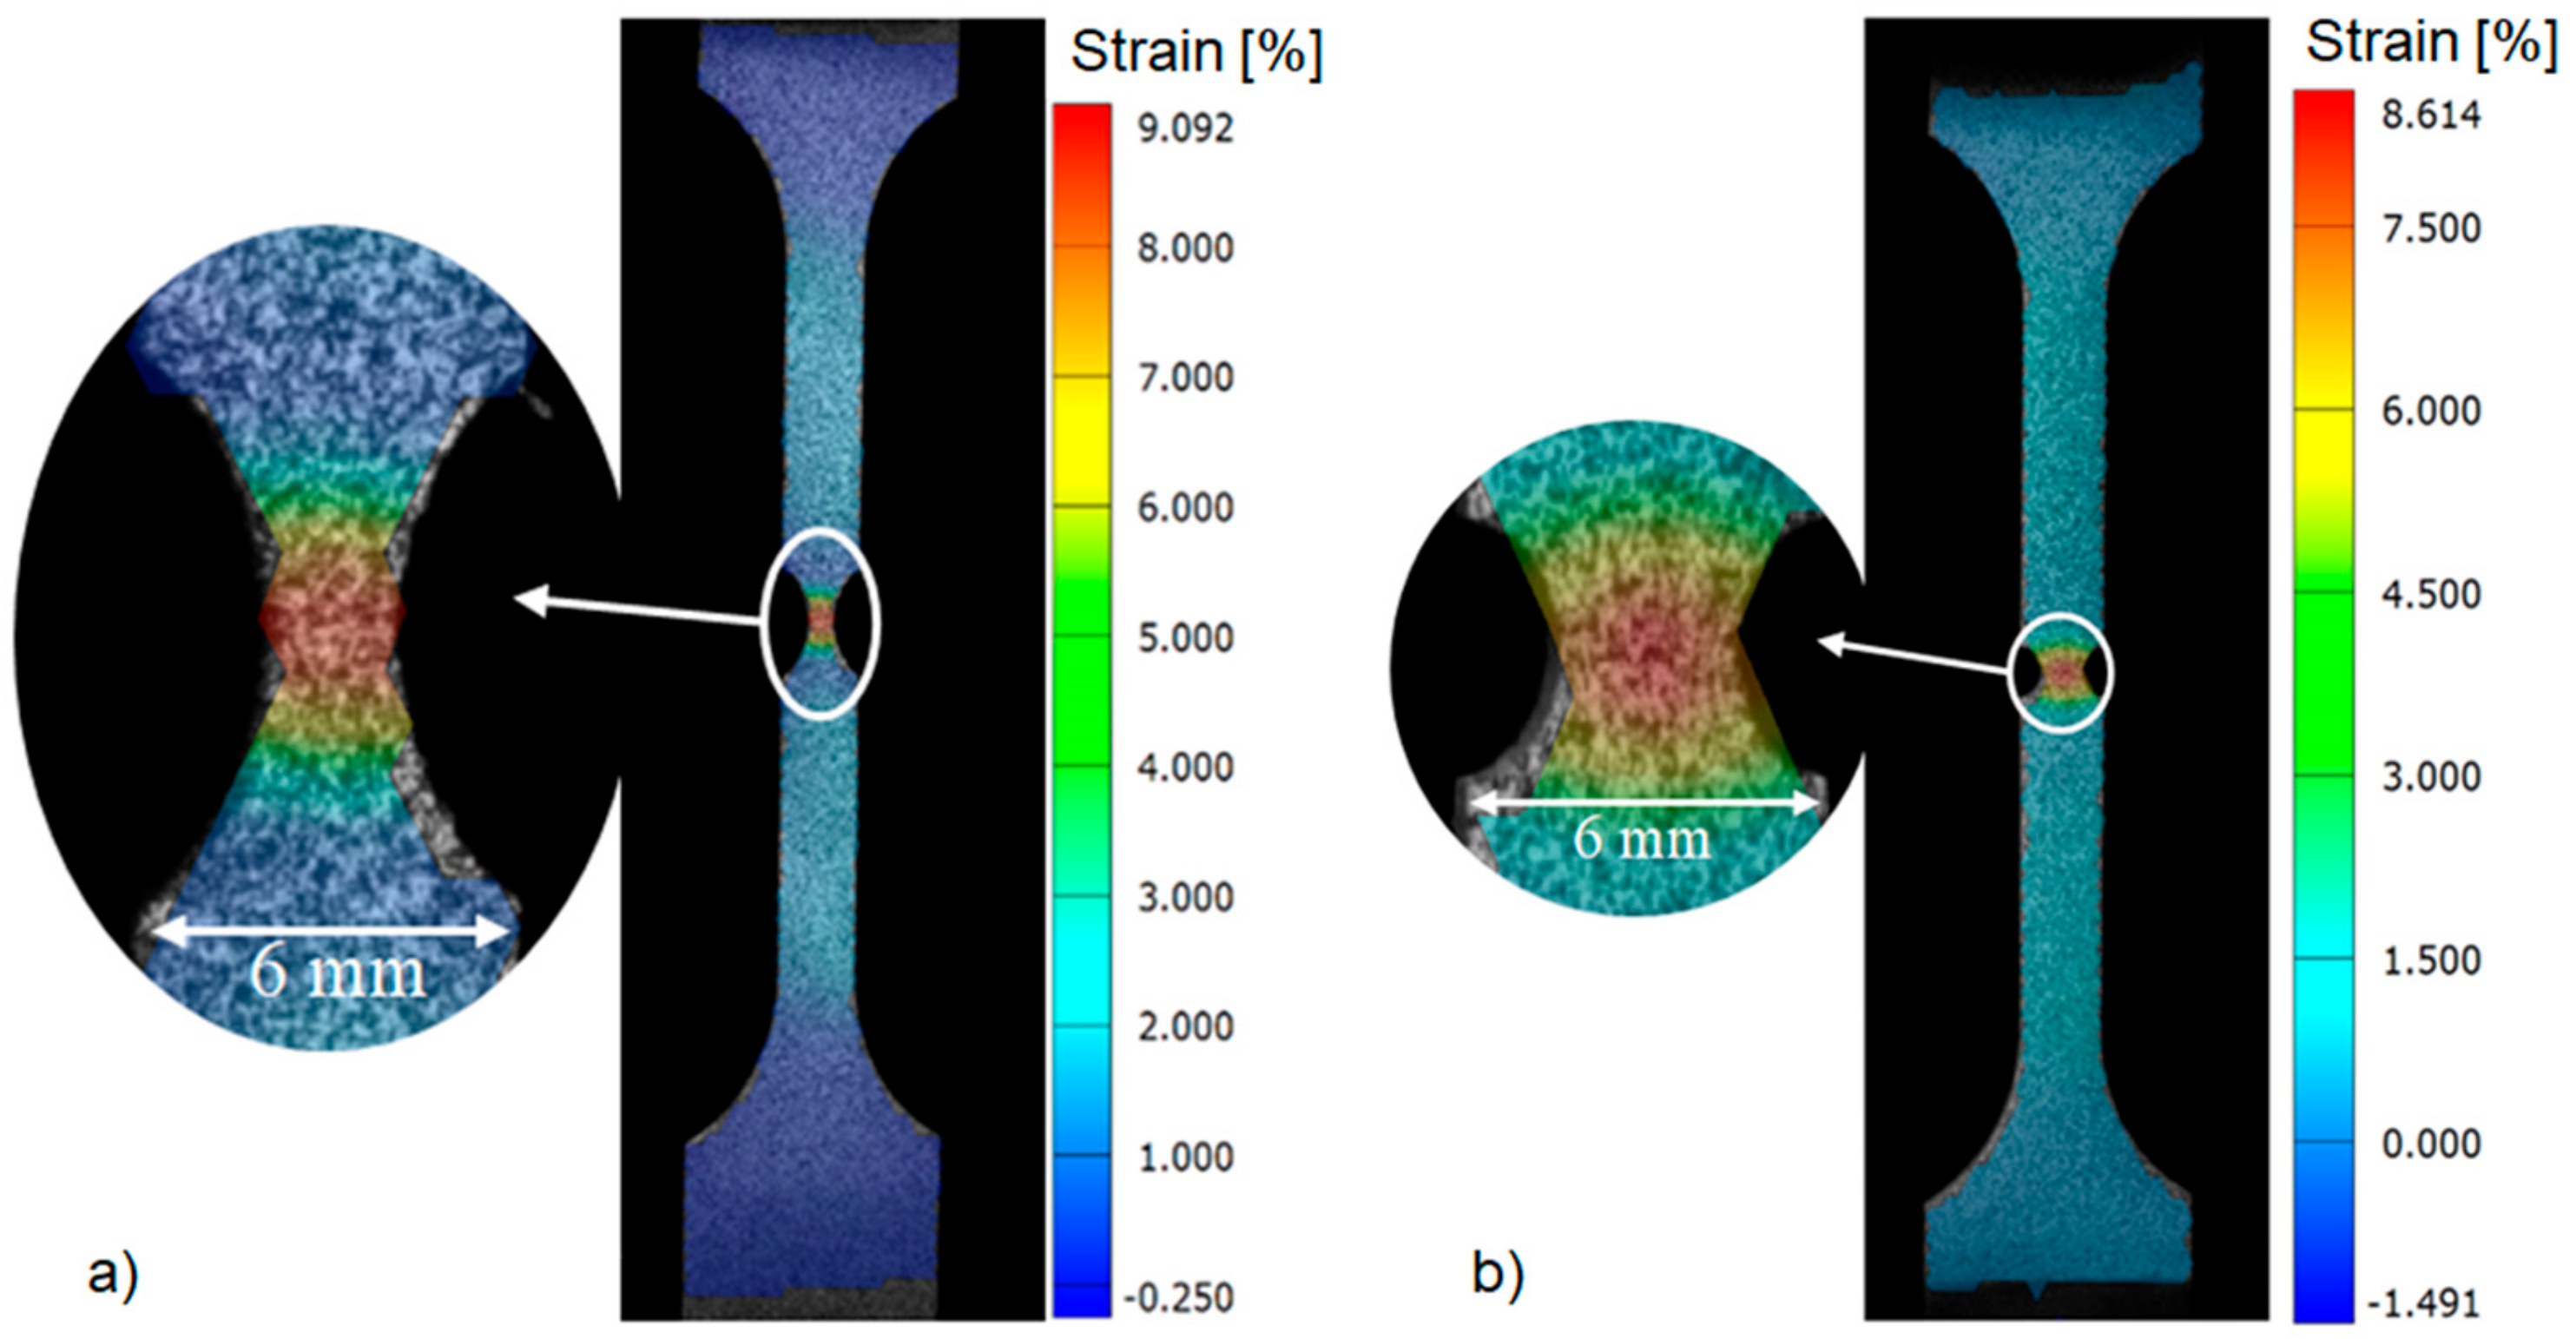
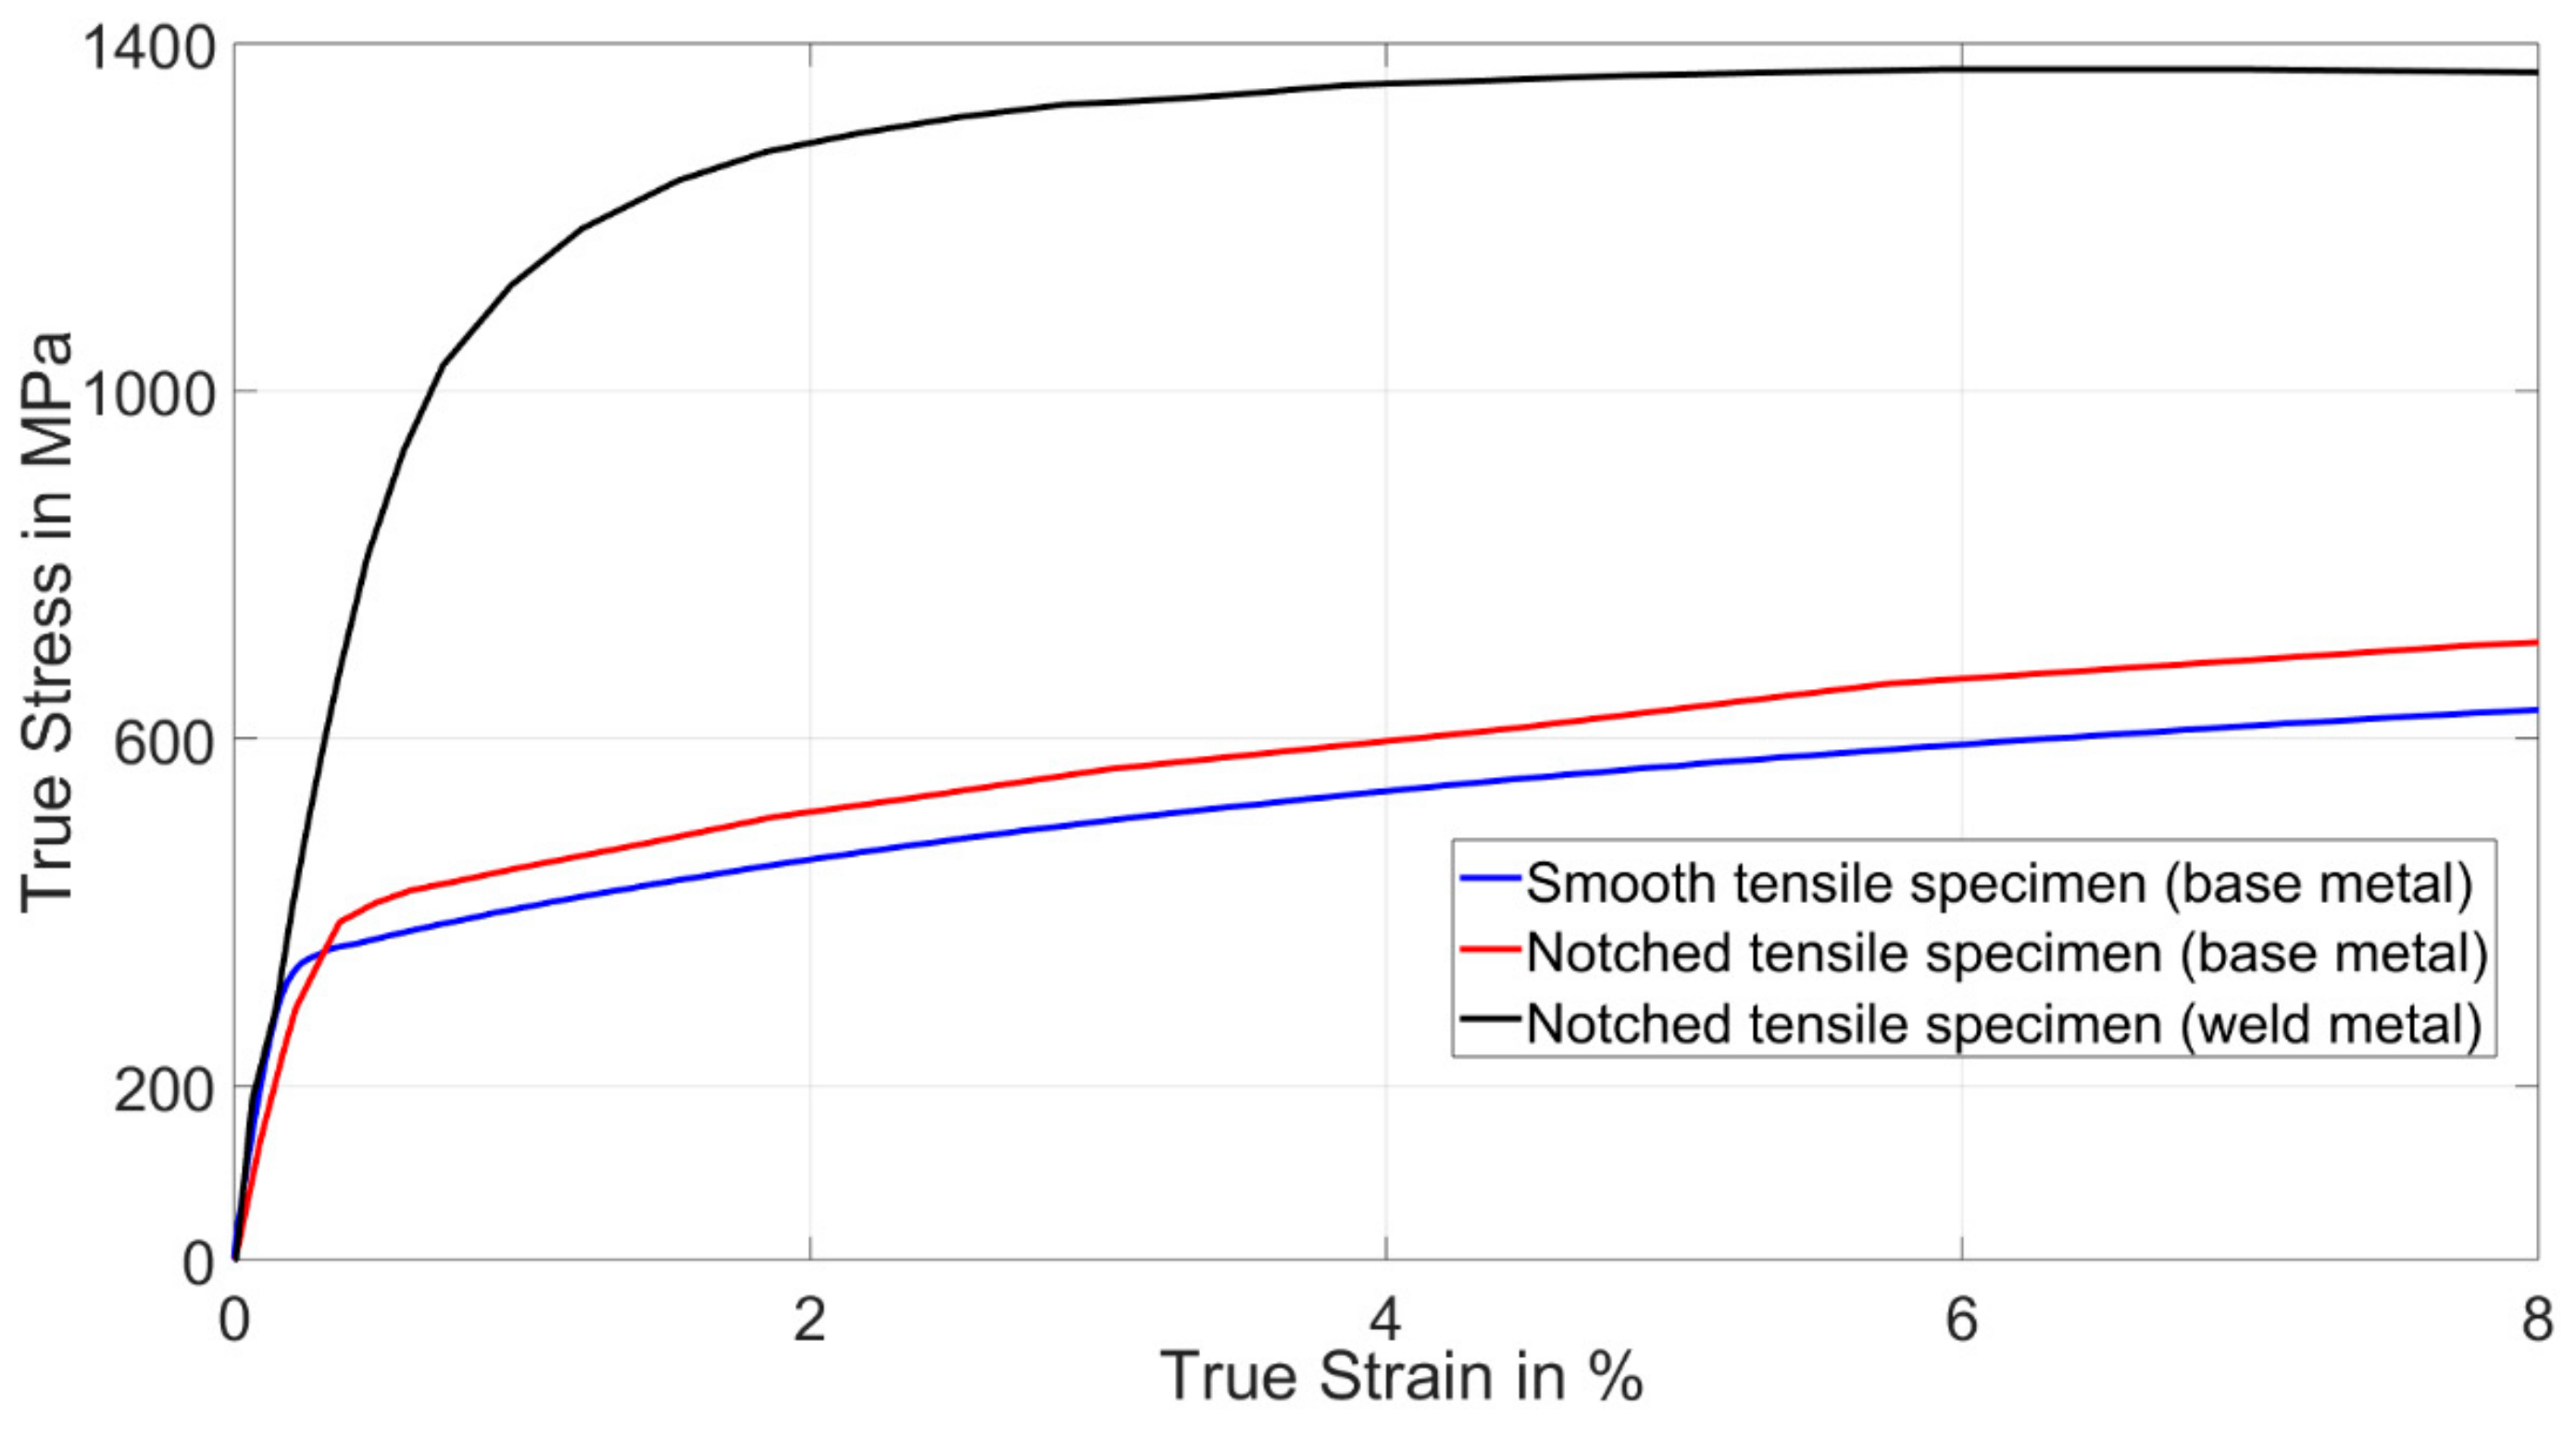
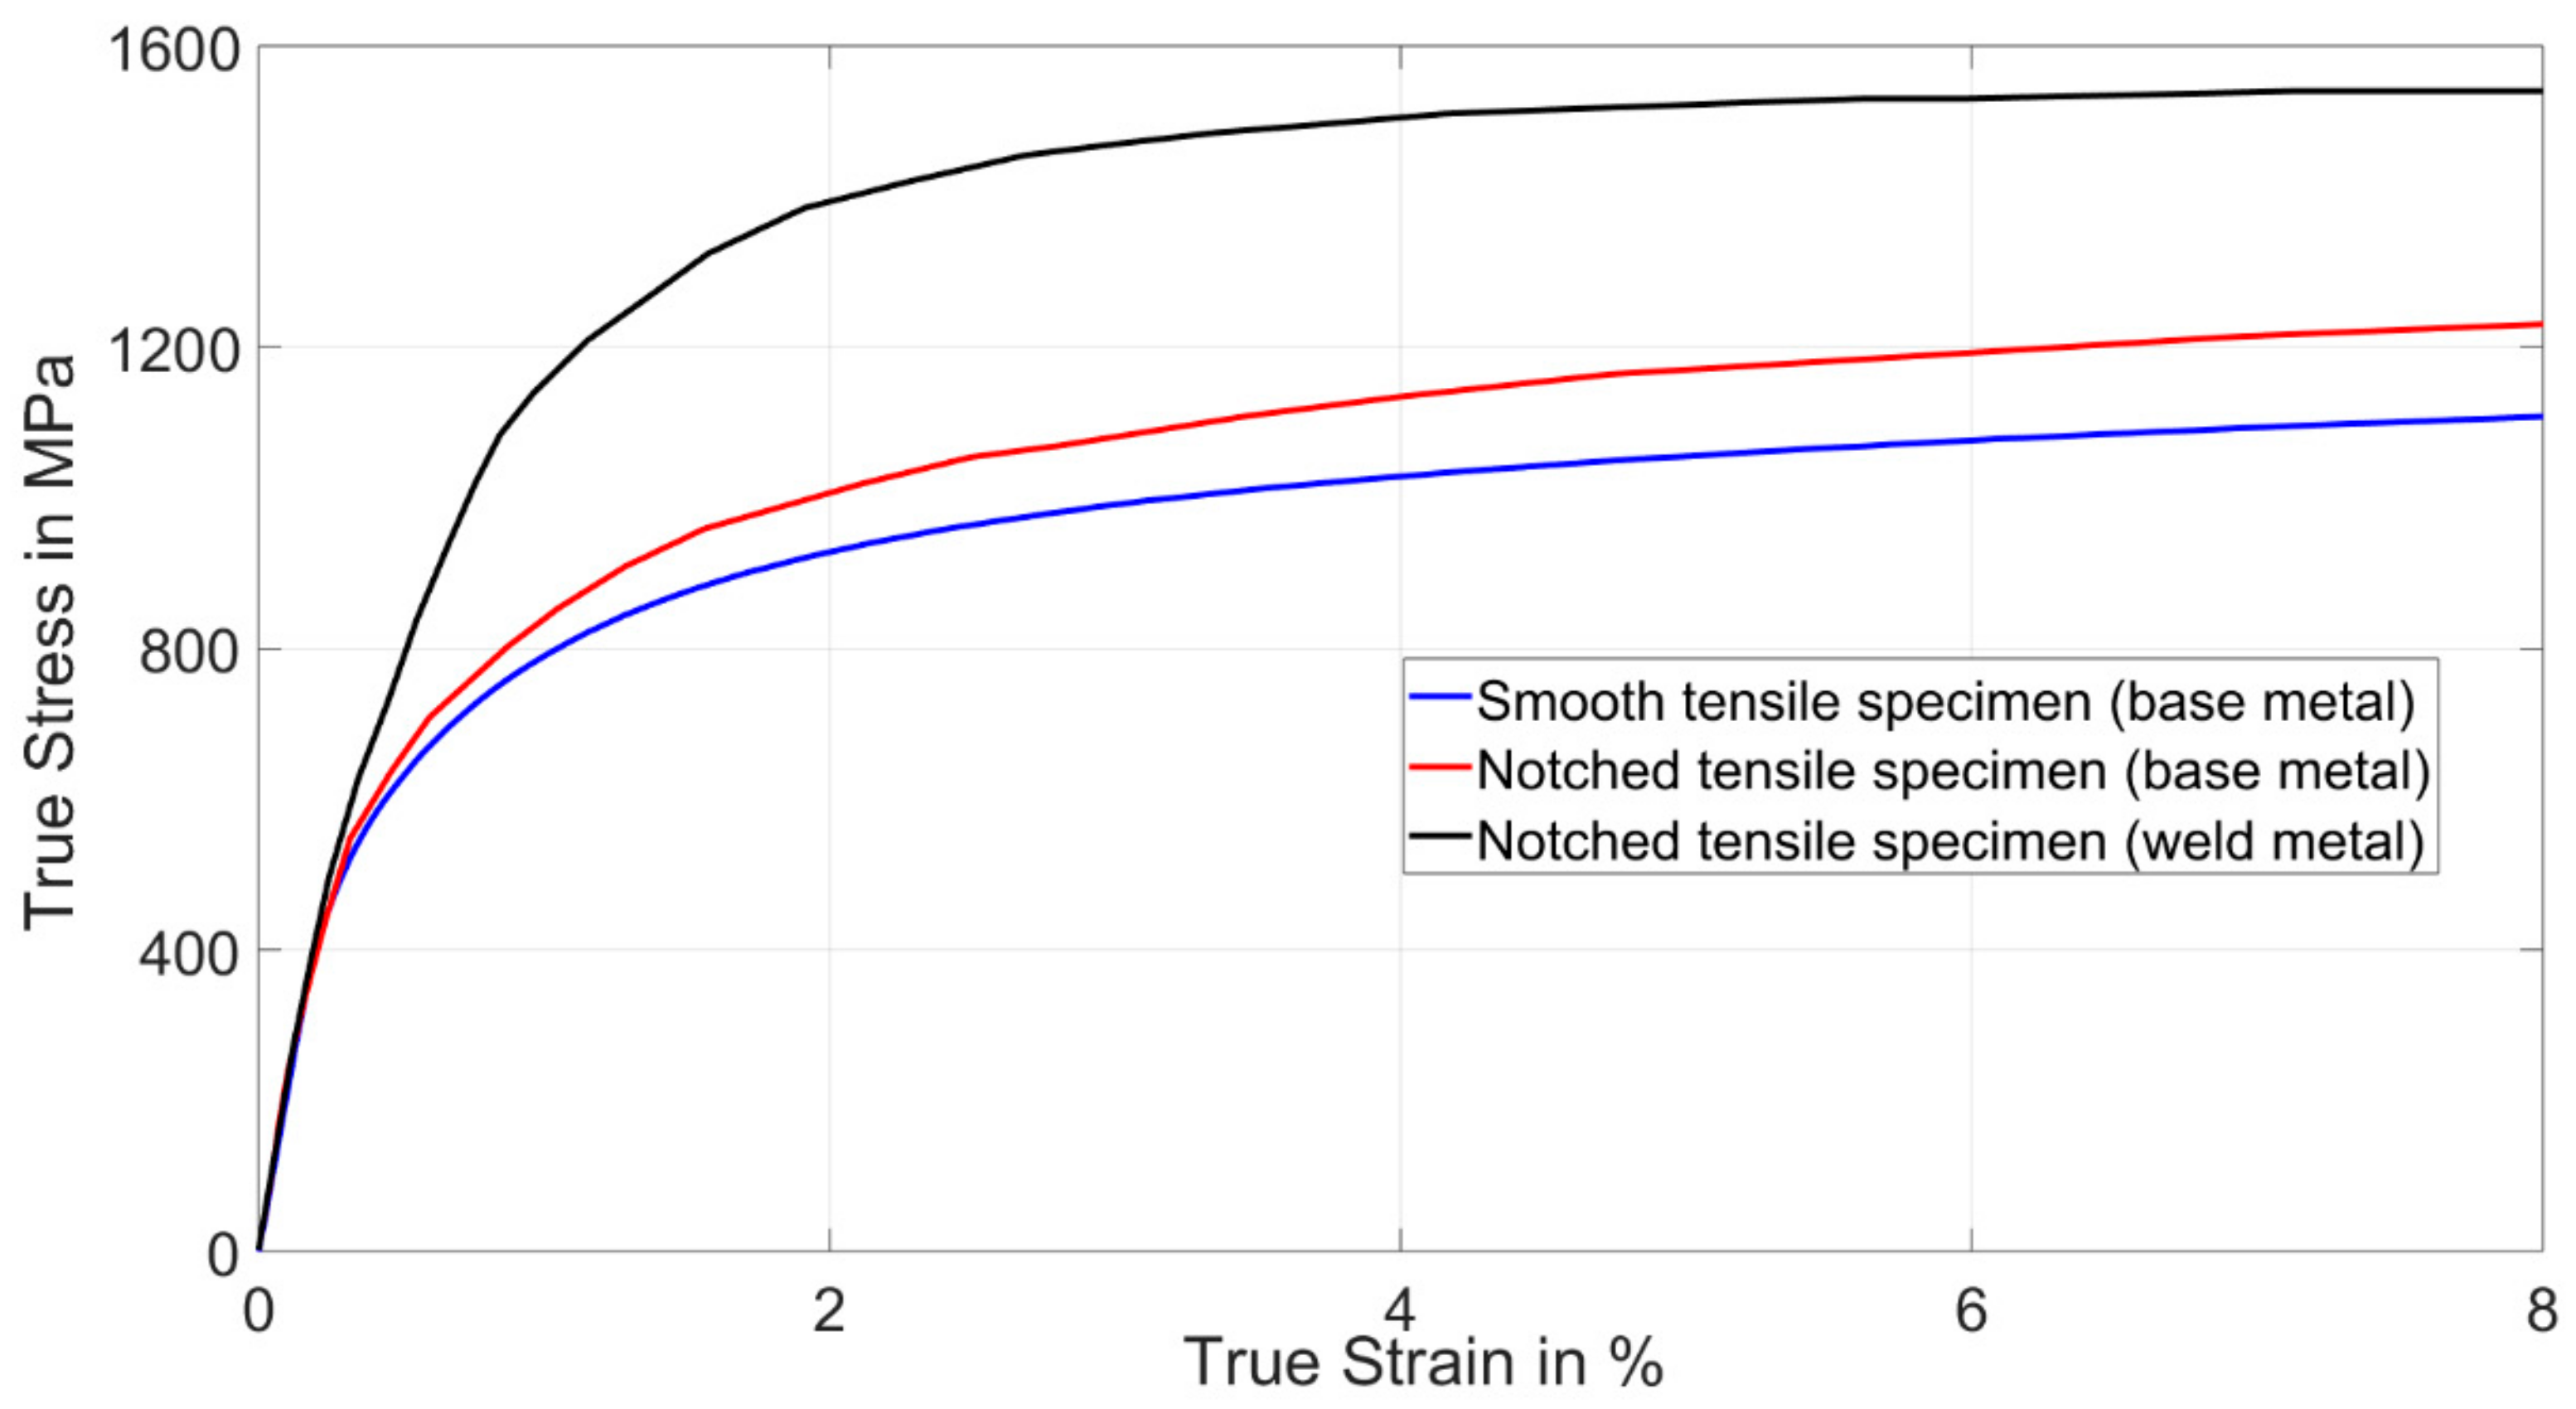
Investigations have shown that in the weld metal of DP steels, a martensitic microstructure is formed when the cooling time t8/5 (i.e., the time it takes for the weld seam and HAZ to cool from 800 °C to 500 °C) is less than three seconds [22]. Measurements on the welded plates showed a cooling time t8/5 of 0.3 s for RSW and 0.4 s for LBW. It is therefore assumed that a martensitic microstructure is present in both weldments. Figure 5 and Figure 6 show the microstructure of the weldment of LBW and RSW DP600 and DP1000. The welding zones of DP600 and DP1000 show a martensitic microstructure with columnar martensite grains. The base metal of DP600 and DP1000 typically shows a mixture of ferrite and martensite microstructures, which was completely converted into a martensite structure after welding.
In addition, the macrostructure of the welded joints of RSW and LBW of DP600 and DP1000 are shown in Figure 7 and Figure 8 to gain a better overview about the size of the weld metal and HAZ.
In the next step, a Vickers hardness test for both welding methods and DP steels was performed according to [23], and is shown in Figure 9, Figure 10 and Figure 11. Figure 9 and Figure 10 show the mapping of hardness value (HV0.1) for DP600 and DP1000. Each indentation was automatically performed on the samples with 0.1 mm distance from the last one in each direction (X and Y) in order to measure the Vickers hardness value (HV0.1) based on [23]. The total number of indentations in the entire specimen is mentioned in the caption of Figure 9 and Figure 10 for each sample. Then, the value of each indentation is mapped to a color. Figure 11 compares the hardness values (HV1) for different welding methods performed on DP600 and DP1000. It can be observed that the hardness value of the weld seams is above 400 HV1, which is related to the martensite phase [19].

4.2. Tensile Test

Quasi-static tensile tests were carried out on the smooth and notched tensile specimens of the base and weld material. The strain was measured locally with the DIC systems, as described in Section 2.4. The local strain distributions of the notched and welded specimens are presented in Figure 12.
Figure 13 and Figure 14 show the results of the tensile tests on smooth, notched, and notched-welded specimens for DP600 and DP1000, respectively. It can be seen that the yield and tensile strengths of the notched specimens are higher than the strength of the smooth specimens of the base material due to the additional notch stresses.
Table 5 shows the mechanical properties of DP600 and DP1000 calculated by the DIC-system GOM Aramis 4m. For each material, three specimens were tested and the average results were calculated. It should be noted that the parameters in Table 5 are directly calculated by the Aramis system, and can only be compared to the parameters from the Voce nonlinear isotropic hardening model to a limited extent, since the latter’s parameters are calculated by inverse simulation, as mentioned in Section 3.1. Analyzing the results of the notched and notched-welded specimens, it was shown that RSW leads to a reduced total elongation at the maximum force for DP600 and DP1000. It can be concluded that the microstructural changes reduce ductility and increase the strength of the material. The yield and tensile strength are enhanced by 137% and 87% in the case of DP600 and by 44% and by 28% for DP1000 after RSW.

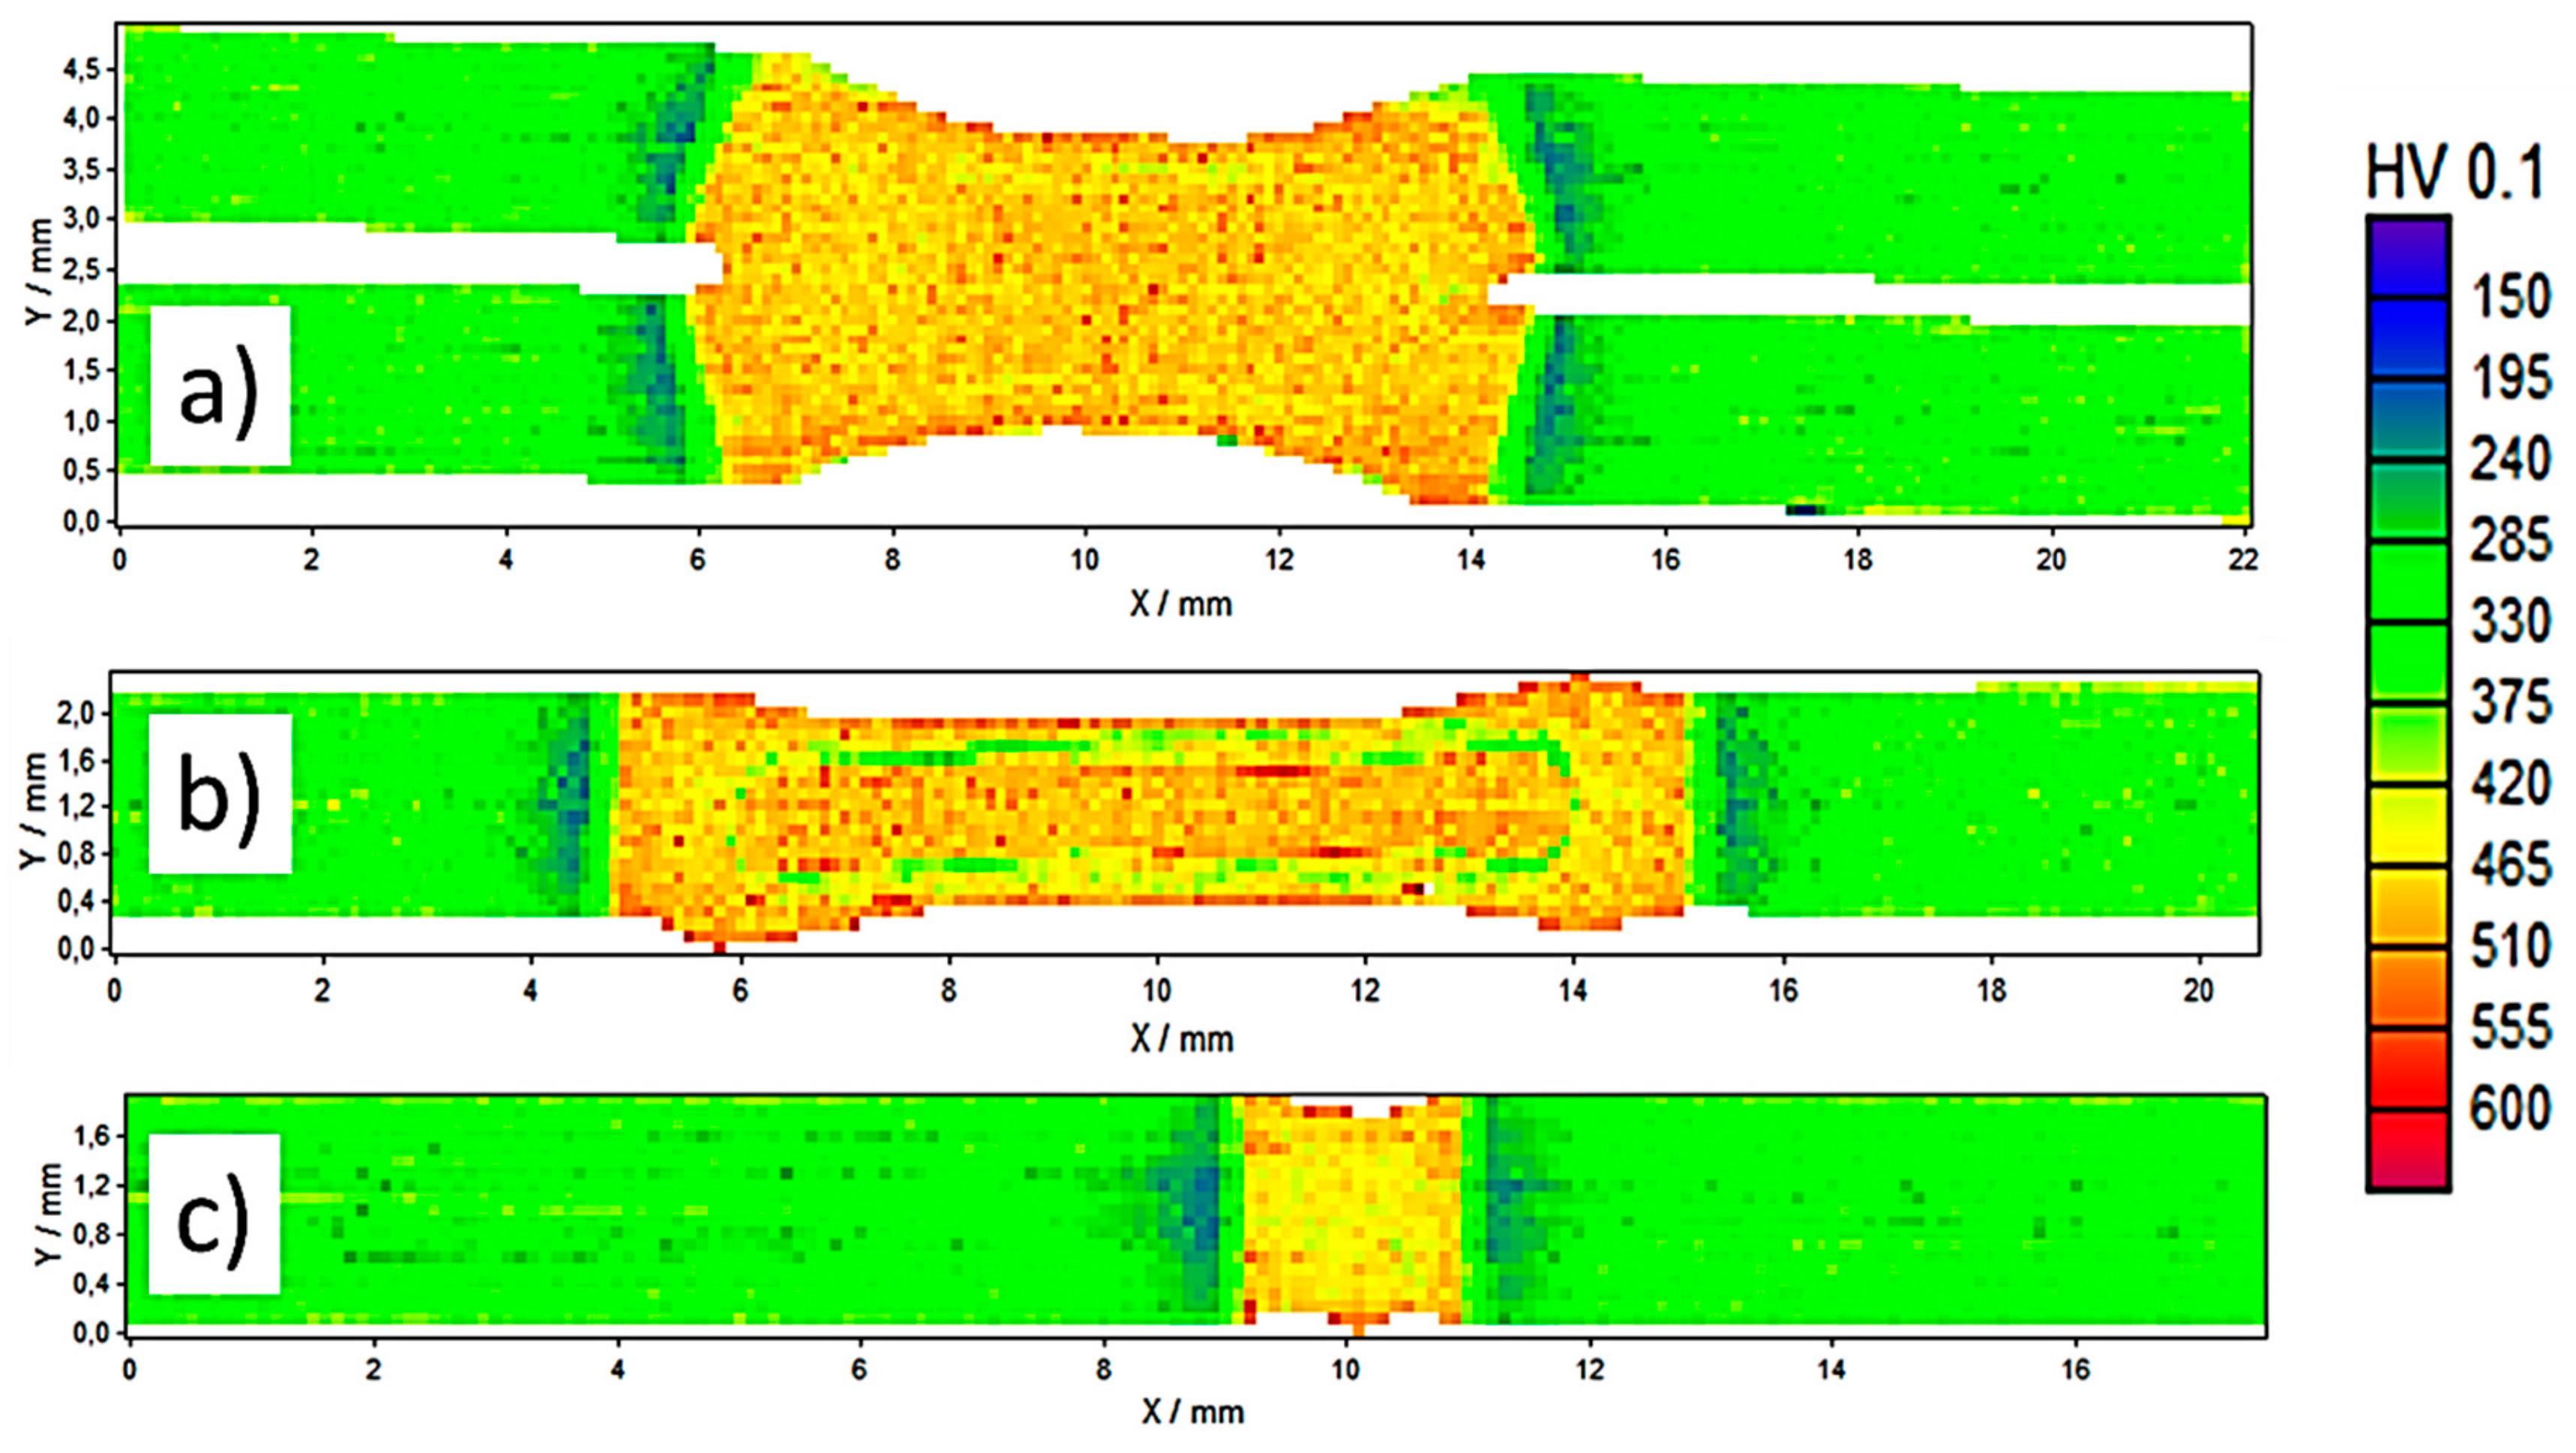
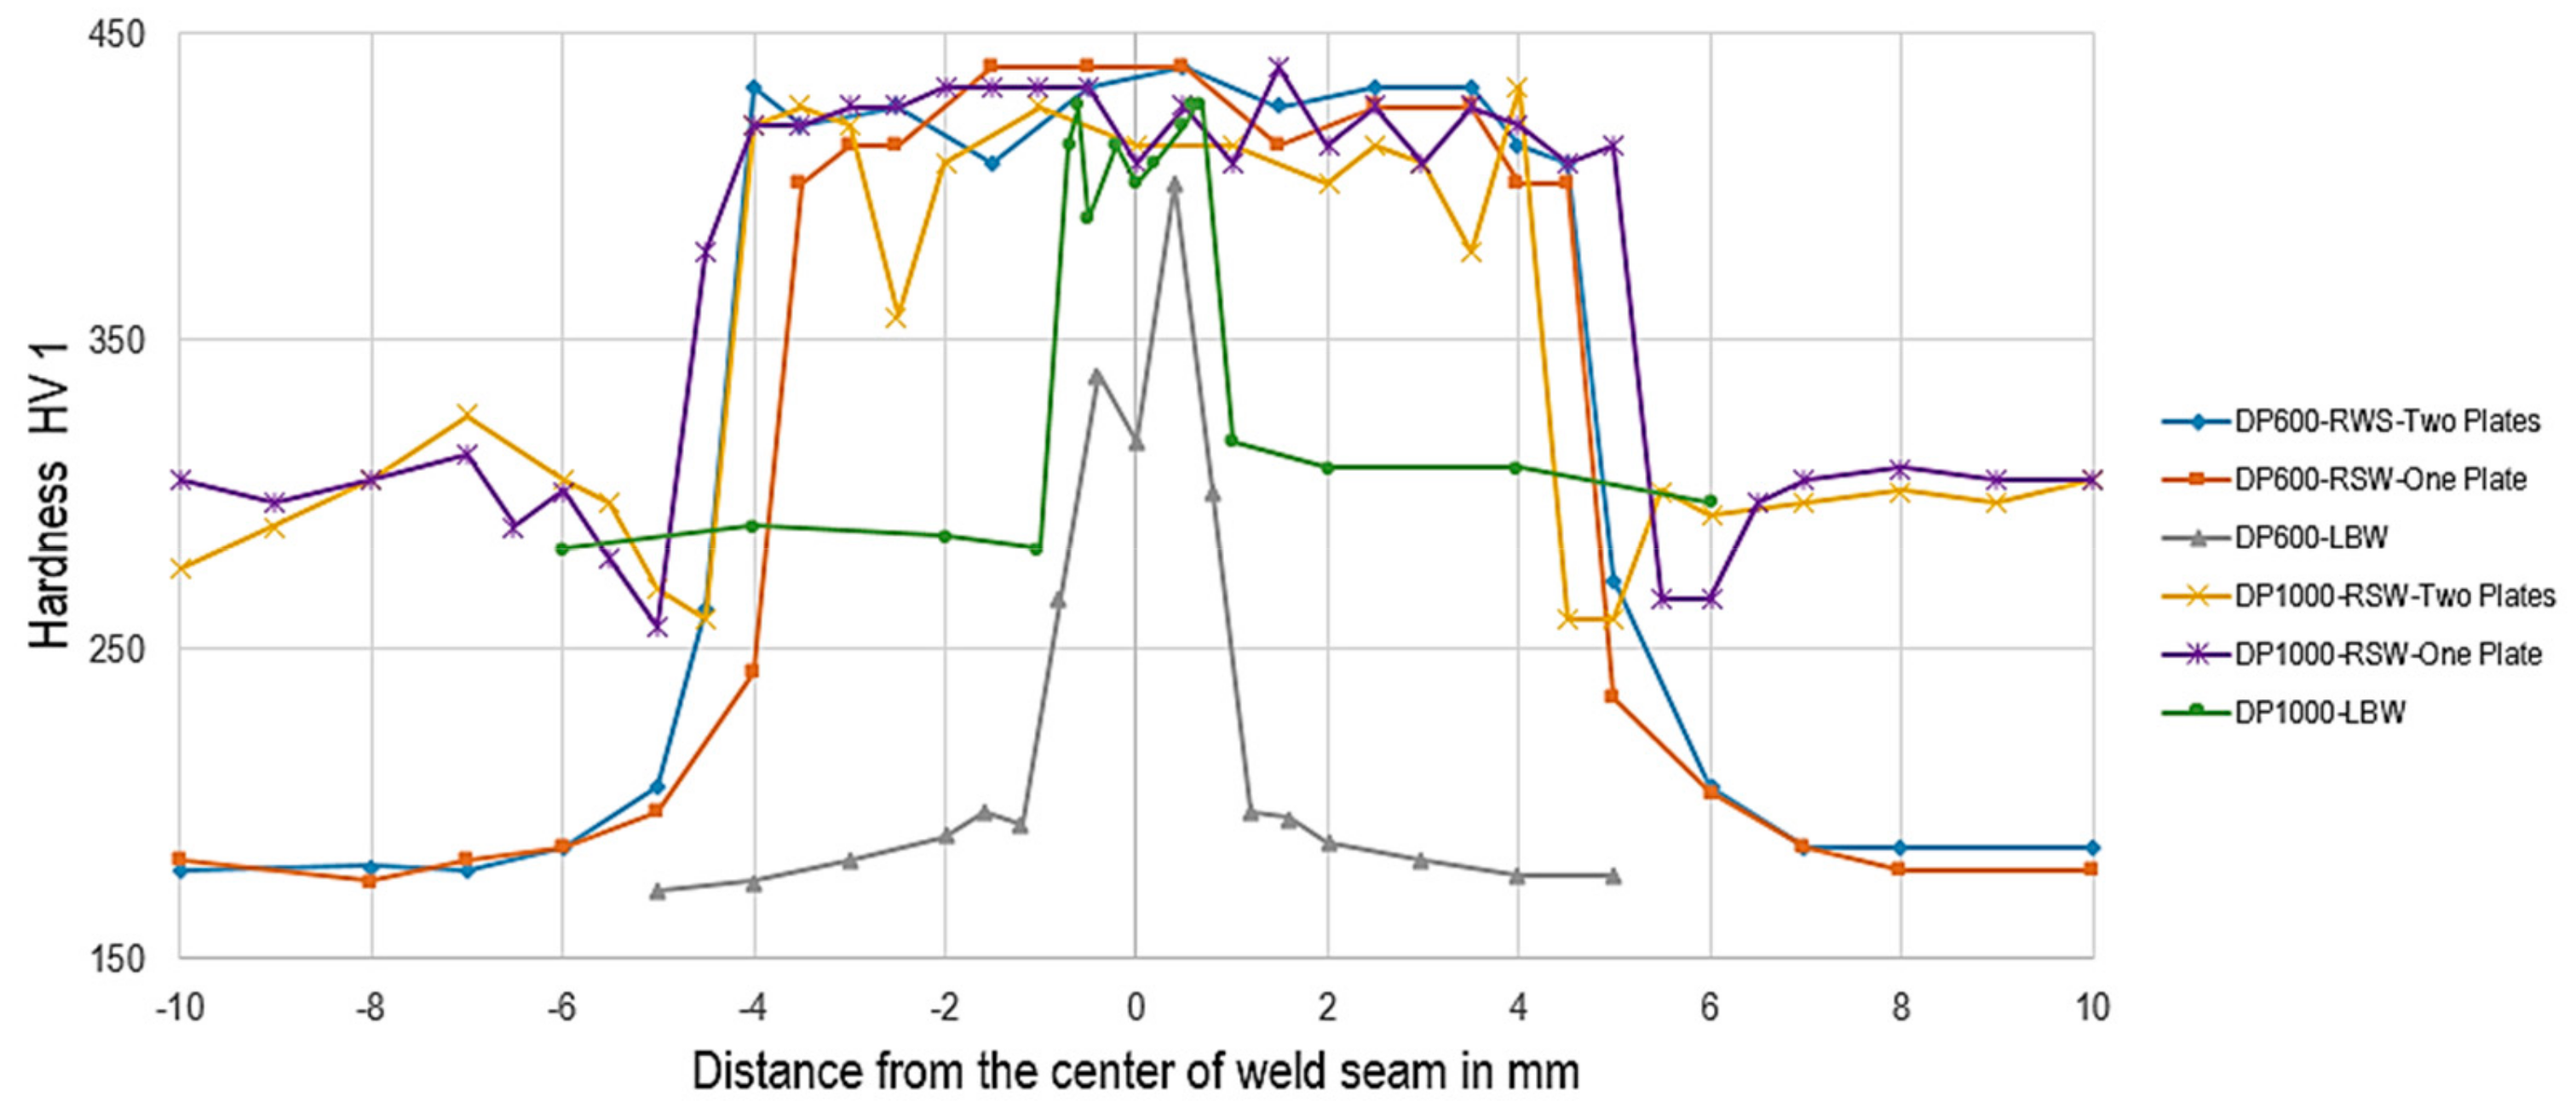
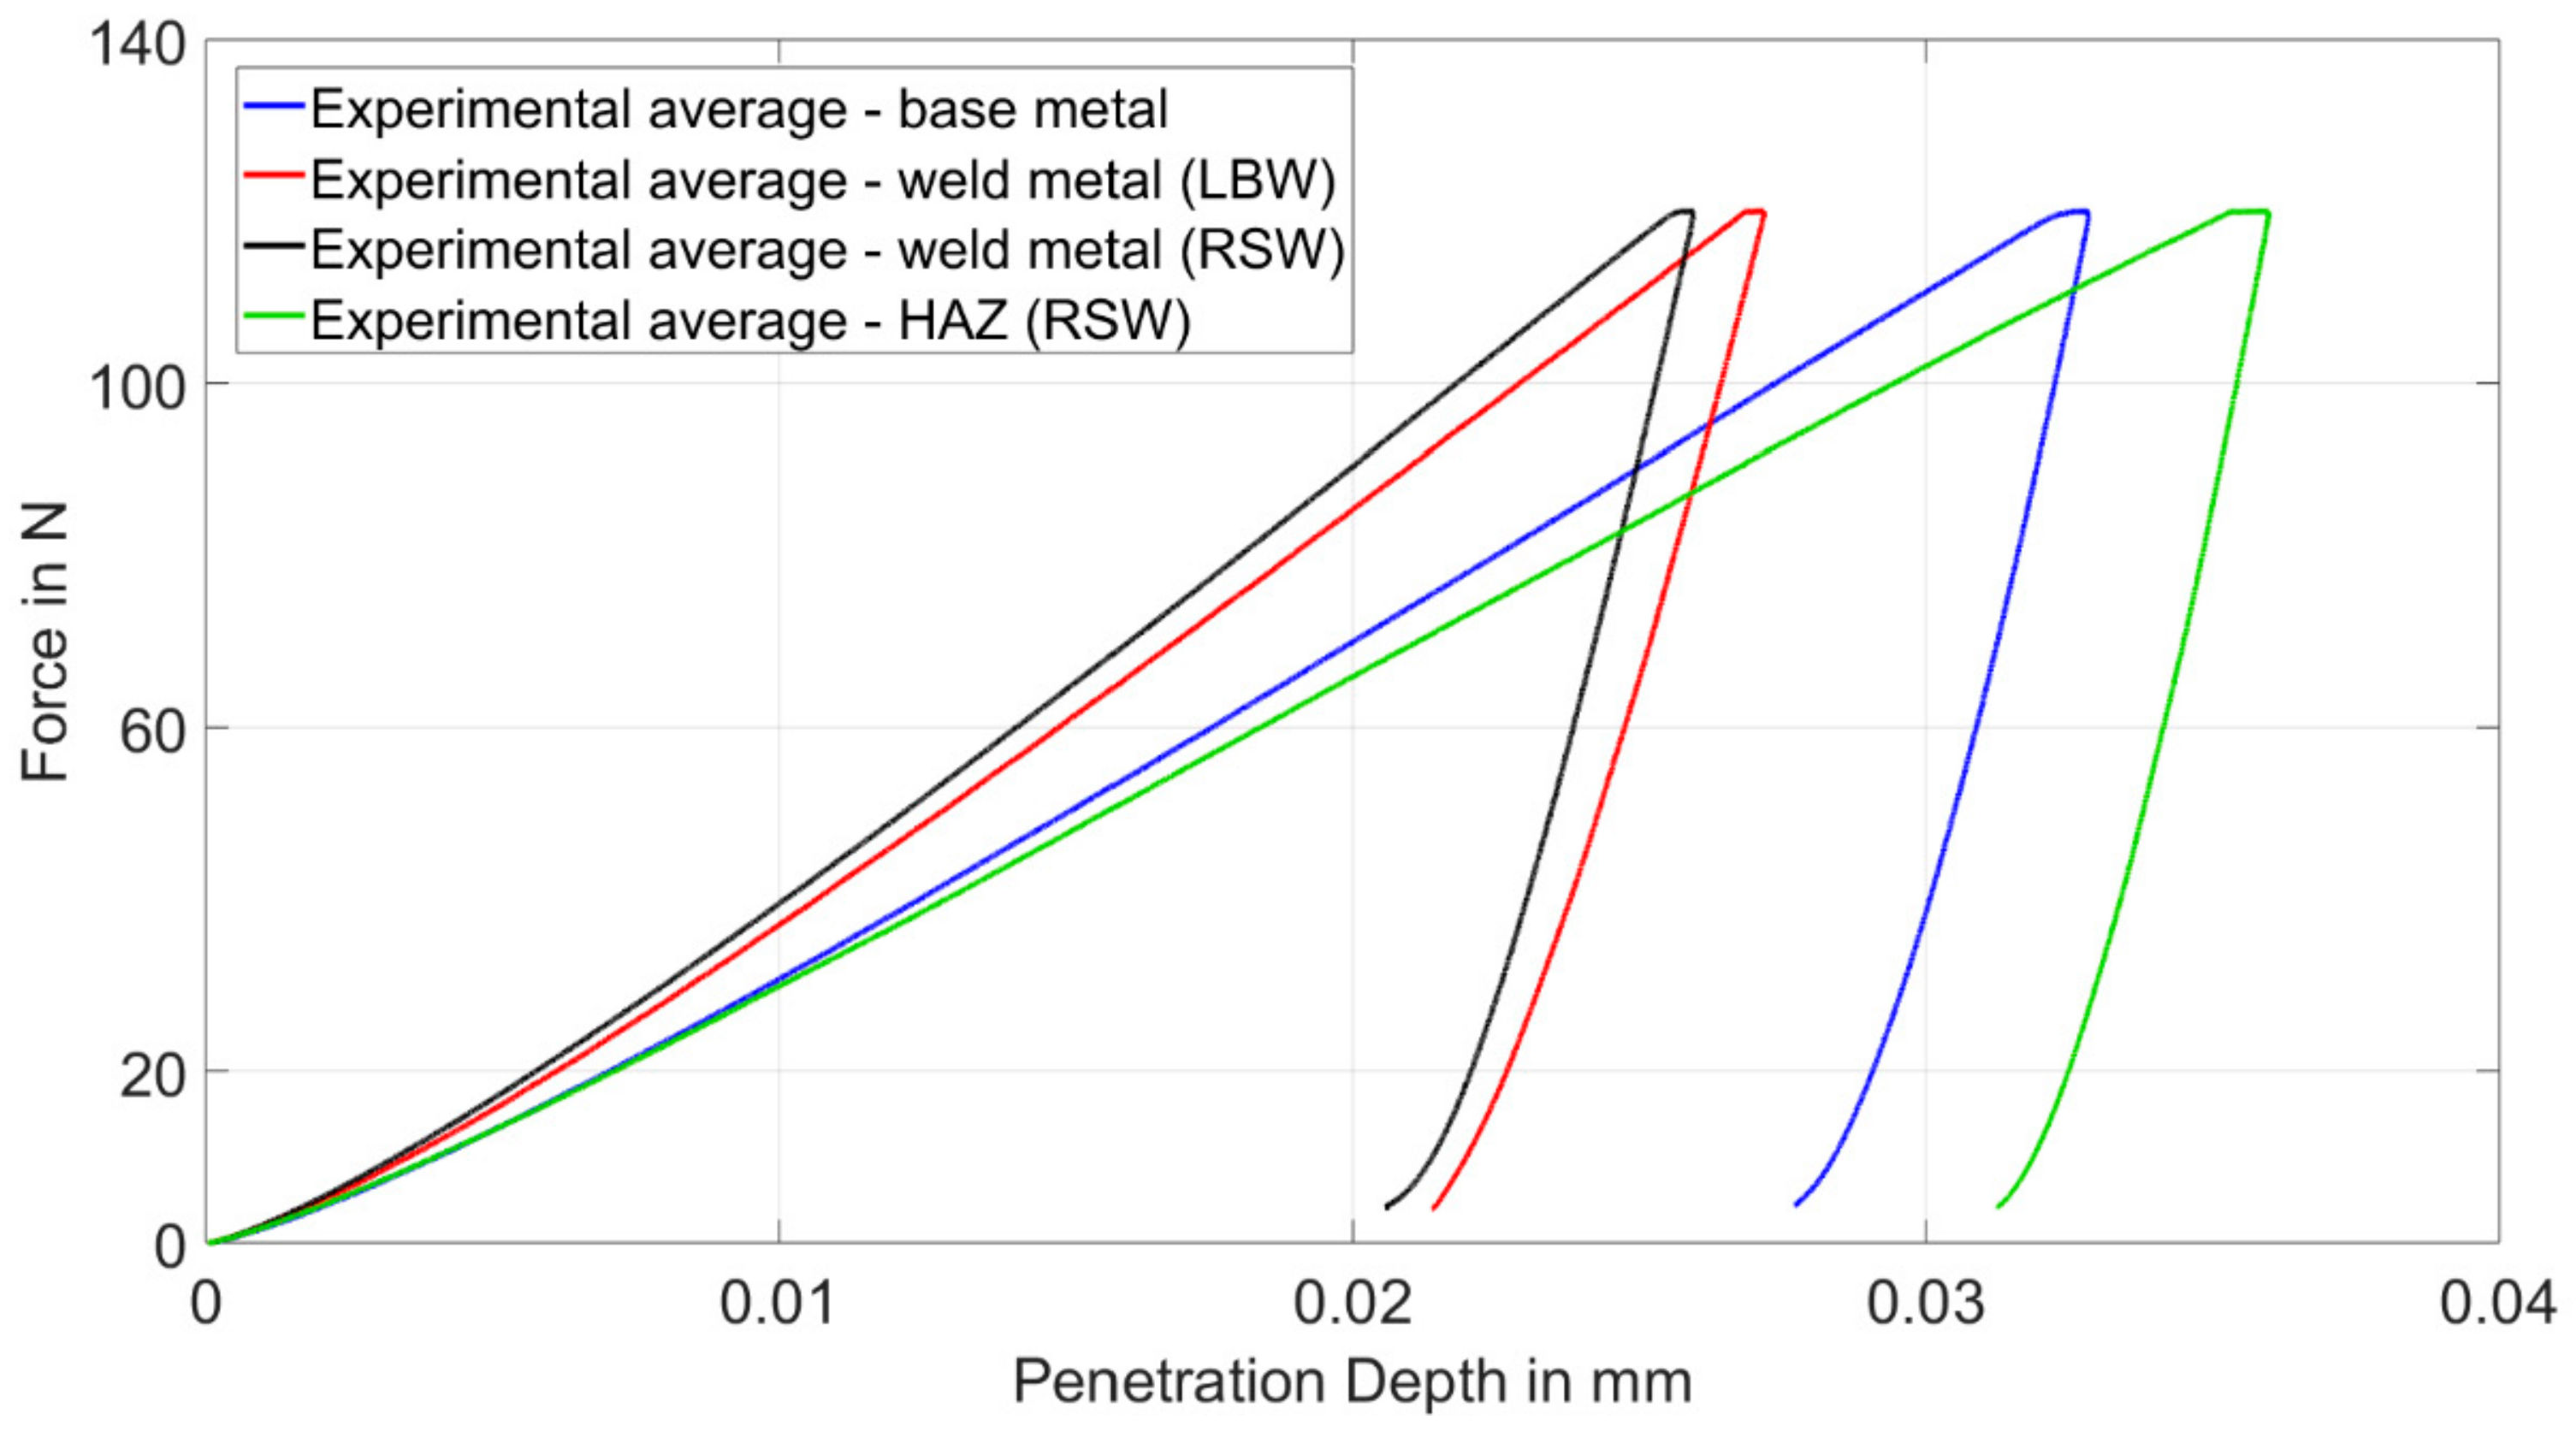
4.3. Indentation Test

Indentation tests were performed on all specimens of DP600 and DP1000. Figure 15 shows the results of the indentation tests for DP600. For each material, three specimens were tested and the average results were calculated.
The penetration depths of the weld metals are smaller than those of the HAZ and the base metal. This is due to the higher hardness in the weld metal. Here, the microstructure consists almost exclusively of martensite, and has a hardness of more than 400 HV1 [19]. In the HAZ, the martensite content is lower, and thus, the reduced hardness leads to larger penetration depths. It is noticeable that RSW leads to lower penetration depths compared to LBW. Measurements have shown that the cooling time t8/5 for RSW is lower than for LBW, which leads to a higher hardness, and thus, to smaller penetration depths. Figure 16 shows the experimental results for DP1000. Once again, the weld metal has a lower penetration depth than the HAZ and the base metal. It is noticeable that the HAZ has a higher penetration depth than the base metal, and thus, is the weakest part of the weldment. Hardness tests on resistance spot-welded DP1000 specimens have shown (Figure 10 and Figure 11) that the hardness in the HAZ decreases compared to the base material, which leads to greater penetration depths [19].

4.4. Numerical Analysis

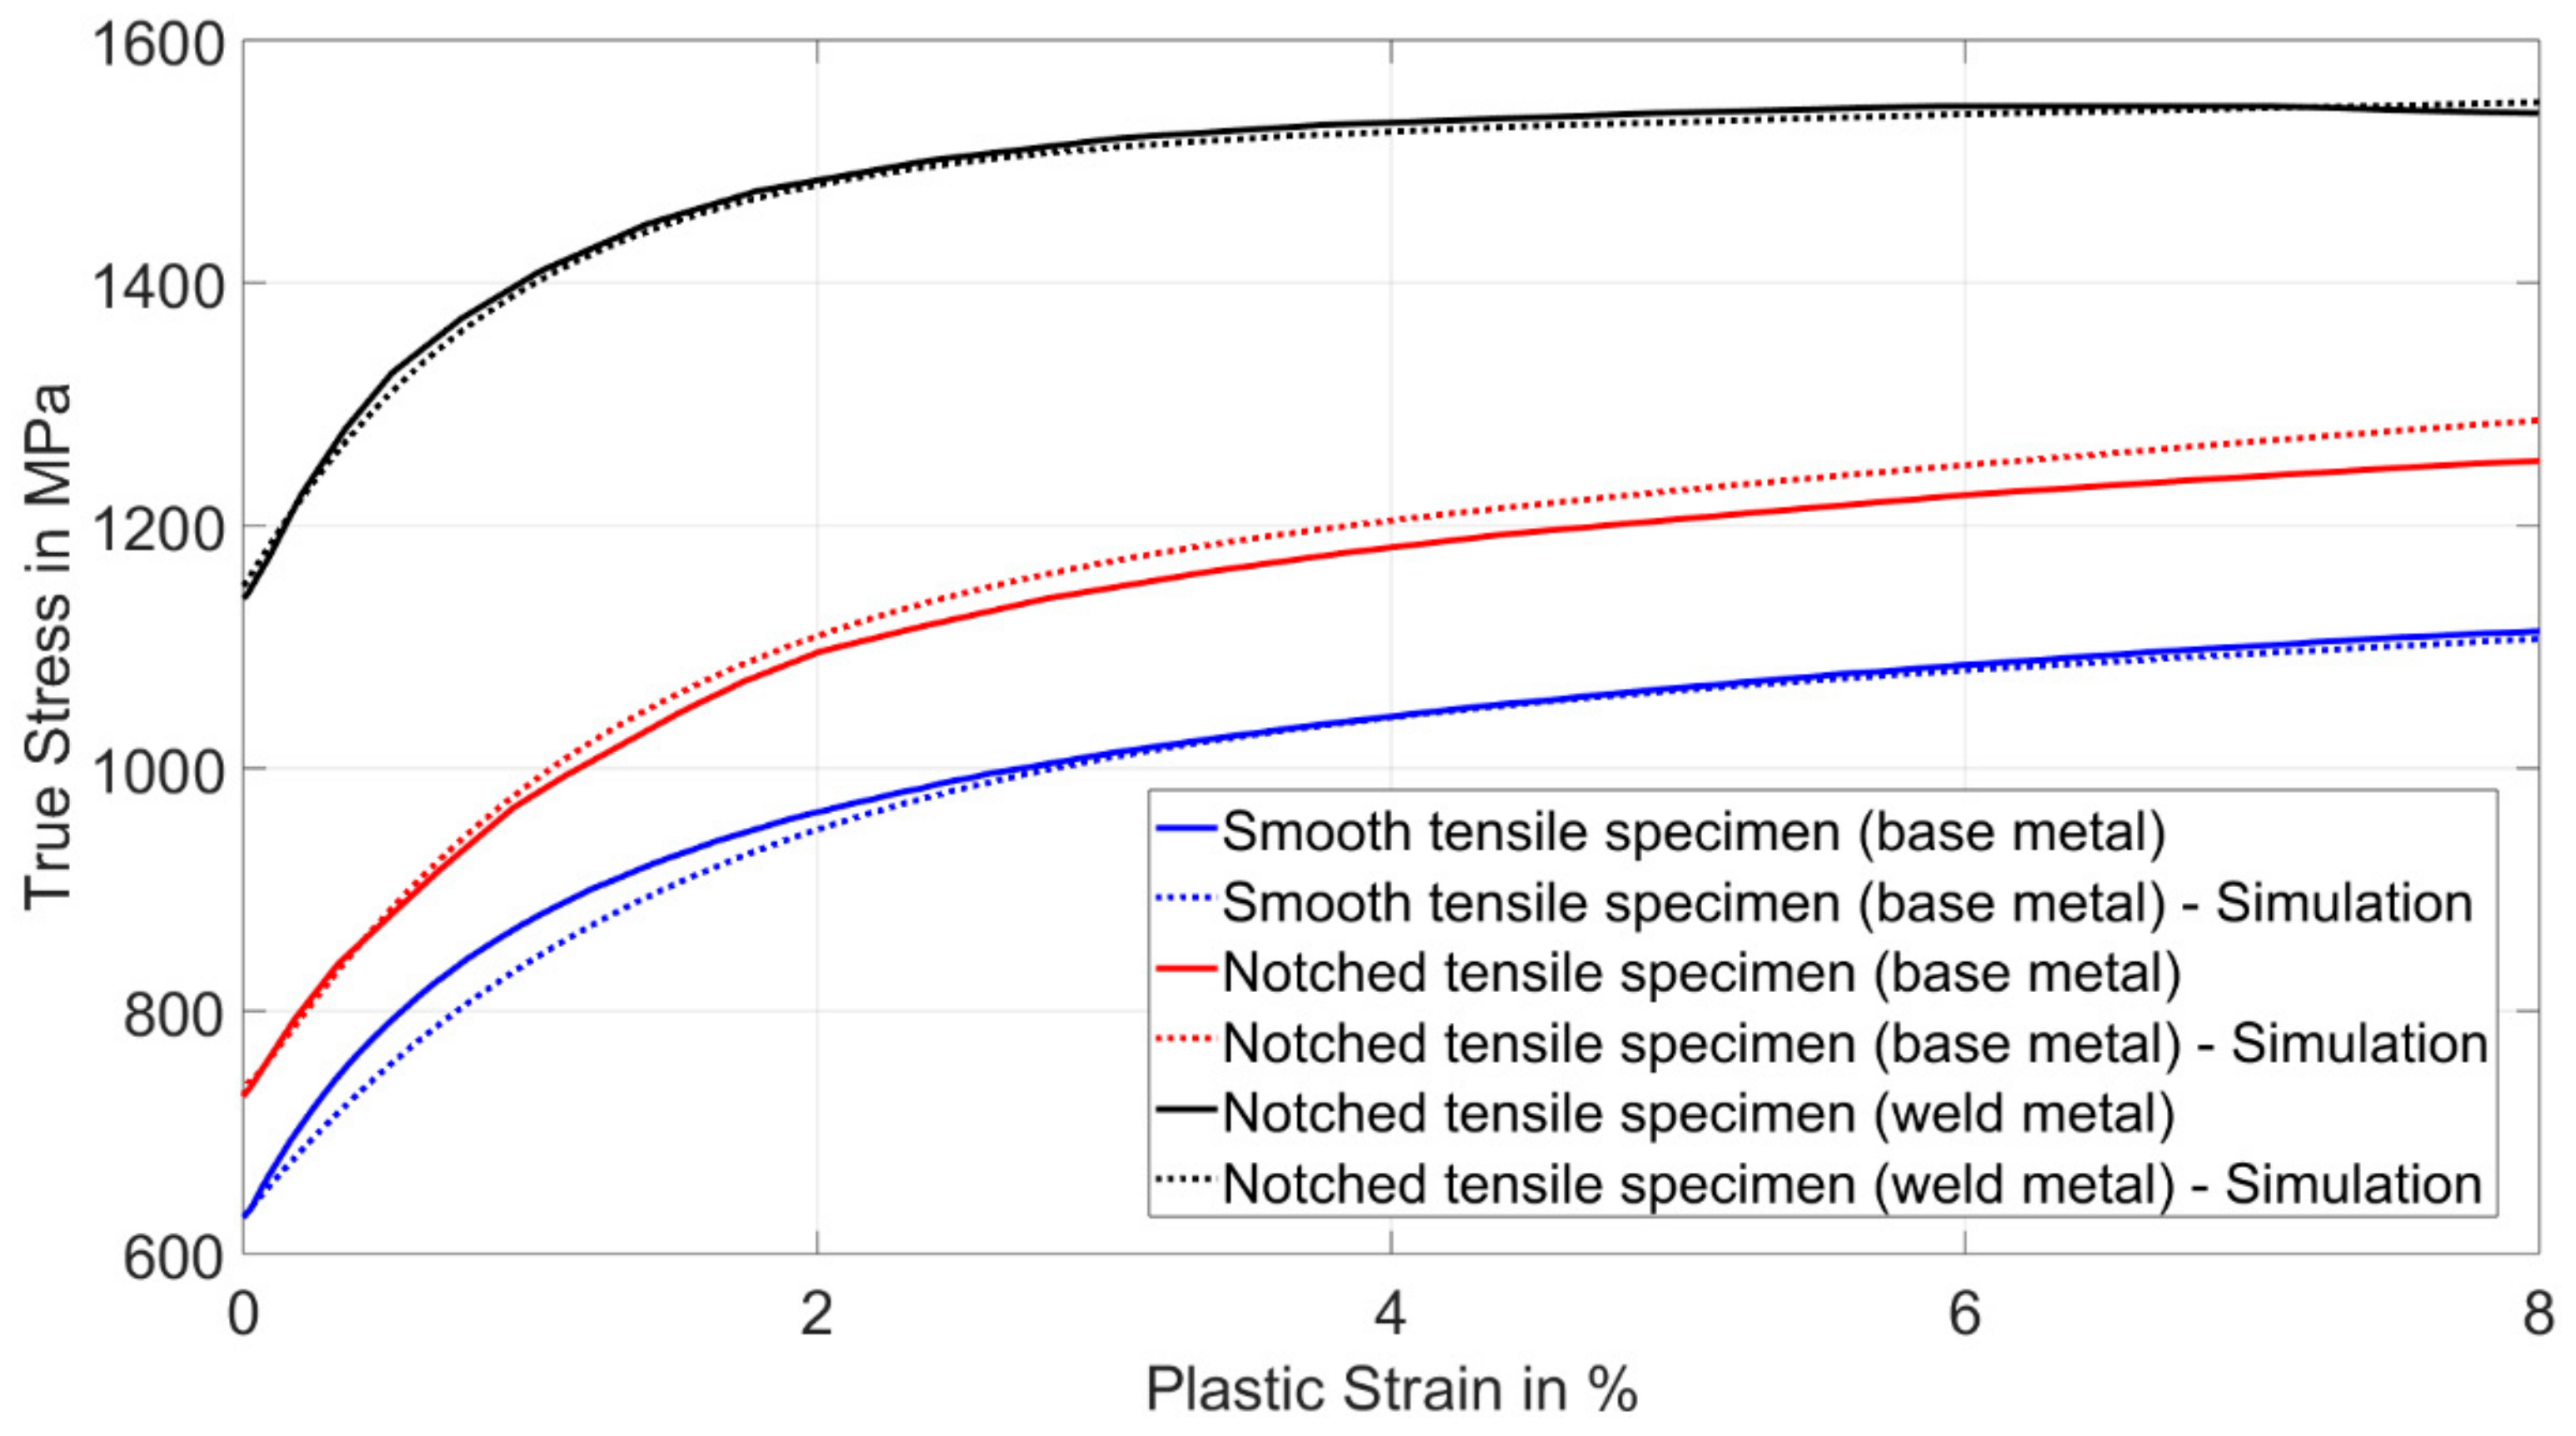
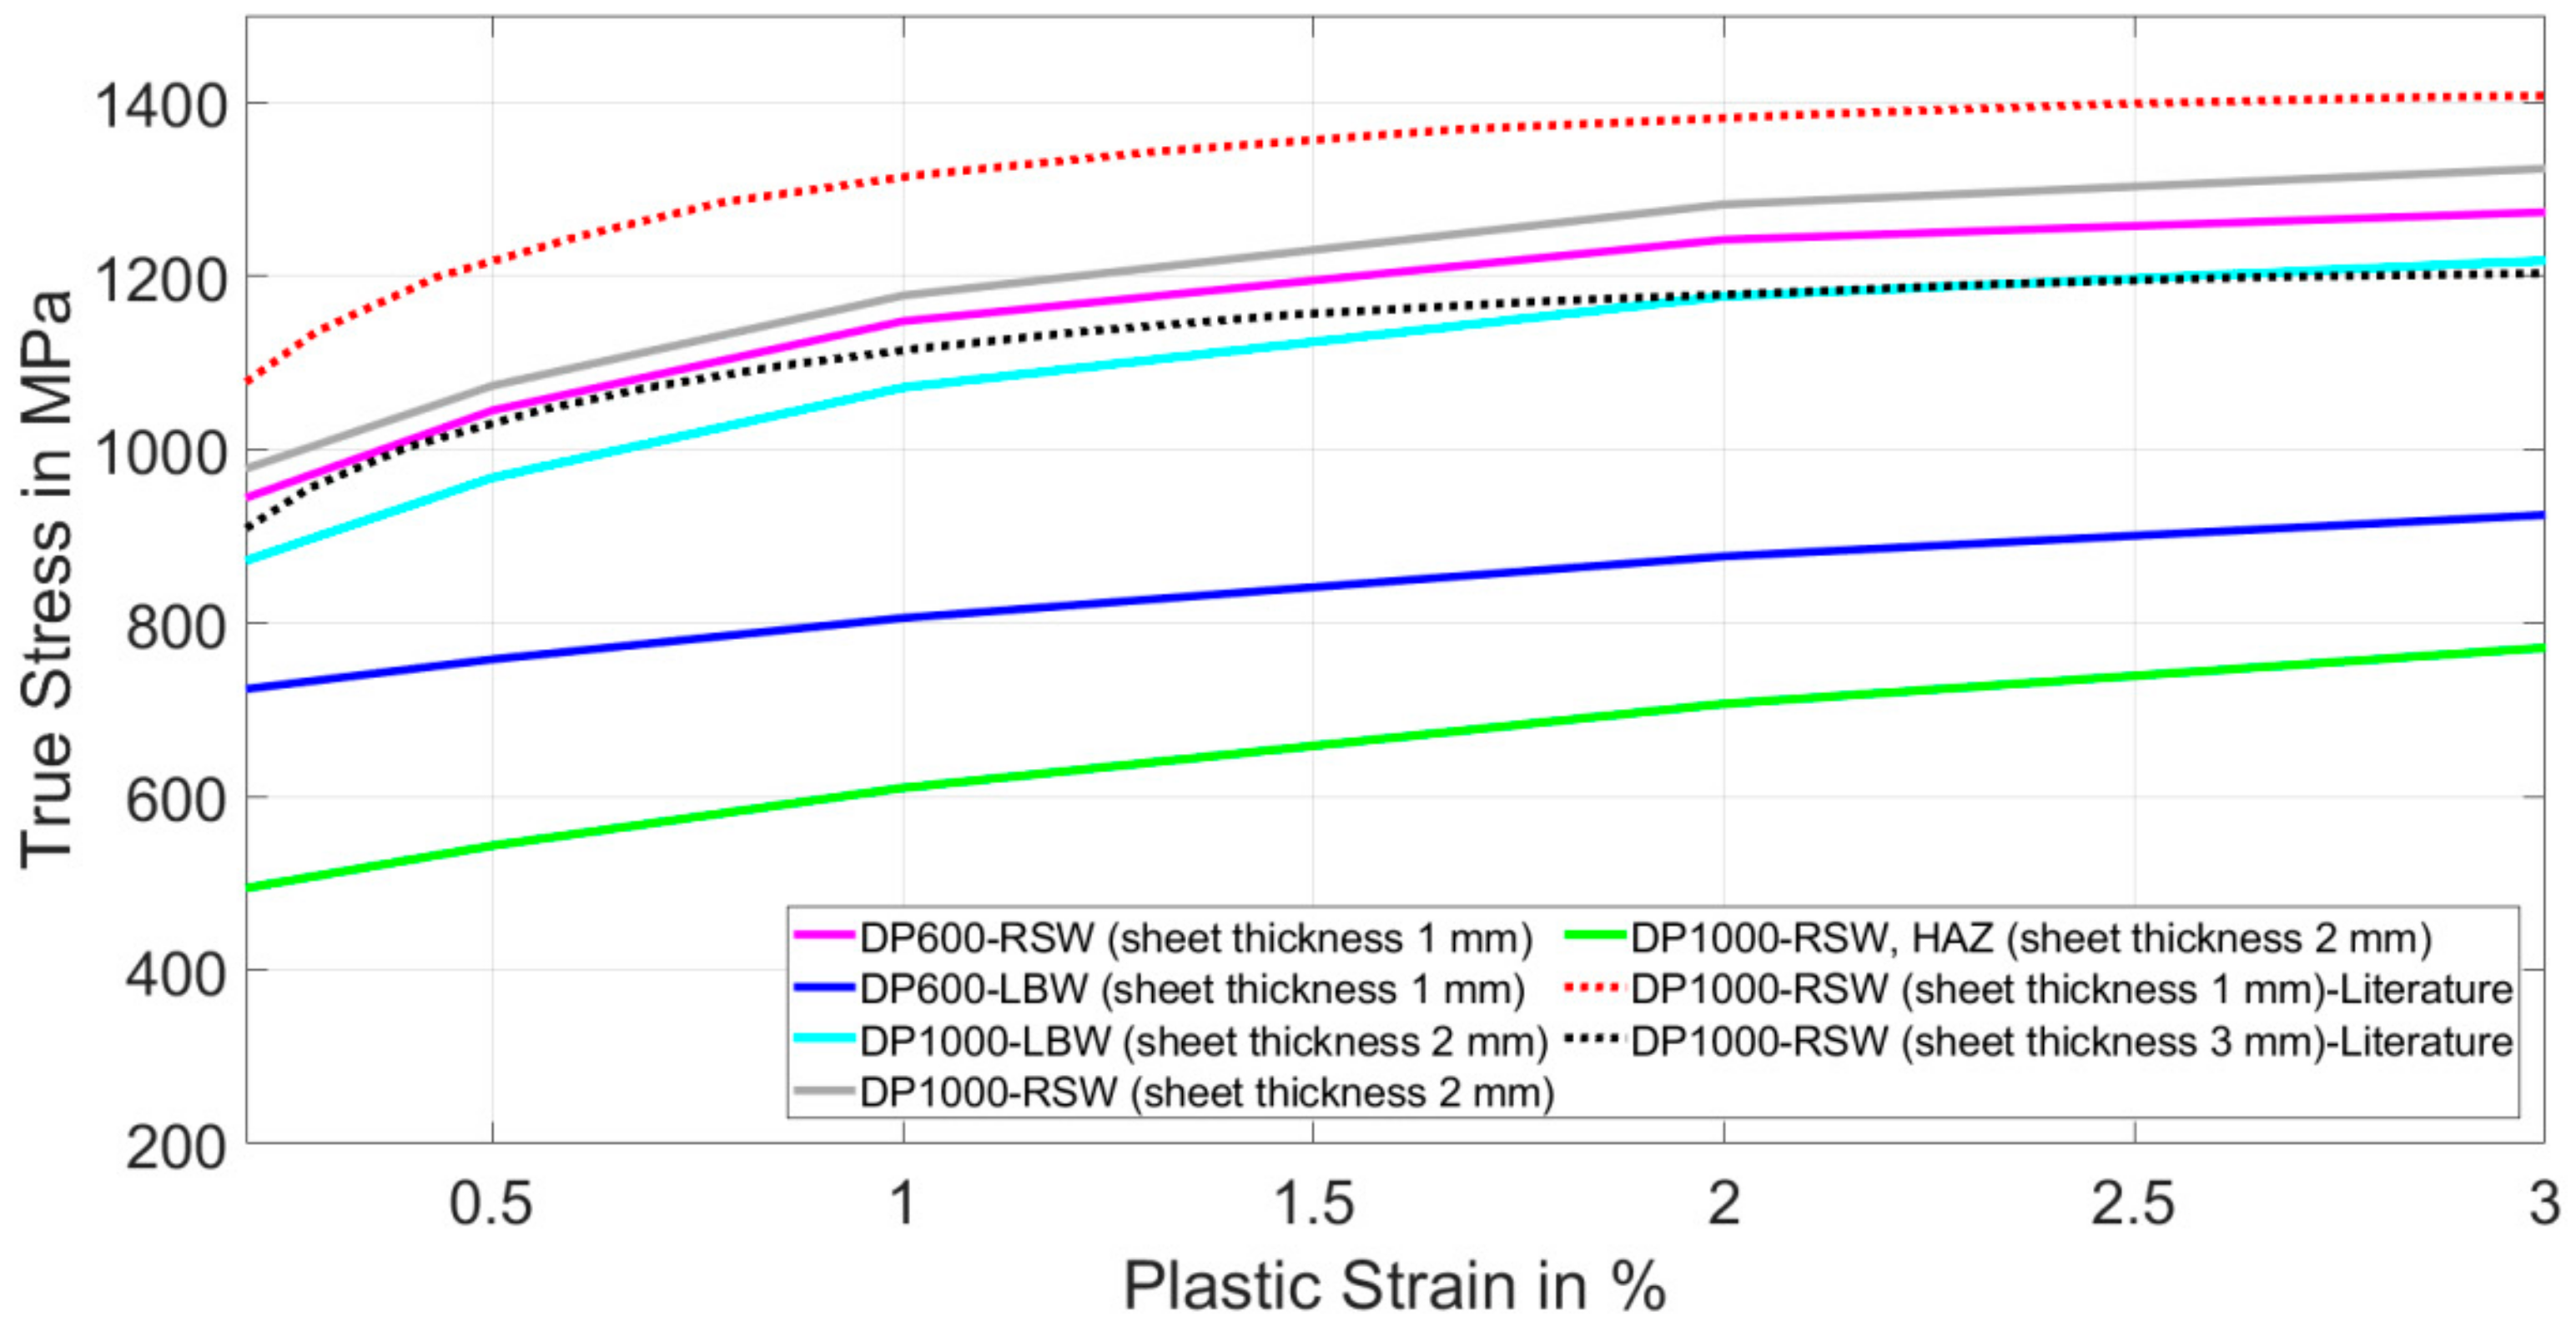
4.4.1. Numerical Simulation of the Tensile Tests

Simulations of the tensile tests were carried out and compared with the experimental results to obtain the geometric factors and material parameters of RSW DP600 and DP1000. Inverse simulation was used to calculate the material parameters for smooth and notched base material of DP600 and DP1000 as described in Section 3.1. Afterwards, the material parameters of the notched samples were divided by the material parameters for the smooth samples to determine the resulting geometry factors. Table 6 shows the results for base material of DP600 and DP100 and the calculated geometric factors for both notch geometries.
In the next step, the material parameters of the notched and welded samples of DP600 and DP1000 were calculated by using inverse simulation, as mentioned above Afterwards, those material parameters were divided by the geometry factor to determine the material parameters for the smooth and welded samples (RSW) of DP600 and DP1000. These material model parameters are summarized in Table 7.
Figure 17 and Figure 18 show a comparison of the experimental results from the tensile tests with the results of the simulation.
A good agreement with the numerical and experimental results is recognizable. The calculated model parameters for the smooth and welded DP600 and DP1000 were validated by the simulation.

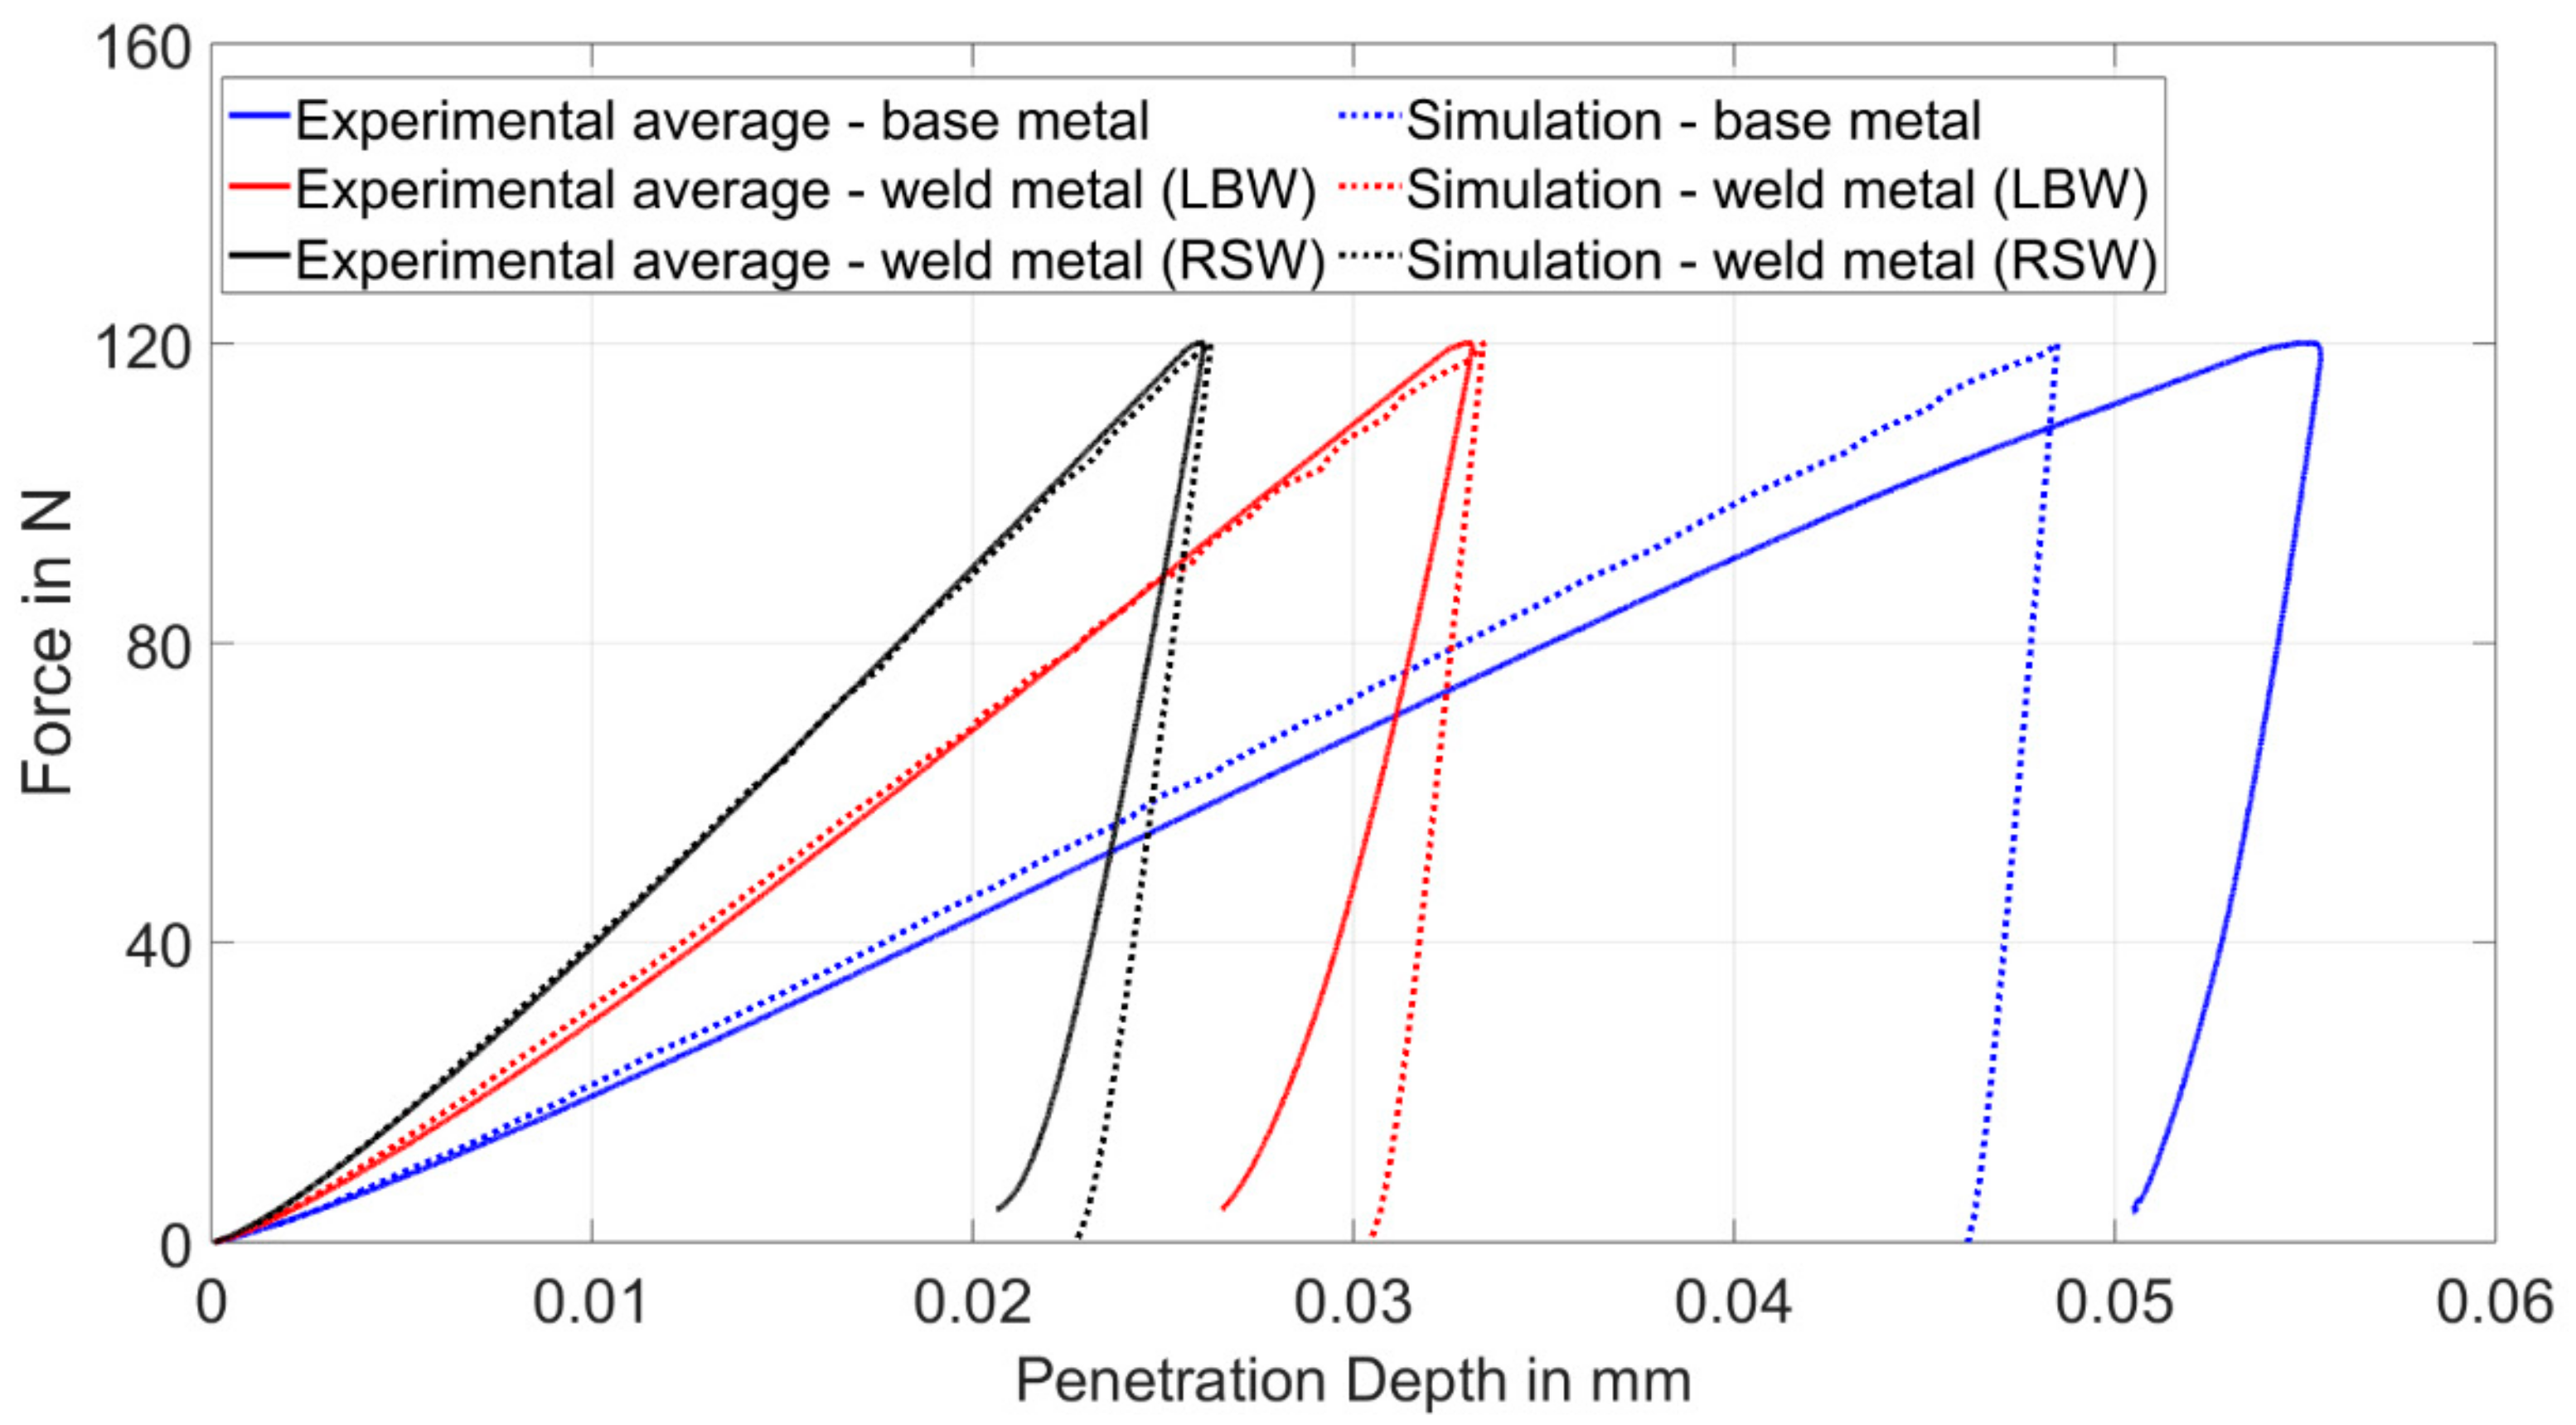
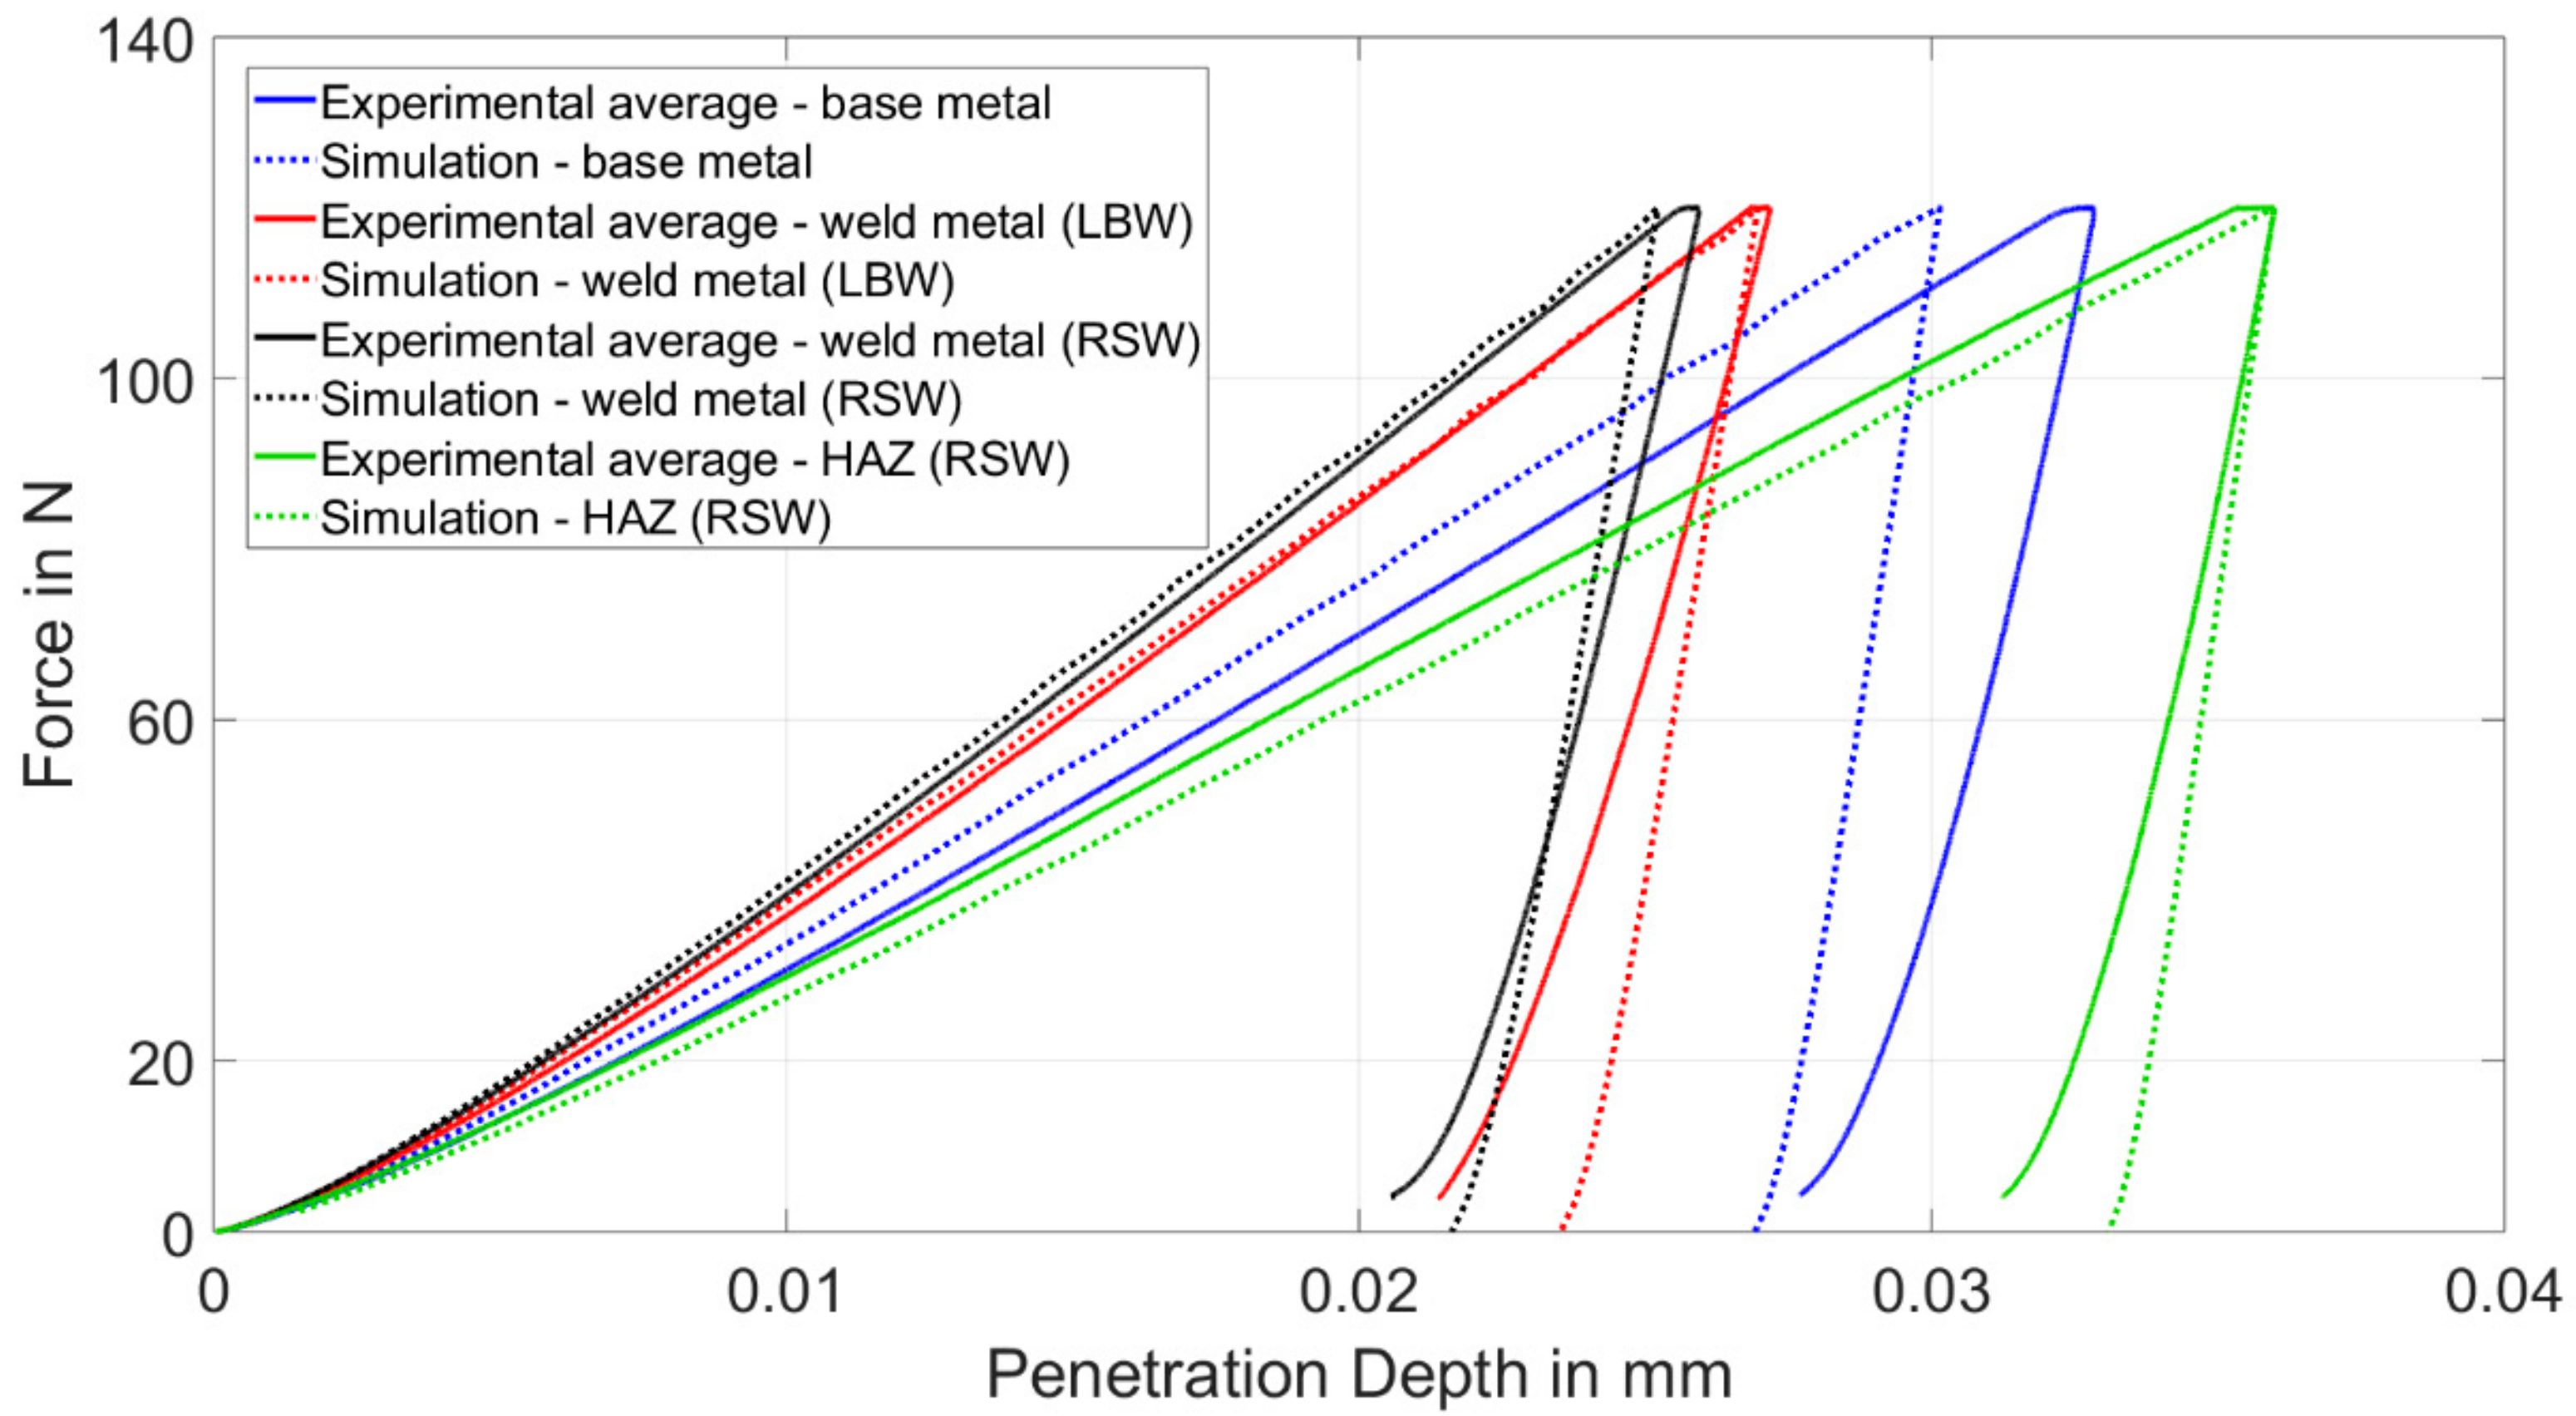
4.4.2. Numerical Simulation of the Indentation Tests

The indentation tests were simulated with varying values for the material parameters σ 0 ,   R 0 ,   R , and b, until a good agreement between the simulation and the experimental results was achieved for the indentation tests, as described in Section 3.2. The results are shown in Table 8. Compared to the base material, the yield strength in the HAZ was decreased by around 27% after RSW. The yield strength of weldment of DP1000 could be increased by 27% after LBW. However, it should be noted that the HAZ of LBW was not investigated. Similar to RSW, it is expected that the strength of the HAZ is reduced after LBW. Consequently, the HAZ is the weakest part of the weldment, and determines the overall strength of the welded component.
In Figure 19 and Figure 20, the experimental results of the indentation tests and the penetration profiles, as described in Section 2.6, are compared with the results of the numerical simulation. A good agreement of the simulation results with the experimental data of laser-welded DP600 in the weld metal can be seen, whereby the material model parameters can be validated.
The material model parameters for weld metal from RSW, which were already determined from the tensile tests, can be further validated due to the good agreement. The results of the base material show that the deviation of the simulation results from the experimental results increases with decreasing hardness of the sample; one reason for this could be the stronger occurrence of the pileup effect with softer metals [24]. The comparison of the yield strength for the base metal and for the weld metal of LBW shows that the yield strength was increased by 94% after welding, due to the microstructural changes.
Figure 21 and Figure 22 show the results for DP1000. Good agreement of the simulation with the experimental results for the weldment of LBW and for the weldment and HAZ of RSW can be recognized. The newly-determined material model parameters for LBW can be validated, and the material model parameters determined from the tensile tests can be confirmed.

4.5. Method Validation

To validate the method used in this paper, the calculated material parameters are compared with the results of Dancette [13]. Dancette investigated RSW DP1000 with sheet thicknesses of 1 and 3 mm. In this paper, RSW DP1000 with a sheet thickness of 2 mm was used. Consequently, the stress–strain curves from the obtained material parameters should lie between those determined by Dancette (shown in Figure 23). The dotted lines represent the curves from the literature for sheet thicknesses of 1 mm and 3 mm. It can be seen that the stress–strain curves calculated in this paper for RSW DP1000 with a sheet thickness of 2 mm are located between those of Dancette, and can thus be validated. Furthermore, the results for DP600 are similar to those for DP1000, due to the similar microstructure in the weldment after RSW, as shown in Section 4.1. It is noticeable that RSW leads to enhanced strengths compared to LBW for both DP steels. Compared to LBW, the yield strength of DP600 and DP1000 is increased by 24% and 13%, respectively, after RSW.

5. Conclusions

In the first approach, the material parameters in the weld metal of resistance spot-welded steel were successfully determined by uniaxial tensile tests. In order to investigate the local strain behavior in the weld metal, a notch had to be made in the tensile test specimen. Considering the resulting influence of the notch, geometric factors must be determined to calculate the material parameters for the smooth and welded material. A subsequent numerical simulation was used to validate the material parameters. It could be shown that RSW leads to a reduction of ductility and to an increase in the strength of DP600 and DP1000. The yield and tensile strength were increased by 598 MPa and 606 MPa for DP600, and by 350 MPa and 315 MPa for DP1000 after RSW. It was noticeable that the material parameters for welded DP600 and DP1000 were very similar, which suggested that the same martensitic microstructure was present in the weld metal. For the second approach, the material parameters of laser-welded DP steels and resistance spot-welded materials in HAZ were determined by indentation tests. The results showed that the strength in the weld metal of LBW increased due to the martensitic microstructure. Compared to the base metal, the yield strength was increased by 340 MPa in the case of DP600 and by 170 MPa for DP1000 after LBW. However, the yield strength of the resistance spot-welded DP1000 in HAZ was reduced by 170 MPa compared to the base material. It can be concluded that both approaches are valid material characterization methods for welded DP steels. Moreover, it is necessary to mention that for the second approach, only an instrumented indentation test machine is required. This approach significantly reduces the effort needed to determine the material parameters for welded steels compared to the traditional method, i.e., using the Gleeble system.

Author Contributions

Conceptualization, E.J., B.G. and M.R.; methodology, E.J.; validation, E.J. and J.L.; formal analysis, E.J. and J.L.; investigation, E.J. and J.L.; writing—original draft preparation, E.J. and J.L.; writing—review and editing, B.G. and M.R.; visualization, E.J. and J.L.; supervision, B.G. and M.R.; project administration, M.R.; funding acquisition, E.J., B.G. and M.R. All authors have read and agreed to the published version of the manuscript.

Funding

This research was funded by the German federal ministry for economic affairs and energy (BMWi) through the industrial cooperative research association (AiF) and research association for steel application (FOSTA) under a project entitled “qualification of the instrumented indentation technique for the parameter identification of advanced high strength steels” with grant number of IGF 19550N. The authors would like to thank the BMWi, AiF and FOSTA for their support.

Conflicts of Interest

The authors declare no conflict of interest.

References

  1. Ramazani, A.; Mukherjee, K.; Abdurakhmanov, A.; Abbasi, M.; Prahl, U. Characterization of Microstructure and Mechanical Properties of Resistance Spot Welded DP600 Steel. Metals 2015, 5, 1704–1716. [Google Scholar] [CrossRef] [Green Version]
  2. Ramazani, A.; Mukherjee, K.; Prahl, U.; Bleck, W. Modelling the effect of microstructural banding on the flow curve behaviour of dual-phase (DP) steels. Comput. Mater. Sci. 2012, 52, 46–54. [Google Scholar] [CrossRef]
  3. Ramazania, A.; Ebrahimib, Z.; Prahl, U. Study the effect of martensite banding on the failure initiation in dual-phase steel. Comput. Mater. Sci. 2014, 87, 241–247. [Google Scholar] [CrossRef]
  4. Cornette, D.; Hourman, T.; Hudin, O.; Laurent, J.; Reynaert, A. High Strength Steels for Automotive Safety Parts. SAE Tech. Pap. 2001. [Google Scholar] [CrossRef]
  5. Davies, G. Materials for Automobile Bodies; Elsevier Butterworth–Heinemann: Oxford, UK, 2003. [Google Scholar]
  6. Nanda, T.; Singh, V.; Chakraborty, A.; Sharma, S. Third generation of advanced high-strength steels: Processing routes and properties. Proc. Inst. Mech. Eng. Part L 2016, 233, 209–238. [Google Scholar] [CrossRef]
  7. Nikoosohbat, F.; Kheirandish, S.; Goodarzi, M.; Marashi, P. Microstructure and failure behaviour of resistance spot welded DP980 dual phase steel. Mater. Sci. Technol. 2010, 26, 738–744. [Google Scholar] [CrossRef]
  8. Manladan, S.; Abdullahi, I.; Hamza, M. A Review on the Application of Resistance Spot Welding of Automotive. J. Eng. Tech. 2015, 10, 20–37. [Google Scholar]
  9. Pouranvari, M.; Asgari, H.; Mosavizadch, S.; Marashi, P.; Goodarzi, M. Effect of weld nugget size on overload failure mode of resistance spot welds. Sci. Technol. Weld. Joining 2013, 12, 217–225. [Google Scholar] [CrossRef]
  10. Weber, G.; Brauser, S.; Gaul, H.; Rethmeier, M. Study of Fatigue Behavior for Spot Welded Tensile Shear Specimens of Advanced High Strength Steels. Steel Res. Int. 2012, 83, 988–994. [Google Scholar] [CrossRef]
  11. Nayah, S.; Biro, E. Resistance Spot Welding of Dual-phase Steels: Heat affected zone softening and tensile properties. In Proceedings of the 9th International Conference (ASM International): Trends in Welding Research, Chicago, IL, USA, 4–8 June 2012. [Google Scholar]
  12. Pouranvari, M.; Marashi, S.; Mousavizadeh, S. Failure mode transition and mechanical properties of similar and dissimilar resistance spot welds of DP600 and low carbon steels. Sci. Technol. Weld. Joining 2010, 15, 625–631. [Google Scholar] [CrossRef]
  13. Dancette, S.; Massardier-Jourdan, V.; Fabrègue, D.; Merlin, J.; Dupuy, T.; Bouzekri, M. HAZ Microstructures and Local Mechanical Properties of High Strength Steels Resistance Spot Welds. ISIJ Int. 2011, 51, 99–107. [Google Scholar] [CrossRef] [Green Version]
  14. Lee, H.; Choi, J. Overload analysis and fatigue life prediction of spot-welded specimens using an effective J-integral. Mech. Mater. 2005, 37, 19–32. [Google Scholar] [CrossRef]
  15. Kong, X.; Yang, Q.; Li, B.; Rothwell, G.; English, R.; Ren, X.J. Numerical study of strengths of spot-welded joints of steel. Mater. Des. 2008, 29, 1554–1561. [Google Scholar] [CrossRef]
  16. Yang, Y.; Babu, S.; Peterson, W. Integrated computational model to predict mechanical behaviour of spot weld. Sci. Technol. Weld. Joining 2008, 13, 232–239. [Google Scholar] [CrossRef]
  17. Ghosh, S.; Pal, T.; Mukherjee, S. Comparative study of heat-affected zone with weld and base material after post-weld heat treatment of HSLA steel using ball indentation technique. J. Mater. Sci. 2008, 43, 5474–5482. [Google Scholar] [CrossRef]
  18. Murty, K.; Miraglia, P.; Mathew, M.; Shah, V.; Haggag, F. Characterization of gradients in mechanical properties of SA-533B steel welds using ball indentation. Int. J. Press. Vessels Pip. 1999, 76, 361–369. [Google Scholar] [CrossRef]
  19. Javaheri, E.; Pittner, A.; Graf, B.; Rethmeier, M. Mechanical properties characterization of resistance spot welded DP1000 Steel under uniaxial tensile test. Mater. Test. 2019, 61, 527–532. [Google Scholar] [CrossRef]
  20. Lemaitre, J.; Chaboche, J.L. Mechanics of Solid Materials; Cambridge University Press: Cambridge, UK, 1990. [Google Scholar]
  21. Lee, H.; Lee, J.; Pharr, M. A numerical approach to spherical indentation techniques for material property evaluation. J. Mech. Phys. Solids 2005, 53, 2037–2069. [Google Scholar] [CrossRef]
  22. Zhong, N.; Liao, X.; Wang, M.; Wu, Y.; Rong, Y. Improvement of microstructures and mechanical properites of resistance spot welded DP600 steel by double pulse technology. Mater. Trans. 2011, 52, 2143–2150. [Google Scholar] [CrossRef] [Green Version]
  23. DIN EN ISO 6507-1:2018-07: Metallische Werkstoffe-Härteprüfung nach Vickers-Teil 1: Prüfverfahren (ISO 6507-1:2018); Beuth Verlag: Berlin, Germany, 2018.
  24. Tang, Z.; Guo, Y.; Jia, Z.; Li, Y.; Wei, Q. Examining the Effect of Pileup on the Accuracy of Sharp Indentation Testing. Adv. Mater. Sci. Eng. 2015. [Google Scholar] [CrossRef] [Green Version]
Figure 1. Geometries of the notched tensile specimens in mm: (a) DP1000 with a sheet thickness of 0.9 mm; (b) DP600 with a sheet thickness of 0.4 mm.
Metals 10 00001 g001
Figure 2. Parameters of the Voce nonlinear isotropic hardening model [20].
Metals 10 00001 g002
Figure 3. Simulation model of the notched specimen, (a) original notched geometry for DP1000, (b) modified notched geometry for DP600.
Metals 10 00001 g003
Figure 4. Geometry of the simulation model.
Metals 10 00001 g004
Figure 5. Microstructure of DP600: (a) base metal; (b) weld metal of RSW of two plates; (c) weld metal of RSW of one plate; (d) weld metal of LBW.
Metals 10 00001 g005
Figure 6. Microstructure of DP1000: (a) base metal; (b) weld metal of RSW of two plates; (c) weld metal of RSW of one plate; (d) weld metal of LBW.
Metals 10 00001 g006
Figure 7. Macrostructure of welded joint of DP600: (a) RSW of two plates; (b) RSW of one plate; (c) LBW.
Metals 10 00001 g007
Figure 8. Macrostructure of welded joint of DP1000: (a) RSW of two plates; (b) RSW of one plate; (c) LBW.
Metals 10 00001 g008
Figure 9. Hardness (HV0.1) mapping of DP600: (a) RSW of two plates (4296 indentations); (b) RSW of one plate (2436 indentations).
Metals 10 00001 g009
Figure 10. Hardness (HV0.1) mapping of DP1000: (a) RSW of two plates (11050 indentations); (b) RSW of one plate (4944 indentations); (c) LBW (3520 indentations).
Metals 10 00001 g010
Figure 11. Comparison between the hardness value (HV1) of different welding methods performed on DP600 and DP1000.
Metals 10 00001 g011
Figure 12. Strain distribution of the notched and welded (RSW) specimens before fracture, (a) DP600, (b) DP1000.
Metals 10 00001 g012
Figure 13. Stress–strain curves for smooth, notched, and notched-welded (RSW) specimens of DP600 (mean value).
Metals 10 00001 g013
Figure 14. Stress–strain curves for smooth, notched, and notched-welded (RSW) specimens of DP1000 (mean value).
Metals 10 00001 g014
Figure 15. Force-penetration depth-curve for DP600.
Metals 10 00001 g015
Figure 16. Force-penetration depth-curve for DP1000.
Metals 10 00001 g016
Figure 17. Stress–strain curves for DP600: Comparison between the tensile tests and simulation (welding method: RSW).
Metals 10 00001 g017
Figure 18. Stress–strain curves for DP1000: Comparison between the the tensile tests and simulation (welding method: RSW).
Metals 10 00001 g018
Figure 19. Force-penetration depth-curve for DP600: Comparison between experimental results and simulation.
Metals 10 00001 g019
Figure 20. Penetration depth depending on the distance from the center of the indenter (DP600).
Metals 10 00001 g020
Figure 21. Force-penetration depth-curve for DP1000: Comparison between experimental results and simulation.
Metals 10 00001 g021
Figure 22. Penetration depth depending on the distance from the center of the indenter (DP1000).
Metals 10 00001 g022
Figure 23. Comparison of determined material parameters with data from other literature [13].
Metals 10 00001 g023
Table 1. Chemical compositions of DP600 and DP1000, in weight-%.
MaterialCSiMnCrMoAlFe
DP10000.110.52.140.030.0020.04balance
DP600+ZE75/750.10.141.40.160.180.02balance
Table 2. Welding parameters for RSW for one plate.
MaterialForce in kNHold Time in msCurrent in kAElectrode Cape
DP600560016A16
DP1000560013.5A16
Table 3. Welding parameters of laser beam welding.
MaterialPower in kWFocusing in mmSpeed in m/min
DP6001.601.8
DP10002.401.8
Table 4. Dimensions of the simulation model.
GeometryAbbreviationDimension [mm]
Radius of the indenterR0.2
Width of the specimenB2.5
Height of the specimenH1.5
Table 5. Mechanical properties of DP600 and DP1000 (mean values).
MaterialYield Strength in MPaTensile Strength in MPaStrain Hardening ExponentTotal Elongation at Maximum Force in %
DP600Smooth sample360 ± 1.73633 ± 20.216 ± 0.00218.7 ± 1.1
Notched sample430 ± 10.07698 ± 20.124 ± 0.00915.8 ± 1.37
Notched-welded sample (RSW)1036 ± 3.061304 ± 10.820.049 ± 0.0084.18 ± 0.26
DP1000Smooth sample630 ± 2.081025 ± 1.530.096 ± 0.0028.3 ± 0.036
Notched sample800 ± 36.31145 ± 8.080.104 ± 0.0038.7 ± 0.376
Notched-welded sample (RSW)1150 ± 20.51460 ± 13.440.057 ± 0.0084.3 ± 0.25
Table 6. Material model parameters and geometric factors for base metal of DP600 and DP1000.
Material σ 0 in
MPa
R0 in
MPa
Rinf in
MPa
b
DP600Smooth sample36071026822
Notched sample430130020725
Resulting geometric factors for DP6001.191.830.771.14
DP1000Smooth sample630110039072
Notched sample800125034075
Resulting geometric factors for DP10001.271.140.871.04
Table 7. Material model parameters for RSW DP600 and DP1000.
Material σ 0 in
MPa
R0 in
MPa
Rinf in
MPa
b
DP600Smooth-welded sample86765420110
Notched-welded sample 1036120325125
DP1000Smooth-welded sample90617543796
Notched-welded sample1150200380100
Table 8. Material model parameters for the weldment of LBW and the HAZ of RSW.
Material σ 0 in
MPa
R0 in
MPa
Rinf in
MPa
b
DP600 LBW-Weldment7003032040
DP1000RSW-HAZ460150034350
LBW-Weldment80017543796

