Article

The Intercohort Dynamics of Support for Redistribution in 54 Countries, 1985–2017

Department of Sociology, University of Illinois at Urbana Champaign, Urbana, IL 61801, USA
*
Author to whom correspondence should be addressed.
Societies 2018, 8(3), 69; https://doi.org/10.3390/soc8030069
Submission received: 26 May 2018 / Revised: 2 August 2018 / Accepted: 21 August 2018 / Published: 25 August 2018
(This article belongs to the Special Issue Attitudes about Inequalities)

Abstract

:
When do attitudes towards inequality change? Scholars have examined why publics change their attitudes regarding support for redistribution (SFR). Yet almost all studies focus on SFR change from one year to another. We shift focus by conceptualizing SFR change as occurring across birth cohorts socialized into different cultural zeitgeists. We combine data from 21 waves of cross-national survey data using the International Social Survey Program and European Social Survey covering 54 countries, 32 years, and over a century of birth years. In many countries, we reach substantially different conclusions on the nature of SFR change when examining intercohort dynamics. In several cases, we detect rapidly declining SFR belied by year-to-year stability of attitudes, representing an important challenge for proponents of egalitarian politics. Additional findings and implications are discussed.

1. Introduction

Where, and when, do attitudes towards inequality change? Citizen views about the responsibility of governments to take active steps to reduce inequality, or support for redistribution (SFR), have been the subject of interest in a mature line of research (e.g., [1,2,3,4,5,6,7,8,9,10]) Such attitudes are potentially consequential for class-based mobilizations to enact policy change [3,11], can be used to assess policy responsiveness, or lack thereof, to citizen preferences, can indicate the potential breakdown of democratic ideals or shifts in power resources [5,12,13], and reflect context-specific norms and ideals surrounding social solidarity and ideas of justice and fairness [1,14,15]. Scholars have devoted increasing attention to the assessment of when, where, and why a public’s SFR changes. Approaches range from a focus on microlevel changes in an individual’s personal financial situation [16], macrolevel shifts in immigration rates, economic development, or country-level variation of group membership and social identity [8,9,10,17], and psychological priming effects that might create fleeting shifts in cognitive schemas regarding ideas of worthiness and fairness [18,19,20]. In the current research, we address a gap in the study of SFR change by conceptualizing it as something that occurs across birth cohorts. Of course, in related fields of research, changes in values and beliefs from one birth cohort to the next have been effectively used to reveal subtle dynamics of socialization that are confounded when examining simple changes over time in a total citizenry [21,22,23,24]. Yet aside from Jaeger’s study of 30 European countries [25] and Olivera’s follow-up research [26], such a cohort-based design has not been applied to the study of SFR. As we will show, in some country contexts, switching focus to a cohort-based design highlights substantial intercohort changes in SFR, belied by population-level stability over time. In this study, we descriptively examine SFR as it changes across birth cohorts within countries. We create a unique database of 723,698 individuals nested in 54 countries by combining 21 cross-national surveys covering years 1985 to 2017. We then document and describe how SFR changes across periods, and across birth cohorts. We exploit the large dataset by examining variation across welfare regimes [1,27,28], and how the gap in SFR across educational attainment has evolved across birth cohorts [25,29,30]. This paper has several implications. First, we show that seeming stability, or growth, of SFR over time occasionally belies substantial contradicting intercohort changes. Conclusions about where SFR is high, and rising, might depend upon the focus on how attitudinal change should be measured. Second, we document important heterogeneity of intercohort change in SFR across welfare regime types. On the one hand, we observe sizable differences in levels of SFR and educational cleavages across welfare regimes. On the other hand, we often observe greater variation of SFR across birth cohorts within a single country than across typical levels of SFR across regimes, which present a challenge to regime-based arguments of publics “locked into” particular views of SFR by historical legacies. Third, this paper reveals potentially important political challenges for some countries. Younger cohorts in some countries with seemingly constant trends in SFR, such as the United States and more educated respondents in East Europe, are becoming increasingly supportive of SFR, while other countries, such as The Netherlands and Sweden, face a potential youth movement against the state.

2. Background

2.1. Support for Redistribution

Who supports government efforts to reduce inequality? The answer to this question has resulted in a mature line of cross-national comparative research that examines country differences in support for redistribution (SFR). Changes in economic inequality represent perhaps the core social issue faced by high income countries over the past 45 years [10,31,32,33]. Cross-national comparative researchers have long demonstrated the capacity for state policies to reduce inequality levels (e.g., [34,35,36,37,38]). States can reduce inequality through such practices as progressive taxation, social welfare policies, decommodifying insurance programs, and robust public employment. While many countries experience similarly high levels of market inequality, country rankings differ on net inequality, with some countries, like those in Nordic Europe and France, taking significant action to reduce inequality, while others, like the US, Canada, and Australia, reduce inequality in small amounts (e.g., [37,38]).
The potential for states to reduce inequality has generated competitive politics surrounding such state action [10,34,39]. Political factions routinely turn to the state for protective rents to buffer market forces [10,40]. In democratic societies, public opinion is one such arena of political contestation [3,13]. Given the central importance of inequality to contemporary social trends, understanding variation in public views towards the state’s responsibility to address inequality is of great scholarly concern.
In this research, we assess SFR at the aggregate, population level [10,11,25]. Understanding population SFR is important for at least three reasons. First, the examination of aggregate public opinion can potentially reduce the noisiness involved with individual level attitudinal measures [3,13]. Conceptualizing SFR as a population level characteristic might thus yield improved measurement. Second, some argue that citizen views on resonant policy questions are occasionally incorporated into political decision making [3]. Although the robustness of this link is anything but settled [5,12,41], the notion of policy responsiveness to inequality based on mass citizen views represents a fundamental tenant of democratic ideals [13]. Third, regardless of its influence on policy responsiveness, SFR represents important variation across contexts in values and norms held by different publics [42]. Such differences reflect, and are created by, values and norms governed by different historical legacies and cultural contexts. That is to say, variation of SFR across publics is simply interesting in its own right [14,17].
The current research pays special descriptive attention to cross-national variation of change over time in SFR. Recent studies have leveraged SFR change to better understand the nature of citizen views towards inequality. For example, [17] uses a sophisticated multilevel modeling technique to document the relationship between change in immigration and change in a variety of welfare attitudes. Kenworthy and McCall show the contrast between largely stable levels of welfare spending and variation in SFR [6]. Similarly, McCall uses General Social Survey data to document long-run trends in a variety of dimensions of views towards inequality [31]. VanHeuvlen [10] combines data from multiple surveys to document longitudinal changes in SFR in relation to country-level changes in economic development, social policy, and inequality.
Understanding the nature of attitudinal change is critical for at least two reasons. First, it allows for the assessment of the stability of attitudes over time. Some argue that SFR is part of a bundle of welfare attitudes that become largely locked in by the historical legacy of enacted social welfare policies (cf. [1]). An assessment of SFR in a dynamic context allows for the direct assessment of how much SFR becomes “locked in” to a public’s value system via historical institutional contexts. Second, an assessment of SFR change can illustrate how certain political cleavages evolve over time. For example, Brooks and Manza [15] demonstrated the partisan attitudinal response to the Great Recession in the US. Even if SFR levels across different country contexts remain relatively stable—e.g., the USA remains largely unsupportive of government action—important changes in who supports government redistribution may nevertheless occur.

2.2. Intercohort Analysis

While change over time has become increasingly central to SFR research (e.g., [3,5,10,11,17]), most studies assess SFR change as a process that occurs across years, from one survey wave to another. While valuable, this approach overlooks a critical alternative method to understand change: intercohort change. How attitudes, norms, and values change from individuals born in one era to the next has been widely examined across social science subdisciplines. For example, Pampel and Hunter [23] demonstrate the decline and stagnation of environmental concern across American birth cohorts. Shu and Meagher [43] illustrate the benefits of a cohort-based study of gender attitudes in the United States. Fiel and Zhang examine desegregation trends in relation to grade, period, and cohort changes in the US educational system [44]. And Biegert constructs a pseudo panel in 20 countries to examine changes in unemployment in response to welfare benefits [24]. An important general lesson of these studies is that change over time does not necessarily correspond to change across cohorts. A focus on the latter can indicate important longitudinal dynamics that are lost when averaging across birth cohorts in a particular year. In total, these studies highlight the utility of transitioning focus from a period-based focus to a cohort-based one.
An assessment of SFR in an intercohort perspective might be particularly useful for SFR studies. For example, in their analysis of environmental attitudes, Pampel and Hunter argue that value systems tend to get “locked in” early in life, partially due to the broader social contexts and zeitgeist in which a birth cohort comes of age [23]. Similarly, discussed more below, previous research on SFR connect it to a country’s basic value systems, institutional contexts, and expectations of responsibilities the state and individuals have toward one another. Simply put, intercohort change is an intuitive place to examine how these values and expectations get locked in during formative early years.
While intercohort analysis represents a powerful tool for scholars to understanding dynamic processes, few studies of SFR place birth cohorts at the center of analysis [25,26]. For example, Jaeger [25] uses a panel of 30 European countries from years 2000–2010, finding that birth cohorts respond to both inequality change and economic growth. Olivera [26] similarly uses a sample of European countries, finding that cohorts tend to have higher SFR in response to higher inequality. However, in each case, cohort trends were primarily a tool for assessing the influence of changes in country-level variables on changes in SFR. Critically, cohort-level SFR were demeaned. Thus, time-invariant variation of SFR levels across cohorts were effectively controlled away, leaving analytical focus on within-cohort change in SFR across time to be modeled against country-level changes in macrolevel variables. This is an effective and ingenious approach to identify macrolevel causes of SFR change, but it does not address our primary interest. We are not aware of other cross-national cohort based studies of SFR beyond these. In the current research, we extend these studies by providing a critical descriptive understanding of intercohort change, expanding the years in the sample by 22 years, and expanding the countries in the sample beyond Europe.
We place primary focus on descriptive trends across birth cohorts, and do so for two reasons. First, few have examined SFR across birth cohorts. There is little knowledge of where, and when, birth cohorts become more or less supportive of government action towards inequality. Simply put, descriptive information across a large number of countries provides an important foundational set of knowledge of SFR dynamics hitherto ignored. Second, descriptive information often provides an important base for substantive understanding of SFR change. For example, McCall paid special attention to extensively documenting the descriptive information of change over time in inequality attitudes [31]. Lupu and Pontusson [11] create a unique dataset of macrolevel observations of SFR and then plot descriptive associations against a small set of macrolevel characteristics. Descriptive visualization of SFR trends can provide a useful substantive understanding of variation in levels of SFR which might not be apparent from the coefficients of multilevel regression models.

2.3. Welfare Regimes and SFR

We focus on two grouping characteristics to examine SFR as it changes along birth cohorts. First, welfare regimes, originally categorized by Esping-Andersen [27], have provided a foundational macrolevel theory for cross-national SFR studies over the past two decades [1,2,3,10,28,45,46]. Such a focus begins from the idea that welfare state regimes represent the crystallization of long-run historical power struggles over control of economic and social resources [39]. State policies and institutional arrangements thus reflect the victories of many previous power struggles, and these long-run historical processes help establish path dependent norms, values, and expectations of citizens, both in terms of the responsibility that states have towards citizens, and of the responsibilities citizens have towards one another [14]. For example, universalist social welfare policies reflect and solidify social solidarity, leading to higher support, while regimes tolerant to high inequality can undermine support through the creation of economic cleavages between the top and the bottom of the income distribution [4]. Some argue that welfare regime historical origins are intimately tied to dominant religious organizations of countries, and thus state policies and institutions are intimately connected to widely shared norms, values, and interpersonal expectations [42,47,48].
SFR may vary across regimes due to basic differences in social policies and institutional arrangements [27,46,49]. Liberal regimes are defined by residual social welfare policies, a privileging of market processes over state intervention, a greater tolerance of inequality, and means tested social insurance programs. Conservative regimes on continental Europe tend to have more generous social welfare programs and insurance systems than Liberal regimes. However, Conservative regimes are largely defined by insider–outsider employment cleavages and an emphasis on traditional gender systems. The Social Democratic regime has broad and generous social welfare policies and cradle-to-grave insurance systems, robust public employment, and low inequality. Four additional regimes are frequently used for countries in more peripheral economic and social positions. Mediterranean regimes tend to have generous social welfare policies, an emphasis on familialism, and strong Catholic legacies. East European countries are defined by a late and forcible shock into the global capitalistic system and a strong communist legacy. Central and South American countries have relatively low levels of generosity and somewhat regressive redistributive social policies [50]. East Asian countries have heterogeneous social policies, but many countries, such as Japan, South Korea, and Taiwan, experienced simultaneously, economic growth and equity, and thus effectively developed generous and universal welfare states [51].
Some argue that SFR varies across these regimes, as public attitudes and tolerances regarding inequality tend to be path dependent and locked in by context specific histories and political legacies. Therefore, SFR should be lower in Liberal countries and higher in Social Democratic ones, for example. These expectations are based on the fact that contemporary policy bundles reflect deeply held values, and that the effective reduction of inequality might create perceptions of state efficacy, thus bolstering and expanding support [10]. We assess these general expectations for differences in SFR levels, but also assess trends over time, and across birth cohorts, within regimes. There exists little theoretical development for an anticipation of variation of trends across regimes. We therefore address this topic inductively.
Of course, the strength of regime-based variation of SFR has been called into question [10,28,52]. Some argue that these groupings are overly blunt and mask substantial within-regime heterogeneity. Still others note that regime categories mask changes within countries in policies, institutional arrangements, and citizen views [53]. We keep these criticisms in mind when examining results below. Nevertheless, given its foundational place in cross-national SFR research, welfare regimes present a logical starting point to examine intercohort trends.1

2.4. Educational Attainment

Many have examined SFR in relation to educational attainment, doing so based on two potentially salient dimensions of education.2 First, education tends to associate with class standing, and so individuals might perceive the potential personal costs and benefits of redistribution differently based on their level of educational attainment [54]. Over the past several decades, highly educated individuals have tended to be the economic beneficiaries of the upswing of inequality [33], as the premiums paid to a college degree have risen rapidly, and technologically-induced wage attainment has privileged those with the abstract knowledge sets and skills to effectively use information and communication technology and manage increasingly complex organization. Similarly, individuals with less educational attainment tend to be in a more economically volatile situation and may have fewer lucrative skills to offer in the labor market. Some find that more educated individuals tend to have lower SFR (e.g., [30,55]). Insofar as the contemporary era of high inequality associates with greater potential payoff to more educated individuals, one might anticipate a growing education-based cleavage among younger birth cohorts. Simply put, from a rational self-interested perspective, higher educated individuals might be less supportive of government redistribution than less educated individuals.3
Second, educational attainment does not only reflect economic opportunity. This point is made clear by recent research in the United States on racial inequality. Wodtke [56], for example, shows that greater verbal skill is positively associated with more tolerant racial views. Others have similarly found that in the US context, greater educational attainment is associated with more tolerant views towards racial minorities (e.g., [57,58]). Similarly, economic inequality is complex, and involves an understanding of the relative levels of market and net inequality, government policy effectiveness in reducing inequality, and the downstream and contextual harms that inequality can yield (e.g., [38]). The necessary mastery of understanding complex systems, systems of benefits and consequences, and the nature of how actually existing inequality came to be might be better understood by more highly educated individuals. Thus, more educated individuals in more recent birth cohorts might have a better grasp on the full set of consequences of their economic system and thus have higher SFR. Finally, some find that education influences individual value systems through socialization processes [59,60], creating durable and deeply held differences in value systems that persist across the life course.

3. Data and Methods

We construct a unique dataset from 21 cross-national surveys to examine support for redistribution: eight waves of the European Social Survey (ESS) and 13 waves of the International Social Survey Programme (ISSP). ESS data come from the 2002, 2004, 2006, 2008, 2010, 2012, 2014, and 2016 waves. ISSP data come from the 1985, 1987, 1990, 1991, 1992, 1993, 1996, 1998, 1999, 2000, 2006, 2009, and 2010 waves. This combination of data sources is motivated by Lupu and Pontusson [11] and extends the data management approach of VanHeuvelen [10], who similarly combine ISSP and ESS sources to create an extensive set of cross-national SFR measurements.

3.1. Dependent Variable

We measure support for redistribution using three survey items. ESS respondents are asked, “Please say to what extent you agree or disagree with each of the following statements: The government should take measures to reduce differences in income levels.” ISSP respondents are asked one of the following questions across surveys: “How much do you agree or disagree with each of these statements...It is the responsibility of the government to reduce the differences in income between people with high incomes and those with low incomes” (ISSP-1) and “On the whole, do you think it should be or should not be the government’s responsibility to reduce income differences between the rich and poor” (ISSP-2). Item answers are ordinal, ranging from strongly agreeing to strongly disagreeing. We recode these items to differentiate agreement. Agree and strongly agree for ISSP-1 and ESS and definitely should and probably should for ISSP-2 are coded as agreement (one), while neither, disagree, strongly disagree, and do not know for ISSP-1 and ESS, and probably not, definitely should not, cannot choose, and do not know for ISSP-2 are coded as zero. We create a binary variable to minimize bias stemming from unobserved cultural answering tendencies [17]. VanHeuvelen showed that ISSP-2 question wording tends to result in higher SFR compared to other questions [10]. We therefore replicated all results using just ESS and ISSP-1 questions, but reach the same substantive conclusions. Our measure of SFR thus indicates the percentage of a group that affirms that the state should take action to reduce income inequality.

3.2. Key Independent Variables

Our main independent variable of interest is a respondent’s birth cohort. We collect information on the respondent’s age and the year of the country-specific survey administration to create a measurement of the respondent’s year of birth. Following similar cohort studies [4,46], we group respondents into six-year birth cohorts:4 (1) 1900–1904 (2) 1905–1909 (3) 1910–1914 (4) 1915–1919 (5) 1920–1924 (6) 1925–1929 (7) 1930–1934 (8) 1935–1939 (9) 1940–1944 (10) 1945–1949 (11) 1950–1954 (12) 1955–1959 (13) 1960–1964 (14) 1965–1969 (15) 1970–1974 (16) 1975–1979 (17) 1980–1984 (18) 1985–1989 (19) 1990–1994 (20) 1995–2001.
We also examine cohort change across groups defined by educational attainment. Specifically, we measure whether a respondent has completed tertiary educational attainment (approximately corresponding to 1997 ISCED education codes 5A and 6).5
In total, our cohort-based design yields 40 cohort-education cells (20 birth cohorts, two education categories). We compute weighted mean SFR levels in these cells separately in each survey wave, in each country.
We also examine cohort trends across countries grouped by welfare regime: Liberal, Conservative, Nordic, Mediterranean, and East European. We also examine South/Central American and Asian countries separately.6 Countries included in each regime are listed in footnote 1 of Table 1.7
Table 1 includes descriptive statistics for our project. In general, publics tend to have high SFR, as the mean SFR ranges from 0.57 in Liberal regimes to 0.81 in Mediterranean regimes. The typical respondent in our sample was born in the mid to late 1950s across each regime, and the typical survey administration year was in the early 2000s. Between 9% (Central/South America) and 25% (Nordic countries) of respondents report having a tertiary educational degree.

3.3. Methods

As noted earlier, because little knowledge of intercohort SFR change in a cross-national perspective currently exists, we restrict focus to descriptive analyses. We present mean differences across cohorts and regimes. We also visualize nonlinear associations across years and across cohorts using locally weighted regression (LOWESS) lines. Briefly, LOWESS regression lines visualize a nonlinear association between two variables. This method involves rolling bivariate regressions along values of the independent variable where values of the independent variable are more highly weighted, allowing for an assessment of nonlinear changes of an outcome (SFR) across values of an independent variable (e.g., birth cohort).
We also examine our regime-by-education-by-cohort results using age-period-cohort multilevel models. Briefly, we replicate the logic of Nawrotzki and Pampel [61] and use a mixed-model in which individual data are nested within a cross-classification of years and five-year age groupings. We use these cross-classified multilevel models and compare them to a standard three-level regression model of individuals nested in country-years nested in countries. In each model, we control for the respondent’s sex, marital status (married, separated/divorce, widowed, or never married), employment status (employed or not), whether the respondent is a member of a labor union, the respondent’s relative household income,8 and country fixed-effects.9 We estimate these regression models separately by welfare regime, which mimics a full interaction of all individual level variables with a regime categorical variable.

4. Results

4.1. Descriptive Country Trends

What is gained by reconceptualizing SFR as changing across birth cohorts? Figure 1 shows locally weighted regression (LOWESS) lines that track the nonlinear relationship between either year (top axis) or birth cohort (bottom) axis in relation to mean SFR. While we examined trends across all countries in our sample, we restrict focus to 21 in Figure 1. We include three countries from each of the seven regime types used in our sample. Rows correspond to the grouping categories (from top, Liberal, Conservative, Nordic, Mediterranean, East European, Central/South America, and East Asia).
Of the many patterns notable across these descriptive associations, we highlight two. First, sometimes cohort and time trends largely mirror one another. With some slight variation, Irish SFR has declined from around 0.8 to around 0.75. Similarly, French SFR has remained largely constant across time and across cohorts. We observe similarity in Mediterranean countries like Spain, and East Asian countries like Japan and the Philippines. Simply put, in some country contexts, an assessment of SFR across years or across birth cohorts yields little substantive differences in one’s general conclusions regarding SFR change.
Second, trends do not always align. Consider the divergent trends in the United States. Assessment of SFR across years shows stable and low SFR from the mid-1980s to around the financial crisis of 2008, followed by a sharp decline. From this perspective, contemporary America is unique, compared to the countries visualized in Figure 1, in its contemporary decline of SFR. However, assessment of change across birth cohorts reveals a u-shaped pattern. Cohorts born between 1900 and 1940 were less supportive of redistribution, with SFR changing from approximately 0.4 to 0.35.10 Around 1940 was an inflection point. SFR has increased across birth cohorts, so that those born in the 1980s express the highest levels of support. Importantly, opposite trends emerge in many Nordic countries. In Sweden, for example, SFR rose form about 0.475 to 0.65 between 1990 and 2005, and SFR has remained relatively constant since. In contrast, young cohorts in Sweden born after 1960 express increasingly unsupportive views towards redistribution, with changes declining from approximately from 0.68 to 0.5. Similar contrasting trends can be observed in Finland and Iceland.

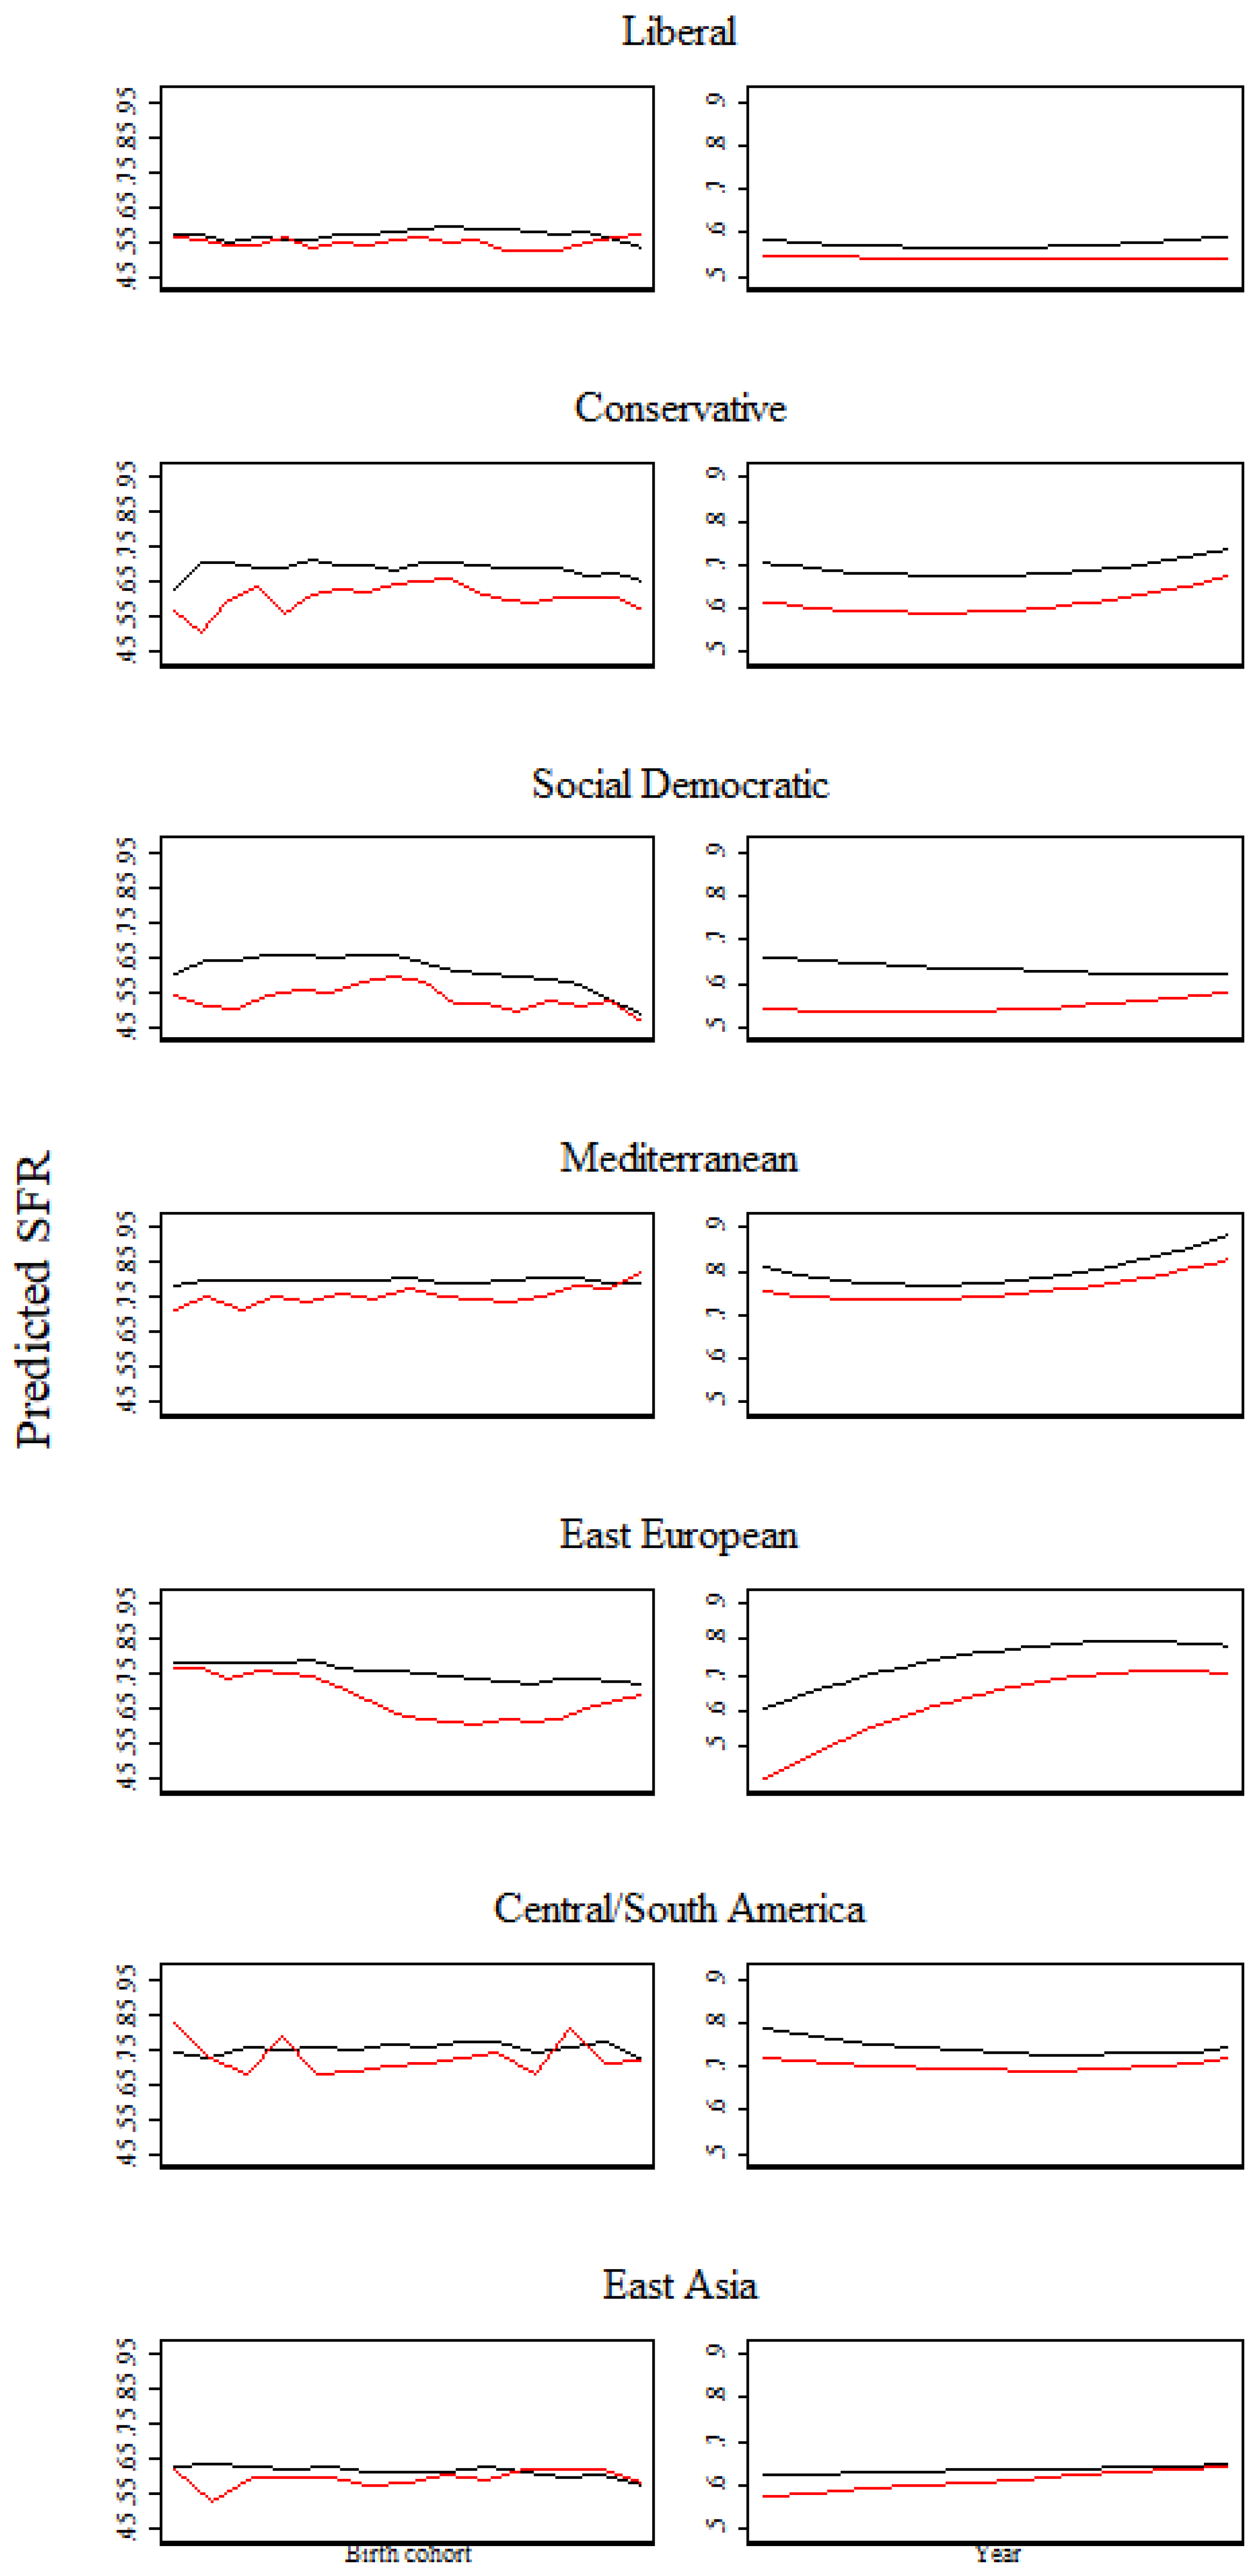
4.2. Welfare Regime Variation, by Cohort and Year

We next assess the extent of variation of SFR across four key dimensions: between-country differences, between-regime differences, SFR variation within countries across years, and across birth cohorts. Table 2 shows results.11
Of the many patterns observable in Table 2, we highlight six. Our first two points refer to the total sample. First, there is significant variation of views towards redistribution across countries. Some countries, such as the USA (0.36) and New Zealand (0.50), have low SFR, while other, Portugal (0.89), Greece (0.87), and Hungary (0.81) have very high support. The maximum range of typical SFR across countries is 0.531. Yet the US is an outlier in the sample with a particularly low SFR, and so a more reasonable anchoring range is about 0.4, between New Zealand and Portugal. Second, we observe significant variation within countries across years and across cohorts. The average range of SFR within a country across year observations is 0.21, and the average range of SFR within a country across cohorts is 0.271. Put differently, the typical country has experienced about half the spread of SFR across birth cohorts as exists across countries in the sample.
Our next point refers to the relative size of year-to-year change compared to the cohort-to-cohort change in SFR. We generally find that the magnitude of difference across birth cohorts is greater than the magnitude of change across years. For the total sample, the average difference across cohorts is 27% larger than the average difference across years. The minimum intercohort change (0.096) is twice the magnitude of the minimum year change (0.046), and the maximum intercohort change (0.875) is about 60% greater than the maximum year change (0.544). Simply put, our findings suggest that intercohort analyses may yield greater leverage for understanding SFR change than analysis across survey waves.
Fourth, we turn to comparisons within welfare regimes. We observe expected variation of levels of SFR across regimes: Liberal countries have the lowest average SFR, while Mediterranean countries have the highest. However, in Liberal, Social Democratic, and East European regimes, we observe greater variation of country average SFR within regimes than we observe on average across all regimes. For example, the range of SFR within the Nordic regime is 0.3, while the range of regime SFR is 0.24. Our results thus reflect the tentative conclusions of previous cross-national SFR research: regime-based analyses reveal expected differences, but these differences are somewhat minor and co-reside along substantial heterogeneity (e.g., [28]).
Fifth, how do interyear and intercochort changes in SFR compare across welfare regimes? In Liberal, Social Democratic, East European, Central/South American, and East Asian countries, we observe larger average variation of SFR across cohorts than across years. Mean cohort changes are 16% larger in Liberal regimes, 56% in East European regimes, and 87% in Social Democratic regimes. In Conservative and Mediterranean regimes, the magnitudes are roughly equivalent, as year changes are 13.5% larger in Conservative regimes and 12% larger in Mediterranean regimes. Overall, these findings point to Liberal, Social Democratic, and East European regimes as locations of particularly large intercohort changes in SFR, relative to year changes.
Finally, we compare the magnitude of within-country intercohort changes to variation of country averages within regimes. Simply put, in nearly all cases, we observe as much or more variation of SFR across birth cohorts in a single country than we observe variation across countries in a single regime. The only exception is Liberal regimes. However, the differences across countries is slightly exaggerated due to the particularly low level of SFR in the United States. Similarly, the typical variation across cohorts within a single country is greater than the typical variation of SFR across regimes. In total, these results highlight the importance of dynamic variation of SFR across generations within a single country. There is typically as much, if not more, variation in attitudes towards redistribution across older and younger Swedes, for example, than there is between Liberal and Social Democratic residents.

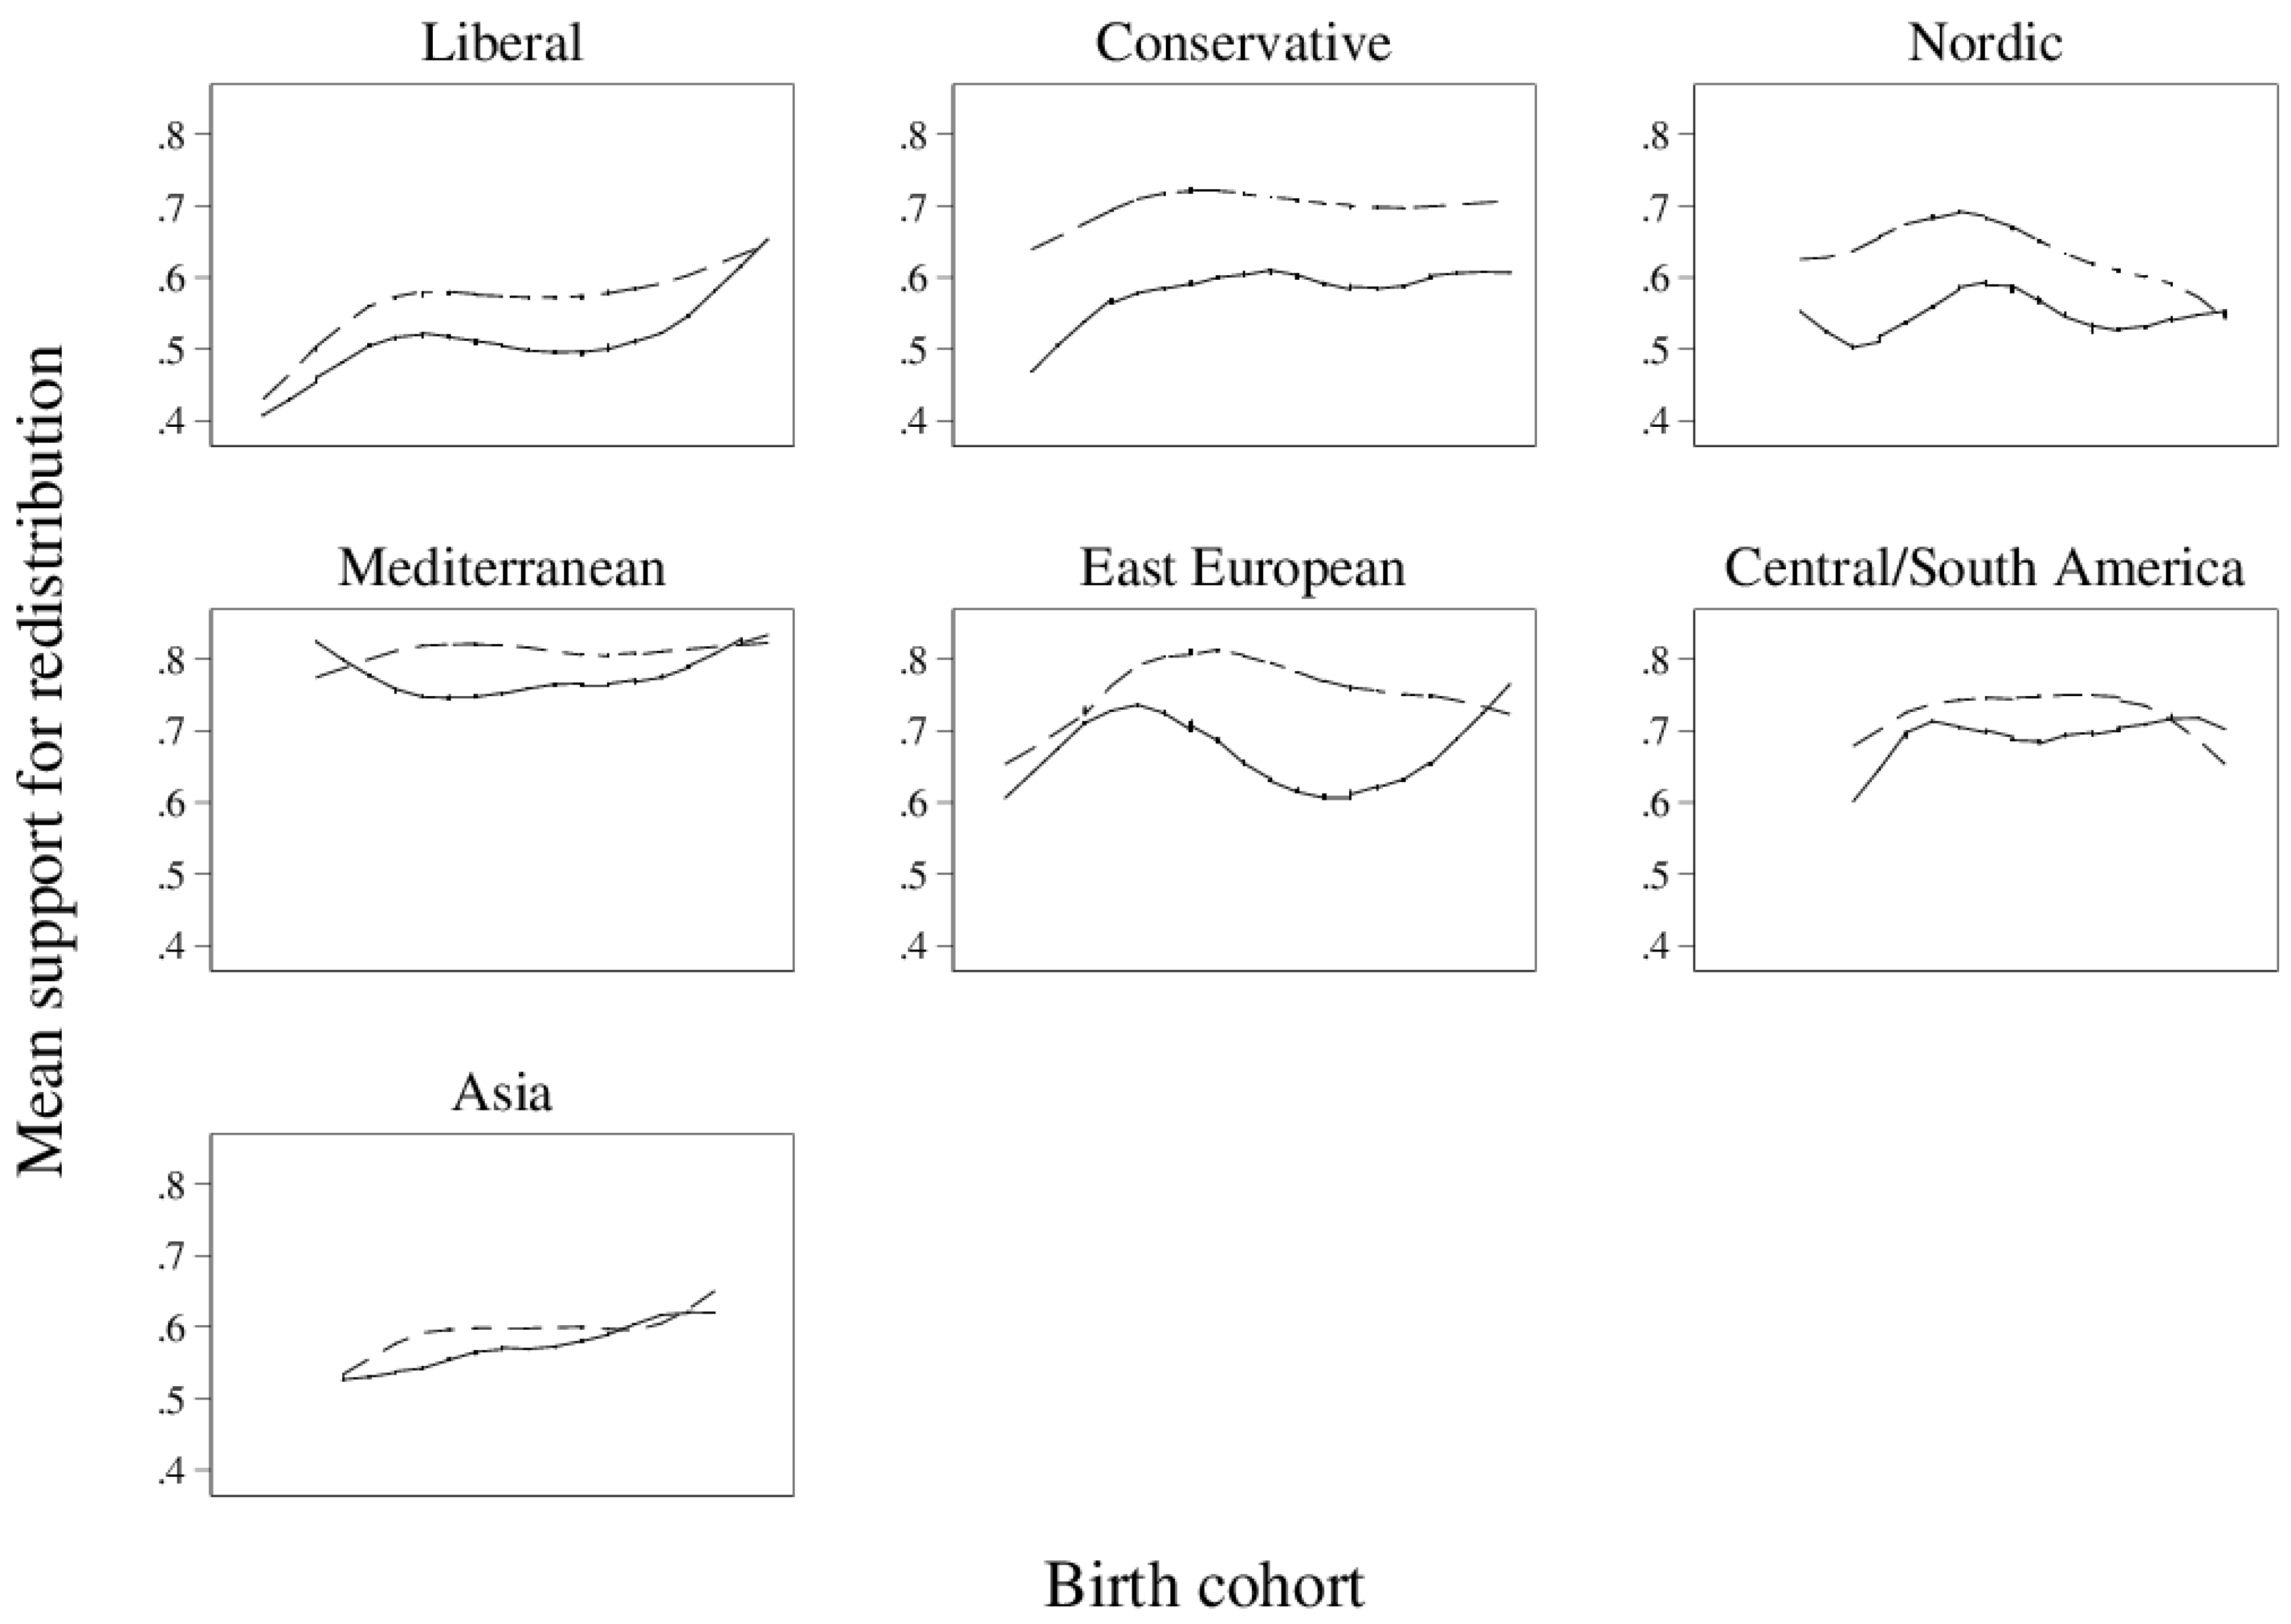
4.3. Education Cohort Trends

The following results examine changes in SFR across individuals with more and less educational attainment. To assess the utility of assessing SFR across cohorts, we first visualize locally weighted regression (LOWESS) line across samples by year. Figure 2 shows results for all countries in the sample, and Figure 3 shows results separately by welfare regime. Figure 2 shows slight but observable convergence of SFR across educational levels. Less educated individuals have higher SFR, with gaps across years ranging from about 0.08 to 0.12. SFR was relatively low and stable between the mid-1980s and early 1990s. SFR rose considerably between around 1995 and 2010 (0.47 to 0.64 for highly educated respondents) and has subsequently declined, from about 0.65 to 0.6 for highly educated respondents, and 0.75 to about 0.72 for less educated respondents. Notably, the education gap remained relatively constant from 2000 onward.
Figure 3 shows SFR trends separately by welfare regime. We observe SFR to have substantially risen in Liberal regimes from the 1990s onwards, with little convergence between education levels. Similarly, SFR rose over time among Conservative regimes, with a slight convergence across educational levels due to the more rapid growth of more highly educated respondents. In Nordic countries, SFR of less educated respondents remained relatively stable until recent years, in which it grew, and we observe a rapid and growing level of WFR among Nordic highly educated respondents. Mediterranean SFR follows a u-shaped pattern across educational groups, with convergence between less and more educated respondents in the most recent years, while East European SFR grew rapidly over time until recent years, in which SFR has declined substantially for both more and less educated individuals.12 We observe little difference across educational attainment level in East Asian countries. SFR has risen substantially in East Asian countries, from approximately 0.4 to 0.65. Central and South American countries went through a u-shaped pattern in SFR, but remained at relatively high levels of around 0.6 to 0.7.
In total, results from Figure 2 and Figure 3 suggest a few general trends for SFR. First, we observe a consistent cap in Liberal, Conservative, and East European regimes, convergence in the most recent years in Nordic and Mediterranean regimes, and little educational difference in East Asia. Second, with the exception of recent years in East Europe, we generally observe rising SFR among more and less educated individuals over time. In total, an assessment of educational differences in SFR across yearly samples of counties suggests rising SFR across education groups, and a sizable education gap in most years and regimes, with less educated respondents more supportive.
We now turn attention to intercohort change in SFR, presented in Figure 4 and Figure 5. These figures present locally weighted regression (LOWESS) lines plotting cohort-specific mean SFR by birth cohort, with means computed separately between those with a tertiary degree or more, and those with less than a tertiary degree. The solid line represents more educated, and the dashed line, less educated, cohort trends. Figure 4 shows trends for the entire sample, while Figure 5 shows trends separately by regime type.
Figure 4 clearly shows a convergence in SFR across educational attainment in more recent cohorts. This convergence is driven by the increase in SFR among more educated individuals and the stability of SFR among less educated individuals. For cohorts born between 1900 and 1934, SFR increased at similar magnitudes for both more and less educated individuals, by around 0.15. Yet a consistent gap of roughly 0.1 remained between individuals at different education levels. For cohorts born after 1935, SFR for less educated individuals declined modestly, while SFR for more educated respondents born in 1970 and onward has steadily increased, from about 0.6 to 0.7. Among the youngest birth cohorts, there is little difference in SFR between more and less educated individuals.
Figure 5 replicates the LOWESS regression lines separately by welfare regime. We observe significant heterogeneity across regimes in the intercohort trends of SFR by educational attainment. In the Liberal regime, SFR rose and stabilized across less educated individuals and declined slightly among more educated individuals. Then, SFR has increased rapidly among more educated individuals in younger cohorts, so that more educated individuals in the youngest cohorts have slightly higher SFR than less educated individuals. Among Conservative regime countries, more educated individuals in older cohorts increased in SFR more rapidly than their less educated counterparts, so that the education gap shrunk from about 0.2 to 0.1. Since then, cohorts have changed little in SFR, and the education gap has remained. Nordic country intercohort trends differ markedly from year trends. SFR among more educated individuals has fluctuated around a level of 0.55 for all birth cohorts, while SFR has collapsed among more recently born cohorts. As with Liberal regime countries, SFR has converged among Nordic countries, but in contrast to Liberal regimes, convergence has occurred through declining SFR of less educated individuals, not rising SFR of more educated individuals. In Mediterranean countries, SFR among less educated individuals remained relatively high and constant across birth cohorts, while SFR for more educated individuals has followed a u-shaped pattern. We observe convergence in SFR among younger and older Mediterranean cohorts. In East European countries, SFR rose then declined among less educated individuals, while it rose, declined, and rose again among more educated individuals. As with those in the Liberal regime, more educated individuals in East European countries in the youngest cohorts have higher SFR than less educated individuals in the youngest cohort.
Across these patterns, a few general trends are notable. First, SFR has remained stable or declined among less educated individuals in all regimes except the Liberal regime and East Asian countries. Second, trends over time do not capture many of the dynamics that occur across cohorts. We observe convergence in SFR across educational attainment levels in all regimes except the Conservative regime. Third, significant variation of trends occurs across regimes. Perhaps most notable is the rapid decline of SFR among Nordic countries. On the one hand, this collapse might signal a changing meaning of SFR questions among Nordic countries, which have taken some of the most effective and expansive action against market-led inequality growth. Results might signify that standard question wording of SFR might not appropriately apply in low inequality regimes. On the other hand, if results reflect true attitudinal changes among younger cohorts, then these changes might signify future potential political struggles for political actors hoping to maintain the robust welfare systems of Nordic countries. These results also challenge implications in Figure 2 of broadly supportive publics and consistently detectable education gaps.
Are these results driven by age differences across sampled cohorts? Perhaps educational groups differ little among younger ages, but cohorts are sampled at different mean ages. To partially account for this possibility, we replicate Figure 2 and Figure 4 in Figure 6, estimating separate LOWESS lines among older aged individuals (aged 55 and older) and younger aged individuals (aged 35 and younger).
Overall, patterns presented in Figure 6 do not suggest that our results are confounded by age differences. Among younger respondents across cohorts (left panel), we observe a convergence of SFR from about 0.13 (1950–1954) to 0.03 (1995–2001), driven primarily by the rapid increase in SFR among more educated respondents. In contrast, in our yearly sample (right panel), we observe a slight convergence of SFR among younger individuals from years 2012 onward, with the education gap changing from approximately 0.08 to 0.04. We also observe a convergence in SFR among older individuals over time, from about 0.15 in 1990 to 0.075 in 2012. Again, we highlight the contrasting results across these methods of analysis. In an analysis of change over survey waves, we conclude a shared convergence in SFR across older and younger age groups, albeit at substantially different starting points. In contrast, we only observe convergence among the youngest cohorts when examining changes across birth cohorts. Interestingly, when examining results by cohort, we observe educational gaps of roughly the same magnitude among the few cohorts where these age groups overlap (1950–1960). In contrast, results in the right panel suggest a uniformly larger education gap among older individuals.

4.4. Comparison of Multilevel Models

We end analyses by assessing the predicted education gap in SFR when modeling changes across birth cohorts and changes across years. Results are presented in Figure 7 and Figure 8. Figure 7 shows the predicted levels of SFR by education category, by welfare regime, following cross-classified and three-level regression models. Figure 8 shows the predicted difference in SFR by educational attainment across cohorts (left column) and years (right column).
From the many patterns that are notable in Figure 7 and Figure 8, we highlight one main conclusion. Aside from East Asian countries, standard three-level models suggest the presence of a consistent and statistically significant gap in SFR between more and less educated respondents. Across all regimes, higher educated respondents have lower SFR than less educated respondents. While there is some movement in some regimes in the magnitude of the difference, the overarching story is one of a constant and constantly detectable education gap. In Liberal and Mediterranean countries, this gap appears to have expanded in recent years. These results strongly support the argument that education represents a difference in self-interested material standing. However, a focus on cohort change reveals starkly different conclusions. Perhaps most importantly, we largely observe a convergence of SFR between education groups in younger cohorts in all regimes except for the Conservative regime. In Liberal, Social Democratic, Mediterranean, Central/South American, and East Asian countries, an education gap in SFR is not the constant suggested in the three level models, but rather due to a temporary large gap among middle birth cohorts in our sample. We find the convergence of these trends interesting because they largely occur during an era where higher education tends to associate with a greater likelihood of connection to the high payoffs of high inequality regimes. Thus, cohort analyses yield support for the second mechanism of education, that of value transmission and socialization.

5. Discussion

Where, and when, do attitudes towards inequality change? The answer to this question reveals changing value systems in publics, is potentially consequential for policy change, and highlights an important cultural dimension of the contemporary upswing of economic inequality experienced in many high-income countries.
Our results highlight the utility of examining support for redistribution (SFR) change across birth cohorts. The choice of assessing change across years or change across birth cohorts frequently yields contradicting conclusions. Indeed, we occasionally observe substantially declining SFR among countries with seemingly stable levels from one year to the next, and we draw substantially different conclusions about the temporal nature of educational differences in SFR.
Our findings can be summarized by four main points. First, examination of country-specific trends reveals that a focus on intercohort or yearly change results in contradictory conclusions about changing SFR in a population, sometimes. Some countries, like the United Kingdom, Spain, New Zealand, and Ireland, have similar SFR trends whether one focuses on intercohort change or year-to-year change. Others, like the United States, Sweden, The Netherlands, and Finland, result in substantially different conclusions. These findings highlight the importance of the researcher’s decision in how SFR change should be measured. Significant changes in a country’s value system might be masked when focusing on an aggregate population, with SFR change across generations masked by concurrent population changes in the age distribution, for example. This is not an argument against the assessment of SFR across years. Rather, it highlights the need to be explicit in how one conceptualizes attitudinal change, and to understand the potential tradeoffs of one choice over another.
Second, we find that the assessment of SFR as structured by welfare regimes can be somewhat useful. However, we are skeptical that historical legacies of social welfare policies, political victories, and institutional configurations “lock in” public values towards state redistribution. Indeed, we routinely find greater change across cohorts and across years within countries than we find across typical levels of SFR across regimes. Put differently, the typical values held by Swedes among older and younger birth cohorts tend to be more different than the typical values held by Social Democratic and Liberal individuals. Of course, regime variation can help reveal heterogeneity in SFR, as we showed in our assessment of educational cleavages. However, we conclude that regime differences, as they relate to SFR, are best understood as descriptive tools, and great care must be made to understand the variation of values occurring within these regimes.
Third, we draw substantively different conclusions in the relationship between education and SFR depending on whether we focus on year-to-year or intercohort changes. When focusing on year changes, we observe a constant cleavage in SFR across educational categories co-occurring with a broadly shared rise in SFR. When we focus on birth cohorts, we observe the disappearance of the education-based gap among younger cohorts. When assessing these changes across welfare regimes, we observe a few critical caveats to these general trends. The education cleavage remains in Conservative regimes. The education cleavage disappears due to rapidly growing SFR among more educated individuals in Liberal and East European regimes, and the education cleavage disappears due to rapidly falling SFR among less educated individuals in Nordic regimes. Tentatively, we conclude that more educated individuals exposed to greater inequality in Liberal and East European regimes potentially have more tolerant views regarding the complexity and consequences of inequality growth, leading to greater desire for state redistribution, in spite of the potential immediate economic consequences they face.
We believe this conclusion is particularly consequential for future SFR research. Particularly, we are able to draw different conclusions about the mechanisms linking educational attainment and SFR based on whether we take a focus on year-to-year or cohort-to-cohort changes. When we estimate standard three-level regression models and examine educational gaps in SFR across years, we observe a durable gap between those with and without a tertiary degree. Such a finding provides support for a reading of individuals weighting the costs and benefits of redistribution differently based on their likely economic standing. Yet the intercohort analyses reveal a convergence of educational attitudes during a time of divergent economic fortunes across individuals with and without a tertiary degree. We believe that these results strongly support the argument that educational attainment provides socialization into tolerant and equitable value systems and potentially provides individuals with the conceptual skills to understand the full stakes of the contemporary rise of inequality. These arguments need testing in future research. Yet they highlight a critical point of this manuscript: future scholarship on cross-national attitudes needs to take special care in how change is to be measured, as different choices can result in different supported mechanisms.
Fourth, our results highlight potential challenges faced by proponents of egalitarian politics in Nordic countries. When we examine SFR across years we observe stable and slightly rising SFR in this regime. However, these year-to-year trends mask plummeting support among younger populations, particularly less educated individuals. These findings might be interpreted in two ways. First, younger generations in Nordic countries might be growing in antagonism against the broad system of welfare protection. This might be motivated by such factors as migration and the growing national and ethnic diversity in these countries [9]. Alternatively, these changing responses might reflect the inadequacy of traditional SFR questions to measure inequality attitudes in highly interventionist and low inequality states. Perhaps younger generations in Nordic countries would have extremely high levels of SFR were they to live in the high inequality Liberal regime. Their responses might be primed by a satisfaction of the current level of state policies and decommodifying insurance programs. Experimental vignette surveys conducted cross-nationally, like those done by Aaroe and Petersen [62], are needed to better understand the meaning of public opinion questions across different country contexts.
Our research addressed an important gap in the literature on cross-national inequality attitudes: a dearth of research on intercohort changes. We have addressed this gap by both showing the utility of considering SFR in a birth cohort context, and by providing descriptive knowledge of intercohort changes in SFR across several individual and country social groupings. Future work that merges multilevel (e.g., [8,10]) or macrolevel (e.g., [3,5]) regression analyses applied specifically to intercohort SFR change is needed.
One potentially useful multilevel analysis would be an analysis of intercohort SFR in relation to inequality change and typical inequality levels. Our results are suggestive that inequality growth might be important in understanding why some younger cohorts are more supportive of state redistribution, but that these changes might be restricted to state contexts with already high levels of inequality (e.g., [10]). Alternatively, future research on changes in migration and racial/ethnic diversity likely helps to explain variation in cohort SFR (e.g., [8,9]). Multilevel regression analyses focusing on intercohort variation would likely benefit by taking these country-level factors into account.
What might explain the regime-based variation in educational cleavages? Although it is beyond the scope of the current research to formally test this question, we below offer possible explanations. First, a cohort-based design introduces the ability to test changes in SFR across major political shocks. For example, differences might emerge among cohorts born after the Second World War, and among cohorts before and after the integration of former Soviet Union states into the global capitalist economy. Similarly, cohorts might change in their views of the state when they are born into turbulent economic times. Countries have experienced shared and distinct financial shocks, including the global financial crisis beginning in 2008, the Swedish banking rescue in the early 1990s, and the Asian financial crisis in the late 1990s. Our cohort design can be used to test changes in SFR before and after these crises. Additionally, the number of college degree holders has expanded rapidly across this sample of birth cohorts. We might find that the education cleavage changes simply through a greater proportion of the population holding a college degree. The variation across countries in terms of college attainment levels and trajectories allows for this test.
In total, our research reveals the benefits of assessing SFR in an intercohort framework. Conclusions about the relative change, or lack thereof, of views towards state redistribution depend on how one conceptualizes change. Economic inequality, and state responses to inequality, are likely to continue to be a central social issue in high income countries, and our research points to an important and frequently overlooked dimension on how to understand how public value systems towards these important social issues have evolved in the inequality era.

Author Contributions

K.C. made significant contributions to the theoretical emphasis of the paper, the writing of the paper, and the research design of the paper. T.V. made significant contributions to the conceptualization of the project, research design, analysis, and writing of the paper.

Funding

This research received no external funding.

Conflicts of Interest

The authors declare no conflicts of interest.

References

  1. Svallfors, S. Worlds of welfare and attitudes to redistribution: A comparison of eight western nations. Eur. Sociol. Rev. 1997, 13, 283–304. [Google Scholar] [CrossRef]
  2. Linos, K.; Martin, W. Self-interest, social beliefs, and attitudes to redistribution. Re-addressing the issue of cross-national variation. Eur. Sociol. Rev. 2003, 19, 93–409. [Google Scholar] [CrossRef]
  3. Brooks, C.; Manza, J. Why Welfare States Persist: The Importance of Public Opinion in Democracies; University of Chicago Press: Chicago, IL, USA, 2008. [Google Scholar]
  4. Larsen, C.A. The institutional logic of welfare attitudes: How welfare regimes influence public support. Comp. Political Stud. 2008, 41, 45–168. [Google Scholar] [CrossRef] [Green Version]
  5. Breznau, N. The missing main effect of welfare state regimes: A replication of ‘Social policy responsiveness in developed democracies’ by Brooks and Manza. Sociol. Sci. 2015, 2, 420–441. [Google Scholar] [CrossRef]
  6. Kenworthy, L.; McCall, L. Inequality, public opinion and redistribution. Socio-Econ. Rev. 2007, 6, 35–68. [Google Scholar] [CrossRef] [Green Version]
  7. Steele, L.G. Income Inequality, Equal Opportunity, and Attitudes about Redistribution. Soc. Sci. Q. 2015, 96, 444–464. [Google Scholar] [CrossRef]
  8. Steele, L.G. Ethnic Diversity and Support for Redistributive Social Policies. Soc. Forces 2016, 94, 1439–1481. [Google Scholar] [CrossRef]
  9. Breznau, N.; Maureen, A.E. Immigrant Presence, Group Boundaries, and Support for the Welfare State in Western European Societies. Acta Soc. 2016, 59, 195–214. [Google Scholar] [CrossRef]
  10. Van Heuvelen, T. Unequal views of inequality: Cross-national support for redistribution 1985–2011. Soc. Sci. Res. 2017, 64, 43–66. [Google Scholar] [CrossRef] [PubMed]
  11. Lupu, N.; Pontusson, J. The structure of inequality and the politics of redistribution. Am. Political Sci. Rev. 2011, 105, 316–336. [Google Scholar] [CrossRef]
  12. Gilens, M. Affluence and Influence: Economic Inequality and Political Power in America; Princeton University Press: Princeton, NJ, USA, 2012. [Google Scholar]
  13. Manza, J.; Brooks, C. How sociology lost public opinion: A genealogy of a missing concept in the study of the political. Sociol. Theory 2012, 30, 89–113. [Google Scholar] [CrossRef]
  14. Mau, S. The Moral Economy of Welfare States: Britain and Germany Compared; Routledge: London, UK, 2004. [Google Scholar]
  15. Brooks, C.; Manza, J. A broken public? Americans’ responses to the Great Recession. Am. Sociol. Rev. 2013, 78, 727–748. [Google Scholar] [CrossRef]
  16. Owens, L.A.; Pedulla, D.S. Material welfare and changing political preferences: The case of support for redistributive social policies. Soc. Forces 2013, 92, 1087–1113. [Google Scholar] [CrossRef]
  17. Brady, D.; Finnigan, R. Does immigration undermine public support for social policy? Am. Sociol. Rev. 2014, 79, 17–42. [Google Scholar] [CrossRef]
  18. Kuziemko, I.; Norton, M.I.; Saez, E.; Stantcheva, S. How elastic are preferences for redistribution? Evidence from randomized survey experiments. Am. Econ. Rev. 2015, 105, 1478–1508. [Google Scholar] [CrossRef]
  19. Sands, M.L. Exposure to inequality affects support for redistribution. Proc. Natl. Acad. Sci. USA 2017, 114, 663–668. [Google Scholar] [CrossRef] [PubMed]
  20. McCall, L.; Burk, D.; Laperrière, M.; Richeson, J.A. Exposure to rising inequality shapes Americans’ opportunity beliefs and policy support. Proc. Natl. Acad. Sci. USA 2017, 114, 9593–9598. [Google Scholar] [CrossRef] [PubMed] [Green Version]
  21. Deaton, A. Panel Data from Time Series of Cross-Sections. J. Econom. 1985, 30, 109–126. [Google Scholar] [CrossRef]
  22. Verbeek, M. Pseudo Panel Data. In The Econometrics of Panel Data; Advanced Studies in Theoretical and Applied Econometrics; Mátyás, L., Sevestre, P., Eds.; Springer: Dordrecht, The Neitherlands, 1996; Volume 33, pp. 280–292. [Google Scholar]
  23. Pampel, F.C.; Hunter, L.M. Cohort change, diffusion, and support for environmental spending in the United States. Am. J. Sociol. 2012, 118, 420–448. [Google Scholar] [CrossRef] [PubMed]
  24. Biegert, T. Welfare benefits and unemployment in affluent democracies: The moderating role of the institutional insider/outsider divide. Am. Sociol. Rev. 2017, 82, 1037–1064. [Google Scholar] [CrossRef]
  25. Jæger, M.M. The effect of macroeconomic and social conditions on the demand for redistribution: A pseudo panel approach. J. Eur. Soc. Policy 2013, 23, 149–163. [Google Scholar] [CrossRef]
  26. Olivera, J. Preferences for redistribution in Europe. IZA J. Eur. Lab. Stud. 2015, 4, 14. [Google Scholar] [CrossRef] [Green Version]
  27. Esping-Andersen, G. The Three Worlds of Welfare Capitalism; John Wiley & Sons: Hoboken, NJ, USA, 1990. [Google Scholar]
  28. Arts, W.; Gelissen, J. Three worlds of welfare capitalism or more? A state-of-the-art report. J. Eur. Soc. Policy 2002, 12, 137–158. [Google Scholar] [CrossRef]
  29. Kalmijn, M.; Kraaykamp, G. Social stratification and attitudes: A comparative analysis of the effects of class and education in Europe. Br. J. Soc. 2007, 585, 47–576. [Google Scholar] [CrossRef] [PubMed]
  30. Bosancianu, C.M. A Growing Rift in Values? Income and Educational Inequality and Their Impact on Mass Attitude Polarization. Soc. Sci. Q. 2017, 981, 587–1602. [Google Scholar] [CrossRef]
  31. McCall, L. The Undeserving Rich: American Beliefs about Inequality, Opportunity, and Redistribution; Cambridge University Press: Cambridge, MA, USA, 2013. [Google Scholar]
  32. Atkinson, A.B. Inequality: What Can Be Done; Harvard University Press: Cambridge, MA, USA, 2015. [Google Scholar]
  33. Van Heuvelen, T. Recovering the Missing Middle: A Mesocomparative Analysis of Within-Group Inequality, 1970–2011. Am. J. Sociol. 2018, 123, 1064–1116. [Google Scholar] [CrossRef]
  34. Bradley, D.; Huber, E.; Moller, S.; Nielsen, F.; Stephens, J.D. Distribution and redistribution in postindustrial democracies. World Politics 2003, 55, 193–228. [Google Scholar] [CrossRef]
  35. Kenworthy, L. Egalitarian Capitalism: Jobs, Incomes, and Growth in Affluent Countries; Russell Sage Foundation: New York, NY, USA, 2004. [Google Scholar]
  36. Brady, D. Rich Democracies, Poor People: How Politics Explain Poverty; Oxford University Press: Oxford, UK, 2009. [Google Scholar]
  37. Garfinkel, I.; Rainwater, L.; Smeeding, T. Wealth and Welfare States: Is America a Laggard or Leader? Oxford University Press: Oxford, UK, 2010. [Google Scholar]
  38. Gornick, J.C.; Milanovic, B. Income Inequality in the United States in Cross-National Perspective: Redistribution Revisited; LIS Center Research Brief: New York, NY, USA, 2015; pp. 1–7. [Google Scholar]
  39. Korpi, W. Power resources approach vs. action and conflict: On causal and intentional explanations in the study of power. Sociol. Theory 1985, 3, 31–45. [Google Scholar] [CrossRef]
  40. Brady, D.; Leicht, K.T. Party to inequality: Right party power and income inequality in affluent Western democracies. Res. Soc. Stratif. Mobil. 2008, 26, 77–106. [Google Scholar] [CrossRef] [Green Version]
  41. Burstein, P. American Public Opinion, Advocacy, and Policy in Congress: What the Public Wants and What It Gets; Cambridge University Press: Cambridge, MA, USA, 2014. [Google Scholar]
  42. Van Heuvelen, T. The religious context of welfare attitudes. J. Sci. Study Relig. 2014, 53, 268–295. [Google Scholar] [CrossRef]
  43. Shu, X.; Meagher, K.D. Beyond the Stalled Gender Revolution: Historical and Cohort Dynamics in Gender Attitudes from 1977 to 2016. Soc. Forces 2017, 31, 243–1274. [Google Scholar] [CrossRef]
  44. Fiel, J.E.; Zhang, Y. Three Dimensions of Change in School Segregation: A Grade-Period-Cohort Analysis. Demography 2018, 55, 33–58. [Google Scholar] [CrossRef] [PubMed]
  45. Svallfors, S. (Ed.) Contested Welfare States: Welfare Attitudes in Europe and Beyond; Stanford University Press: Redwood, CA, USA, 2012. [Google Scholar]
  46. Sachweh, P.; Olafsdottir, S. The welfare state and equality? Stratification realities and aspirations in three welfare regimes. Eur. Sociol. Rev. 2010, 28, 149–168. [Google Scholar] [CrossRef]
  47. Kahl, S. The religious roots of modern poverty policy: Catholic, Lutheran, and Reformed Protestant traditions compared. Eur. J. Soc. 2005, 46, 91–126. [Google Scholar] [CrossRef]
  48. Van Kersbergen, K.; Manow, P. (Eds.) Religion, Class Coalitions, and Welfare States; Cambridge University Press: Cambridge, UK, 2009. [Google Scholar]
  49. Castles, F.G.; Leibfried, S.; Lewis, J.; Obinger, H.; Pierson, C. (Eds.) The Oxford Handbook of the Welfare State; OUP Oxford: Oxford, UK, 2012. [Google Scholar]
  50. Huber, E.; Bogliaccini, J. Latin America. In The Oxford Handbook of the Welfare State; Castles, F.G., Leibfried, S., Lewis, J., Obinger, H., Pierson, C., Eds.; OUP Oxford: Oxford, UK, 2012. [Google Scholar]
  51. Peng, I.; Wong, J. East Asia. In The Oxford Handbook of the Welfare State; Castles, F.G., Stephan, L., Jane, L., Herbert, O., Christopher, P., Eds.; OUP Oxford: Oxford, UK, 2012. [Google Scholar] [Green Version]
  52. Van Oorschot, W. Making the difference in social Europe: Deservingness perceptions among citizens of European welfare states. J. Eur. Soc. Policy 2006, 16, 23–42. [Google Scholar] [CrossRef]
  53. Thelen, K. Varieties of Liberalization and the New Politics of Social Solidarity; Cambridge University Press: Cambridge, UK, 2014. [Google Scholar]
  54. Busemeyer, M.R.; Achim, G.; Simon, W. Attitudes towards redistributive spending in an era of demographic ageing: The rival pressures from age and income in 14 OECCD countries. J. Eur. Soc. Policy 2009, 191, 95–212. [Google Scholar] [CrossRef]
  55. Hayes, T.J. Do Citizens Link Attitudes with Preferences? Economic Inequality and Government Spending in the “New Gilded Age”. Soc. Sci. Q. 2013, 954, 68–485. [Google Scholar] [CrossRef]
  56. Wodtke, G.T. Are smart people less racist? Verbal ability, anti-black prejudice, and the principle-policy paradox. Soc. Prob. 2016, 63, 21–45. [Google Scholar] [CrossRef] [PubMed]
  57. Federico, C.M. When Do Welfare Attitudes Become Racialized? The Paradoxical Effects of Education. Am. J. Political Sci. 2004, 483, 74–391. [Google Scholar] [CrossRef]
  58. Heerwig, J.A.; Brian, J.M. Education and Social Desirability Bias: The Case of a Black Presidential Candidate. Soc. Sci. Q. 2009, 906, 74–686. [Google Scholar] [CrossRef]
  59. Stubager, R. Education effects on authoritarian-liberatian values: A question of socialization. Br. J. Sociol. 2008, 59, 327–350. [Google Scholar] [CrossRef] [PubMed]
  60. Werfhorst, H.G.V.D.; Graaf, N.D.D. The sources of political orientations in post-industrial society: Social class and education revisited. Br. J. Sociol. 2004, 55, 211–235. [Google Scholar] [CrossRef] [PubMed]
  61. Nawrotzki, R.J.; Pampel, F.C. Cohort change and the diffusion of environmental concern: A cross-national analysis. Popul. Environ. 2013, 35, 11–25. [Google Scholar] [CrossRef] [PubMed]
  62. Aarøe, L.; Petersen, M.B. Crowding out culture: Scandinavians and Americans agree on social welfare in the face of deservingness cues. Int. J. Politics 2014, 76, 684–697. [Google Scholar] [CrossRef]
1
Another benefit of regime-based analyses is that regimes provide time-invariant country groups. A shift to the study of intercohort SFR change introduces important challenges in country-level measurement. For example, consider a college-educated individual born in 1940 who offers their view on SFR in 1995. At what time point should the country-level variable be measured? Any of 1940 (year of birth), 1962 (approximate year of labor market entry), or 1995 (date of survey administration) seem reasonable decisions. Future work is needed to determine the optimal method of measurement.
2
Of course, educational attainment is not the only characteristic that might be of interest for an intercohort analysis. We focus on it primarily because it is a durable indicator of socioeconomic status and has been widely examined in previous SFR research. We hope that future research extends our focus to other important microlevel characteristics.
3
Education is a particularly useful indicator of social class for the current study. With some exception, educational attainment tends to be fairly stable across the adult life course, unlike income or employment. We can therefore examine cohort differences by educational attainment without concern that different individuals may be in different groups based on the year of survey administration.
4
Early and later cohorts include longer bands to account for small sample sizes.
5
We make survey- and country-specific adjustments to be approximate a uniform measurement of tertiary educational attainment.
6
We do not have strong theoretical expectations for how SFR should vary across these regions. We thus examine them inductively.
7
A benefit of welfare regimes is that they are time invariant. We can thus measure cohort change in a similar grouping across individuals born decades apart. Other country-level variables, such as GDP per capita, introduce difficulties in comparison. For example, Poland cohorts are difficult to classify, as younger cohorts were born into a high income country, and older cohorts were born into a lower-middle income country.
8
This measure is the country-specific standardized measure of income, with a mean of zero. Missing values are imputed at zero and a binary indicator indicates respondents with missing income values.
9
We use a linear probability modeling strategy in both cases to ease the complexity of estimating cross-classified regression models.
10
This decline is 9% the magnitude of the maximum between-country difference in mean-SFR, discussed below.
11
In these results, we restrict samples to countries with four or more observations to compare cohort and year changes.
12
It is important to note that Eastern Europe is a widely heterogeneous set of countries. Some of these results might be due to the combination of different trajectories into a single category. Future work that focuses specifically on the heterogeneity of East Europe is needed.
Figure 1. Year/birth cohort locally weighted regression (LOWESS) against support for redistribution, 21 select countries. Note: solid line = LOWESS for year. Dashed line = LOWESS for birth cohort.
Societies 08 00069 g001
Figure 2. Locally weighted (LOWESS) regression lines, support for redistribution (SFR) against year, by education, total sample.
Societies 08 00069 g002
Figure 3. Locally weighted (LOWESS) regression lines, support for redistribution (SFR) against year, by education, by welfare regime.
Societies 08 00069 g003
Figure 4. Locally weighted (LOWESS) regression lines, support for redistribution (SFR) against birth cohort, by education, total sample.
Societies 08 00069 g004
Figure 5. Locally weighted (LOWESS) regression lines, support for redistribution (SFR) against birth cohort, by education, by welfare regime.
Societies 08 00069 g005
Figure 6. Locally weighted (LOWESS) regression lines, support for redistribution (SFR) against year (left panel) and birth cohort (right panel), by age.
Societies 08 00069 g006
Figure 7. Predicted SFR from cross-classified and three-level mixed effects regression models. Note: Red line is higher education, black line is lower education. Cohort models interact a categorical version of birth cohort with education. Year models interact a squared version of year and education variables. Same results are found if a squared version of cohort is used instead in the left column.
Societies 08 00069 g007
Figure 8. Education gap from cross-classified and three-level mixed effects regression model. Notes: Lines indicate the difference in SFR between educational attainment levels. Shaded areas indicate 95% confidence intervals. Modeling decisions and conclusions from sensitivity analyses are the same as those described in the notes of Figure 7.
Societies 08 00069 g008
Table 1. Descriptive statistics.
MeanSDMinMax
Liberal regime 1
Support for redistribution (SFR)0.57 01
Year2000.318.7819852017
Birth year1952.8618.7819002001
Has tertiary degree0.20 01
n = 114,189
Conservative regime
SFR0.68 01
Year2004.468.0819852016
Birth year1957.2918.9619002001
Has tertiary degree0.18 01
n = 186,622
Nordic regime
SFR0.62 01
Year2005.996.6919872016
Birth year1959.0618.4919052001
Has tertiary degree0.25 01
n = 92,595
Mediterranean regime
SFR0.81 01
Year2003.876.9619852013
Birth year1956.8018.8619031998
Has tertiary degree0.13 01
n = 74,607
East European regime
SFR0.75 01
Year2005.007.6219872017
Birth year1958.5418.8419002001
Has tertiary degree0.16 01
n = 200,083
Central/South America
SFR0.74 01
Year2005.684.2819982011
Birth year1962.6817.6119061993
Has tertiary degree0.09 01
n = 19,356
Asia
SFR0.62 01
Year2003.316.3919912010
Birth year1959.5217.1719021994
Has tertiary degree0.16 01
n = 36,246
1 Liberal regime countries: Australia, Canada, Ireland, New Zealand, United Kingdom, and United States. Conservative countries: Austria, Belgium, France, (West/East) Germany, Israel, Luxembourg, The Netherlands, Switzerland. Nordic countries: Denmark, Finland, Norway, and Sweden. Mediterranean countries: Cyprus, Greece, Italy, Portugal, and Spain. East European countries: Albania, Bulgaria, Croatia, Czech Republic, Estonia, Hungary, Latvia, Lithuania, Poland, Romania, Russian Federation, Slovakia, Slovenia, Turkey, Ukraine, and Kosovo. Central/South America countries: Argentina, Chile, Dominican Republic, Mexico, Uruguay, and Venezuela. Asia: China, Japan, Philippines, South Korea, and Taiwan.
Table 2. Range of mean support for distribution by regime.
RegimeMeanSDMinMaxMax-Min
Liberal0.573
  Mean country SFR0.5510.1440.3570.7360.379
  Within country year SFR range0.2390.0290.1960.2710.075
  Within country birth cohort SFR range0.2780.1400.1080.5290.422
Conservative0.672
  Mean country SFR0.6980.0790.5840.7970.213
  Within country year SFR range0.2350.1410.0700.5170.447
  Within country birth cohort SFR range0.2070.0710.1250.3640.239
Social Democratic0.619
  Mean country SFR0.6310.1210.4360.7370.301
  Within country year SFR range0.1590.0820.0570.2680.211
  Within country birth cohort SFR range0.2980.0580.2350.3690.134
Mediterranean0.811
  Mean country SFR0.8140.0710.7130.8880.175
  Within country year SFR range0.1900.1110.0980.3610.263
  Within country birth cohort SFR range0.1720.0580.0960.2540.158
East European0.746
  Mean country SFR0.7560.0760.5760.8500.274
  Within country year SFR range0.2180.1300.0460.5440.498
  Within country birth cohort SFR range0.3410.2220.1080.8750.768
Central/South America0.735
  Mean country SFR0.7160.0720.6330.7870.154
  Within country year SFR range0.1470.1980.0230.3890.366
  Within country birth cohort SFR range0.2800.1400.2630.3000.037
East Asia0.586
  Mean country SFR0.6270.1280.5010.7440.243
  Within country year SFR range0.1810.1830.0340.3120.278
  Within country birth cohort SFR range0.4300.2000.3260.5300.204
Range of regime-mean SFR0.238
Total sample: Mean country SFR0.6910.1270.3570.8880.530787
Total sample: Within country year SFR range0.2200.1110.0460.5440.498074
Total sample: Within country year SFR range0.2650.1510.0960.8750.779352

