
Change of Direction Speed and Technique Modification Training Improves 180° Turning Performance, Kinetics, and Kinematics

 ,
,  ,
,  and
and 
Abstract
1. Introduction
2. Materials and Methods
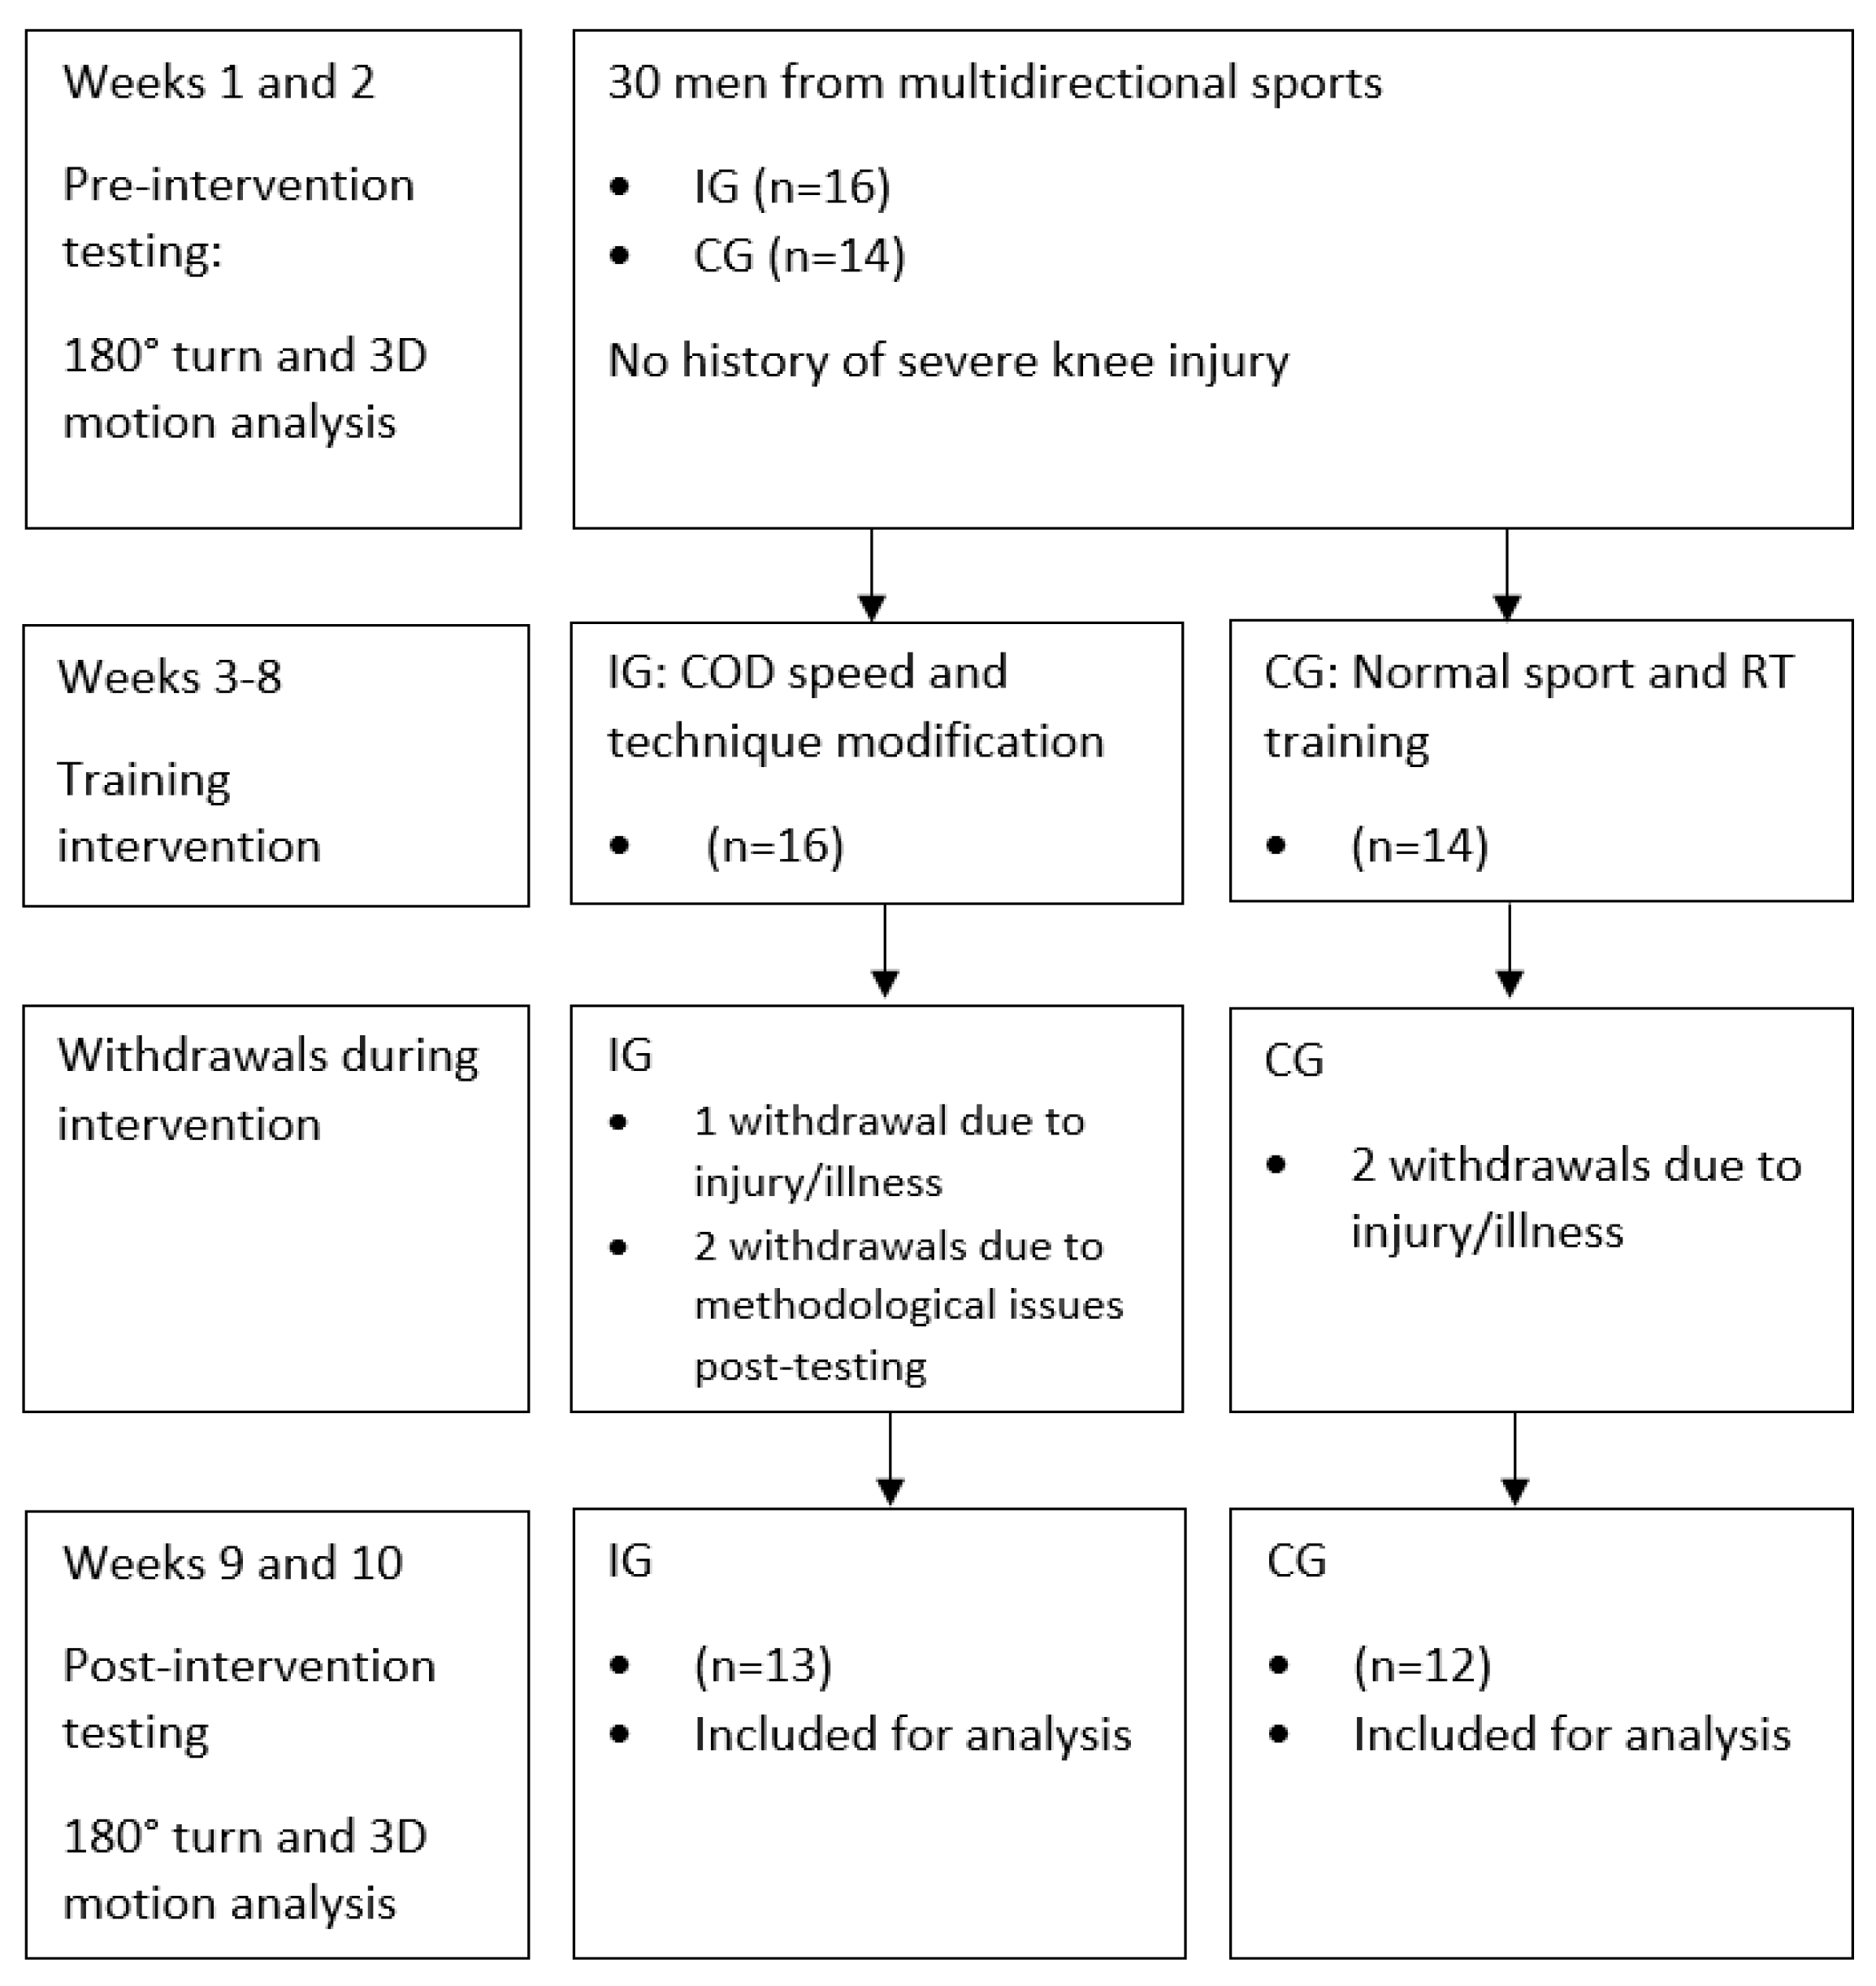
2.1. Research Design
2.2. Subjects
2.3. Procedures
2.3.1. Turning Biomechanical Variables
2.3.2. The 6 Week COD Speed and Technique Modification Training Intervention
2.4. Statistical Analyses
3. Results
4. Discussion
5. Conclusions
Supplementary Materials
Author Contributions
Funding
Institutional Review Board Statement
Informed Consent Statement
Data Availability Statement
Acknowledgments
Conflicts of Interest
References
- Nimphius, S. Training change of direction and agility. In Advanced Strength and Conditioning; Turner, A., Comfort, P., Eds.; Routledge: Oxon, UK, 2017; pp. 291–308. [Google Scholar]
- DeWeese, B.H.; Nimphius, S. Program Design Technique for Speed and Agility Training. In Essentials of Strength Training and Conditioning; Haff, G.G., Triplett, N.T., Eds.; Human Kinetics: Champaign, IL, USA, 2016; pp. 521–558. [Google Scholar]
- Dos’Santos, T.; McBurnie, A.; Thomas, C.; Comfort, P.; Jones, P.A. Biomechanical Comparison of Cutting Techniques: A Review and Practical Applications. Strength Cond. J. 2019, 41, 40–54. [Google Scholar] [CrossRef]
- Bloomfield, J.; Polman, R.; Donoghue, P. Physical demands of different positions in FA Premier League soccer. J. Sports Sci. Med. 2007, 6, 63–70. [Google Scholar] [PubMed]
- Sweeting, A.J.; Aughey, R.J.; Cormack, S.J.; Morgan, S. Discovering frequently recurring movement sequences in team-sport athlete spatiotemporal data. J. Sports Sci. 2017, 35, 2439–2445. [Google Scholar] [CrossRef] [PubMed]
- Slaughter, P.R.; Adamczyk, P.G. Tracking Quantitative Characteristics of Cutting Maneuvers with Wearable Movement Sensors during Competitive Women’s Ultimate Frisbee Games. Sensors 2020, 20, 6508. [Google Scholar] [CrossRef]
- Duffield, R.; Drinkwater, E.J. Time–motion analysis of test and one-day international cricket centuries. J. Sports Sci. 2008, 26, 457–464. [Google Scholar] [CrossRef]
- Nimphius, S.; Callaghan, S.J.; Bezodis, N.E.; Lockie, R.G. Change of Direction and Agility Tests: Challenging Our Current Measures of Performance. Strength Cond. J. 2017, 40, 26–38. [Google Scholar] [CrossRef]
- Nimphius, S.; Geib, G.; Spiteri, T.; Carlisle, D. “Change of direction deficit” measurement in Division I American football players. J. Aust. Strength Cond. 2013, 21, 115–117. [Google Scholar]
- Fairchild, B.; Amonette, W.; Spiering, B. Prediction models of speed and agility in NFL combine attendees. J. Strength Cond. Res. 2011, 25, S96. [Google Scholar] [CrossRef]
- Jones, P.A.; Thomas, C.; Dos’Santos, T.; McMahon, J.; Graham-Smith, P. The Role of Eccentric Strength in 180° Turns in Female Soccer Players. Sports 2017, 5, 42. [Google Scholar] [CrossRef]
- Spiteri, T.; Newton, R.U.; Binetti, M.; Hart, N.H.; Sheppard, J.M.; Nimphius, S. Mechanical determinants of faster change of direction and agility performance in female basketball athletes. J. Strength Cond. Res. 2015, 28, 2205–2214. [Google Scholar] [CrossRef]
- Spiteri, T.; Nimphius, S.; Hart, N.H.; Specos, C.; Sheppard, J.M.; Newton, R.U. The contribution of strength characteristics to change of direction and agility performance in female basketball athletes J. Strength Cond. Res. 2014, 28, 2415–2423. [Google Scholar] [CrossRef]
- Dos’Santos, T.; Thomas, C.; Comfort, P.; Jones, P.A. The effect of angle and velocity on change of direction biomechanics: An angle-velocity trade-off. Sports Med. 2018, 48, 2235–2253. [Google Scholar] [CrossRef] [PubMed]
- Dos’Santos, T.; Thomas, C.; Comfort, P.; Jones, P.A. The Role of the Penultimate Foot Contact During Change of Direction: Implications on Performance and Risk of Injury. Strength Cond. J. 2019, 41, 87–104. [Google Scholar] [CrossRef]
- Jones, P.A.; Dos’ Santos, T.; McMahon, J.J.; Graham-Smith, P. Contribution of Eccentric Strength to Cutting Performance in Female Soccer Players. J. Strength Cond. Res. 2019. [Google Scholar] [CrossRef]
- Falch, H.N.; Rædergård, H.G.; van den Tillaar, R. Effect of Different Physical Training Forms on Change of Direction Ability: A Systematic Review and Meta-analysis. Sports Med. Open 2019, 5, 53. [Google Scholar] [CrossRef] [PubMed]
- Spiteri, T.; Cochrane, J.L.; Hart, N.H.; Haff, G.G.; Nimphius, S. Effect of strength on plant foot kinetics and kinematics during a change of direction task. Eur. J. Sports Sci. 2013, 13, 646–652. [Google Scholar] [CrossRef] [PubMed]
- Dos’Santos, T.; McBurnie, A.; Thomas, C.; Comfort, P.; Jones, P.A. Biomechanical determinants of the modified and traditional 505 change of direction speed test. J. Strength Cond. Res. 2020, 34, 1285–1296. [Google Scholar] [CrossRef] [PubMed]
- Graham-Smith, P.; Atkinson, L.; Barlow, R.; Jones, P. Braking characteristics and load distribution in 180 degree turns. In Proceedings of the 5th Annual UKSCA Conference, Wyboston Lakes, UK, 5–7 June 2009. [Google Scholar]
- Dos’Santos, T.; Thomas, C.; Jones, P.A.; Comfort, P. Mechanical determinants of faster change of direction speed performance in male athletes. J. Strength Cond. Res. 2017, 31, 696–705. [Google Scholar] [CrossRef] [PubMed]
- Dos’Santos, T.; McBurnie, A.; Comfort, P.; Jones, P.A. The Effects of Six-Weeks Change of Direction Speed and Technique Modification Training on Cutting Performance and Movement Quality in Male Youth Soccer Players. Sports 2019, 7, 205. [Google Scholar] [CrossRef] [PubMed]
- Jones, P.A.; Barber, O.R.; Smith, L.C. Changing pivoting technique reduces knee valgus moments. Free Communication. Journal of Sports Sciences. J. Sports Sci. 2015, 33, S62. [Google Scholar]
- Fox, A.S.; Bonacci, J.; McLean, S.G.; Saunders, N. Exploring individual adaptations to an anterior cruciate ligament injury prevention programme. Knee 2018, 25, 83–98. [Google Scholar] [CrossRef] [PubMed]
- Mendiguchia, J.; Conceição, F.; Edouard, P.; Fonseca, M.; Pereira, R.; Lopes, H.; Morin, J.-B.; Jiménez-Reyes, P. Sprint versus isolated eccentric training: Comparative effects on hamstring architecture and performance in soccer players. PLoS ONE 2020, 15, e0228283. [Google Scholar] [CrossRef] [PubMed]
- Faul, F.; Erdfelder, E.; Buchner, A.; Lang, A.-G. Statistical power analyses using G* Power 3.1: Tests for correlation and regression analyses. Behav. Res. Methods 2009, 41, 1149–1160. [Google Scholar] [CrossRef] [PubMed]
- Dos’Santos, T.; Comfort, P.; Jones, P.A. Average of trial peaks versus peak of average profile: Impact on change of direction biomechanics. Sports Biomech. 2020, 19, 483–492. [Google Scholar] [CrossRef]
- Cohen, J. Statistical Analysis for the Behavioral Sciences; Hillsdale Lawrance Erlbaum: Hillsdale, NJ, USA, 1988; pp. 273–403. [Google Scholar]
- Hopkins, W.G. A Scale of Magnitudes for Effect Statistics. New View Stat. 2002, 502, 411. Available online: http://sportsci.org/resource/stats/effectmag.html (accessed on 14 March 2021).
- Hopkins, W.G. Measures of reliability in sports medicine and science. Sports Med. 2000, 30, 1–15. [Google Scholar] [CrossRef] [PubMed]
- Welch, N.; Richter, C.; Franklyn-Miller, A.; Moran, K. Principal Component Analysis of the Associations between Kinetic Variables in Cutting and Jumping, and Cutting Performance Outcome. J. Strength Cond. Res. 2019. published ahead of print. [Google Scholar] [CrossRef]
- Winkelman, N.C. Attentional Focus and Cueing for Speed Development. Strength Cond. J. 2018, 40, 13–25. [Google Scholar] [CrossRef]
- King, E.; Franklyn-Miller, A.; Richter, C.; O’Reilly, E.; Doolan, M.; Moran, K.; Strike, S.; Falvey, E. Clinical and biomechanical outcomes of rehabilitation targeting intersegmental control in athletic groin pain: Prospective cohort of 205 patients. Br. J. Sports Med. 2018, 52, 1054–1062. [Google Scholar] [CrossRef] [PubMed]
- Bencke, J.; Næsborg, H.; Simonsen, E.B.; Klausen, K. Motor pattern of the knee joint muscles during side-step cutting in European team handball. Scand. J. Med. Sci. Sports 2000, 10, 68–77. [Google Scholar] [CrossRef]
- de Hoyo, M.; Sañudo, B.; Carrasco, L.; Mateo-Cortes, J.; Domínguez-Cobo, S.; Fernandes, O.; Del Ojo, J.J.; Gonzalo-Skok, O. Effects of 10-week eccentric overload training on kinetic parameters during change of direction in football players. J. Sports Sci. 2016, 34, 1380–1387. [Google Scholar] [CrossRef] [PubMed]
- Morin, J.-B.; Edouard, P.; Samozino, P. Technical ability of force application as a determinant factor of sprint performance. Med. Sci. Sports Exerc. 2011, 43, 1680–1688. [Google Scholar] [CrossRef] [PubMed]
- Dai, B.; William, E.G.; Michael, T.G.; Darin, A.P.; Robin, M.Q.; Bing, Y. The Effects of 2 Landing Techniques on Knee Kinematics, Kinetics, and Performance During Stop-Jump and Side-Cutting Tasks. Am. J. Sports Med. 2014, 43, 466–474. [Google Scholar] [CrossRef] [PubMed]
- McBride, J.M.; Nimphius, S. Biological system energy algorithm reflected in sub-system joint work distribution movement strategies: Influence of strength and eccentric loading. Sci. Rep. 2020, 10, 1–11. [Google Scholar] [CrossRef]
- Dempsey, A.R.; Lloyd, D.G.; Elliott, B.C.; Steele, J.R.; Munro, B.J. Changing sidestep cutting technique reduces knee valgus loading. Am. J. Sports Med. 2009, 37, 2194–2200. [Google Scholar] [CrossRef]
- Nimphius, S. Increasing Agility. In High-Performance Training for Sports; Joyce, D., Lewindon, D., Eds.; Human Kinetics: Champaign, IL, USA, 2014; pp. 185–198. [Google Scholar]


| Intervention Group | Control Group | |
|---|---|---|
| Age (years) | 23.5 ± 5.2 | 22.2 ± 5.0 |
| Height (m) | 1.80 ± 0.05 | 1.76 ± 0.08 |
| Mass (kg) | 81.6 ± 11.4 | 72.7 ± 12.4 |
| Sporting population | soccer n = 12, rugby n = 4 | soccer n = 9, rugby n = 4, field hockey n = 1 |
| Compliance rate | 11.9 ± 0.3 sessions (99.4 ± 2.3%). 12 subjects completed 12 (100%) sessions and one subject completed 11 sessions (91.7%) | - |
| Variable | Group (Interaction) | ||
|---|---|---|---|
| p Value | η2 | Power | |
| Completion time | <0.001 ** | 0.417 | 0.973 |
| GCT | 0.615 | 0.011 | 0.078 |
| Approach velocity | 0.706 | 0.006 | 0.066 |
| PFC change in velocity | 0.465 | 0.023 | 0.110 |
| Velocity at FFC | 0.741 | 0.005 | 0.062 |
| Exit velocity | 0.071 | 0.135 | 0.443 |
| FFC mean HPF | 0.031 * | 0.186 | 0.594 |
| FFC H to V mean propulsive ratio | 0.008 * | 0.271 | 0.800 |
| PFC mean HBF | 0.929 | 0.000 | 0.051 |
| PFC H to V mean braking force ratio | 0.004 * | 0.314 | 0.874 |
| Lateral trunk flexion | 0.758 | 0.004 | 0.060 |
| FFC trunk inclination | 0.802 | 0.003 | 0.057 |
| Pelvic rotation | 0.381 | 0.034 | 0.137 |
| IFPA | 0.458 | 0.024 | 0.112 |
| FFC KFA ROM | 0.025 * | 0.200 | 0.633 |
| PFC peak HFA | 0.040 * | 0.170 | 0.548 |
| PFC peak KFA | 0.720 | 0.006 | 0.064 |
| Trivial η2 (<0.010) | Small η2 (0.010–0.059) | Medium η2 (0.060–0.149) | Large η2 (≥0.150) |
| Group | Variable | Pre | Post | Hedges’ g | Pre-Post Mean Difference | SWC | Ratio to SWC | Individual Responses | |||||
|---|---|---|---|---|---|---|---|---|---|---|---|---|---|
| Mean | SD | Mean | SD | p | g | ±CI | Mean | SD | (Positive, Non, Negative) | ||||
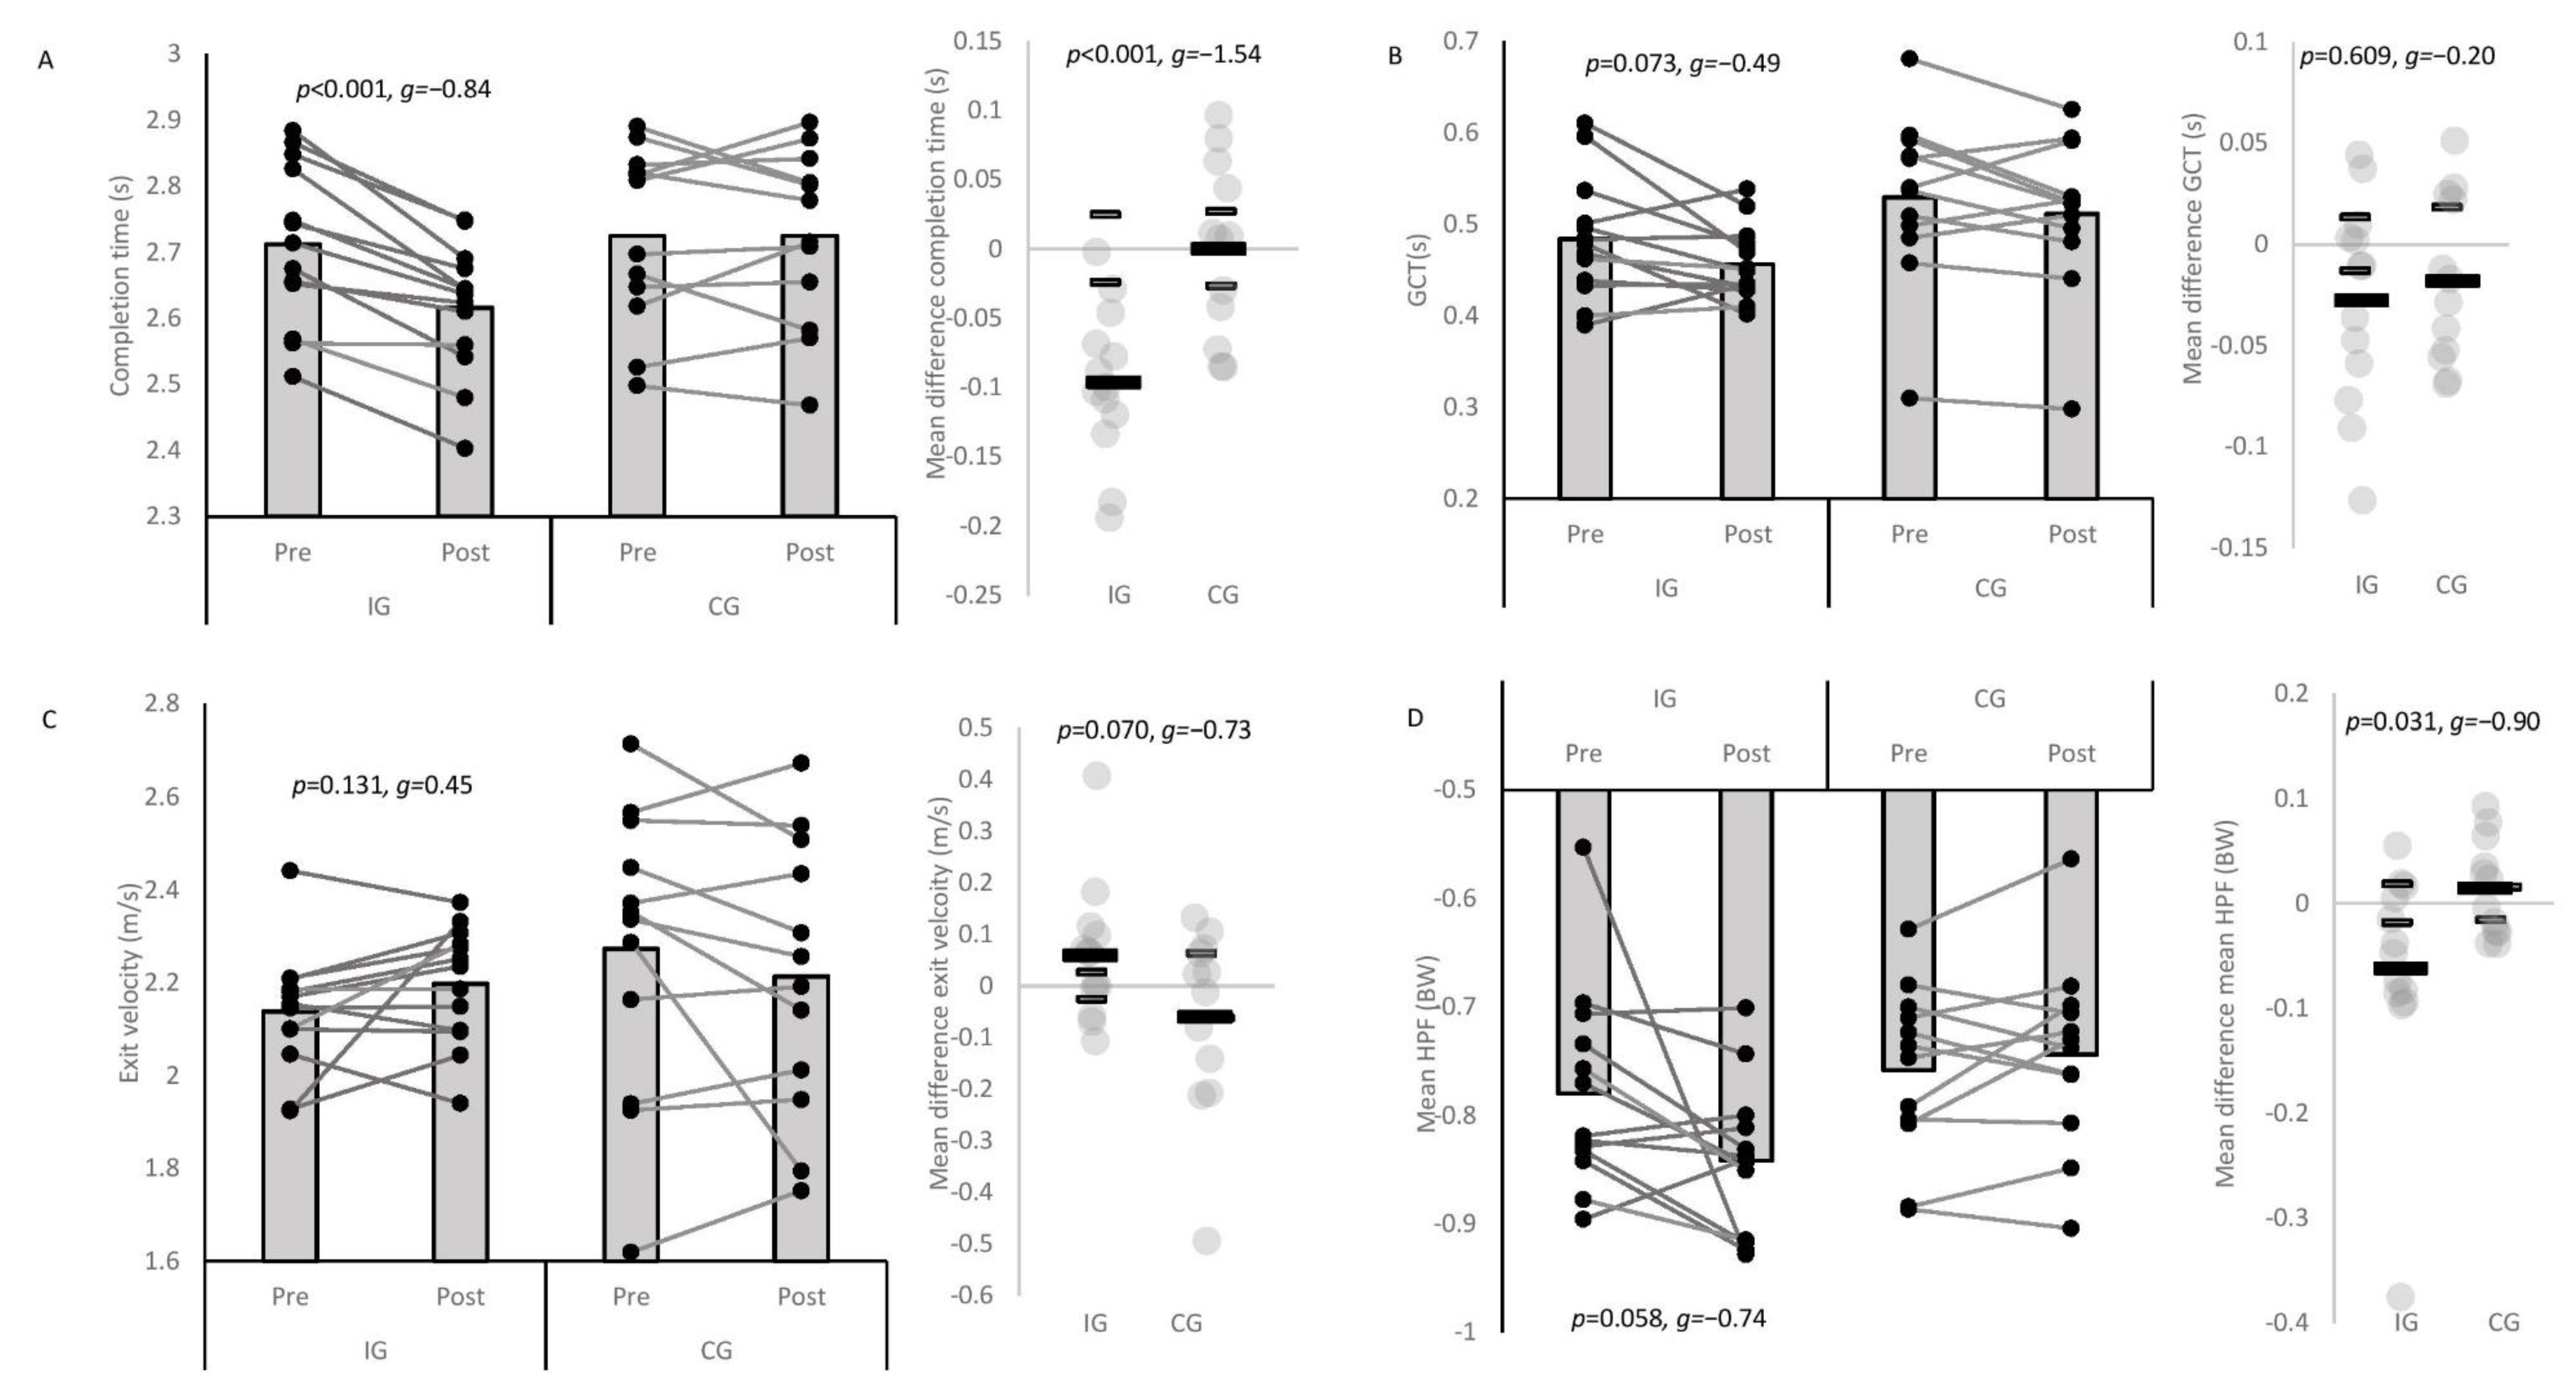
| IG | Completion time (s) | 2.712 | 0.122 | 2.616 b | 0.099 | <0.001 ** | −0.84 | 0.80 | −0.096c | 0.055 | 0.024 | 3.9 | 12-1-0 |
| GCT (s) | 0.484 | 0.067 | 0.456 b | 0.041 | 0.073 | −0.49 | 0.78 | −0.028 | 0.051 | 0.013 | 2.1 | 6-5-2 | |
| Approach velocity (m/s) | 3.96 | 0.33 | 4.00 | 0.24 | 0.625 | 0.13 | 0.77 | 0.04 | 0.29 | 0.07 | 0.6 | 8-1-4 | |
| PFC change in velocity (m/s) | −1.30 | 0.35 | −1.40 | 0.22 | 0.25 | −0.33 | 0.77 | −0.10 | 0.29 | 0.07 | 1.4 | 6-4-3 | |
| Velocity at FFC (m/s) | 2.65 | 0.21 | 2.60 | 0.26 | 0.374 | −0.24 | 0.77 | −0.06 | 0.23 | 0.04 | 1.4 | 5-3-5 | |
| Exit velocity (m/s) | 2.14 | 0.13 | 2.20 | 0.13 | 0.131 | 0.45 | 0.78 | 0.06 | 0.13 | 0.03 | 2.3 | 7-3-3 | |
| CG | Completion time (s) | 2.725 | 0.134 | 2.724 | 0.133 | 0.996 | 0.00 | 0.80 | 0.000 | 0.063 | 0.027 | 0.0 | 5-3-4 |
| GCT (s) | 0.529 | 0.092 | 0.511 | 0.085 | 0.157 | −0.20 | 0.80 | −0.018 | 0.041 | 0.018 | 1.0 | 6-2-4 | |
| Approach velocity (m/s) | 4.09 | 0.34 | 4.09 | 0.30 | 0.978 | 0.01 | 0.80 | 0.00 | 0.20 | 0.07 | 0.0 | 3-3-6 | |
| PFC change in velocity (m/s) | −1.38 | 0.20 | −1.42 | 0.20 | 0.332 | −0.15 | 0.80 | −0.03 | 0.11 | 0.04 | 0.8 | 5-4-3 | |
| Velocity at FFC (m/s) | 2.70 | 0.34 | 2.67 | 0.28 | 0.600 | −0.09 | 0.80 | −0.03 | 0.19 | 0.07 | 0.4 | 7-1-4 | |
| Exit velocity (m/s) | 2.27 | 0.31 | 2.21 | 0.30 | 0.276 | −0.19 | 0.80 | −0.06 | 0.18 | 0.06 | 0.9 | 4-3-5 | |
| IG | FFC mean HPF (BW) | −0.78 | 0.09 | −0.84 c | 0.07 | 0.058 | −0.74 | 0.79 | −0.06 b | 0.11 | 0.02 | 3.4 | 8-3-2 |
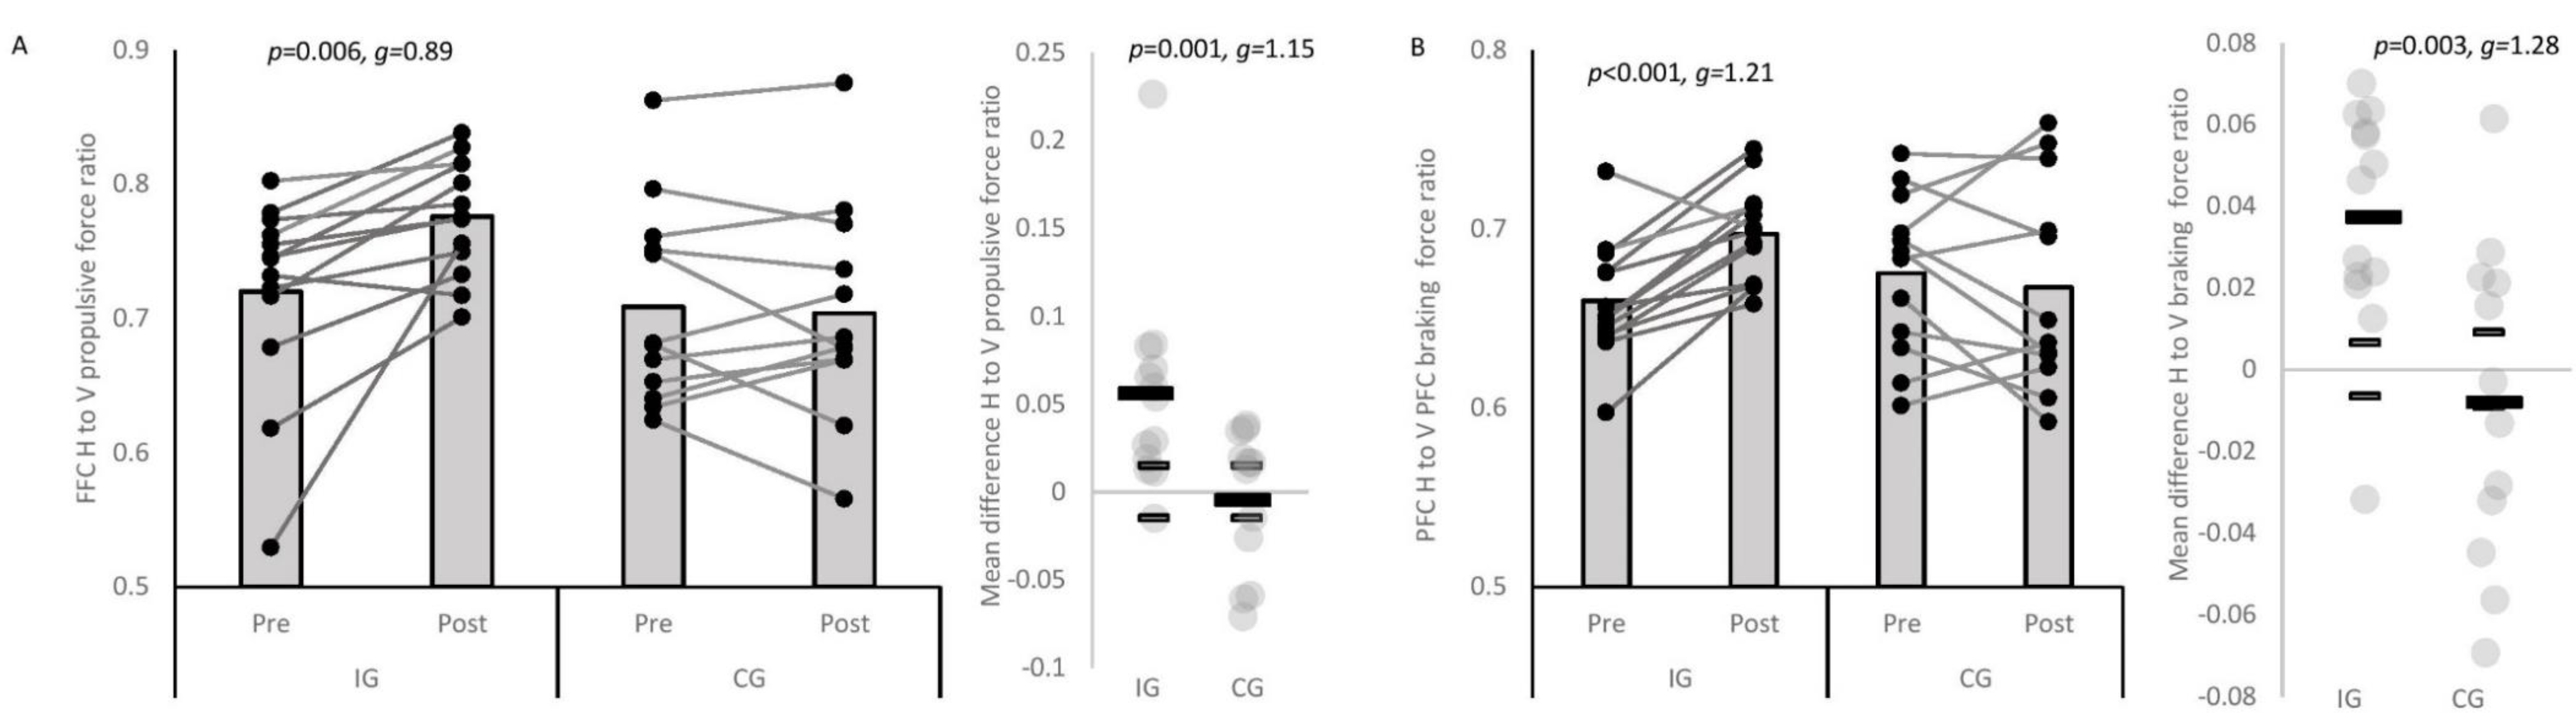
| FFC H to V mean propulsive ratio | 0.72 | 0.07 | 0.78 b | 0.04 | 0.006 * | 0.89 | 0.81 | 0.06 b | 0.06 | 0.01 | 3.8 | 10-3-0 | |
| PFC mean HBF (BW) | −0.51 | 0.06 | −0.53 | 0.06 | 0.087 | −0.34 | 0.77 | −0.02 | 0.04 | 0.01 | 1.8 | 7-2-4 | |
| PFC H to V mean braking force ratio | 0.66 | 0.03 | 0.70 c | 0.03 | <0.001 ** | 1.21 | 0.84 | 0.04 c | 0.03 | 0.01 | 5.7 | 12-0-1 | |
| CG | FFC mean HPF (BW) | −0.76 | 0.08 | −0.74 | 0.09 | 0.299 | 0.17 | 0.80 | 0.01 | 0.05 | 0.02 | 0.9 | 5-2-5 |
| FFC H to V mean propulsive ratio | 0.71 | 0.07 | 0.70 | 0.08 | 0.712 | −0.06 | 0.80 | 0.00 | 0.04 | 0.01 | 0.3 | 6-3-3 | |
| PFC mean HBF (BW) | −0.52 | 0.07 | −0.54 | 0.10 | 0.174 | −0.23 | 0.80 | −0.02 | 0.05 | 0.01 | 1.4 | 9-1-2 | |
| PFC H to V mean braking force ratio | 0.68 | 0.05 | 0.67 | 0.06 | 0.558 | −0.15 | 0.80 | −0.01 | 0.04 | 0.01 | 0.9 | 5-2-5 | |
| IG | Lateral trunk flexion (°) | 3.9 | 4.5 | 4.9 | 7.5 | 0.602 | 0.15 | 0.77 | 1.0 | 6.6 | 0.9 | 1.1 | 6-4-3 |
| FFC trunk inclination (°) | 36.4 | 12.9 | 41.6 | 10.4 | 0.075 | 0.43 | 0.78 | 5.2 | 9.6 | 2.6 | 2.0 | 7-3-3 | |
| Pelvic rotation (°) | 76.9 | 10.0 | 83.2 | 9.0 | 0.061 | 0.64 | 0.79 | 6.3 | 11.0 | 2.0 | 3.1 | 7-3-3 | |
| IFPA (°) | 48.2 | 16.4 | 52.1 | 14.5 | 0.384 | 0.24 | 0.77 | 3.9 | 15.6 | 3.3 | 1.2 | 6-2-5 | |
| FFC KFA ROM (°) | 44.5 | 5.5 | 42.1 c | 4.1 | 0.012 * | −0.49 | 0.78 | −2.4 b | 3.0 | 1.1 | 2.2 | 9-2-2 | |
| PFC peak HFA (°) | 88.8 | 11.9 | 95.6 | 7.8 | 0.003 * | −0.65 | 0.79 | −6.8 b | 6.5 | 2.4 | 2.9 | 10-2-1 | |
| PFC peak KFA (°) | 113.0 | 6.9 | 114.0 | 6.6 | 0.458 | 0.14 | 0.77 | 1.0 | 4.5 | 1.4 | 0.7 | 6-0-7 | |
| CG | Lateral trunk flexion (°) | 10.9 | 11.7 | 12.6 | 10.2 | 0.224 | 0.15 | 0.80 | 1.7 | 4.5 | 2.3 | 0.7 | 5-6-1 |
| FFC trunk inclination (°) | 32.1 | 13.3 | 38.8 | 12.9 | 0.248 | 0.50 | 0.81 | 6.7 | 19.1 | 2.7 | 2.5 | 7-3-2 | |
| Pelvic rotation (°) | 89.2 | 24.9 | 92.2 | 22.0 | 0.140 | 0.12 | 0.80 | 3.0 | 6.6 | 5.0 | 0.6 | 3-8-1 | |
| IFPA (°) | 60.7 | 22.4 | 69.3 | 12.9 | 0.082 | 0.45 | 0.81 | 8.6 | 15.5 | 4.5 | 1.9 | 7-4-1 | |
| FFC KFA ROM (°) | 49.1 | 5.8 | 49.8 | 7.0 | 0.502 | 0.11 | 0.80 | 0.7 | 3.6 | 1.2 | 0.6 | 4-4-4 | |
| PFC peak HFA (°) | 89.5 | 18.7 | 91.1 | 19.9 | 0.337 | −0.08 | 0.80 | −1.6 | 5.4 | 3.7 | 0.4 | 3-6-3 | |
| PFC peak KFA (°) | 110.1 | 9.5 | 110.3 | 10.3 | 0.920 | 0.02 | 0.80 | 0.2 | 6.2 | 1.9 | 0.1 | 5-2-5 | |
| Trivial ES (≤0.19) | Small ES (0.20–0.59) | Moderate ES (0.60–1.19) | Large ES (1.20–1.99) | ||||||||||
| Performance Variable | Associated with | Correlation Value with 95% Confidence Interval | Descriptor |
|---|---|---|---|
| Improvements in completion time |
|
|
|
| Improvements in GCT |
|
|
|
| Improvements in exit velocity |
|
|
|
Publisher’s Note: MDPI stays neutral with regard to jurisdictional claims in published maps and institutional affiliations. |
© 2021 by the authors. Licensee MDPI, Basel, Switzerland. This article is an open access article distributed under the terms and conditions of the Creative Commons Attribution (CC BY) license (https://creativecommons.org/licenses/by/4.0/).
Share and Cite
Dos’Santos, T.; Thomas, C.; McBurnie, A.; Comfort, P.; Jones, P.A. Change of Direction Speed and Technique Modification Training Improves 180° Turning Performance, Kinetics, and Kinematics. Sports 2021, 9, 73. https://doi.org/10.3390/sports9060073
Dos’Santos T, Thomas C, McBurnie A, Comfort P, Jones PA. Change of Direction Speed and Technique Modification Training Improves 180° Turning Performance, Kinetics, and Kinematics. Sports. 2021; 9(6):73. https://doi.org/10.3390/sports9060073
Chicago/Turabian StyleDos’Santos, Thomas, Christopher Thomas, Alistair McBurnie, Paul Comfort, and Paul A. Jones. 2021. "Change of Direction Speed and Technique Modification Training Improves 180° Turning Performance, Kinetics, and Kinematics" Sports 9, no. 6: 73. https://doi.org/10.3390/sports9060073
APA StyleDos’Santos, T., Thomas, C., McBurnie, A., Comfort, P., & Jones, P. A. (2021). Change of Direction Speed and Technique Modification Training Improves 180° Turning Performance, Kinetics, and Kinematics. Sports, 9(6), 73. https://doi.org/10.3390/sports9060073