The Reliability and Validity of Current Technologies for Measuring Barbell Velocity in the Free-Weight Back Squat and Power Clean


Abstract
1. Introduction
2. Materials and Methods
2.1. Participants
2.2. Study Design
2.3. Methodology
2.4. Equipment Setup
2.5. Data Processing
2.6. Statistical Analysis
3. Result
3.1. Reliability
3.1.1. Back Squat
3.1.2. Power Clean
3.2. Validity
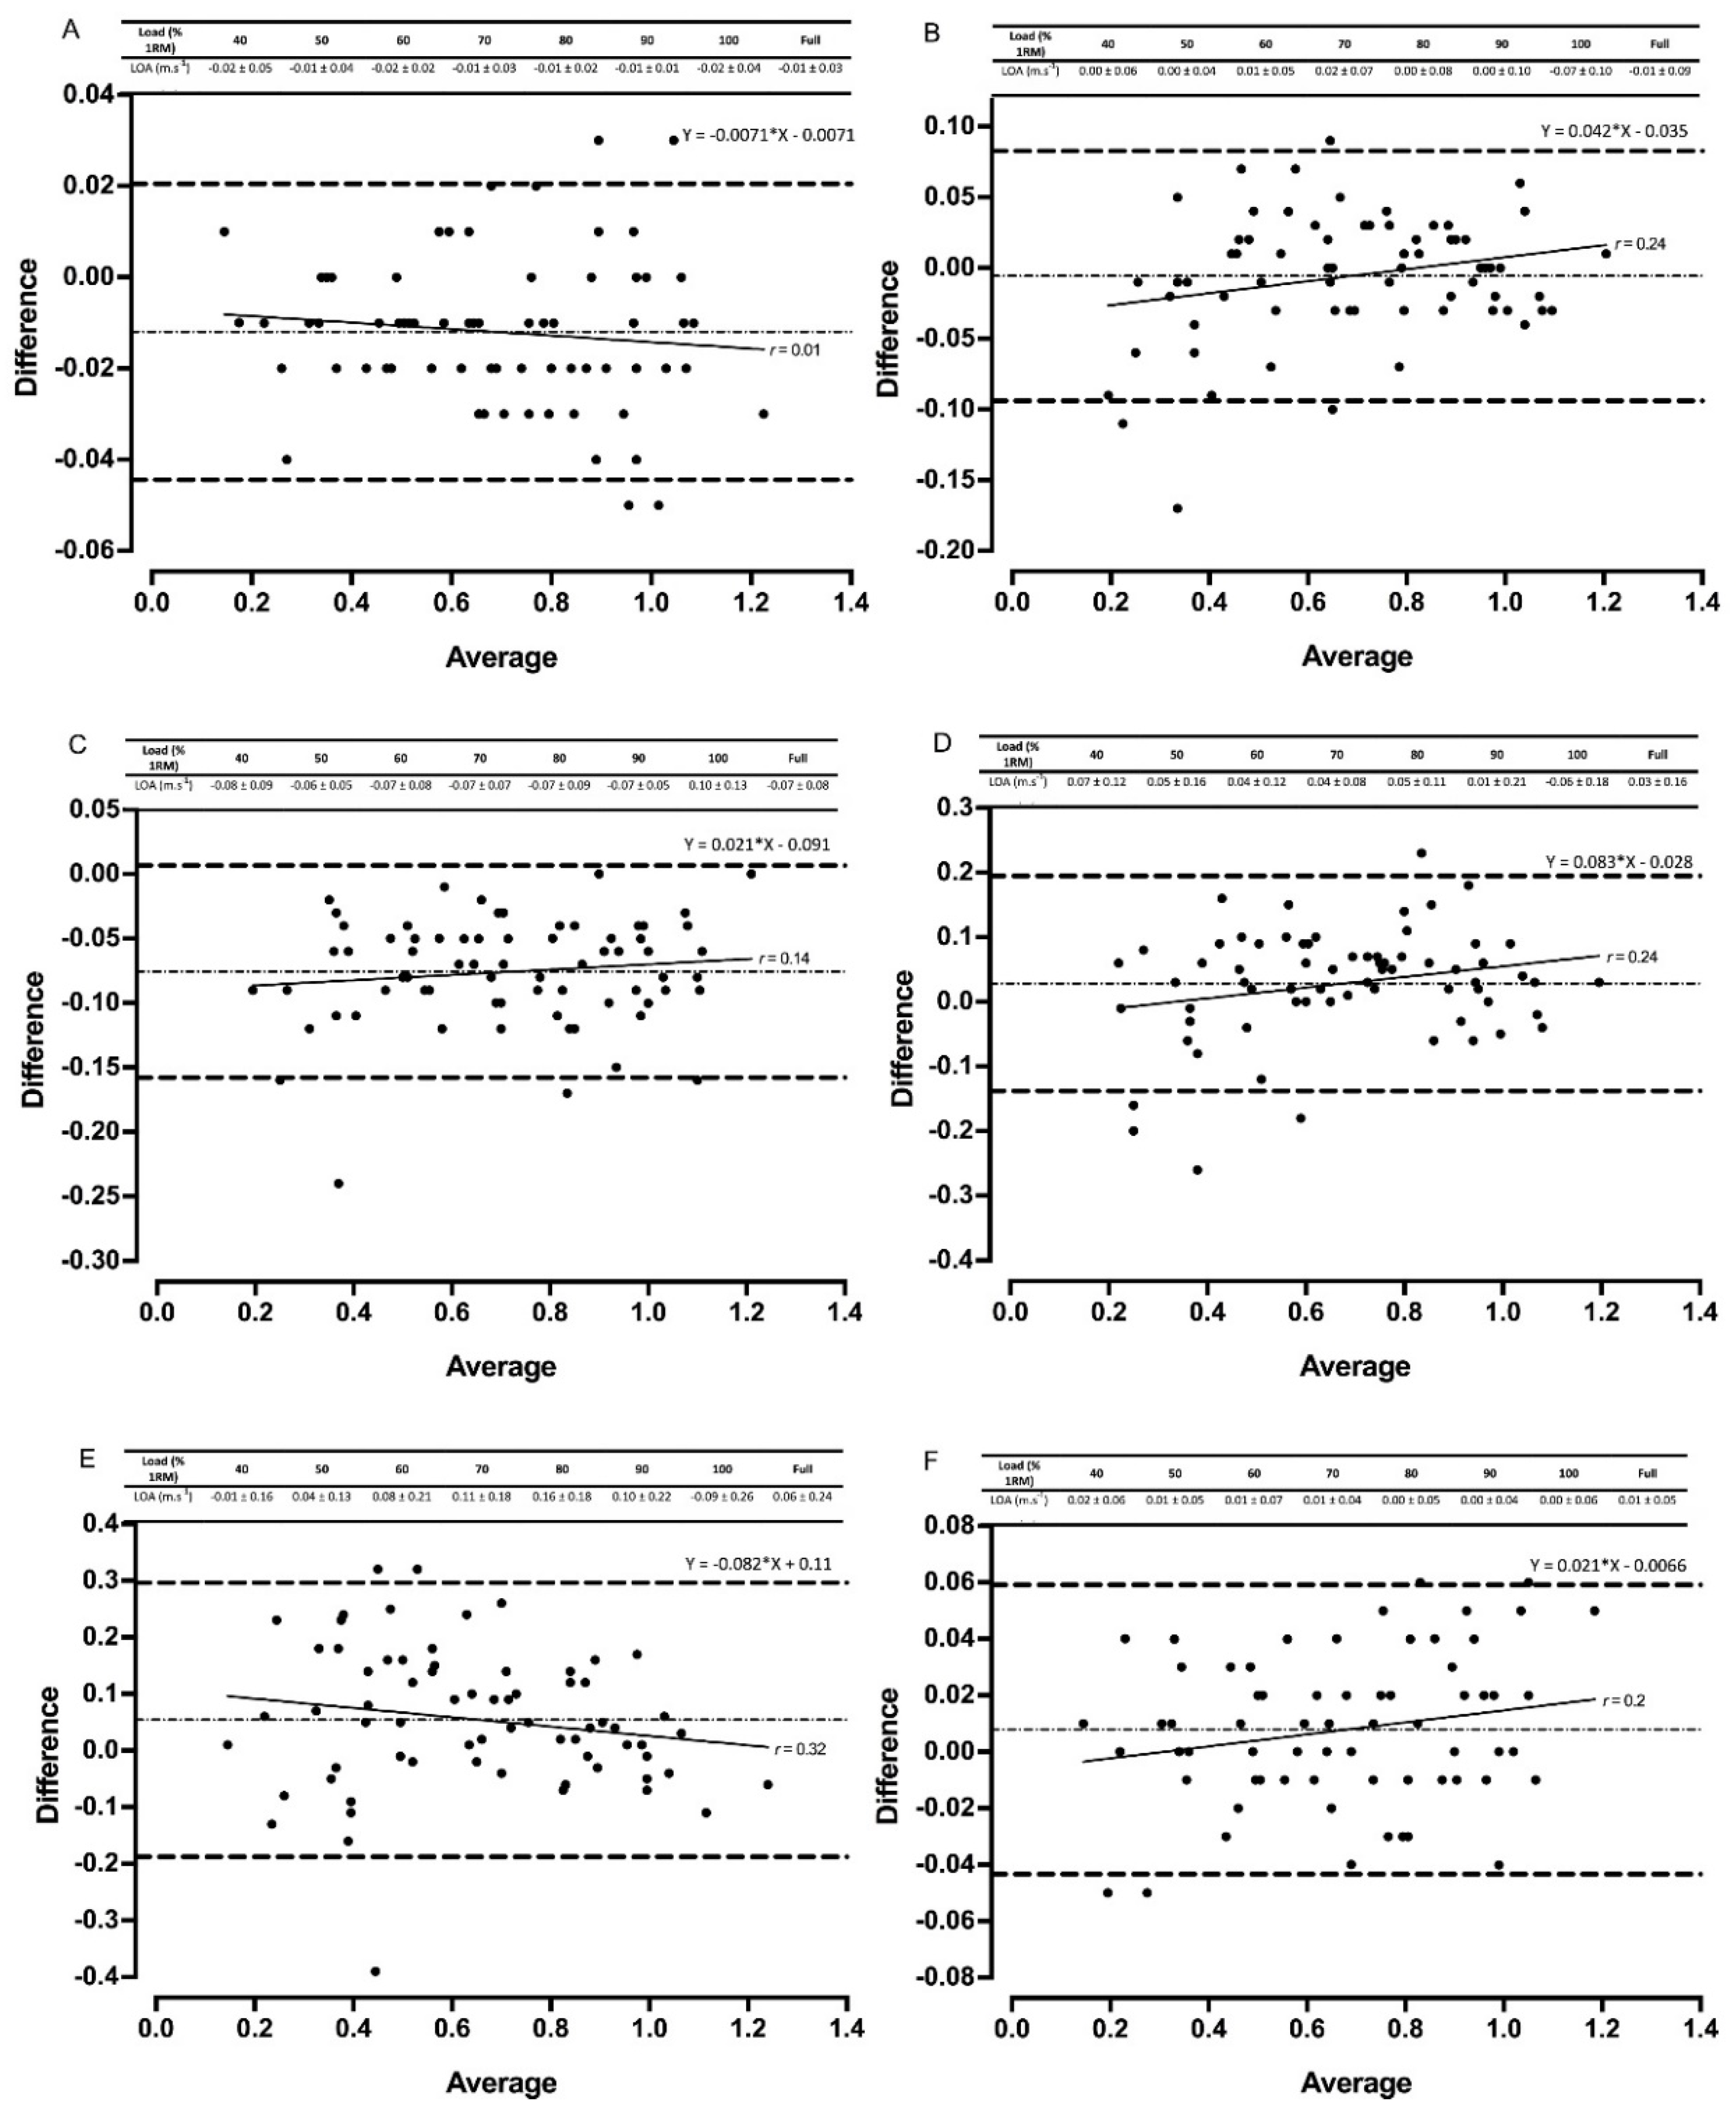
3.2.1. Back Squat
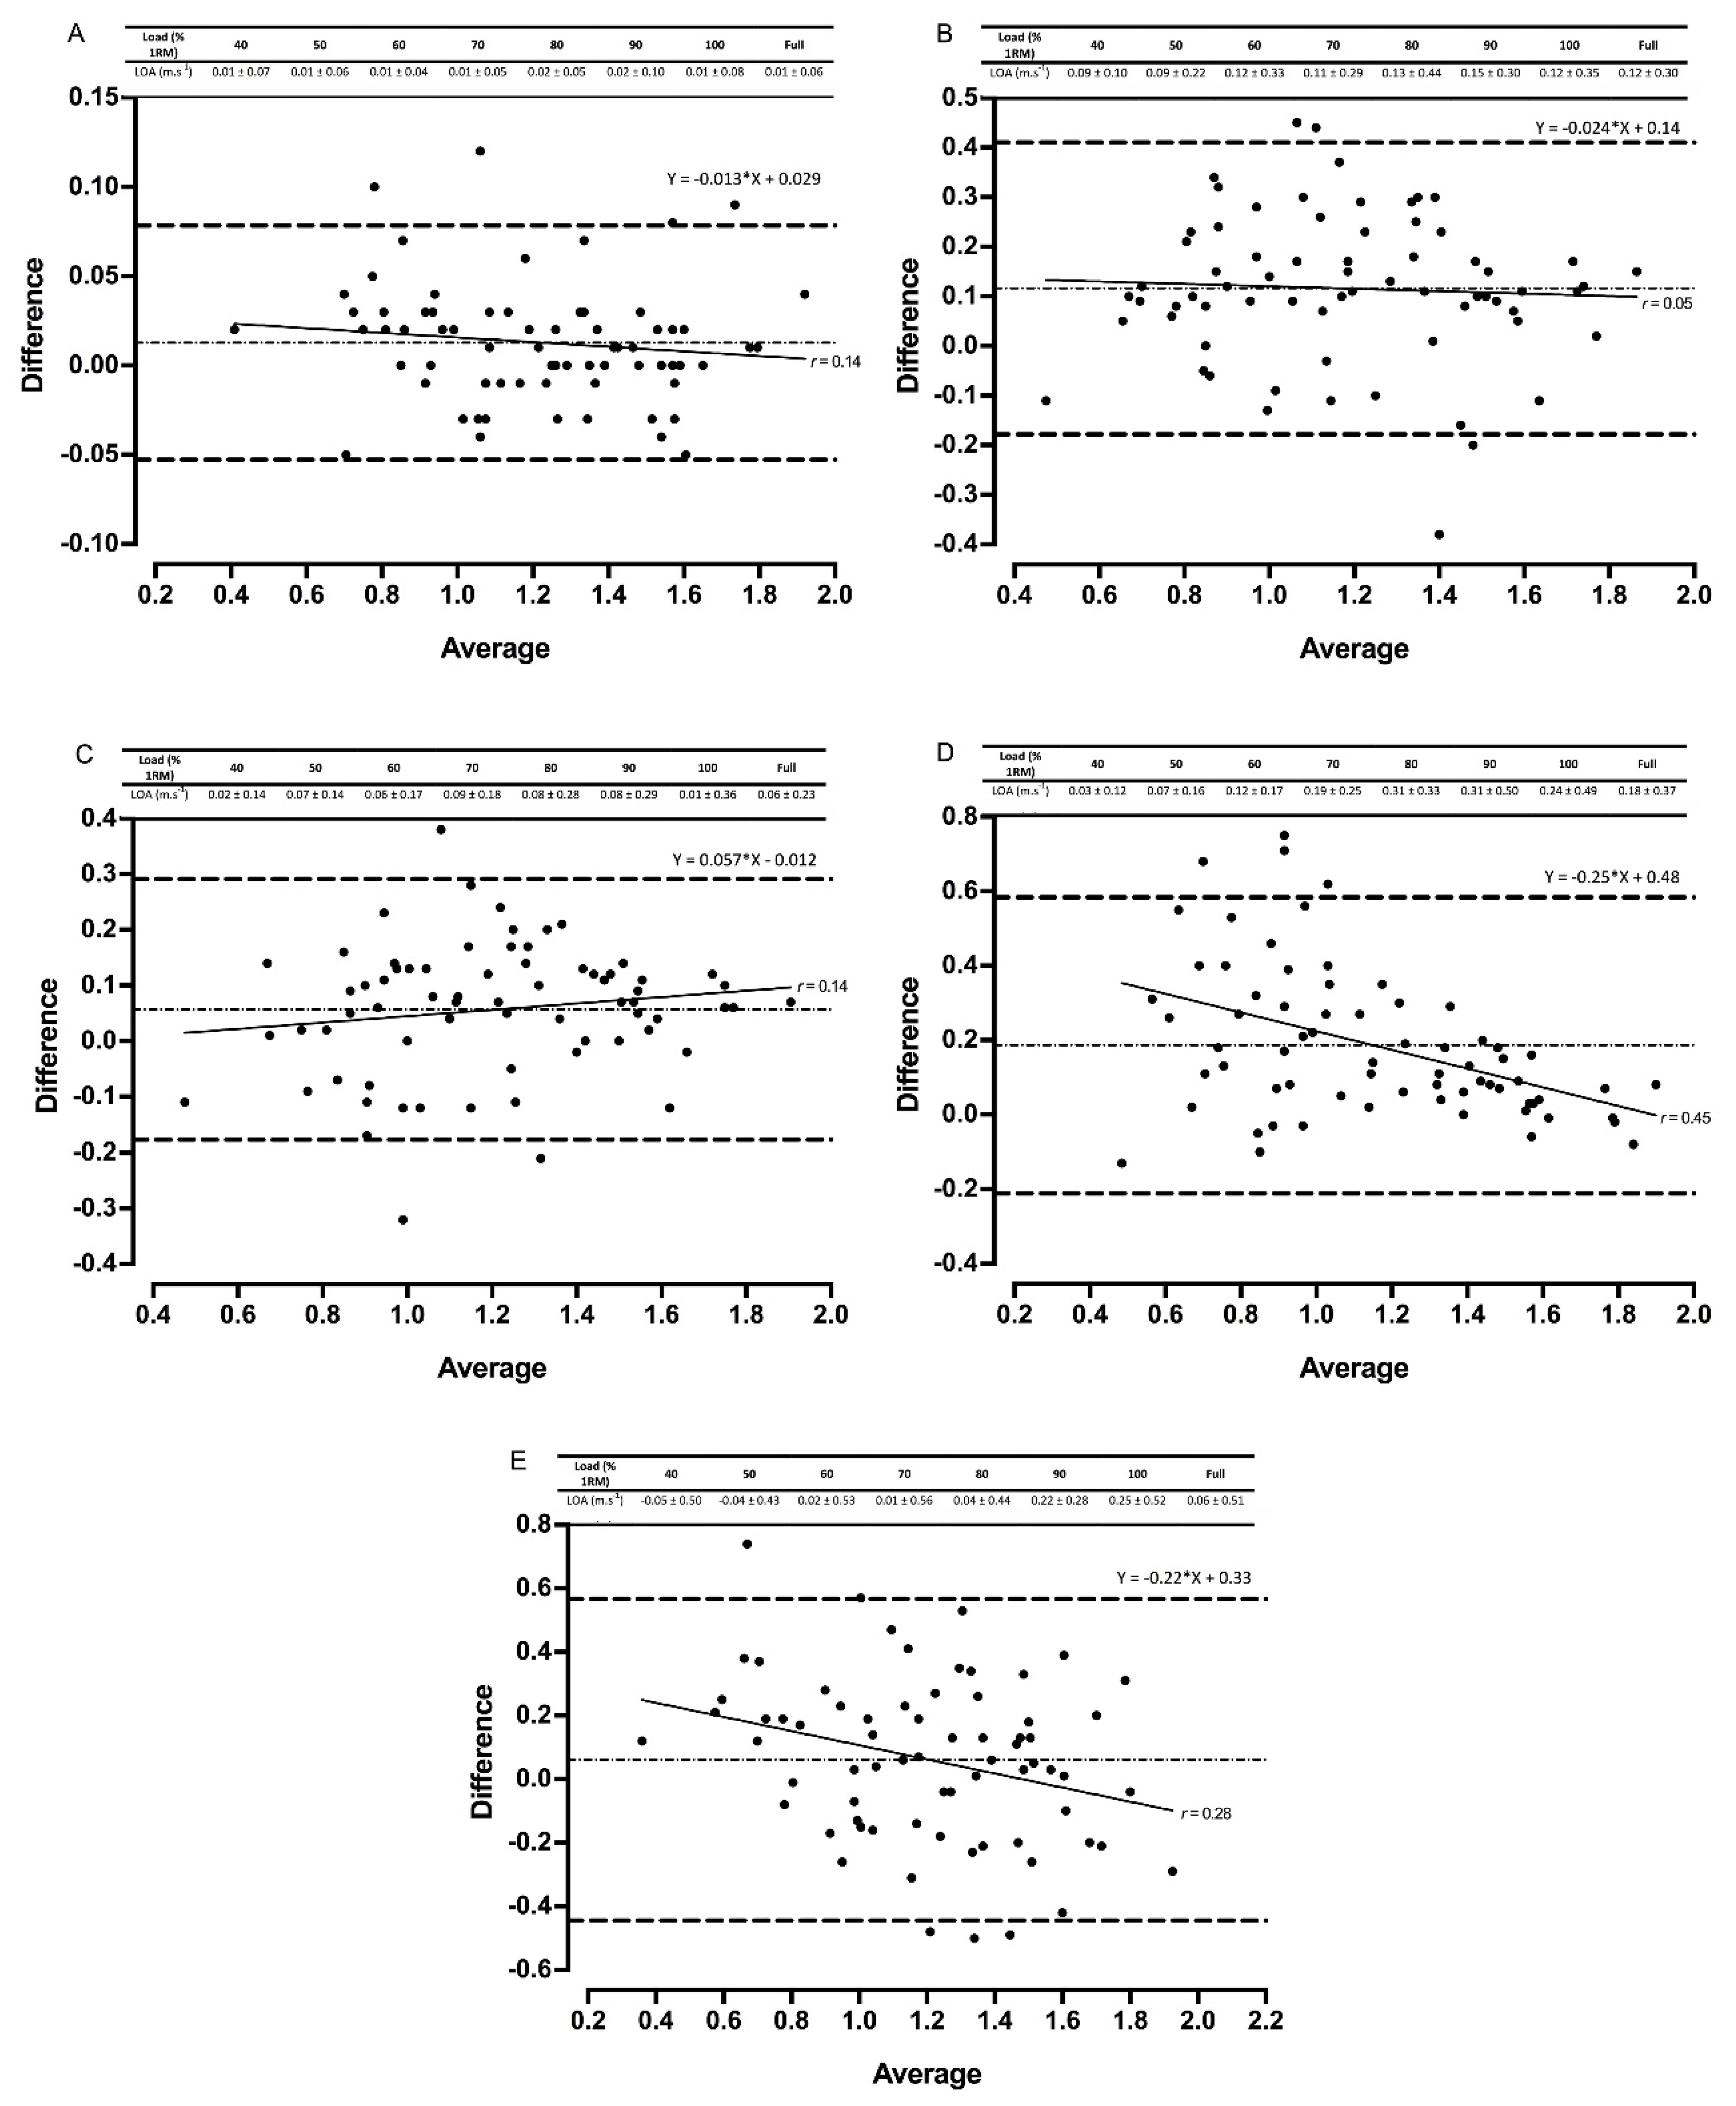
3.2.2. Power Clean
4. Discussion
5. Conclusions
6. Practical Applications
Author Contributions
Funding
Conflicts of Interest
References
- Banyard, H.G.; Nosaka, K.; Haff, G.G. Reliability and validity of the load-velocity relationship to predict the 1RM back squat. J. Strength Cond. Res. 2017, 31, 1897–1904. [Google Scholar] [CrossRef] [PubMed]
- Chery, C.; Ruf, L. Reliability of the load-velocity relationship and validity of PUSH to measure velocity of the deadlift. J. Strength Cond. Res. 2019, 33, 2370–2380. [Google Scholar] [CrossRef] [PubMed]
- Gonzalez-Badillo, J.J.; Sanchez-Medina, L. Movement velocity as a measure of loading intensity in resistance training. Int. J. Sports Med. 2010, 31, 347–352. [Google Scholar] [CrossRef] [PubMed]
- Jovanovic, M.; Flanagan, E. Researched applications of velocity-based strength training. J. Aust. Strength Cond. 2014, 22, 58–69. [Google Scholar]
- Weakley, J.; Wilson, K.; Till, K.; Banyard, H.G.; Dyson, J.; Phibbs, P.; Read, D.; Jones, B. Show me, tell me, encourage me: The effect of different forms of feedback on resistance training performance. J. Strength Cond. Res. 2018. [Google Scholar] [CrossRef]
- Banyard, H.G.; Nosaka, K.; Sato, K.; Haff, G.G. Validity of various methods for determining velocity, force and power in the back squat. Int. J. Sports Phys. Perf. 2017, 12, 1170–1176. [Google Scholar] [CrossRef]
- Courel-Ibanez, J.; Martinez-Cava, A.; Moran-Navarro, R.; Escribano-Penas, P.; Chavarren-Caberero, J.; Gonzalez-Badillo, J.J.; Pallares, J.G. Reproducibility and repeatability of five different technologies for bar velocity measurement in resistance training. Ann. Biomed. Eng. 2019, 47, 1523–1538. [Google Scholar] [CrossRef]
- Dorrell, H.F.; Moore, J.M.; Smith, M.F.; Gee, T.I. Validity and reliability of linear positional transducer across commonly practised resistance training exercises. J. Sports Sci. 2019, 37, 67–73. [Google Scholar] [CrossRef]
- Perez-Castilla, A.; Piepoli, A.; Delgado-Garcia, G.; Garrido-Blanca, G.; Garcia-Ramos, A. Reliability and concurrent validity of seven commercially available devices for the assessment of movement velocity at different intensities during the bench press. J. Strength Cond. Res. 2019, 35, 1258–1265. [Google Scholar] [CrossRef]
- Garnacho-Castano, M.V.; Lopez-Lastra, S.; Mate-Munoz, J.L. Reliability and validity assessment of a linear position transducer. J. Sports Sci. Med. 2015, 14, 128–136. [Google Scholar] [PubMed]
- Orange, S.T.; Metcalfe, J.W.; Liefeith, A.; Marshall, P.; Madden, L.A.; Fewster, C.R.; Vince, R.V. Validity and reliability of a wearable inertial sensor to measure velocity and power in the back squat and bench press. J. Strength Cond. Res. 2019, 33, 2398–2408. [Google Scholar] [CrossRef] [PubMed]
- Garcia-Ramos, A.; Perez-Castilla, A.; Martin, F. Reliability and concurrent validity of the Velowin optoelctronic system to measure movement velocity during the free-weigh back squat. Int. J. Sports Sci. Coach. 2018, 13, 737–742. [Google Scholar] [CrossRef]
- Orange, S.T.; Metcalfe, J.W.; Marshall, P.; Vince, R.V.; Madden, L.A.; Liefeith, A. Test-retest reliability of commercial linear position transducer (GymAware PowerTool) to measure velocity and power in the back squat and bench press. J. Strength Cond. Res. 2020, 34, 728–737. [Google Scholar] [CrossRef] [PubMed]
- Balsalobre-Fernandez, C.; Kuzdub, M.; Poveda-Ortiz, P.; Campo-Vecino, J.D. Validity and reliability of the PUSH wearable device to measure movement velocity during the back squat exercise. J. Strength Cond. Res. 2016, 30, 1968–1974. [Google Scholar] [CrossRef] [PubMed]
- Lake, J.; Augustus, S.; Austin, K.; Comfort, P.; McMahon, J.; Mundy, P.; Haff, G.G. The reliability and validity of the bar-mounted PUSH bandTM 2.0 during bench press with moderate and heavy loads. J. Sports Sci. 2019, 37, 2685–2690. [Google Scholar] [CrossRef]
- Hughes, L.J.; Peiffer, J.J.; Scott, B.R. Reliability and validity of using the push band v2.0 to measure repetition velocity in free-weight and smith machine exercises. J. Strength Cond. Res. 2019. [Google Scholar] [CrossRef]
- Balsalobre-Fernandez, C.; Marchante, D.; Baz-Valle, E.; Alonso-Malero, I.; Jimenez, S.L.; Munoz-Lopez, M. Analysis of smartphone-based and wearable technologies for the measurement of barbell velocity in different resistance training exercises. Front. Phys. 2017, 8, 649. [Google Scholar] [CrossRef]
- Beckham, G.K.; Layne, D.K.; Kim, S.B.; Martin, E.A.; Perez, B.G.; Adams, K.J. Reliability and criterion validity of the assess2perform bar sensei. Sports 2019, 7, 230. [Google Scholar] [CrossRef]
- Balsalobre-Fernandez, C.; Marchante, D.; Munoz-Lopez, M.; Saiz, S.J. Validity and reliability of a novel iphone app for the measurement of barbell velocity and 1RM on the bench press exercise. J. Sports Sci. 2018, 36, 64–70. [Google Scholar] [CrossRef]
- Ford, K.R.; Myer, G.D.; Hewett, T.E. Reliability of landing 3D motion analysis: Implications for longitudinal analyses. Med. Sci. Sport Exer. 2007, 39, 2021–2028. [Google Scholar] [CrossRef]
- Munro, A.; Herrington, L.; Carolan, M. Reliability of 2-dimensional video assessment of frontal-plane dynamic knee valgus during common athletic screening tasks. J. Sport Rehabil. 2012, 21, 7–11. [Google Scholar] [CrossRef] [PubMed]
- Comfort, P. Within- and between-session reliability of power, force and, rate of force development during the power clean. J. Strength Cond. Res. 2013, 27, 1210–1214. [Google Scholar] [CrossRef] [PubMed]
- Tricoli, V.; Lamas, L.; Carnevale, R.; Urginowitsch, C. Short-term effects on lower-body functional power development: Weightlifting vs. vertical jump training programs. J. Strength Cond. Res. 2005, 19, 433–437. [Google Scholar] [CrossRef] [PubMed]
- Kipp, K.; Meinerz, C. A biomechanical comparison of successful and unsuccessful power clean attempts. Sports Biomech. 2017, 16, 272–282. [Google Scholar] [CrossRef]
- Stone, M.H.; Pierce, K.C.; Sands, W.A.; Stone, M.E. Weightlifting: A brief overview. Strength Cond. 2006, 28, 50–66. [Google Scholar] [CrossRef]
- Haff, G.G.; Triplett, N.T. Essentials of Strength Training and Conditioning, 4th ed.; Human Kinetics: Champaign, IL, USA, 2016. [Google Scholar]
- International Powerlifting Federation. Technical Rules Book 2019; International Powerlifting Federation: Luxembourg, 2019; Available online: https://www.powerlifting.sport/2019 (accessed on 29 June 2019).
- International Weightlifting Federation. Technical and Competition Rules and Regulations. 2019. Available online: https://www.iwf.net/2019 (accessed on 29 June 2019).
- Hamill, J.; Knutzen, K.M.; Derrick, T.R. Biomechanical Basis of Human Movement; Wolters Kluwer: Philadephia, PA, USA, 2015. [Google Scholar]
- Hopkins, W. Spreadsheets for analysis of validity and reliability. Sportscience 2015, 19, 36–42. [Google Scholar]
- Hopkins, W.G. Measures in reliability in sports medicine and science. Sports Med. 2000, 30, 1–15. [Google Scholar] [CrossRef] [PubMed]
- Mullineaux, D.R.; Barnes, C.A.; Batterham, A.M. Assessment of bias in comparing measurements: A reliability example. Meas. Phys. Educ. Exerc. Sci. 1999, 3, 195–205. [Google Scholar] [CrossRef]
- Harris, N.K.; Cronin, J.; Taylor, K.L.; Jidovtseff, B.; Sheppard, J. Understanding position transducer technology for strength and conditioning practitioners. Strength Cond. J. 2010, 32, 66–79. [Google Scholar] [CrossRef]
- Balsalobre-Fernandez, C. Letter to the Editor Concerting the Article ‘‘Reproducibility and Repeatability of Five Different Technologies for Bar Velocity Measurement in Resistance Training’’ by Courel-Ibanez et al. Ann. Biomed. Eng. 2019. [Google Scholar] [CrossRef]
- Kellis, E.; Arambatzi, F.; Papadopoulos, C. Effects of load on ground reaction force and lower limb kinematics during concentric squats. J. Sports Sci. 2005, 23, 1045–1055. [Google Scholar] [CrossRef] [PubMed]
- Kristiansen, M.; Rasmussen, G.H.F.; Sloth, M.E.; Voigt, M. Inter- and Intra-individual variability in the kinematics of the back squat. Hum. Mov. Sci. 2019, 67, 102510. [Google Scholar] [CrossRef] [PubMed]
- Banyard, H.G.; Nosaka, K.; Vernon, A.D.; Haff, G.G. The reliability of Individualized load-velocity profiles. Int. J. Sports Phys. Perf. 2018, 13, 763–769. [Google Scholar] [CrossRef] [PubMed]
- Dorrell, H.F.; Smith, M.F.; Gee, T. Comparison of velocity-based and traditional percent-based loading methods on maximal strength and power adaptations. J. Strength Cond. Res. 2020, 34, 46–53. [Google Scholar] [CrossRef]
- Orange, S.T.; Metcalfe, J.W.; Robinson, A.; Appelgarth, M.J.; Liefeith, A. Effects of in-season velocity- vs. percentage-based training in academy rugby league. Int. J. Sports Phys. Perf. 2019. [Google Scholar] [CrossRef]
- Pareja-Blanco, F.; Alcazar, J.; Sánchez-Valdepeñas, J.; Cornejo-Daza, P.J.; Piqueras-Sanchiz, F.; Mora-Vela, R.; Sanchez-Moreno, M.; Bachero-Mena, B.; Ortega-Becerra, M.; Alegre, L.M. Velocity Loss as a Critical Variable Determining the Adaptations to Strength Training. Med. Sci. Sports Exerc. 2020. [Google Scholar] [CrossRef]


| Device | Type | Technology | Cost (£) | Sampling Rate | Location of Device |
|---|---|---|---|---|---|
| Gymaware | Linear position transducer | Optical encoder (records displacement-time curve data in order to determine changes in bar position) | £1950 | 20 millisecond time points down-sampled to 50 Hz | Tether attachment 100 mm from the end of the right hand-side of the barbell |
| Bar Sensei | Inertial measurement unit | Not reported | £305 approx. | Not reported | Placed on the left-hand side of the barbell, directly inside the collar using the sleeve provided by the manufacturer |
| PUSHbody (PUSH band located on the forearm) | Wearable inertial measurement unit | 3-axis accelerometer and gyroscope providing 6 degrees of freedom in coordinate system. (Integration of acceleration data with respect to time) | £250 approx. | 1000 Hz down-sampled to 200 Hz | Worn on the right forearm immediately inferior to the elbow crease with the on/off button located proximally as suggested by the manufacturer |
| PUSHbar (PUSH band located on the barbell) | Inertial measurement unit | 3-axis accelerometer and gyroscope providing 6 degrees of freedom in coordinate system. (Integration of acceleration data with respect to time) | £250 approx. | 1000 Hz down-sampled to 200 Hz | Placed on the right hand-side of the barbell, directly inside the collar using the bar sleeve provided by the manufacturer |
| Beast Sensor | Wearable inertial measurement unit | 3-axis accelerometer, gyroscope and magnetometer. (Integration of vertical acceleration data with respect to time) | £250 approx. | 50 Hz | Worn on the superior aspect of the right wrist using a wrist band provided by the manufacturer |
| MyLift (PowerLift at the time of data collection) | Smartphone application | Manual frame-by-frame inspection of slow-motion video. (Pre-defined range of motion/time inputted prior to data collection) | £9.99 | 240 Hz (720p video quality) | Located directly behind the participant and fixed in position using a tripod in order for the full barbell to be visible on the iPhone 7 (iOS 11.4.1) screen |
| Load (%) | Back Squat | Power Clean | ||||||
|---|---|---|---|---|---|---|---|---|
| TE (m·s−1) | CV (%) | TE (m·s−1) | CV (%) | |||||
| MV | PV | MV | PV | MV | PV | MV | PV | |
| Gymaware | ||||||||
| 40 | 0.04 | 0.08 | 4.5 | 5.6 | 0.05 | 0.09 | 3.6 | 3.7 |
| 50 | 0.03 | 0.07 | 3.4 | 4.9 | 0.03 | 0.08 | 2.2 | 3.7 |
| 60 | 0.02 | 0.08 | 2.9 | 6.0 | 0.03 | 0.07 | 2.4 | 3.1 |
| 70 | 0.03 | 0.10 | 4.5 | 8.3 | 0.04 | 0.05 | 3.2 | 2.5 |
| 80 | 0.04 | 0.09 | 7.0 | 8.6 | 0.04 | 0.08 | 3.3 | 3.8 |
| 90 | 0.04 | 0.09 | 9.5 | 12.6 | 0.08 | 0.07 | 8.9 | 3.9 |
| 100 | 0.03 | 0.15 | 13.6 | 22.0 | 0.04 | 0.06 | 4.3 | 4.0 |
| Full | 0.04 | 0.10 | 9.8 | 11.3 | 0.05 | 0.07 | 4.9 | 3.3 |
| PUSH Body | ||||||||
| 40 | 0.03 | 0.09 | 3.5 | 6.0 | 0.06 | 0.08 | 4.9 | 4.9 |
| 50 | 0.04 | 0.15 | 4.1 | 9.9 | 0.06 | 0.08 | 5.2 | 5.2 |
| 60 | 0.04 | 0.11 | 5.4 | 9.1 | 0.05 | 0.08 | 4.5 | 4.5 |
| 70 | 0.03 | 0.10 | 5.0 | 8.9 | 0.09 | 0.12 | 7.7 | 7.7 |
| 80 | 0.03 | 0.07 | 5.2 | 6.8 | 0.10 | 0.14 | 10.2 | 10.2 |
| 90 | 0.07 | 0.11 | 15.6 | 11.0 | 0.09 | 0.13 | 11.3 | 11.3 |
| 100 | 0.04 | 0.08 | 14.9 | 11.4 | 0.09 | 0.12 | 11.4 | 11.4 |
| Full | 0.05 | 0.11 | 10.6 | 11.3 | 0.08 | 0.11 | 8.3 | 8.3 |
| PUSH Bar | ||||||||
| 40 | 0.06 | 0.09 | 5.2 | 5.7 | 0.20 | 0.36 | 21.5 | 21.5 |
| 50 | 0.08 | 0.10 | 9.2 | 7.5 | 0.18 | 0.33 | 19.0 | 17.9 |
| 60 | 0.05 | 0.12 | 5.1 | 9.4 | 0.17 | 0.42 | 18.9 | 25.4 |
| 70 | 0.04 | 0.09 | 5.9 | 8.3 | 0.13 | 0.22 | 14.6 | 13.4 |
| 80 | 0.09 | 0.09 | 14.3 | 8.8 | 0.14 | 0.25 | 16.3 | 15.6 |
| 90 | 0.09 | 0.12 | 20.3 | 14.2 | 0.15 | 0.31 | 18.1 | 22.2 |
| 100 | 0.06 | 0.09 | 15.4 | 11.6 | 0.10 | 0.23 | 13.3 | 17.5 |
| Full | 0.07 | 0.11 | 14.5 | 11.0 | 0.21 | 0.32 | 18.6 | 20.5 |
| Bar Sensei | ||||||||
| 40 | 0.08 | 0.14 | 9.1 | 9.4 | 0.23 | 0.20 | 20.4 | 7.7 |
| 50 | 0.09 | 0.10 | 13.5 | 7.6 | 0.16 | 0.15 | 13.8 | 6.5 |
| 60 | 0.07 | 0.08 | 8.8 | 8.0 | 0.13 | 0.13 | 12.1 | 5.8 |
| 70 | 0.07 | 0.09 | 10.7 | 10.2 | 0.13 | 0.19 | 11.8 | 8.8 |
| 80 | 0.08 | 0.24 | 18.3 | 35.8 | 0.13 | 0.13 | 14.9 | 6.1 |
| 90 | 0.08 | 0.12 | 19.1 | 18.0 | 0.15 | 0.14 | 17.7 | 7.9 |
| 100 | 0.13 | 0.12 | 60.5 | 28.5 | 0.14 | 0.15 | 18.4 | 8.5 |
| Full | 0.09 | 0.13 | 22.1 | 18.7 | 0.16 | 0.17 | 15.9 | 8.7 |
| Beast Sensor | ||||||||
| 40 | 0.05 | 0.10 | 5.1 | 6.2 | - | - | - | - |
| 50 | 0.06 | 0.11 | 7.6 | 7.4 | - | - | - | - |
| 60 | 0.08 | 0.15 | 12.0 | 11.8 | - | - | - | - |
| 70 | 0.12 | 0.27 | 22.4 | 25.8 | - | - | - | - |
| 80 | 0.22 | 0.33 | 72.3 | 54.0 | - | - | - | - |
| 90 | 0.21 | 0.48 | 75.8 | 119.9 | - | - | - | - |
| 100 | 0.15 | 0.29 | 40.6 | 65.1 | - | - | - | - |
| Full | 0.14 | 0.30 | 42.4 | 53.2 | - | - | - | - |
| MyLift | ||||||||
| 40 | 0.04 | - | 4.2 | - | - | - | - | - |
| 50 | 0.03 | - | 3.7 | - | - | - | - | - |
| 60 | 0.04 | - | 5.5 | - | - | - | - | - |
| 70 | 0.03 | - | 4.9 | - | - | - | - | - |
| 80 | 0.04 | - | 6.8 | - | - | - | - | - |
| 90 | 0.05 | - | 12.6 | - | - | - | - | - |
| 100 | 0.03 | - | 13.8 | - | - | - | - | - |
| Full | 0.05 | - | 9.7 | - | - | - | - | - |
| Load (%) | R2 | Slope (95% CI) | Intercept (95% CI) | |||
|---|---|---|---|---|---|---|
| MV | PV | MV | PV | MV | PV | |
| Gymaware | ||||||
| 40 | 0.95 | 0.97 | 1.010 (0.824, 1.196) | 1.033 (0.896, 1.170) | −0.027 (−0.221, 0.167) | −0.042 (−0.263, 0.178) |
| 50 | 0.95 | 0.98 | 0.990 (0.808, 1.172) | 0.971 (0.866, 1.075) | −0.004 (−0.173, 0.166) | 0.054 (−0.100, 0.209) |
| 60 | 0.98 | 0.99 | 1.046 (0.931, 1.160) | 0.983 (0.908, 1.059) | −0.056 (−0.152, 0.040) | 0.031 (−0.073, 0.136) |
| 70 | 0.97 | 0.99 | 1.073 (0.917, 1.229) | 0.957 (0.870, 1.044) | −0.060 (−0.172, 0.052) | 0.067 (−0.040, 0.174) |
| 80 | 0.99 | 0.99 | 0.990 (0.892, 1.088) | 0.979 (0.885, 1.073) | −0.002 (−0.061, 0.058) | 0.040 (−0.064, 0.144) |
| 90 | 0.99 | 0.96 | 1.014 (0.943, 1.084) | 0.910 (0.761, 1.059) | −0.014 (−0.048, 0.020) | 0.110 (−0.040, 0.261) |
| 100 | 0.97 | 0.97 | 0.965 (0.826, 1.104) | 0.936 (0.813, 1.059) | −0.001 (−0.042, 0.039) | 0.066 (−0.043, 0.174) |
| Full | 0.99 | 0.99 | 0.991 (0.979, 1.004) | 0.970 (0.931, 1.009) | −0.005 (−0.014, 0.003) | 0.054 (−0.003, 0.110) |
| PUSH Body | ||||||
| 40 | 0.92 | 0.94 | 0.968 (0.730, 1.207) | 1.026 (0.819, 1.233) | 0.031 (−0.214, 0.275) | 0.051 (−0.265, 0.368) |
| 50 | 0.96 | 0.76 | 0.975 (0.816, 1.134) | 0.852 (0.459, 1.245) | 0.022 (−0.125. 0.168) | 0.291 (−0.261, 0.844) |
| 60 | 0.95 | 0.45 | 0.813 (0.659, 0.967) † | 0.648 (0.069, 1.227) | 0.160 (0.035, 0.285) * | 0.562 (−0.170, 1.294) |
| 70 | 0.88 | 0.60 | 0.842 (0.594, 1.090) | 0.723 (0.238, 1.208) | 0.128 (−0.043, 0.300) | 0.425 (−0.127, 0.976) |
| 80 | 0.92 | 0.37 | 0.746 (0.569, 0.922) † | 0.482 (−0.033, 0.997) † | 0.153 (0.048, 0.259) * | 0.638 (0.114, 1.162) * |
| 90 | 0.79 | 0.53 | 0.624 (0.365, 0.883) † | 0.912 (0.217, 1.607) | 0.173 (0.048, 0.298) * | 0.227 (−0.380, 0.835) |
| 100 | 0.58 | 0.48 | 0.790 (0.247, 1.333) | 1.320 (0.195, 2.445) | 0.004 (−0.184, 0.193) | −0.144 (−0.956, 0.727) |
| Full | 0.97 | 0.80 | 1.028 (0.984, 1.072) | 0.994 (0.918, 1.070) | −0.025 (−0.057, 0.007) | 0.133 (0.053, 0.213) |
| PUSH Bar | ||||||
| 40 | 0.69 | 0.91 | 1.224 (0.835, 1.613) | 1.185 (0.894, 1.476) | −0.326 (−0.755, 0.102) | −0.271 (−0.735, 0.193) |
| 50 | 0.95 | 0.89 | 1.000 (0.814, 1.186) | 1.063 (0.763, 1.362) | −0.062 (−0.245, 0.120) | −0.019 (−0.444, 0.405) |
| 60 | 0.83 | 0.84 | 0.757 (0.479, 1.036) | 0.881 (0.574, 1.188) | 0.143 (−0.106, 0.393) | 0.212 (−0.196, 0.621) |
| 70 | 0.84 | 0.80 | 1.082 (0.691, 1.473) | 1.091 (0.655, 1.528) | −0.135 (−0.440, 0.170) | −0.019 (−0.525, 0.487) |
| 80 | 0.87 | 0.60 | 0.745 (0.505, 0.985) † | 0.818 (0.271, 1.365) | 0.099 (−0.061, 0.259) | 0.267 (−0.308, 0.842) |
| 90 | 0.92 | 0.56 | 0.858 (0.657, 1.059) | 0.951 (0.257, 1.644) | 0.010 (−0.098, 0.118) | 0.128 (−0.525, 0.781) |
| 100 | 0.39 | 0.41 | 0.661 (−0.013, 1.335) | 0.890 (0.027, 1.752) | 0.023 (−0.236, 0.282) | 0.100 (−0.652, 0.851) |
| Full | 0.97 | 0.86 | 1.010 (0.969, 1.050) | 0.982 (0.888, 1.076) | −0.082 (−0.115, −0.050) * | 0.078 (−0.037, 0.193) |
| Bar Sensei | ||||||
| 40 | 0.82 | 0.96 | 0.702 (0.437, 0.968) † | 0.840 (0.051, 0.509) † | 0.352 (0.098, 0.607) * | 0.280 (0.051, 0.509) * |
| 50 | 0.75 | 0.93 | 0.599 (0.313, 0.885) † | 0.784 (0.605, 0.962) † | 0.394 (0.143, 0.645) * | 0.377 (0.123, 0.631) * |
| 60 | 0.67 | 0.82 | 0.660 (0.285, 1.035) | 0.968 (0.599, 1.336) | 0.303 (0.009, 0.597) * | 0.163 (−0.302, 0.628) |
| 70 | 0.86 | 0.66 | 0.778 (0.520, 1.035) | 0.825 (0.346, 1.303) | 0.188 (0.015, 0.361) * | 0.372 (−0.135, 0.880) |
| 80 | 0.66 | 0.52 | 0.871 (0.362, 1.380) | 0.680 (0.144, 1.217) | 0.121 (−0.156, 0.398) | 0.566 (0.120, 1.012) * |
| 90 | 0.23 | 0.10 | 0.309 (−0.147, 0.765) † | 0.332 (−0.470, 1.133) | 0.326 (0.112, 0.540) * | 0.777 (0.191, 1.362) * |
| 100 | 0.01 | 0.02 | 0.359 (−0.233, 0.950) † | 0.132 (−0.807, 0.171) † | 0.147 (−0.056, 0.349) | 0.737 (0.171, 1.303) * |
| Full | 0.87 | 0.80 | 1.028 (0.945, 1.111) | 0.712 (0.625, 0.799) † | 0.010 (−0.048, 0.068) | 0.485 (0.386, 0.583) * |
| Beast Sensor | ||||||
| 40 | 0.64 | 0.10 | 0.646 (0.250, 1.042) | 0.319 (−0.442, 1.080) | 0.354 (−0.058, 0.765) | 1.079 (−0.193, 2.351) |
| 50 | 0.71 | 0.12 | 0.719 (0.347, 1.091) | 0.470 (−0.590, 1.531) | 0.282 (−0.048, 0.612) | 0.763 (−0.849, 2.375) |
| 60 | 0.49 | 0.00 | 0.414 (0.067, 0.761) † | 0.038 (−0.857, 0.933) † | 0.511 (0.250, 0.771) * | 1.320 (0.100, 2.539) * |
| 70 | 0.46 | 0.00 | 0.499 (0.062, 0.936) † | −0.097 (−1.043, 0.848) † | 0.406 (0.139, 0.673) * | 1.353 (0.165, 2.541) * |
| 80 | 0.58 | 0.02 | 0.499 (0.154, 0.844) † | 0.345 (−1.716, 2.407) | 0.377 (0.224, 0.531) * | 0.742 (−1.716, 2.952) |
| 90 | 0.12 | 0.58 | 0.271 (−0.172, 0.713) † | 0.927 (0.281, 1.574) | 0.368 (0.199, 0.538) * | 0.273 (−0.252, 0.798) |
| 100 | 0.20 | 0.15 | 0.236 (−0.146, 0.619) † | 0.385 (−0.357, 1.127) | 0.188 (0.041, 0.335) * | 0.626 (0.141, 1.110) * |
| Full | 0.80 | 0.57 | 0.835 (0.736, 0.933) † | 0.622 (0.493, 0.751) † | 0.159 (0.092, 0.227) * | 0.506 (0.346, 0.667) * |
| MyLift | ||||||
| 40 | 0.96 | - | 1.161, (0.934, 1.388) | - | −0.142 (−0.370, 0.086) | - |
| 50 | 0.94 | - | 1.052 (0.833, 1.271) | - | −0.036 (−0.234, 0.163) | - |
| 60 | 0.88 | - | 0.847 (0.591, 1.104) | - | 0.133 (−0.075, 0.341) | - |
| 70 | 0.95 | - | 0.936 (0.768, 1.104) | - | 0.055 (−0.063, 0.173) | - |
| 80 | 0.93 | - | 0.884 (0.694, 1.074) | - | 0.070 (−0.043, 0.183) | - |
| 90 | 0.92 | - | 1.004 (0.766, 1.243) | - | 0.003 (−0.109, 0.114) | - |
| 100 | 0.85 | - | 1.004 (0.658, 1.351) | - | 0.001 (−0.096, 0.097) | - |
| Full | 0.99 | - | 1.017 (0.992, 1.042) | - | −0.003 (−0.021, 0.015) | - |
| Load (%) | R2 | Slope (95% CI) | Intercept (95% CI) | |||
|---|---|---|---|---|---|---|
| MV | PV | MV | PV | MV | PV | |
| Gymaware | ||||||
| 40 | 0.93 | 0.91 | 1.165 (0.913, 1.417) | 1.067 (0.787, 1.348) | −0.254 (−0.598, 0.090) | −0.172 (−0.841, 0.498) |
| 50 | 0.95 | 0.93 | 0.944 (0.768, 1.120) | 1.042 (0.806, 1.279) | 0.042 (−0.192, 0.277) | −0.110 (−0.660, 0.441) |
| 60 | 0.95 | 0.95 | 0.900 (0.731, 1.068) | 0.974 (0.798, 1.150) | 0.096 (−0.119, 0.312) | 0.044 (−0.347, 0.435) |
| 70 | 0.78 | 0.95 | 0.788 (0.443, 1.133) | 1.061 (0.869, 1.253) | 0.235 (−0.180, 0.650) | −0.133 (−0.545, 0.280) |
| 80 | 0.86 | 0.91 | 0.831 (0.553, 1.110) | 1.058 (0.801, 1.314) | 0.167 (−0.148, 0.482) | −0.119 (−0.641, 0.403) |
| 90 | 0.42 | 0.86 | 0.553 (0.023, 1.082) | 0.949 (0.641, 1.257) | 0.463 (−0.087, 1.014) | 0.110 (−0.480, 0.700) |
| 100 | 0.64 | 0.86 | 0.848 (0.334, 1.361) | 0.879 (0.589, 1.170) | 0.140 (−0.358, 0.368) | 0.243 (−0.275, 0.762) |
| Full | 0.94 | 0.96 | 0.956 (0.902, 1.009) | 0.967 (0.918, 1.017) | 0.032 (−0.030, 0.94) | 0.069 (−0.036, 0.174) |
| PUSH Body | ||||||
| 40 | 0.38 | 0.27 | 0.713 (−0.021, 1.448) | 0.655 (−0.229, 1.540) | 0.431 (−0.498, 1.360) | 1.213 (−0.351, 2.777) |
| 50 | 0.50 | 0.43 | 0.485 (0.088, 0.881) † | 0.663 (0.041, 1.285) | 0.702 (0.214, 1.191) * | 1.173 (0.102, 2.244) * |
| 60 | 0.50 | 0.24 | 0.529 (0.103, 0.955) † | 0.629 (−0.279, 1.537) | 0.625 (0.123, 1.127) * | 1.164 (−0.332, 2.661) |
| 70 | 0.66 | 0.43 | 0.407 (0.167, 0.647) † | 0.641 (0.043, 1.239) | 0.703 (0.461, 0.999) * | 1.149 (0.212, 2.086) * |
| 80 | 0.54 | 0.27 | 0.274 (0.067, 0.481) † | 0.426 (−0.140, 0.992) † | 0.823 (0.607, 1.039) * | 1.414 (0.589, 2.239) * |
| 90 | 0.61 | 0.60 | 0.341 (0.118, 0.565) † | 0.609 (0.201, 1.017) | 0.719 (0.508, 0.930) * | 1.126 (0.589, 1.663) * |
| 100 | 0.34 | 0.66 | 0.327 (−0.048, 0.702) † | 0.803 (0.329, 1.277) | 0.677 (0.350, 1.005) * | 0.833 (0.254, 1.412) * |
| Full | 0.72 | 0.65 | 0.694 (0.591, 0.797) † | 0.808 (0.664, 0.951) † | 0.412 (0.298, 0.525) * | 0.884 (0.663, 1.105) * |
| PUSH Bar | ||||||
| 40 | 0.62 | 0.59 | 0.923 (0.334, 1.512) | 0.515 (0.166, 0.863) † | 0.302 (−0.357, 0.961) | 1.329 (0.617, 2.042) |
| 50 | 0.54 | 0.11 | 0.502 (0.121, 0.882) † | 0.256 (−0.331, 0.843) † | 0.755 (0.342, 1.168) | 1.807 (0.652, 2.961) |
| 60 | 0.50 | 0.68 | 0.662 (0.126, 1.119) | 1.070 (0.478, 1.662) | 0.568 (0.017, 1.119) | 0.216 (−0.883, 1.316) |
| 70 | 0.24 | 0.08 | 0.227 (−0.102, 0.556) † | 0.140 (−0.256, 0.535) † | 0.951 (0.611, 1.291) | 1.889 (1.148, 2.629) |
| 80 | 0.35 | 0.06 | 0.242 (−0.026, 0.510) † | 0.128 (−0.281, 0.537) † | 0.872 (0.610, 1.134) | 1.808 (1.089, 2.527) |
| 90 | 0.41 | 0.26 | 0.395 (0.010, 0.780) † | 0.391 (−0.144, 0.926) † | 0.703 (0376, 1.031) | 1.349 (0.562, 2.137) |
| 100 | 0.23 | 0.60 | 0.286 (−0.138, 0.710) † | 0.579 (0.197, 0.961) † | 0.725 (0.372, 1.077) | 0.966 (0.407, 1.525) |
| Full | 0.62 | 0.48 | 0.765 (0.621, 0.910) † | 0.536 (0.400, 0.672) † | 0.414 (0.270, 0.558) | 1.169 (0.925, 1.412) |
| Bar Sensei | ||||||
| 40 | 0.82 | 0.47 | 0.761 (0.478, 1.045) | 0.591 (0.079, 1.103) | 0.218 (−0.198, 0.634) | 0.753 (−0.650, 2.156) |
| 50 | 0.82 | 0.22 | 0.621 (0.386, 0.856) † | 0.428 (−0.222, 1.077) | 0.439 (0.113, 0.765) * | 1.212 (−0.455, 2.879) |
| 60 | 0.73 | 0.61 | 0.520 (0.262, 0.777) † | 0.623 (0.218, 1.028) | 0.545 (0.197, 0.894) * | 0.706 (−0.269, 1.681) |
| 70 | 0.04 | 0.50 | 0.081 (−0.243, 0.405) † | 0.502 (0.095, 0.910) † | 1.085 (0.693, 1.478) * | 0.990 (0.047, 1.934) * |
| 80 | 0.07 | 0.69 | 0.110 (−0.198, 0.417) † | 0.582 (0.267, 0.897) † | 0.985 (0.645, 1.326) * | 0.781 (0.102, 1.460) * |
| 90 | 0.18 | 0.84 | 0.213 (−0.151, 0.577) † | 0.678 (0.442, 0.913) † | 0.821 (0.449, 1.193) * | 0.592 (0.128, 1.055) * |
| 100 | 0.02 | 0.57 | −0.071 (−0.460, 0.318) † | 0.507 (0.145, 0.869) † | 1.029 (0.657, 1.400) * | 0.866 (0.190, 1.542) * |
| Full | 0.73 | 0.74 | 0.569 (0.486, 0.652) † | 0.608 (0.522, 0.693) † | 0.479 (0.377, 0.580) * | 0.726 (0.528, 0.924) * |
© 2020 by the authors. Licensee MDPI, Basel, Switzerland. This article is an open access article distributed under the terms and conditions of the Creative Commons Attribution (CC BY) license (http://creativecommons.org/licenses/by/4.0/).
Share and Cite
Thompson, S.W.; Rogerson, D.; Dorrell, H.F.; Ruddock, A.; Barnes, A. The Reliability and Validity of Current Technologies for Measuring Barbell Velocity in the Free-Weight Back Squat and Power Clean. Sports 2020, 8, 94. https://doi.org/10.3390/sports8070094
Thompson SW, Rogerson D, Dorrell HF, Ruddock A, Barnes A. The Reliability and Validity of Current Technologies for Measuring Barbell Velocity in the Free-Weight Back Squat and Power Clean. Sports. 2020; 8(7):94. https://doi.org/10.3390/sports8070094
Chicago/Turabian StyleThompson, Steve W., David Rogerson, Harry F. Dorrell, Alan Ruddock, and Andrew Barnes. 2020. "The Reliability and Validity of Current Technologies for Measuring Barbell Velocity in the Free-Weight Back Squat and Power Clean" Sports 8, no. 7: 94. https://doi.org/10.3390/sports8070094
APA StyleThompson, S. W., Rogerson, D., Dorrell, H. F., Ruddock, A., & Barnes, A. (2020). The Reliability and Validity of Current Technologies for Measuring Barbell Velocity in the Free-Weight Back Squat and Power Clean. Sports, 8(7), 94. https://doi.org/10.3390/sports8070094