1. Introduction
Maximal oxygen uptake (VO
2max) and lactate threshold (LT) are often used to evaluate the physiological effect of endurance training and to predict performance in endurance sports for elite athletes [
1,
2]. These are generally tested in the laboratory to ensure that the measured parameters are both valid and reliable. Research on VO
2max and LT has been ongoing for almost a century and has been reviewed regularly; as a result, VO
2max and LT have been used as predictors of endurance performance [
3,
4,
5]. VO
2max is not only a measure of aerobic energy turnover, but is also considered to be a precise measure of lung capacity, heart rate and oxygen transport capacity of the blood, and the ability of muscles and mitochondria to utilize oxygen [
6].
LT is normally tested on a treadmill or in a specific movement pattern and is often used to monitor the training process and specific performance [
7]. The concept demonstrates that lactate accumulation occurs later (shifting to a higher percentage of VO
2max, at a lower heart rate and a higher workload) after a period of endurance training. In athletes, the level of work intensity that can be sustained for an extended period prior to lactate accumulation is an accurate predictor of endurance performance [
8]. In order to obtain steady state aerobic conditions, the stages used to assess LT should be longer than 4 min, and beyond the duration of stages used for incremental testing of VO
2max. Thus, LT and VO
2max are normally determined in two separate tests.
Testing elite athletes must be time effective and well-organized to prevent undue interference with their training schedule. Therefore, the two separate tests for determining LT and VO2max are often done on the same day. It is often difficult to organize scientific testing and training evaluation over several days, due to the influence of the elite athletes’ own training schedule.
The nature of one test, due to the degree of exhaustion and motivation, is hypothesized to affect results in the next test in the protocol with insufficient recovery. When testing VO
2max, the procedure in much scientific work and many test labs requires no exhausting activity the day before or the same day since this is expected to negatively influence the result [
9]. This also applies to the testing of LT, and it is hypothesized that an exhausting VO
2max test immediately before the test will negatively influence the La
-b values and LT speed. However, to our knowledge there is no scientific evidence to support the hypothesis that endurance tests will influence test outcome in the following test. The study aim was therefore to investigate the effect of the order of submaximal LT and VO
2max testing on test outcomes.
2. Materials and Methods
2.1. Methods
A within-subject repeated measures design with cross-over was used to investigate the effect of the order of submaximal LT and VO2max testing on test outcomes.
2.2. Subjects
The subjects in this study were twelve well-trained male cross-country skiers (mean age, SD 20.0 ± 1.7 years, body mass 71.5 ± 5.3 kg, height 1.81 ± 0.06 m). The participants were athletes that had trained and competed in cross-country skiing for 6–10 years and had competed at a national level for at least four years. All participants were familiar with running on a treadmill and the test protocols for VO2max and LT. Inclusion criteria were having a VO2max above 65 mL∙min−1∙kg−1. All participants were 18 years or older at the start of the study. All participants received written information about the entire content of the study and signed an informed consent prior to voluntary participation in the study. They were informed of their right to withdraw from the study at any time. The study was approved by the Norwegian Center for Research Data (NSD).
2.3. Procedures
To study whether the two tests influenced each other, the subjects performed the two test protocols within 48 h to 7 days. The order of each test combination was a within-subjects repeated measure with cross-over design, i.e., a VO2max test before an LT (VO2max -LT) or an LT test before the VO2max test (LT-VO2max). The athletes were tested in the lab on two occasions, at least 48 h apart. They were instructed to prepare as if they were going to participate in a competition, during the last 24 h before the test. All the athletes were to arrive well rested and hydrated, and all were given a standard light meal consisting of oat porridge topped with sugar, cinnamon and butter and apple juice, estimated at 285 Kcal, two hours before testing.
The skiers had 20 min with active recovery between the two tests. La
-b was monitored during the active recovery phase between the two tests in both protocols at 15, 10, 5 and 0 min before the LT test or VO
2max test. The test protocols contained a 15 min warm-up at 60% of VO
2max, followed by a measurement of La
-b in the fingertip (La
-b); this La
-b value was taken as a baseline from which the LT test was calculated [
10].
The VO
2max test was an incremental uphill running test with increasing speed by 1 km h
−1 every min until exhaustion at 10.5% inclination on a 2.5 × 0.7 m motor-driven treadmill (RL 2500E, Rodby, Södertalje, Sweden). Gas exchange was measured continuously and VO
2max was defined if two out of the following three criteria were reached: (1) attaining a plateau in VO
2 despite increased intensity, (2) respiratory exchange ratio (RER) > 1.10, and (3) peak La
-b > 8 mmol/L [
11]. The LT test was also an incremental uphill treadmill running test, but with increasing speed by 1 km h
−1 every five min with a standard break of one min for recording of RPE, end heart rate, La
-b and increase in the speed on the treadmill. LT was defined as the running speed when the subject’s La
-b increased by ≈ 4.0 mmol/L or by more than 1.0 mmol/L between two intervals [
12]. A visual control of the break point where La
-b increased exponentially was also conducted. Several laboratories use a detection method that includes warm-up values of +1.5 mmol/L [
13], while others use a fixed 4.0 mmol/L [
14]. Researchers have tried to establish an accurate measure of LT [
15] and there is an accepted concept of a right shift of the curve as a sign of improved LT level, but there are no generally accepted values or methods for detecting the LT itself. To avoid fatigue, the LT-VO
2max test was aborted when the subjects had reached an La
-b of 4 mmol/L, which has been used as the absolute highest value of LT testing [
12]. To investigate the physical response to the test protocol, VO
2 was measured during the last 3 min of every interval in the LT test. The subjects wore a nose clip and a mouthpiece for the VO
2 measurement during the whole interval, while running.
2.4. Measurements
La
-b were determined from 20-μL samples from the fingertip and analyzed by the BIOSEN C-line Sport (EKF Diagnostic, Magdeburg. Germany). HR was measured with a heart rate monitor (Polar RC3GPS, Polar Electro OY, Kempele, Finland), using a five-second interval for data storage. Body mass was measured with an electronic body mass scale (Seca model no. 708, Seca GmbH & Co, Hamburg, Germany) and height with a stadiometer (Holtain Ltd., Crosswell, UK). Rating of perceived exertion (RPE) was recorded using the 6–20 point Borg Scale [
16].
Oxygen uptake was measured by an Oxycon Pro with a mixing chamber (Jaeger GmbH, Höchberg, Germany), and the mean of the three highest consecutive 10-sec measurements of VO
2 at each stage was designated as VO
2peak [
1]. At the start of each fifth test daily, the VO
2 and VCO
2 gas analyzers were calibrated against both ambient air and a commercial mixture of high-precision gases (15.920 ± 0.04% O
2 and 5.030 ± 0.1% CO
2, CareFusion Gas GmbH, Höchberg, Germany). The O
2 and CO
2 content of the ambient air was recorded, and the flow meter was calibrated with a 3-L high-precision syringe (Hans Rudolph Inc., Kansas City, Missouri, USA). A Polar RC3GPS (Polar Electro OY, Kempele. Finland) was used to measured HR every five sec. Calibration of the La
-b analyzer was performed every hour and checked using a standard of 12 mmol/L. Voltage was assessed using a Redicom Norm solution of 2.69–3.35 mmol/L.
2.5. Statistical Analysis
All data were controlled for normality and the Shapiro–Wilk test concluded that the data were normally distributed. No data were excluded from the study. One and two-way ANOVA with repeated measurements on test order were used for the physiological and perceptual responses during and at the end of the LT and VO2max tests. Post-hoc comparisons with Holm–Bonferroni corrections were conducted to determine differences. When sphericity assumptions were violated, Greenhouse–Geisser adjustments of the p-values were reported. The effect size used and reported in this study was partial eta squared (η2), where 0.01 ≤ η2 < 0.06 constituted a small effect, 0.06 ≤ η2 < 0.14 constituted a medium effect, and η2 < 0.14 constituted a large effect (Cohen, 1988). The level of significance was set at p ≤ 0.05 for all tests and the analyses were carried out with SPSS Statistics v24 (SPSS Inc., Chicago, IL, USA). To assess reliability of the performances (time to exhaustion) and dependent physiological responses (VO2max, heart rate) at the end of both tests in each order, the ICC (2,1) and the coefficient of variation (CV) were calculated.
3. Results
The HR (132 ± 11 vs. 131 ± 12 beats/min) and La-b values (1.15 ± 0.30 vs. 1.25 ± 0.39 mmol/L) immediately after the warming up were not significantly different before starting the two test occasions.
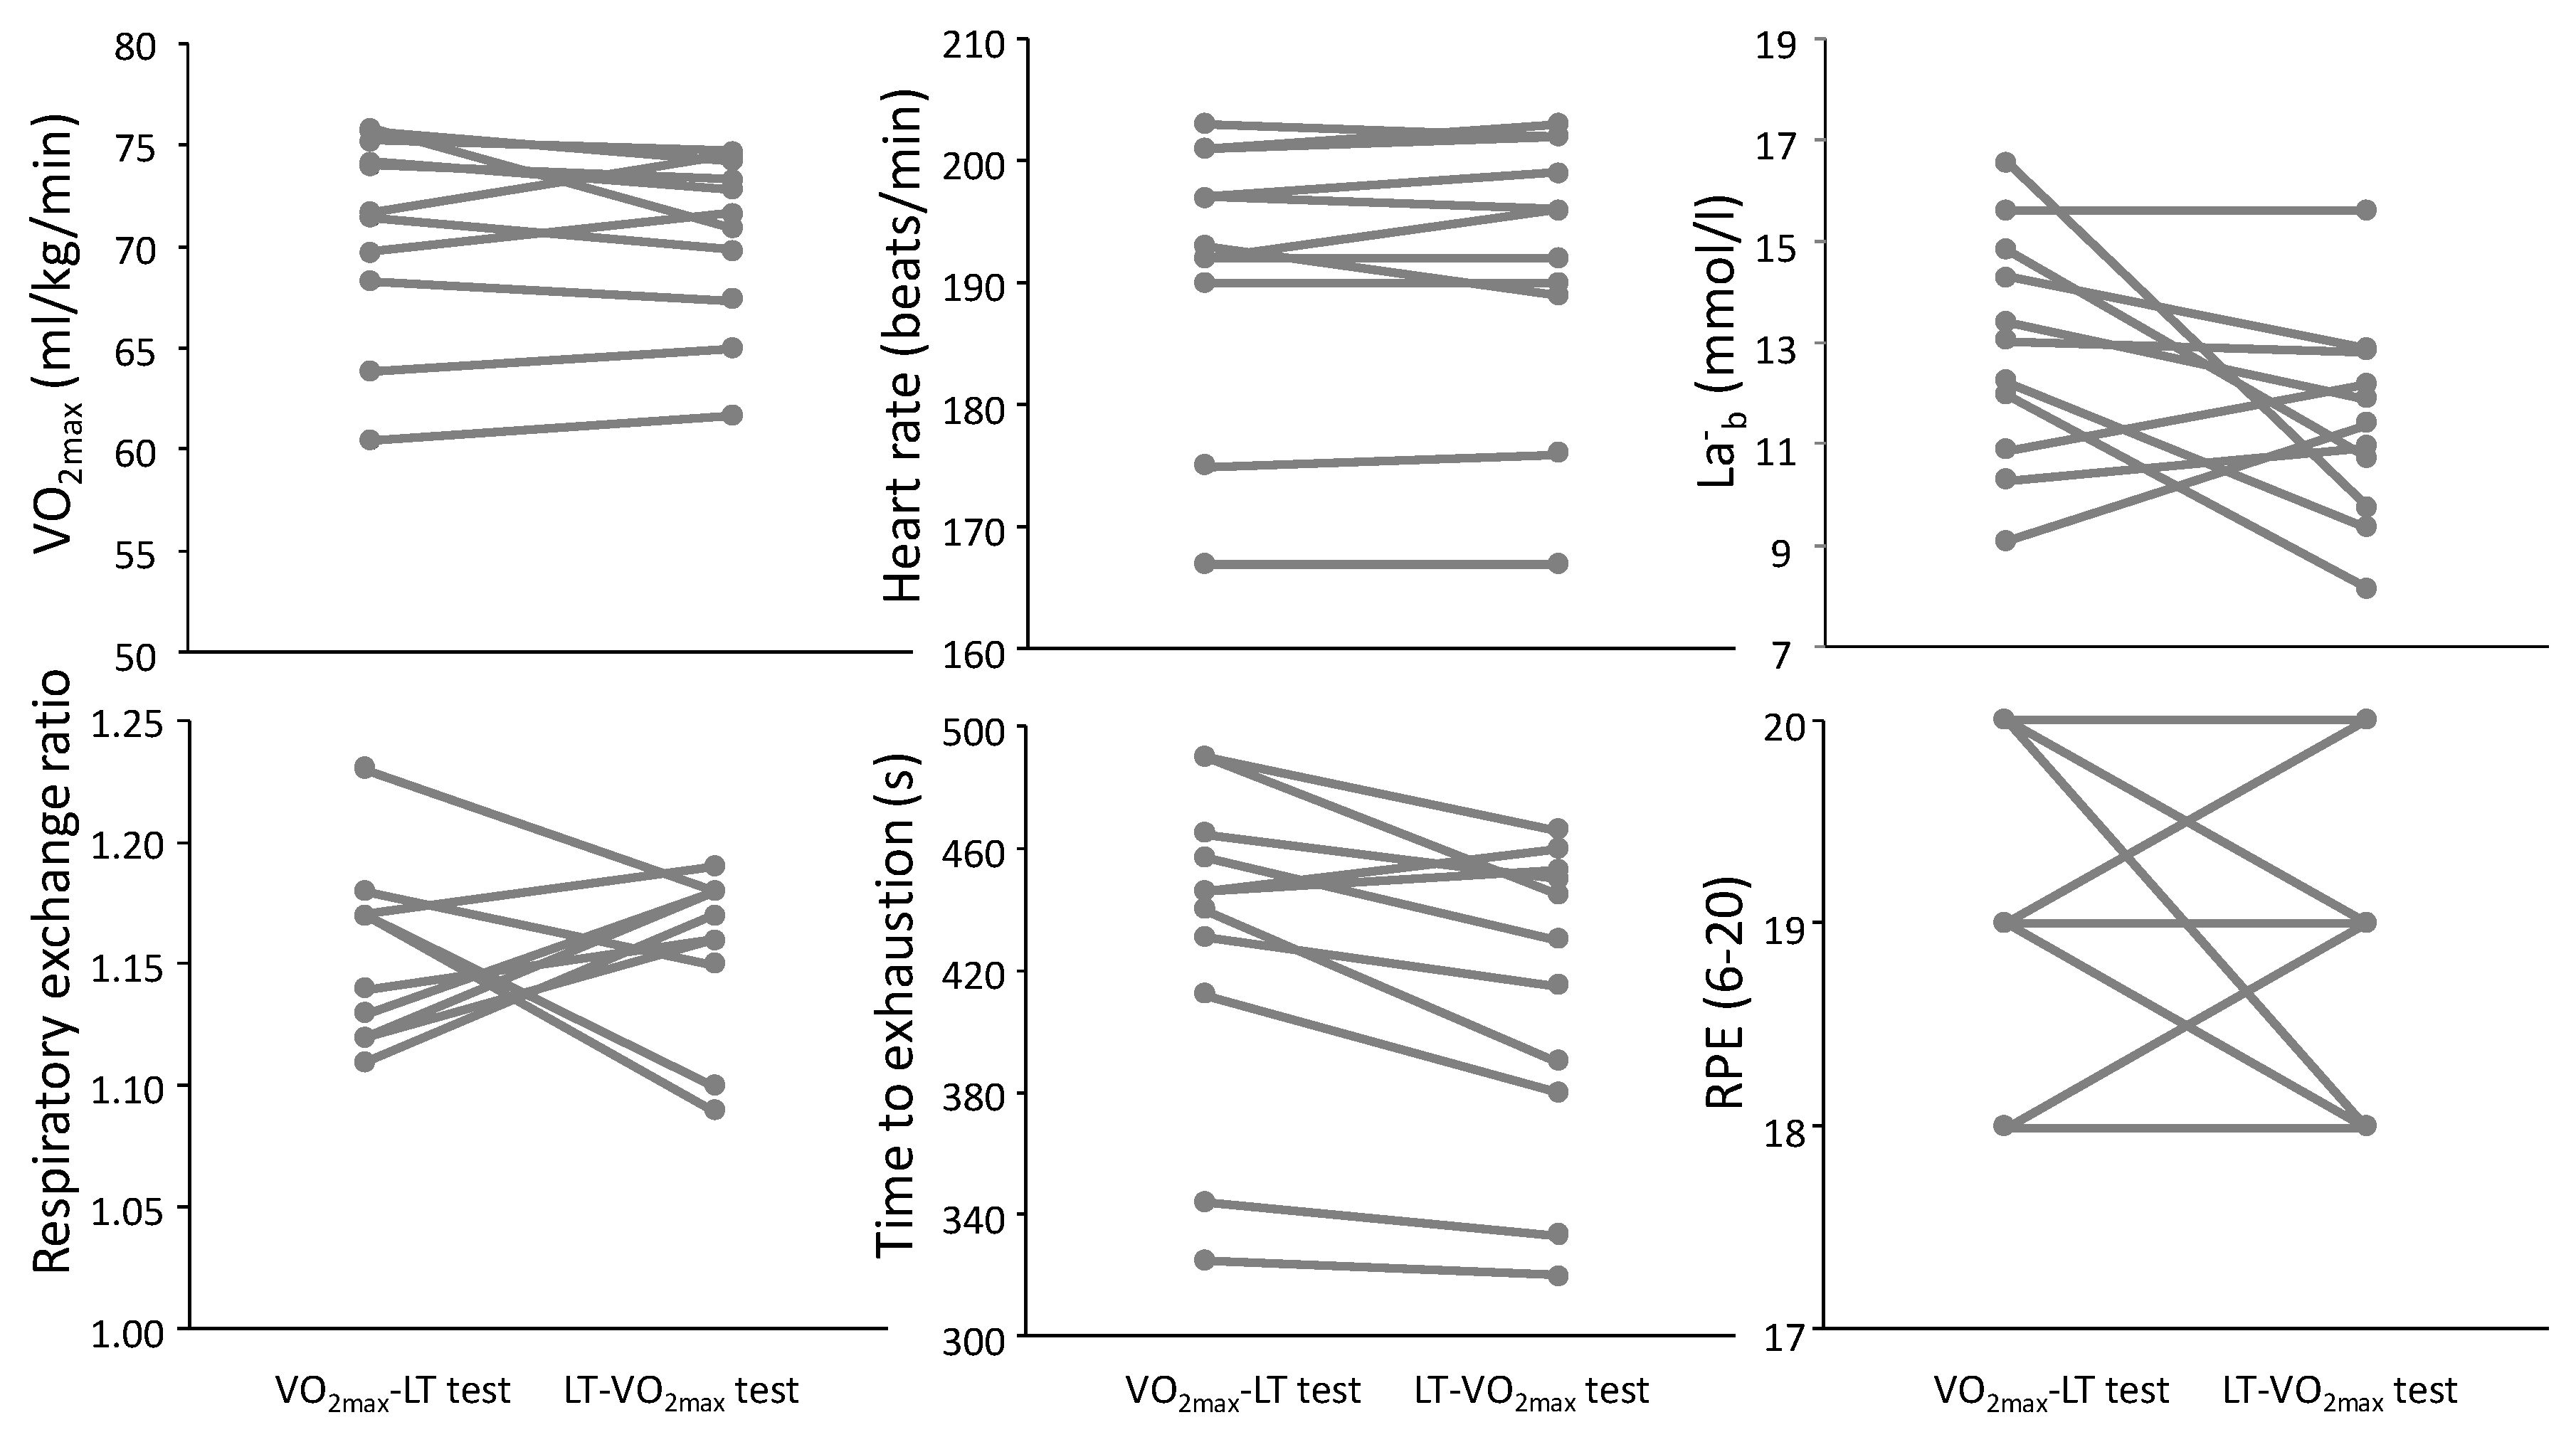
No significant differences were found due to the testing order of the VO
2max test (
Table 1 and
Figure 1). In the VO
2max test, no significant differences between test conditions were found for any of the physiological and perceptual responses (F ≤ 3.04,
p ≥ 0.107, η
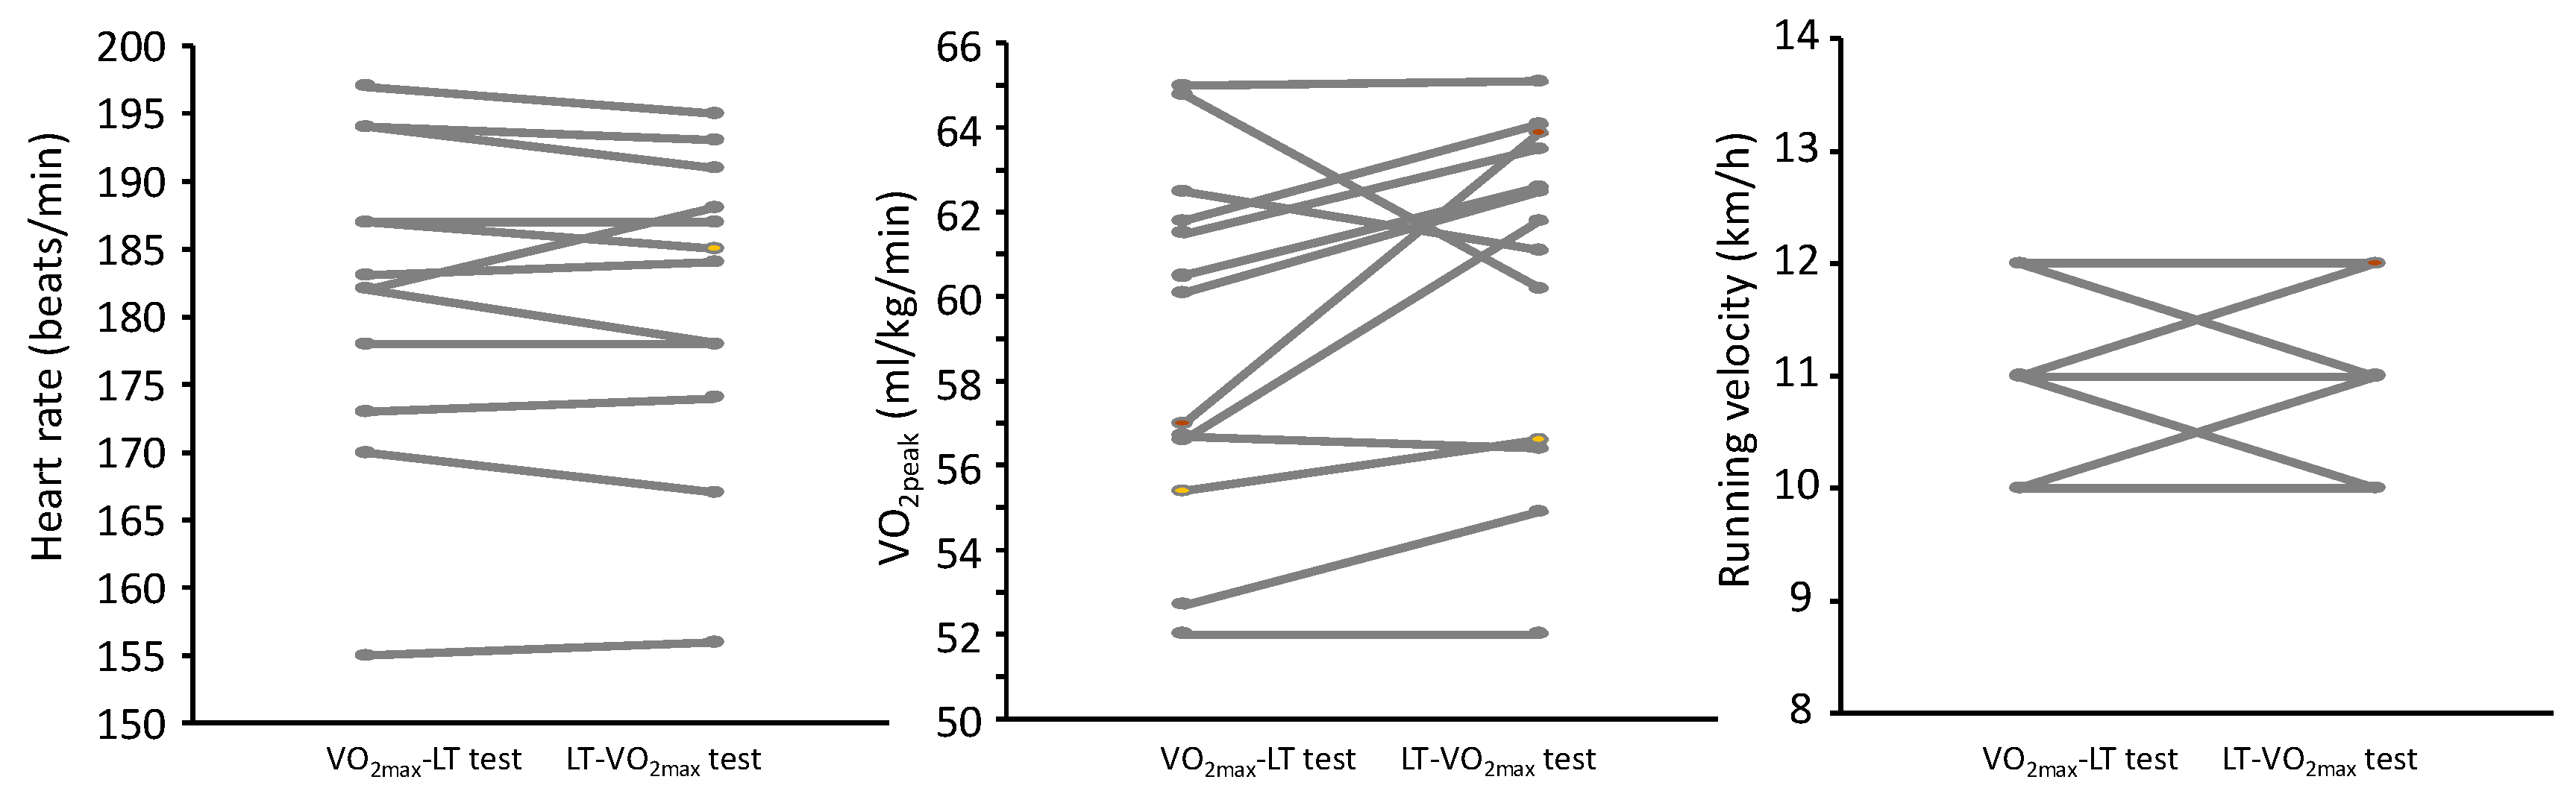
2 ≤ 0.20). At the end of the LT test (
Table 2 and
Figure 2), there were also no significant differences for any of the physiological and perceptual responses (F ≤ 3.04,
p ≥ 0.105, η
2 ≤ 0.20). Furthermore, the ICCs varied from 0.87 (VO
2peak at end LT test) to 0.99 (HR at end of VO
2max and LT tests) with CVs varying from 0.62 to 3.9%.
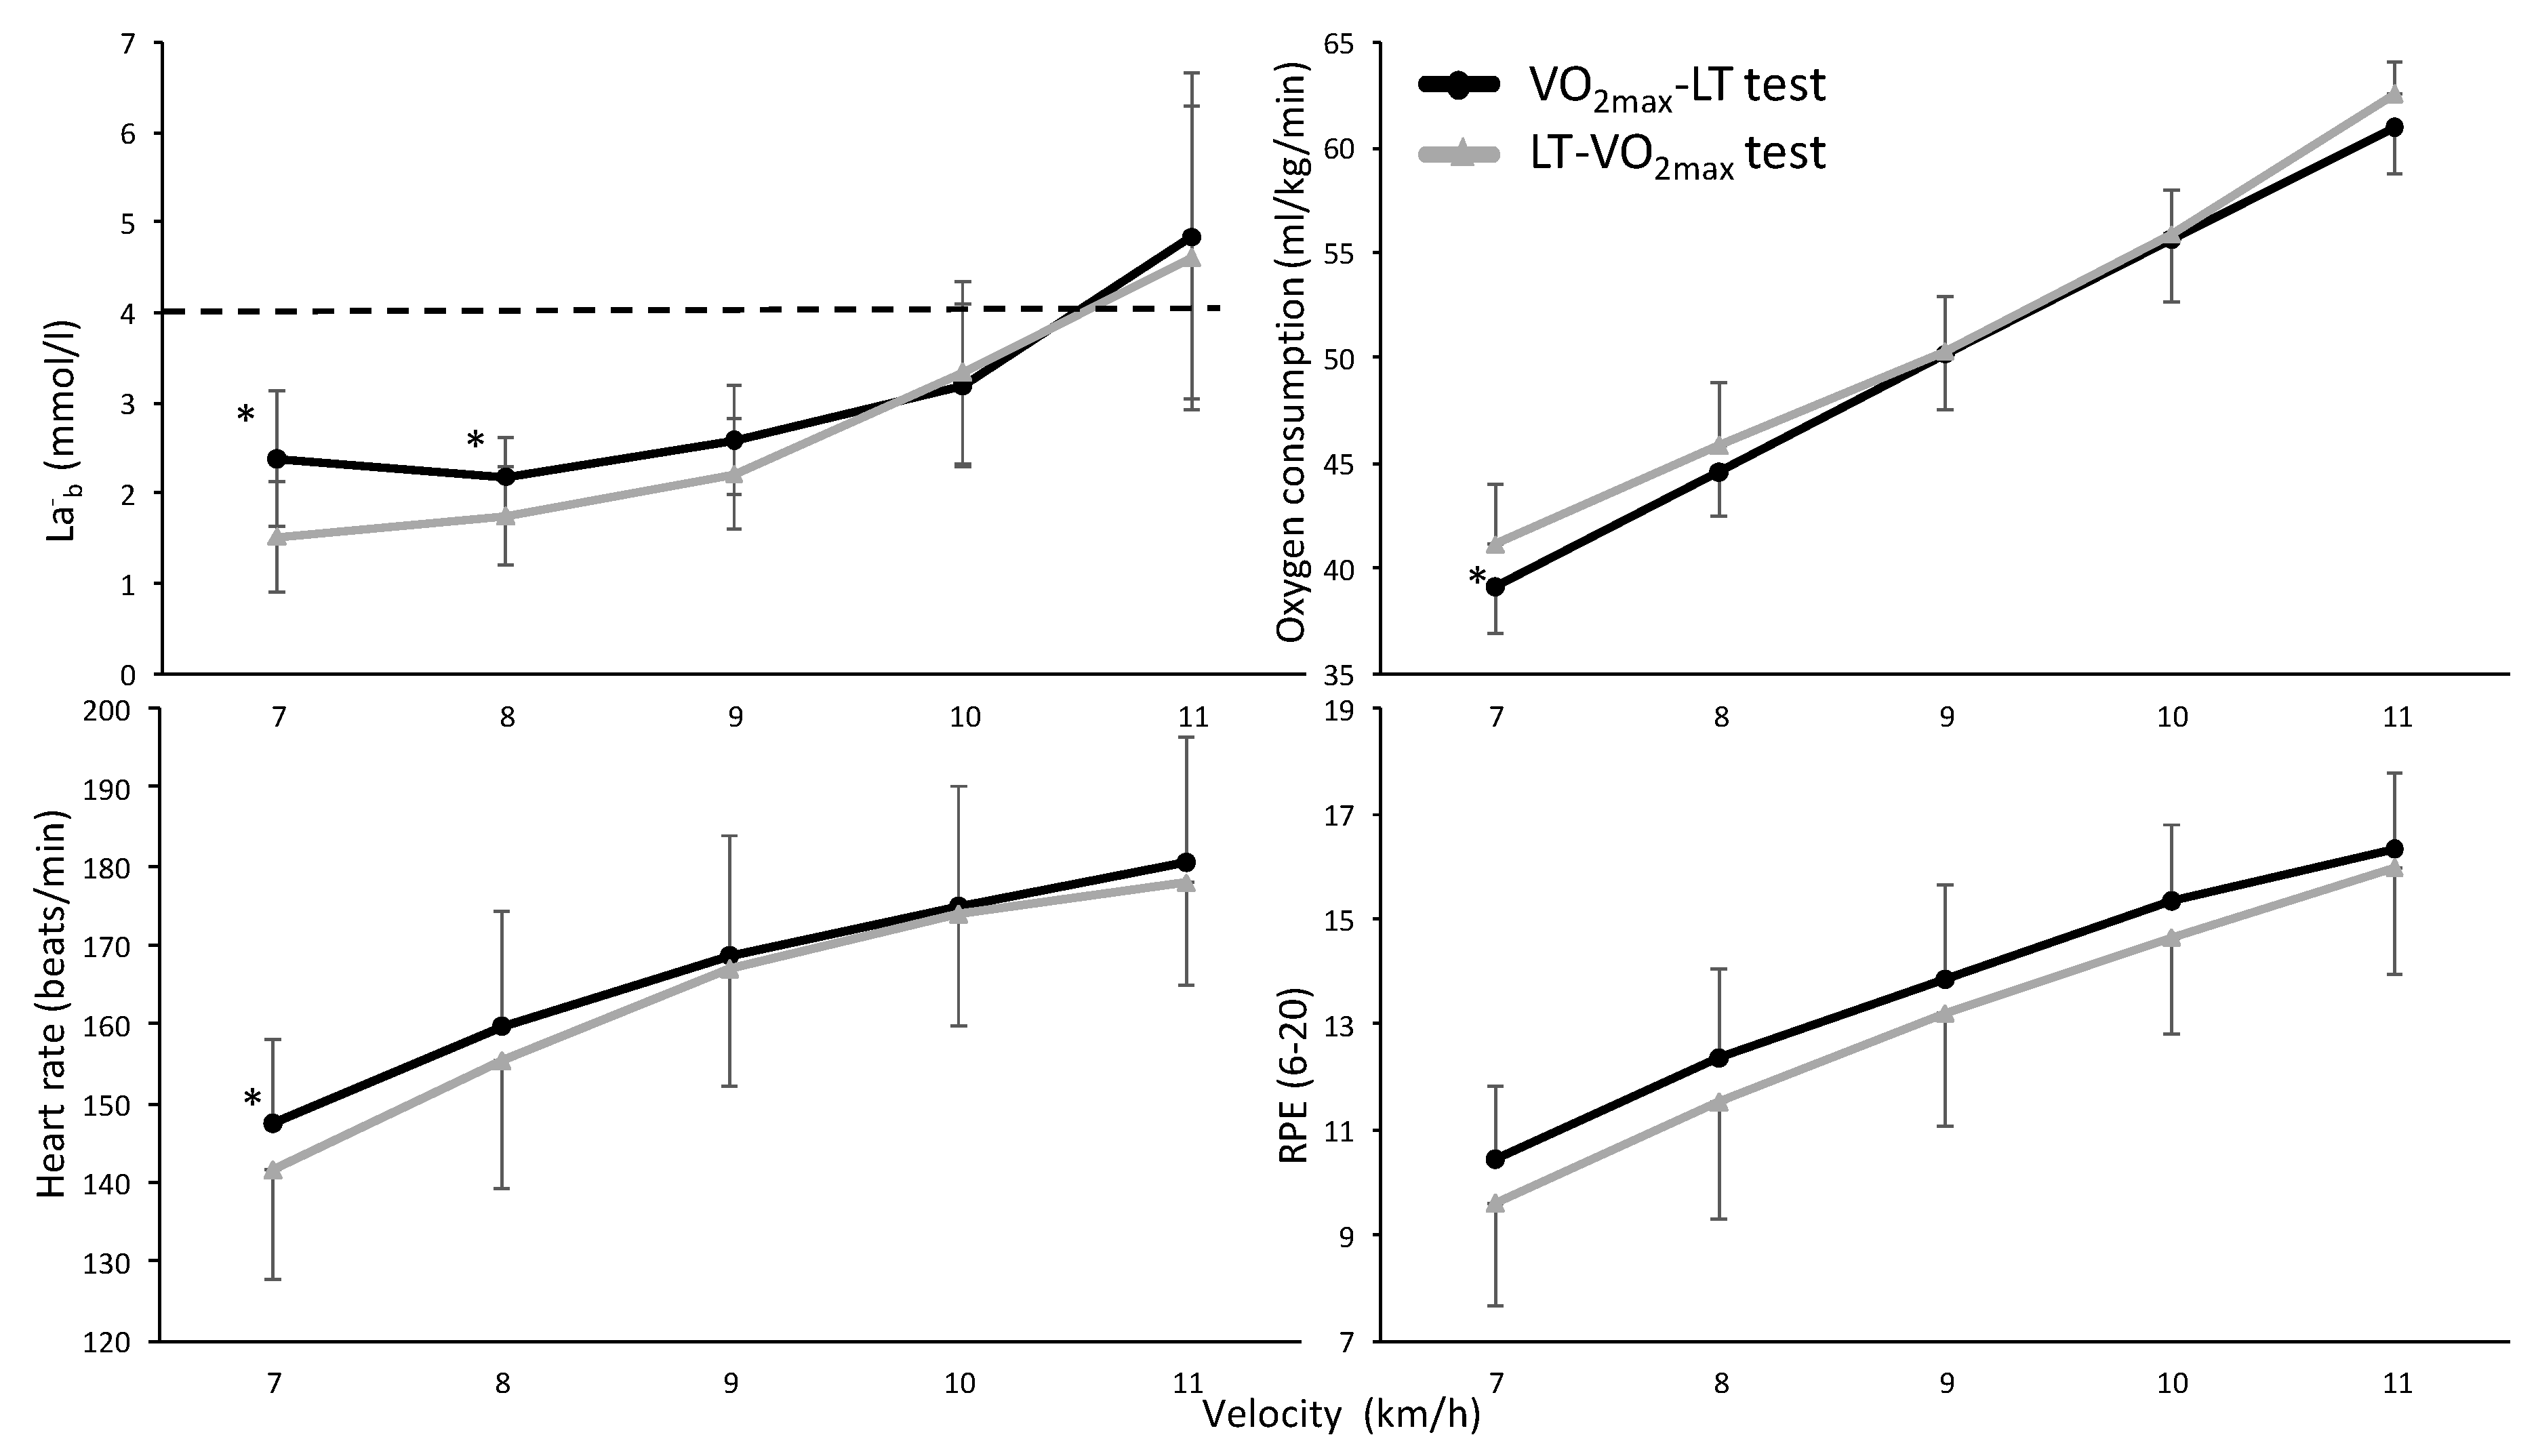
A significant effect was found for all physiological and perceptual parameters during the LT test (F ≥ 26.2,
p ≤ 0.001, η
2 ≥ 0.79); all parameters increased with increasing running velocity (
Figure 3). No significant effect for testing order (F ≤ 1.28,
p ≥ 0.30, η
2 ≤ 0.15) or interaction effect (F ≤ 1.9,
p ≥ 0.125, η
2 ≤ 0.22) was found for these parameters. However, post hoc comparison revealed lower HR, La
-b and oxygen uptake at 7 km/h when starting with the LT test than when starting with the VO
2max test. In addition, at 8 km/h the La
-b values were still lower in the LT-VO
2max test order compared with the VO
2max-LT test order (
Figure 3).
La
-b concentrations after completing the first tests were 12.9 ± 2.1 and 4.8 ± 1.6 after the VO
2max and LT tests and decreased significantly every five min. Fifteen min after conducting the LT test, La
-b had reached a similar level to just after the warm-up, while the La
-b concentration after the VO
2max test still had not reached the values of immediately after the warm-up (
Figure 4). However, no left or right shift of the La
-b curve was observed.
4. Discussion
This study investigated the effect of testing order of the VO2max and LT test in the same session upon these aspects of performance in these two tests. Our main findings, for well-trained cross-country skiers, were that no physiological differences were found due to the testing order. The exception was at the start of the LT test after conducting the VO2max-LT protocol first, where the physiological parameters tested were higher than in the opposite testing order. Furthermore, the La-b concentration 20 min after the VO2max test did not reach similarly low levels to the warm-up, while after 15 min of the LT-VO2max protocol, the La-b levels were similar to those just after the warming up session. This resulted in higher values (La-b, HR and VO2) in the two first steps of the VO2max-LT protocol, without any effect on the speed at LT.
The results of this study do not support the recommendation given in the testing methodology concerning the effect of having exhaustive activity the same day or the day before. These recommendations take all precautions into consideration, such as the level of the athlete, sex, age and body composition. However, the subjects in this study, well-trained cross-country skiers, were not significantly affected by either of the two protocols on reaching VO
2max or establishing the level of LT. Their ability to push themselves to exhaustion may be dependent on the fact that they are used to training for long periods, with several training sessions per day, compared to untrained subjects. However, the ability to reach physical parameters is reported to be independent of physical training status [
17]. By contrast, Berglund et al. [
18] speculate that fit individuals are better at pushing themselves to exhaustion than unfit individuals. Athletes at a lower physical activation level would probably have greater difficulty with a submaximal test after a maximal test in one test session. However, the RPE were slightly, but not significantly, higher (0.6–0.8) for the first two steps of the VO
2max-LT protocol compared to the LT-VO
2max protocol. Despite 20 min of active recovery after a VO
2max test, one may expect to feel a little more exhausted than without. These findings indicate that most healthy, well-trained elite cross-country skiers reach similar values for LT and VO
2max independently of the two test protocols despite the slightly higher RPE in the first two steps.
In both test conditions, all subjects achieved the criteria for VO
2max and there was no significant difference in VO
2max between HR
peak, La
-b, RER and reaching a plateau in VO
2 despite increasing workload. The subjects also reported the same subjective exhaustion (RPE). It is also to be noted that the subjects had the same running speed and time to exhaustion. The difference was also within the expected day to day variation of 2 mL∙min
−1∙kg
−1. The level of VO
2max is considered to be a relatively rough measure of endurance capacity; the measure is relatively stable within the variance of the equipment and day to day variation and quite easy to reach [
11]. Our findings show that VO
2max is not affected by previous activity in trained athletes and that they reach their VO
2max in both test protocols. This test on well-trained athletes is not affected by activity at and just over the LT on the same day.
However, it must be considered that a normal improvement of quality endurance training in VO
2max per year, in well-trained athletes, is reported to be 2 mL∙min
−1∙kg
−1 [
19]. This indicates the importance of accuracy in the test procedure, if the aim is to measure the effect of endurance training on VO
2max rather than to establish a level of VO
2max.
We assume that if the most important goal is to evaluate the effect of training on the level of VO2max and the athlete and the researcher have limited time and resources in the test conditions, an VO2max-LT protocol is preferable. To prevent any form of bias, the best protocol in research is probably a plain VO2max test.
The speed at LT seems to be unaffected by a prior exhausting VO
2max in well-trained cross-country skiers. The La
-b values were higher at the two first velocity levels of the VO
2max-LT protocol. The VO
2 and HR were also significantly higher at the first level. However, there were no significantly higher RPE values at these two workloads. The break following the VO
2max test was 20 min, containing easy walking at 4 km/h, 10% inclination, resting and preparing actively for the LT protocol. During this time the La
-b values declined from an average of 11.37 mmol/L to 2.78 mmol/L, but not down to warm-up level. La
-b continued to decrease to 2.25 mmol/L at the end of the first step, and further down to 2.07 mmol/L after step two. This indicates that the active recovery and the workloads at the two first steps in the VO
2max-LT protocol brought the La
-b values down to the level below LT values at steps three and four. At step three, the La
-b values were identical (3.02 mmol/L) in the two protocols. The different methods to determine LT (4 mmol/L, break point or first workload that elevated La
-b values more than 1 mmol/L between the two steps) did not correspond with different speeds or oxygen uptake between protocols (LT-VO
2max vs. VO
2max-LT). There was also no right or left shift of the La
-b curve due to protocol, which would have been proof of an effect of the test order. If the use of a warming up La
-b value of + 1.5 mmol/L was used, this would give different detection of the LT La
-b values (3.0 and 3.8 mmol/L) due to the higher warming up values in the VO
2max-LT protocol. In that way, the LT test would be stopped at a lower running speed in the VO
2max-LT protocol than in the LT-VO
2max (10.9 vs. 10.5 km/h in the present study). Thereby, the VO
2max-LT protocol would underestimate the LT, while it was shown in the present study that in the later stages of the LT test, in both protocols, the same development and values were observed. This indicates that the 4.0 mmol/L fixed method combined with the more than 1.0 mmol/L increase of La
-b between two speed intervals is perhaps a better method to use when performing a LT and VO
2max test after each other. It must also be considered that the LT measurements also tend to show higher day-to-day variation than VO
2max and HR
max [
20]. No such observation was made in our study.


