Absolute and Relative Strength, Power and Physiological Characteristics of Indian Junior National-Level Judokas


Abstract
1. Introduction
2. Materials and Methods
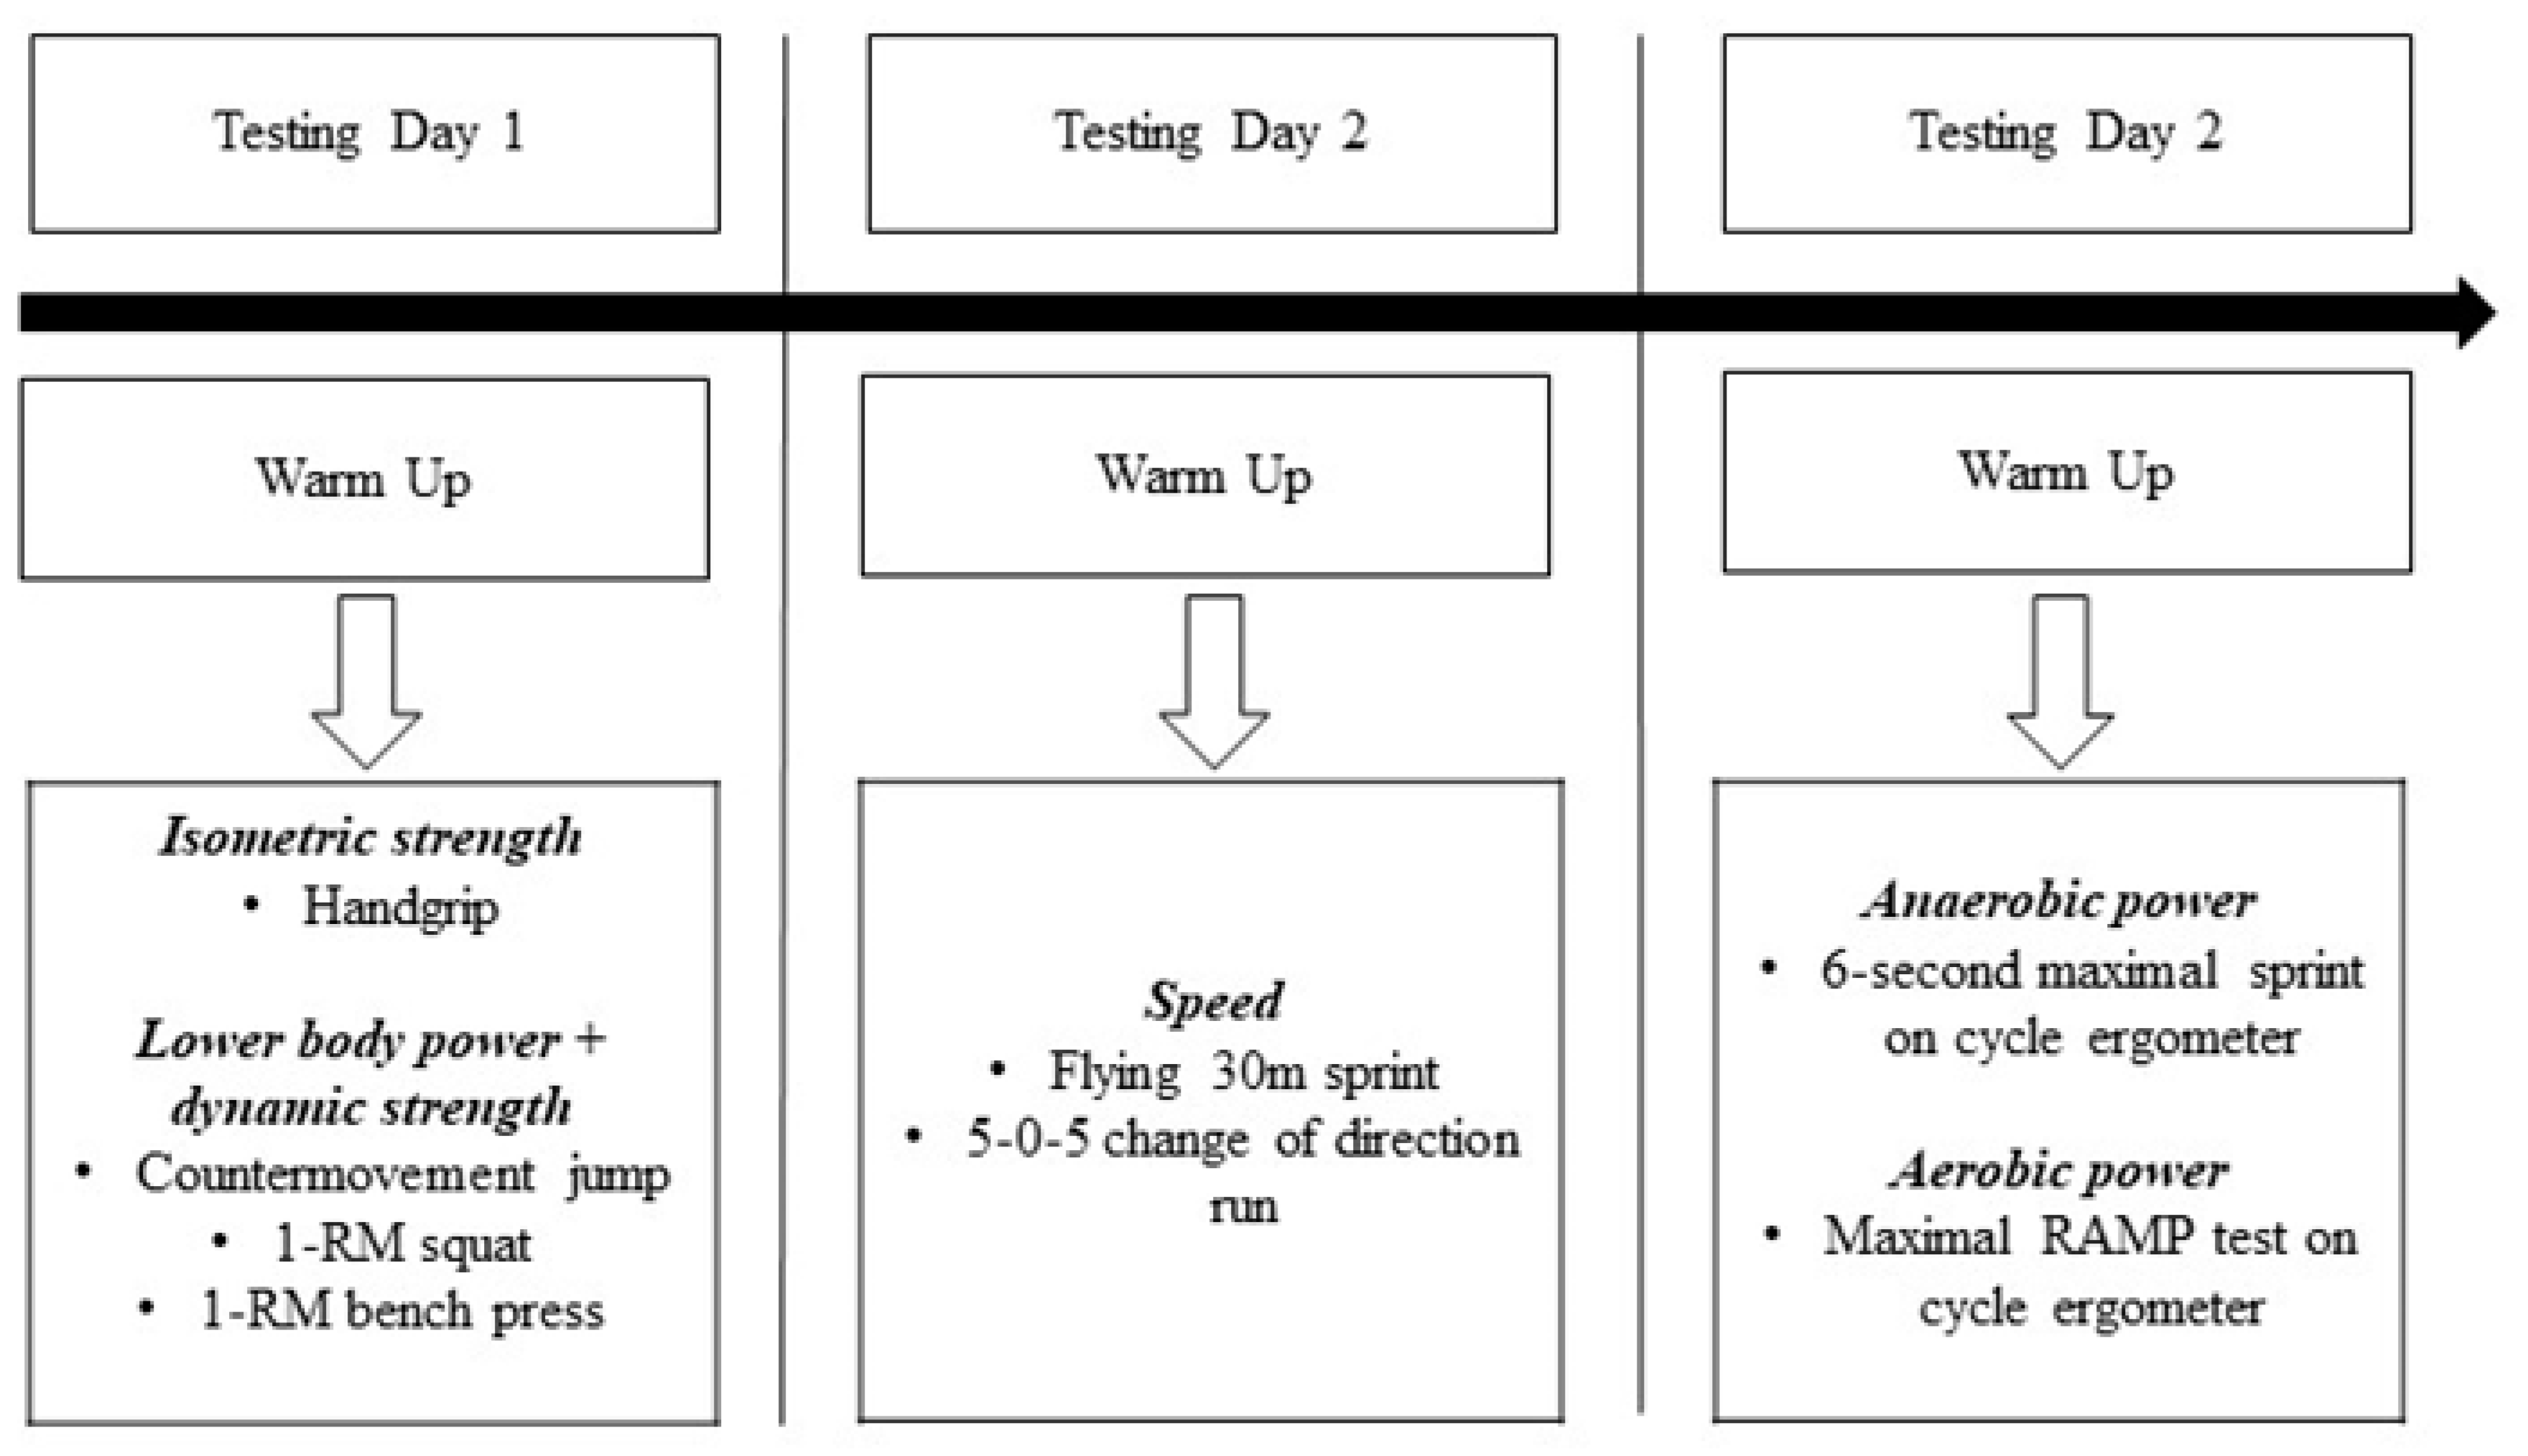
2.1. Experimental Approach to the Problem
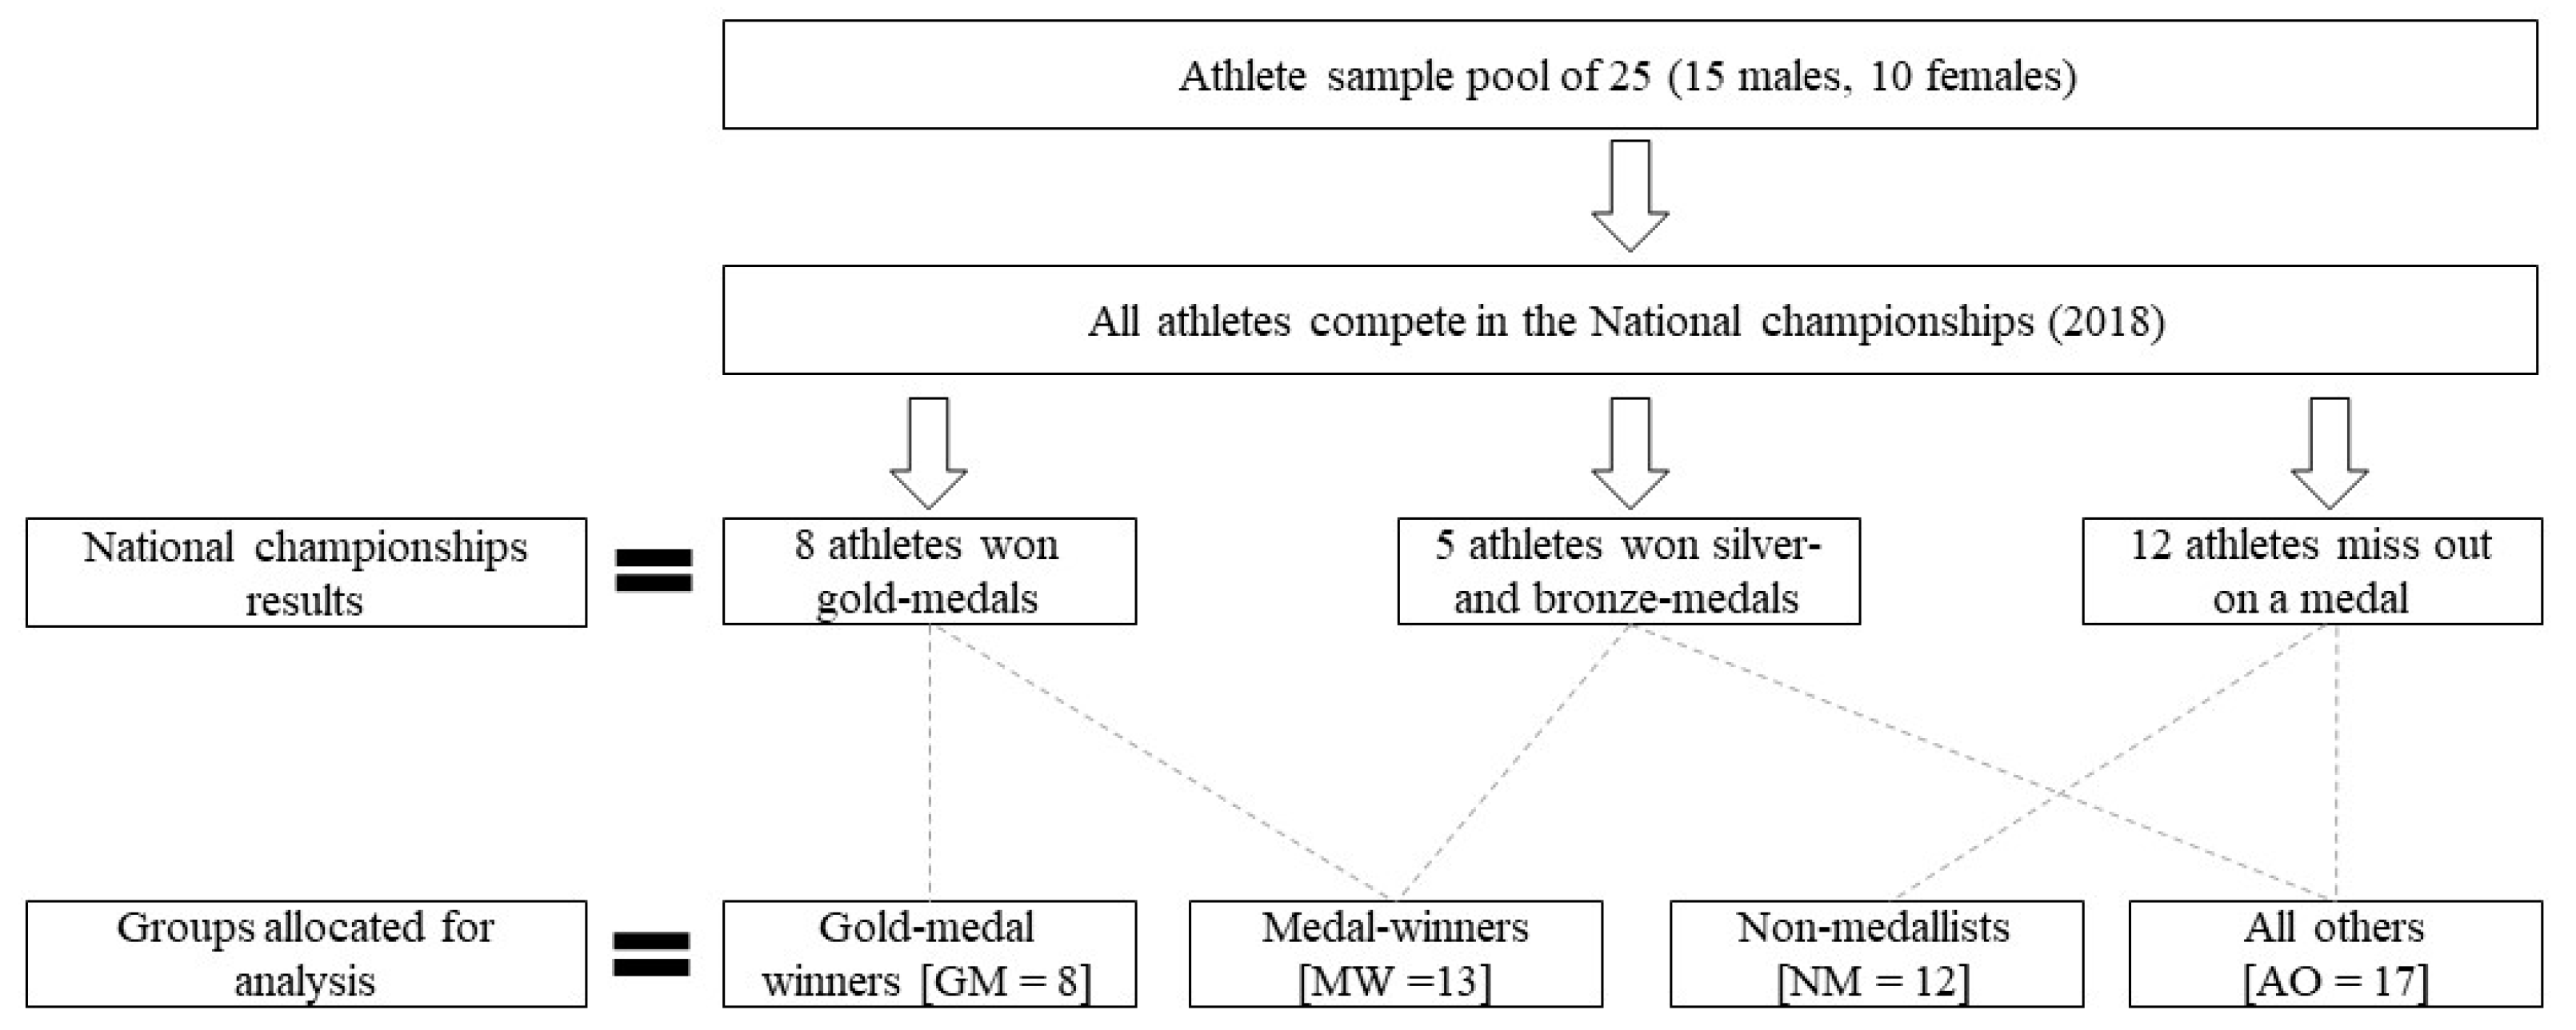
2.2. Subjects
2.3. Testing Day One
2.4. Testing Day Two
2.5. Testing Day Three
2.6. Statistical Analyses
3. Results
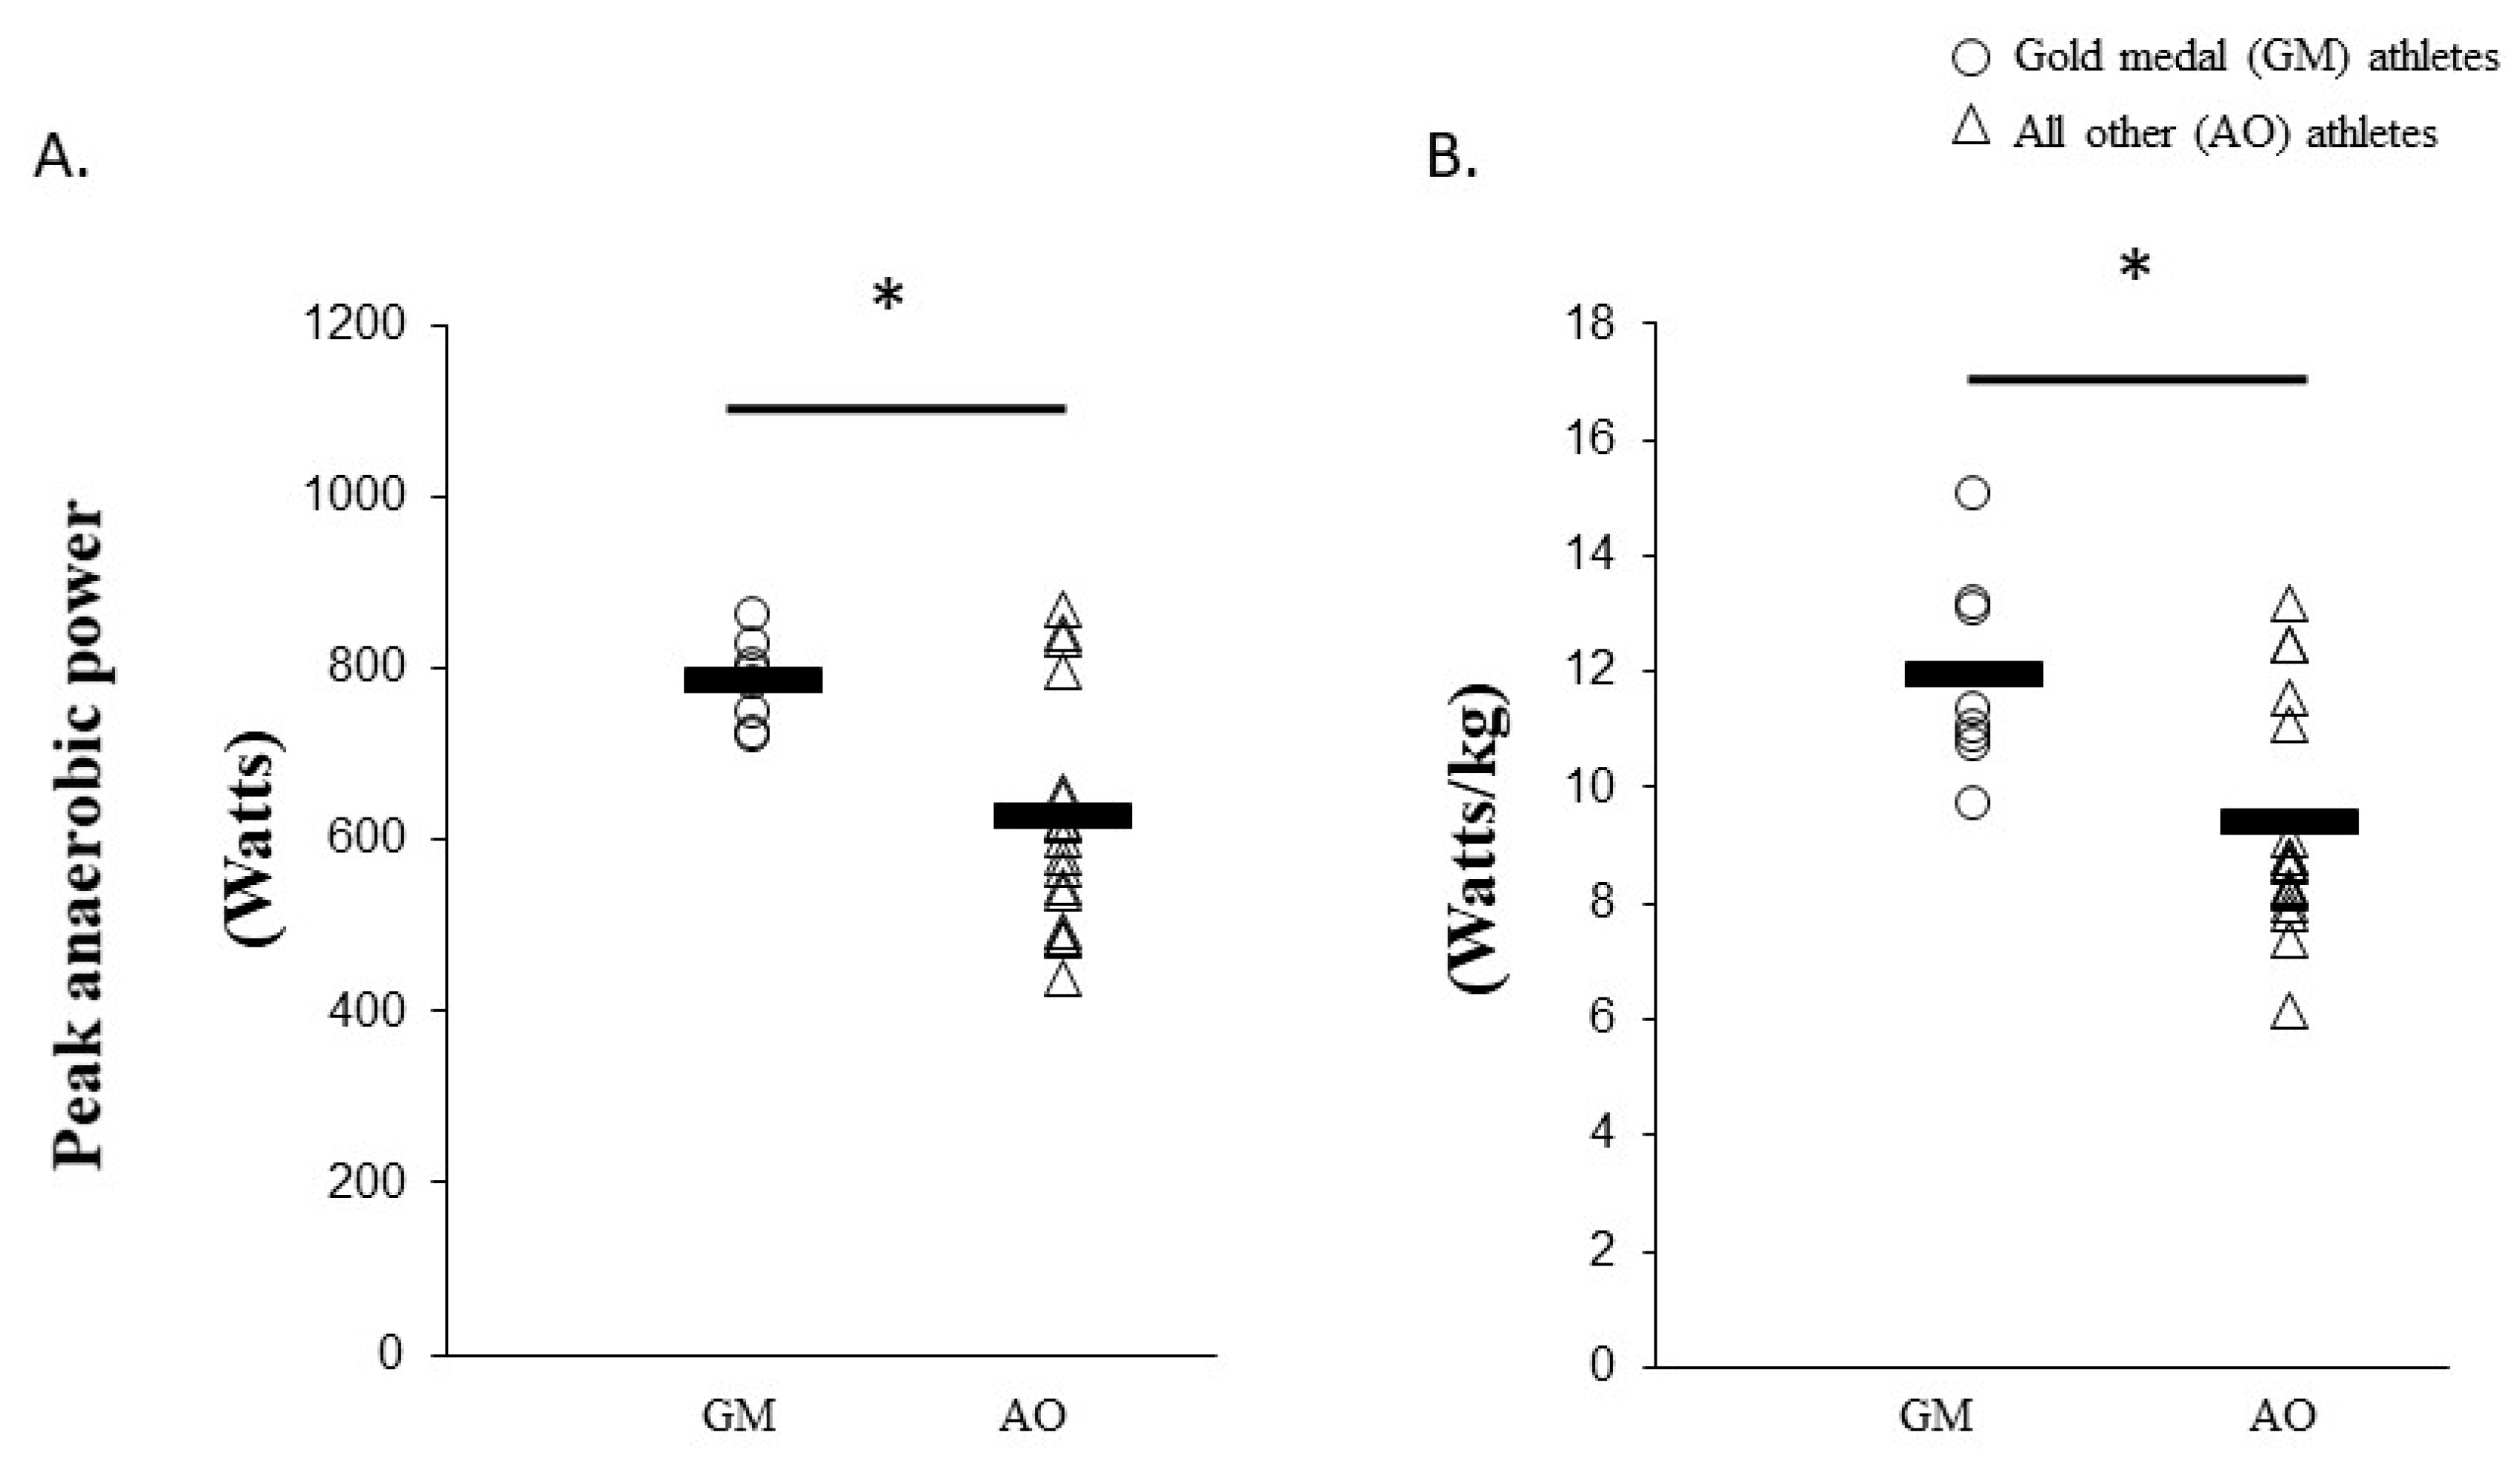
3.1. Anaerobic Power
3.2. Aerobic Power
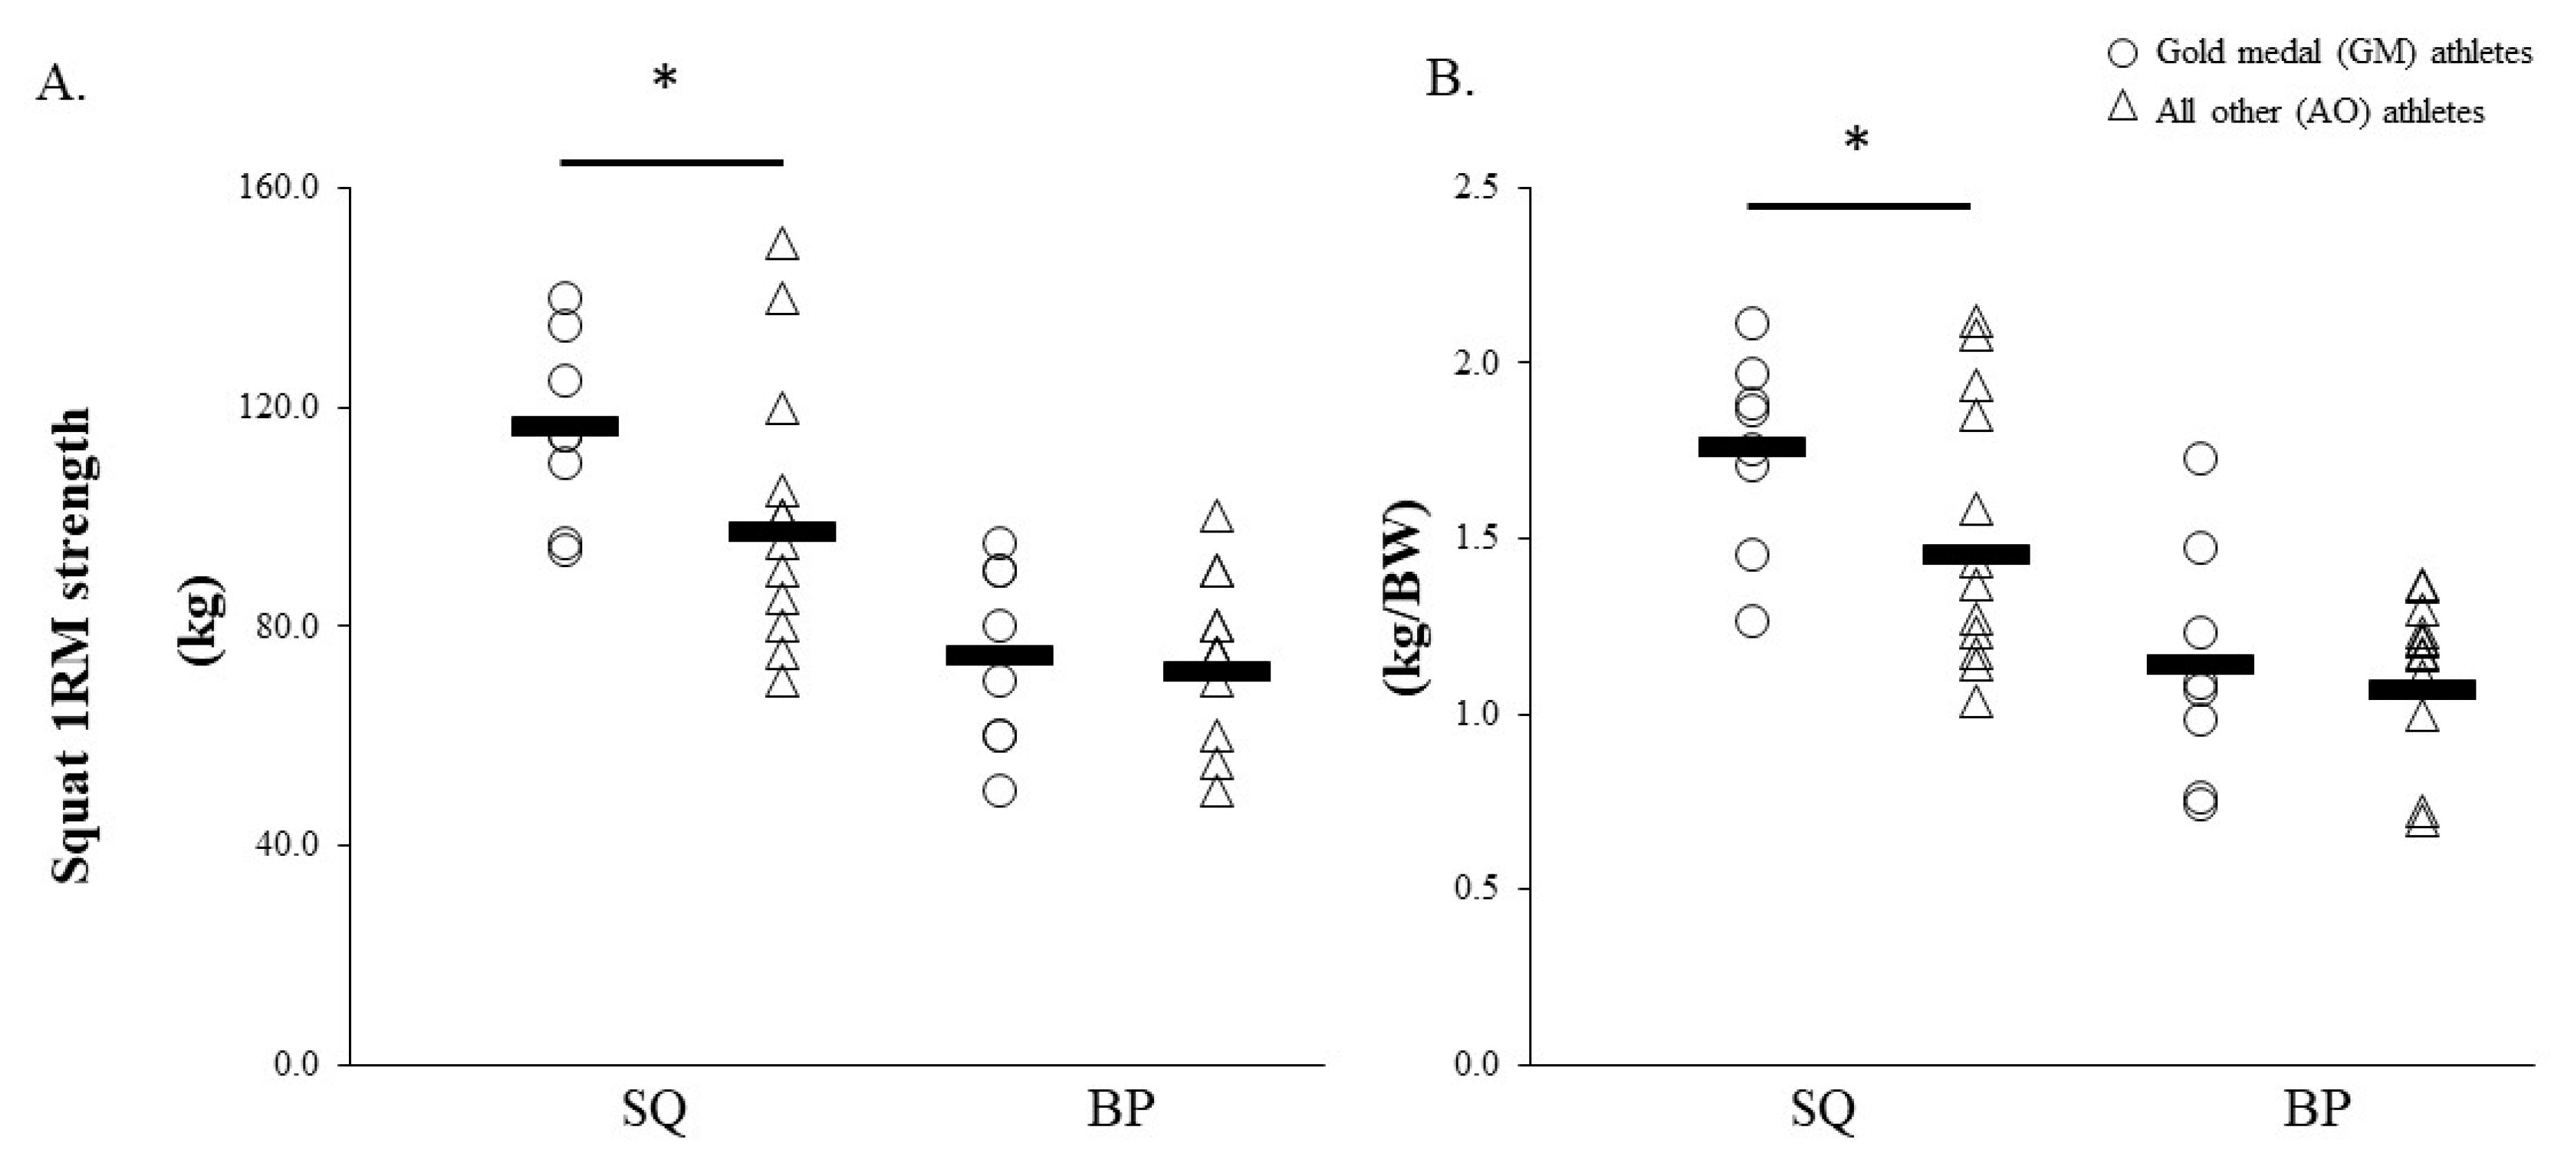
3.3. Strength
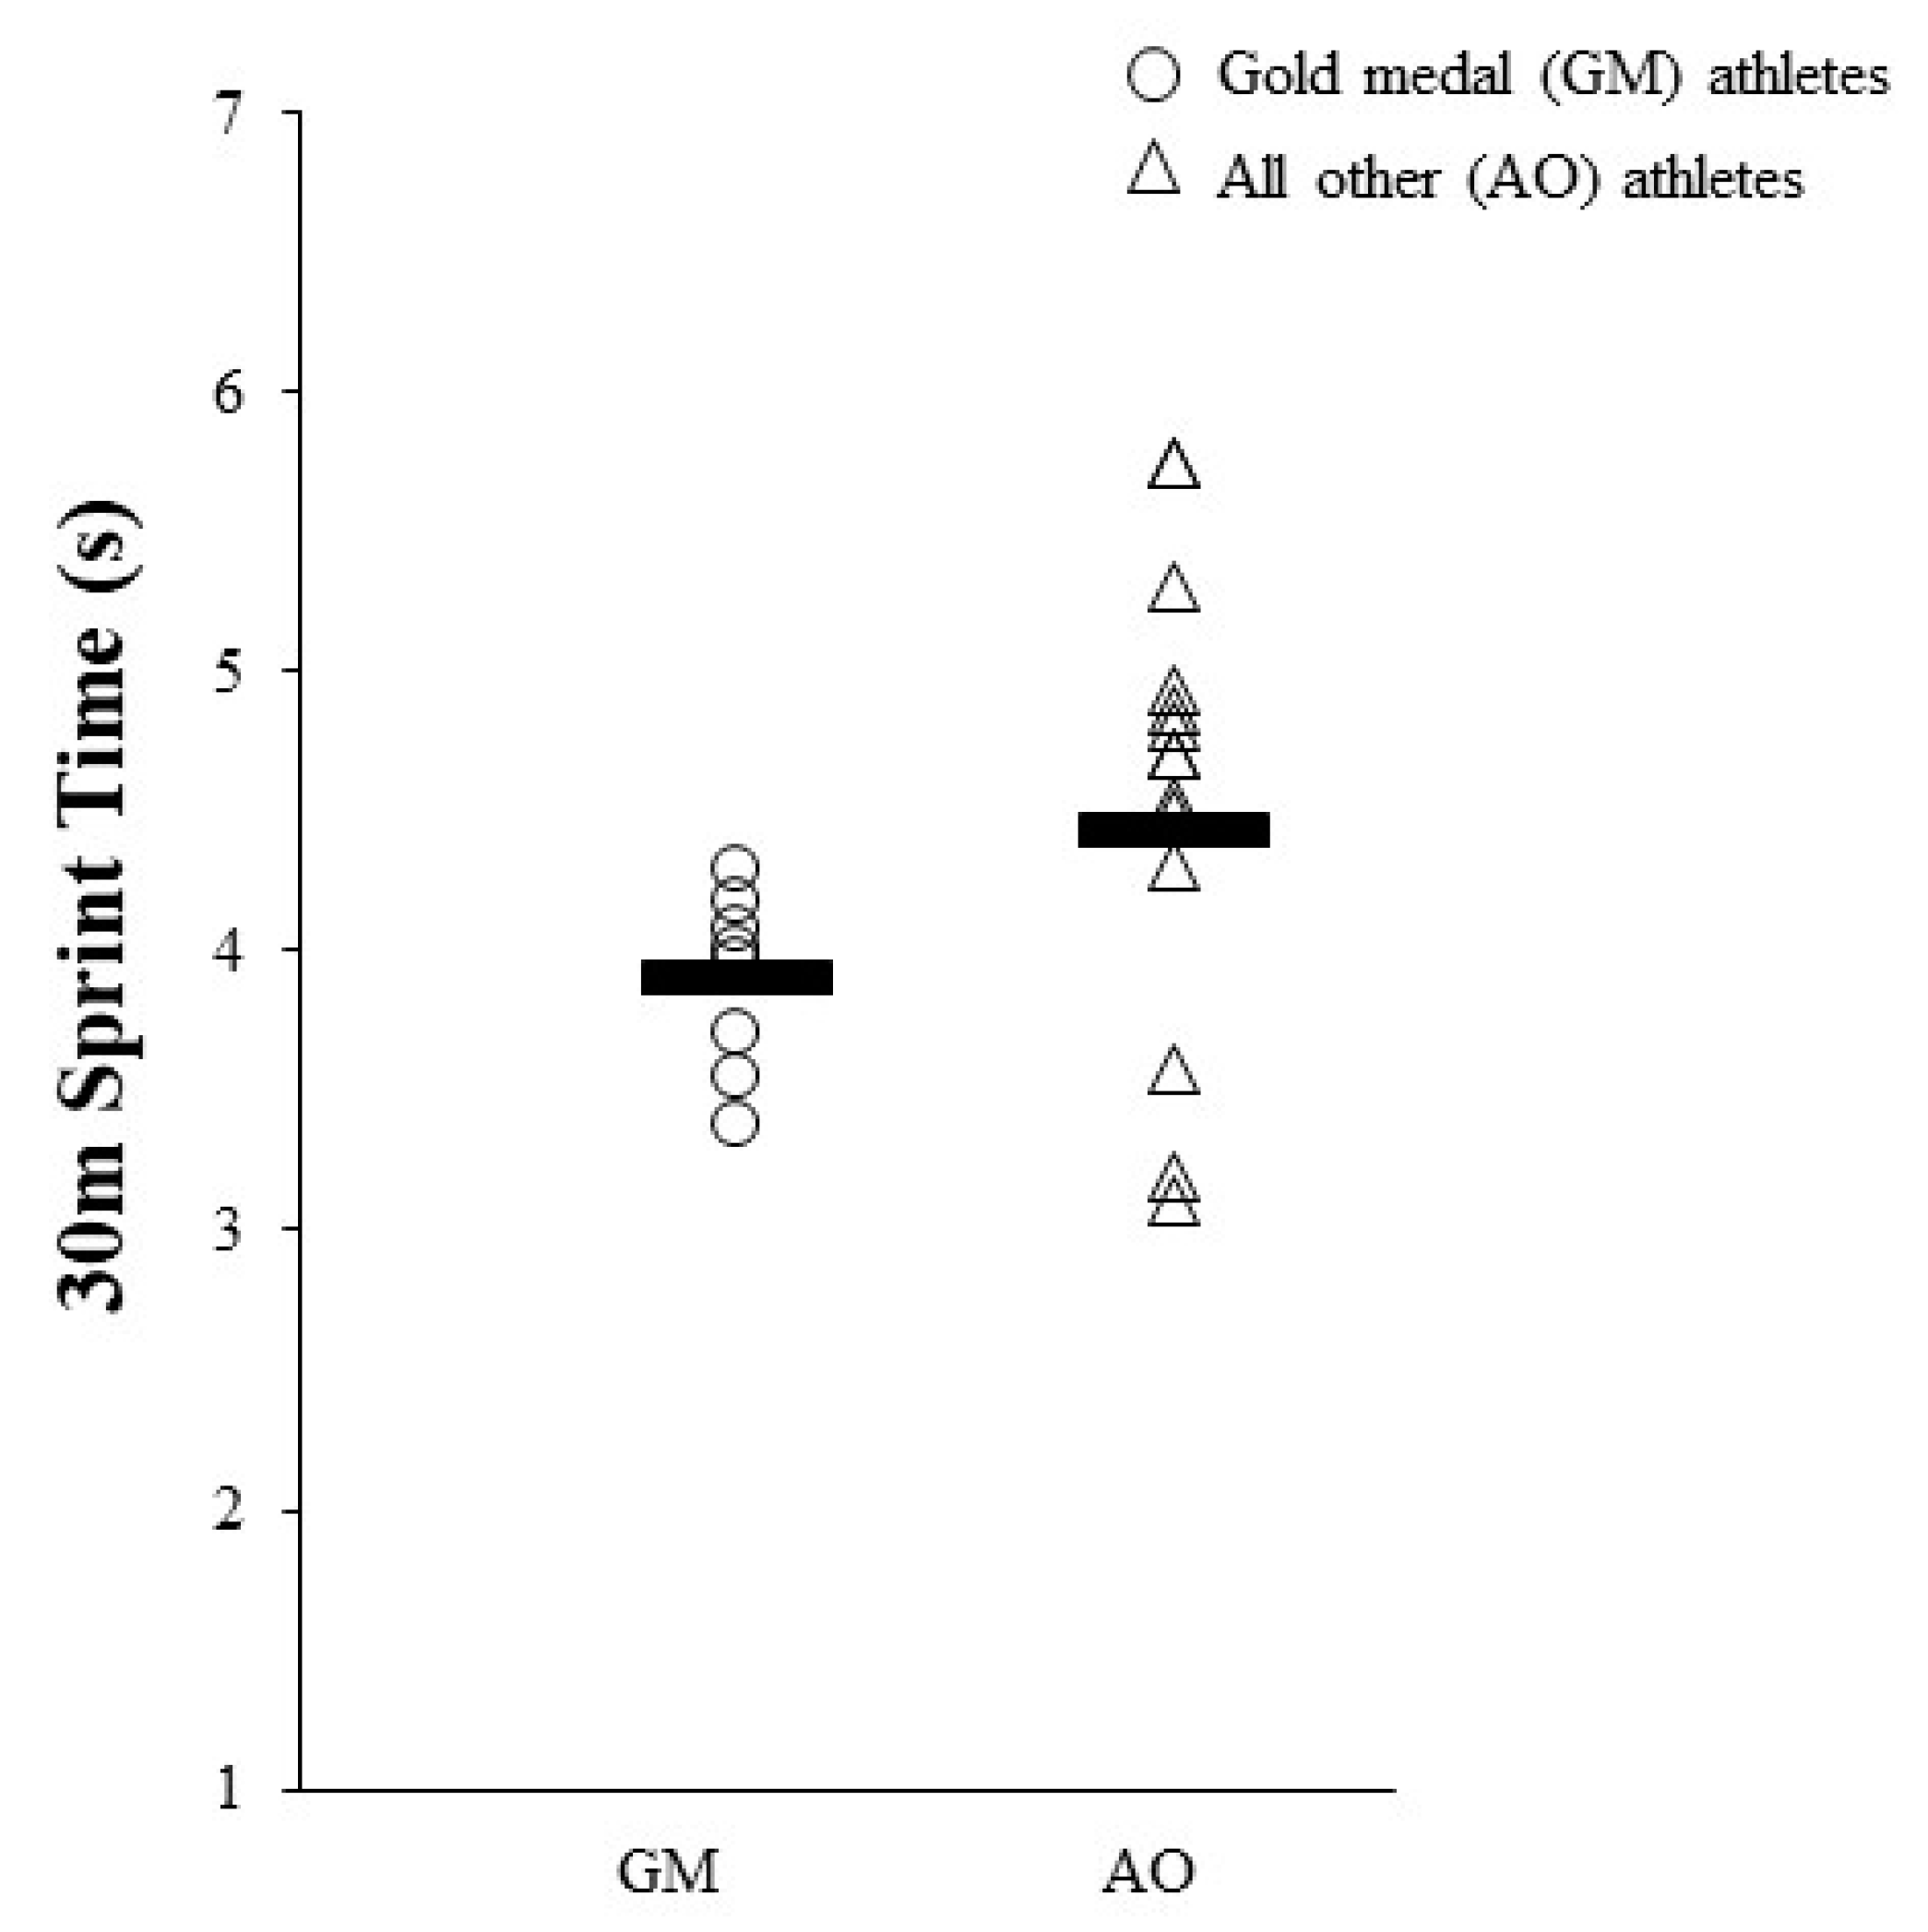
3.4. Speed
3.5. Power
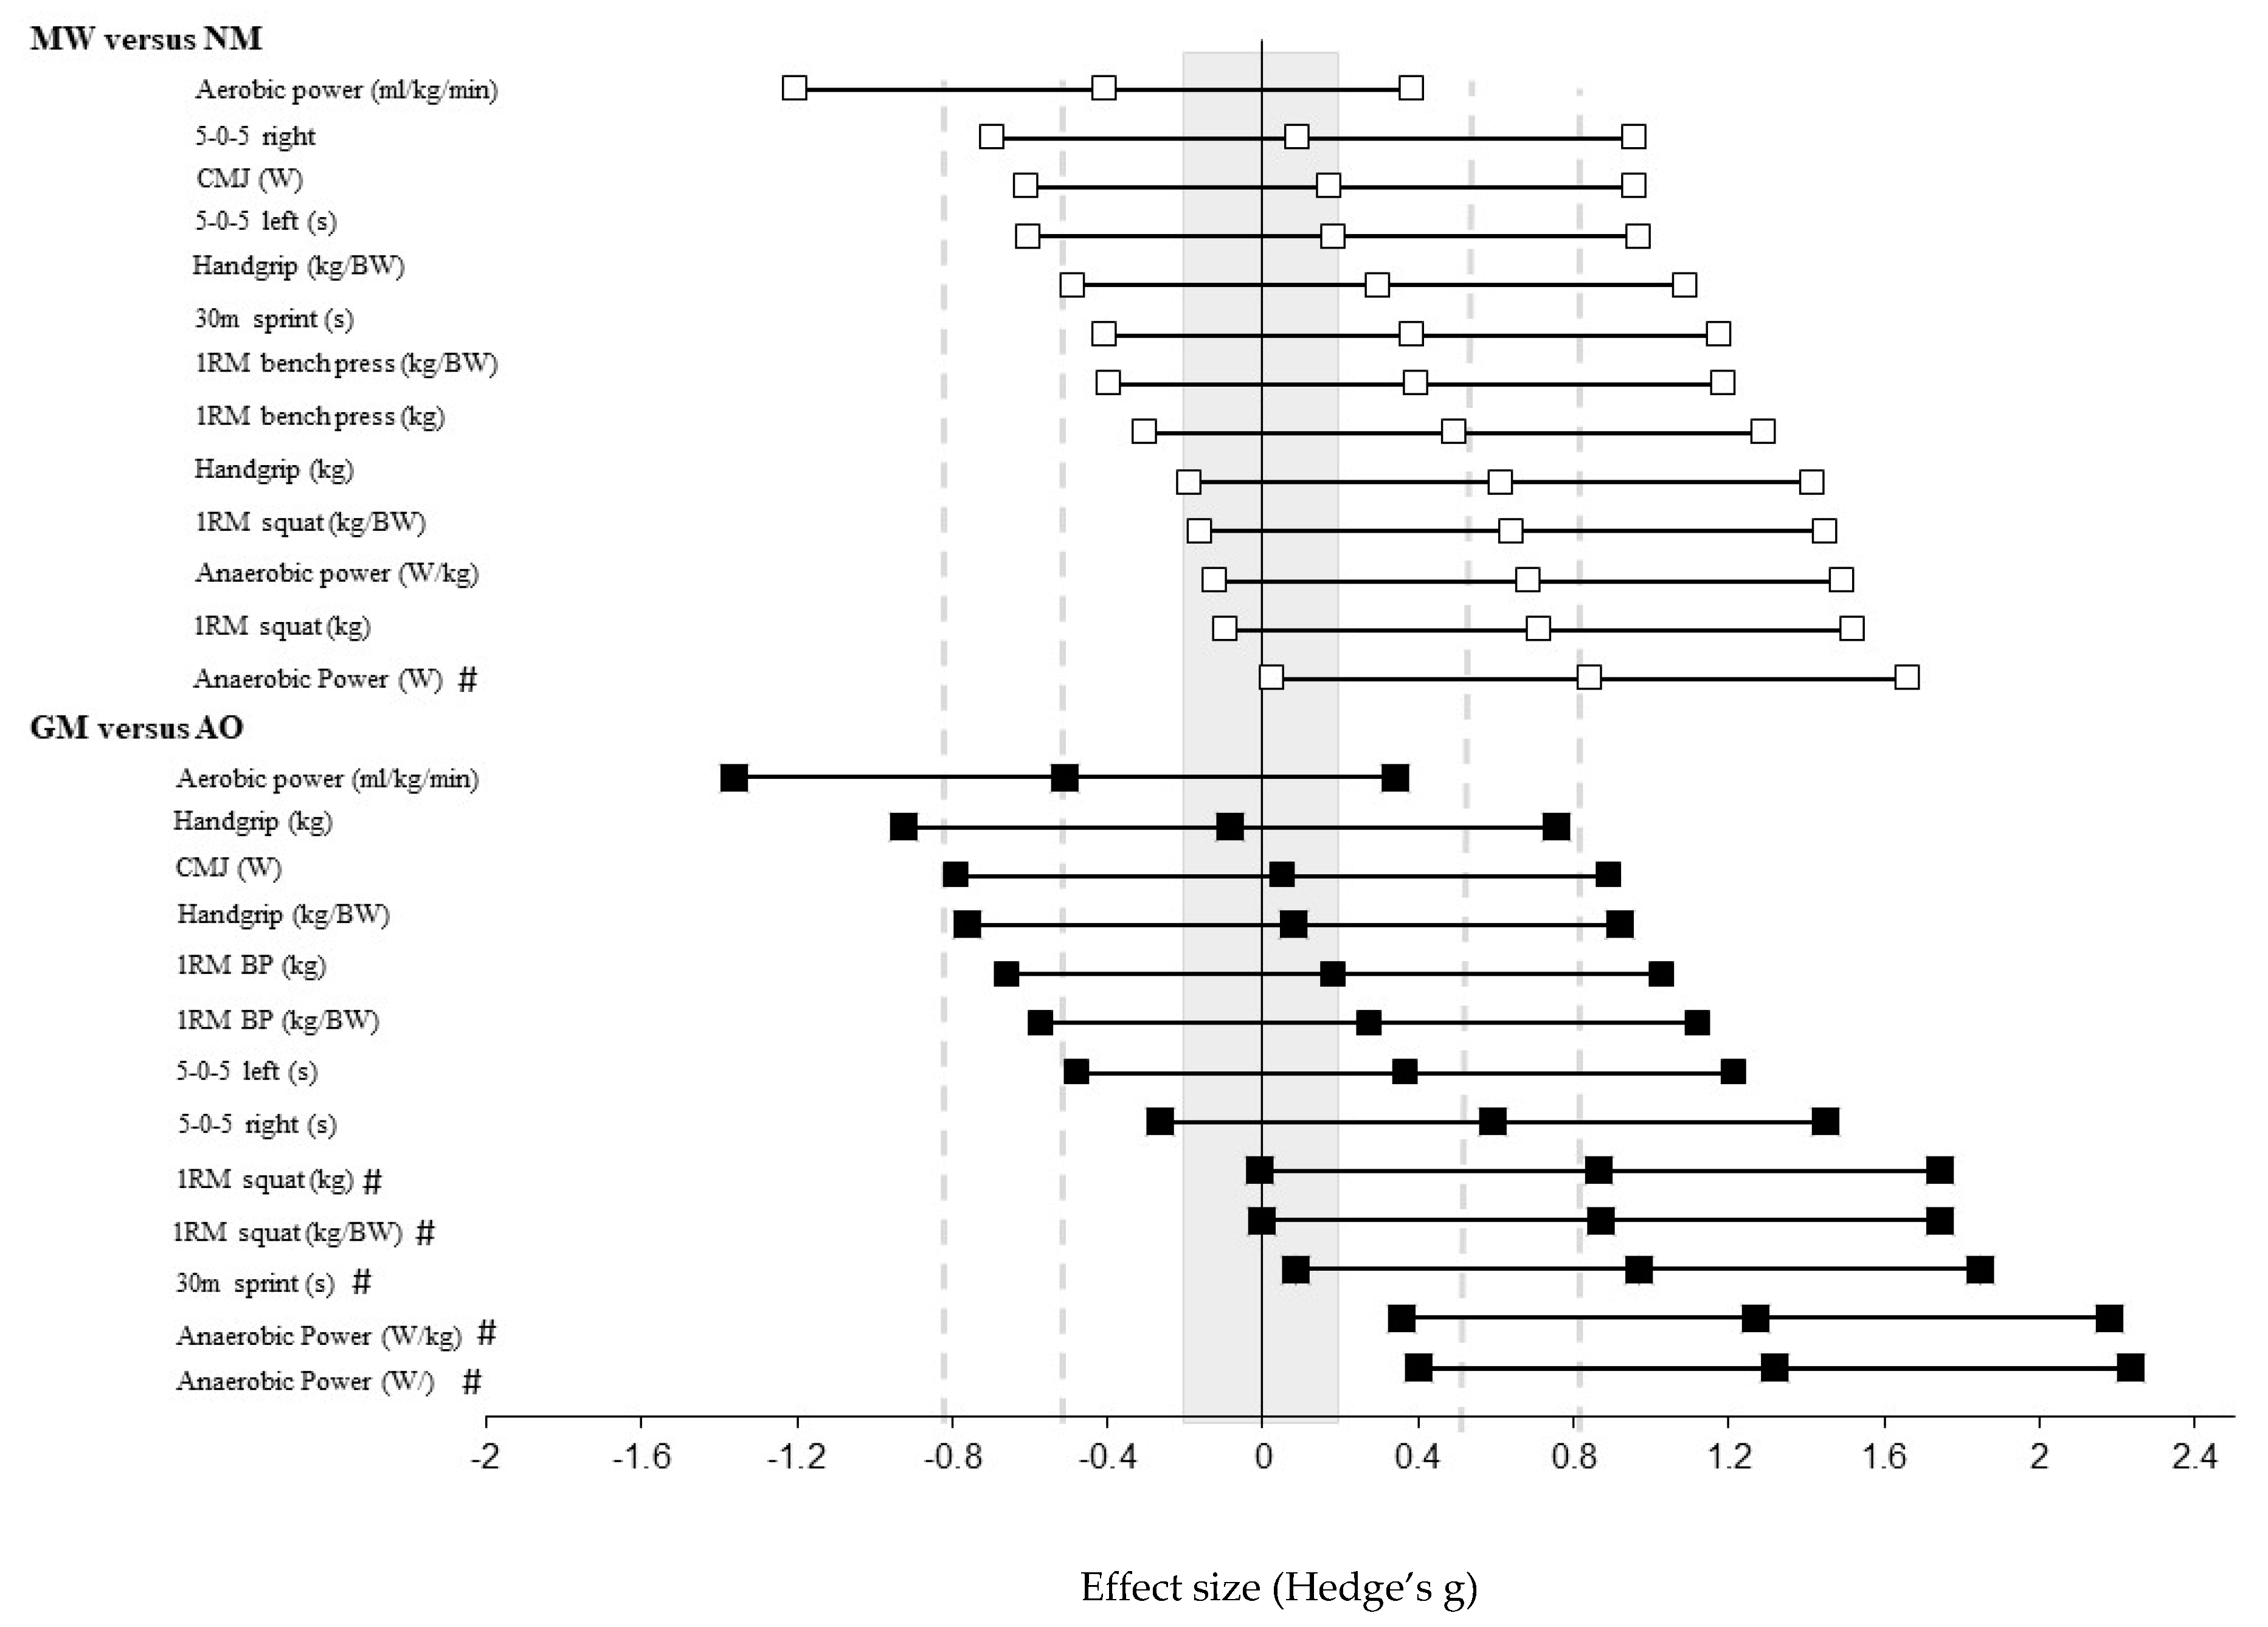
3.6. Predictors
4. Discussion
5. Conclusions
Supplementary Materials
Author Contributions
Funding
Acknowledgments
Conflicts of Interest
References
- Hopkins, W.G.; Marshall, S.W.; Batterham, A.M.; Hanin, J. Progressive Statistics for Studies in Sports Medicine and Exercise Science. Med. Sci. Sports Exerc. 2009, 41, 3–13. [Google Scholar] [CrossRef]
- Latella, C.; van den Hoek, D.; Teo, W.P. Differences in Strength Performance Between Novice and Elite Athletes: Evidence From Powerlifters. J. Strength Cond. Res. 2019, 33 (Suppl. 1), S103–S112. [Google Scholar] [CrossRef]
- Thomas, S.G.; Cox, M.H.; Legal, Y.M.; Verde, T.J.; Smith, H.K. Physiological profiles of the Canadian National Judo Team. Can. J. Sport Sci. 1989, 14. [Google Scholar]
- Callister, R.; Staron, R.; Fleck, S.; Tesch, P.; Dudley, G. Physiological Characteristics of Elite Judo Athletes. Int. J. Sports Med. 1991, 12, 196–203. [Google Scholar] [CrossRef]
- Horswill, C.A.; Scott, J.; Galea, P.; Park, S.H. Physiological Profile of Elite Junior Wrestlers. Res. Q. Exerc. Sport 1988, 59, 257–261. [Google Scholar] [CrossRef]
- Franchini, E.; Matsushigue, K.A.; Artioli, G.G.; Franchini, E.; Del Vecchio, F.B. Physiological Profiles of Elite Judo Athletes. Sports Med. 2011, 41, 147–166. [Google Scholar] [CrossRef]
- Torres-Luque, G.; Hernández-García, R.; Escobar-Molina, R.; Garatachea, N.; Nikolaidis, P.T. Physical and Physiological Characteristics of Judo Athletes: An Update. Sports 2016, 4, 20. [Google Scholar] [CrossRef]
- Franchini, E.; Schwartz, J.; Takito, M.Y. Maximal isometric handgrip strength: comparison between weight categories and classificatory table for adult judo athletes. J. Exerc. Rehabilitation 2018, 14, 968–973. [Google Scholar] [CrossRef]
- Marques, L.; Franchini, E.; Drago, G.; Aoki, M.S.; Moreira, A. Physiological and performance changes in national and international judo athletes during block periodization training. Boil. Sport 2017, 34, 371–378. [Google Scholar] [CrossRef]
- Bridge, C.A.; Santos, J.F.D.S.; Chaabene, H.; Pieter, W.; Franchini, E. Physical and Physiological Profiles of Taekwondo Athletes. Sports Med. 2014, 44, 713–733. [Google Scholar] [CrossRef]
- Chaabene, H.; Hachana, Y.; Franchini, E.; Mkaouer, B.; Chamari, K. Physical and physiological profile of elite karate athletes. Sports Med. 2012, 42, 829–843. [Google Scholar] [PubMed]
- Franchini, E.; Takito, M.; Kiss, M.; Strerkowicz, S. Physical fitness and anthropometrical differences between elite and non-elite judo players. Biol. Sport 2005, 22, 315. [Google Scholar]
- Drid, P.; Casals, C.; Mekic, A.; Radjo, I.; Stojanovic, M.; Ostojic, S.M. Fitness and Anthropometric Profiles of International vs. National Judo Medalists in Half-Heavyweight Category. J. Strength Cond. Res. 2015, 29, 2115–2121. [Google Scholar] [CrossRef] [PubMed]
- Andreato, L.V.; Lara, F.J.D.; Andrade, A.; Branco, B.H.M. Physical and Physiological Profiles of Brazilian Jiu-Jitsu Athletes: a Systematic Review. Sports Med. - Open 2017, 3, 9. [Google Scholar] [CrossRef]
- James, L.P.; Haff, G.G.; Kelly, V.G.; Beckman, E.M. Towards a Determination of the Physiological Characteristics Distinguishing Successful Mixed Martial Arts Athletes: A Systematic Review of Combat Sport Literature. Sports Med. 2016, 46, 1525–1551. [Google Scholar] [CrossRef]
- James, L.P.; Robertson, S.; Haff, G.G.; Beckman, E.M.; Kelly, V.G. Identifying the performance characteristics of a winning outcome in elite mixed martial arts competition. J. Sci. Med. Sport 2017, 20, 296–301. [Google Scholar] [CrossRef]
- Barbado, D.; Lopez-Valenciano, A.; Juan-Recio, C.; Montero-Carretero, C.; van Dieën, J.H.; Vera-Garcia, F.J. Trunk stability, trunk strength and sport performance level in judo. PLoS ONE 2016, 11, e0156267. [Google Scholar]
- Fagerlund, R. Strength profile of Finnish judoists-measurement and evaluation. Biol. Sport. 1991, 8, 143–149. [Google Scholar]
- Bonitch-Góngora, J.G.; Almeida, F.; Padial Puche, P.; Bonitch-Domínguez, J.G.; Feriche, B. Maximal isometric handgrip strength and endurance differences between elite and non-elite young judo athletes. Arch. Budo 2013, 9, 239–248. [Google Scholar]
- Buchheit, M.; Laursen, P.B. High-intensity interval training, solutions to the programming puzzle. Sports Med. 2013, 43, 313–338. [Google Scholar] [CrossRef]
- Gerodimos, V.; Karatrantou, K. Reliability of maximal handgrip strength test in pre-pubertal and pubertal wrestlers. Pediatr. Exerc. Sci. 2013, 25, 308–322. [Google Scholar] [CrossRef] [PubMed]
- Markovic, G.; Dizdar, D.; Jukic, I.; Cardinale, M. Reliability and factorial validity of squat and countermovement jump tests. J. Strength Cond. Res. 2004, 18, 551–555. [Google Scholar] [PubMed]
- Sayers, S.P.; Harackiewicz, D.V.; Harman, E.A.; Frykman, P.N.; Rosenstein, M.T. Cross-validation of three jump power equations. Med. Sci. Sports Exerc. 1999, 31, 572–577. [Google Scholar] [CrossRef] [PubMed]
- Seo, D.-I.; Kim, E.; Fahs, C.A.; Rossow, L.; Young, K.; Ferguson, S.L.; Thiebaud, R.; Sherk, V.D.; Loenneke, J.P.; Kim, D.; et al. Reliability of the One-Repetition Maximum Test Based on Muscle Group and Gender. J. Sports Sci. Med. 2012, 11, 221–225. [Google Scholar]
- Shalfawi, S.A.; Enoksen, E.; Tønnessen, E.; Ingebrigtsen, J. Assessing test-retest reliability of the portable Brower speed trap II testing system. Kinesiology 2012, 44, 24–30. [Google Scholar]
- Barber, O.R.; Thomas, C.; Jones, P.A.; McMahon, J.J.; Comfort, P. Reliability of the 505 Change-of-Direction Test in Netball Players. Int. J. Sports Physiol. Perform. 2016, 11, 377–380. [Google Scholar] [CrossRef]
- Herbert, P.; Sculthorpe, N.; Baker, J.S.; Grace, F.M.; Sculthorpe, N. Validation of a Six Second Cycle Test for the Determination of Peak Power Output. Res. Sports Med. 2015, 23, 115–125. [Google Scholar] [CrossRef]
- Lamberts, R.P.; Lambert, M.I.; Swart, J.; Noakes, T.D. Allometric scaling of peak power output accurately predicts time trial performance and maximal oxygen consumption in trained cyclists. Br. J. Sports Med. 2012, 46, 36–41. [Google Scholar] [CrossRef]
- Hanley, B. Senior men’s pacing profiles at the IAAF World Cross Country Championships. J. Sports Sci. 2014, 32, 1060–1065. [Google Scholar] [CrossRef]
- Mytton, G.J.; Archer, D.T.; Turner, L.; Skorski, S.; Renfree, A.; Thompson, K.G.; Gibson, A.S.C. Increased Variability of Lap Speeds: Differentiating Medalists and Nonmedalists in Middle-Distance Running and Swimming Events. Int. J. Sports Physiol. Perform. 2015, 10, 369–373. [Google Scholar] [CrossRef]
- Kwok, H.H.M. Discrepancies in fighting strategies between Taekwondo medalists and non-medalists. J. Hum. Sport Exerc. 2012, 7, 806–814. [Google Scholar] [CrossRef][Green Version]
- Cular, D.; Janovic, M.; Krstulovic, S. The Differences Between Medalists and Non-Medalists at the 2008 Olympic Games Taekwondo Tournament. Hum. Mov. 2011, 12. [Google Scholar] [CrossRef]
- James, L.P.; Beckman, E.M.; Kelly, V.G.; Haff, G.G. The Neuromuscular Qualities of Higher- and Lower-Level Mixed-Martial-Arts Competitors. Int. J. Sports Physiol. Perform. 2017, 12, 612–620. [Google Scholar] [CrossRef] [PubMed]
- Chelly, M.S.; Hermassi, S.; Shephard, R.J. Relationships between Power and Strength of the Upper and Lower Limb Muscles and Throwing Velocity in Male Handball Players. J. Strength Cond. Res. 2010, 24, 1480–1487. [Google Scholar] [CrossRef] [PubMed]
- Lehman, G.; Drinkwater, E.J.; Behm, D.G. Correlation of Throwing Velocity to the Results of Lower-Body Field Tests in Male College Baseball Players. J. Strength Cond. Res. 2013, 27, 902–908. [Google Scholar] [CrossRef] [PubMed]
- Howenstein, J.; Kipp, K.; Sabick, M.B. Energy Flow Analysis to Investigate Youth Pitching Velocity and Efficiency. Med. Sci. Sports Exerc. 2019, 51, 523–531. [Google Scholar] [CrossRef]
- Loturco, I.; Artioli, G.G.; Kobal, R.; Gil, S.; Franchini, E. Predicting punching acceleration from selected strength and power variables in elite karate athletes: a multiple regression analysis. J. Strength Cond. Res. 2014, 28, 826–832. [Google Scholar] [CrossRef]
- Wirth, K.; Hartmann, H.; Mickel, C.; Szilvas, E.; Keiner, M.; Sander, A. Core stability in athletes: A critical analysis of current guidelines. Sports Med. 2017, 47, 401–414. [Google Scholar] [CrossRef]
- Franchini, E.; Sterkowicz, S.; Szmatlan-Gabrys, U.; Gabrys, T.; Garnys, M. Energy System Contributions to the Special Judo Fitness Test. Int. J. Sports Physiol. Perform. 2011, 6, 334–343. [Google Scholar] [CrossRef]
- Harris, D.M.; Foulds, S.; Latella, C. Evidence-Based Training Recommendations for the Elite Judoka. Strength Cond. J. 2019, 41, 108–118. [Google Scholar] [CrossRef]
- Grant, S.; Corbett, K.; Amjad, A.M.; Wilson, J.; Aitchison, T. A comparison of methods of predicting maximum oxygen uptake. Br. J. Sports Med. 1995, 29, 147–152. [Google Scholar] [CrossRef] [PubMed]
- Franchini, E.; Cormack, S.; Takito, M.Y. Effects of High-Intensity Interval Training on Olympic Combat Sports Athletes’ Performance and Physiological Adaptation: A Systematic Review. J. Strength Cond. Res. 2019, 33, 242–252. [Google Scholar] [CrossRef] [PubMed]
- Nimphius, S.; McBride, J.M.; Rice, P.E.; Goodman-Capps, C.L.; Capps, C.R. Comparison of Quadriceps and Hamstring Muscle Activity during an Isometric Squat between Strength-Matched Men and Women. J. Sports Sci. Med. 2019, 18, 101–108. [Google Scholar] [PubMed]
- Nimphius, S. Exercise and Sport Science Failing by Design in Understanding Female Athletes. Int. J. Sports Physiol. Perform. 2019, 14, 1157–1158. [Google Scholar] [CrossRef] [PubMed]


© 2020 by the authors. Licensee MDPI, Basel, Switzerland. This article is an open access article distributed under the terms and conditions of the Creative Commons Attribution (CC BY) license (http://creativecommons.org/licenses/by/4.0/).
Share and Cite
Harris, D.M.; Kendall, K.; Haff, G.G.; Latella, C. Absolute and Relative Strength, Power and Physiological Characteristics of Indian Junior National-Level Judokas. Sports 2020, 8, 14. https://doi.org/10.3390/sports8020014
Harris DM, Kendall K, Haff GG, Latella C. Absolute and Relative Strength, Power and Physiological Characteristics of Indian Junior National-Level Judokas. Sports. 2020; 8(2):14. https://doi.org/10.3390/sports8020014
Chicago/Turabian StyleHarris, Dale M., Kristina Kendall, G. Gregory Haff, and Christopher Latella. 2020. "Absolute and Relative Strength, Power and Physiological Characteristics of Indian Junior National-Level Judokas" Sports 8, no. 2: 14. https://doi.org/10.3390/sports8020014
APA StyleHarris, D. M., Kendall, K., Haff, G. G., & Latella, C. (2020). Absolute and Relative Strength, Power and Physiological Characteristics of Indian Junior National-Level Judokas. Sports, 8(2), 14. https://doi.org/10.3390/sports8020014