Abstract
The purpose of this case study was to investigate the influence of a training load (TL), oxygen saturation (SO2) and blood pressure (BP) on mood states in a wheelchair marathoner during (7 weeks at sea level (SL), 5 weeks at 3860 m altitude, 1 week returning to SL). TL was obtained with Foster’s equation while mood states were obtained with the Profile of Mood States Questionnaire (POMS). Furthermore, SO2 and BP were assessed upon wakening. SO2 (%) decreased at altitude, compared to SL (88.31 ± 2.46 vs. 98.52 ± 0.11) and increased until the last week at altitude (92.64 ± 1.12). Systolic pressure (SP) increased at altitude compared to pre-altitude (126.0 ± 5.1 vs. 107.6 ± 4.4 mmhg), and was not different from the last week at altitude. Controlling for SO2 and SP, differences were also observed in fatigue (97.66 ± 18.92 vs. 17.39 ± 13.71) and vigor (73.23 ± 8.62 vs. 26.48 ± 11.89) as a function of altitude. Upon return to SL, fatigue, vigor, SO2 and SP returned to pre values. This case study demonstrated the POMS was sensitive to worsening patterns in fatigue and vigor at altitude through a practical survey approach combined with daily physiological assessment.
1. Introduction
The Profile of Mood States questionnaire (POMS) [1] reflects the individual mood in six primary dimensions (Depression-Dejection, Tension-Anxiety, Anger-Hostility, Vigor-Activity, Fatigue-Inertia, Confusion-Bewilderment) and is widely used in sports to evaluate the psychological state of athletes. High values on the vigor-activity scale and low values in the remaining scales are desirable for athletic performance and resemble an iceberg formation when plotted. Exercise has been suggested to alter mood, depending on the type, volume, duration and intensity [2]. An optimal balance between training and rest may prevent overtraining symptoms, which have been characterized by fatigue, performance decrements, mood changes, irritability, and loss of motivation [3]. Moreover, during periods of overtraining, athletes generally report undesirable changes in Total Mood Disturbance (TMD), which represents the sum of the five negative scales of POMS, subtracting vigor score and adding a constant of 100 [4]. Therefore, flattened or even inverted iceberg profiles on the POMS subscales have been observed in non-functional, overreaching, or over trained athletes [5], as high values on the vigor-activity scale and low values in the remaining scales are desirable for athletics performance. Furthermore, when training load (TL) is reduced during taper periods, athletes have reported improvements in mood as reflected by a return of POMS scores to baseline. Moreover, it has been suggested that a 50% or greater increase in an individual’s basal off-season TMD score may be reflective of an overreaching state [6].
Numerous researchers have reported an increase in negative mood states at altitudes above 3050 m [7]. For example, in a recent publication where the POMS was administered to a nine person team ascending 6000 m during a Mount Everest expedition, the authors reported oscillations in fatigue and vigor during the ascent; however, the depression scale was unaffected [8]. More specifically, upon psychological evaluation of the athletes using the POMS, mood changes are most severe during the first or second day at altitude and then gradually recede over the next 2–4 days [9].
To the best of our knowledge, use of the POMS to assess elite marathoners is absent from the literature, despite the fact that marathon running has been shown to affect mood states more negatively than low to moderate intensity exercise [10]. Therefore, it may be reasonable to surmise that similar mood disturbance may be precipitated by a combination of intense marathon training performed under normoxic and hypoxic environments. However, to date, there is a dearth of literature pertaining to mood response of wheelchair athletes in training scenarios at SL or hypoxic conditions. One exception, found elite athletes with and without disabilities possessed similar iceberg profiles and thus, had superior emotional health compared to the general population, implying “elite” rather than “ability” was most influential to mood status [11]. Moreover, it must be considered that only one study has assessed the physiological-psychological response of a Paralympic athlete under altitude conditions [12]. In fact, recently, the same study reported a disturbance in oxygen saturation (SO2) and brachial blood pressure (BP) upon arrival to altitude; however, to our knowledge there are no studies that have analyzed the influence of these physiological variables on mood states.
Despite the aforementioned finding, the extent to which wheelchair athletes experience mood responses similar to able-bodied athletes is largely unknown. Therefore, the purpose of this study was to investigate the psychological response of an elite wheelchair marathoner to a TL under both, normoxic and hypoxic conditions. Furthermore, we examined the influence of SO2, systolic and diastolic blood pressure (SP and DP) on mood states, when these physiological variables were added as covariates. To achieve this goal, our study was divided into three aims:
Aim 1—To examine the psychological response of an elite-wheelchair marathoner during a TL at sea level (SL), considered baseline.
Aim 2—To examine how the same athlete and TL performed at altitude (3860 m) and how this impacts psychological response.
Aim3—To determine if any changes in mood state occurring at altitude would return back to baseline when training resumed at SL under a reduced TL.
2. Materials and Methods
2.1. Participant
The athlete was a 36 year-old, professional wheelchair marathoner, International Paralympic Committee (IPC) class T52 (wheelchair athletes with arm involvement), multiple times world champion, Paralympic Games silver medalist, 13 world records; height = 1.76 m; Body Mass = 52.6 ± 0.4 kg; VO2max = 52 mL kg−1 min−1; VO2 at second ventilatory threshold (VT2) = 48 mL kg−1 min−1 training 8000 km per year. The athlete was familiarized with altitude training camps set at 1600–2900 m in the last 13 years with next models: live-high-train-high (LHTH), live-high-train-low (LHTL) and high-high-low (LHTHTL) [13]. Altitude camp was performed as a preparation for Boston and London marathons, where he finished first with a course record and second respectively in his division. The participant provided written informed consent for participation and the study was conducted in accordance with the Declaration of Helsinki, and the protocol was approved by the Ethics Research Committee of the University (project identification code # DPS.MMR.02.15).
2.2. Procedures
2.2.1. Training Features at Sea Level and Altitude
Our study occurred between SL at 16 m altitude at the Peruvian Altiplano (Puno, 3860 m altitude). The study period occurred from 23 November 2015 to 21 February 2016 (13 weeks; 91 days), and was composed of the athlete’s introductory cycle I (I1) (weeks 1 to 4) at SL, where training contents included arm ergometer workouts, over ground Nordic ski sessions and workouts below the first ventilatory threshold (<VT1) with the racing chair. Fundamental cycle I (F1) (weeks 5 and 6) occurred at SL where training included arm ergometer workouts, over ground Nordic ski, long moderate workouts at approximately VT1, two interval sessions at approximately VT2, and strength sessions in the gym. Introductory cycle 2 (I2) (weeks 7 and 8) occurred at SL week 7 and shifted to 3860 m altitude in week 8, where the athlete performed the same 16 to 20 km workouts <VT1 during the pre-altitude and acclimatization week. Fundamental cycle II (F2) (weeks 9 to 12) at 3860 m altitude, involved only intense sessions if the athlete reached a reference value of his Heart Rate Variability (HRV), considered as optimal to perform intense sessions, explained in detail previously [11]. The Introductory cycle 3 (I3) (week 13) occurred at SL, as post-altitude, and involved training identical to I2 (See Figure 1).
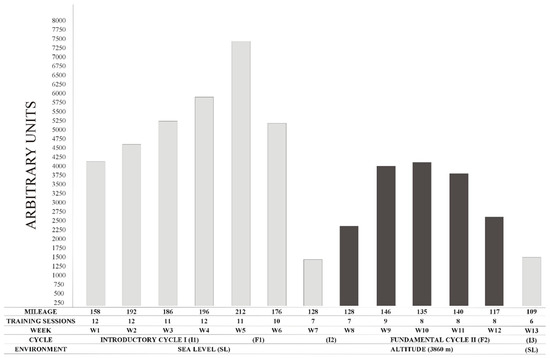
Figure 1.
Weekly Training Load.
2.2.2. Mood States Assessment and Training Load Calculation
Mood states were assessed using the Spanish short form version of the Profile of Mood States self-report questionnaire (POMS). This version consists of 59 adjectives; each rated on a five-point scale. From week 1, every Sunday (rest day) and after breakfast, our athlete responded to the question of how he had felt during the past week including that day. First week results constituted baseline 1. Week 7 data was not included for analysis because it coincided with overseas travel.
Physical TL was defined with Foster’s equation [14] as the product of the rating of perceived effort (RPE), using Borg scale 1–10 (where 1 means nothing at all and 10 extremely strong) [15] multiplied by the active time of the session duration. RPE was recorded 30 minutes after the morning and afternoon sessions and was calculated based on morning sessions (1-day training) or as the average of the morning and afternoon (two session training day). Daily TL was calculated by summing the Fosters values for the morning and afternoon sessions. Weekly TL was calculated as the summation of daily values from Monday to Saturday (See Figure 1).
2.2.3. Oxygen Saturation and Brachial Blood Pressure Assessment
The SO2 was measured with a finger pulse oximeter (Colson 650 2100, Frouard, France) in a seated position upon waking.
Brachial blood pressure (BP) was measured in a seated position, with the validated (Omron HEM-705CP, OMRON HEALTHCARE, INC., Lake Forest, IL, USA) oscillometric sphygmomanometer. Measurements were made in triplicate and averaged. Both systolic (SP) and diastolic (DP) blood pressure were recorded as well.
The assessment, results and discussion of both SO2 and BP have been previously reported [12].
2.3. Statistical Analysis
Kolmogorov-Smirnov was used to assess data normality. A repeated measures ANOVA was performed for POMS dimensions with TIME at two levels (SL and altitude). Oxygen saturation (SO2), systolic blood pressure (SP) and diastolic blood pressure (DP) were added as covariates. A post hoc LSD multiple range test determined the differences between factor levels. Pearson’s correlation coefficients were calculated for tension, fatigue, vigor, anger, depression, confusion, TMD, weekly Foster, SO2, SP and DP. Effect size (d) associated with change in every POMS dimension was calculated using Cohen’s d (difference in mean scores over time divided by pooled SD) and was interpreted as trivial (≤0.19), small (0.20–0.49), medium (0.50–0.79), and large (≥0.08) [16]. Statistical significance was set at alpha = 0.05. Statistical analyses were performed using SPSS version 22.0 (SPSS, Inc., Chicago, IL, USA) software.
3. Results

Table 1.
Weekly POMS dimensions values and rate of perceived exertion.
Table 2.
Weekly oxygen saturation, systolic and diastolic blood pressure.
3.1. POMS
We observed significant differences between SL and altitude in two dimensions of the POMS (fatigue and vigor), while considering SO2 and SP as covariates. Fatigue was significantly higher at altitude compared to SL (97.66 ± 18.92 vs. 17.39 ± 13.71, p = 0.0362, d = 6); also, vigor was significantly lower at altitude (73.23 ± 8.62 vs. 26.48 ± 11.89, p = 0.0484, d = 6.1). No significant differences were observed between SL and altitude in any POMS dimension when DP was considered as the covariate.
3.2. Oxygen Saturation
The SO2 improved with altitude exposure from acclimatization until the fifth week of exposure (88.31 ± 2.46 vs. 92.64 ± 1.12, p = 0.001, d = 2.7), although it remained stable at SL (98.08 ± 0.26 to 98.77 ± 0.14).
3.3. Brachial Blood Pressure
SP remained significantly higher (p = 0.001) at altitude compared to SL. Values were maximal during the third week of exposure (132.4 ± 3.4) and reached their lowest magnitude by the last altitude week (124.9 ± 3.5). Upon returning, SL become significantly lower compared to the last altitude week (113.1 ± 3.1, p = 0.001, d = 2). A deeper report on SO2 and BP during the experiment can be found in Reference [12].
Oscillations in POMS dimensions can be found in Figure 2.
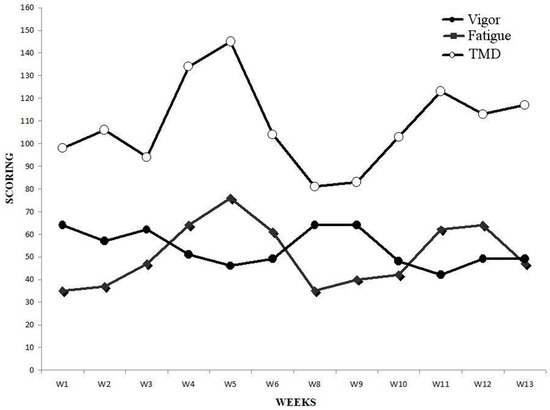
Figure 2.
Weekly POMS vigor, POMS fatigue and total mood disturbance.
3.4. Total Mood Disturbance
We observed the greatest values in TMD in week 5 (145 A.U.) and week 4 (134 A.U.), where weekly Foster reached its greatest level (7406.86 A.U. in week 5 and 5916.1 A.U in week 4). Indeed, a strong correlation was observed between TMD and weekly Foster (r = 0.66; p = 0.0258). In week 5, when SO2 remained high at SL, value for fatigue reached the greater level (76 A.U.), and so did anger (56 A.U.) which was not influenced by SO2, SP and DP when considered as covariates. Furthermore, we found a strong correlation between fatigue and anger (r = 0.70; p = 0.0109). Both depression and confusion remained similarly stable during the entirety of the experiment. However, in the last week, confusion increased 38.7% and the magnitude of change compared to the last altitude week was large (d = 3.7). Moreover, we found a strong correlation between depression and confusion (r = 0.60; p = 0.0367). Finally, tension was greater pre-altitude and a strong correlation was found between tension and weekly mileage (r = 0.67; p = 0.0244).
4. Discussion
The purpose of this study was to investigate the psychological response of an elite wheelchair marathoner to a TL under both normoxic and hypoxic conditions. In addition, we examined the influence of SO2, SP and DP on the psychological response, through their addition as covariates. Finally, we examined if mood changes occurring from SL to altitude would resolve to baseline levels when training resumed at SL under reduced TL.
Consistent with previous studies performed on able-bodied athletes at altitude ranging from 3080 m to 6000 m [7,8], we found increased fatigue and decrease vigor with altitude. In addition, we observed that increased TL at SL had a negative effect on fatigue and TMD, which peaked in week five when TL was maximal. These findings resemble those of elite swimmers who showed decreased vigor after 1 day of a 2/3 volume increase and elevated fatigue and overall mood scores after 2 days of increased TL [17]. Interestingly, TMD in the current study peaked in week 5, although training volumes in weeks four and five were similar (196.4 vs. 211.6 km), which may suggest a Foster’s threshold was reached and might significantly affect TMD. In fact, a TMD 48% greater than baseline, may be reflective of overreaching symptoms [6]. It seems that altitude had a lower impact on TMD than a greater volume of training performed at SL; however, we must consider that training volume at altitude was 1/3 lower compared to SL. Moreover, an inverted iceberg profile occurred in weeks 5 and 12, which again may signify overreaching symptoms [5]. Similarly, we found confusion and TMD were negatively affected upon return to SL where levels exceeded those observed during pre-altitude 1. Despite a strong positive correlation between tension and mileage, high tension scores occurred in the first 2 weeks, which may reflect stress imposed by equipment preparation for the season. Finally, we observed that vigor and fatigue returned to baseline levels upon return to SL.
A limitation of the current study was to find in the current literature, similar experimental designs among the elite marathoners population; and to the best of our knowledge, only one study with middle distance collegiate athletes has been set at similar altitude (4000 m) [18]. Other possible limitations might be the influence of loneliness on mood states at weeks four and five at altitude, however, the athlete feedback on social relations with the hotel’s workers and area coaches was quite positive. Finally, this study was also limited with the influence that variables such as poor wheelchair accessibility in town and hotel might have on tension and anger dimensions. A positive aspect regarding training places was perfect tarmac, where athlete had no incidences, other than one flat tire.
5. Conclusions
In conclusion, our study shows that despite the implementation of only one questionnaire per week, compared to daily physiological variables assessment [12], POMS was sensitive to worsening patterns in fatigue and vigor at altitude, which might be influenced by a disturbance in SO2 and SP. Furthermore, effects on fatigue and TMD may be more pronounced at SL once TL reaches its peak, in an elite wheelchair marathoner. Fortunately, the POMS is non-invasive, easy to assess, inexpensive, and has excellent internal consistency and reliability ((Cronbach’s α) range from 0.84 to 0.95) [1]. Therefore, we encourage its use for coaches and athletes interested in monitoring oscillations in psychological response to TLs during training at varying altitudes.
Often times, altitude training camps must be completed by athletes in remote locations, without direct assistance from coaches, physicians, doctors or psychologists. This study shows that a wheelchair athlete could self-monitor TL with simple and non-expensive devices, along with the use of a weekly mood profile assessment (POMS), to better convey his (physiological-psychological) state to technical staff during a training program under greater stressful conditions, as a challenging environment. Our research may help to inform the design and power of future studies performed under similar conditions. Future studies should continue to examine greater numbers of elite wheelchair marathon racers with more diverse disability characteristics (paraplegics, tetraplegics, spina bifida, etc.) to replicate and validate our findings.
Author Contributions
Conceptualization, M.M.-R., R.L.-G. and S.S.-Q.; Methodology, M.M.-R., R.L.-G. and S.S.-Q.; Formal analysis, G.B. and S.S.-Q.; Investigation, S.S.-Q.; Data curation, G.B., R.L.-G. and S.S.-Q.; Writing—original draft preparation, S.S.-Q. and R.L.-G.; Writing—review and editing, M.M.-R., R.L.-G., G.B., I.R. and S.S.-Q.; Supervision, M.M.-R., R.L.-G., G.B., R.L.-G. and S.S.-Q.
Funding
No funding was received for this study.
Conflicts of Interest
The authors have no conflict of interest to report.
References
- Mcnair, D.; Loor, M.; Droppleman, L. EITS Manual for the Profile of Mood States, 1st ed.; Educational and Industrial Testing Service: San Diego, CA, USA, 1971. [Google Scholar]
- Odagiri, Y.; Shimomitsu, T.; Iwane, H.; Katsumura, T. Relationships between exhaustive mood state and changes in stress hormones following an ultraendurance race. Int. J. Sports Med. 1996, 17, 325–331. [Google Scholar] [CrossRef] [PubMed]
- Purvis, D.; Gonsalves, S.; Deuster, P.A. Physiological and psychological fatigue in extreme conditions: Overtraining and elite athletes. PM&R 2010, 2, 442–450. [Google Scholar] [CrossRef]
- Morgan, W.P.; Brown, D.R.; Raglin, J.S.; O’Connor, P.J.; Ellickson, K.A. Psychological monitoring of overtraining and staleness. Br. J. Sports Med. 1987, 21, 107–114. [Google Scholar] [CrossRef] [PubMed]
- Morgan, W.P. The trait psychology controversy. Res. Q. Exerc. Sport 1980, 51, 50–76. [Google Scholar] [CrossRef] [PubMed]
- Berglund, B.; Säfström, H. Psychological monitoring and modulation of training load of world-class canoeists. Med. Sci. Sports Exerc. 1994, 26, 1036–1040. [Google Scholar] [CrossRef] [PubMed]
- Shukitt-Hale, B.; Rauch, T.M.; Foutch, R. Altitude symptomatology and mood states during a climb to 3630 meters. Aviat. Space Environ. Med. 1990, 61, 225–228. [Google Scholar] [PubMed]
- Karinen, H.M.; Tuomisto, M.T. Performance, mood, and anxiety during a climb of Mount Everest. High Alt. Med. Biol. 2017, 18, 400–410. [Google Scholar] [CrossRef] [PubMed]
- Shukitt, B.E.; Banderet, L.E. Mood states at 1600 and 4300 meters terrestrial altitude. Aviat. Space Environ. Med. 1988, 59, 530–532. [Google Scholar] [PubMed]
- Hassmén, P.; Blomstrand, E. Mood change and marathon running: A pilot study using a Swedish version of the POMS test. Scand. J. Psychol. 1991, 32, 225–232. [Google Scholar] [CrossRef] [PubMed]
- Horvat, M.; French, R.; Henschen, K. A comparison of the psychological characteristics of male and female able-bodied and wheelchair athletes. Paraplegia 1986, 24, 115–122. [Google Scholar] [CrossRef] [PubMed]
- Sanz-Quinto, S.; López-Grueso, R.; Brizuela, G.; Flatt, A.A.; Moya-Ramón, M. Influence of training models at 3900m altitude on the physiological response and performance of a profesional wheelchair athlete: A case study. J. Strength Cond. Res. 2018. [Google Scholar] [CrossRef] [PubMed]
- Levine, B.D.; Stray-Gundersen, J. “Living high-training low”: Effect of moderate-altitude acclimatization with low-altitude training on performance. J. Appl. Physiol. 1997, 83, 102–112. [Google Scholar] [CrossRef] [PubMed]
- Foster, C. Monitoring training in athletes with reference to overtraining syndrome. Med. Sci. Sports Exerc. 1998, 30, 1164–1168. [Google Scholar] [CrossRef] [PubMed]
- Borg, G.A. Psychophysical bases of perceived exertion. Med. Sci. Sports Exerc. 1982, 14, 377–381. [Google Scholar] [CrossRef] [PubMed]
- Cohen, J. A power primer. Psychol. Bull. 1992, 112, 155–159. [Google Scholar] [CrossRef] [PubMed]
- O’Connor, P.J.; Morgan, W.P.; Raglin, J.S. Psychobiologic effects of 3D of increased training in female and male swimmers. Med. Sci. Sports Exerc. 1991, 23, 1055–1061. [Google Scholar] [PubMed]
- Buskirk, E.R.; Kollias, J.; Akers, R.F.; Prokop, E.K.; Reategui, E.P. Maximal performance at altitude and on return from altitude in conditioned runners. J. Appl. Physiol. 1967, 23, 259–266. [Google Scholar] [CrossRef] [PubMed]


© 2018 by the authors. Licensee MDPI, Basel, Switzerland. This article is an open access article distributed under the terms and conditions of the Creative Commons Attribution (CC BY) license (http://creativecommons.org/licenses/by/4.0/).