
Pitch Sequence Complexity and Long-Term Pitcher Performance

Strategic Innovation Group, Booz Allen Hamilton, 901 15th Street NW, Washington, DC 20005, USA
Sports 2015, 3(1), 40-55; https://doi.org/10.3390/sports3010040
Submission received: 27 November 2014
/
Revised: 15 February 2015
/
Accepted: 25 February 2015
/
Published: 2 March 2015
Abstract
:Winning one or two games during a Major League Baseball (MLB) season is often the difference between a team advancing to post-season play, or “waiting until next year”. Technology advances have made it feasible to augment historical data with in-game contextual data to provide managers immediate insights regarding an opponent’s next move, thereby providing a competitive edge. We developed statistical models of pitcher behavior using pitch sequences thrown during three recent MLB seasons (2011–2013). The purpose of these models was to predict the next pitch type, for each pitcher, based on data available at the immediate moment, in each at-bat. Independent models were developed for each player’s most frequent four pitches. The overall predictability of next pitch type is . Additional analyses on pitcher predictability within specific game situations are discussed. Finally, using linear regression analysis, we show that an index of pitch sequence predictability may be used to project player performance in terms of Earned Run Average (ERA) and Fielding Independent Pitching (FIP) over a longer term. On a restricted range of the independent variable, reducing complexity in selection of pitches is correlated with higher values of both FIP and ERA for the players represented in the sample. Both models were significant at the level (ERA: ; FIP: ). With further development, such models may reduce risk faced by management in evaluation of potential trades, or to scouts assessing unproven emerging talent. Pitchers themselves might benefit from awareness of their individual statistical tendencies, and adapt their behavior on the mound accordingly. To our knowledge, the predictive model relating pitch-wise complexity and long-term performance appears to be novel.
1. Introduction
Winning one or two games during a Major League Baseball (MLB) season is often the difference between a team advancing to post-season play or “waiting until next year”. There is strong economic incentive to win; the estimated total market for U.S. spectator sports is in somewhere in the range [1]. Winning on the field produces a positive feedback effect on future sales of tickets, merchandising and advertising revenues.
Prior to each game or series, statistical metrics and scouting reports on opposing teams are compiled and are used to inform the design of lineups and strategies. Technology advances have made it feasible to augment this historical data with a dynamic statistical view of a game as it unfolds in real time. Forward thinking MLB teams may have already begun building large computing infrastructure for analysis and prediction using unstructured data [2]. When combined with observations made by managers, coaches and players during a game, complex queries of data and predictions on opponents’ actions are possible.
Our hypothesis is that teams may gain a competitive edge by using real-time statistical decision support during a game.
Proposed here is an approach to exploit such data; a central element of this approach is machine learning. Prediction of the next pitch type is selected as a prototypical case study for real-time baseball analytics. The pitcher controls the pace and flow of the game. The time interval between pitches can be used to incrementally compute new statistics and make predictions according to the current game situation. In particular, the ability to improve the guess of the next pitch from the pitcher’s repertoire would represent a fundamental advantage to the offensive team. For pitchers, increasing deception by changing selection and sequencing of pitches in certain game situations can improve outcomes [3].
Previous investigators [4] applied support vector machine classifiers to predict the type of next pitch. They framed the machine learning problem as a binary decision, i.e., predicting whether or not the next pitch is a fastball. Average overall accuracy for the “fastball, no fastball” prediction was reported as 70%. Linear predictive models were used, in order to analyze the importance of attributes contributing to correct prediction [4].
A second hypothesis addressed in this study is that predictability of a player’s pitch sequences may be used to project his performance over a longer term. Such a capability would reduce risk faced by management in evaluation of potential trades, or to scouts assessing unproven emerging talent. We use classical regression analysis to demonstrate a relationship between pitch sequence complexity and both Earned Run Average (ERA) and Fielding Independent Pitching (FIP) statistics. To our knowledge, a predictive model relating pitch-wise complexity and long-term performance appears to be novel.
2. Methods
We developed statistical models of pitcher behavior using pitch sequences thrown over the course of three MLB seasons (2011–2013). The purpose of these models was to predict the next pitch type, for each particular pitcher, based on data available at the immediate moment, in each at-bat. Independent models were developed to predict each pitcher’s most frequently thrown pitches.
Consider for example Detroit Tigers pitcher Justin Verlander. His most frequent pitches, in order of frequency, are: a four-seam fastball (), change-up (), curve ball () and a slider (). From historical data, we train models to predict the likelihood of a batter seeing or as his very next pitch. This is done over a multitude of batters and various game situations.
2.1. Predictive Modeling Approach
Classifier models were trained using multinomial logistic regression [5] and support vector machine (SVM) [6,7] algorithms. Data used for model development were collected from the public MLB Gameday server at http://gd2.mlb.com, which provides extensive details from games extending back many seasons.
2.1.1. Experimental Sample
The original population contained nearly 900 MLB pitchers. By excluding players having thrown less than 1000 pitches total over the three seasons considered, we drew an experimental sample of about 400. This threshold was chosen to facilitate comparison with results from previous researchers [4], where a minimum of 600 pitches over two seasons was the criterion for inclusion in the sample.
2.1.2. Training Examples
Data points for classifier training included real-valued attributes x describing the current at-bat (pitch type & zone history, ball-strike count); the game situation (inning, # outs, # and location of men on base); and pitcher/batter handedness. Other features from observations on pitchers that vary across ballgames (e.g., curve ball release point, fastball velocity, general pitch selection, slider movement) were used to augment the representation, where available. Each feature array is labeled with a discrete value signifying the next pitch type to construct samples for training. Elements of the set of values for are different for each player, according to his unique statistical tendencies.
2.1.3. Model Evaluation
Each pitcher-specific model was trained and tested by 5-fold cross-validation testing, providing a measure of that pitcher’s predictability under different game conditions. For support vector learning, we used the SVM formulation [7] with linear and radial basis function kernels. The training protocol included a linear search over values of the ν parameter, while enforcing a feasible numerical solution for all four pitches being modeled. A weighted average of the predictive accuracy observed across data partitions was taken as the figure of merit for predictability.
2.1.4. Pitch Prediction Decision
A multiclass learning strategy known as “one-versus-rest” [8] was followed. This entails the solution of K distinct binary valued problems, learning to recognize pitch class k in contrast to the rest of the classes for . In operation, the resultant classifiers are each exercised in parallel for an input feature vector x. We report on predictability of each set of pitcher-customized models, and on the combined resultant decision that would be made in real game situation. The latter case is the subject of a case study involving an out-of-sample test on 2013 World Series data.
2.1.5. Linear Regression Analysis
A basic pitching performance statistic is the Earned Run Average (ERA), indicating the average number of runs a pitcher allows the opposing team in a 9-inning game. It has been argued that ERA is not the most objective means to assess pitching talent, since it includes the effects of defense on balls in play and defense is essentially outside a pitcher’s control. Accordingly, Fielding Independent Pitching (FIP) statistics have been proposed to exclude factors related to defensive skill and luck in the evaluation of pitching performance. These factors may adversely affect ERA. FIP aims to measure performance in terms of pure pitching outcomes (primarily walks, strikeouts and home runs) [9,10].
Using the outputs of the machine learning models, we demonstrate that a player’s relative “predictability index” is an important predictor variable in linear regression models of ERA and FIP.
2.2. Post-Hoc Analyses
Our numerical experiments were designed to learn to predict the type of the next pitch. All results presented are based on cross-validation training and testing. Superior predictive results were obtained using nonlinear kernel SVMs versus multinomial logistic regression, so for brevity the discussion here concentrates on the most efficacious algorithmic approach.
2.2.1. Overall Predictability
We analyze the overall average predictive accuracy of the method, and establish an index of predictability for each pitcher. Predictability is a measure of the difficulty of guessing the next outcome in a sequence of random variables [11]. Suppose that the accuracy of prediction of the pitch type is expressed by . This number represents the average rate (over batters, situations) at which the next pitch is correctly identified by the model, under cross-validation test. The predictability index is calculated by a pitch-weighted average of all K models, that is, , where is the number of instances of the pitch type, , and x is a general variable signifying in-game context as described above.
The statistic π integrates over a range of pitches, batters and game situations for each individual pitcher. By averaging over a variety of probability distributions, it is reminiscent of the mean recognition accuracy introduced by Hughes [12]. Note that π can be used for qualitative comparisons among pitchers, for example to gauge their relative degree of pitch selection complexity.
For clarity, Table 1 resents the typical results obtained for Clayton Kershaw, winner of the 2014 National League Most Valuable Player and Cy Young awards. Models predicting Kershaw’s four main pitches have predictive accuracies of and %. The overall predictability for this pitcher is .

Table 1.
Typical numerical results, shown for pitcher Clayton Kershaw. Predictive models for his four most common pitches are accurate at percentage rates . The overall predictability for this pitcher is 74.9%.
| Pitcher | |||||
|---|---|---|---|---|---|
| C. Kershaw | 74.9 | 76.3 | 61.9 | 88.3 | 97.1 |
2.2.2. Predictability by Pitch Count
This study analyzed pitcher predictability in three general pitch count situations: (1) when the batter is ahead (more balls than strikes); (2) behind (more strikes than balls); and (3) the pitch count is even. The data were partitioned accordingly, and three predictive models for each of the four pitches were developed and evaluated.
2.2.3. Predictability by Platoon
Platooning in baseball most often refers to strategic placement of a batter in the lineup to face a certain pitcher, such that a right-handed batter faces a left-handed pitcher, and vice versa. In such cases the batter is said to have the “platoon advantage” and this is generally assumed to translate into more success at the plate. This case studied the predictability of pitch type under platoon advantage and disadvantage matchups from the batter’s perspective.
2.2.4. Out-of-Sample Test
We performed out-of-sample predictions by running trained classifier models using previously unseen examples from the 2013 World Series between the Boston Red Sox and the St. Louis Cardinals.
3. Results
3.1. Overall Predictability
The overall predictability of next pitch type using the current method is . Predictive accuracy is averaged over all players in the sample , each pitcher’s most frequently thrown four pitches, and all batters and game situations from the 2011–2013 regular MLB seasons. This rate of correct prediction compares favorably with other investigations, where an overall accuracy of was obtained when classifying only “fastball/not fastball” as the next pitch [4].
The top and bottom fifteen pitchers ranked in decreasing order of their associated predictability index π are listed in Table 2. The most predictable player based on this statistic is Trevor Rosenthal; the least deterministic in terms of pitch selection is Adam Ottavino.
| Top 15: Pitcher | Last 15: Pitcher | ||
|---|---|---|---|
| Trevor Rosenthal | 92.4 | Tom Wilhelmsen | 64.7 |
| Tony Cingrani | 92.1 | Steve Cishek | 64.6 |
| Joe Kelly | 90.2 | Greg Holland | 64.5 |
| J.J. Hoover | 89.7 | Jesse Crain | 64.3 |
| Michael Wacha | 89.2 | Troy Patton | 64.1 |
| Sean Doolittle | 88.4 | Matt Lindstrom | 64.0 |
| Brad Peacock | 88.1 | Boone Logan | 63.9 |
| Junichi Tazawa | 87.8 | Antonio Bastardo | 63.8 |
| Aaron Cook | 87.5 | Manuel Corpas | 63.2 |
| Aroldis Chapman | 86.4 | Michael Gonzalez | 62.9 |
| Edward Mujica | 86.1 | Ervin Santana | 62.9 |
| Bryan Shaw | 86.0 | George Kontos | 62.6 |
| Jake Westbrook | 85.8 | Shawn Camp | 62.5 |
| Ronald Belisario | 85.8 | Bryan Morris | 58.0 |
| Pat Neshek | 85.6 | Adam Ottavino | 54.9 |
3.2. Predictability by Pitch Count
The ten most (and least) predictable pitchers for each pitch count scenario studied are summarized in Table 3 and Table 4. The sample size for this study was reduced slightly as our procedure enforced the requirement that all four distinct pitch-predictor models converged to a feasible solution during training, and that a sufficient number of samples in each category were available.
It is observed from Table 3 that several pitchers remain near amongst the most predictable in terms of pitch selection without regard to pitch count. These include Trevor Rosenthal, Joe Kelly, J.J. Hoover and Brad Peacock. An interesting observation is made by comparing Table 3 with the results for the least predictable pitchers in Table 4. Joel Hanrahan’s pitch selection is highly predictable when the batter is ahead in the count, but when the batter is behind, Hanrahan becomes very unpredictable. Contrast this with Luke Gregerson, whose selection is easy to predict when the batter is behind in the count, yet much less deterministic when pitching at a count disadvantage.
| Pitcher | Pitcher | Pitcher | |||
|---|---|---|---|---|---|
| (Batter ahead) | (Batter behind) | (Even Count) | |||
| Tony Cingrani | 97.7 | Trevor Rosenthal | 89.4 | Trevor Rosenthal | 93.7 |
| Aroldis Chapman | 95.9 | Edward Mujica | 88.5 | Tony Cingrani | 93.0 |
| Trevor Rosenthal | 95.2 | J.J. Hoover | 87.4 | Joe Kelly | 90.0 |
| Joel Hanrahan | 95.1 | Luke Gregerson | 86.2 | J.J. Hoover | 89.0 |
| Brad Peacock | 94.7 | Brandon League | 85.8 | Jake Westbrook | 87.5 |
| Joe Kelly | 94.5 | Joe Kelly | 85.7 | Phil Hughes | 87.1 |
| J.J. Hoover | 93.9 | Pat Neshek | 84.8 | Brad Peacock | 86.8 |
| Aaron Loup | 93.1 | Heath Bell | 83.5 | Aroldis Chapman | 86.7 |
| Brandon League | 91.8 | Wei-Yin Chen | 83.3 | Aaron Loup | 86.1 |
| Jake Westbrook | 91.6 | Brad Peacock | 83.0 | Heath Bell | 85.9 |
| Pitcher | Pitcher | Pitcher | |||
|---|---|---|---|---|---|
| (Batter ahead) | (Batter behind) | (Even Count) | |||
| Alfredo Aceves | 67.1 | Anthony Bass | 61.9 | Brandon McCarthy | 65.2 |
| Jamey Wright | 67.1 | Edwin Jackson | 61.7 | Ervin Santana | 64.9 |
| Louis Coleman | 66.9 | Tony Sipp | 61.5 | Rafael Soriano | 64.8 |
| Jesse Chavez | 66.8 | Kevin Jepsen | 60.3 | Aaron Crow | 64.8 |
| Luke Gregerson | 66.6 | Ervin Santana | 59.9 | Tony Sipp | 64.0 |
| Koji Uehara | 66.5 | Jonny Venters | 59.5 | Scott Atchison | 63.5 |
| Brandon McCarthy | 63.2 | Jose Mijares | 59.3 | Michael Gonzalez | 62.4 |
| Dan Haren | 62.9 | Daniel Bard | 58.4 | Jesse Crain | 62.2 |
| Scott Atchison | 62.7 | Rex Brothers | 56.2 | Guillermo Moscoso | 59.5 |
| Michael Gonzalez | 59.6 | Joel Hanrahan | 56.1 | Carlos Carrasco | 57.0 |
3.3. Predictability by Platoon
When batter and pitcher are of like-handedness, we observed an aggregated mean predictability of . In the case of the batter’s platoon advantage, overall predictability was . This increased degree of predictability may contribute to a hitter’s presumed advantage in such situations.
Numerical results obtained from predictive modeling of pitch selection under platooning based on handedness are presented in Table 5 and Table 6. These tables distill results for the top and bottom ten players ranked by predictability index π. In the most predictable list (Table 5), several pitchers appearing consistently across all analyses are seen. Trevor Rosenthal, Tony Cingrani, Junichi Tazawa and Brad Peacock are very predictable, regardless of whether the batter is right- or left-handed. Similarly unaffected by platooning are Aaron Crow and Antonio Bastardo, as seen in the least predictable set in Table 6.
| Pitcher | Pitcher | ||
|---|---|---|---|
| (Same Handedness) | (Opposite Handedness) | ||
| Trevor Rosenthal | 93.4 | Tony Cingrani | 94.0 |
| Charlie Morton | 89.5 | Brad Peacock | 91.7 |
| Jake Westbrook | 86.7 | Aaron Cook | 91.3 |
| Tony Cingrani | 86.4 | Junichi Tazawa | 91.2 |
| Will Harris | 85.7 | Trevor Rosenthal | 91.0 |
| Junichi Tazawa | 85.5 | Aaron Loup | 88.0 |
| Steve Delabar | 85.4 | Aroldis Chapman | 87.8 |
| Brad Peacock | 84.1 | Robbie Ross | 87.7 |
| Roy Oswalt | 83.2 | Matt Albers | 87.5 |
| Phil Hughes | 83.0 | Michael Wacha | 86.7 |
| Pitcher | Pitcher | ||
|---|---|---|---|
| (Same Handedness) | (Opposite Handedness) | ||
| Bud Norris | 63.3 | Justin Grimm | 69.0 |
| Mike Dunn | 63.2 | Aaron Crow | 68.1 |
| Alexi Ogando | 63.2 | Antonio Bastardo | 68.0 |
| Nick Vincent | 63.1 | Chris Tillman | 67.8 |
| Aaron Crow | 62.3 | David Huff | 67.7 |
| Grant Balfour | 62.3 | Jesse Crain | 67.7 |
| P.J. Walters | 62.2 | Luke Gregerson | 67.6 |
| Everett Teaford | 62.1 | Alex Burnett | 65.7 |
| Jon Rauch | 61.6 | Koji Uehara | 51.5 |
| Antonio Bastardo | 57.1 | Steve Delabar | 43.2 |
3.4. Out-of-Sample Test
In-sample cross-validation tests are commonly used for estimating generalization performance, and may in fact have greater statistical power in some cases [13]. Nonetheless, it is important to assess the predictive performance of classifiers in out-of-sample mode. One inspiration for the current research is to inform an analytics platform that provides continuously-updated models, based on new input data, to predict the next behavior made by the opponent during a game. Results presented in earlier sections were focused on experiments to optimize pitch-specific predictors, and integrate their outputs in order to gain insight into the relative predictability of different pitchers’ selections, within different game situations.
For in-game application, with new input data x, the outputs from each model must be combined to declare the next pitch type. The final decision on pitch type prediction is made according to the (most positive) magnitude of the decision function output from each classifier, or [14].
Results from out-of-sample predictions on previously unseen data from the 2013 World Series between the Boston Red Sox and the St. Louis Cardinals are summarized in Table 7. On this limited sample of pitchers , predictive accuracy upon combining all four pitch models is seen to range from 50% to nearly 70%. Also shown in the table are the number of batters faced () and the pitcher’s recorded earned run average ().
Note that there is no obvious correlation between high predictability and performance as indicated by . The most predictable pitcher in this sample was Clay Buchholz, whose in the 2013 Series was 0.00. Similarly, Jon Lester was very predictable, yet his was outstanding at 0.590. Several pitchers previously identified during this research appear in the table. Jake Peavy’s pitch selection pattern was more difficult to decipher, but his was elevated at 4.50.
| Pitcher | BF | ERA | |
|---|---|---|---|
| Clay Buchholz | 69.8 | 18 | 0.00 |
| Jon Lester | 66.8 | 54 | 0.59 |
| Joe Kelly | 65.8 | 21 | 3.38 |
| Junichi Tazawa | 65.6 | 9 | 3.16 |
| Michael Wacha | 65.5 | 45 | 7.45 |
| Ryan Dempster | 65.4 | 5 | 9.00 |
| Adam Wainwright | 63.7 | 52 | 4.50 |
| Lance Lynn | 61.1 | 25 | 4.76 |
| John Lackey | 60.1 | 60 | 2.57 |
| Trevor Rosenthal | 57.4 | 16 | 0.00 |
| Felix Doubront | 55.5 | 17 | 1.93 |
| Craig Breslow | 54.7 | 7 | 54.00 |
| Koji Uehara | 51.2 | 15 | 0.00 |
| Jake Peavy | 50.2 | 19 | 4.50 |
3.5. Long-Term ERA and FIP Forecasting
An interesting question is whether the output from the machine learning method for prediction of pitches within a game situation could be used to estimate a pitcher’s future statistical performance.
The sample size represented in Table 7 is insufficient for inference on a relationship between pitch selection predictability and ERA, a fundamental metric of pitcher performance. We carried out linear regression analysis on the entire sample population (from the original sample , four ERA values had data quality issues and were not included in the analysis) to determine if there was a meaningful statistical relationship between these variables, further including analysis of FIP as a function of predictability index π. The dependent variables were constructed as the mean values of ERA and FIP recorded for each pitcher during the seasons in question.
Regression analysis on the entire sample did not uncover significant relationships between either π and ERA, or π and FIP.
Considering next only the third quartile of values of the independent variable , we calculated a regression equation for a player’s ERA from his pitch selection predictability π as follows:
The coefficient for the predictor π is significant at the level . Standard error estimates for the intercept and coefficient are and , respectively. Plotting the residuals suggested an unbiased and random distribution throughout the range of fitted response values.
Similarly, a regression equation to predict FIP was computed for this sample, applicable over the same range of the independent variable. This relationship is expressed as
which was also found significant at (; s.e. and for intercept and coefficient).
These results suggest that reducing complexity in selection of pitches (a proxy for increased predictability) is correlated with higher values of both FIP and ERA.
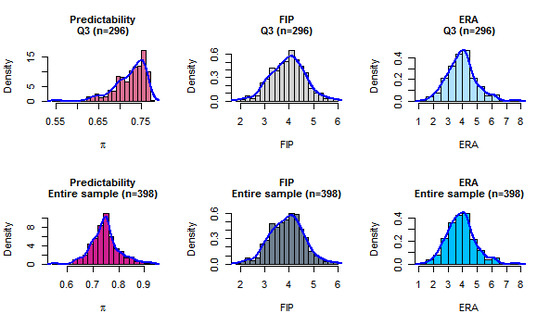
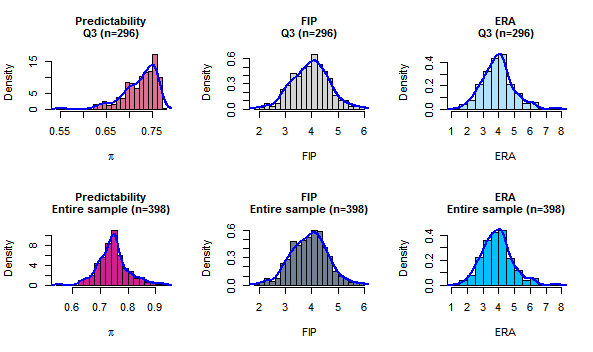
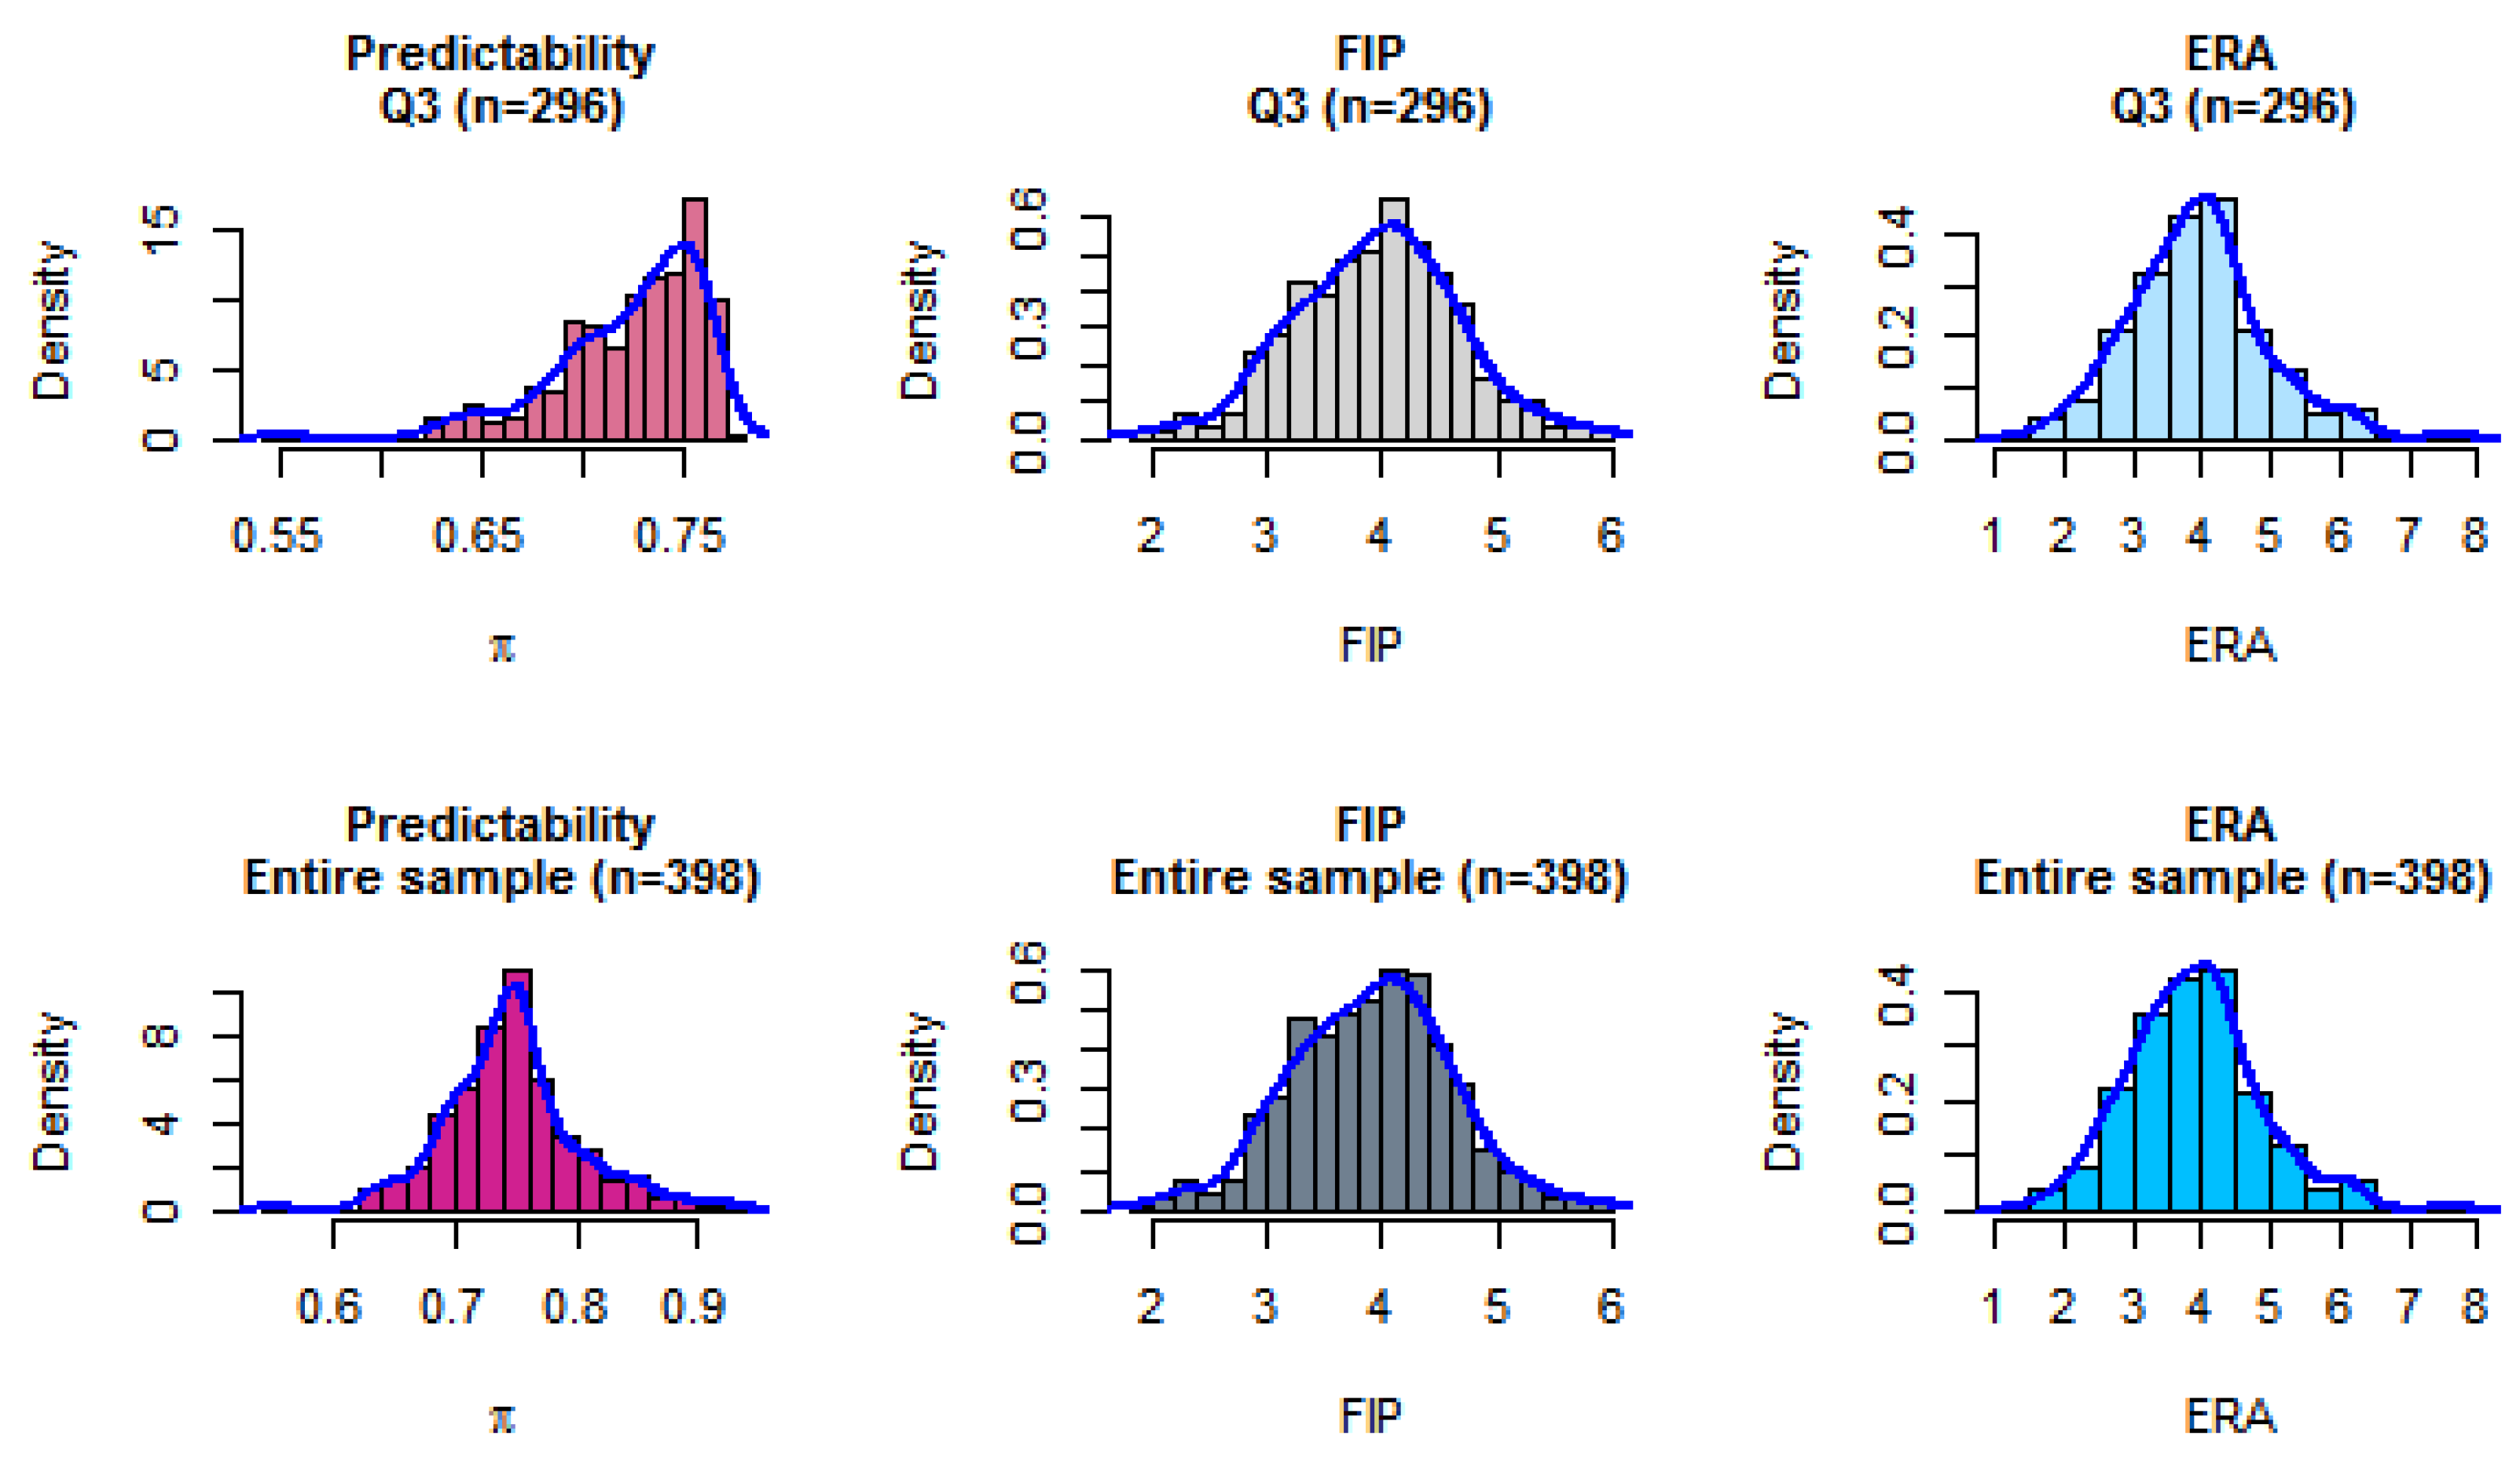
At predictability index scores , the linear relationships break down. Figure 1 plots probability densities of the independent and explanatory variables subject to regression analysis. The top row in the figure represents the distributions: computed predictability, and recorded FIP and ERA in that order. In the bottom row, the corresponding quantities for the entire sample are depicted.
It is noteworthy that the coefficient of determination for each regression model is low (ERA: ; FIP: ), clearly indicating that other factors contribute to the response variables beyond the predictability index considered in this preliminary analysis. The determination of such factors is left for future research.
The low p-values imply that changes in the predictor variable relate to changes in the response, however inadequate model precision. The value of these regression equations may rest in estimating a player’s potential performance with respect to his peers, when evaluating young athletes within a given level of competition.
For reference, the distribution of scores computed from the entire experimental sample is summarized in Table 8.
Figure 1.
Densities of predictability , FIP and ERA for valid range of π in the regression equations (top row) and for the entire sample (bottom row).
Figure 1.
Densities of predictability , FIP and ERA for valid range of π in the regression equations (top row) and for the entire sample (bottom row).
| Min. | Q1 | Median | Q3 | Max. |
|---|---|---|---|---|
| 54.88 | 71.39 | 74.58 | 77.03 | 92.38 |
4. Discussion
It is hypothesized that baseball teams may gain a competitive edge by using real-time statistical decision support during a game. Technology advances now enable a potential pitch-wise dynamic statistical view of a game. Certain MLB teams are said to have built computing infrastructures for analysis and prediction using unstructured data [2]. When combined with observations made by managers, coaches and players during a game, complex queries of data and predictions on opponents’ actions are possible.
We have presented a methodology to predict the next type of pitch anticipated from a pitcher, based on a machine learning model that includes historical data and game context as inputs. The time interval between pitches can be used to incrementally compute new statistics and make predictions according to the current game situation. The strategic value of the model outlined herein may be improved significantly by including relevant data such as scouting notes, text and voice annotations of player and coaching observations during the game.
Essentially, this is a method to dynamically predict player behavior. Both pitchers and batters can benefit from this approach. The batter might improve his guess as to the next pitch in a certain situation. The pitcher in turn could use knowledge of his predictability to confound the hitter by intermittent deviation from his statistical tendencies. Some non-cooperative game theoretic strategizing comes into play, assuming this type of information is applied in a game [15]. We recognize and appreciate that being presented with this information during an at-bat may be confounding to certain players, who may choose to ignore it.
Sequence complexity and errors predicting the next value in that sequence are not simply related [11,16]. Many of the pitchers whose selection was found to be more deterministic in our experiments remain hard to hit. Knowing in advance that Aroldis Chapman is going to deliver a slider or a fastball does not make the task of hitting either pitch any easier.
The data contain many examples of statistically effective pitchers with a high predictability index (Trevor Rosenthal, ; Aroldis Chapman: ). Likewise, a number of pitchers with low predictability yet high ERA and/or FIP (Daisuke Matsuzaka, ; Everett Teaford: can be identified.
We observed that out-of-sample results were not as accurate upon prediction as those obtained from in-sample cross-validation testing. In-sample cross-validation tests are often used for estimating generalization performance. A common assumption is such tests are biased. However, it was noted in [13] that in-sample tests may in fact have greater statistical power. This is especially true for cases where the sample size in the out-of-sample test is small, as the test may fail to detect predictability that exists in the population [13].
For combining pitch-specific binary classifiers into a single decision, a number of schemes have been described in the literature [14,17]. Greater accuracy in prediction may be achieved by the introduction of more sophisticated voting mechanisms, e.g., [18].
The main statistic used for evaluation of predictive performance in this research is accuracy. It is well known that accuracy as a statistical metric is counter-indicated in cases where costs of misclassification are unequal [19]. In the present case, a misclassification equates to a wrong pitch type prediction. The cost of a wrong prediction is identical to that incurred when the batter’s guess is incorrect, which happens routinely.
Predictive results obtained in this study are good, in comparison with previous research [4]. The cited study cast the prediction objective into terms of predicting “fastball, no fastball” for the next pitch, and observed an average rate of accuracy of 70%. In the present investigation, the predictability of the next pitch type here was found to be . Here, we predict one of four pitches for each player, a somewhat more difficult induction objective. Results for certain pitches, players and game situations were observed often in high even to accuracy range, upon cross-validation.
The experimental sample used in this study was limited to pitchers recording at least 1000 pitches over the course of the three seasons considered. This subsetting of the population of all pitchers omits players with less than three years’ experience. Middle-relief pitchers and closers who do not throw as many total pitches as do starters are also generally excluded from this sample.
Linear regression analysis to explain ERA using an individual’s pitch sequence complexity suggests a simple relationship, given by the expression
This model was significant at the level . Reducing complexity in selection of pitches (increasing predictability) is correlated with higher values of ERA for the players represented in the sample. At values of π greater than the 75th percentile of all sample scores, the relationship is not statistically significant.
A regression equation to predict FIP over the third quartile of predictability indices was found. This expression is written as , and is likewise significant at with a smaller p value (). Sabermetricians have stated that FIP is a better predictor of future performance than measuring the present (e.g., using ERA), owing to observed fluctuations in small samples [20]. In terms of our hypothesis that predictability of pitch sequences may help project longer term pitching performance, the articulation of a linear relationship between predictability and FIP is an important result.
A large proportion of the variances in FIP and ERA are not explained by these models, based on low values of determination coefficient for the model fits. Other explanatory variables must be included to explain the variance in response variables for precise forecasts for specific players.
A short list of variables that may impact observed pitching performance includes specific pitcher–batter matchups [21], a catcher’s skills in pitch framing [22], or even the effect of the umpire on called strikes [23].
The investigation of these and other predictors is left to further research. Nonetheless, we can still infer that changes in the predictor (π), a measure of the “learnability” of pitch sequence patterns, are directly associated with changes in a player’s FIP and ERA over a longer term of performance.
This observation is valuable for management evaluation of hypothetical trades, or to scouts assessing pitching potential of undeveloped players.
5. Conclusions
This paper presented an approach to predict pitcher behavior using statistical models based on pitch sequences thrown during three recent MLB seasons (2011–2013). The purpose of these models was to predict the next pitch type, for each pitcher, based on data available at the immediate moment, in each at-bat. Independent models were developed for each athlete’s most frequent four pitches.
Two main hypotheses were advanced and examined. First, baseball teams may gain a competitive edge by using real-time statistical decision support during a game. Second, the predictability of a player’s pitch sequences may be used to project his performance over a longer term.
- The overall predictability of next pitch type using the current method is . This rate of correct prediction measure well against previous research, where an overall accuracy of was obtained when classifying only “fastball/not fastball” as the next pitch [4]. Here, we predict one of four frequently used pitches by each player , a somewhat more difficult induction objective.
- An index of predictability for a player’s next pitch type was introduced. This statistic is aggregated over a range of pitches, batters and game situations for each individual pitcher. This single number can be used to make qualitative comparisons amongst pitchers, ranking them according to their relative degree of pitch selection complexity. The most predictable pitcher based on this statistic is Trevor Rosenthal; the least deterministic in terms of pitch selection is Adam Ottavino.
- A study on the predictability of pitchers in different pitch count situations was carried out. The most predictable were Tony Cingrani (batter ahead) and Trevor Rosenthal (batter behind, count even). The least predictable for these count situations, respectively, were Michael Gonzalez, Joel Hanrahan and Carlos Carrasco.
- The presence of increased pitch selection predictability under platooning of batters versus pitchers was investigated. It was observed that when the batter and pitcher are of like-handedness, the aggregated mean pitch predictability was . When the hitter has platoon advantage, the overall predictability was . This increased predictability may contribute to a hitter’s presumed advantage in such situations.
- High predictability of pitch sequence pattern does not necessarily imply bad statistical outcomes for the sample of pitchers studied. Many of the pitchers whose selection was found to be more deterministic in our experiments are still hard to hit. The data contain many examples of effective pitchers (as measured by low FIP and/or ERA) with a high predictability index, and pitchers with low predictability but higher values of the performance statistics.
- A linear regression equation was developed that predicts ERA as a function of predictability for the 75h percentile of predictability scores. This model was significant at the level . Reducing complexity in selection of pitches (a proxy for increased predictability) is associated with higher values of ERA for the players represented in the sample.
- Fielding Independent Pitching (FIP) versus sequence predictability for the sample was also calculated using regression. The FIP regression model was also found significant at (). It has been suggested that FIP is a better predictor of future performance than present estimators such as ERA; the discovery of a linear relationship between predictability and FIP is an important result in this sense, and lends support to the second hypothesis advanced in this study.
- At values of predictability index π greater than the 3d quartile, the linear relationships break down. A large proportion of the variances in FIP and ERA are not explained by these models. Other explanatory variables must be included to explain the variance in response variables for precise forecasts for specific players. These may include analysis of the effects of pitcher–batters matchups, catchers’ framing skills, or individual umpires’ strike calling tendencies.
Author Contributions
Joel R. Bock conceived and performed the numerical experiments, analyzed their results, and wrote the paper.
Conflicts of Interest
The author declares no conflict of interest.
References
- Fry, M.; Ohlmann, J. Introduction to the Special Issue on Analytics in Sports, Part I: General Sports Applications. Interfaces 2012, 42, 105–108. [Google Scholar] [CrossRef]
- Eggers, B. The Most Important Offseason Acquisition for the San Francisco Giants Could be Hadoop. Available online: http://tcrn.ch/1ExTnY1 (accessed on 15 February 2015).
- Kalk, J. Pitch Sequence: High Fastball Then Curveball. Hardball Times. Available online: http://bit.ly/1zWrSbb (accessed on 15 February 2015).
- Ganeshapillai, G.; Guttag, J. Predicting the Next Pitch. In Proceedings of the MIT Sloan Sports Analytics Conference, Boston, MA, USA, 2 March 2012.
- Glonek, G.; McCullagh, P. Multivariate Logistic Models. J. R. Stat. Soc. Ser. B 1995, 57, 533–546. [Google Scholar]
- Cortes, C.; Vapnik, V. Support-vector networks. Mach. Learn. 1995, 20, 273–297. [Google Scholar] [CrossRef]
- Schölkopf, B.; Smola, A.; Williamson, R.; Bartlett, P. New support vector algorithms. Neural Comput. 2000, 12, 1083–1121. [Google Scholar] [CrossRef]
- Rifkin, R.; Klautau, A. In defense of one-vs-all classification. J. Mach. Learn. Res. 2004, 5, 101–141. [Google Scholar]
- McCracken, V. Pitching and Defense: How Much Control Do Hurlers Have? Available online: http://bit.ly/1Fel8Zy (accessed on 15 February 2015).
- Tango, T. Defensive Responsibility Spectrum (DRS): Breaking up the Fielders from the Pitchers. Available online: http://bit.ly/1zFaXFg (accessed on 15 February 2015).
- Feder, M.; Merhav, N. Relations between entropy and error probability. IEEE Trans. Inf. Theory 1994, 40, 259–266. [Google Scholar] [CrossRef]
- Hughes, G. On the mean accuracy of statistical pattern recognizers. IEEE Trans. Inf. Theory 1968, 14, 55–63. [Google Scholar] [CrossRef]
- Inoue, A.; Kilian, L. In-Sample or Out-of-Sample Tests of Predictability: Which One Should We Use? Econom. Rev. 2005, 23, 371–402. [Google Scholar] [CrossRef]
- Hsu, C.; Lin, C. A comparison of methods for multiclass support vector machines. IEEE Trans. Neural Netw. 2002, 13, 415–425. [Google Scholar] [PubMed]
- Swartz, M. Game Theory and Baseball, part 2: Introduction to Pitch Selection. Available online: http://bit.ly/1ArqG1I (accessed on 15 February 2015).
- Solomonoff, R. A Formal Theory of Inductive Inference (Parts I, II). Inf. Control 1964, 7, 1–22; 224–254. [Google Scholar] [CrossRef]
- Kittler, J.; Hatef, M.; Duin, R.; Matas, J. On combining classifiers. IEEE Trans. Pattern Anal. Mach. Intell. 1998, 20, 226–239. [Google Scholar] [CrossRef]
- Sigletos, G.; Paliouras, G.; Spyropoulos, C.; Hatzopoulos, M. Combining Information Extraction Systems Using Voting and Stacked Generalization. J. Mach. Learn. Res. 2005, 6, 1751–1782. [Google Scholar]
- Provost, F.; Fawcett, T.; Kohavi, R. The case against accuracy estimation for comparing induction algorithms. In Proceedings of the Fifteenth International Conference on Machine Learning, Madison, WI, USA, July 1998; Morgan Kaufmann: San Francisco, CA, USA, 1998; pp. 445–453. [Google Scholar]
- Dupaul, G. Should We Be Trying to Predict FIP Instead of ERA? Available online: http://bit.ly/1Feluzt (accessed on 15 Febuary 2015).
- Carty, D. How Important Are Batter/Pitcher Matchups? (Part 1, 2). Available online: http://bit.ly/1JhYjqV (accessed on 15 February 2015).
- Woodrum, B. The State and Future of Pitch-Framing Research. Available online: http://bit.ly/1Feluzt (accessed on 15 February 2015).
- Dewan, J. The Most Pitcher & Hitter Friendly Umpires. Available online: http://bit.ly/1DURR4u (accessed on 15 February 2015).
© 2015 by the author; licensee MDPI, Basel, Switzerland. This article is an open access article distributed under the terms and conditions of the Creative Commons Attribution license (http://creativecommons.org/licenses/by/4.0/).
Share and Cite
MDPI and ACS Style
Bock, J.R. Pitch Sequence Complexity and Long-Term Pitcher Performance. Sports 2015, 3, 40-55. https://doi.org/10.3390/sports3010040
AMA Style
Bock JR. Pitch Sequence Complexity and Long-Term Pitcher Performance. Sports. 2015; 3(1):40-55. https://doi.org/10.3390/sports3010040
Chicago/Turabian StyleBock, Joel R. 2015. "Pitch Sequence Complexity and Long-Term Pitcher Performance" Sports 3, no. 1: 40-55. https://doi.org/10.3390/sports3010040