
Neuromuscular Retraining in Female Adolescent Athletes: Effect on Athletic Performance Indices and Noncontact Anterior Cruciate Ligament Injury Rates

Abstract
:1. Introduction
2. Subjects and Methods
2.1. Subjects
2.2. Study Design

| Test | Number of Athletes |
|---|---|
| Video drop-jump | 912 |
| Single-leg triple crossover hop | 280 |
| Single-leg triple hop | 223 |
| Vertical jump, no countermovement | 807 |
| Vertical jump with countermovement | 502 |
| Agility t-test | 221 |
| 37-m sprint | 136 |
| 18-m sprint | 350 |
| Multi-stage fitness test | 356 |
| Sit-up test | 110 |
| Isokinetic strength test, 300°/s, quadriceps & hamstrings | 141 |
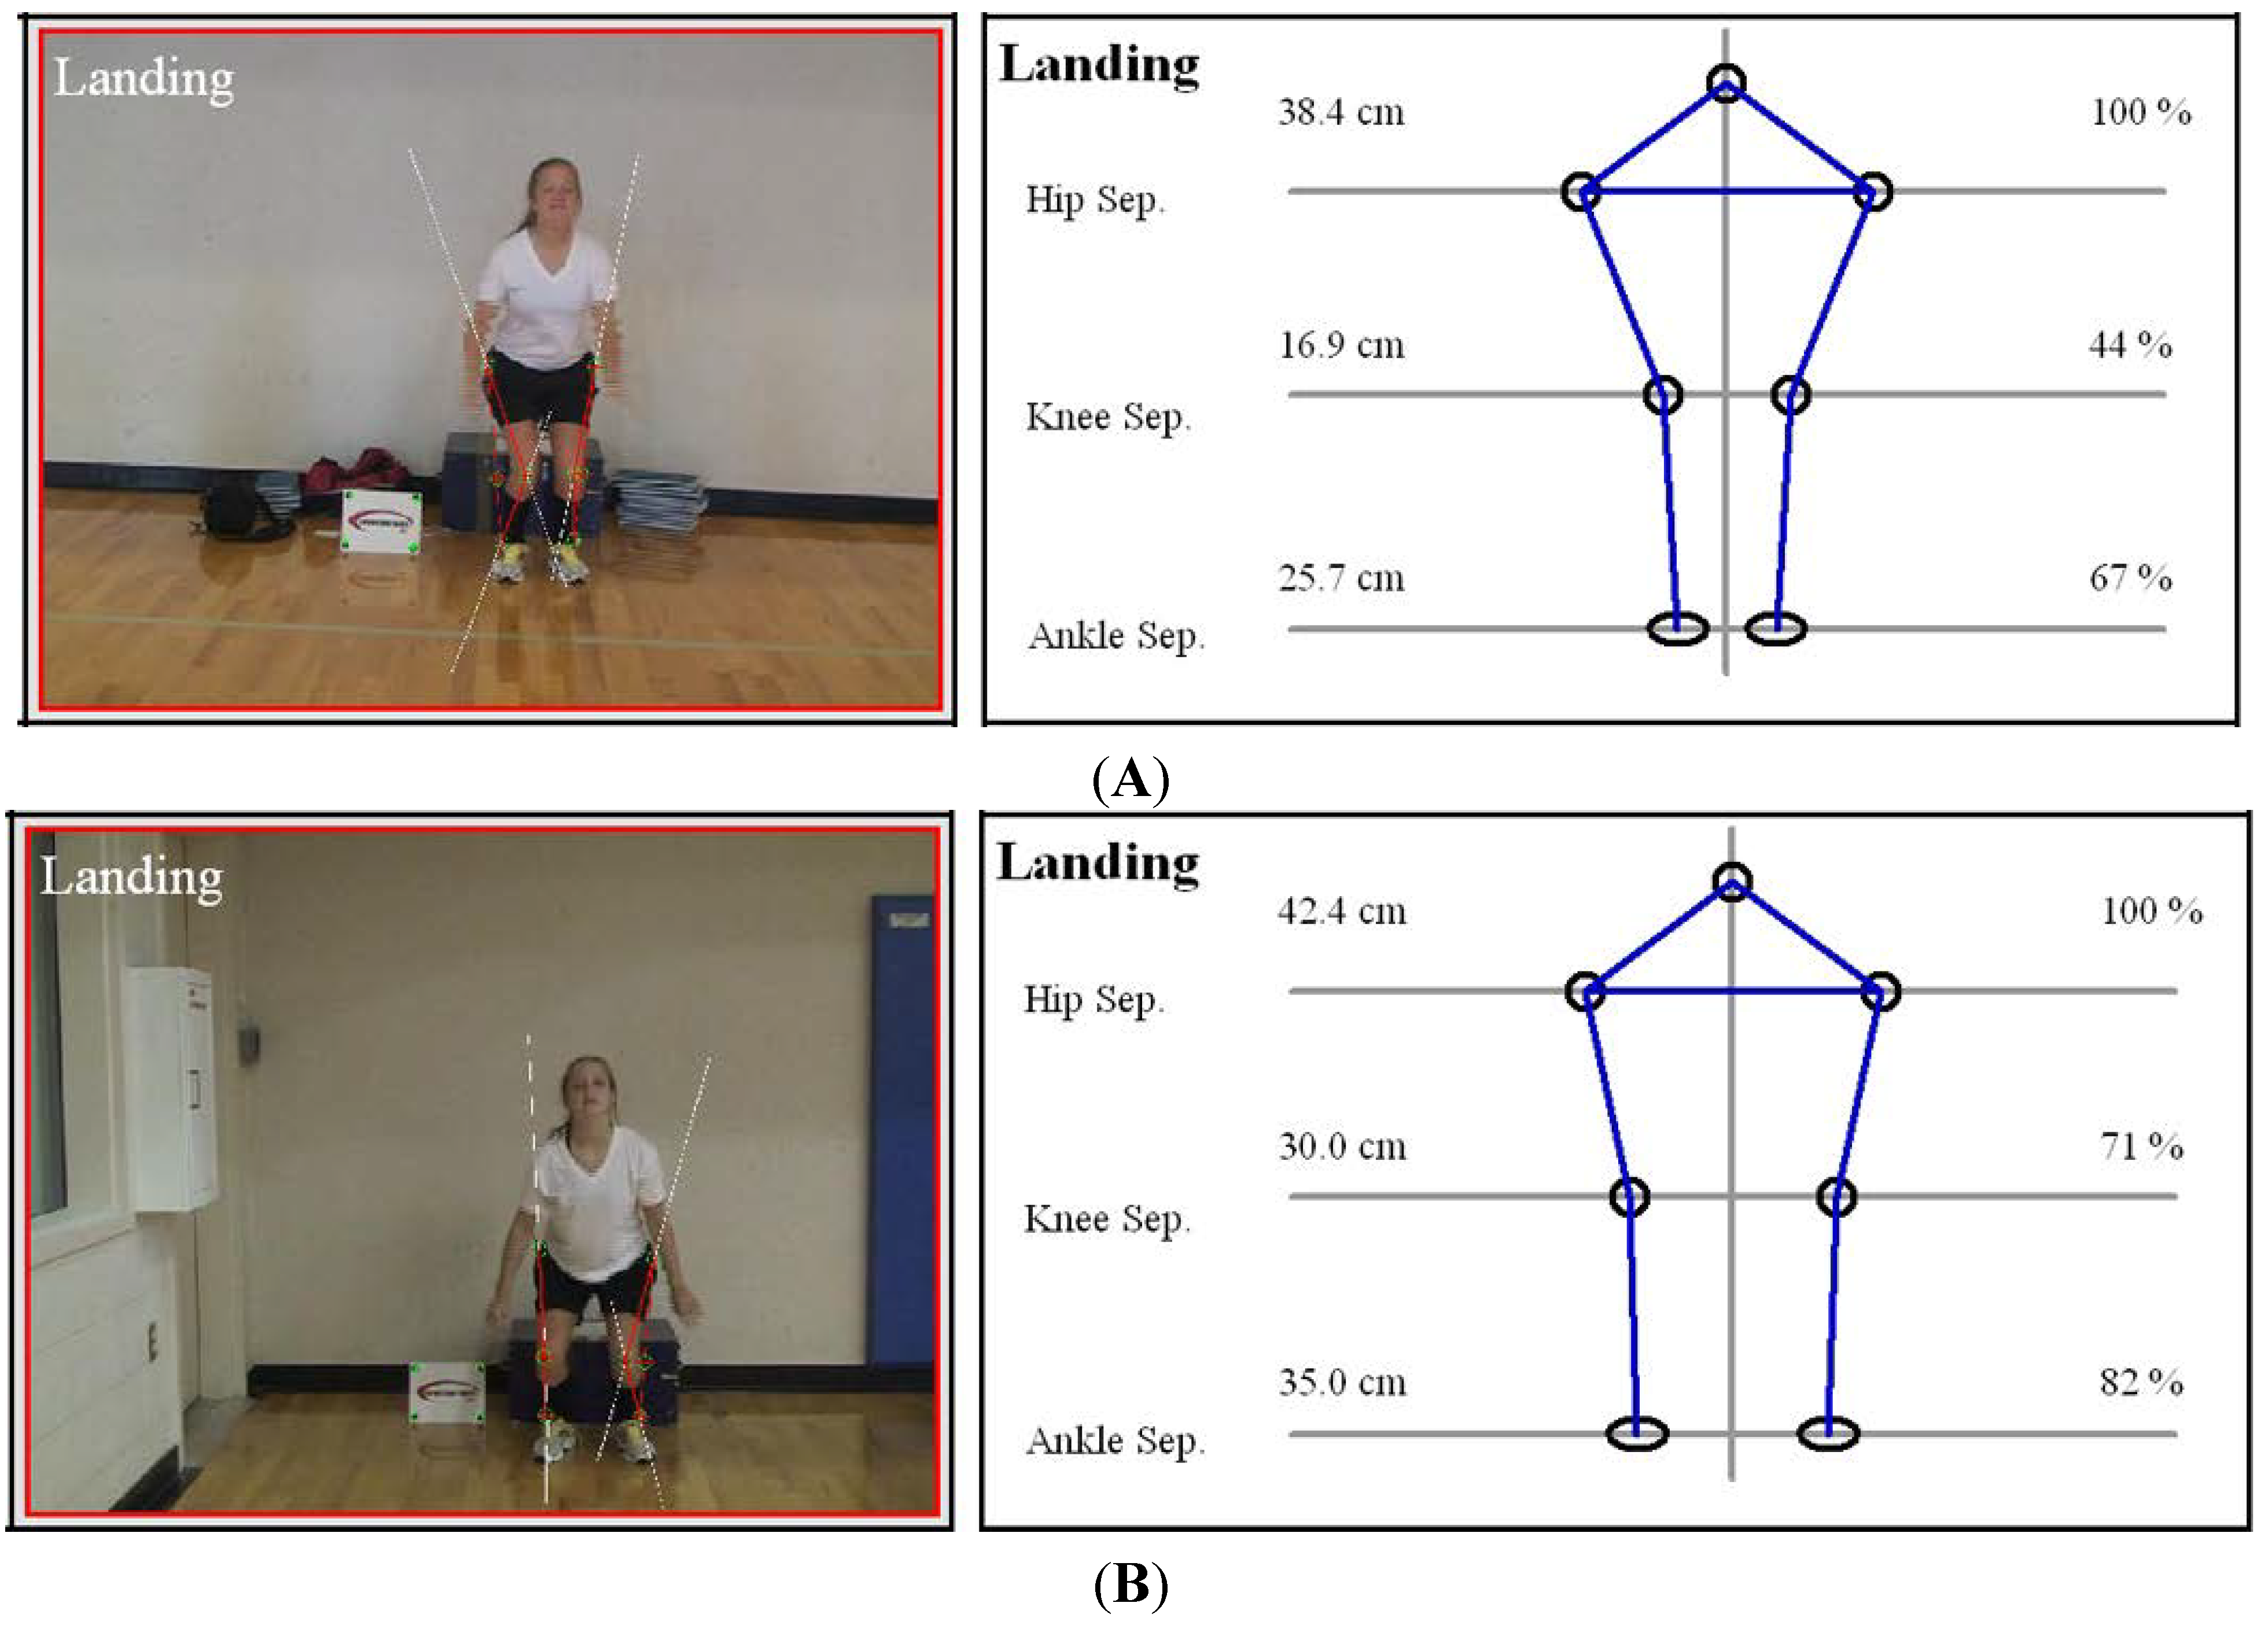
2.3. Video Drop-Jump Test
2.4. Single-Leg Hop Tests
2.5. Vertical Jump Tests
2.6. Agility t-Test
2.7. Sprint Tests
2.8. Multi-Stage Fitness Test
2.9. Sit-up Test
2.10. Isokinetic Strength Test
2.11. Neuromuscular Retraining Program
| Exercise | Instructions |
|---|---|
| Toe walk | Walk on the toes and keep the legs straight. Do not allow the heel to touch the ground. |
| Heel walk | Walk on the heels and keep the legs straight. Do not allow the toes to touch the ground. Do not lock the knees, but keep them slightly flexed. |
| Straight leg march | Walk with both legs straight, alternating lifting up each leg as high as possible without compromising form. Keep the knees straight and the posture erect. Do not the lean backward. |
| Leg cradle | Walk forward and keep the entire body straight and neutrally aligned. Lift one leg off of the ground in front of the body, bending at the knee. Turn the knee outward and grasp the foot with both hands. Hold this position for 3 s, then place the foot back down and repeat with the opposite leg. |
| Hip rotator walk | Pretend there is an obstacle directly in front of you. Face forward and keep the shoulders and hips square. Extend one leg at the hip and keep the knee bent. Rotate the leg out at the hip and bend the knee to 90°. Rotate and bring the leg up and over the obstacle, then place it back on the ground. Repeat with the opposite leg. |
| High knee skip | This exercise involves skipping in which one knee is driven up in the air as high as possible, while the other is used to land and hop off the ground. Immediate repeat the skip on the opposite side with each land. Swing the arm opposite of the high knee up in the air to help gain height. |
| High knees | This exercise involves jogging where, with each step, the knees are driven up as high as possible using short, choppy steps. The shoulders and hips are kept square throughout the exercise. |
| Glut kicks | This exercise involves jogging where, with each step, the athlete kicks the feet back as if trying to reach the gluts with the heel, using short, choppy steps. The shoulders and hips are kept square throughout the exercise. |
| Stride out | Begin jogging forward using an exaggerated running form. Drive the knees as high as possible and kick the feet back, as if trying to make a large complete circle with the legs. Stay up on the balls of the feet throughout the exercise. |
| All-out sprint | Sprint forward as fast as possible, making sure to maintain proper technique and running form. |
| Jumps | Duration | |
|---|---|---|
| Phase I: Technique | Week 1 | Week 2 |
| Wall jump | 20 s | 25 s |
| Tuck jump | 20 s | 25 s |
| Squat jump | 10 s | 15 s |
| Barrier jump (side-to-side) | 20 s | 25 s |
| Barrier jump (forward-back) | 20 s | 25 s |
| 180° jump | 20 s | 25 s |
| Broad jump (hold 5 s) | 5 reps | 10 reps |
| Bounding in place | 20 s | 25 s |
| Phase II: Fundamentals | Week 3 | Week 4 |
| Wall jump | 25 s | 30 s |
| Tuck jump | 25 s | 30 s |
| Jump, jump, jump, vertical jump | 5 reps | 8 reps |
| Squat jump | 15 s | 20 s |
| Single-leg barrier hop side-to-side* | 25 s | 30 s |
| Single-leg barrier hop forward-back* | 25 s | 30 s |
| Scissors jump | 25 s | 30 s |
| Single-leg hop* (hold 5 s) | 5 reps | 5 reps |
| Bounding for distance | 1 run | 2 runs |
| Phase III: Performance | Week 5 | Week 6 |
| Wall jump | 25 s | 20 s |
| Jump up, down, 180°, vertical | 5 reps | 10 reps |
| Squat jump | 25 s | 25 s |
| Mattress jump side-to-side | 30 s | 30 s |
| Mattress jump forward-back | 30 s | 30 s |
| Single-leg hop, hop, hop, stick* | 5 reps | 5 reps |
| Jump into bounding | 3 runs | 4 runs |
2.12. Statistical Analyses
3. Results
3.1. Compliance with Training
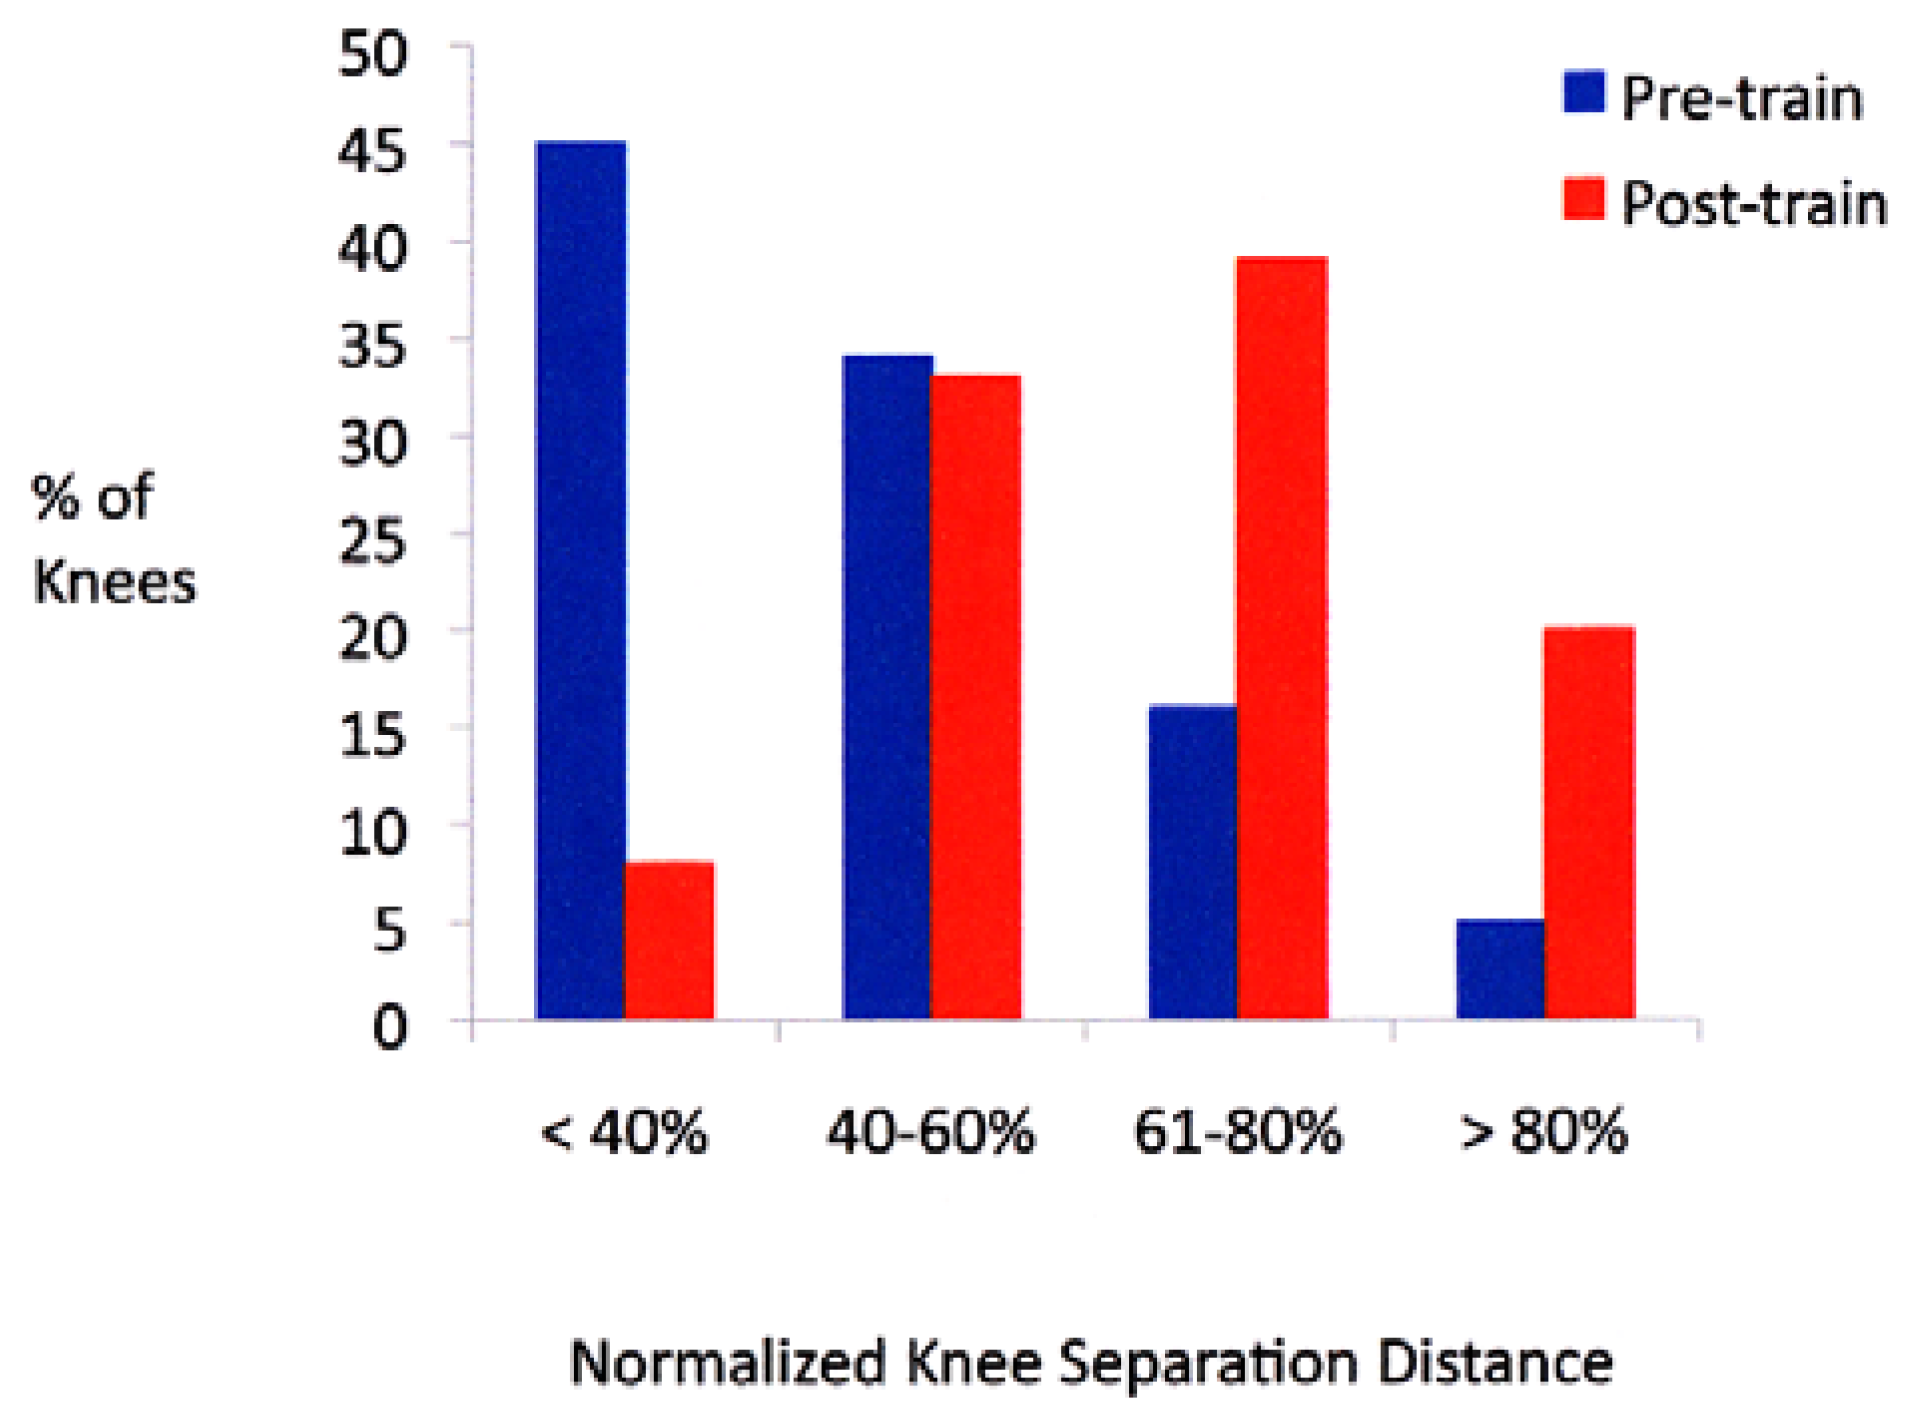
3.2. Video Drop-Jump
| Pre-Train * | Post-Train * | Difference * | p Value | Effect Size | |
|---|---|---|---|---|---|
| Knee separation distance (cm) | 20 ± 8 (range, 6–56) | 27 ± 8 (range, 9–57) | 8 ± 8 (range, −19–41) | <0.0001 | 0.87 |
| Normalized knee separation distance (%) | 47 ± 19 (range, 14–150) | 65 ± 18 (range, 21–118) | 18 ± 19 (range, −53–92) | <0.0001 | 0.97 |

3.3. Single-Leg Hop Tests
| Test | Pre-Train (cm)* | Post-Train (cm)* | Difference (cm)* | p Value | Effect Size |
|---|---|---|---|---|---|
| Triple crossover | 360 ± 71 (range, 140–523) | 393 ± 69 (range, 185–555) | 33 ± 54 (range, −136–261) | <0.0001 | 0.47 |
| Triple straight | 405 ± 96 (range, 117–554) | 414 ± 95 (range, 128–602) | 9 ± 48 (range, −110–164) | 0.003 | 0.09 |
3.4. Vertical Jump Tests
3.5. Agility t-Test, Sprints, Multi-Stage Fitness Test, Sit-up Test
3.6. Isokinetic Test
| Test | Pre-Train * | Post-Train * | Difference * | p Value | Effect Size |
|---|---|---|---|---|---|
| Hamstrings Dominant | 29 ± 6 (range, 10–45) | 33 ± 8 (range, 15–73) | 4 ± 7 (range, −9–53) | <0.0001 | 0.57 |
| Hamstrings Nondominant | 27 ± 6 (range, 14–43) | 31 ± 7 (range, 9–56) | 4 ± 6 (range, −8–32) | <0.0001 | 0.61 |
| Quadriceps Dominant | 35 ± 7 (range, 15–56) | 37 ± 8 (range, 17–67) | 2 ± 7 (range, −16–32) | 0.001 | 0.27 |
| Quadriceps Nondominant | 35 ± 7 (range, 16–57) | 38 ± 10 (range, 6–103) | 3 ± 9 (range, −17–60) | 0.0001 | 0.35 |
| Ham/Quad Ratio Dominant | 83 ± 17 (range, 44–163) | 90 ± 24 (range, 54–272) | 7 ± 27 (range, −88–206) | 0.001 | 0.34 |
| Ham/Quad Ratio Nondominant | 78 ± 18 (range, 38–145) | 83 ± 19 (range, 39–191) | 5 ± 23 (range, −59–131) | 0.006 | 0.27 |
3.7. Noncontact ACL Injury Rate
4. Discussion
5. Conclusions
Acknowledgments
Author Contributions
Conflicts of Interest
References
- Joseph, A.M.; Collins, C.L.; Henke, N.M.; Yard, E.E.; Fields, S.K.; Comstock, R.D. A multisport epidemiologic comparison of anterior cruciate ligament injuries in high school athletics. J. Athl. Train. 2013, 48, 810–817. [Google Scholar] [CrossRef] [PubMed]
- Mountcastle, S.B.; Posner, M.; Kragh, J.F., Jr.; Taylor, D.C. Gender differences in anterior cruciate ligament injury vary with activity: Epidemiology of anterior cruciate ligament injuries in a young, athletic population. Am. J. Sports Med. 2007, 35, 1635–1642. [Google Scholar] [CrossRef] [PubMed]
- Hootman, J.M.; Dick, R.; Agel, J. Epidemiology of collegiate injuries for 15 sports: Summary and recommendations for injury prevention initiatives. J. Athl. Train. 2007, 42, 311–319. [Google Scholar] [PubMed]
- Beynnon, B.D.; Johnson, R.J.; Abate, J.A.; Fleming, B.C.; Nichols, C.E. Treatment of anterior cruciate ligament injuries, part i. Am. J. Sports Med. 2005, 33, 1579–1602. [Google Scholar] [CrossRef] [PubMed]
- Boden, B.P.; Dean, G.S.; Feagin, J.A., Jr.; Garrett, W.E., Jr. Mechanisms of anterior cruciate ligament injury. Orthopedics 2000, 23, 573–578. [Google Scholar] [PubMed]
- Shimokochi, Y.; Shultz, S.J. Mechanisms of noncontact anterior cruciate ligament injury. J. Athl. Train. 2008, 43, 396–408. [Google Scholar] [CrossRef] [PubMed]
- Mather, R.C., 3rd; Koenig, L.; Kocher, M.S.; Dall, T.M.; Gallo, P.; Scott, D.J.; Bach, B.R., Jr.; Spindler, K.P.; Group, M.K. Societal and economic impact of anterior cruciate ligament tears. J. Bone Joint Surg. Am. 2013, 95, 1751–1759. [Google Scholar] [CrossRef] [PubMed]
- Hanypsiak, B.T.; Spindler, K.P.; Rothrock, C.R.; Calabrese, G.J.; Richmond, B.; Herrenbruck, T.M.; Parker, R.D. Twelve-year follow-up on anterior cruciate ligament reconstruction: Long-term outcomes of prospectively studied osseous and articular injuries. Am. J. Sports Med. 2008, 36, 671–677. [Google Scholar] [CrossRef] [PubMed]
- Ait Si Selmi, T.; Fithian, D.; Neyret, P. The evolution of osteoarthritis in 103 patients with acl reconstruction at 17 years follow-up. Knee 2006, 13, 353–358. [Google Scholar] [CrossRef] [PubMed]
- Barber-Westin, S.D.; Noyes, F.R. Consequences of complete acl ruptures. In Acl Injuries in the Female Athlete: Causes, Impacts, and Conditioning Programs; Noyes, F.R., Barber-Westin, S.D., Eds.; Springer-Verlag: Berlin Heidelberg, Germany, 2012; pp. 27–53. [Google Scholar]
- Noyes, F.R.; Barber-Westin, S.D. Sportsmetrics acl intervention training program: Components, results. In Acl Injuries in the Female Athlete: Causes, Impacts, and Conditioning Programs; Noyes, F.R., Barber-Westin, S.D., Eds.; Springer-Verlag: Berlin Heidelberg, Germany, 2012; pp. 275–308. [Google Scholar]
- Noyes, F.R.; Barber-Westin, S.D. Acl injury prevention warm-up programs. In Acl Injuries in the Female Athlete: Causes, Impacts, and Conditioning Programs; Noyes, F.R., Barber-Westin, S.D., Eds.; Springer-Verlag: Berlin Heidelberg, Germany, 2012; pp. 371–390. [Google Scholar]
- Campbell, C.J.; Carson, J.D.; Diaconescu, E.D.; Celebrini, R.; Rizzardo, M.R.; Godbout, V.; Fletcher, J.A.; McCormack, R.; Outerbridge, R.; Taylor, T.; et al. Canadian academy of sport and exercise medicine position statement: Neuromuscular training programs can decrease anterior cruciate ligament injuries in youth soccer players. Clin. J. Sport Med. 2014, 24, 263–267. [Google Scholar] [CrossRef] [PubMed]
- Postma, W.F.; West, R.V. Anterior cruciate ligament injury-prevention programs. J. Bone Joint Surg. Am. 2013, 95, 661–669. [Google Scholar] [CrossRef] [PubMed]
- Shultz, S.J.; Schmitz, R.J.; Benjaminse, A.; Chaudhari, A.M.; Collins, M.; Padua, D.A. Acl research retreat vi: An update on acl injury risk and prevention. J. Athl. Train. 2012, 47, 591–603. [Google Scholar] [PubMed]
- Renstrom, P.; Ljungqvist, A.; Arendt, E.; Beynnon, B.; Fukubayashi, T.; Garrett, W.; Georgoulis, T.; Hewett, T.E.; Johnson, R.; Krosshaug, T.; et al. Non-contact acl injuries in female athletes: An international olympic committee current concepts statement. Br. J. Sports Med. 2008, 42, 394–412. [Google Scholar] [CrossRef] [PubMed]
- Barber-Westin, S.D.; Noyes, F.R.; Smith, S.T.; Campbell, T.M. Reducing the risk of noncontact anterior cruciate ligament injuries in the female athlete. Phys. Sportsmed. 2009, 37, 49–61. [Google Scholar] [CrossRef] [PubMed]
- Gagnier, J.J.; Morgenstern, H.; Chess, L. Interventions designed to prevent anterior cruciate ligament injuries in adolescents and adults: A systematic review and meta-analysis. Am. J. Sports Med. 2013, 41, 1952–1962. [Google Scholar] [CrossRef] [PubMed]
- Stojanovic, M.D.; Ostojic, S.M. Preventing acl injuries in team-sport athletes: A systematic review of training interventions. Res. Sports Med. 2012, 20, 223–238. [Google Scholar] [PubMed]
- Noyes, F.R.; Barber-Westin, S.D. Neuromuscular retraining intervention programs: Do they reduce noncontact anterior cruciate ligament injury rates in adolescent female athletes? Arthroscopy 2014, 30, 245–255. [Google Scholar] [CrossRef] [PubMed]
- Yoo, J.H.; Lim, B.O.; Ha, M.; Lee, S.W.; Oh, S.J.; Lee, Y.S.; Kim, J.G. A meta-analysis of the effect of neuromuscular training on the prevention of the anterior cruciate ligament injury in female athletes. Knee Surg. Sports Traumatol. Arthrosc. 2010, 18, 824–830. [Google Scholar] [CrossRef] [PubMed]
- Hewett, T.E.; Stroupe, A.L.; Nance, T.A.; Noyes, F.R. Plyometric training in female athletes. Decreased impact forces and increased hamstring torques. Am. J. Sports Med. 1996, 24, 765–773. [Google Scholar] [CrossRef] [PubMed]
- Hewett, T.E.; Lindenfeld, T.N.; Riccobene, J.V.; Noyes, F.R. The effect of neuromuscular training on the incidence of knee injury in female athletes. A prospective study. Am. J. Sports Med. 1999, 27, 699–706. [Google Scholar] [PubMed]
- Noyes, F.R.; Barber-Westin, S.D.; Smith, S.T.; Campbell, T. A training program to improve neuromuscular indices in female high school volleyball players. J. Strength Cond. Res. 2011, 25, 2151–2160. [Google Scholar] [CrossRef] [PubMed]
- Noyes, F.R.; Barber-Westin, S.D.; Smith, S.T.; Campbell, T.; Garrison, T.T. A training program to improve neuromuscular and performance indices in female high school basketball players. J. Strength Cond. Res. 2012, 26, 709–719. [Google Scholar] [PubMed]
- Noyes, F.R.; Barber-Westin, S.D.; Tutalo Smith, S.T.; Campbell, T. A training program to improve neuromuscular and performance indices in female high school soccer players. J. Strength Cond. Res. 2013, 27, 340–351. [Google Scholar] [CrossRef] [PubMed]
- Marshall, W.A.; Tanner, J.M. Variations in pattern of pubertal changes in girls. Arch. Dis. Child. 1969, 44, 291–303. [Google Scholar] [CrossRef] [PubMed]
- Marshall, W.A.; Tanner, J.M. Variations in the pattern of pubertal changes in boys. Arch. Dis. Child. 1970, 45, 13–23. [Google Scholar] [CrossRef] [PubMed]
- Tanner, J.M.; Davies, P.S. Clinical longitudinal standards for height and height velocity for north american children. J. Pediatr. 1985, 107, 317–329. [Google Scholar] [CrossRef] [PubMed]
- Anderson, M.; Messner, M.B.; Green, W.T. Distribution of lengths of the normal femur and tibia in children from one to eighteen years of age. J. Bone Joint Surg. Am. 1964, 46, 1197–1202. [Google Scholar] [PubMed]
- Mulligan, E.P.; McGuffie, D.Q.; Coyner, K.; Khazzam, M. The reliability and diagnostic accuracy of assessing the translation endpoint during the lachman test. Int. J. Sports Phys. Ther. 2015, 10, 52–61. [Google Scholar] [PubMed]
- Benjaminse, A.; Gokeler, A.; van der Schans, C.P. Clinical diagnosis of an anterior cruciate ligament rupture: A meta-analysis. J. Orthop. Sports Phys. Ther. 2006, 36, 267–288. [Google Scholar] [CrossRef] [PubMed]
- Noyes, F.R.; Barber-Westin, S.D.; Fleckenstein, C.; Walsh, C.; West, J. The drop-jump screening test: Difference in lower limb control by gender and effect of neuromuscular training in female athletes. Am. J. Sports Med. 2005, 33, 197–207. [Google Scholar] [CrossRef] [PubMed]
- Noyes, F.R.; Barber, S.D.; Mangine, R.E. Abnormal lower limb symmetry determined by function hop tests after anterior cruciate ligament rupture. Am. J. Sports Med. 1991, 19, 513–518. [Google Scholar] [CrossRef] [PubMed]
- Reid, A.; Birmingham, T.B.; Stratford, P.W.; Alcock, G.K.; Giffin, J.R. Hop testing provides a reliable and valid outcome measure during rehabilitation after anterior cruciate ligament reconstruction. Phys. Ther. 2007, 87, 337–349. [Google Scholar] [CrossRef] [PubMed]
- Ross, M.D.; Langford, B.; Whelan, P.J. Test-retest reliability of 4 single-leg horizontal hop tests. J. Strength Cond. Res. 2002, 16, 617–622. [Google Scholar] [PubMed]
- Chimera, N.J.; Swanik, K.A.; Swanik, C.B.; Straub, S.J. Effects of plyometric training on muscle-activation strategies and performance in female athletes. J. Athl. Train. 2004, 39, 24–31. [Google Scholar] [PubMed]
- Young, W.; MacDonald, C.; Heggen, T.; Fitzpatrick, J. An evaluation of the specificity, validity and reliability of jumping tests. J. Sports Med. Phys. Fit. 1997, 37, 240–245. [Google Scholar]
- Ben Abdelkrim, N.; Castagna, C.; Jabri, I.; Battikh, T.; el Fazaa, S.; el Ati, J. Activity profile and physiological requirements of junior elite basketball players in relation to aerobic-anaerobic fitness. J. Strength Cond. Res. 2010, 24, 2330–2342. [Google Scholar] [CrossRef] [PubMed]
- Delextrat, A.; Cohen, D. Physiological testing of basketball players: Toward a standard evaluation of anaerobic fitness. J. Strength Cond. Res. 2008, 22, 1066–1072. [Google Scholar] [CrossRef] [PubMed]
- Delextrat, A.; Cohen, D. Strength, power, speed, and agility of women basketball players according to playing position. J. Strength Cond. Res. 2009, 23, 1974–1981. [Google Scholar] [CrossRef] [PubMed]
- Myrick, S. Injury prevention and performance enhancement: A training program for basketball. Conn. Med. 2007, 71, 5–8. [Google Scholar] [PubMed]
- Lidor, R.; Ziv, G. Physical and physiological attributes of female volleyball players—A review. J. Strength Cond. Res. 2010, 24, 1963–1973. [Google Scholar] [CrossRef] [PubMed]
- Sassi, R.H.; Dardouri, W.; Yahmed, M.H.; Gmada, N.; Mahfoudhi, M.E.; Gharbi, Z. Relative and absolute reliability of a modified agility t-test and its relationship with vertical jump and straight sprint. J. Strength Cond. Res. 2009, 23, 1644–1651. [Google Scholar] [CrossRef] [PubMed]
- Pauole, K.; Madole, K.; Garhammer, J.; Lacourse, M.; Rozenek, R. Reliability and validity of the t-test as a measure of agility, leg power, and leg speed in college-aged men and women. J. Strength Cond. Res. 2000, 14, 443–450. [Google Scholar]
- Hetzler, R.K.; Stickley, C.D.; Lundquist, K.M.; Kimura, I.F. Reliability and accuracy of handheld stopwatches compared with electronic timing in measuring sprint performance. J. Strength Cond. Res. 2008, 22, 1969–1976. [Google Scholar] [CrossRef] [PubMed]
- Leger, L.A.; Lambert, J. A maximal multistage 20-m shuttle run test to predict vo2 max. Eur. J. Appl. Physiol. Occup. Physiol. 1982, 49, 1–12. [Google Scholar] [CrossRef] [PubMed]
- Ramsbottom, R.; Brewer, J.; Williams, C. A progressive shuttle run test to estimate maximal oxygen uptake. Br. J. Sports Med. 1988, 22, 141–144. [Google Scholar] [CrossRef] [PubMed]
- Gabbett, T.J. A comparison of physiological and anthropometric characteristics among playing positions in junior rugby league players. Br. J. Sports Med. 2005, 39, 675–680. [Google Scholar] [CrossRef] [PubMed]
- Williford, H.N.; Scharff-Olson, M.; Duey, W.J.; Pugh, S.; Barksdale, J.M. Physiological status and prediction of cardiovascular fitness in highly trained youth soccer athletes. J. Strength Cond. Res. 1999, 13, 10–15. [Google Scholar]
- Alaranta, H.; Hurri, H.; Heliovaara, M.; Soukka, A.; Harju, R. Non-dynamometric trunk performance tests: Reliability and normative data. Scand. J. Rehabil. Med. 1994, 26, 211–215. [Google Scholar] [PubMed]
- Carvalho, H.M.; Coelho, E.S.M.J.; Ronque, E.R.; Goncalves, R.S.; Philippaerts, R.M.; Malina, R.M. Assessment of reliability in isokinetic testing among adolescent basketball players. Medicina (Kaunas) 2011, 47, 446–452. [Google Scholar]
- De Araujo Ribeiro Alvares, J.B.; Rodrigues, R.; de Azevedo Franke, R.; da Silva, B.G.; Pinto, R.S.; Vaz, M.A.; Baroni, B.M. Inter-machine reliability of the biodex and cybex isokinetic dynamometers for knee flexor/extensor isometric, concentric and eccentric tests. Phys. Ther. Sport 2015, 16, 59–65. [Google Scholar] [CrossRef] [PubMed]
- Nuyens, G.; de Weerdt, W.; Spaepen, A.; Janssens, L.; Ketelaer, P.; Bogaerts, K. Reliability of torque measurements during passive isokinetic knee movements in healthy subjects. Scand J. Rehabil. Med. 2000, 32, 61–65. [Google Scholar] [CrossRef] [PubMed]
- Tsiros, M.D.; Grimshaw, P.N.; Schield, A.J.; Buckley, J.D. Test-retest reliability of the biodex system 4 isokinetic dynamometer for knee strength assessment in paediatric populations. J. Allied Health 2011, 40, 115–119. [Google Scholar] [PubMed]
- Sole, G.; Hamren, J.; Milosavljevic, S.; Nicholson, H.; Sullivan, S.J. Test-retest reliability of isokinetic knee extension and flexion. Arch. Phys. Med. Rehabil. 2007, 88, 626–631. [Google Scholar] [CrossRef] [PubMed]
- Cohen, J. Statistical Power Analysis for the Behavioral Sciences; Academic Press: New York, NY, USA, 1977; pp. 19–74. [Google Scholar]
- Wilkerson, G.B.; Colston, M.A.; Short, N.I.; Neal, K.L.; Hoewischer, P.E.; Pixley, J.J. Neuromuscular changes in female collegiate athletes resulting from a plyometric jump-training program. J. Athl. Train. 2004, 39, 17–23. [Google Scholar] [PubMed]
- Herman, D.C.; Weinhold, P.S.; Guskiewicz, K.M.; Garrett, W.E.; Yu, B.; Padua, D.A. The effects of strength training on the lower extremity biomechanics of female recreational athletes during a stop-jump task. Am. J. Sports Med. 2008, 36, 733–740. [Google Scholar] [CrossRef] [PubMed]
- Herman, D.C.; Onate, J.A.; Weinhold, P.S.; Guskiewicz, K.M.; Garrett, W.E.; Yu, B.; Padua, D.A. The effects of feedback with and without strength training on lower extremity biomechanics. Am. J. Sports Med. 2009, 37, 1301–1308. [Google Scholar] [CrossRef] [PubMed]
- Tsang, K.K.; Dipasquale, A.A. Improving the q:H strength ratio in women using plyometric exercises. J. Strength Cond. Res. 2011, 25, 2740–2745. [Google Scholar] [CrossRef] [PubMed]
- Wilderman, D.R.; Ross, S.E.; Padua, D.A. Thigh muscle activity, knee motion, and impact force during side-step pivoting in agility-trained female basketball players. J. Athl. Train. 2009, 44, 14–25. [Google Scholar] [CrossRef] [PubMed]
- Lephart, S.M.; Abt, J.P.; Ferris, C.M.; Sell, T.C.; Nagai, T.; Myers, J.B.; Irrgang, J.J. Neuromuscular and biomechanical characteristic changes in high school athletes: A plyometric versus basic resistance program. Br. J. Sports Med. 2005, 39, 932–938. [Google Scholar] [CrossRef] [PubMed]
- Chappell, J.D.; Limpisvasti, O. Effect of a neuromuscular training program on the kinetics and kinematics of jumping tasks. Am. J. Sports Med. 2008, 36, 1081–1086. [Google Scholar] [CrossRef] [PubMed]
- Myer, G.D.; Ford, K.R.; Palumbo, J.P.; Hewett, T.E. Neuromuscular training improves performance and lower-extremity biomechanics in female athletes. J. Strength Cond. Res. 2005, 19, 51–60. [Google Scholar] [PubMed]
- Zebis, M.K.; Bencke, J.; Andersen, L.L.; Dossing, S.; Alkjaer, T.; Magnusson, S.P.; Kjaer, M.; Aagaard, P. The effects of neuromuscular training on knee joint motor control during sidecutting in female elite soccer and handball players. Clin. J. Sport Med. 2008, 18, 329–337. [Google Scholar] [CrossRef] [PubMed]
- Distefano, L.J.; Padua, D.A.; Blackburn, J.T.; Garrett, W.E.; Guskiewicz, K.M.; Marshall, S.W. Integrated injury prevention program improves balance and vertical jump height in children. J. Strength Cond. Res. 2010, 24, 332–342. [Google Scholar] [CrossRef] [PubMed]
- Herrington, L. The effects of 4 weeks of jump training on landing knee valgus and crossover hop performance in female basketball players. J. Strength Cond. Res. 2010, 24, 3427–3432. [Google Scholar] [CrossRef] [PubMed]
- Barendrecht, M.; Lezeman, H.C.; Duysens, J.; Smits-Engelsman, B.C. Neuromuscular training improves knee kinematics, in particular in valgus aligned adolescent team handball players of both sexes. J. Strength Cond. Res. 2011, 25, 575–584. [Google Scholar] [CrossRef] [PubMed]
- Barber-Westin, S.D.; Noyes, F.R. Effect of intervention programs on reducing the incidence of acl injuries, improving neuromuscular deficiencies, and enhancing athletic performance. In Acl Injuries in the Female Athlete: Causes, Impacts, and Conditioning Programs; Noyes, F.R., Barber-Westin, S.D., Eds.; Springer-Verlag: Berline Heidelberg, Germany, 2012; pp. 391–423. [Google Scholar]
- Mandelbaum, B.R.; Silvers, H.J.; Watanabe, D.S.; Knarr, J.F.; Thomas, S.D.; Griffin, L.Y.; Kirkendall, D.T.; Garrett, W., Jr. Effectiveness of a neuromuscular and proprioceptive training program in preventing anterior cruciate ligament injuries in female athletes: 2-Year follow-up. Am. J. Sports Med. 2005, 33, 1003–1010. [Google Scholar] [CrossRef] [PubMed]
- Labella, C.R.; Huxford, M.R.; Grissom, J.; Kim, K.Y.; Peng, J.; Christoffel, K.K. Effect of neuromuscular warm-up on injuries in female soccer and basketball athletes in urban public high schools: Cluster randomized controlled trial. Arch. Pediatr. Adolesc. Med. 2011, 165, 1033–1040. [Google Scholar] [CrossRef] [PubMed]
- Lim, B.O.; Lee, Y.S.; Kim, J.G.; An, K.O.; Yoo, J.; Kwon, Y.H. Effects of sports injury prevention training on the biomechanical risk factors of anterior cruciate ligament injury in high school female basketball players. Am. J. Sports Med. 2009, 37, 1728–1734. [Google Scholar] [CrossRef] [PubMed]
- Vescovi, J.D.; VanHeest, J.L. Effects of an anterior cruciate ligament injury prevention program on performance in adolescent female soccer players. Scand. J. Med. Sci. Sports 2010, 20, 394–402. [Google Scholar] [CrossRef] [PubMed]
- Olsen, O.E.; Myklebust, G.; Engebretsen, L.; Holme, I.; Bahr, R. Exercises to prevent lower limb injuries in youth sports: Cluster randomised controlled trial. BMJ 2005, 330, 449. [Google Scholar] [CrossRef] [PubMed]
- Pfeiffer, R.P.; Shea, K.G.; Roberts, D.; Grandstrand, S.; Bond, L. Lack of effect of a knee ligament injury prevention program on the incidence of noncontact anterior cruciate ligament injury. J. Bone Joint Surg. Am. 2006, 88, 1769–1774. [Google Scholar] [CrossRef] [PubMed]
- Steffen, K.; Myklebust, G.; Olsen, O.E.; Holme, I.; Bahr, R. Preventing injuries in female youth football--a cluster-randomized controlled trial. Scand. J. Med. Sci. Sports 2008, 18, 605–614. [Google Scholar] [CrossRef] [PubMed]
- Kiani, A.; Hellquist, E.; Ahlqvist, K.; Gedeborg, R.; Michaelsson, K.; Byberg, L. Prevention of soccer-related knee injuries in teenaged girls. Arch. Intern. Med. 2010, 170, 43–49. [Google Scholar] [CrossRef] [PubMed]
- Walden, M.; Atroshi, I.; Magnusson, H.; Wagner, P.; Hagglund, M. Prevention of acute knee injuries in adolescent female football players: Cluster randomised controlled trial. BMJ 2012, 344, e3042. [Google Scholar] [CrossRef] [PubMed]
- Pollard, C.D.; Sigward, S.M.; Powers, C.M. Limited hip and knee flexion during landing is associated with increased frontal plane knee motion and moments. Clin. Biomech. (Bristol., Avon.) 2010, 25, 142–146. [Google Scholar] [CrossRef]
- Ebben, W.P. Analysis of male and female athletes’ muscle activation patterns during running, cutting, and jumping. In Acl Injuries in the Female Athlete: Causes, Impacts, and Conditioning Programs; Noyes, F.R., Barber-Westin, S.D., Eds.; Springer-Verlag: Berlin Heidelberg, Germany, 2012; pp. 149–168. [Google Scholar]
- Miranda, D.L.; Fadale, P.D.; Hulstyn, M.J.; Shalvoy, R.M.; Machan, J.T.; Fleming, B.C. Knee biomechanics during a jump-cut maneuver: Effects of sex and acl surgery. Med. Sci. Sports Exerc. 2013, 45, 942–951. [Google Scholar] [CrossRef] [PubMed]
- Hanson, A.M.; Padua, D.A.; Troy Blackburn, J.; Prentice, W.E.; Hirth, C.J. Muscle activation during side-step cutting maneuvers in male and female soccer athletes. J. Athl. Train. 2008, 43, 133–143. [Google Scholar] [CrossRef] [PubMed]
- Laughlin, W.A.; Weinhandl, J.T.; Kernozek, T.W.; Cobb, S.C.; Keenan, K.G.; O’Connor, K.M. The effects of single-leg landing technique on acl loading. J. Biomech. 2011, 44, 1845–1851. [Google Scholar] [CrossRef] [PubMed]
- Greska, E.K.; Cortes, N.; van Lunen, B.L.; Onate, J.A. A feedback inclusive neuromuscular training program alters frontal plane kinematics. J. Strength Cond. Res. 2012, 26, 1609–1619. [Google Scholar] [PubMed]
- Celebrini, R.G.; Eng, J.J.; Miller, W.C.; Ekegren, C.L.; Johnston, J.D.; MacIntyre, D.L. The effect of a novel movement strategy in decreasing acl risk factors in female adolescent soccer players. J. Strength Cond. Res. 2012, 26, 3406–3417. [Google Scholar] [CrossRef] [PubMed]
- Kristianslund, E.; Faul, O.; Bahr, R.; Myklebust, G.; Krosshaug, T. Sidestep cutting technique and knee abduction loading: Implications for acl prevention exercises. Br. J. Sports Med. 2014, 48, 779–783. [Google Scholar] [CrossRef] [PubMed]
- Heckmann, T.P.; Noyes, F.R.; Barber-Westin, S.D. Rehabilitation after acl reconstruction. In Acl Injuries in the Female Athlete: Causes, impacts, and Conditioning Programs; Noyes, F.R., Barber-Westin, S.D., Eds.; Springer-Verlag: Berlin Heidelberg, Germany, 2013; pp. 427–454. [Google Scholar]
© 2015 by the authors; licensee MDPI, Basel, Switzerland. This article is an open access article distributed under the terms and conditions of the Creative Commons Attribution license (http://creativecommons.org/licenses/by/4.0/).
Share and Cite
Noyes, F.R.; Barber-Westin, S.D. Neuromuscular Retraining in Female Adolescent Athletes: Effect on Athletic Performance Indices and Noncontact Anterior Cruciate Ligament Injury Rates. Sports 2015, 3, 56-76. https://doi.org/10.3390/sports3020056
Noyes FR, Barber-Westin SD. Neuromuscular Retraining in Female Adolescent Athletes: Effect on Athletic Performance Indices and Noncontact Anterior Cruciate Ligament Injury Rates. Sports. 2015; 3(2):56-76. https://doi.org/10.3390/sports3020056
Chicago/Turabian StyleNoyes, Frank R., and Sue D. Barber-Westin. 2015. "Neuromuscular Retraining in Female Adolescent Athletes: Effect on Athletic Performance Indices and Noncontact Anterior Cruciate Ligament Injury Rates" Sports 3, no. 2: 56-76. https://doi.org/10.3390/sports3020056
APA StyleNoyes, F. R., & Barber-Westin, S. D. (2015). Neuromuscular Retraining in Female Adolescent Athletes: Effect on Athletic Performance Indices and Noncontact Anterior Cruciate Ligament Injury Rates. Sports, 3(2), 56-76. https://doi.org/10.3390/sports3020056