Article

The Progression of Male 100 m Sprinting with a Lower-Limb Amputation 1976–2012

Faculty of Science & Technology, Bournemouth University, Fern Barrow, Poole BH12 5BB, UK
Sports 2015, 3(1), 30-39; https://doi.org/10.3390/sports3010030
Submission received: 24 October 2014 / Revised: 10 February 2015 / Accepted: 12 February 2015 / Published: 16 February 2015

Abstract

:
Sprinting with a lower-limb amputation over 100 m has taken place in the Paralympic Games for over three decades. The aim of this paper is to statistically evaluate the performances and participation levels of such athletes during this period. The level of performance improvement over a 36-year period was proposed to be significantly greater than the able-bodied equivalent. Coupled with this, a major spike in amputee running performance improvement was shown to occur from 1984–1988. This supports previously recorded accounts of a major technological change being made at this time. Finally, whilst the average performance of the medallists has increased consistently over the 36-year history, the overall participation in the event fell significantly after 1988 and did not recover until 2012.

1. Introduction

Whilst other competitions such as World Championships and the Paralympic World Cup both offer competitive opportunities for athletes with a disability, the longest recorded and best known event is the Paralympic Games.
The first Paralympic Games took place in 1960 [1] and a specific event for lower-limb amputee sprinting began in 1976. The sprint running distances of 100, 200 and 400 m for both male and female athletes all exist within the Paralympic programme. However, only the male 100 m has consistently taken place since 1976.
Generally speaking, whilst an amputation is a disability, the level and type of any limb amputation will affect the performance of an athlete differently [2]. As a result, such athletes are classified based upon their functionality [3]. The classification of any athletes’ disability has been undertaken either as a specific designation of their disability, or more recently through actual functional assessment [3]. This process clusters athletes with a similar level of disability together. The classification designated code for an athlete with a below-knee amputation in sprint athletics has changed over the 1976–2012 timeframe and has been defined in each Paralympic Games as:
  • MC (1976 and 1980)
  • A4 (1984 and 1988)
  • TS2 (1992)
  • T44 (1996-current)
The current T44 class sprinter is typically characterised by a single amputation performed below the knee joint. An athlete with a double below-knee amputation can also race in the same event despite actually receiving a different formal classification (T43). This is known as a combined class and is often as a result of low levels of participation in any one classification [3]. However, even in a combined classification, prizes are only awarded to the first three athletes across the finish line. This makes parity between such mixed groups essential.
Sprinting with an amputation typically requires the use of a prosthetic limb. With functional prostheses, their purpose is to help a user maintain a full and active lifestyle [4]. However, the nature of prostheses when used in competitive sport is to facilitate the act of running and contribute to the best possible performance from an athlete. Running with a disability is unique in that it fundamentally requires technology to help facilitate it [5].
Whilst attention has focused on the act of amputee running [2], the behaviour of its technology [6] or characteristics when such athletes race [7], no study to date has investigated the male 100 m lower-limb amputee sprinting results and participation over the course of its history at the Paralympic Games. This study will evaluate both performance data from the Paralympic Games over the 1976–2012 period and then compare this to the able-bodied equivalent. It will also evaluate the level and type of athletic participation that has taken place during this time period.

2. Methods

2.1. Performance Data

The results of the male 100 m below knee classification from 1976–2012 was used as the basis of this study. The data was obtained from the sport’s governing body website (http://www.paralympic.org/Athletes/Results).
Two statistical methods were used to track the progression of this event. The first method uses the Performance Improvement Index [8]. The Performance Improvement Index (PII) primarily assesses sports performance change from one set of performance data to another using the results of an event. It ultimately identifies proportions that could also be attributed to sports technology and provides a metric which forms a direct comparison to other sports that rely on different metrics (such as speed, distance, or time). Considering the typical requirement of a prosthetic limb when running with a lower-limb amputation [2] and the publicised controversy surrounding their use [6], use of this method may add further value to any discussions in the future. The PII has also been used to explore the impact of World Wars 1 and 2 upon running short, middle and long distance world records [9], and on the impact of technological innovation in Olympic field jumping events [10]. The PII cannot currently identify the exact proportion of impact of sports technology change, but it has been shown to corroborate anecdotal evidence of change such as the inception of new materials used for the pole vault or a change in the aerodynamic design of bicycles [8]. As a result, it is a complementary tool to inform debate rather than to generate substantive findings. When considering timed events over fixed distances, Haake [8] defines the Performance Improvement Index as:
Index = [ ( t 1 t 2 ) 2 1 ]   × 100
This formula was initially derived as part of a linear regression process [8]. This formula addresses work done by a body overcoming aerodynamic drag when moving and for a fixed air density. It comprises a first timed performance t1 divided by a second performance t2. The rest of the formula converts the change between two performances and expresses it as a percentage. This formula assumes events requiring motion to be dominated by aerodynamics. However, it should be noted that air resistance increases exponentially as speed increases [11]. The proportion attributed to the air resistance of a 100 m sprinter running at 36 km/h is going to be exponentially less than a cyclist performing a 4 km individual pursuit at 50 km/h. As a result, the magnitude of the PII index may be skewed if comparing events that result in different absolute and average speeds.
The second method was the percentage increase of a performance from one Paralympics Games to the next. This was expressed as:
Index = [ ( t 1 t 2 ) t 1 ]   × 100
Like the PII, t1 is the first performance (race time) and t2 the next performance (race time). The result of this change was also expressed as a percentage.
The mean average of the finishing time of the 3 medal podium runners from each successive Paralympic Games was calculated as a basis for methods one and two. By considering a group of runners (rather than outright world records or event winners), any individual outliers are reduced in impact to help prevent skew. Each events sample of three allows a normalised comparison of all results despite participation likely varying at each games.
Both amputee sprinting and its able-bodied equivalent could be considered the same in philosophical nature. As a result, to provide a base of reference to the amputee race analysis, both methods one and two were compared to able-bodied 100 m sprinting to the nearest able-bodied equivalent, the Olympic Games. The Olympic Games and Paralympic Games have both taken place every 4 years and (since 1992) at the same venue. To provide the basis for such comparison (and to also provide several methods of normalising the relative infancy of sprinting with a disability with those of the able-bodied equivalent), three 36-year data evaluations were compared. These are:
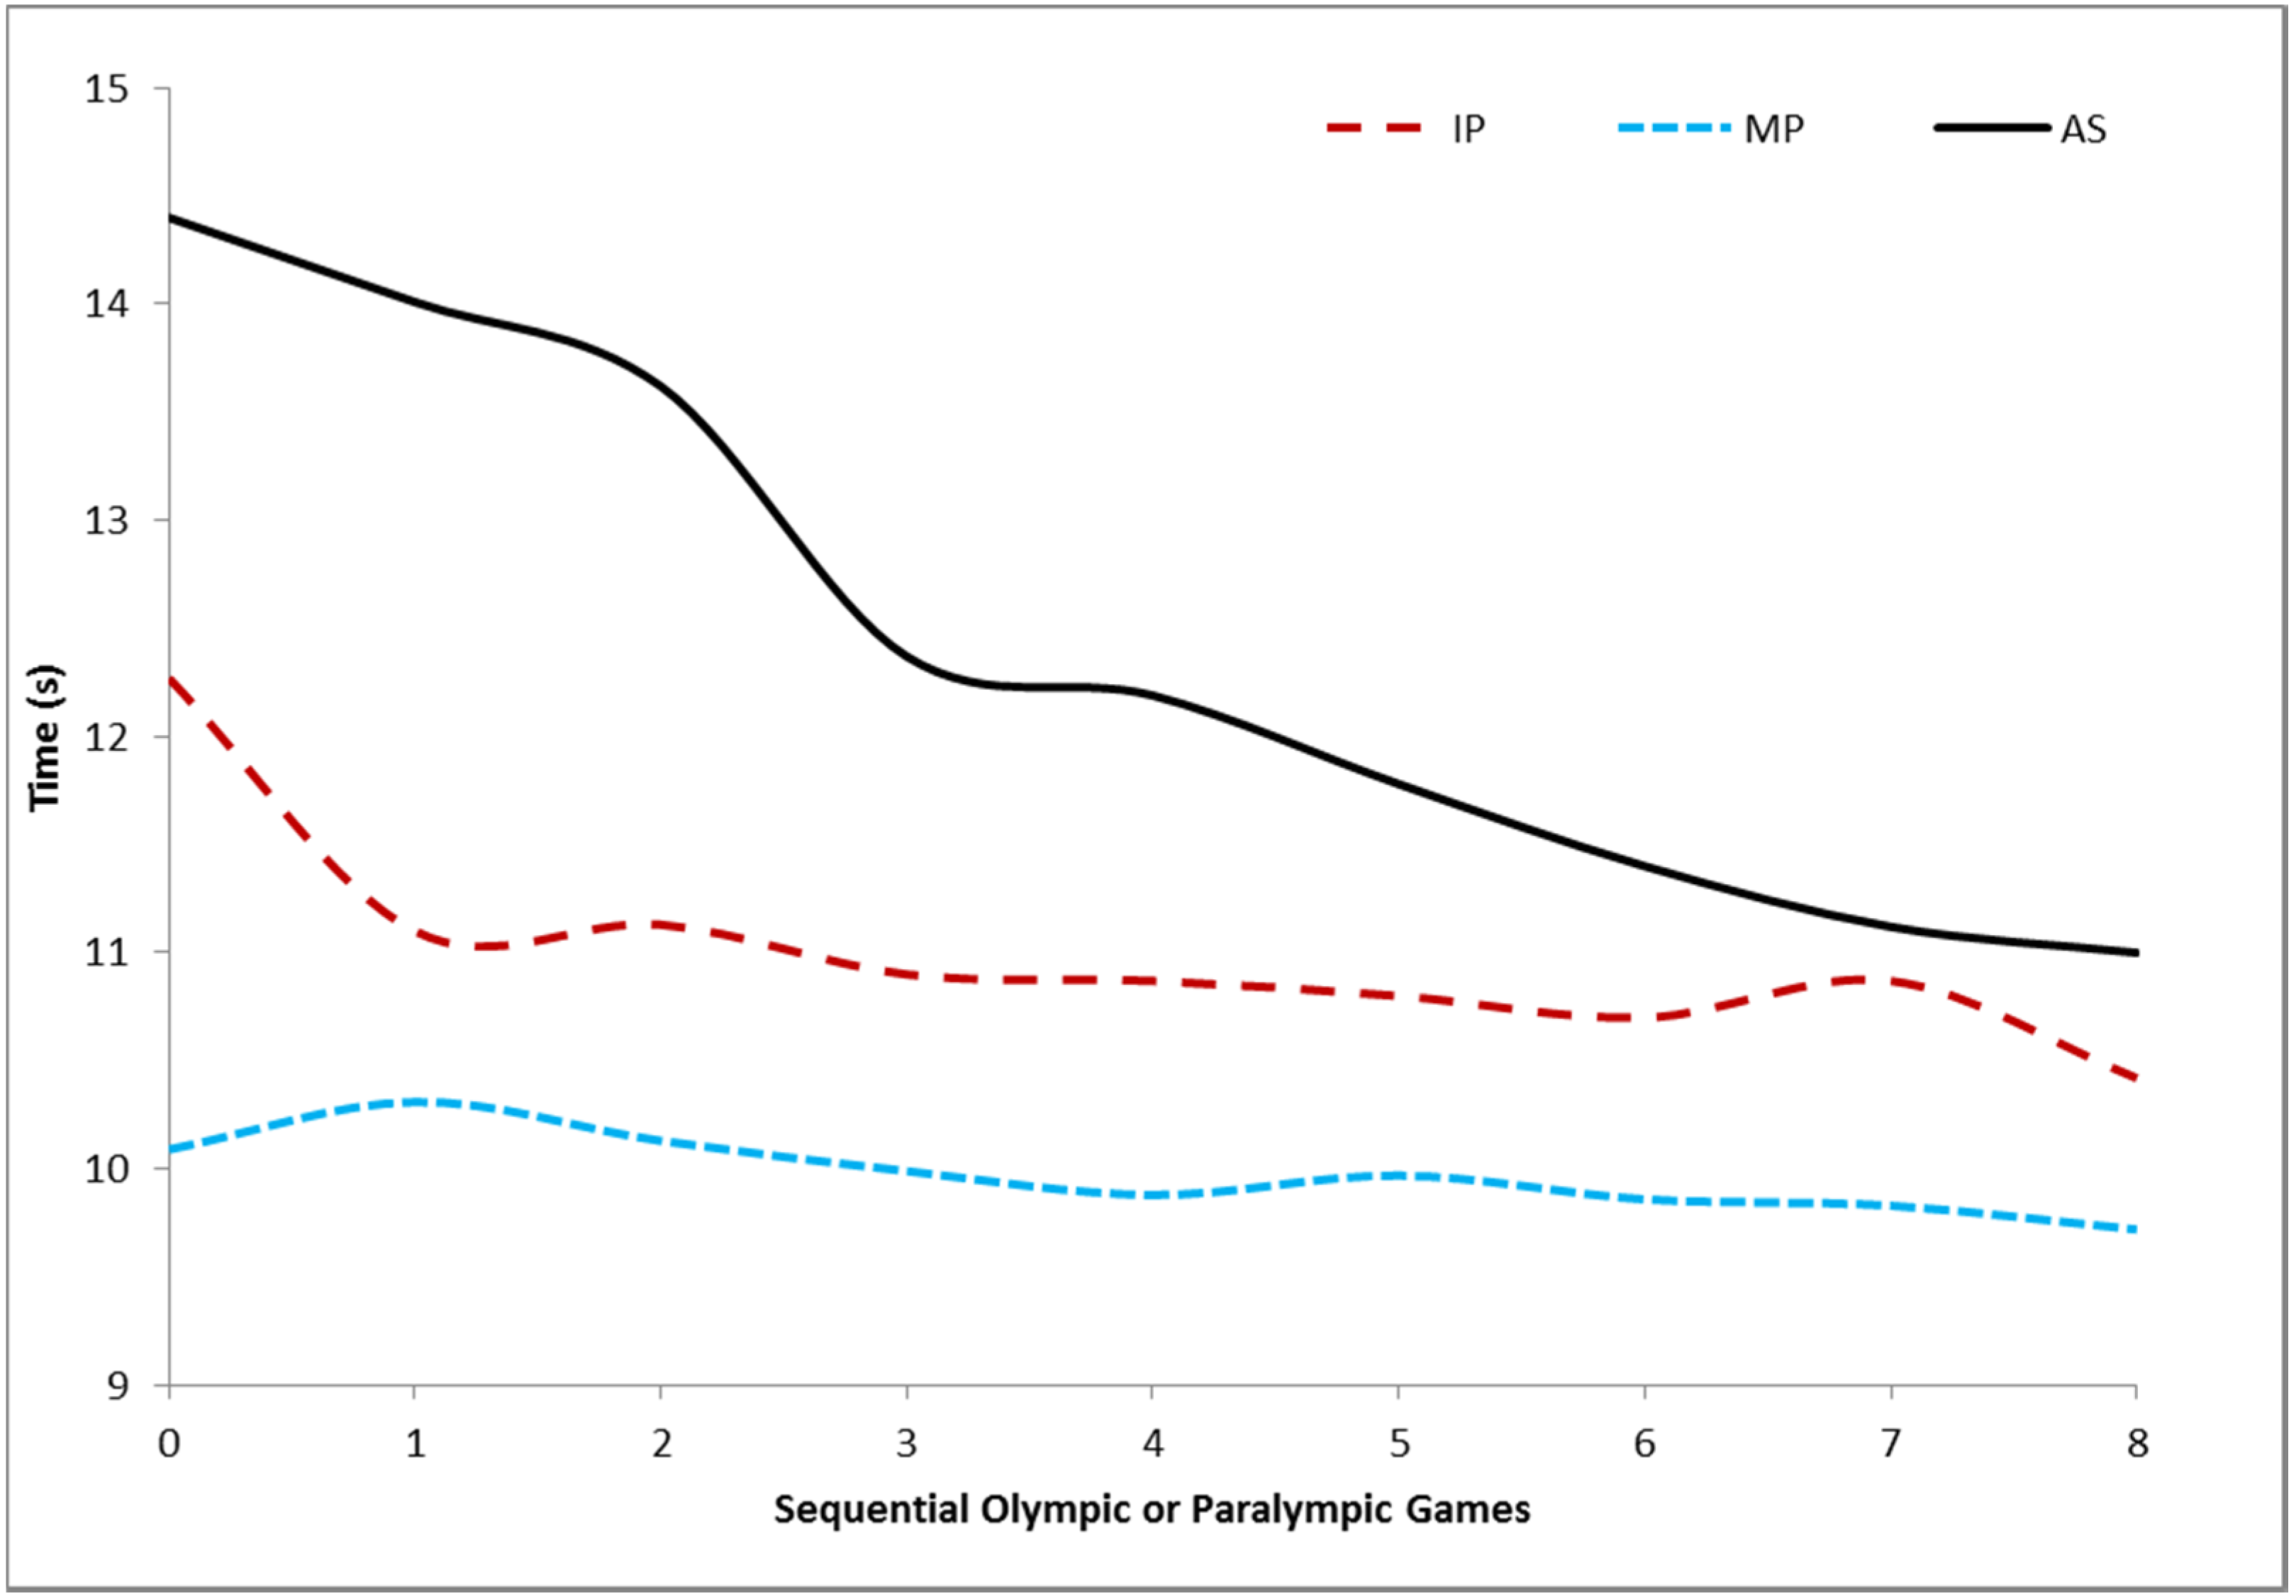
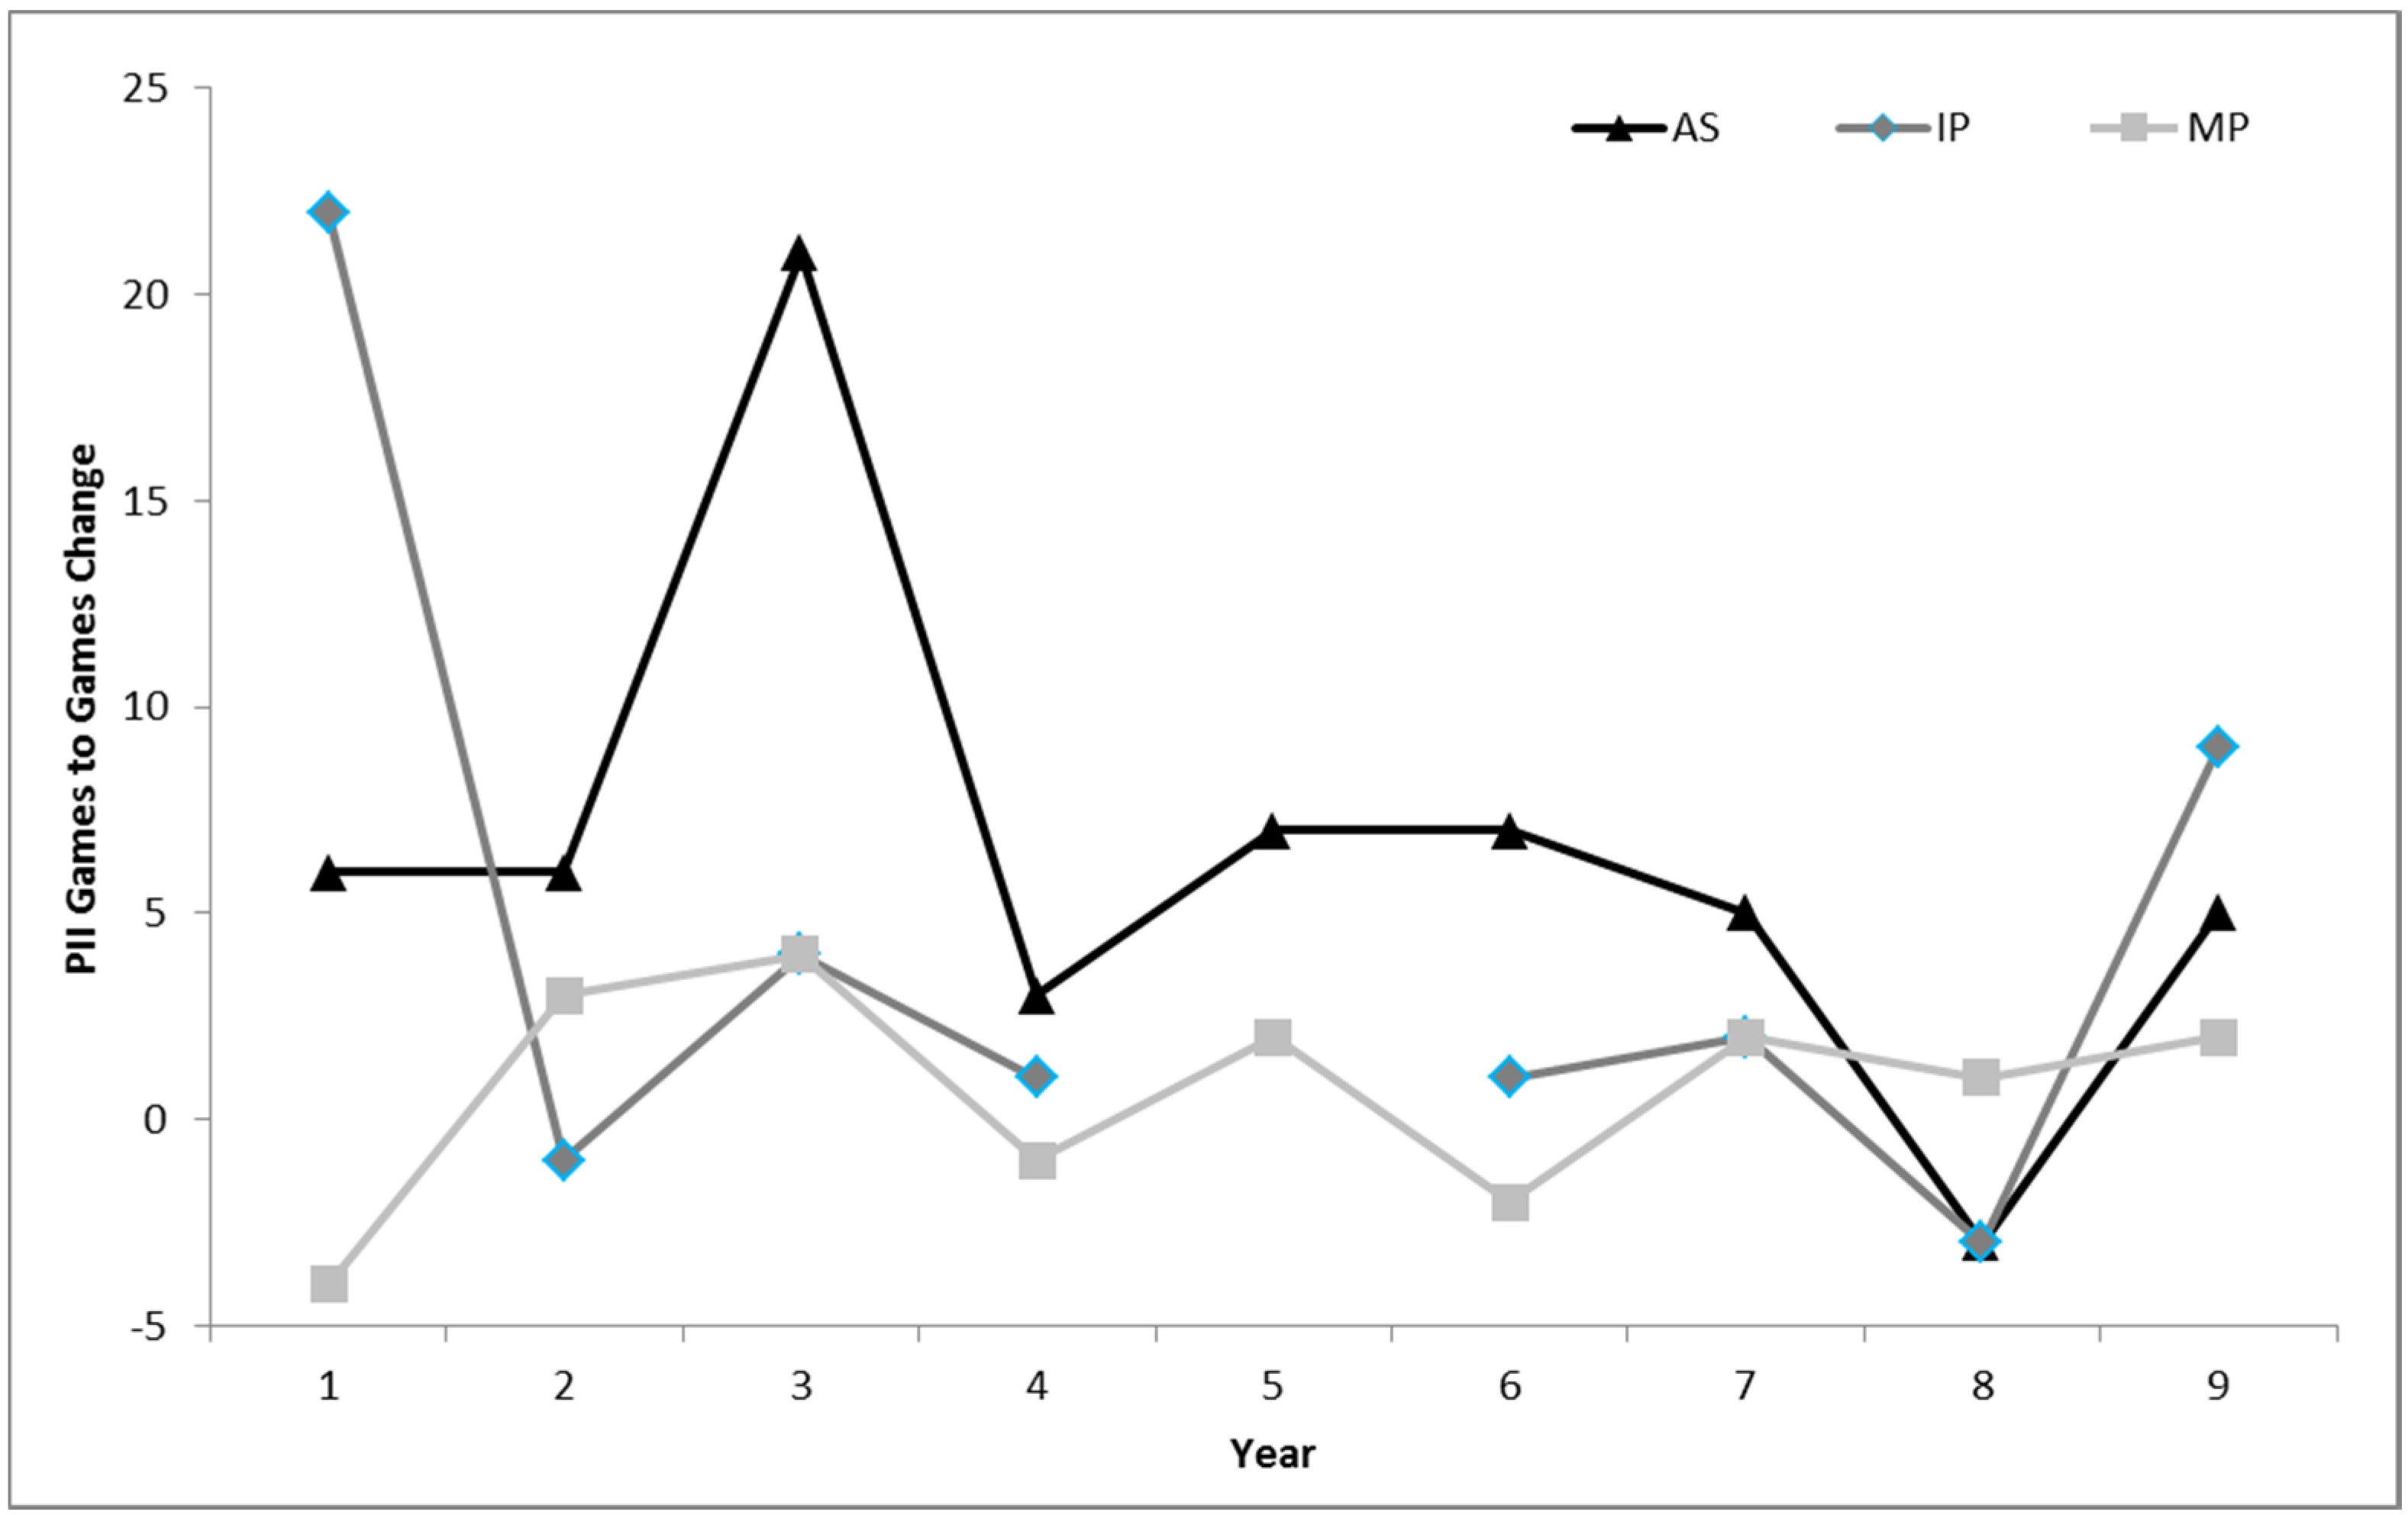
  • Amputee sprinting (AS): The PII change from Paralympic Games to Paralympic Games over the 1976–2012 time period.
  • Able-bodied Inception Period (IP): The change from Olympic Games to Olympic Games over the 1896–1932 time period.
  • Able-bodied Modern Period (MP): The change from Olympic Games to Olympic Games over the 1976–2012 time period.
It should be noted that only legal competitive performances were used in this study. Any sprinting performance which were rejected in the official results due to illegal practises such as doping, were also excluded here.

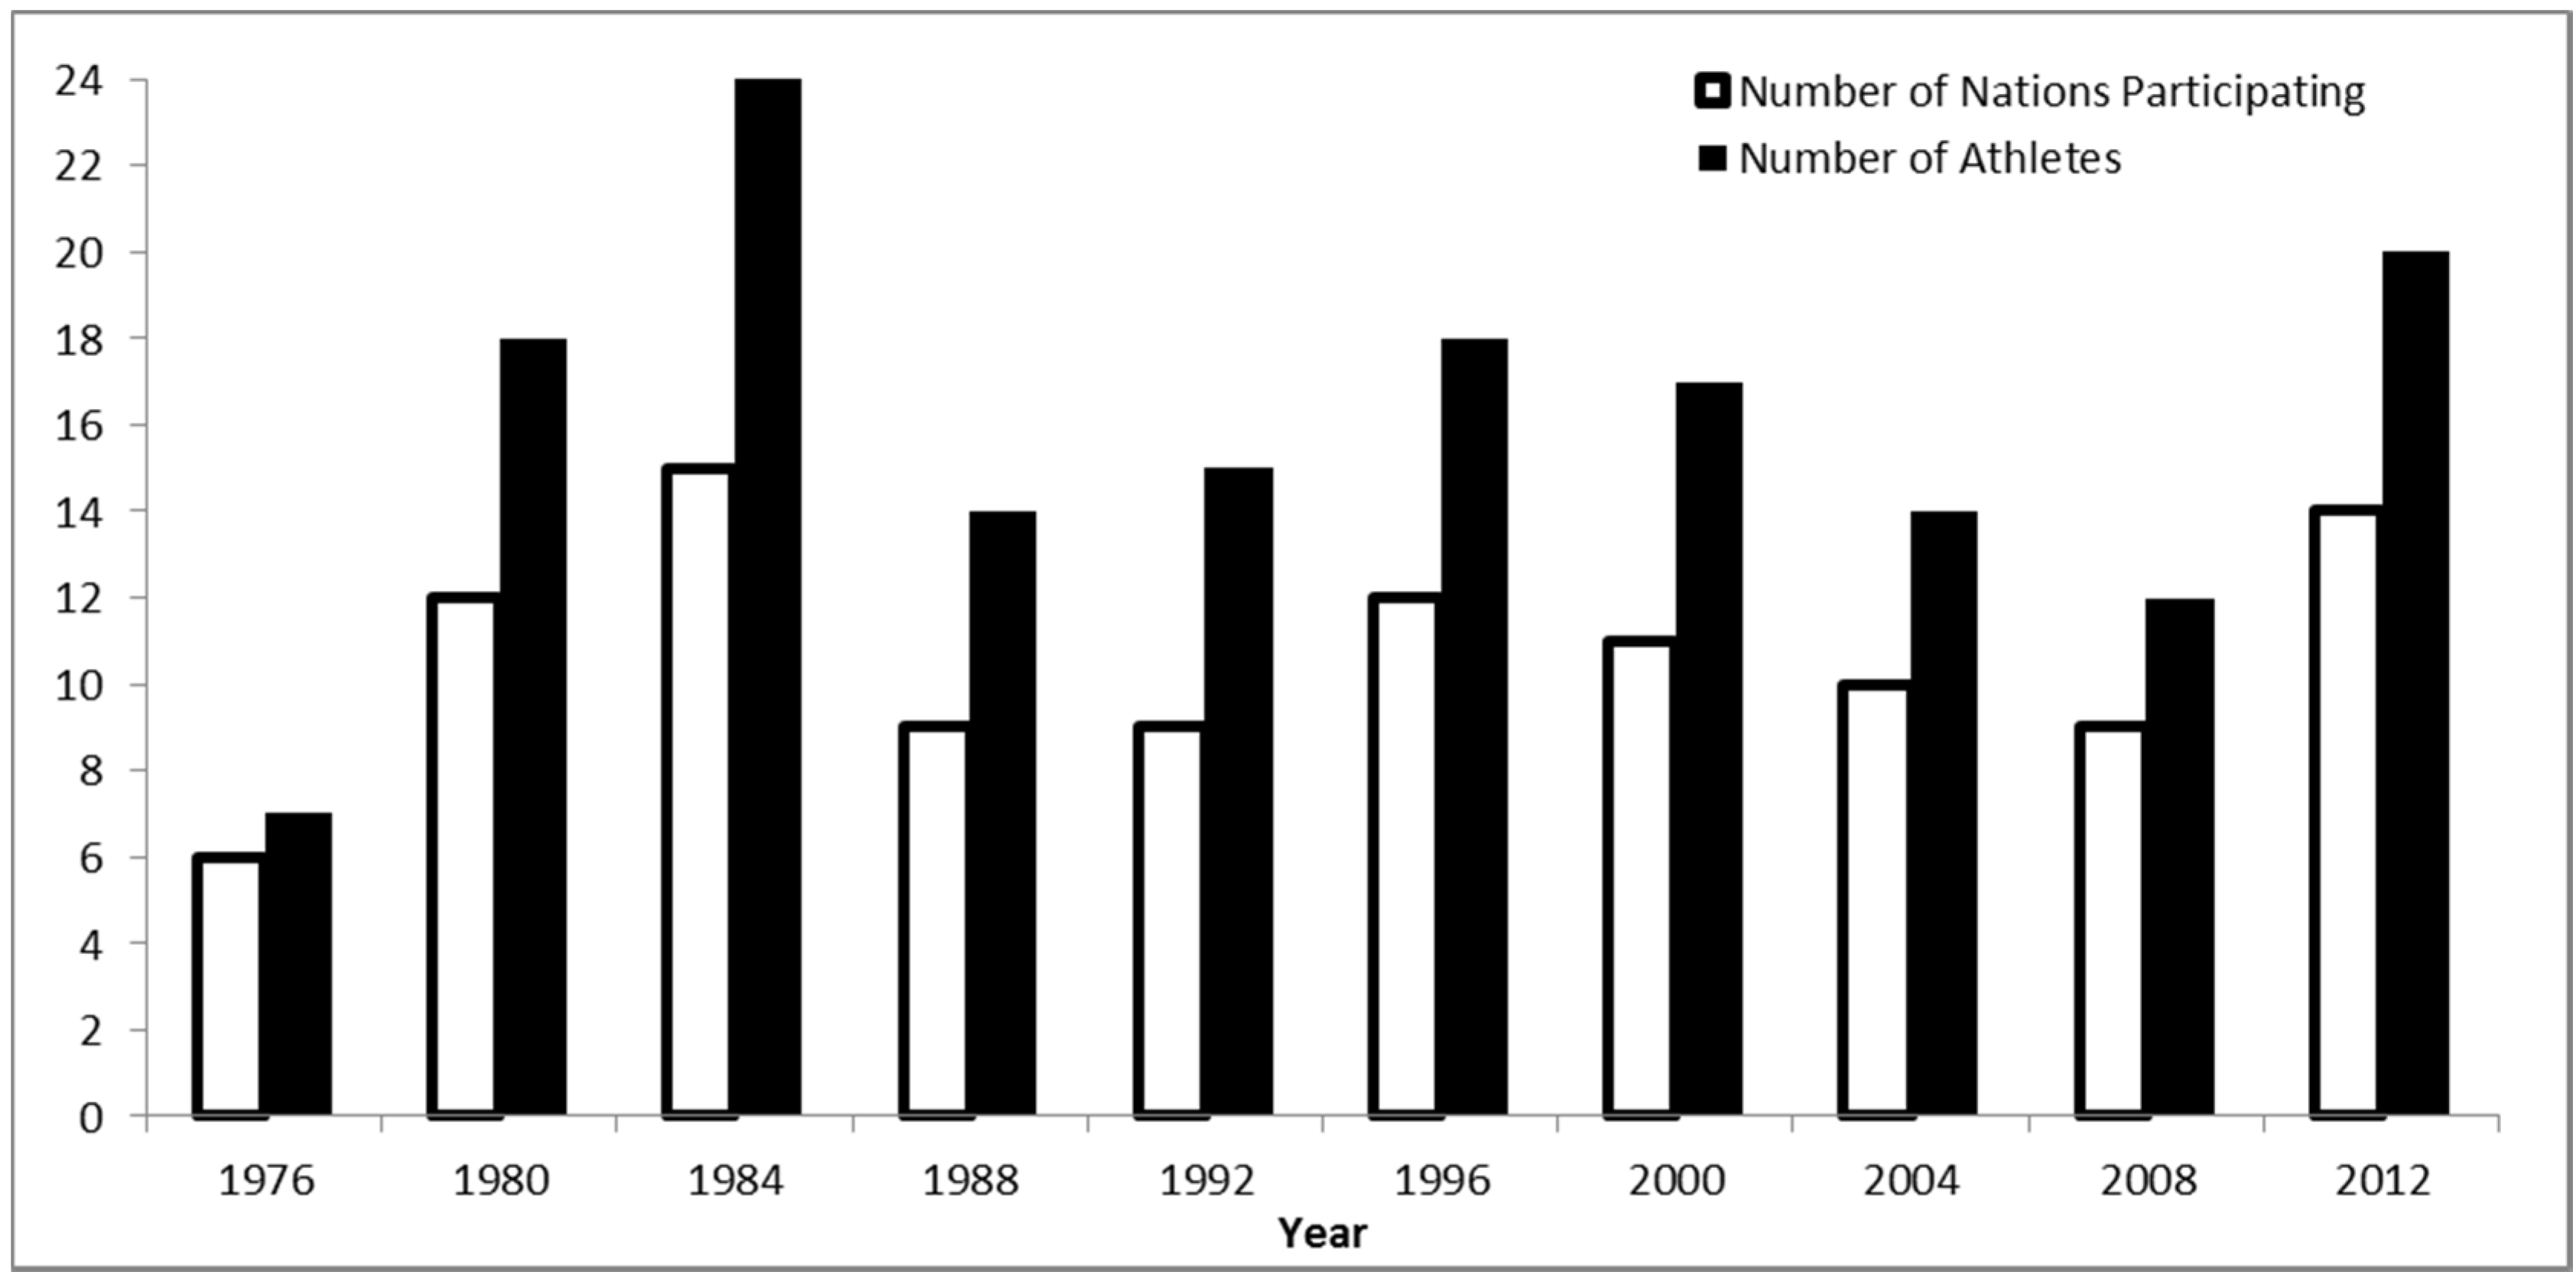
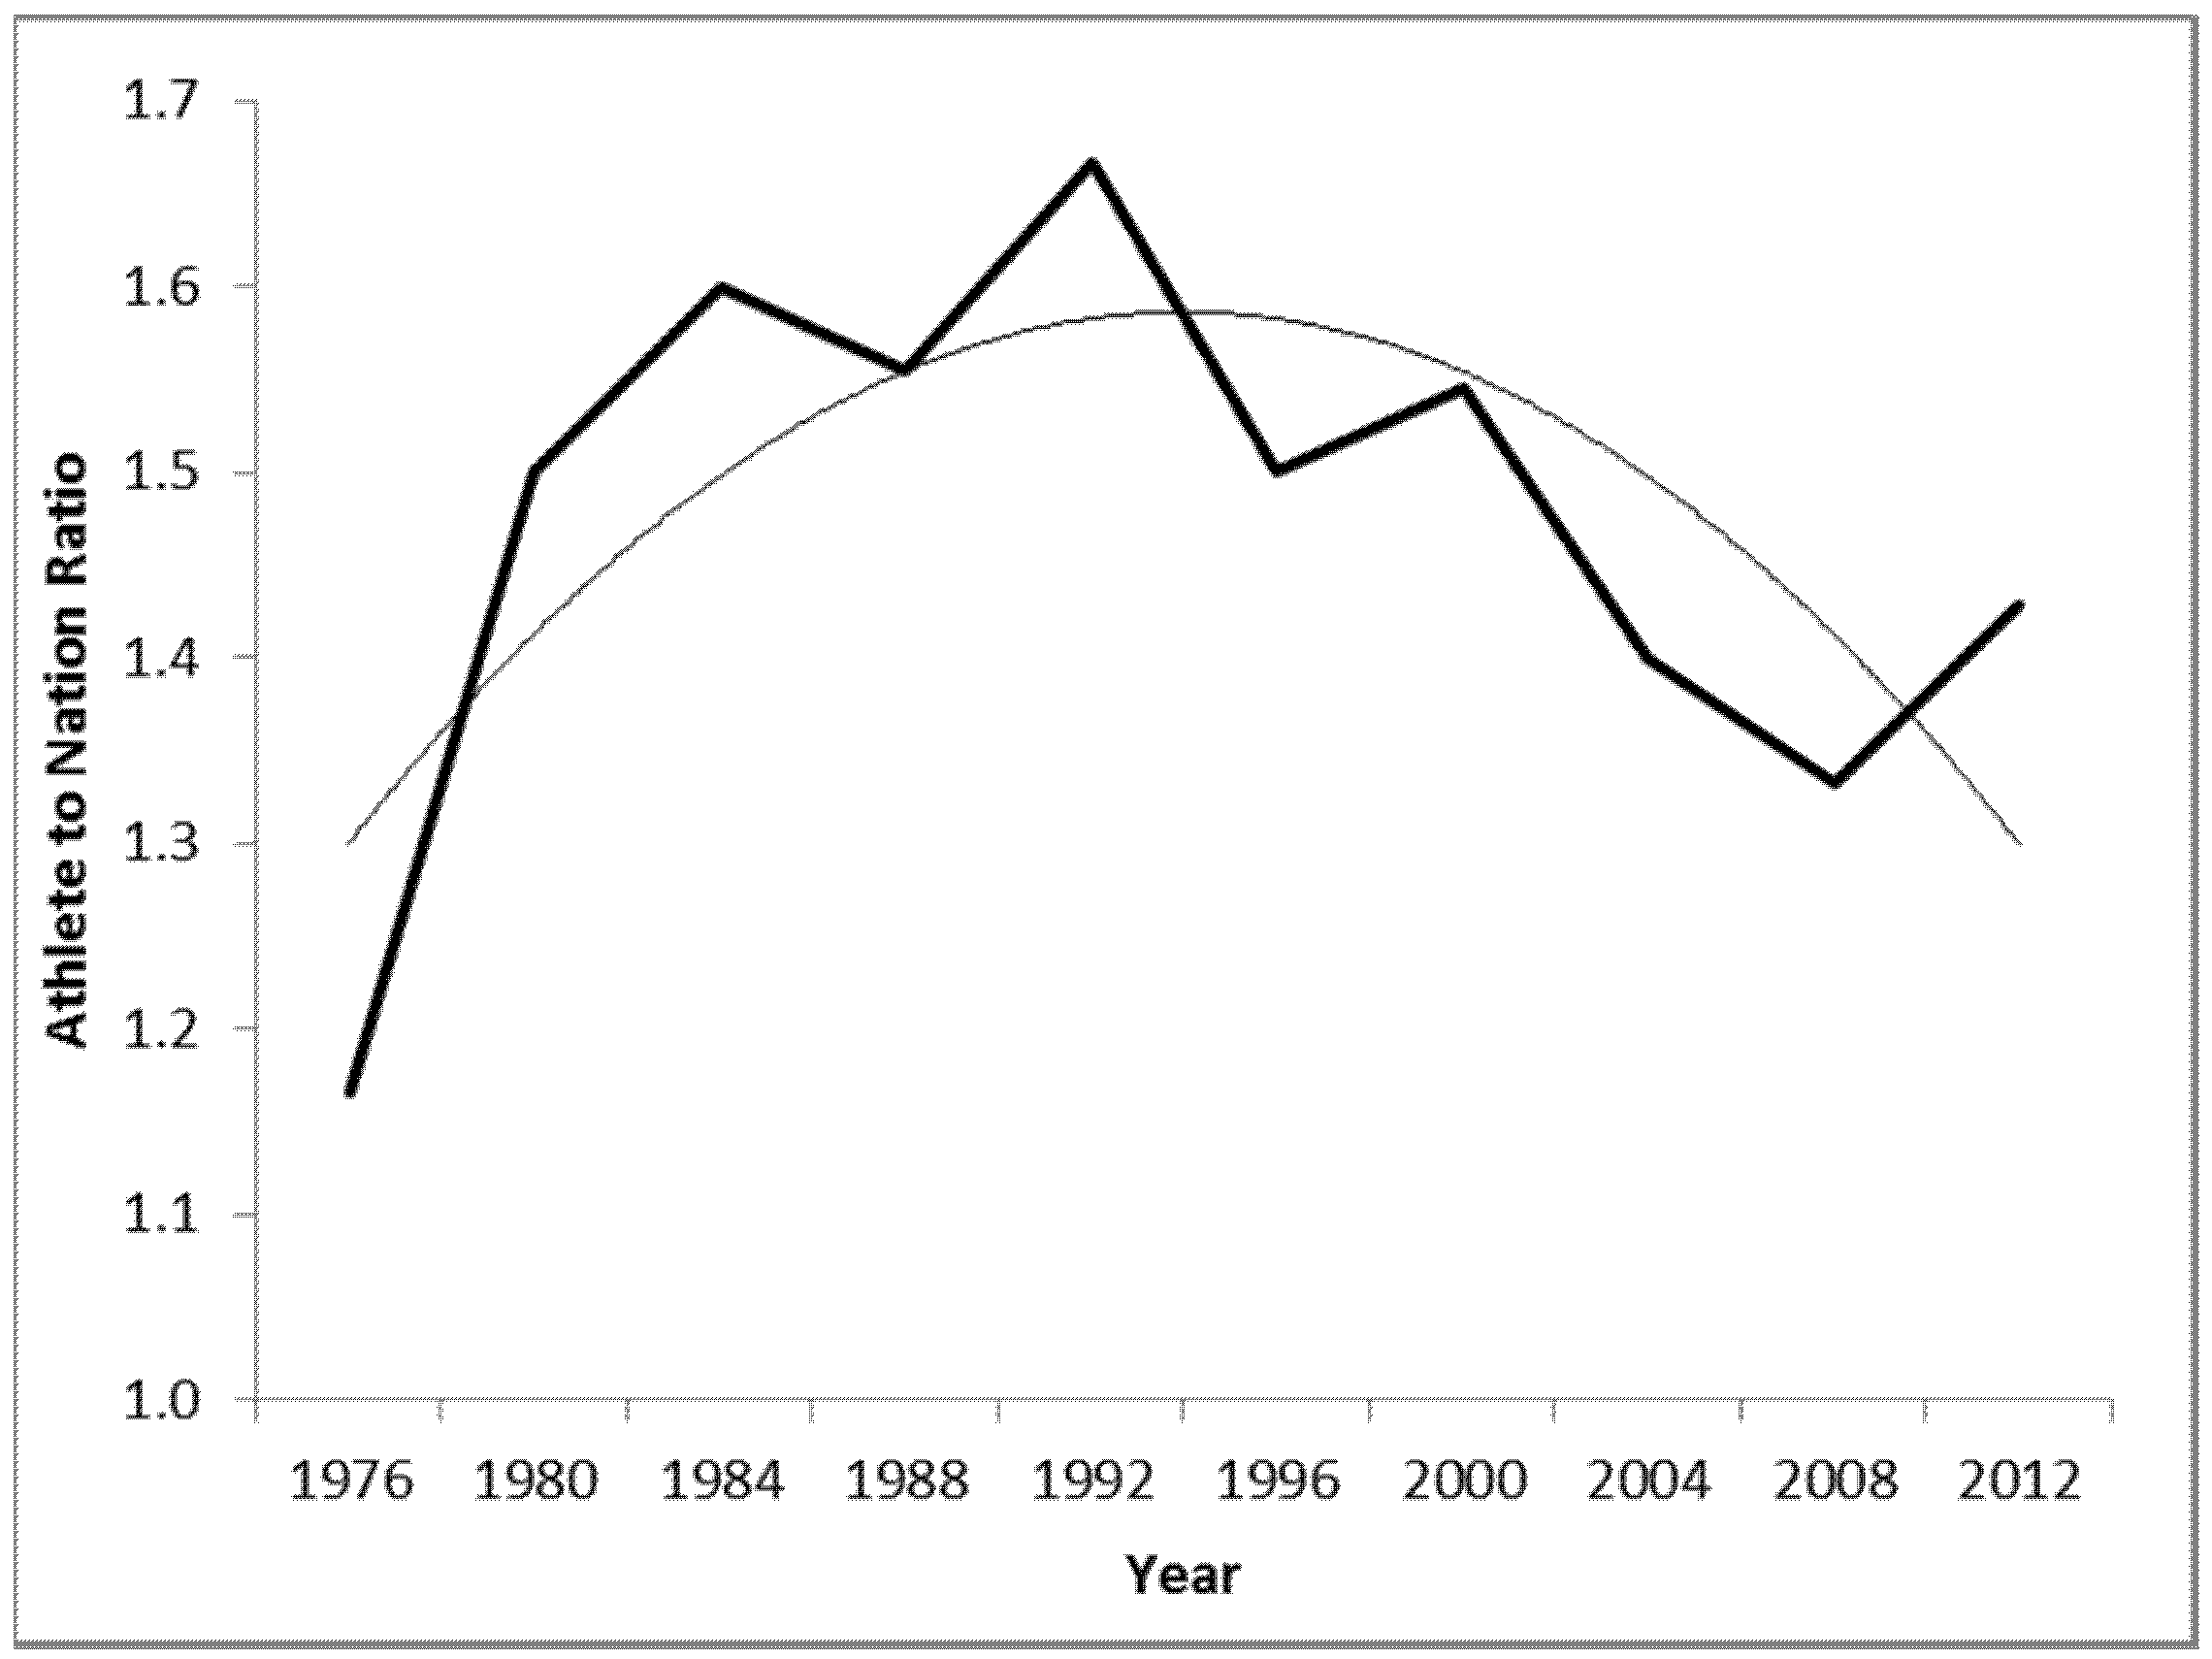
2.2. Event Participation

Athlete participation data was used to track trends to ascertain any level of change over the 36 year time periods. These were drawn from the classifications inception in 1976 up to the 2012 games using those described in the introduction section of this paper. The athletes’ total participation number and country of representation was recorded from the total entry of the event—not just those qualifying for the final.
The data of athlete participation was also derived from the official governing body’s website (http://www.paralympic.org/Athletes/Results).

3. Results

3.1. Performance Improvement

3.1.1. Performance Improvement of AS

The data derived from the timed performance of lower-limb amputee sprinting from Paralympics to subsequent Paralympics over the 1976–2012 timeframe is shown in Table 1.
Table 1. Amputee sprinting (AS) performance improvement 1976–2012.
Paralympic GamesMean podium time (s)Percentage improvement from prior games (%)PII improvement from prior games (%)PII improvement from 1976 baseline (%)
197614.40---
198014.012.766
198413.622.8612
198812.379.22136
199212.191.5340
199611.783.4749
200011.403.2760
200411.122.5568
200811.29−1.5−363
201211.002.6571
Note: PII = performance improvement index.
It is evident in Table 1 that both the “games to games” percentage increase and the PII demonstrates substantial improvement in 1988 with an increase well in excess of other AS “games to games” scores. There is no evidence of a change in PII to the same magnitude as 1988—either prior to it or after this date. Improvements in performance can be demonstrated until 2008 when performance times generally decrease.

3.1.2. Performance Improvement of Able-Bodied IP

The data derived from the timed performance of able-bodied sprinting from their inception at the Olympics over the 1896–1932 timeframe is shown in Table 2.
Table 2. Inception Period (IP) performance improvement 1896–1932.
Olympic GamesMean podium time (s)Percentage improvement from prior games (%)PII improvement from prior games (%)PII improvement from 1896 baseline (%)
189612.27--0
190011.109.52222
190411.13−0.3−121
190810.902.1427
191210.870.3127
192010.800.6129
192410.700.9231
192810.87−1.6−327
193210.424.29939
Note: PII = performance improvement index.
Able bodied sprinting from its Olympic Games inception saw progressively low rates of improvement. However, there was a spike, (equal to that of the AS 1984–1988 Paralympic sprinting improvement) from 1896–1900. The specific reason for this (be it social, technological or other) is not known. It should also be noted that a gap in the data occurred in 1916 since the Olympic Games were cancelled that year due to World War 1.

3.1.3. Performance Improvement of Able-Bodied MP

The data derived from the timed performance of able-bodied sprinting from their inception at the Olympics over the 1976–2012 timeframe is shown in Table 3.
Table 3. Modern Period (MP) performance improvement 1976–2012.
Olympic GamesMean podium time (s)Percentage improvement from prior games (%)PII improvement from prior games (%)PII improvement from 1976 baseline (%)
197610.09--0
198010.31−2.2−4−4
198410.131.73−3
19889.961.743
19929.99−0.3−12
19969.881.124
20009.97−0.9−23
20049.861.125
20089.830.315
20129.721.128
Note: PII = performance improvement index.
The degree of improvement of able-bodied MP PII is very low and significantly lower than those illustrated in Table 1 and Table 2. Any gains are typically around 1% which is less than half of the typical gain that AS see during the same time period.
The general trend progressions of the mean podium of IP, MP and AS are now illustrated for comparative purposes in Figure 1.
Figure 1. Performance improvement index (PII) of evaluated timeframes. IP = able-bodied inception period; MP = able-bodied modern period; AS = amputee sprinting.
Sports 03 00030 g001
Visual inspection of Figure 1 reveals that whilst it can be seen at the start of the evaluated time period that the three traces are wide apart, by the end of a 36-year duration they have narrowed considerably. Whilst the MP group has seen relatively little progression, AS has been subjected to a substantial reduction in the mean podium performances, illustrated with a far steeper gradient in its trace. Both IP and MP are also reducing but this is at a far more conservative rate. The three sub-groups decaying downward traces suggest that they are all likely to improve further in the future but that AS will likely be subjected to the greatest level of improvement.
The “games to games” PII changes of AS and able-bodied MP and IP over their 36 year periods can be compared together as shown in Figure 2.
It should be noted that the gap in IP’s trace in Figure 2 was due to there being no Olympic Games held in 1916. The magnitude of the change in the AS event is shown by the steep peak in 1988 (games no. 3). After this point, the AS rate reduces until games no. 9. The IP timeframe too sees a slight increase at the end of its 36-year period, despite relative stability prior to it. The MP period seems to be in a state of relatively marginal improvement.
Figure 2. PII of timeframes. PII = performance improvement index; IP = able-bodied inception period; MP = able-bodied modern period; AS = amputee sprinting.
Sports 03 00030 g002

3.2. Event Participation

36 different countries sent athletes to the eight Paralympic games held between 1976 and 2012. The total number of eligible race “starts” by athletes was 159 (inclusive of those who did not finish). Figure 3 illustrates the number of nations participating and the total number of athletes competing in the lower-limb amputee 100 m sprint event at each games.
Figure 3. Amputee sprinting historical participation levels.
Sports 03 00030 g003
It can be seen that the number of competing athletes peaked in 1984 with a sharp decline in 1988. There is a gradual second (but smaller) peak at the 1996 games and then a gentle decline until the biggest increase seen since 1984 in 2012. This trend is also reflected by the total number of countries sending athletes to compete in this event. It is unclear what may have caused a positive increase in 2012, having suffered a gradual decline prior to it. It should be noted that (as mentioned in the introduction) the disability classification codes were changed 4 times over this full period. Crucially though, there was no such change in these between 1984 and 1988.
The relationship between the number of athletes and the number of nations taking part from 1976–2012 can be expressed as a ratio. This is illustrated in Figure 4.
Figure 4. Athlete to nation ratio 1976–2012.
Sports 03 00030 g004
The ratio had its higher level from 1984–1992 but has been in decline since then. This demonstrates that the number of athletes a country could have is not increasing—despite the increase in AS illustrated in Figure 1. Secondly, Figure 3 has not indicated an increase in the number of nations competing. As a result, whilst the strength in competition is clear, its depth is not.

4. Discussion

Able-bodied sprinting has generally shown consistent, yet marginal improvements in performance. Amputee sprinting on the other hand has not directly followed the trends of able-bodied sprinting—either with their original inception into the Olympic Games nor over the same timeframe from 1976–2012. Amputee sprinting has seen a greater and faster rate of performance improvement compared to both of the able-bodied time period comparisons.
In addition, a noticeable peak in PII took place from 1984–1988. The specific reason for this peak can only be speculated. It has been demonstrated that of a typical historical performance improvement change, some of this can be attributed to clothing [8] or the social impact of war [10], but the able-bodied athlete’s data over the same evaluated time period do not reflect similar sudden increases in PII that the amputee sprinting group demonstrated. Acknowledging that there were no changes in disability classification at the Paralympics between 1984 and 1988 (which may account for the sudden change in performance or participation), this suggests that there are other causative factors involved which are unique to disability sprinting. It has been proposed that a significant change in prosthetics technology took place from 1988 with the introduction of energy storage and return prostheses [8]. The PII magnitude of this peak (21%) is extremely large compared to any other Paralympic Games to Games increase over the evaluated period. This PII peak value is not as high as other values reported [8] such as javelin technology (95%), pole vault design (86%) or the cycling individual pursuit (35%). However, those examples were all calculated over much greater timeframes of at least 80 years. Considering that the maximum change in able-bodied sprinting would be 24% over a 100 year period [8], the level of progression shown by AS of 21% over just a 4 year period could be regarded as somewhat unusual and supportive of the notion that the technological change occurring in 1988 reported by Nolan [2], has positively contributed to the running ability of a lower-limb amputee. It has been suggested that to break plateaus in sporting performance, greater athletic improvements will be driven by revolutions in sports technology [10]. If this is true (and if a technological change was the sole cause of the large increase in PII), the use and role of prosthetics technology requires clarification by the sports stakeholders.
The general rate of performance improvement progression, whilst remaining positive, has generally decayed over the 36 year history. Such decay is typical in nature of sporting records and has also been recorded in the able-bodied 100 m world record generally [9]. This suggests that the sport will continue to develop for the foreseeable future but that the margins of improvement will become increasingly smaller in magnitude.
The evidence presented here also demonstrates a declining level of participation coupled with increasing levels of performance, even though overall athlete attendance at the Paralympic Games has been stated to continually increase [12]. In addition, the ratio of athlete to nation entering the 100 m at the Paralympic Games is also in decline—even as its performances are. If an increase in participation is desirable to the sport, any perceived barriers need to be identified to improve this. There are caveats to this proposal—it is not known what restrictions any nations might have applied to the number of athletes sent during this allotted time-period. The changes in participation levels could hypothetically be attributed to countries changing their attitude to athlete selection. It would be worthwhile to find out why smaller nations such as Poland, Israel or Myanmar (who sent several athletes prior to 1988) suddenly failed to do so from this point onwards. It is possible that their athletes simply were not replaced when they retired by younger ones of comparable standard but it would be a significant coincidence that several nations had this issue around the same time, who were all previously successful. It is of note that if a change in prosthetics technology took place from 1988 as discussed earlier, whether this impacted on athlete participation. The supply, demand or access to prostheses technology should be investigated to see if that was a contributory factor.

5. Conclusions

Amputee sprinting was evaluated from 1976–2012 and compared to able-bodied sprinting over the same duration and time period to its change in Paralympic Games event to event performance. The rate of improvement is significantly higher in amputee sprinting than an able-bodied equivalent. However, the performance trend of lower-limb amputee sprinting demonstrates a decaying rate of improvement which is typical of other sports. A large increase in amputee sprinting performance improvement was identified in 1988. This evidence supports previously reported anecdotes of a technological change made at this time. Finally, whilst the running performance has steadily improved, the level of participation has not. The nations sending athletes to the Paralympic Games changed significantly before and after 1988 but it is not clear if this is linked to the increase in performance improvement that occurred at the same time.

Acknowledgments

Both Philip Sewell and Siamak Noroozi of Bournemouth University are thanked for their feedback on the original data that contributed to this paper.

Conflicts of Interest

The author declares no conflict of interest.

References

  1. Gold, J.; Gold, M. Access for all: The rise of the Paralympic Games. J. R. Soc. Promot. Health 2007, 127, 133–141. [Google Scholar] [CrossRef] [PubMed]
  2. Nolan, L. Carbon fibre prostheses and running in amputees: A review. Foot Ankle Surg. 2008, 14, 125–129. [Google Scholar] [CrossRef] [PubMed]
  3. Tweedy, S.; Vanlandewijck, Y. International Paralympic Committee position stand—Background and scientific principles of classification in Paralympic Sport. Br. J. Sports Med. 2011, 45, 259–269. [Google Scholar] [CrossRef] [PubMed]
  4. Gutfleisch, O. Peg legs and bionic limbs: The development of lower extremity prosthetics. Interdiscip. Sci. Rev. 2003, 28, 139–148. [Google Scholar] [CrossRef]
  5. Burkett, B. Technology in Paralympic sport: Performance enhancement or essential for performance? Br. J. Sports Med. 2010, 44, 215–220. [Google Scholar] [CrossRef] [PubMed]
  6. Bruggemann, G.; Arampatzis, A.; Emrich, F.; Potthast, W. Biomechanics of double transtibial amputee using dedicated sprinting prostheses. Sports Technol. 2008, 1, 220–227. [Google Scholar] [CrossRef]
  7. Dyer, B.; Noroozi, S.; Sewell, P. Sprinting with an amputation: Some race-based lower-limb step observations. Prosthet. Orthot. Int. 2014. [Google Scholar] [CrossRef]
  8. Haake, S. The impact of technology on sporting performance in Olympic Sports. J. Sports Sci. 2009, 27, 1421–1431. [Google Scholar] [CrossRef] [PubMed]
  9. Foster, L.; James, D.; Haake, S. Understanding the influence of population size on athletic performance. Proced. Eng. 2010, 2, 3183–3189. [Google Scholar] [CrossRef]
  10. Balmer, N.; Pleasence, P.; Nevill, A. Evolution and revolution: Gauging the impact of technological and technical innovation on Olympic performance. J. Sports Sci. 2012, 30, 1075–1083. [Google Scholar] [CrossRef] [PubMed]
  11. Kyle, C. Ergogenics for bicycling. Perspect. Exercise Sci. Sports Med. 1991, 4, 373–413. [Google Scholar]
  12. Legg, D.; Steadward, R. The Paralympic Games and 60 years of change (1948–2008): Unification and restructuring from a disability and medical model to sport-based competition. Sport Soc. 2011, 14, 1099–1115. [Google Scholar] [CrossRef]

