


Understanding External Peak Demands in Elite vs. Non-Elite Male Basketball Players

 ,
,  , , ,
, , , 
Abstract
1. Introduction
2. Methods
2.1. Participants
2.2. Design
2.3. Physical Variables
2.4. Statistical Analysis
3. Results
4. Discussion
5. Conclusions
Author Contributions
Funding
Institutional Review Board Statement
Informed Consent Statement
Data Availability Statement
Conflicts of Interest
References
- Taylor, J.B.; Wright, A.A.; Dischiavi, S.L.; Townsend, M.A.; Marmon, A.R. Activity Demands During Multi-Directional Team Sports: A Systematic Review. Sports Med. 2017, 47, 2533–2551. [Google Scholar] [CrossRef]
- Sosa, C.; Lorenzo, A.; Trapero, J.; Ribas, C.; Alonso, E.; Jimenez, S.L. Specific Absolute Velocity Thresholds during Male Basketball Games Using Local Positional System; Differences between Age Categories. Appl. Sci. 2021, 11, 4390. [Google Scholar] [CrossRef]
- Fox, J.L.; Scanlan, A.T.; Stanton, R. A Review of Player Monitoring Approaches in Basketball: Current Trends and Future Directions. J. Strength Cond. Res. 2017, 31, 2021–2029. [Google Scholar] [CrossRef]
- Alonso Pérez-Chao, E.; Portes, R.; Gómez, M.Á.; Parmar, N.; Lorenzo, A.; Jiménez-Sáiz, S.L. A Narrative Review of the Most Demanding Scenarios in Basketball: Current Trends and Future Directions. J. Hum. Kinet. 2023, 89, 231–245. [Google Scholar] [CrossRef]
- Halson, S.L. Monitoring Training Load to Understand Fatigue in Athletes. Sports Med. 2014, 44, 139. [Google Scholar] [CrossRef]
- Gonçalves, G.; Neta, P.; Ribeiro, J.; Guimaraes, E. Internal and External Loads during Formal Training and Competition, Physical Capacities, and Technical Skills in Youth Basketball: A Comparison between Starters and Rotation Players. J. Hum. Kinet. 2025, 96, 53–67. [Google Scholar] [CrossRef]
- Williams, C.; Rollo, I. Carbohydrate Nutrition and Team Sport Performance. Sports Med. 2015, 45, 13–22. [Google Scholar] [CrossRef]
- Calleja-González, J.; Terrados, N.; Mielgo-Ayuso, J.; Delextrat, A.; Jukic, I.; Vaquera, A.; Torres, L.; Schelling, X.; Stojanovic, M.; Ostojic, S.M. Evidence-Based Post-Exercise Recovery Strategies in Basketball. Physician Sportsmed. 2016, 44, 74–78. [Google Scholar] [CrossRef]
- Ochoa-Lácar, J.; Singh, M.; Bird, S.P.; Charest, J.; Huyghe, T.; Calleja-González, J. How Sleep Affects Recovery and Performance in Basketball: A Systematic Review. Brain Sci. 2022, 12, 1570. [Google Scholar] [CrossRef]
- França, C.; Gomes, B.B.; Gouveia, É.R.; Ihle, A.; Coelho-E-silva, M.J. The Jump Shot Performance in Youth Basketball: A Systematic Review. Int. J. Environ. Res. Public Health 2021, 18, 1–12. [Google Scholar] [CrossRef]
- Esteves, P.T.; Mikolajec, K.; Schelling, X.; Sampaio, J. Basketball Performance Is Affected by the Schedule Congestion: NBA Back-to-Backs under the Microscope. Eur. J. Sport. Sci. 2021, 21, 26–35. [Google Scholar] [CrossRef]
- Cao, S.; Geok, S.K.; Roslan, S.; Sun, H.; Lam, S.K.; Qian, S. Mental Fatigue and Basketball Performance: A Systematic Review. Front. Psychol. 2022, 12, 819081. [Google Scholar] [CrossRef]
- Fox, J.L.; Conte, D.; Stanton, R.; McLean, B.; Scanlan, A.T. The Application of Accelerometer-Derived Moving Averages to Quantify Peak Demands in Basketball: A Comparison of Sample Duration, Playing Role, and Session Type. J. Strength Cond. Res. 2021, 35, S58–S63. [Google Scholar] [CrossRef]
- Alonso, E.; Miranda, N.; Zhang, S.; Sosa, C.; Trapero, J.; Lorenzo, J.; Lorenzo, A. Peak Match Demands in Young Basketball Players: Approach and Applications. Int. J. Environ. Res. Public Health 2020, 17, 2256. [Google Scholar] [CrossRef]
- Cunningham, D.J.; Shearer, D.A.; Carter, N.; Drawer, S.; Pollard, B.; Bennett, M.; Eager, R.; Cook, C.J.; Farrell, J.; Russell, M.; et al. Assessing Worst Case Scenarios in Movement Demands Derived from Global Positioning Systems during International Rugby Union Matches: Rolling Averages versus Fixed Length Epochs. PLoS ONE 2018, 13, e0195197. [Google Scholar] [CrossRef]
- McKay, A.K.A.; Stellingwerff, T.; Smith, E.S.; Martin, D.T.; Mujika, I.; Goosey-Tolfrey, V.L.; Sheppard, J.; Burke, L.M. Defining Training and Performance Caliber: A Participant Classification Framework. Int. J. Sports Physiol. Perform. 2022, 17, 317–331. [Google Scholar] [CrossRef]
- Swann, C.; Moran, A.; Piggott, D. Defining Elite Athletes: Issues in the Study of Expert Performance in Sport Psychology. Psychol. Sport. Exerc. 2015, 16, 3–14. [Google Scholar] [CrossRef]
- Scanlan, A.; Dascombe, B.; Reaburn, P. A Comparison of the Activity Demands of Elite and Sub-Elite Australian Men’s Basketball Competition. J. Sports Sci. 2011, 29, 1153–1160. [Google Scholar] [CrossRef]
- Sirotic, A.C.; Coutts, A.J.; Knowles, H.; Catterick, C. A Comparison of Match Demands between Elite and Semi-Elite Rugby League Competition. J. Sports Sci. 2009, 27, 203–211. [Google Scholar] [CrossRef]
- Conte, D.; Favero, T.G.; Niederhausen, M.; Capranica, L.; Tessitore, A. Determinants of the Effectiveness of Fast Break Actions in Elite and Sub-Elite Italian Men’s Basketball Games. Biol. Sport. 2017, 34, 177–183. [Google Scholar] [CrossRef]
- Trapero, J.; Trapero, J.; Sosa, C.; Zhang, S.; Portes, R.; Gómez-Ruano, M.Á.; Bonal, J.; Jiménez, S.L.; Lorenzo, A. Comparison of the Movement Characteristics Based on Position-Specific Between Semi-Elite and Elite Basketball Players. Rev. de Psicol. Del Deporte 2019, 28, 140–145. [Google Scholar]
- Ujaković, F.; Salazar, H.; Pleša, J.; Svilar, L. Elite Basketball Game External Load Varies Between Different Teams and Competition. Kinesiology 2024, 56, 145–152. [Google Scholar] [CrossRef]
- Gabbett, T.J. The Training-Injury Prevention Paradox: Should Athletes Be Training Smarter and Harder? Br. J. Sports Med. 2016, 50, 273–280. [Google Scholar] [CrossRef] [PubMed]
- Alonso Pérez-Chao, E.; Lorenzo, A.; Scanlan, A.; Lisboa, P.; Sosa, C.; Gómez, M.Á. Higher Playing Times Accumulated Across Entire Games and Prior to Intense Passages Reduce the Peak Demands Reached by Elite, Junior, Male Basketball Players. Am. J. Mens. Health 2021, 15. [Google Scholar] [CrossRef]
- Hodder, R.W.; Ball, K.A.; Serpiello, F.R. Criterion Validity of Catapult ClearSky T6 Local Positioning System for Measuring Inter-Unit Distance. Sensors 2020, 20, 3693. [Google Scholar] [CrossRef]
- Castellano, J.; Casamichana, D.; Calleja-González, J.; Román, J.S.; Ostojic, S.M. Reliability and Accuracy of 10 Hz GPS Devices for Short-Distance Exercise. J. Sports Sci. Med. 2011, 10, 233. [Google Scholar]
- Bredt, S.D.G.T.; Chagas, M.H.; Peixoto, G.H.; Menzel, H.J.; Andrade, A.G.P.D. Understanding Player Load: Meanings and Limitations. J. Hum. Kinet. 2020, 71, 5. [Google Scholar] [CrossRef]
- Barr, D.J.; Levy, R.; Scheepers, C.; Tily, H.J. Random Effects Structure for Confirmatory Hypothesis Testing: Keep It Maximal. J. Mem. Lang. 2013, 68, 255–278. [Google Scholar] [CrossRef]
- Hopkins, W.G.; Marshall, S.W.; Batterham, A.M.; Hanin, J. Progressive Statistics for Studies in Sports Medicine and Exercise Science. Med. Sci. Sports Exerc. 2009, 41, 3–12. [Google Scholar] [CrossRef]
- Broadbent, D.P.; Causer, J.; Williams, A.M.; Ford, P.R. Perceptual-Cognitive Skill Training and Its Transfer to Expert Performance in the Field: Future Research Directions. Eur. J. Sport. Sci. 2015, 15, 322–331. [Google Scholar] [CrossRef]
- Marteniuk, R.G. Cognitive Information Processes in Motor Short-Term Memory and Movement Production. In Motor Control; Elsevier: Amsterdam, The Netherlands, 1976; pp. 175–186. [Google Scholar] [CrossRef]
- Hayes, K.C.; Marteniuk, R.G. Dimensions of Motor Task Complexity. In Motor Control; Elsevier: Amsterdam, The Netherlands, 1976; pp. 201–228. [Google Scholar] [CrossRef]
- Antoranz, Y.; Alonso-Pérez-Chao, E.; Tejero-González, C.M.; Salazar, H.; Del Campo-Vecino, J.; Jiménez-Sáiz, S.L. Exploring External Peak Demands: The Influence of Contextual Factors on Male Basketball Players. Appl. Sci. 2024, 14, 10542. [Google Scholar] [CrossRef]
- Sampaio, J.; McGarry, T.; Calleja-González, J.; Jiménez Sáiz, S.; Schelling I Del Alcázar, X.; Balciunas, M. Exploring Game Performance in the National Basketball Association Using Player Tracking Data. PLoS ONE 2015, 10, e0132894. [Google Scholar] [CrossRef] [PubMed]
- Paul, D.J.; Gabbett, T.J.; Nassis, G.P. Agility in Team Sports: Testing, Training and Factors Affecting Performance. Sports Med. 2016, 46, 421–442. [Google Scholar] [CrossRef] [PubMed]
- Morrison, M.; Martin, D.T.; Talpey, S.; Scanlan, A.T.; Delaney, J.; Halson, S.L.; Weakley, J. A Systematic Review on Fitness Testing in Adult Male Basketball Players: Tests Adopted, Characteristics Reported and Recommendations for Practice. Sports Med. 2022, 52, 1491. [Google Scholar] [CrossRef]
- Scanlan, A.; Humphries, B.; Tucker, P.S.; Dalbo, V. The Influence of Physical and Cognitive Factors on Reactive Agility Performance in Men Basketball Players. J. Sports Sci. 2014, 32, 367–374. [Google Scholar] [CrossRef]
- Kioumourtzoglou, E.; Derri, V.; Tzetzis, G.; Theodorakis, Y. Cognitive, Perceptual, and Motor Abilities in Skilled Basketball Performance. Percept. Mot. Ski. 1998, 86, 771–786. [Google Scholar] [CrossRef]
- Keshvari, F.; Farsi, A.; Abdoli, B. Investigating the EEG Profile of Elite and Non-Elite Players in the Basketball Free Throw Task. J. Mot. Behav. 2024, 56, 91–102. [Google Scholar] [CrossRef]
- Huijgen, B.C.H.; Leemhuis, S.; Kok, N.M.; Verburgh, L.; Oosterlaan, J.; Elferink-Gemser, M.T.; Visscher, C. Cognitive Functions in Elite and Sub-Elite Youth Soccer Players Aged 13 to 17 Years. PLoS ONE 2015, 10, e0144580. [Google Scholar] [CrossRef]
- Toering, T.T.; Elferink-Gemser, M.T.; Jordet, G.; Visscher, C. Self-Regulation and Performance Level of Elite and Non-Elite Youth Soccer Players. J. Sports Sci. 2009, 27, 1509–1517. [Google Scholar] [CrossRef]
- Elferink-Gemser, M.T.; Kannekens, R.; Lyons, J.; Tromp, Y.; Visscher, C. Knowing What to Do and Doing It: Differences in Self-Assessed Tactical Skills of Regional, Sub-Elite, and Elite Youth Field Hockey Players. J. Sports Sci. 2010, 28, 521–528. [Google Scholar] [CrossRef]
- Serpell, B.G.; Young, W.B.; Ford, M. Are the Perceptual and Decision-Making Components of Agility Trainable? A Preliminary Investigation. J. Strength Cond. Res. 2011, 25, 1240–1248. [Google Scholar] [CrossRef]
- Soligard, T.; Schwellnus, M.; Alonso, J.M.; Bahr, R.; Clarsen, B.; Dijkstra, H.P.; Gabbett, T.; Gleeson, M.; Hägglund, M.; Hutchinson, M.R.; et al. How Much Is Too Much? (Part 1) International Olympic Committee Consensus Statement on Load in Sport and Risk of Injury. Br. J. Sports Med. 2016, 50, 1030–1041. [Google Scholar] [CrossRef]

| Descriptive | |||||||||||
|---|---|---|---|---|---|---|---|---|---|---|---|
| 30-s Time Window | 1-min Time Window | 3-min Time Window | |||||||||
| Variable | Group | Mean ± SD | %CV | Variable | Group | Mean ± SD | %CV | Variable | Group | Mean ± SD | %CV |
| Player Load (PL) | Elite | 13.59 ± 1.15 | 9.2% | Player Load (PL) | Elite | 22.38 ± 2.02 | 10.0% | Player Load (PL) | Elite | 43.54 ± 6.41 | 15.7% |
| Non-elite | 19.39 ± 2.95 | 14.9% | Non-elite | 42.71 ± 6.27 | 14.5% | Non-elite | 62.80 ± 9.65 | 15.1% | |||
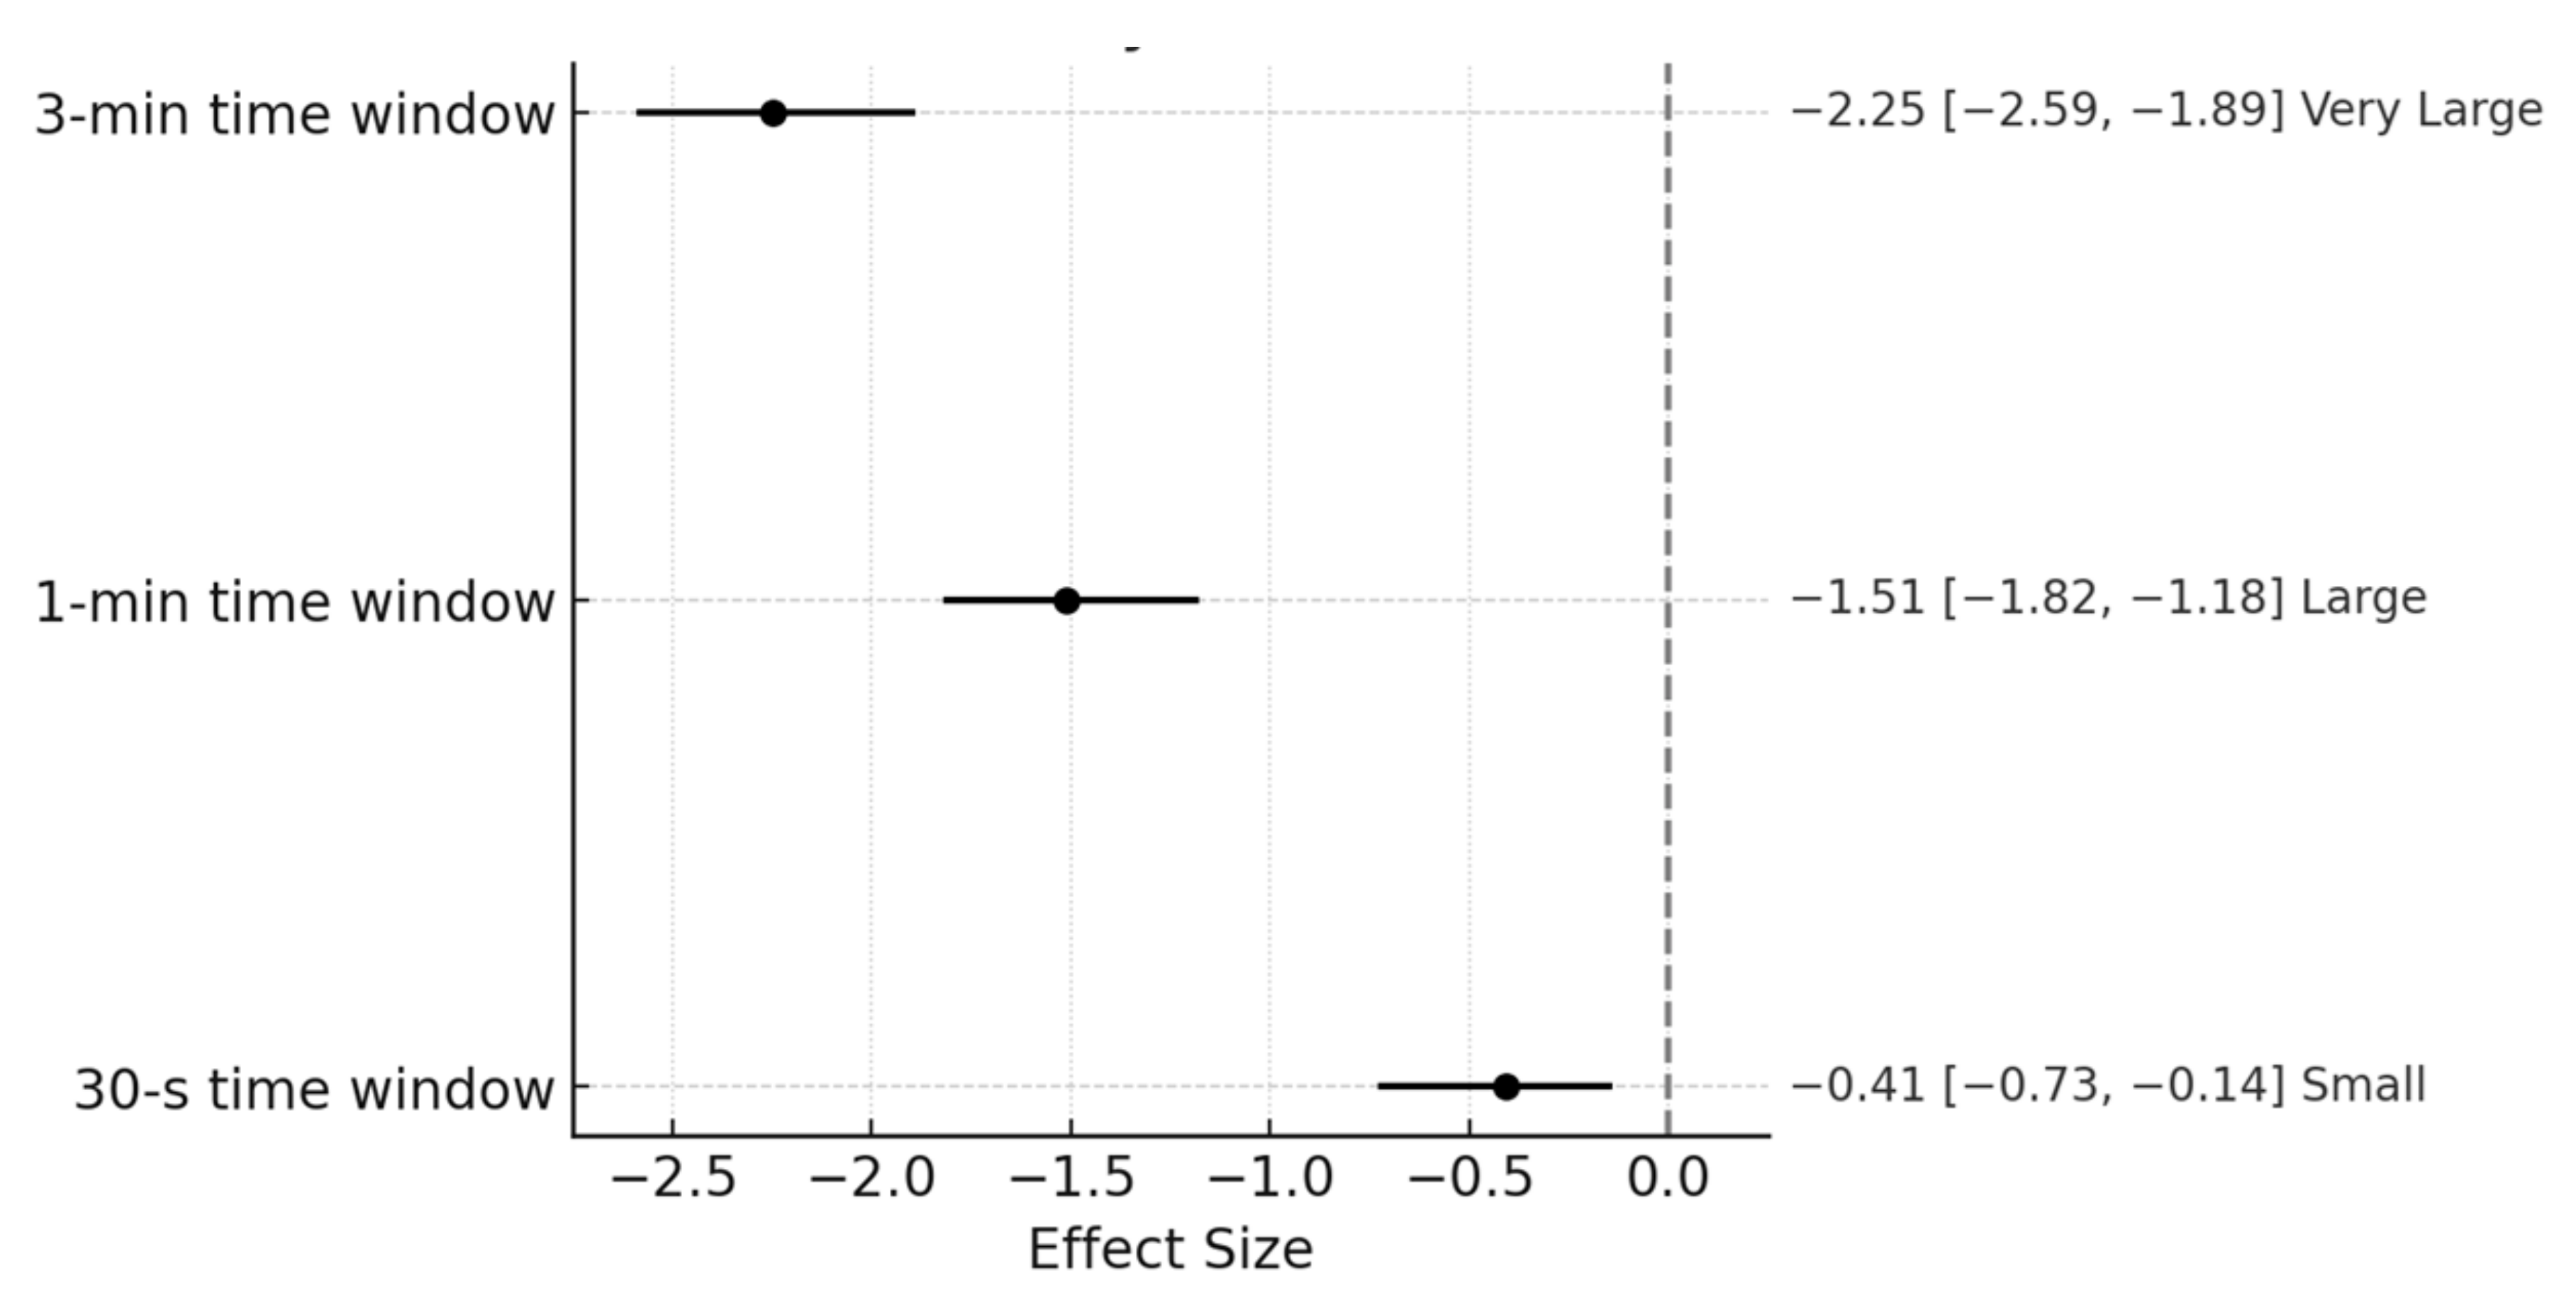
| Mean Differences and Effect Sizes | |||
|---|---|---|---|
| Sample Duration | Effect Size | 95%CI | p |
| 30-s time window, | |||
| elite vs. non-elite | −0.41 | −0.70, −0.12 | <0.001 |
| 1-min time window, | |||
| elite vs. non-elite | −1.47 | −1.78, −1.16 | <0.001 |
| 3-min time window, | |||
| elite vs. non-elite | −2.11 | −2.44, −1.77 | <0.001 |
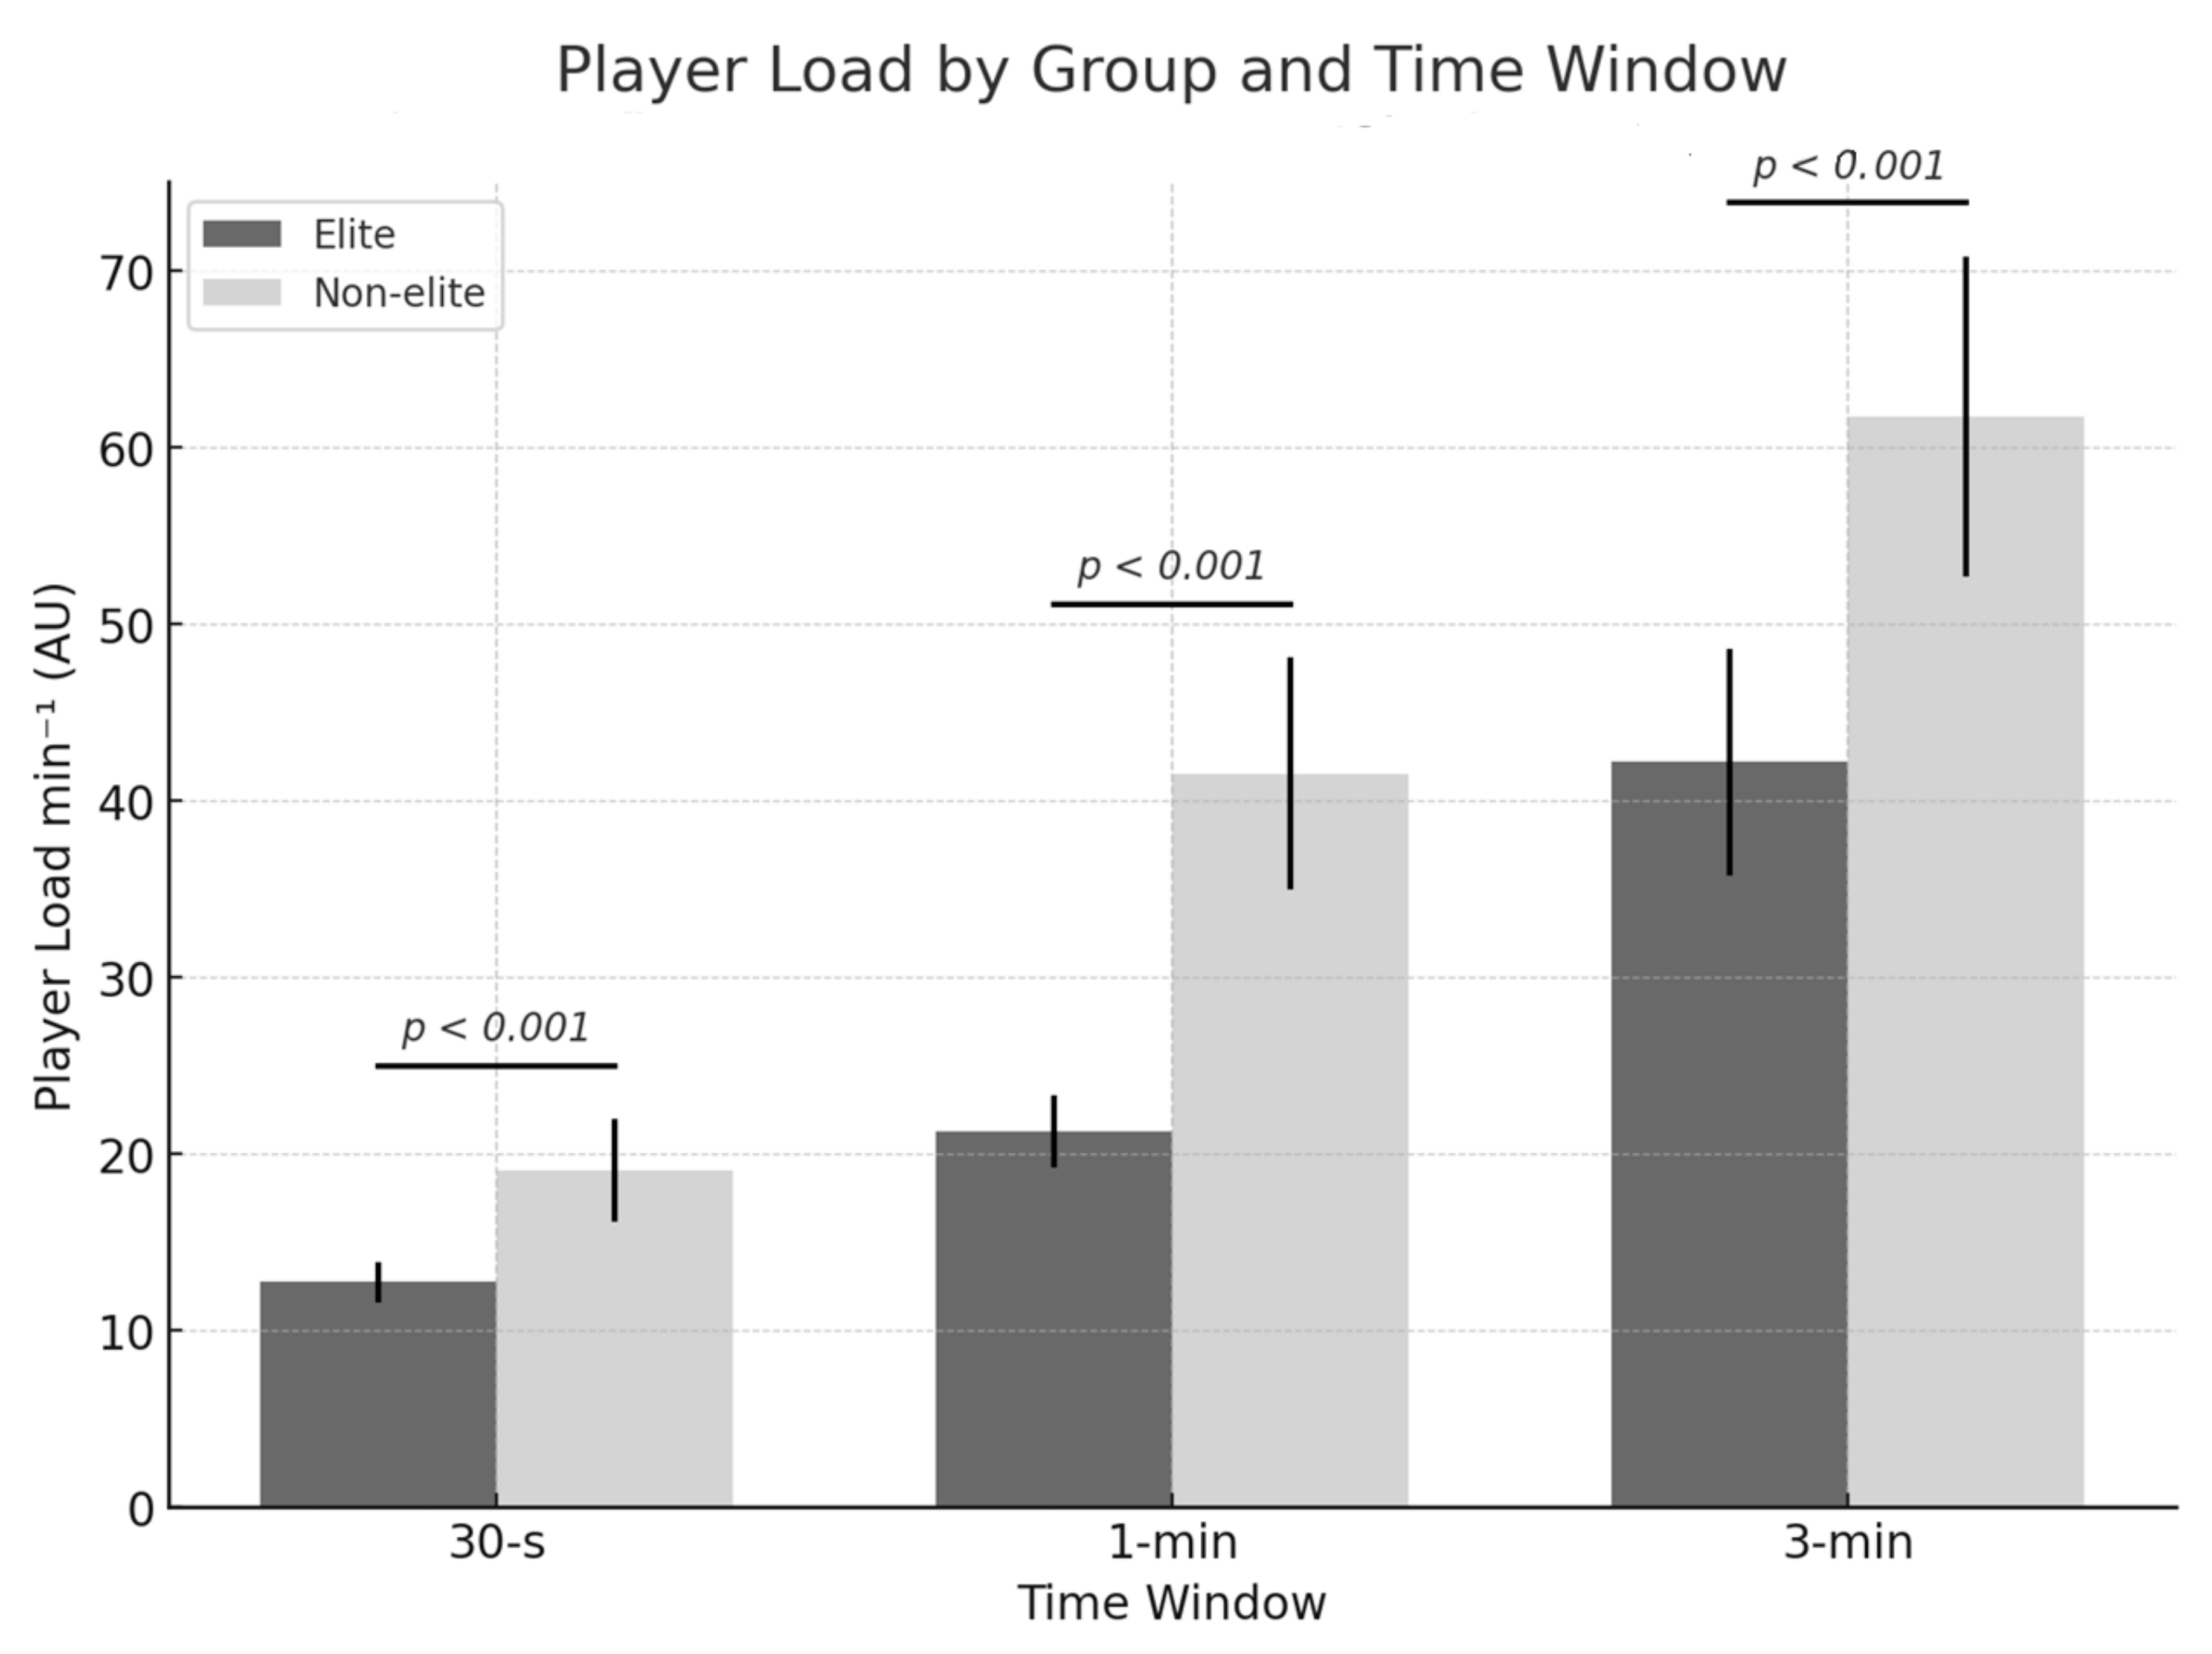
| Descriptive (Non-Official Matches) | |||||||||||
|---|---|---|---|---|---|---|---|---|---|---|---|
| 30-s Time Window | 1-min Time Window | 3-min Time Window | |||||||||
| Variable | Group | Mean ± SD | %CV | Variable | Group | Mean ± SD | %CV | Variable | Group | Mean ± SD | %CV |
| Player Load (PL) | Elite | 12.73 ± 1.15 | 9.2% | Player Load (PL) | Elite | 21.28 ± 2.02 | 10.0% | Player Load (PL) | Elite | 42.18 ± 6.41 | 15.7% |
| Non-elite | 19.05 ± 2.93 | 14.9% | Non-elite | 41.51 ± 6.58 | 15.1% | Non-elite | 61.76 ± 9.06 | 15.1% | |||
| Mean Differences and Effect Sizes (Non-Official Matches) | |||
|---|---|---|---|
| Sample Duration | Effect Size | 95%CI | p |
| 30-s time window, | |||
| elite vs. non-elite | −2.68 | −3.27, −2.03 | <0.001 |
| 1-min time window, | |||
| elite vs. non-elite | −5.06 | −5.91, −4.11 | <0.001 |
| 3-min time window, | |||
| elite vs. non-elite | −3.36 | −4.03, −2.64 | <0.001 |
Disclaimer/Publisher’s Note: The statements, opinions and data contained in all publications are solely those of the individual author(s) and contributor(s) and not of MDPI and/or the editor(s). MDPI and/or the editor(s) disclaim responsibility for any injury to people or property resulting from any ideas, methods, instructions or products referred to in the content. |
© 2025 by the authors. Licensee MDPI, Basel, Switzerland. This article is an open access article distributed under the terms and conditions of the Creative Commons Attribution (CC BY) license (https://creativecommons.org/licenses/by/4.0/).
Share and Cite
Antoranz, Y.; Alonso-Pérez-Chao, E.; Tejero-González, C.M.; Salazar, H.; del Campo-Vecino, J.; Jiménez-Sáiz, S.L. Understanding External Peak Demands in Elite vs. Non-Elite Male Basketball Players. Sports 2025, 13, 179. https://doi.org/10.3390/sports13060179
Antoranz Y, Alonso-Pérez-Chao E, Tejero-González CM, Salazar H, del Campo-Vecino J, Jiménez-Sáiz SL. Understanding External Peak Demands in Elite vs. Non-Elite Male Basketball Players. Sports. 2025; 13(6):179. https://doi.org/10.3390/sports13060179
Chicago/Turabian StyleAntoranz, Yoel, Enrique Alonso-Pérez-Chao, Carlos Mª Tejero-González, Hugo Salazar, Juan del Campo-Vecino, and Sergio L. Jiménez-Sáiz. 2025. "Understanding External Peak Demands in Elite vs. Non-Elite Male Basketball Players" Sports 13, no. 6: 179. https://doi.org/10.3390/sports13060179
APA StyleAntoranz, Y., Alonso-Pérez-Chao, E., Tejero-González, C. M., Salazar, H., del Campo-Vecino, J., & Jiménez-Sáiz, S. L. (2025). Understanding External Peak Demands in Elite vs. Non-Elite Male Basketball Players. Sports, 13(6), 179. https://doi.org/10.3390/sports13060179