
Perceptual and Metabolic Responses During Resistance Training Sessions: Comparing Low-Load Plus Blood Flow Restriction with High-Load Plans

 ,
,  , , ,
, , ,  and
and 
Abstract
1. Introduction
2. Materials and Methods
2.1. Participants
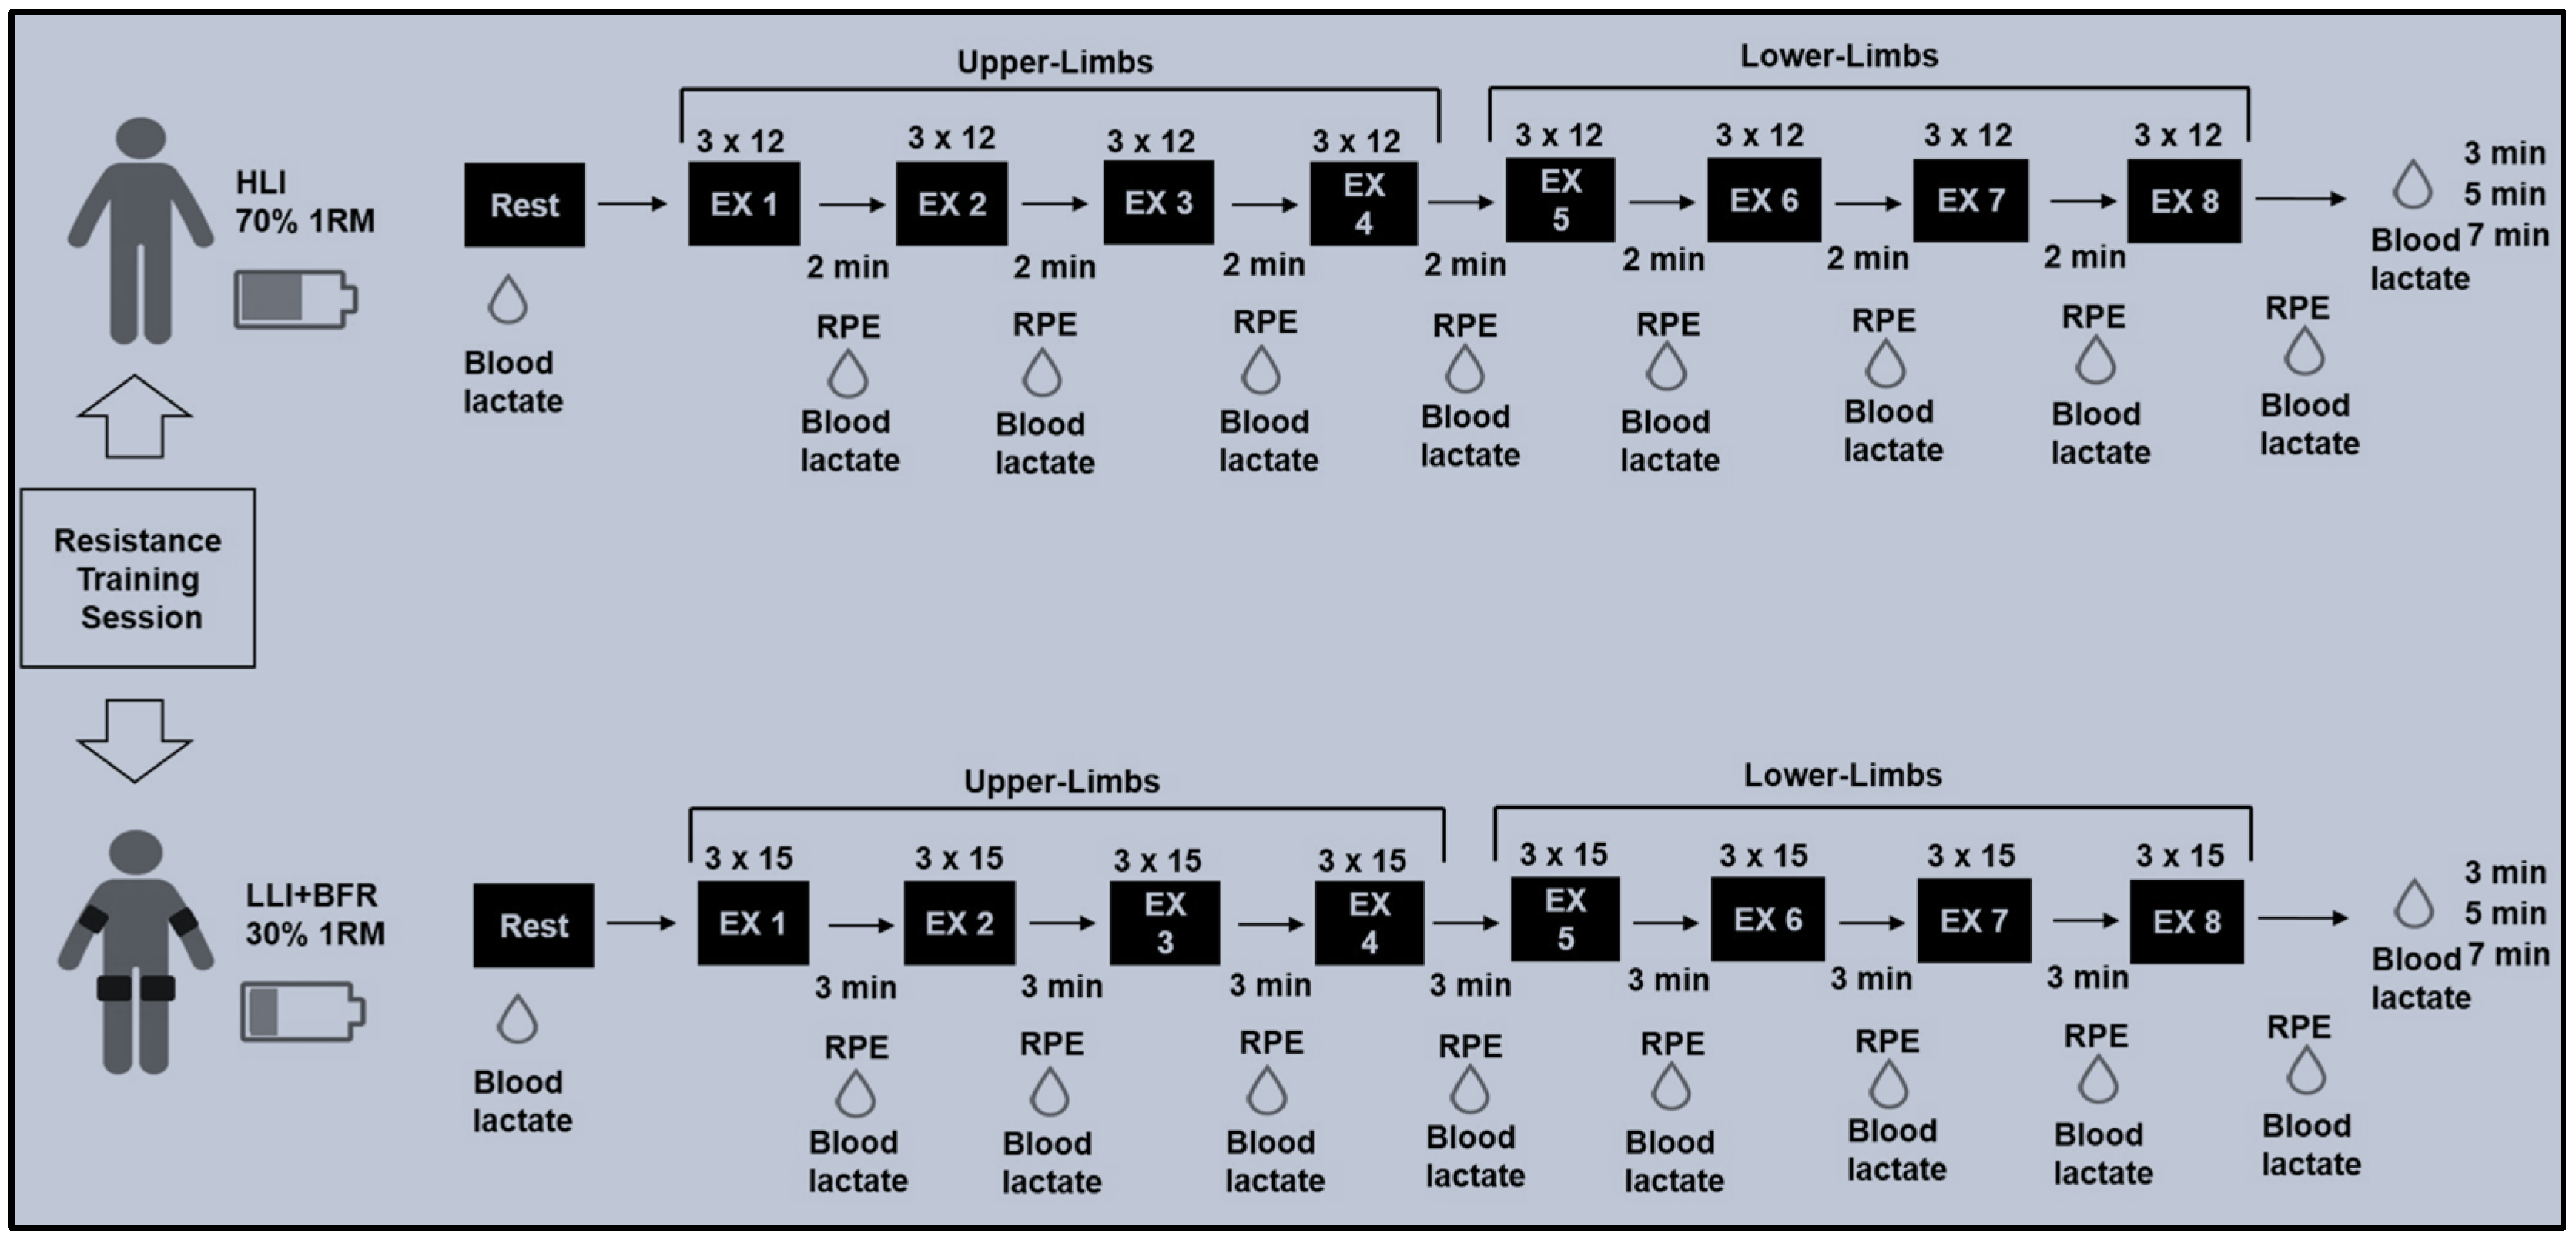
2.2. Strength Measurements and Training Protocols
2.3. Metabolic and Perceptual Measurements
2.4. Statistical Analysis
3. Results
4. Discussion
- (i)
- The lack of a third protocol planned with low-load training without BFR to compare the effect of RPE and [La−] responses with the LLI+BFR, which would probably support the question of whether BFR is the only condition eliciting high blood lactate accumulation when training with low load intensity.
- (ii)
- The trained young adults usually show a high tolerance threshold for pain and discomfort during RE, which suggests that future studies should explore if sex, age, and strength conditioning level differences can affect RPE and [La−] responses similarly.
- (iii)
- The lack of a subgroup of participants experienced with low-load resistance training could mean the unusual (or novelty) exercise condition is not a confounding factor when comparing the RPE with a high-load intensity training or exercise condition.
- (iv)
- The use of SBP instead of AOP to define cuff pressure during training might be a concern since the effects of the BFR can be underestimated with actual pressure. However, the current mean cuff pressure during training (60 ± 2 mmHg) is within the range of the absolute cuff pressures at 40 to 50% of AOP (55 ± 7 mmHg and 61 ± 5 mmHg, respectively) used in the studies of Lixandrão et al. [21] and Moriggi et al. [48]. Moreover, given the theoretical range for OAP (100–210 mmHg) [49], the 50% SBP might probably rely on the zone of cuff pressures (40–80% AOP) in which BFR effects can be considered ideal to optimise BFR effects and reduce risks [50], despite the differences between these two variables regarding values and procedures [51].
- (v)
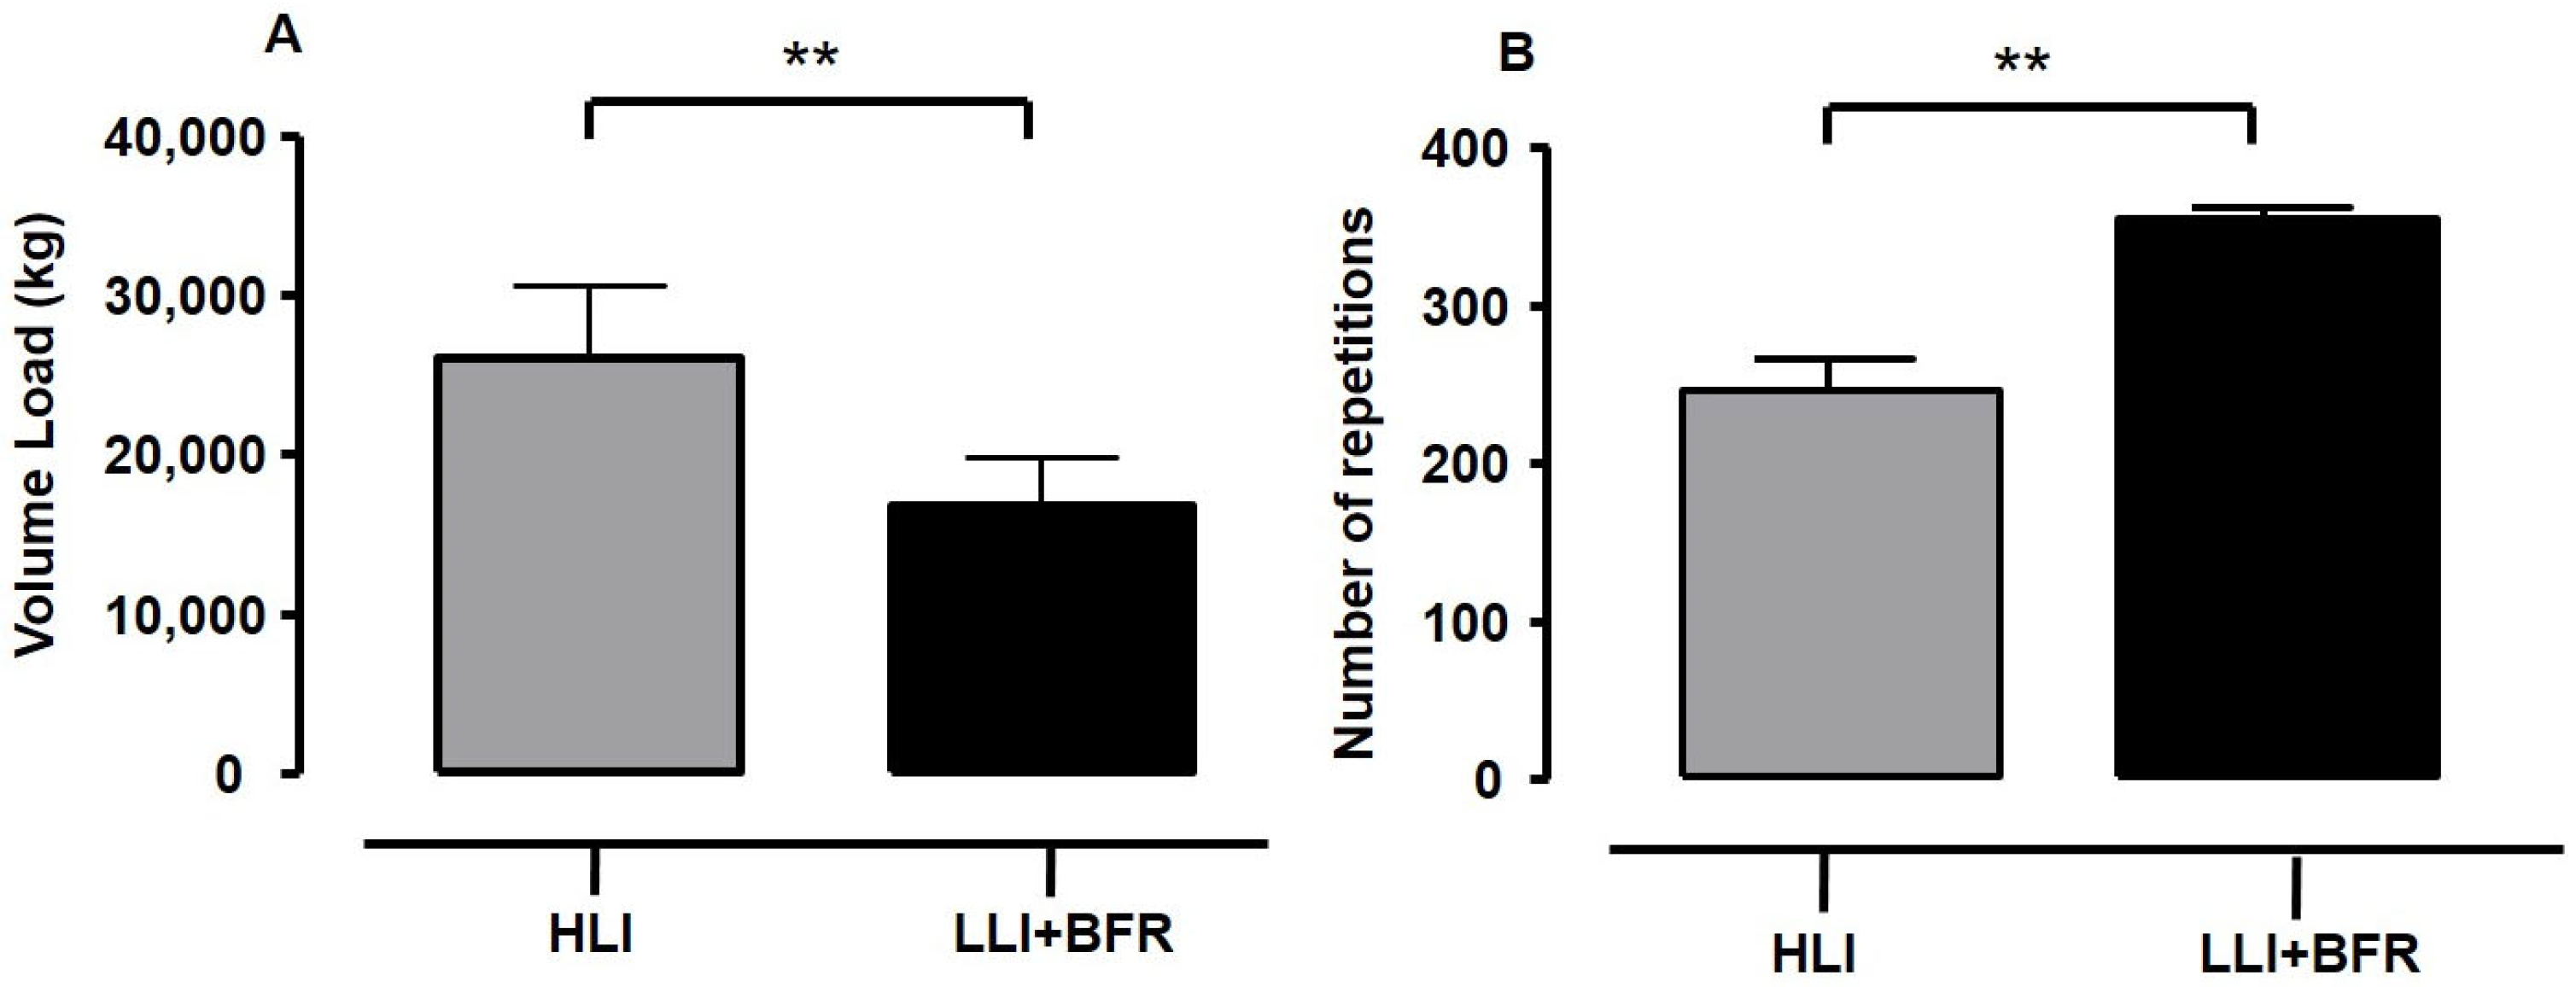
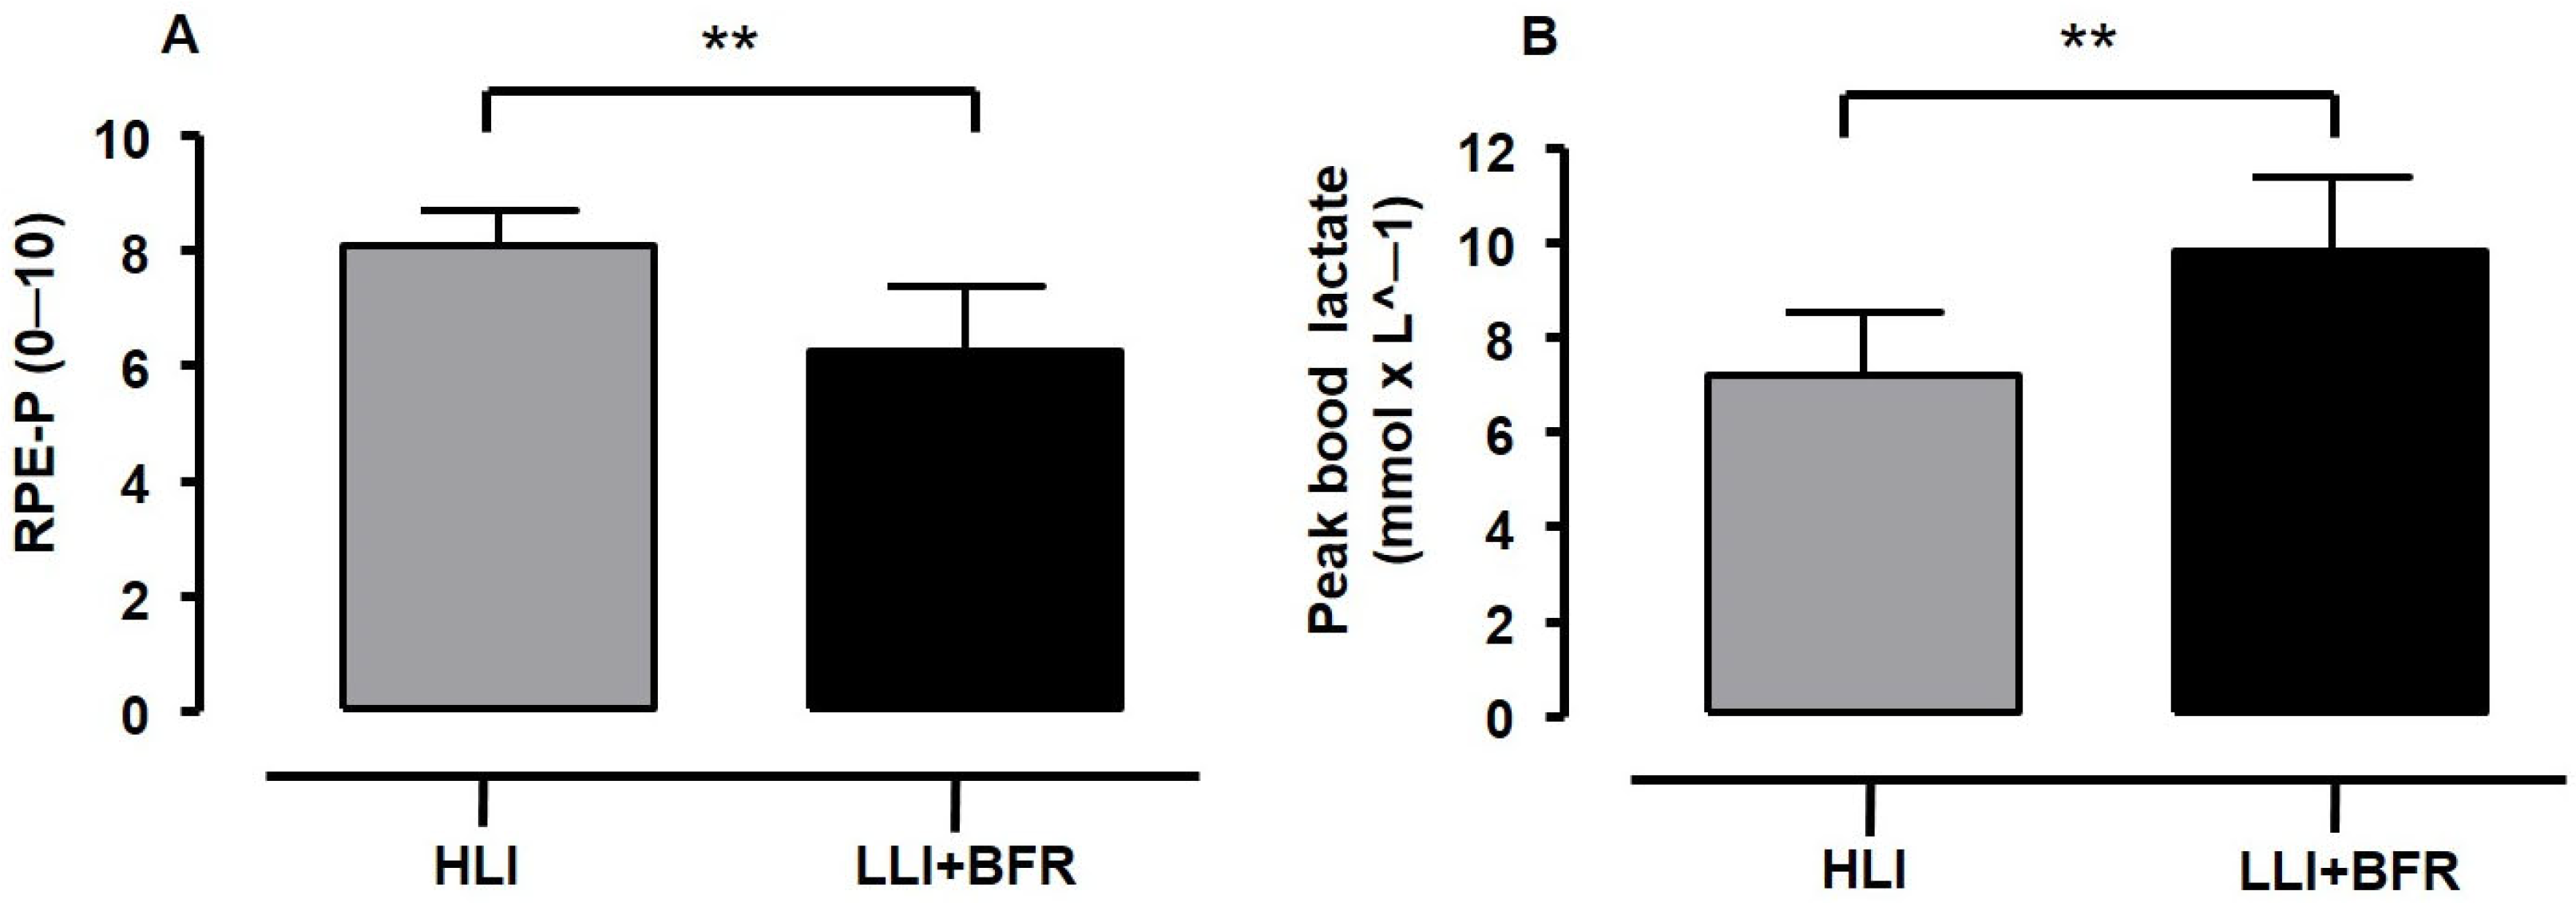
- The volume load difference between protocols is a concern, since the higher volume load may influence the high RPE scores during HLI protocols. Despite the findings of previous studies regarding the influence of volume load on RPE and blood lactate responses being conflicting, the HLI training was perceived as heavier in being performed than LLI+BFR in the current study, with the RPE response inversely associated with metabolic response and the number of repetitions (i.e., a variable of volume).
5. Conclusions
Author Contributions
Funding
Institutional Review Board Statement
Informed Consent Statement
Data Availability Statement
Acknowledgments
Conflicts of Interest
Abbreviations
| BFR | Blood Flow Restriction |
| RT | Resistance Training |
| HLI | High Load Intensity Training or Protocol |
| LLI | Low Load Intensity Training or Protocol |
| LLI+BFR | Low Load Intensity Training or Protocol with Blood Flow Restriction |
| RPE | Rate of Perceived Exertion |
| [La−] | Blood Lactate Accumulation |
| SBP | Systolic Blood Pressure |
| AOP | Arterial Occlusion Pressure |
| 1RM | One repetition to maximum |
References
- Alix-Fages, C.; Del Vecchio, A.; Baz-Valle, E.; Santos-Concejero, J.; Balsabore-Fernandez, C. The role of the neural stimulus in regulating skeletal muscle hypertrophy. Eur. J. Appl. Physiol. 2022, 122, 1111–1128. [Google Scholar] [CrossRef] [PubMed]
- Kraemer, W.J.; Ratamess, N.A. Fundamentals of Resistance Training: Progression and Exercise Prescription. Med. Sci. Sports Exerc. 2004, 36, 674–688. [Google Scholar] [CrossRef]
- Weakley, J.; Schoenfeld, B.J.; Ljungberg, J.; Halson, S.L.; Phillips, S.M. Physiological responses and adaptations to lower load resistance training: Implications for health and performance. Sports Med–Open. 2023, 9, 28. [Google Scholar] [CrossRef]
- Burd, N.A.; West, D.W.D.; Staples, A.W.; Atherton, P.J.; Baker, J.M.; Moore, D.R.; Holwerda, A.M.; Parise, G.; Rennie, M.J.; Baker, S.K.; et al. Low-load high volume resistance exercise stimulates muscle protein synthesis more than high-load low volume resistance exercise in young men. PLoS ONE 2010, 5, e12033. [Google Scholar] [CrossRef]
- Pope, Z.K.; Wilardosn, J.M.; Shoefeld, B.J. Exercise and blood flow restriction. J. Strength. Cond. Res. 2013, 27, 2914–2926. [Google Scholar] [CrossRef] [PubMed]
- Patterson, S.D.; Hughes, L.; Warmington, S.; Burr, J.; Scott, B.R.; Owens, J.; Abe, T.; Nielsen, J.L.; Libardi, C.A.; Laurentino, G.; et al. Blood flow restriction exercise: Considerations of methodology, application, and safety. Front. Physiol. 2019, 15, 10533. [Google Scholar] [CrossRef]
- Jessee, M.B.; Mattocks, K.T.; Buckner, S.L.; Dankel, S.J.; Mouser, J.G.; Abe, T.; Loenneke, J.P. Mechanisms of blood flow restriction: The New Testament. Technol. Orthop. 2018, 33, 72–79. [Google Scholar] [CrossRef]
- Wernbom, M.; Augustsson, J.; Raastad, T. Ischemic strength training: A low-load alternative to heavy resistance exercise? Scand. J. Med. Sci. Sports 2008, 18, 401–416. [Google Scholar] [CrossRef]
- Loenneke, J.P.; Kim, D.; Fahs, C.A.; Thiebaud, R.S.; Abe, T.; Larson, R.D.; Bemben, D.A.; Bemben, M.G. The influence of exercise load with and without different levels of blood flow restriction on acute changes in muscle thickness and lactate. Clin. Physiol. Funct. Imaging 2017, 37, 734–740. [Google Scholar] [CrossRef]
- Loenneke, J.P.; Kim, D.; Fahs, C.A.; Thiebaud, R.S.; Abe, T.; Larson, R.D.; Bemben, D.A.; Bemben, M.G. The effects of resistance exercise with and without different degrees of blood-flow restriction on perceptual responses. J. Sports Sci. 2015, 33, 1472–1479. [Google Scholar] [CrossRef]
- Morishita, S.; Tsubaki, A.; Takabayashi, T.; Fu, J.B. Relationship between of perceived exertion scale the load intensity of resistance training. Strength. Cond. J. 2018, 40, 94–109. [Google Scholar] [CrossRef]
- Suminski, R.R.; Robertson, R.J.; Arslanian, S.; Kang, J.; Utter, A.C.; DaSilva, S.G.; Goss, F.L.; Metz, K.F. Perception of effort during resistance exercise. J. Strength. Cond. Res. 1997, 11, 261–265. [Google Scholar]
- Gearhart, R.F.; Goss, F.L.; Lagally, K.M.; Jakick, J.M.; Gallagher, J.; Gallagher, K.I.; Robertson, R.J. Ratings of perceived exertion in active muscle during high-intensity and low-intensity resistance exercise. J. Strength. Cond. Res. 2002, 16, 87–91. [Google Scholar] [CrossRef] [PubMed]
- Lagally, K.M.; Robertson, R.J.; Gallagher, K.I.; Goss, F.L.; Jakicic, J.M.; Lephart, S.; McCaw, S.T.; Goodpaster, B. Perceived exertion, electromyography, and blood lactate during acute bouts of resistance exercise. Med. Sci. Sports Exerc. 2002, 34, 552–559. [Google Scholar] [CrossRef]
- Poton, R.; Polito, M.D. Hemodynamic response to resistance exercise with and without blood flow restriction in healthy subjects. Clin. Physiol. Funct. Imaging 2016, 36, 231–236. [Google Scholar] [CrossRef] [PubMed]
- Ilett, M.J.; Rantalainen, T.; Keske, M.A.; May, A.K.; Warmington, S.A. The effects of restriction pressures on the acute responses to blood flow restriction exercise. Front. Physiol. 2019, 10, 1018. [Google Scholar] [CrossRef]
- Pierce, K.; Rozenek, R.; Stone, M.H. Effects of high-volume weight training on lactate, heart rate, and perceived exertion. J. Strength Cond. Res. 1993, 7, 211–215. [Google Scholar]
- Suga, T.; Okita, K.; Takarada, S.; Omokawa, M.; Kadoguchi, T.; Yokota, T.; Hirabayashi, K.; Takahashi, M.; Morita, N.; Horiuchi, M.; et al. Effect of multiple sets on intramuscular metabolic stress during low-intensity resistance exercise with blood flow restriction. Eur. J. Appl. Physiol. 2012, 112, 3915–3920. [Google Scholar] [CrossRef]
- Massini, D.A.; Macedo, A.G.; Almeida, T.A.; Espada, M.C.; Santos, F.J.; Castro, E.A.; Fereira, D.C.P.; Neiva, C.M.; Pessôa Filho, D.M. Single-and multi-joint maximum weight lifting relationship to free-fat mass in different exercises for upper-and lower-limbs in well-trained male young adults. Int. J. Environ. Res. Public Health 2022, 19, 4020. [Google Scholar] [CrossRef]
- Ratamess, A.; Alvar, A.B.; Evetoch, T.K.; Housh, T.J.; Kibler, W.B.; Kraemer, W.J.J.; Triplett, N.T. ACSM Position stand: Progression models in resistance training for healthy adults. Med. Sci. Sports Exerc. 2009, 41, 687–708. [Google Scholar] [CrossRef]
- Lixandrão, M.E.; Ugrinowitsch, C.; Laurentino, G.; Libardi, C.A.; Aihara, A.Y.; Cardoso, F.N.; Tricoli, V.; Roschel, H. Effects of exercise intensity and occlusion pressure after 12 weeks of resistance training with blood-flow restriction. Eur. J. Appl. Physiol. 2015, 115, 2471–2480. [Google Scholar] [CrossRef] [PubMed]
- Lui, E.Y.; Steinman, A.H.; Cobbold, R.S.; Johnston, K.W. Human factors as a source of error in peak Doppler velocity measurement. J. Vasc. Surg. 2005, 42, 972–979. [Google Scholar] [CrossRef]
- Walker, A.; Olsson, E.; Wrame, B.; Ringqvist, P.; Ask, P. Accuracy of spectral Doppler flow and tissue velocity measurements in ultrasound systems. Ultrasound Med. Biol. 2004, 30, 127–132. [Google Scholar] [CrossRef]
- Sieljacks, P.; Knudsen, L.; Wernbom, M.; Vissing, K. Body position influences arterial occlusion pressure: Implications for the standardization of pressure during blood flow restricted exercise. Eur. J. Appl. Physiol. 2018, 118, 303–312. [Google Scholar] [CrossRef] [PubMed]
- Rosenthal, J. Qualitative descriptors of strength of association and effect size. J. Social. Serv. Res. 1996, 21, 37–59. [Google Scholar] [CrossRef]
- Yasuda, T.; Abe, T.; Brechue, W.; Iida, H.; Takano, H.; Meguro, K.; Kurano, M.; Fujita, S.; Nakajima, T. Venous blood gas and metabolite response to low-intensity muscle contractions with external limb compression. Metabolism 2010, 59, 1510–1519. [Google Scholar] [CrossRef] [PubMed]
- Day, M.L.; Mcguigan, M.R.; Brice, G.; Foster, C. Monitoring exercise intensity during resistance training using the session RPE scale. J. Strength. Cond. Res. 2004, 18, 353–358. [Google Scholar] [CrossRef]
- Genner, K.M.; Weston, M.A. Comparison of workload quantification methods in relation to physiological responses to resistance exercise. J. Strength. Cond. Res. 2014, 28, 2621–2627. [Google Scholar] [CrossRef]
- Vieira, A.; Gadelha, A.B.; Ferreira-Junior, J.B.; Vieira, C.A.; Soares, E.M.K.; Cadore, E.L.; Wagner, D.R.; Bottaro, M. Session rating of perceived exertion following resistance exercise with blood flow restriction. Clin. Physiol. Funct. Imaging 2015, 35, 323–327. [Google Scholar] [CrossRef]
- Neto, G.R.; Souza, M.S.C.; Silva, G.V.C.; Gil, A.L.S.; Salles, B.F.; Novaes, J.S. Acute resistance exercise with flow restriction effects on heart, double product, oxygen saturation and perceived exertion. Clin. Physiol. Funct. Imaging 2016, 36, 36–39. [Google Scholar] [CrossRef]
- De Quieros, V.S.; Rolnick, N.; Dos Santos, I.K.; França, I.M.; Lima, R.J.; Vieira, J.G.; Aniceto, R.R.; Neto, G.R.; de Medeiros, J.A.; Vianna, J.M.; et al. Acute effect of resistance training with blood flow restriction on perceptual responses: A systematic review and meta-analysis. Sports Health 2023, 15, 673–688. [Google Scholar] [CrossRef] [PubMed]
- Sharma, V.; Cunniffe, B.B.; Verma, A.P.; Cardinale, M.; Yellon, D. Characterization of acute ischemia-related physiological responses associated with remote ischemic preconditioning: A randomized controlled, crossover human study. Physiol. Rep. 2011, 2, e122000. [Google Scholar] [CrossRef] [PubMed]
- Miller, R.M.; Galletti, B.A.; Koziol, K.J.; Freitas, E.D.; Heishman, A.D.; Black, C.D.; Larson, D.J.; Bemben, D.A.; Bemben, M.G. Perceptual responses: Clinical versus practical blood flow restriction resistance exercise. Physiol. Behav. 2020, 227, 113137. [Google Scholar] [CrossRef]
- Manini, T.M.; Yarrow, J.F.; Bufford, T.W.; Clark, B.C.; Conover, C.F.; Borst, S.E. Growth hormone responses to acute resistance exercise with vascular restriction in young and old men. Growth Horm. IGF Res. 2012, 22, 167–172. [Google Scholar] [CrossRef] [PubMed]
- Dankel, S.J.; Jesse, M.B.; Mattocks, K.T.; Buckner, S.L.; Mouser, J.G.; Bell, Z.W. Perceptual and arterial occlusion responses to very low load blood flow restricted exercise performed to volitional failure. Clin. Physiol. Funct. Imaging 2019, 39, 29–34. [Google Scholar] [CrossRef]
- Sligon, S.D.; Lixandrão, M.E.; Biazon, T.; Angleri, V.; Roschel, H.; Libardi, C.A. Lower occlusion pressure during resistance exercise with blood-flow restriction promotes lower pain and perception of exercise compared to higher occlusion pressure when the total training volume is equalized. Physiol. Int. 2018, 105, 276–284. [Google Scholar] [CrossRef]
- Robertson, R.J.; Noble, B.J. Perception of physical exertion: Methods, mediators, and applications. Exerc. Sport. Sci. Rev. 1997, 25, 407–452. [Google Scholar] [CrossRef]
- Kraft, J.A.; Green, J.M.; Gast, T.M. Work distribution influences session ratings of perceived exertion response during resistance exercise matched for total volume. J. Strength Cond. Res. 2014, 28, 2042–2046. [Google Scholar] [CrossRef]
- Buitrago, S.; Wirtz, N.; Yue, Z.; Kleinöder, H.; Mester, J. Effects of load and training modes on physiological and metabolic responses in resistance exercise. Eur. J. Appl. Physiol. 2012, 112, 2739–2748. [Google Scholar] [CrossRef]
- Rogatzki, M.J.; Wright, G.A.; Mikat, R.P.; Brice, A.G. Blood ammonium and lactate accumulation response to different training protocols using the parallel squat exercise. J. Strength Cond. Res. 2014, 28, 1113–1118. [Google Scholar] [CrossRef]
- Balsamo, S.; Tibana, R.A.; Nascimento, D.C.; Franz, C.B.; Lyons, S.; Faigenbaum, A.; Prestes, J. Exercise order influences number of repetitions and lactate levels but not perceived exertion during resistance exercise in adolescents. Res. Sport. Med. 2013, 21, 293–304. [Google Scholar] [CrossRef]
- Barcelos, L.C.; Nunes, P.R.P.; De Souza, L.R.M.F.; Oliveira, A.A.; Furlanetto, R.; Marocolo, M.; Orsatti, F.L. Low-load resistance training promotes muscular adaptation regardless of vascular occlusion, load, or volume. Eur. J. Appl. Physiol. 2015, 115, 1559–1568. [Google Scholar] [CrossRef]
- Clael, S.; Barros, M.; Leite, M.M.; Dutra, M.T.; Landim, G.; Dantas, R.A.E.; Mota, M.R. Effects of blood flow restriction in large and small muscle groups. Braz. J. Sport. Med. 2021, 27, 94–97. [Google Scholar] [CrossRef]
- Lopes, C.R.; Crisp, A.H.; Shoenfeld, B.; Ramos, M.; Germano, M.D.; Verlengia, R.; Mota, G.R.; Marchetti, P.H.; Aoki, M.S. Effect of rest interval length between sets on total load lifted and blood lactate response during total-body resistance exercise session. Asian J. Sport. Med. 2017, 9, e57500. [Google Scholar] [CrossRef]
- João, G.A.; Almeida, G.P.L.; Tavares, L.D.; Kalva-Filho, C.A.; Junior, N.C.; Pontes, F.L.; Baker, J.S.; Bocalini, D.S.; Figueira, A.J. Acute behavior of oxygen consumption, lactate concentrations, and energy expenditure during resistance training: Comparisons among three intensities. Front. Sports Act. Living 2021, 3, 797604. [Google Scholar] [CrossRef]
- Takarada, Y.; Takazawa, H.; Sato, Y.; Takebayashi, S.; Tanaka, Y.; Ishii, N. Effects of resistance exercise combined with moderate vascular occlusion on muscular function in humans. J. Appl. Physiol. 2000, 88, 2097–2106. [Google Scholar] [CrossRef] [PubMed]
- McCarthy, S.F.; Bornath, D.P.; Murtaza, M.; Ormond, S.C.; Hazell, T.J. Effect of resistance training load on metabolism during Exercise. J. Strength Cond. Res. 2024, 38, 2029–2033. [Google Scholar] [CrossRef]
- Moriggi, R.J.; Di Mauro, H.S.; Dias, S.C.; Matos, J.M.; Urtado, M.B.; Camarço, N.F.; Neto, I.S.; Nascimento, D.C.; Tibana, R.A.; Assumpção, C.O.; et al. Similar hypotensive responses to resistance exercise with and without blood flow restriction. Biol. Sport. 2015, 32, 289–294. [Google Scholar] [CrossRef]
- Loenneke, J.P.; Thiebaud, R.S.; Abe, T.; Bemben, M.G. Blood flow restriction pressure recommendations: The hormesis hypothesis. Med. Hypotheses 2014, 82, 623–626. [Google Scholar] [CrossRef]
- Lorenz, D.S.; Bailey, L.; Wilk, K.E.; Mangine, R.E.; Head, P.; Grindstaff, T.L.; Morrison, S. Blood flow restriction training. J. Athl. Train. 2021, 56, 937–944. [Google Scholar] [CrossRef]
- Ingram, J.W.; Dankel, S.J.; Buckner, S.L.; Counts, B.R.; Mouser, J.G.; Abe, T.; Laurentino, G.C.; Loenneke, J.P. The influence of time on determining blood flow restriction pressure. J. Sci. Med. Sport. 2017, 20, 777–780. [Google Scholar] [CrossRef] [PubMed]

| Variables of Planning | Protocols | |
|---|---|---|
| HLI | LLI+BFR | |
| Load | 70% 1RM | 30% 1RM |
| Sets | 3 | 3 |
| Repetitions | 12 | 15 |
| Rest (between sets in seconds) | 60 | 30 |
| Rest (between exercises in seconds) | 120 | 180 |
| RPE (0–10 Scale) | [La−] (mmol × L−1) | ||||
|---|---|---|---|---|---|
| HLI | LLI+BFR | HLI | LLI+BFR | ||
| Rest | - | - | 1.5 ± 0.2 a,b,c,d,e,f,g,h | 1.4 ± 0.3 a,b,c,d,e,f,g,h | |
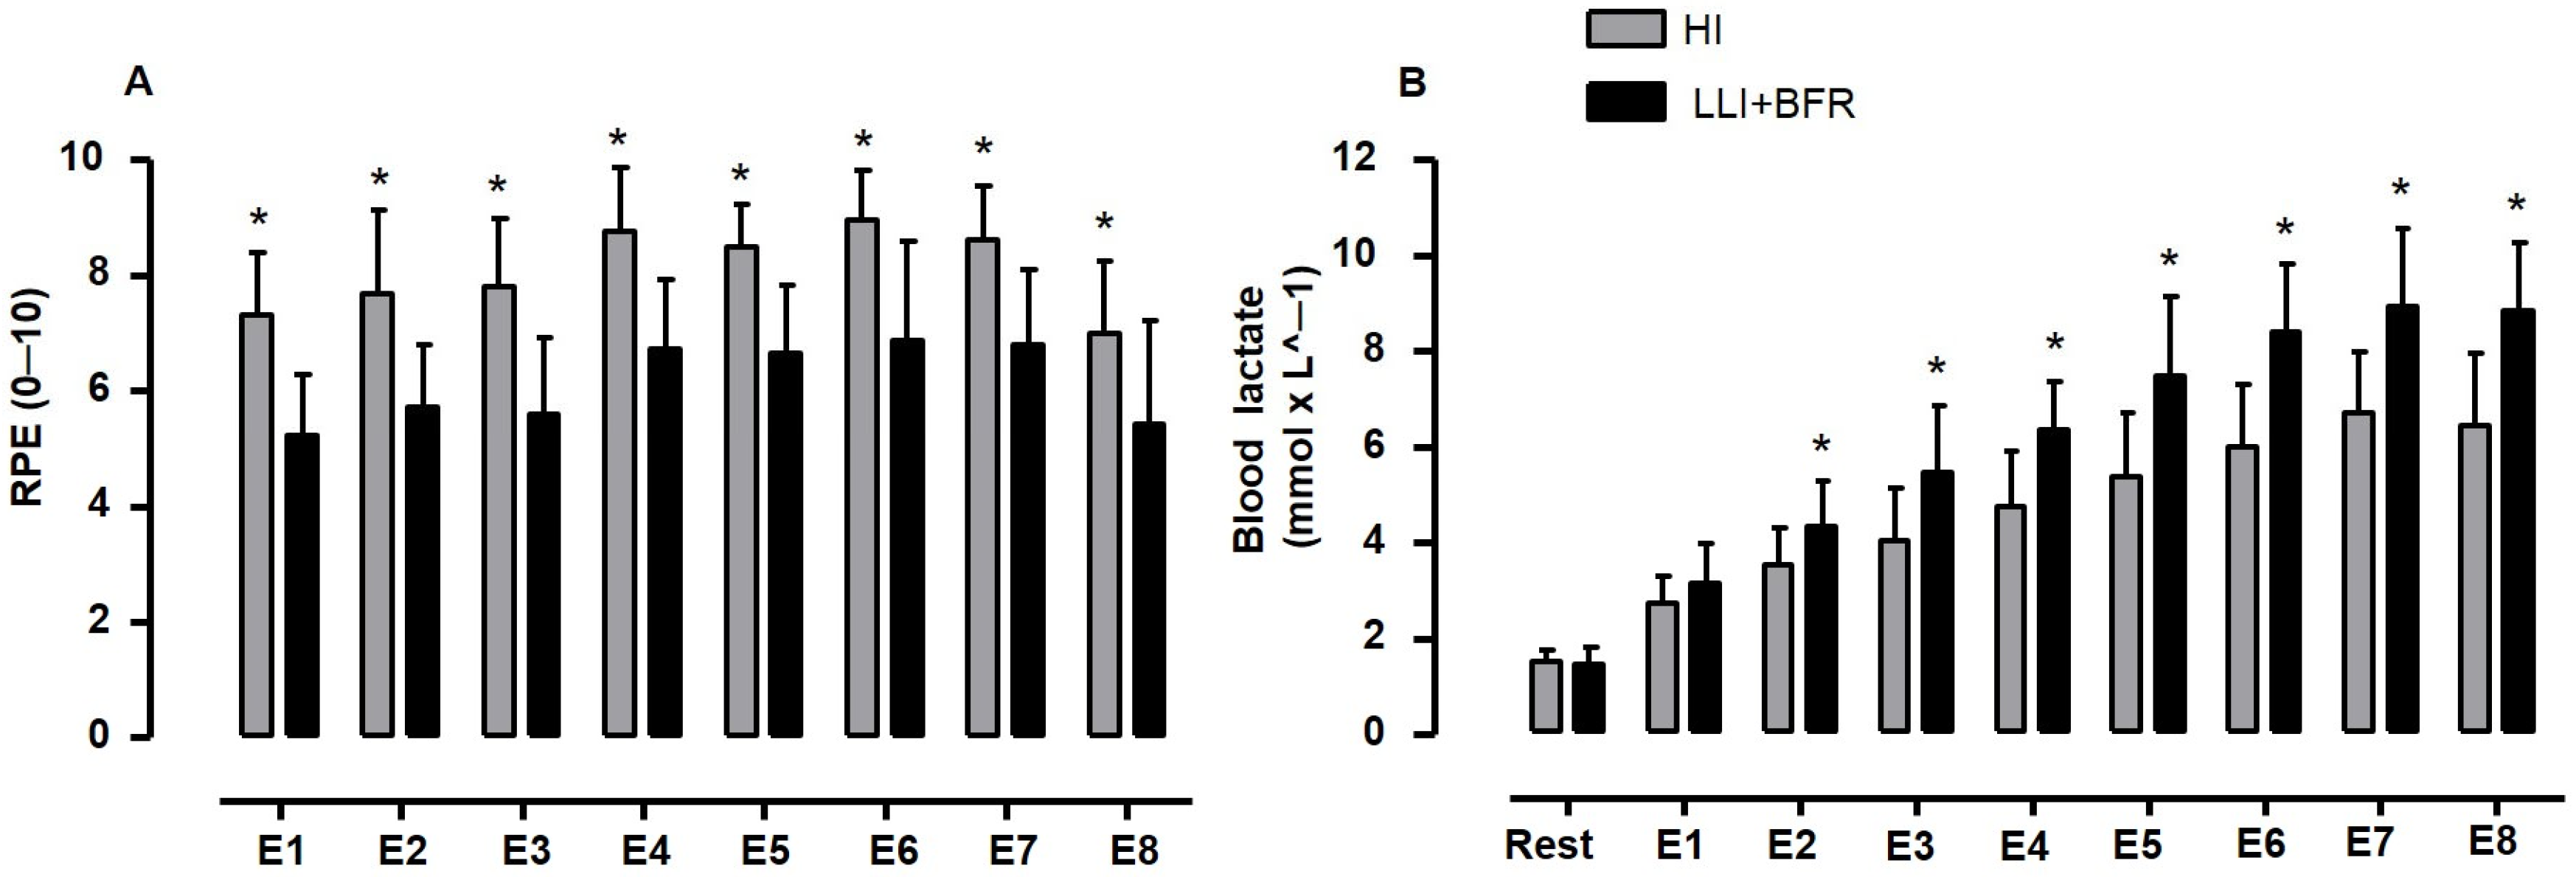
| Upper-limbs | E1 | 7.3 ± 1.1 d,e,f,g | 5.3 ± 1.1 d,e,f,g | 2.7 ± 0.6 b,c,d,e,f,g,h | 3.1 ± 0.8 b,c,d,e,f,g,h |
| E2 | 7.7 ± 1.4 | 5.8 ± 1.2 | 3.5 ± 0.8 d,e,f,g,h | 4.3 ± 1.0 c,d,e,f,g,h | |
| E3 | 7.8 ± 1.2 | 5.6 ± 1.5 d,e,f | 4.0 ± 1.1 d,e,f,g,h | 5.5 ± 1.4 d,e,f,g,h | |
| E4 | 8.8 ± 1.1 h | 6.7 ± 1.4 | 4.7 ± 1.2 g,h | 6.3 ± 1.0 e,f,g,h | |
| Lower-limbs | E5 | 8.5 ± 0.7 h | 6.6 ± 1.2 | 5.4 ± 1.3 g,h | 7.5 ± 1.7 f,g,h |
| E6 | 8.9 ± 0.9 h | 6.9 ± 1.8 h | 6.0 ± 1.2 | 8.4 ± 1.4 | |
| E7 | 8.6 ± 0.9 h | 6.9 ± 1.3 h | 6.7 ± 1.3 | 8.9 ± 1.6 | |
| E8 | 7.0 ± 1.3 | 5.4 ± 1.8 | 6.4 ± 1.5 | 8.8 ± 1.4 | |
Disclaimer/Publisher’s Note: The statements, opinions and data contained in all publications are solely those of the individual author(s) and contributor(s) and not of MDPI and/or the editor(s). MDPI and/or the editor(s) disclaim responsibility for any injury to people or property resulting from any ideas, methods, instructions or products referred to in the content. |
© 2025 by the authors. Licensee MDPI, Basel, Switzerland. This article is an open access article distributed under the terms and conditions of the Creative Commons Attribution (CC BY) license (https://creativecommons.org/licenses/by/4.0/).
Share and Cite
Macedo, A.G.; Massini, D.A.; Almeida, T.A.F.; Santos, A.T.S.; Galdino, G.; de Oliveira, D.M.; Pessôa Filho, D.M. Perceptual and Metabolic Responses During Resistance Training Sessions: Comparing Low-Load Plus Blood Flow Restriction with High-Load Plans. Sports 2025, 13, 148. https://doi.org/10.3390/sports13050148
Macedo AG, Massini DA, Almeida TAF, Santos ATS, Galdino G, de Oliveira DM, Pessôa Filho DM. Perceptual and Metabolic Responses During Resistance Training Sessions: Comparing Low-Load Plus Blood Flow Restriction with High-Load Plans. Sports. 2025; 13(5):148. https://doi.org/10.3390/sports13050148
Chicago/Turabian StyleMacedo, Anderson Geremias, Danilo Alexandre Massini, Tiago André Freire Almeida, Adriana Teresa Silva Santos, Giovane Galdino, David Michel de Oliveira, and Dalton Muller Pessôa Filho. 2025. "Perceptual and Metabolic Responses During Resistance Training Sessions: Comparing Low-Load Plus Blood Flow Restriction with High-Load Plans" Sports 13, no. 5: 148. https://doi.org/10.3390/sports13050148
APA StyleMacedo, A. G., Massini, D. A., Almeida, T. A. F., Santos, A. T. S., Galdino, G., de Oliveira, D. M., & Pessôa Filho, D. M. (2025). Perceptual and Metabolic Responses During Resistance Training Sessions: Comparing Low-Load Plus Blood Flow Restriction with High-Load Plans. Sports, 13(5), 148. https://doi.org/10.3390/sports13050148