
How Does Load Selection and Sex Influence 1RM Prediction Using the Minimal Velocity Threshold During Free-Weight Back Squat?
 , , and
Abstract
1. Introduction
- (1)
- Comparing the use of two or three loads.
- (2)
- Comparing differences between males and females.
- (3)
- Evaluating the use of “Optimal MVT” of 0.40 m·s−1 in females.
2. Materials and Methods
2.1. Subjects
2.2. 1RM TEST
2.3. Sample Size Estimation and Justification
2.4. Statistical Analysis
3. Results
4. Discussion
4.1. Importance of Sex-Specific Minimum Velocity Threshold
4.2. Importance of Load Selection for 1RM Prediction
5. Conclusions
6. Practical Application
7. Limitation
Author Contributions
Funding
Institutional Review Board Statement
Informed Consent Statement
Data Availability Statement
Conflicts of Interest
Abbreviations
| RT | Resistance Training |
| 1RM | One-Repetition Maximum |
| MVT | Minimum Velocity Threshold |
| MPV | Mean Propulsive Velocity |
| SEE | Standard Error of Estimate |
| CV | Coefficient of Variation |
References
- Zhang, X.; Feng, S.; Peng, R.; Li, H. The Role of Velocity-Based Training (VBT) in Enhancing Athletic Performance in Trained Individuals: A Meta-Analysis of Controlled Trials. Int. J. Environ. Res. Public Health 2022, 19, 9252. [Google Scholar] [CrossRef] [PubMed]
- Naclerio, F.; Faigenbaum, A.D.; Larumbe-Zabala, E.; Perez-Bibao, T.; Kang, J.; Ratamess, N.A.; Triplett, N.T. Effects of Different Resistance Training Volumes on Strength and Power in Team Sport Athletes. J. Strength Cond. Res. 2013, 27, 1832–1840. [Google Scholar] [CrossRef]
- Yamamoto, L.M.; Lopez, R.M.; Klau, J.F.; Casa, D.J.; Kraemer, W.J.; Maresh, C.M. The Effects of Resistance Training on Endurance Distance Running Performance Among Highly Trained Runners: A Systematic Review. J. Strength Cond. Res. 2008, 22, 2036–2044. [Google Scholar] [CrossRef]
- Myers, A.M.; Beam, N.W.; Fakhoury, J.D. Resistance Training for Children and Adolescents. Transl. Pediatr. 2017, 6, 137–143. [Google Scholar] [CrossRef]
- Hass, C.J.; Feigenbaum, M.S.; Franklin, B.A. Prescription of Resistance Training for Healthy Populations. Sports Med. 2001, 31, 953–964. [Google Scholar] [CrossRef]
- Lopez, P.; Pinto, R.S.; Radaelli, R.; Rech, A.; Grazioli, R.; Izquierdo, M.; Cadore, E.L. Benefits of Resistance Training in Physically Frail Elderly: A Systematic Review. Aging Clin. Exp. Res. 2018, 30, 889–899. [Google Scholar] [CrossRef]
- Kraemer, W.J.; Ratamess, N.A. Fundamentals of Resistance Training: Progression and Exercise Prescription. Med. Sci. Sports Exerc. 2004, 36, 674–688. [Google Scholar] [CrossRef]
- Banyard, H.G.; Tufano, J.J.; Delgado, J.; Thompson, S.W.; Nosaka, K. Comparison of the Effects of Velocity-Based Training Methods and Traditional 1RM-Percent-Based Training Prescription on Acute Kinetic and Kinematic Variables. Int. J. Sports Physiol. Perform. 2019, 14, 246–255. [Google Scholar] [CrossRef]
- Conceição, F.; Fernandes, J.; Lewis, M.; Gonzaléz-Badillo, J.J.; Jimenéz-Reyes, P. Movement Velocity as a Measure of Exercise Intensity in Three Lower Limb Exercises. J. Sports Sci. 2016, 34, 1099–1106. [Google Scholar] [CrossRef]
- LeMense, A.T.; Malone, G.T.; Kinderman, M.A.; Fedewa, M.V.; Winchester, L.J. Validity of Using the Load-Velocity Relationship to Estimate 1 Repetition Maximum in the Back Squat Exercise: A Systematic Review and Meta-Analysis. J. Strength Cond. Res. 2024, 38, 612–619. [Google Scholar] [CrossRef]
- Jukic, I.; García-Ramos, A.; Malecek, J.; Omcirk, D.; Tufano, J.J. Validity of Load–Velocity Relationship to Predict 1 Repetition Maximum During Deadlifts Performed with and Without Lifting Straps: The Accuracy of Six Prediction Models. J. Strength Cond. Res. 2022, 36, 902–910. [Google Scholar] [CrossRef] [PubMed]
- Garcia-Ramos, A.; Jaric, S. Two-Point Method: A Quick and Fatigue-Free Procedure for Assessment of Muscle Mechanical Capacities and the 1 Repetition Maximum. Strength Cond. J. 2018, 40, 54–66. [Google Scholar] [CrossRef]
- Jidovtseff, B.; Harris, N.K.; Crielaard, J.-M.; Cronin, J.B. Using the Load-Velocity Relationship for 1RM Prediction. J. Strength Cond. Res. 2011, 25, 267–270. [Google Scholar] [CrossRef]
- Banyard, H.G.; Nosaka, K.; Haff, G.G. Reliability and Validity of the Load–Velocity Relationship to Predict the 1RM Back Squat. J. Strength Cond. Res. 2017, 31, 1897–1904. [Google Scholar] [CrossRef]
- Chen, Z.; Xiao, F.; Mao, Y.; Zhang, X.; García-Ramos, A. An Efficient and Accurate Approach for Estimating the Free-Weight Back Squat 1-Repetition Maximum Based on the 2-Point Method and Optimal Minimal Velocity Threshold. J. Strength Cond. Res. 2025, 39, e530–e537. [Google Scholar]
- Fitas, A.; Santos, P.; Gomes, M.; Pezarat-Correia, P.; Schoenfeld, B.J.; Mendonca, G.V. Prediction of One Repetition Maximum in Free-Weight Back Squat Using a Mixed Approach: The Combination of the Individual Load-Velocity Profile and Generalized Equations. J. Strength Cond. Res. 2024, 38, 228–235. [Google Scholar] [CrossRef]
- Hill, A.V. The Heat of Shortening and the Dynamic Constants of Muscle. Proc. R. Soc. Lond. B Biol. Sci. 1938, 126, 136–195. [Google Scholar] [CrossRef]
- González-Badillo, J.J.; Sánchez-Medina, L. Movement Velocity as a Measure of Loading Intensity in Resistance Training. Int. J. Sports Med. 2010, 31, 347–352. [Google Scholar] [CrossRef]
- McBurnie, A.J.; Allen, K.P.; Garry, M.; Martin, M.; Thomas, D.; Jones, P.A.; Comfort, P.; McMahon, J.J. The Benefits and Limitations of Predicting One Repetition Maximum Using the Load-Velocity Relationship. Strength Cond. J. 2019, 41, 28–40. [Google Scholar] [CrossRef]
- Weakley, J.; Mann, B.; Banyard, H.; McLaren, S.; Scott, T.; Garcia-Ramos, A. Velocity-Based Training: From Theory to Application. Strength Cond. J. 2021, 43, 31–49. [Google Scholar] [CrossRef]
- Hughes, L.J.; Banyard, H.G.; Dempsey, A.R.; Scott, B.R. Using a Load-Velocity Relationship to Predict One Repetition Maximum in Free-Weight Exercise: A Comparison of the Different Methods. J. Strength Cond. Res. 2019, 33, 2409–2419. [Google Scholar] [CrossRef]
- Pérez-Castilla, A.; Jaric, S.; Feriche, B.; Padial, P.; García-Ramos, A. Evaluation of Muscle Mechanical Capacities Through the Two-Load Method: Optimization of the Load Selection. J. Strength Cond. Res. 2018, 32, 1245–1253. [Google Scholar] [CrossRef] [PubMed]
- Picerno, P.; Iannetta, D.; Comotto, S.; Donati, M.; Pecoraro, F.; Zok, M.; Tollis, G.; Figura, M.; Varalda, C.; Di Muzio, D.; et al. 1RM Prediction: A Novel Methodology Based on the Force–Velocity and Load–Velocity Relationships. Eur. J. Appl. Physiol. 2016, 116, 2035–2043. [Google Scholar] [CrossRef] [PubMed]
- Nieto-Acevedo, R.; Romero-Moraleda, B.; Díaz-Lara, F.J.; de la Rubia, A.; González-García, J.; Mon-López, D. A Systematic Review and Meta-Analysis of the Differences in Mean Propulsive Velocity between Men and Women in Different Exercises. Sports 2023, 11, 118. [Google Scholar] [CrossRef]
- Pareja-Blanco, F.; Walker, S.; Häkkinen, K. Validity of Using Velocity to Estimate Intensity in Resistance Exercises in Men and Women. Int. J. Sports Med. 2020, 41, 1047–1055. [Google Scholar] [CrossRef]
- Torrejón, A.; Balsalobre-Fernández, C.; Haff, G.G.; García-Ramos, A. The Load-Velocity Profile Differs More between Men and Women than between Individuals with Different Strength Levels. Sports Biomech. 2019, 18, 245–255. [Google Scholar] [CrossRef]
- Romagnoli, R.; Piacentini, M.F. Perception of Velocity during Free-Weight Exercises: Difference between Back Squat and Bench Press. J. Funct. Morphol. Kinesiol. 2022, 7, 34. [Google Scholar] [CrossRef]
- Pérez-Castilla, A.; Piepoli, A.; Delgado-García, G.; Garrido-Blanca, G.; García-Ramos, A. Reliability and Concurrent Validity of Seven Commercially Available Devices for the Assessment of Movement Velocity at Different Intensities During the Bench Press. J. Strength Cond. Res. 2019, 33, 1258–1265. [Google Scholar] [CrossRef]
- Weakley, J.; Morrison, M.; García-Ramos, A.; Johnston, R.; James, L.; Cole, M.H. The Validity and Reliability of Commercially Available Resistance Training Monitoring Devices: A Systematic Review. Sports Med. 2021, 51, 443–502. [Google Scholar] [CrossRef]
- García-Ramos, A.; Suzovic, D.; Pérez-Castilla, A. The Load-Velocity Profiles of Three Upper-Body Pushing Exercises in Men and Women. Sports Biomech. 2021, 20, 693–705. [Google Scholar] [CrossRef]
- Balsalobre-Fernández, C.; García-Ramos, A.; Jiménez-Reyes, P. Load–Velocity Profiling in the Military Press Exercise: Effects of Gender and Training. Int. J. Sports Sci. Coach. 2018, 13, 743–750. [Google Scholar] [CrossRef]
- Fahs, C.A.; Blumkaitis, J.C.; Rossow, L.M. Factors Related to Average Concentric Velocity of Four Barbell Exercises at Various Loads. J. Strength Cond. Res. 2019, 33, 597–605. [Google Scholar] [CrossRef] [PubMed]
- Almåsbakk, B.; Hoff, J. Coordination, the Determinant of Velocity Specificity? J. Appl. Physiol. 1996, 81, 2046–2052. [Google Scholar] [CrossRef] [PubMed]
- Marsden, C.D.; Obeso, J.A.; Rothwell, J.C. The Function of the Antagonist Muscle during Fast Limb Movements in Man. J. Physiol. 1983, 335, 1–13. [Google Scholar] [CrossRef]

| Velocity (m·s−1) | Load Increment (kg) | Repetition | Rest (min) |
|---|---|---|---|
| 20 | 5 | 3 | |
| >0.8 | 20 | 3 | 3 |
| 0.6–0.8 | 10 | 2 | 3 |
| 0.5–0.6 | 5 | 1 | 3 |
| <0.5 | 2.5 | 1 | 3 |
| Model | SEE (kg) − (95%CI) | Pearson r | CV (%) |
|---|---|---|---|
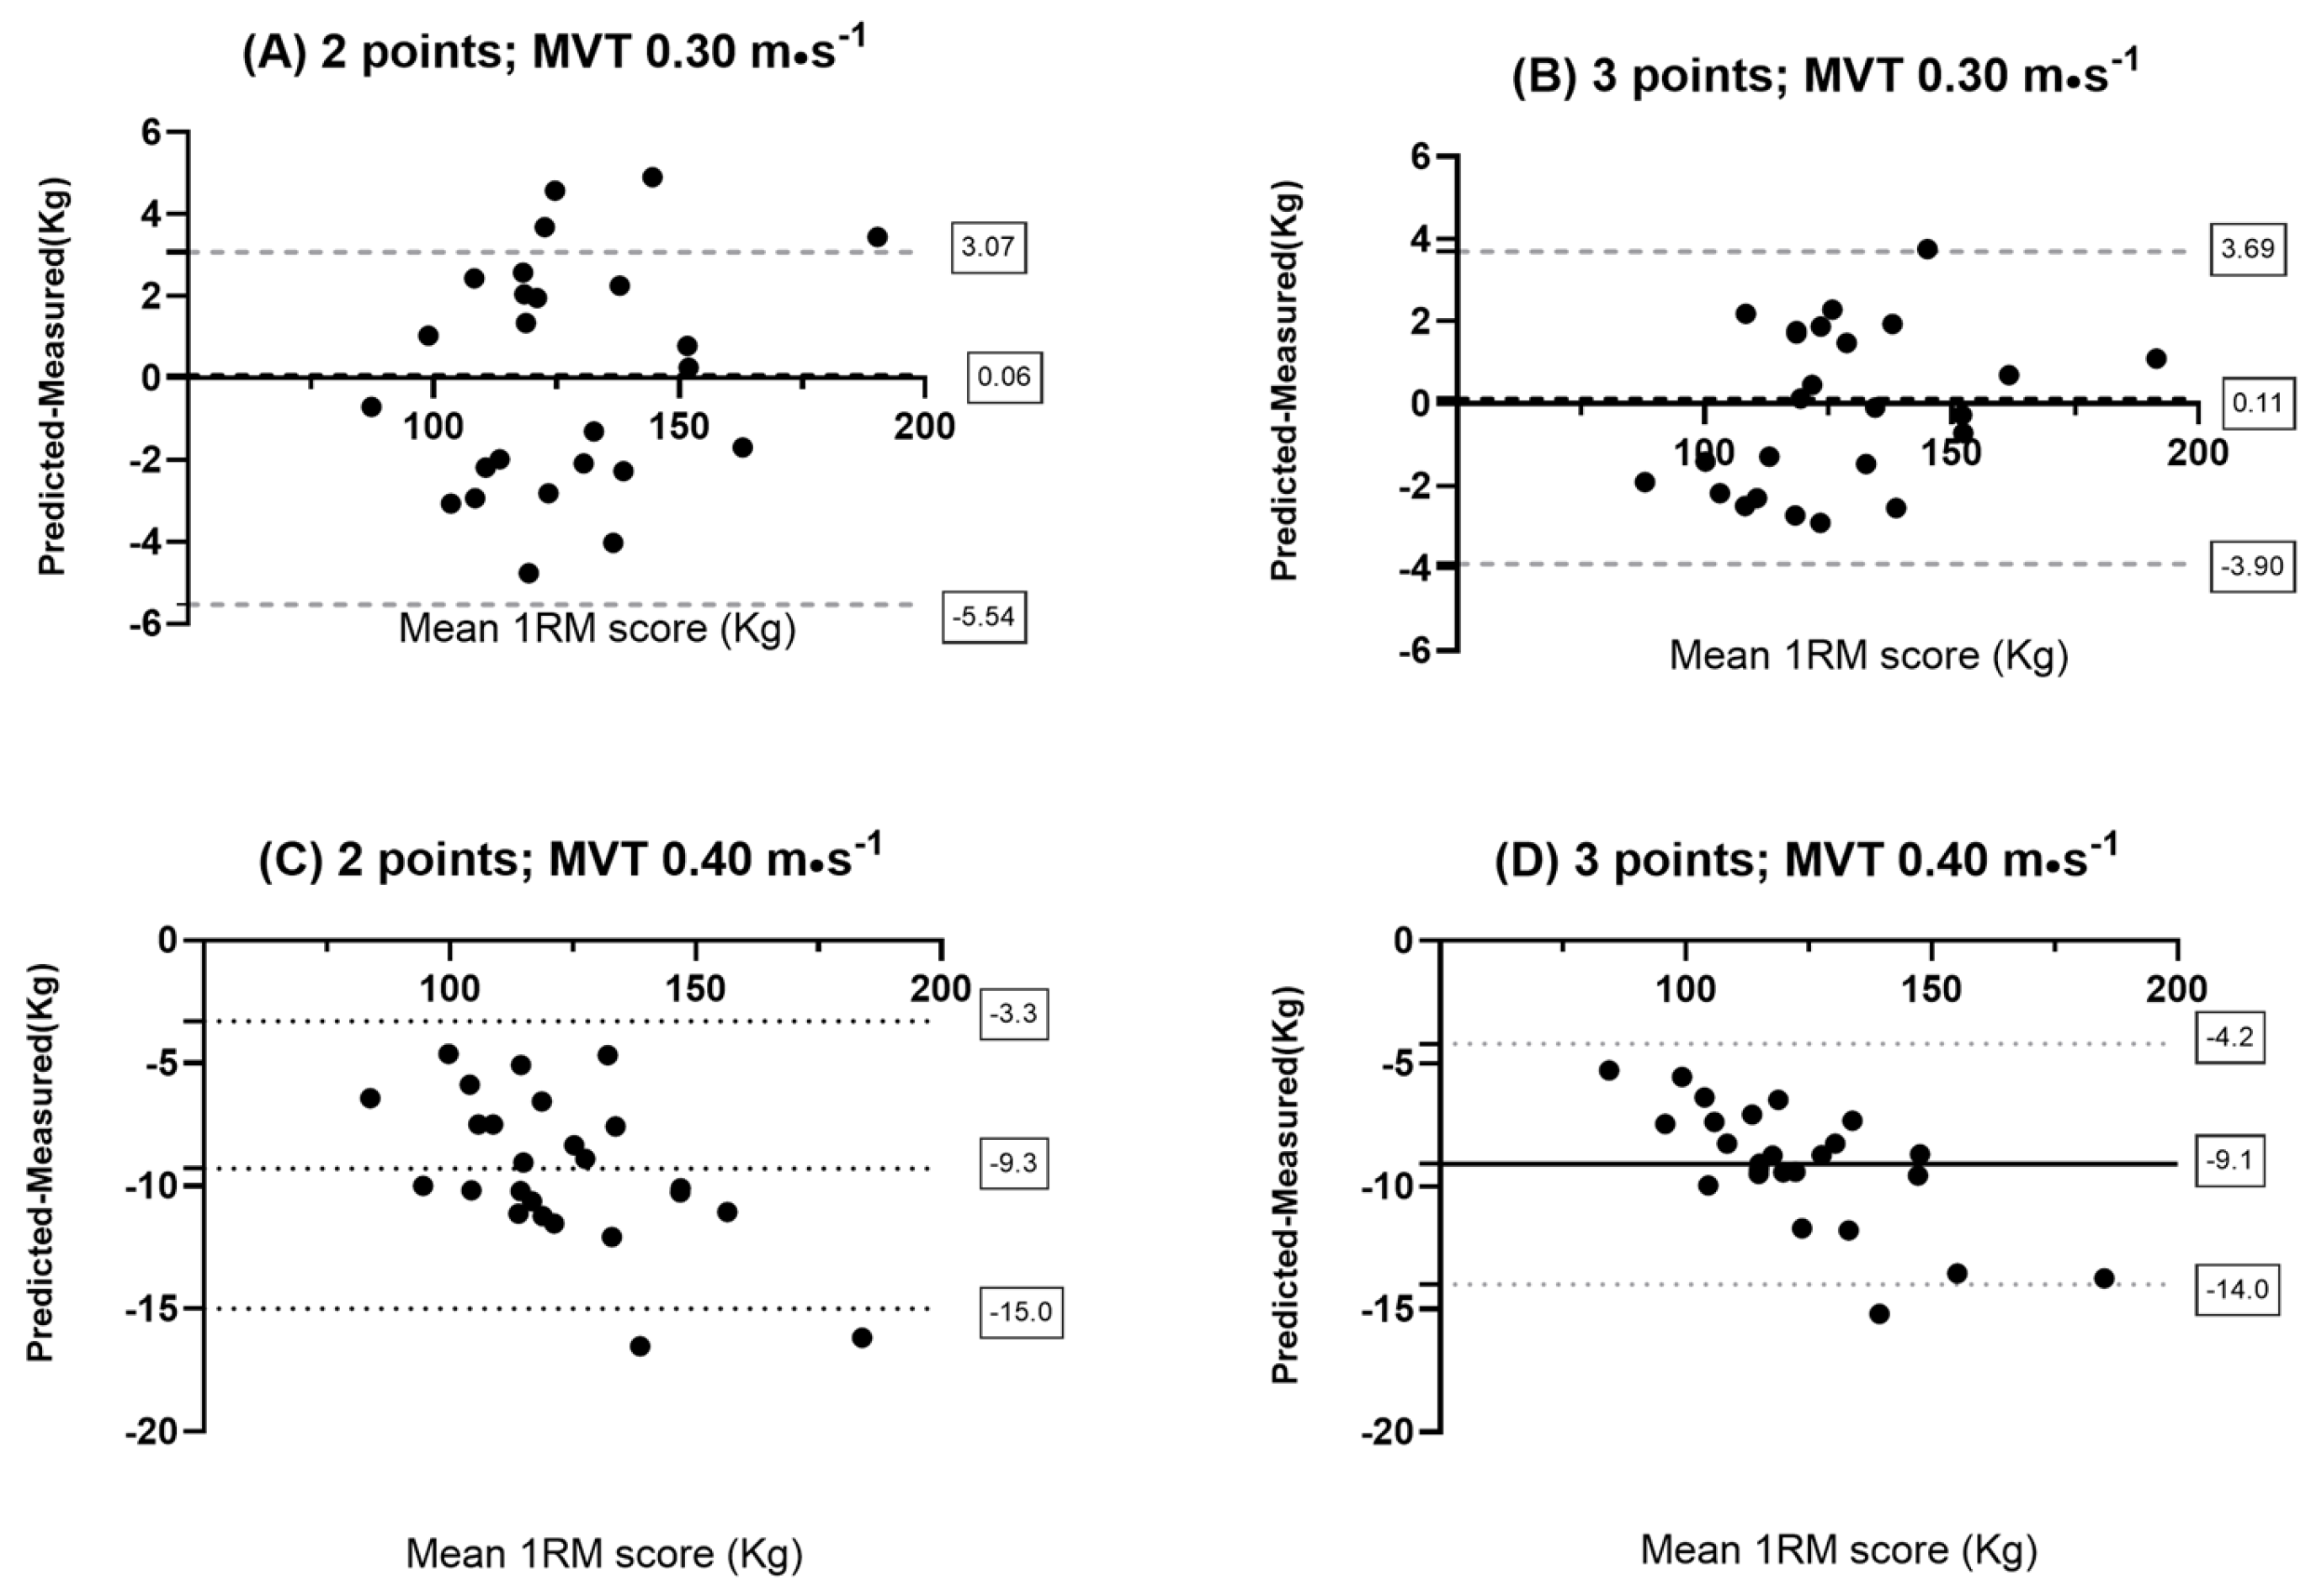
| Males 2 points 0.4 m·s−1 MVT | 10.09 − (−30.5; +11.49) | 0.99 | 2.06 |
| Males 3 points 0.4 m·s−1 MVT | 9.86 − (−29.09; +10.87) | 0.99 | 1.39 |
| Males 2 points 0.3 m·s−1 MVT | 2.86 − (−5.73; +5.85) | 0.99 | 2.23 |
| Males 3 points 0.3 m·s−1 MVT | 1.98 − (−4.20; +3.96) | 0.99 | 1.60 |
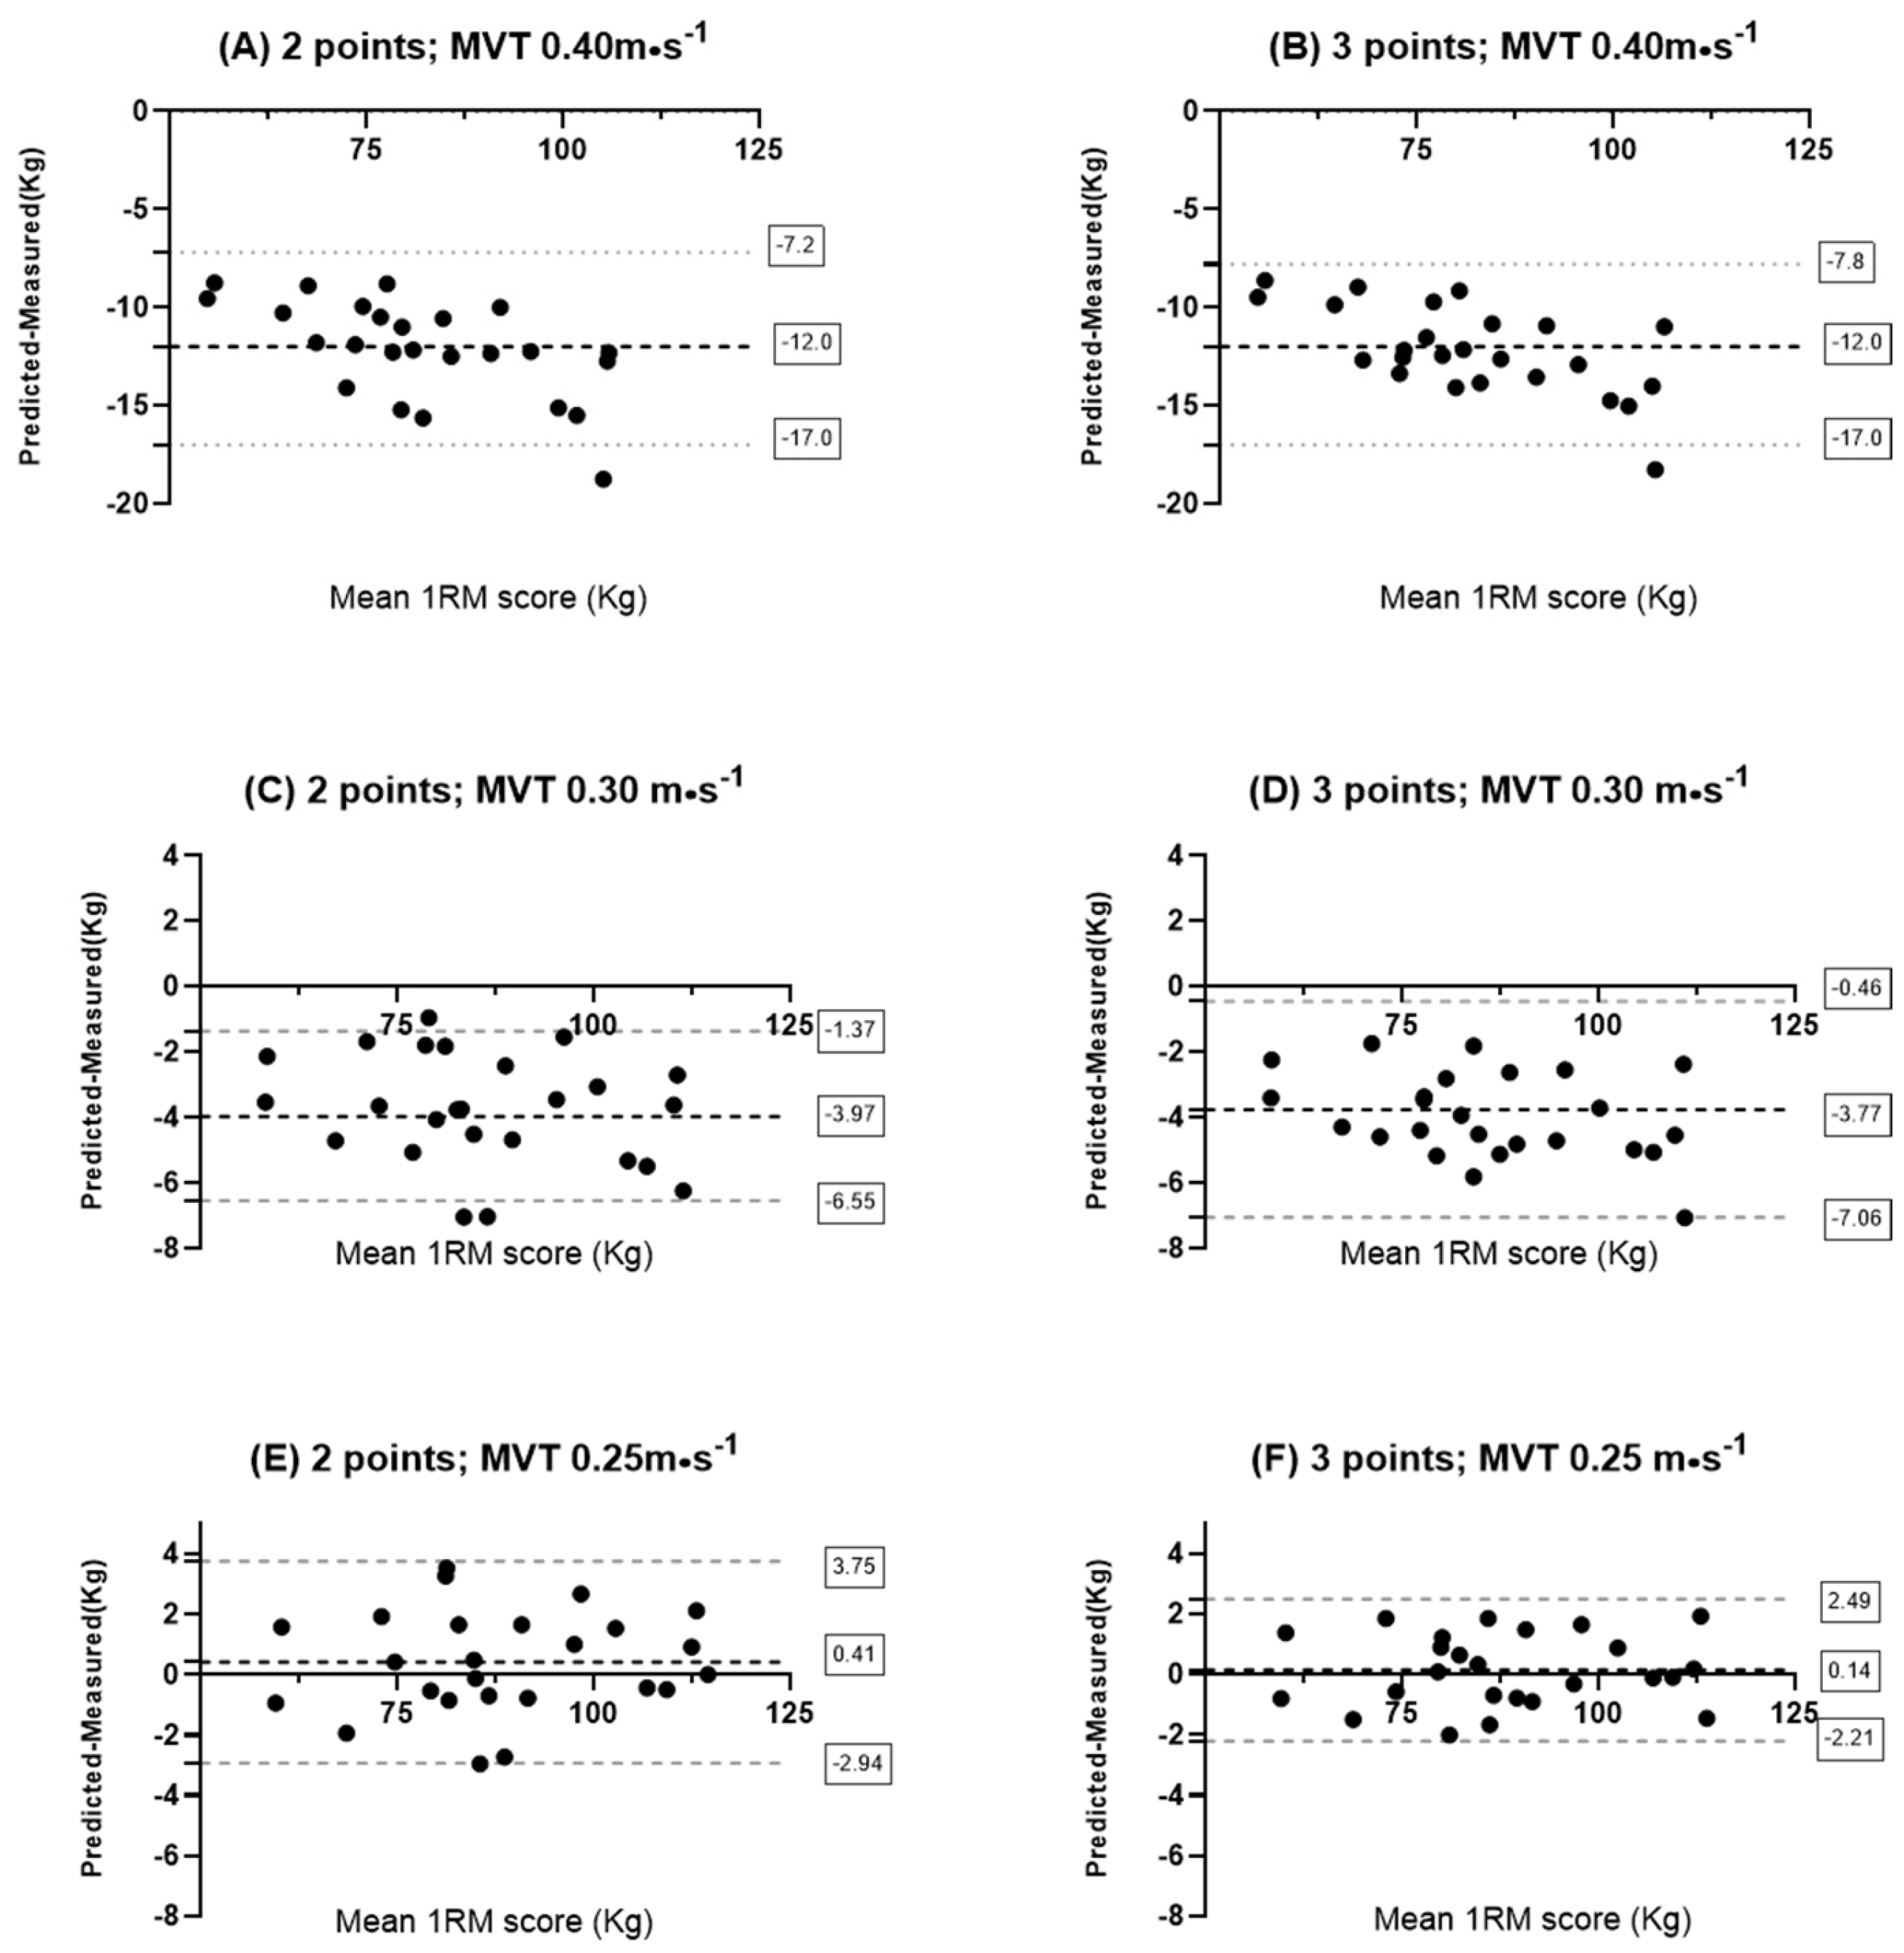
| Females 2 points 0.4 m·s−1 MVT | 12.61 − (−38.15; +13.93) | 0.99 | 2.50 |
| Females 3 points 0.4 m·s−1 MVT | 12.62 − (−38.23; +13.89) | 0.99 | 2.21 |
| Females 2 points 0.3 m·s−1 MVT | 4.20 − (−12.42; +4.88) | 0.99 | 1.95 |
| Females 3 points 0.3 m·s−1 MVT | 4.26 − (−12.74; +4.80) | 0.99 | 1.45 |
| Females 2 points 0.25 m·s−1 MVT | 1.76 − (−3.22; +4.04) | 0.99 | 2.06 |
| Females 3 points 0.25 m·s−1 MVT | 1.21 − (−2.65; +2.63) | 0.99 | 1.45 |
Disclaimer/Publisher’s Note: The statements, opinions and data contained in all publications are solely those of the individual author(s) and contributor(s) and not of MDPI and/or the editor(s). MDPI and/or the editor(s) disclaim responsibility for any injury to people or property resulting from any ideas, methods, instructions or products referred to in the content. |
© 2025 by the authors. Licensee MDPI, Basel, Switzerland. This article is an open access article distributed under the terms and conditions of the Creative Commons Attribution (CC BY) license (https://creativecommons.org/licenses/by/4.0/).
Share and Cite
Dello Stritto, E.; Romagnoli, R.; Nocchi, M.; Piacentini, M.F. How Does Load Selection and Sex Influence 1RM Prediction Using the Minimal Velocity Threshold During Free-Weight Back Squat? Sports 2025, 13, 224. https://doi.org/10.3390/sports13070224
Dello Stritto E, Romagnoli R, Nocchi M, Piacentini MF. How Does Load Selection and Sex Influence 1RM Prediction Using the Minimal Velocity Threshold During Free-Weight Back Squat? Sports. 2025; 13(7):224. https://doi.org/10.3390/sports13070224
Chicago/Turabian StyleDello Stritto, Emanuele, Ruggero Romagnoli, Michele Nocchi, and Maria Francesca Piacentini. 2025. "How Does Load Selection and Sex Influence 1RM Prediction Using the Minimal Velocity Threshold During Free-Weight Back Squat?" Sports 13, no. 7: 224. https://doi.org/10.3390/sports13070224
APA StyleDello Stritto, E., Romagnoli, R., Nocchi, M., & Piacentini, M. F. (2025). How Does Load Selection and Sex Influence 1RM Prediction Using the Minimal Velocity Threshold During Free-Weight Back Squat? Sports, 13(7), 224. https://doi.org/10.3390/sports13070224