1. Introduction
A decisive physiological determinant of sprint performance in track cycling is the ability to produce fatigue-free muscular power, which can be described with maximal force-velocity (F/v) and power-velocity (P/v) profiles. Although A. V. Hill [
1] modelled the velocity of the shortening of contractile elements as an inverse hyperbola, the force-velocity profiles of large muscle groups acting upon more than a single joint may be adequately approximated by linear relations [
2]. Especially in the case of multi-joint movements with resistance, such as those involved in jumping, running, cycling, lifting and throwing, almost linear relations between generated force and body segment velocity have widely been found [
3].
In sprint cycling, a strong linear relation of mean pedal force (F) and pedalling rate (PR) has been reported in numerous investigations (e.g., [
4,
5,
6,
7,
8,
9]). The relation of power output (
) and pedalling rate is parabolic and can be analysed by non-linear regression (ibid.). In cycling, these profiles illustrate the maximal resistance that an athlete can overcome at a certain cadence, and thus the maximal power output at that cadence.
In diagnostics, F/v and P/v profiles allow to describe important characteristics of performance, such as the theoretical maximal mean crank force (
) and maximal pedalling rate (
) as y- and x-axis intercepts of the F/v function, the maximal mechanical power output (
) as the apex of the P/v relation and the optimal pedalling rate (
) as corresponding cadence [
6].
Maximal force-velocity (F/v) and power-velocity (P/v) relations of cyclists are often established on a cycle ergometer in the laboratory utilizing a number (at least three to four efforts) of “fatigue-free” isovelocity maximal sprints at different cadences (usually ≤ 6 s, assuming a fatigue-free time interval of ≤ 6 s, with 5 min passive rest between efforts) [
10,
11,
12,
13,
14,
15,
16,
17]. This method allows a series of pedalling cycles to be recorded for each cadence tested. However, participants usually have to accelerate to the desired cadence by pedalling against the resistance of a large gear ratio and flywheel, and may reach the target cadence after only a few seconds, possibly in a fatigued state. This, combined with the relatively short rest between efforts, can lead to a fatigue-induced drop in performance that can affect the quality of the data [
18].
Alternatively, these profiles can be determined using one single isoinertial sprint bout (usually ≤ 7 s) in which participants accelerate maximally from a standing or rolling position on a friction-loaded ergometer so that several movement velocities occur during the sprint [
4,
5,
8,
18,
19]. Recent research has found slight improvement in the quality of F/v profiles for the isoinertial method when comparing the two methods, presumably due to the absence of multiple sprints after incomplete recovery [
20]. Due to the similarity to the demands of acceleration from a standing or rolling position during competition, this acceleration method is considered highly suited for diagnostics in track cycling sprinting [
8,
19].
To determine track cycling sprint performance via maximal F/v and P/v profiles directly on the cycling track, Gardner and colleagues [
8] transferred the acceleration method to the field and derived profiles from two maximal standing-start 65 m sprints on a cycling track conducted with a constant gear ratio of 48 (front)/14 (rear). They demonstrated high model quality and high agreement with profiles derived from laboratory testing using two 6 s-maximal isoinertial sprints on a cycle ergometer [
8].
Following this approach, it seems possible to derive valid maximal F/v and P/v profiles from data collected during the first 7 s of a maximal (standing-start) sprint on the cycling track using pedalling rates ranging from 55–95 revolutions per minute (rpm) [
8]. In accordance with the procedure suggested by Gardner and colleagues [
8], a comparable method was used to determine the maximal F/v and P/v profiles in BMX cycling [
9,
16].
As was pointed out by a number of researchers, in order to obtain valid maximal F/v and P/v profiles performance should be considered under realistic conditions across the entire force-velocity spectrum, especially the two profile extremes (absolute strength and strength speed/speed) should be represented [
2,
18,
21,
22,
23,
24,
25]. F/v profiles derived from data with maximal pedalling rates of 100 rpm or less may not accurately represent a cyclist’s potential at high to very high cadences.
Furthermore, the data used to determine maximal F/v profiles should be free of fatigue-related performance losses to validly depict maximal fatigue-free performance [
18]. Our own research results show a deviation from the fatigue-free maximal F/v profile after ≤ 3 s of maximal exercise in highly trained sprint cycling athletes due to metabolic fatigue [
26]. If data beyond 3 s are included in the regression analysis, this database is unlikely to represent the cadence-specific maximum in the cadence range reached after the onset of fatigue. This assumption is supported by the results of Kordi et al. [
27], who calculated a significantly higher maximum cadence using the isovelocity method compared to the isoinertial method.
We assume that creating maximal F/v and P/v profiles in track cycling based on the data of a single maximal 65-m acceleration on the cycling track does not validly represent the fatigue-free maximal performance of an athlete and may over- or under-estimate important profile parameters such as maximal and optimal cadence due to two factors: (1) a limited cadence spectrum and (2) an excessive exercise duration represented in the data.
Collecting fatigue-free data across the entire force-velocity spectrum would require several short maximal sprint tests on the cycling track with significant different gears, analogous to the isovelocity method in the laboratory. Such a procedure would be less efficient in practice due to the time required and fatigue accumulated.
In the following, we present a possible integration of the most recent research findings into diagnostic procedures and aim to improve the validity of force-velocity profiles created for track sprint cyclists and to elucidate a potential independence of those profiles on the choice of gear ratio.
As a viable option for practical testing on the cycle track, we propose that the creation of maximal F/v profile can be based on a single maximal acceleration when additional fatigue-free data points at high cadences are included. Those data can exemplarily be derived from a high-cadence low-resistance sprint on a non-resisted (free) roller trainer (motoric test) during the daily warm-up program.
Furthermore, we test the impact of the gear ratio on the results and postulate that maximal F/v and P/v profiles can be produced with any gear ratio that an athlete can manage, as long as the minimum conditions of the approach are met.
2. Methods
2.1. Participants
Twelve elite track cycling sprinters (four females; 21.8 ± 1.3 yrs, body height: 1.75 ± 0.05 m, body weight: 73.1 ± 3.2 kg and eight males; age: 26.8 ± 3.6 yrs, body height: 1.83 ± 0.04 m, body weight: 88.4 ± 5.9 kg; crank length: 0.17 ± 0.00 m (means ± standard deviations)) took part in this investigation.
As our study design required high-level neuromuscular performance, only athletes who had demonstrated closely linear F/v profiles (R2 > 0.95) in previous tests in the laboratory and who had already competed in track cycling sprint events at international championships were included. All participants used their own bicycle, cycling shoes and pedals during the test.
The participants were requested to refrain from consuming alcohol and from intense training and asked to maintain their normal drinking and eating habits for 24 h prior to the experimental session. All participants provided their informed written consent to participate in this study, which was approved by the institute’s ethical committee and performed in accordance with the Declaration of Helsinki.
2.2. Exercise Protocol
After a standardized warm-up each subject completed a motoric test on a free roller and two series of three maximal 65-m sprints on an official cycling track (Frankfurt an der Oder, Germany).
2.3. Warm-Up
The warm-up prior to the tests involved 15 min of low-intensity cycling, with self-selected intensity within the recommended power ranges (1–1.5 W kg−1 bodyweight), followed by two 6-s maximal sprints on the track (starting from rolling at approximately 40 rpm). This warm-up and each series of sprints were separated by 10 min of cycling at low intensity and 10 min of passive recovery.
2.4. Motoric Test
After the warm-up, participants first performed two 6-s maximal sprints in a seated position on a free roller (separated by 5 min of passive recovery). The gear ratios used were chosen so that the athletes reached a cadence of ≥ 160 rpm within the first 3 s of the maximal sprint.
2.5. Track Sprints
Then, all athletes performed two series of three maximal 65-m sprints in a sitting position initiated from a rolling start at approximately 40 rpm at <100 W with their preferred leg first. Each sprint was interspersed by 5 min of passive recovery. All sprints were produced on the straight lines of the track. To investigate the validity of the profiles and elucidate the impact of gear selection, both sprint series were run with significantly different gear ratios. In the first series, a small gear (development of 6.76 ± 0.17 m, mean ± standard deviation) was selected for all athletes. In the second series, the athletes were asked to choose a high, but manageable gear for standing starts (development of 8.00 ± 0.48 m).
Throughout the testing, pedal force and crank velocity were measured continuously with a FES power meter. The system supplied by the Institute for Research and Development of Sports Equipment (FES) in Berlin captures the tangential force on the crank arm with a sample frequency of 200 Hz. From this high-resolution power-meter data, the mean tangential force F (N) at the left pedal, averaged per one revolution, as well as the corresponding mean pedal rate PR (rpm) was derived.
2.6. Data Processing
Two different methods, in the following referred to as models I and II, were used to derive maximal F/v and P/v profiles from the data: In model I following Gardner et al. [
8], the F/v and P/v profiles were calculated based on the mean pedalling rate and the corresponding mean crank force during the first 6 s (in accordance to the traditionally assumed fatigue-free time interval) of each sprint on the track. In our proposed new method of model II, both the initial acceleration phase of each maximal sprint on the track and the motoric test were considered. From the track sprints, the first 3 or 4 cycles (≤ 3 s) with linear F/v relation were taken, and 1 or 2 fatigue-free cycles at pedal rates above 160 rpm from the motoric test were evaluated to establish the fatigue-free F/v and P/v profiles. As cadence is proportional to the tangential speed of motion velocity of the pedal, the profiles were based on the mean cadence PR and corresponding mean crank force F.
The force-velocity continuum was analysed in terms of linear (F/v profile) and non-linear (P/v profile) regression. The function
approximates the fatigue-free relation of mean pedal force F and the movement velocity PR, where a < 0 reflects the decline in mean pedal force with increasing cadence and b the theoretical maximal mean pedal force.
Net power output P(v) was calculated by multiplying force F(v) times cadence PR:
The following equations were used to obtain various characteristics of performance for the best effort of each series: theoretical maximal mean pedal force , theoretical maximal velocity of movement PRmax = −b·a−1, optimal cadence PRopt = −b·(2a)−1 and maximal power output Pmax = −b2(4a)−1. The best efforts were defined as those that indicated the highest peak performance. To evaluate the validity of the different approaches, the consistency of the profiles with raw data results was checked by Pmax ≥ Ppeak.
2.7. Statistical Analyses
Values are reported as means ± standard deviations (SD). Normal distribution of the data was confirmed by Shapiro and Wilk testing and the Levene test for homoscedastity. Differences between the profiles created on the basis of the different runs and models were compared by one-way ANOVA for repeated measures with Bonferroni post-hoc analysis, with the subject’s sex as an interindividual factor; while the mean differences between these parameters were compared employing -tests for dependent samples. Cronbach’s alpha and ICC were calculated to investigate the consistency of the profile parameters derived from series 1 and series 2. In all cases, the level of statistical significance was set at p < 0.05 and Cohen’s d (small = 0.2; medium = 0.5; large = 0.8) employed as a measure of effect size. The quality of the regression analyses was assessed by calculating the coefficient of determination R2. Mathematical analysis and statistical tests were processed using IBM SPSS statistics version 24 Software for Windows (SPSS Inc., Chicago, IL, USA) and Office Excel 2016 (Microsoft Corporation, Redmond, WA, USA).
3. Results
The gear ratios chosen for the first series of sprints of 54 ± 2 (front)/17 ± 1 (rear; development of 6.76 ± 0.17 m) resulted in a range of pedalling rate of 70 rpm to 150 rpm. In the second series conducted with a mean gear ratio of 56 ± 1(front)/15 ± 1(rear; 8.00 ± 0.48 m), the data points reflected pedalling rates between 50 rpm to 110 rpm. In the motoric test data points at pedalling rates between 165 rpm and 235 rpm were obtained.
Anthropometric data and the parameters of the fatigue-free F/v profile with corresponding model quality R
2 calculated with model I and model II are presented in
Table 1 for all athletes.
Although both models exhibited high-to-excellent linearity, statistically significant differences could be observed. Maximal force (1507.51 ± 257.60 N and 1384.35 ± 276.84 N; p < 0.002; d = 2.555) and maximal net power Pmax (1499.54 ± 373.17 W and 1623.84 ± 84; p<0.017, d = −1.711) were statistically significant higher and the slope of the function (aI = −6.78 ± 1.17 and aII = −5.24 ± 1.11; p < 0.003, d = −2.401) and PRmax (223.73 ± 27.11 rpm and 264.59 ± 23.17 rpm; p < 0.004; d = −2.427) statistically significant steeper with model I than model II. Both linear regressions produced high coefficients of determination, with R2 amounting to 0.93 0.06 for model I and to 1.00 for model II. Model II thus showed a higher, almost ideal explained variance (p < 0.003, d = −2.427).
Although fatigue-free maximal force (p < 0.002; d = 3.157), and maximal power output were higher in male athletes (p < 0.001; d = 4.235), no significant interindividual effects were observed for any of the parameters.
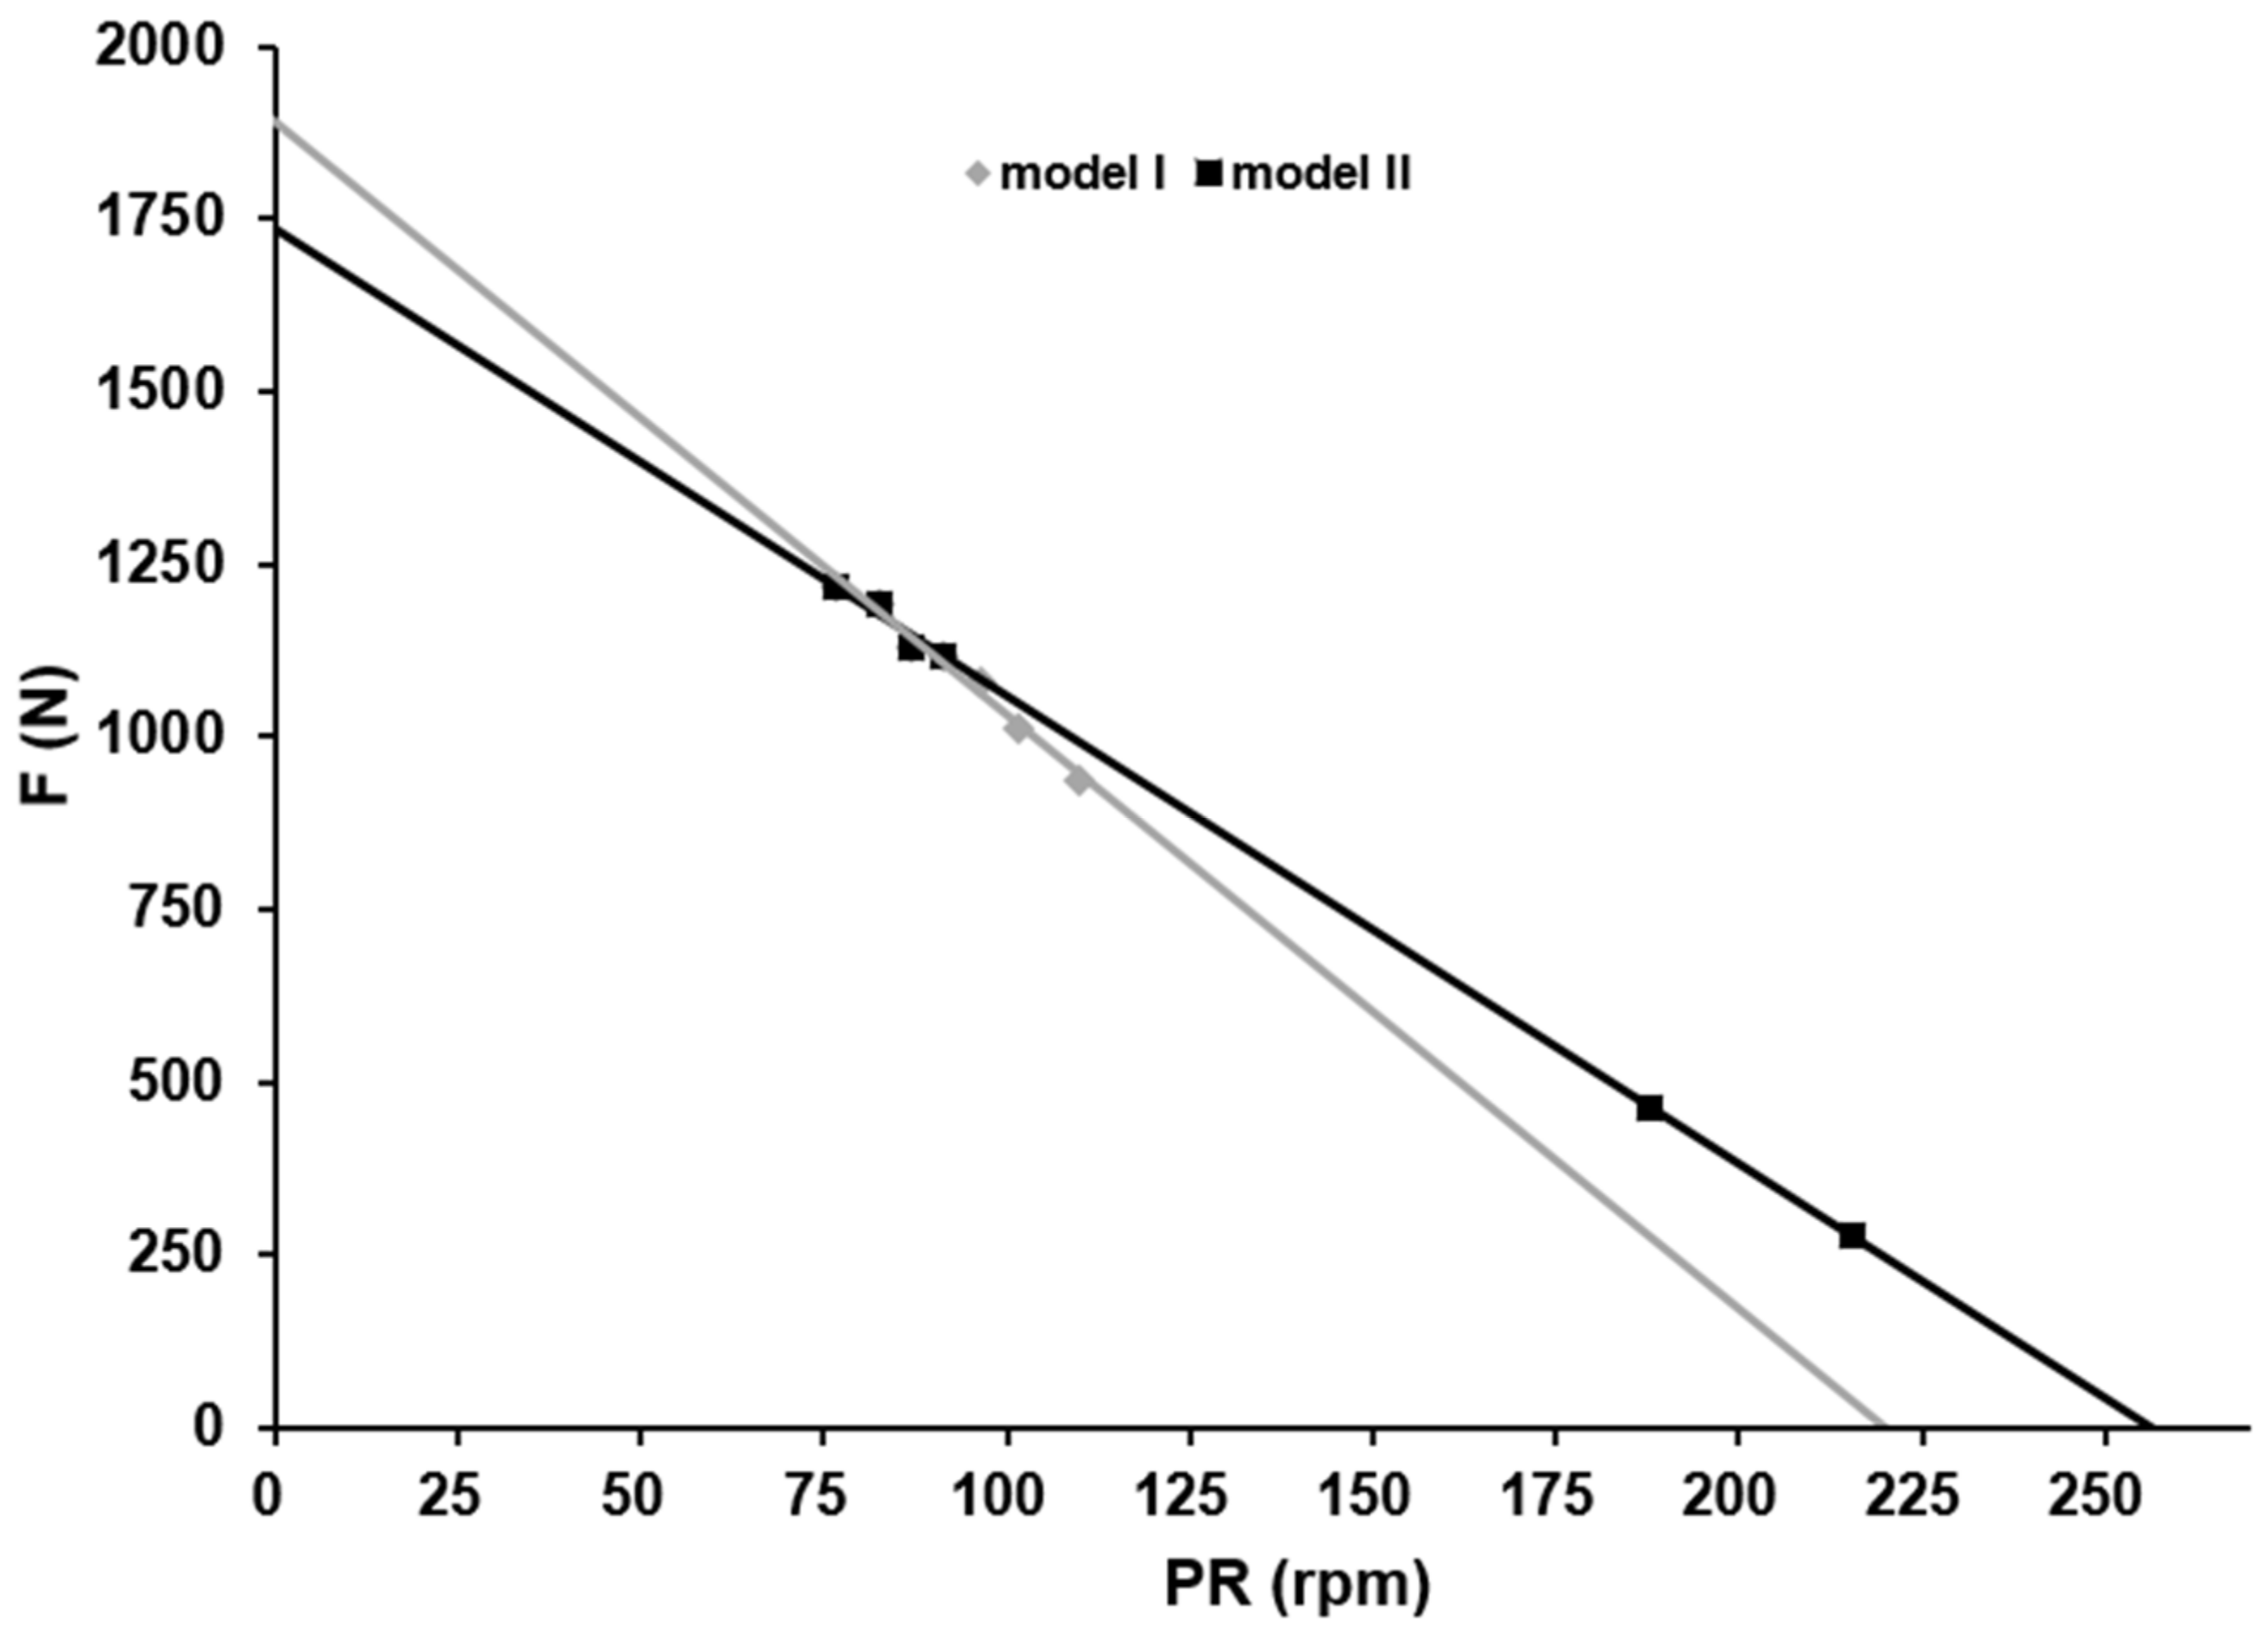
Deviations from the fatigue-free raw data at high cadences derived from the sprint with small gear ratio and the motoric test were smaller for model II. In the case of a fatigue-free mean pedal force of 250.34 ± 84.87 N at a cadence of 215.65 ± 18.95 rpm derived from the motoric test, these deviations were 224.07 ± 163.89 vs. 1.39 ± 1.33 N, respectively (p < 0.002, d = 2.997). Considering a fatigue-free high cadence data point derived from smaller geared sprint at a mean cadence of 141.00 ± 6.71 rpm and corresponding mean pedal force of 667.91 ± 126.88 N, these deviations were 106.35 ± 83.16 vs. 9.41 ± 10.06 N, respectively (p < 0.002, d = 2.312).
A representative example of these differences is depicted in
Figure 1. For all athletes, the F/v profile was significantly steeper and the maximal pedalling rate significantly lower with model I than with model II.
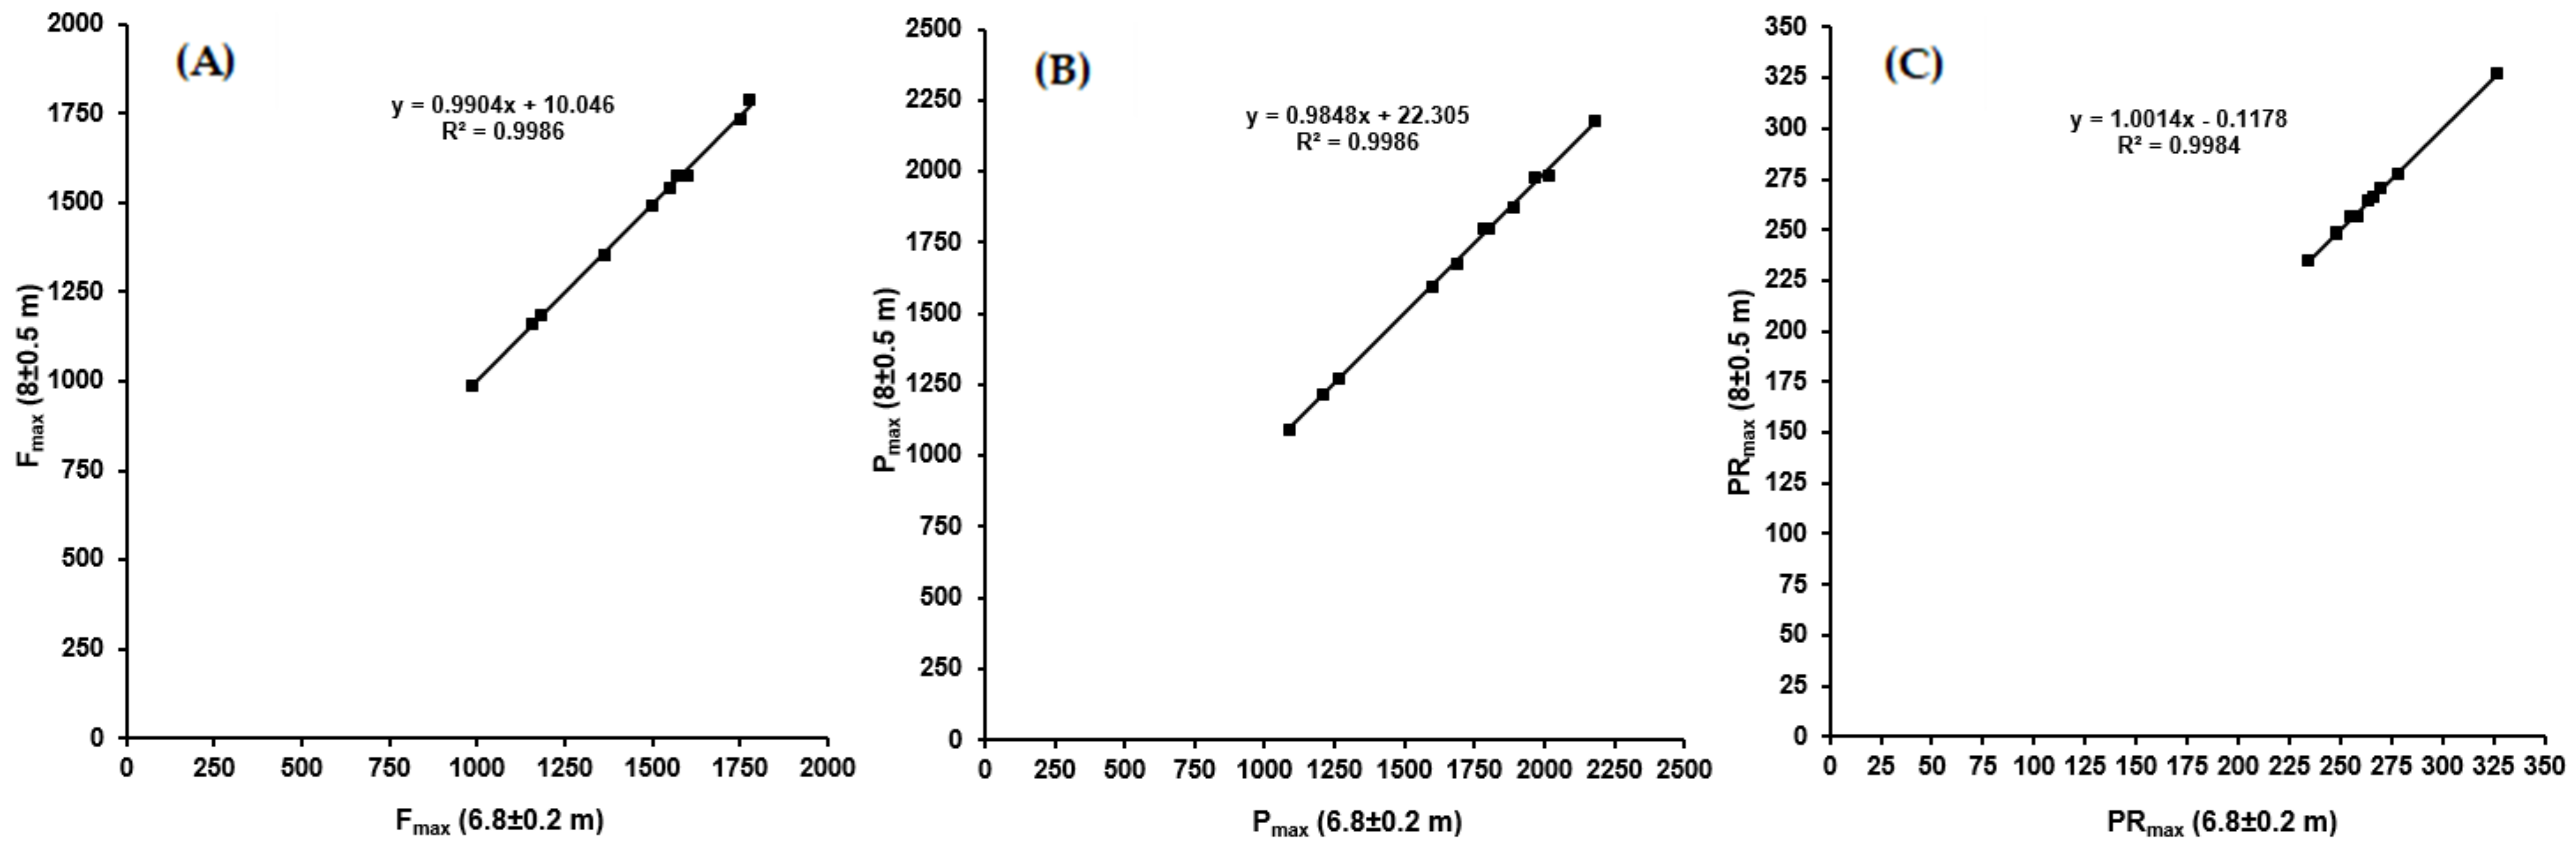
Comparing the F/v and P/v profiles for the best sprint in each series no significant systematic difference in the characteristic values was observed (
p > 0.154). The results of linear regression analysis for the main profile parameters are shown in
Figure 2.
Cronbach’s alpha and intraclass correlation coefficients (ICC) were calculated as 1.00 for parameter a and b, which indicate excellent model consistency. The parameters of the F/v profile derived from the best sprint of each series calculated with model II are shown in
Table 2.
4. Discussion
In agreement with Gardener and colleagues [
8], both of our models I and II demonstrated high- to-excellent linearity, but the values obtained with the adjusted model II were statistically higher. In particular, the higher level of maximal force with a steeper slope of the F/v profile based on model I resulted in mean pedal forces at high cadences that were lower than those the athletes actually realized in the motoric test. With model I the risk of underestimating an athlete’s level of performance at high cadences is high and may result in an incorrect fatigue-free maximal cadence. As an elite track sprinter’s maximal and optimal cadences (
) are sensitive indicators of performance for both training and competition [
28], such inaccuracy may lead to substantial errors, for example, when selecting a non-optimal gear ratio [
29].
When creating F/v profiles for sprint cyclists, it appears necessary to include at least one data point at a realistically high pedalling rate associated with speed strength or speed [
18,
22,
23,
24]). Model I, basing on cadences of 40–150 rpm, reflects performance in the range maximal strength or power, obtaining performance at cadences < 160 rpm only by extrapolation. Since the patterns of muscular recruitment differ at different velocities [
30], this can lead to an inaccurate representation of performance, particularly in the extrapolated portion of the F/v profile.
Moreover, model I involves data from the first 6 s of a maximal sprint on a cycling track. Although Seck et al. [
4], Gardner et al. [
8] and Debraux et al. [
9] reported a linear developement of the force-velocity data within those 6 to 7 s, which is also confirmed by our results, we recently showed that professional track cycling sprinters leave their fatigue-free F/v profile after a maximum of 3 s of maximal cycling due to a reduced energy supply [
26]. The high linearity of the F/v profile derived from a 6 to 7 s maximal sprint suggests validity even though an athlete did not perform maximally for several seconds due to fatigue.
Both problems associated with model I can lead to an inaccurate F/v profile as shown in
Figure 1. The findings with model II suggest incorporating high fatigue-free cadences (>160 rpm), so the risk for such error is significantly reduced. Using data gathered during the first 6 s together with data collected at a very high crank velocity (i.e., a combination of models I and II) reduces the risk of obtaining an inaccurate maximal cadence (model I: 222 rpm, model II: 264 rpm, combined model: 263 rpm). This finding emphasizes the importance of including data from high pedalling rates in order to obtain a valid estimate of the optimal pedalling rate.
Due to the differences between the models, the mean extrapolated maximal cadences found in a sitting position of 264 rpm exceeds the values previously reported for field measurements of 256 rpm or 244 rpm, respectively, for sprinting in a standing position [
8,
9]. Our own research indicates even higher maximal cadences in standing than in sitting position (unpublished data), underlining the possibility of an underestimation of the actual maximal cadence with the previous approaches. The smaller R
2 values reported by Gardner et al. [
8] and Debraux et al. [
9] (R
2 < 0.984) support the possibility of a fatigue bias present in the data used to generate F/v and P/v profiles.
Dorel and colleagues [
6] used 5 s maximal sprint and thereby probably not only fatigue-free data to create maximal F/v and P/v profiles. Their results for maximal mean pedal force, maximal power and maximal pedalling rate compare well with our findings. The high cadence range reflected in their data (<50 to >200 rpm) derived from three maximal sprints against different forces applied to a friction belt seems to reduce or prevent calculation errors.
When creating valid maximal F/v profiles, it seems highly important to represent the different muscular recruitment patterns by data points in different cadence ranges.
Despite the comparatively good prediction of the performance at pedalling rates >160 rpm by model II and the high model validity suggested by it overall, for one athlete the use of data points at very high cadences led to a reduction in the F/v profile slope. This may indicate a potential neuromuscular and/or coordinative deficit of the athlete, hindering utilization the actual strength speed and speed performance potential. This is an example of the versatility of F/v profiles, which may be used to identify such potentials.
Comparing the best profiles for the two individual series of sprints reveals an independence of the choice of gear ratio. The statistical analysis of the profiles indicates high consistency.
In a maximal cycling effort, the gear ratio determines the resistance, which must be overcome at any given pedalling rate. Maximal cycling with different gear ratios leading to pedalling at different rates with different corresponding pedal forces seems to be analogous to the choice of different loads in strength exercises. If the range of cadences is sufficiently high to represent different neuromuscular recruitment patterns, the profile derived should be independent of the gear ratio. Transferring the assignment of movement velocity ranges to strength abilities as suggested by Mann [
23] using the mean F/v profile with a maximal pedalling rate of 265 rpm, the low-frequency cadence range up to 80 rpm appears to be determined by strength, the cadence range from 80 to 160 rpm by power, cadences of between 160 to 220 rpm by speed strength and cadences > 220 rpm by speed.
The database used in model II represents the entire force-velocity spectrum and the very high model quality supports its validity. We deem our approach suitable for creating baseline profiles that allow the assessment of fatigue-free performance during sprinting on a cycling track.
5. Limitations
At present, the application of our model is limited to maximal sprints on a cycling track and has only been validated for a relatively small group of elite athletes. Further validation of the reliability of our approach, as well as examination of its potential applicability to other conditions and sports is required.
Due to the measuring system used, the profiles were derived from the left crank only, possibly measuring combined propulsive forces of both legs. This may reduce comparability to profiles derived from both legs independently. It may further reduce comparability to profiles derived from strength exercise, where designated muscles or muscle chains are analyzed.
The determination of maximal F/v and P/v profiles requires athletes to perform with maximal neuromuscular control. If an athlete’s performance is sub-maximal due to, e.g., deficits in neuromuscular control, a valid representation of maximal performance is not possible. This is reflected in a comparatively poor model quality. In such cases, the need for regeneration (if the deficit is due to fatigue) or training interventions to improve neuromuscular control (if the deficit is a performance reserve) can be deduced from the diagnostic results.
The fatigue-free F/v profile of an athlete is not constant but depends on the current functional state of the nervous system (muscle fibre recruitment, intermuscular coordination, synchronisation, co-contractions) as well as tendons and the muscle system itself (muscle contraction mechanics, energy flow in the muscle cell). Central and peripheral fatigue, hormonal status (stress level, time of day), training conditions and the potential cross-over effects of different exercises can influence the values of individual indicators of maximal performance, including cadence, indicating the need for frequent measurements.
6. Practical Applications
In track cycling, maximal F/v and P/v profiles allow the description of important performance characteristics. When creating these profiles, a sufficiently large cadence range (mean pedal forces with associated cadence representing maximum strength to speed strength or speed should be included as data points) and reflecting an athlete’s maximal, i.e., fatigue-free, performance should be ensured.
As a viable option for practical testing within the available time budget, we suggest deriving maximal F/v and P/v profiles based on a single maximal sprint with any gear an athlete can manage combined with a low resistance, high cadence motoric test, ensuring the athletes’ performance in a fatigue-free state at pedalling rates above 160 rpm. Our practical experience shows that such a motoric test can be integrated as part of the warm-up routine.
7. Conclusions
In track cycling, F/v and P/v profiles provide valuable insight into performance characteristics. The procedure for the creation of such profiles, referred to as model II in this study, is accurate, independent of the gear ratio and suited for the creation of baseline profiles for assessing fatigue-free performance on the cycling track. Creating F/v profiles based on the first 3 to 4 crank revolutions (≤3 s) of a single short maximal sprint on the track with an arbitrary gear ratio the athlete is capable to manage, combined with low-resistance high-cadence test, ensures a sufficiently wide cadence range and protects against fatigue-related data bias.
Author Contributions
Conceptualization, A.K.D.; methodology, A.K.D. and C.H.; validation, A.K.D., C.H., O.U.; formal analysis, A.K.D., O.U. and H.-C.H.; investigation, A.K.D., C.H. and H.-C.H.; writing—original draft preparation, A.K.D., C.H. and H.-C.H.; writing—review and editing, A.K.D., C.H., O.U., H.-C.H.; visualization, A.K.D. and O.U.; supervision, O.U. and H.-C.H. All authors have read and agreed to the published version of the manuscript.
Funding
This research would not have been possible without the financial support from the BMI (Federal Ministry of the Interior and Community; Germany) for the more extensive project (AD-5-17) from which this investigation was derived.
Institutional Review Board Statement
The study was conducted in accordance with the Declaration of Helsinki, and approved by the Ethics Committee of INSTITUTE OF APPLIED TRAINING SCINÈNCE (ER_2020.18.12_16, 04.02.2021).
Informed Consent Statement
Informed consent was obtained from all subjects involved in the study.
Data Availability Statement
The datasets generated and/or analysed during the current study can be obtained from the corresponding author upon reasonable request.
Acknowledgments
The authors would like to thank the coaches and especially the athletes who participated in this study, without whom none of this would have been possible.
Conflicts of Interest
The authors declare no conflict of interest.
Abbreviations
| a | Slope of the F/v profile |
| F/v | Force-velocity |
| F | Force |
| Theoretical maximal pedal force |
| P | Power output |
| Maximal power output |
| PR | Pedalling rate; cadence |
| Maximal pedalling rate; maximal cadence |
| Optimal pedalling rate; optimal cadence |
| P/v | Power-velocity |
| v | Velocity |
| rpm | Revolutions per minute |
References
- Hill, A. The Heat of Shortening and the Dynamic Constants of Muscle. Proc. R. Soc. B. Biol. Sci. 1938, 126, 136–195. [Google Scholar]
- Jaric, S. Force-velocity Relationship of Muscles Performing Multi-joint Maximal Performance. Int. J. Sports Med. 2015, 36, 699–704. [Google Scholar] [PubMed]
- Schleichardt, A.; Badura, M.; Lehmann, F.; Ueberschär, O. Comparison of force-velocity profiles of the leg-extensors for elite athletes in the throwing events relating to gender, age and event. Sports Biomech. 2019, 20, 720–736. [Google Scholar] [CrossRef] [PubMed]
- Seck, D.; Vandewalle, H.; Decrops, N.; Monod, H. Maximal power and torque-velocity relationship on a cycle ergometer during accerlation phase of a single all-out exercise. Eur. J. Appl. Physiol. 1995, 70, 161–168. [Google Scholar] [CrossRef]
- Arsac, L.M.; Belli, A.; Lacour, J.R. Muscle function during brief maximal exercise: Accurate measurements on a friction-loaded cycle ergometer. Eur. J. Appl. Physiol. 1996, 74, 100–106. [Google Scholar] [CrossRef]
- Dorel, S.; Hautier, C.A.; Rambaud, O.; Rouffet, D.; Van Praagh, E.L. Torque and power–velocity relationships in cycling: Relevance to track sprint performance in world-class cyclists. Int. J. Sports Med. 2005, 26, 739–746. [Google Scholar] [CrossRef]
- Abbiss, C.R.; Peiffer, J.J.; Laursen, P. Optimal cadence selection during cycling. Int. J. Sports Med. 2009, 10, 1–15. [Google Scholar]
- Gardner, A.S.; Martin, J.C.; Martin, D.T.; Barras, M.; Jenkins, D.G. Maximal torque- and power-pedalling rate relationships for elite sprint cyclists in laboratory and field tests. Eur. J. Appl. Physiol. 2007, 101, 287–292. [Google Scholar] [CrossRef]
- Debraux, P.; Manolova, A.V.; Soudain-Pineau, M.; Hourde, C.; Bertucci, W. Maximal torque and power pedaling rate relationships for high level BMX riders in field tests. J. Sci. Cycl. 2013, 2, 51–57. [Google Scholar]
- Sargeant, A.J.; Hoinville, E.; Young, A. Maximal leg force and power output during short-term dynamic exercise. J. Appl. Physiol. 1981, 51, 1175–1182. [Google Scholar] [CrossRef]
- McCartney, N.; Heigenhauser, G.J.; Jones, N.L. Power output and fatigue of human muscle in maximal cycling exercise. J. Appl. Physiol. 1983, 55, 218–224. [Google Scholar] [CrossRef]
- Baron, R.; Bachl, N.; Petschnig, R.; Tschan, H.; Smekal, G.; Pokan, R. Measurement of maximal power output in isokinetic and non-isokinetic cycling. A comparison of two methods. Int. J. Sports Med. 1999, 20, 532–537. [Google Scholar] [CrossRef]
- Hirntzy, F.; Belli, A.; Grappe, F.; Rouillon, J.-D. Optimal pedalling velocity characteristics during maximal and submaximal cycling in humans. Eur. J. Appl. Physiol. 1999, 79, 426–432. [Google Scholar] [CrossRef]
- Bertucci, W.T.; Grappe, F. Differences between sprint tests under laboratory and actual cycling conditions. J. Sports Med. Phys. Fitness. 2005, 45, 277–283. [Google Scholar]
- McDaniel, J.; Behjani, N.S.; Elmer, S.J.; Brown, N.A.; Martin, J.C. Joint-specific power-pedaling rate relationships during maximal cycling. J. Appl. Biomech. 2014, 30, 423–430. [Google Scholar] [CrossRef]
- Rylands, L.; Roberts, S.; Hurst, H. Variability in laboratory versus field testing of peak power, torque and time of peak power production amongst elite BMX cyclists. J. Strength Cond. 2015, 29, 2635–2640. [Google Scholar] [CrossRef]
- Bozic, P.R.; Bacvarevic, B.B. Force-Velocity Profiles of Elite Athletes Tested on a Cycle Ergometer. Monten. Sports Sci. Med. 2018, 7, 59–66. [Google Scholar] [CrossRef]
- Rudsits, B.L.; Hopkins, W.G.; Hautier, C.A.; Rouffet, D.M. Force-Velocity test on a stationary cycle ergometer: Methodological recommendations. J. Appl. Physiol. 2018, 124, 831–839. [Google Scholar] [CrossRef]
- Martin, J.C.; Wagner, B.M.; Cyle, E.F. Inertial load method determines maximal cycling power in a single exercise bout. Med. Sci. Sports Exerc. 1997, 29, 1505–1512. [Google Scholar] [CrossRef]
- Wackwitz, T.A.; Minahan, C.L.; King, T.; Du Plessis, C.; Andrews, M.H.; Bellinger, P.M. Quantification of maximal power output in well-trained cyclists. J. Sports Sci. 2021, 39, 84–90. [Google Scholar] [CrossRef]
- Sanchez-Medina, L.; Perez, C.E.; Gonzalez-Badillo, J.J. Importance of the propulsive phase in strength assessment. Int. J. Sports Med. 2010, 31, 123–129. [Google Scholar] [CrossRef]
- Jovanović, M.; Flanagan, E. Researched applications of velocity based strength training. J. Aust. Strength Cond. 2014, 22, 58–69. [Google Scholar]
- Mann, J.B.; Ivey, P.A.; Sayers, S.P. Velocity-based training in football. Strength Cond. J. 2015, 37, 52–57. [Google Scholar] [CrossRef]
- Jaric, S. Two-Load Method for Distinguishing Between Muscle Force, Velocity, and Power-Producing Capacities. Sports Med. 2016, 46, 1585–1589. [Google Scholar] [CrossRef] [PubMed]
- Sašek, M.; Mirkov, D.M.; Hadžić, V.; Šarabon, N. The Validity of the 2-Point Method for Assessing the Force-Velocity Relationship of the Knee Flexors and Knee Extensors: The Relevance of Distant Force-Velocity Testing. Front. Physiol. 2022, 13, 849275. [Google Scholar] [CrossRef] [PubMed]
- Dunst, A.K.; Hesse, C.; Feldmann, A.; Holmberg, H.C. A novel approach to determine alactic timespan in the assessment of the maximal lactate accumulation rate in elite track cyclists. 2022; Under Review. [Google Scholar]
- Kordi, M.; Folland, J.; Goodall, S.; Barratt, P.; Howatson, G. Isovelocity vs. Isoinertial Sprint Cycling Tests for Power- and Torque-cadence Relationships. Int. J. Sports Med. 2019, 40, 897–902. [Google Scholar] [CrossRef] [PubMed]
- Dunst, A.K.; Grüneberger, R.; Holmberg, H.C. Modeling optimal cadence as a function of time during maximal sprint exercises can improve performance by elite track cyclists. Appl. Sci. 2021, 11, 12105. [Google Scholar] [CrossRef]
- Dunst, A.K.; Grüneberger, R. A Novel Approach of Modelling and Predicting Track Cycling Sprint Performance. Appl. Sci. 2021, 11, 12098. [Google Scholar] [CrossRef]
- Sargeant, A.J. Human Power Output and Muscle Fatigue. Int. J. Sports Med. 1994, 15, 116–121. [Google Scholar] [CrossRef]
| Publisher’s Note: MDPI stays neutral with regard to jurisdictional claims in published maps and institutional affiliations. |
© 2022 by the authors. Licensee MDPI, Basel, Switzerland. This article is an open access article distributed under the terms and conditions of the Creative Commons Attribution (CC BY) license (https://creativecommons.org/licenses/by/4.0/).


