Article

Evaluating Changes in Mental Workload in Indoor and Outdoor Ultra-Distance Cycling

1
Epiphanies LLP, Hopyard Farm, Glanbaiden, Govilon, Abergavenny NP7 9SE, UK
2
Faculty of Health & Wellbeing, University of Winchester, Sparkford Road, Winchester SO22 4NR, UK
3
Management School, The University of Sheffield, Conduit Road, Sheffield S10 1FL, UK
*
Author to whom correspondence should be addressed.
Sports 2022, 10(5), 67; https://doi.org/10.3390/sports10050067
Submission received: 10 January 2022 / Revised: 17 March 2022 / Accepted: 25 April 2022 / Published: 28 April 2022

Abstract

:
Whilst increasing mental workload has been shown to have a detrimental effect on cycling performance and more generally to increase the risk of harm, no studies have measured how mental workload changes as a function of ultra-distance cycling, indoors or outdoors. Our objective was to measure the difference in mental workload, as indicated by changes in EEG theta power, components of HRV and psychomotor vigilance and as reported using the ‘NASA Task Load Index questionnaire’, before and after a 5 h indoor ride and outdoor ride completed at 65% of functional threshold power. Results of the NASA-TLX indicated the mental demand of outdoor cycling to be significantly less than that of indoor cycling. There were significant differences in the PVT results between the pre and the post outdoor ride average and median response times. The slowest 10% PVT responses were significantly slower pre than post the indoor ride. There were significant differences in HRV between pre and post outdoor and indoor rides, specifically, in the average RR intervals, RMSSD (ms2), LFPower (ms2), NN50. There were modest changes in indicators of mental workload during an ultra-distance cycle ride. As such, mental workload during ultra-distance cycling is unlikely to be a contributory factor to decreases in performance or to an increased likelihood of accident and injury.

1. Introduction

Ultra-distance cycling, where rides typically comprise many hundreds of kilometres [1], are growing in popularity, as demonstrated by a year-on-year increase in the number of scheduled events listed in the Ultracycling calendar (www.ultracycling.com, accessed on 8 January 2022) and as reported in the press [2]. The mental workload requirements of ultra-distance cycling are unclear and, whilst mental workload has been extensively explored in, for example, driving [3] and flying [4], little attention has been given to ultra-distance cycling. This matters because of the potential negative impact on performance caused by an increase in mental/cognitive workload from cycling for a sustained period of time. Increases in mental workload over time can lead to errors due to inadequate monitoring of actions [5,6], whilst also increasing the likelihood of an accident or injury [3,7].
Mental workload or cognitive workload the terms are used synonymously is “…the level of attentional resources required to meet both objective and subjective performance criteria, which may be mediated by task demands, external support, and past experience” [8]. Mental workload cannot be separated from physical effort, as one does not occur in isolation from the other [9], and mental workload is created by complex decision taking, selective attention and vigilance over time [7]. Mental workload should not be confused with mental fatigue. The focus of this study was specifically on mental workload rather than on mental fatigue. What is meant specifically by mental fatigue is problematic. Mental fatigue can occur from task underload (e.g., boredom) as well as overload ([7], and a high workload does not necessarily lead to fatigue if the rewards associated with the task are high [5,10]. Mental fatigue also depends on the perception of the task [10]. In contrast, mental workload reflects the attentional resources required to meet the demands of the task [8,11] without making any statement as to whether the participants found the experience fatiguing. Hence, the measurements used in this study are indicative of mental workload but do not infer fatigue.
Central to the concept of mental workload is the notion of limited mental resources; once the demands of a task exceed available mental resources, performance decreases [12] and task failure is more likely to occur [11]. Because the parts of the brain associated with a sense of effort are also those involved in cognitive exertion and fatigue during submaximal muscle exertion [13], the mental resources used up by mental workload reduce the capacity available for physical effort, given that attentional resources are finite [7]. For these reasons, increases in mental workload can decrease athletic performance [14,15]; hence, for the ultra-distance cyclist, increases in mental workload could lead to decreases in performance, mistakes, and increased likelihood of accident and injury.
Research investigating mental workload using cycling as the medium tends to be laboratory-based, examining performance in a secondary task following performance in a primary task [16]. For example, the distance covered in a self-paced cycling time trial was measured (primary task) before measuring performance in a Stroop Test (secondary task), where the performance in the secondary task indicated the extent to which cognitive resources were utilised by the primary task [17,18]. Typical tasks used to generate mental workload or to measure the impact of the primary task include the ‘Simon Task’ [19] and the Stroop Test [20]. These replicate neither the duration of ultra-distance cycling events, nor, prima facie, the complexity of cycling on public roads. They nonetheless provide useful insights. For example, mental workload is affected by the level of expertise in the primary task. Professional cyclists were better able to cope with mental workload demands (caused by a pre-trial Stroop Test) than were recreational cyclists in terms of the distance covered in a 20 min time trial, as reported by studies cited in [21].
In addition to experience, the duration of the primary task may also reduce the level of the mental workload experienced. For example, one of the limitations of short duration activities is that experimental sessions where the primary task lasts less than 2 h can demonstrate an adverse impact on cognitive performance, but this impact can level out and even reduce in longer duration experimental sessions [22]. If an ultra-distance cycle ride followed the same pattern, there may be no noticeable change in mental workload after an ultra-distance cycle ride, when compared to pre-ride levels.
Most research investigating mental workload in cycling is laboratory-based (e.g., [17,18]. Ultra-distance cycling events are typically outdoors on public roads or off-road on publicly accessible trails [23]. These are very different environments to the laboratory. Outdoors, riders have to cope with navigation, weather, terrain and other road users, factors which have been shown to have an effect on the mental workload experienced by drivers of motor vehicles [3,24,25]. In a laboratory setting, there are no such threats. By measuring the mental workload required for ultra-distance cycling in a laboratory setting, it may be possible to compare the results to those of mental workload involved in shorter duration cycling. By measuring the mental workload required for ultra-distance cycling in an outdoors setting, the data obtained will be more representative of ultra-distance cycling and also help determine whether the mental workload involved in ultra-distance cycling in the laboratory compares with that associated with ultra-distance cycling in a more realistic setting. Thus, the aim of this research was to both determine the changes in mental workload as a function of ultra-distance cycling in both an outdoor and an indoor (laboratory) setting. Specifically, we asked: What is the mental workload demand of ultra-distance cycling in a field setting? How does this compare with the mental workload demand of ultra-distance cycling in a laboratory setting?

2. Methods

We opted to use the time spent cycling at a specified level of effort as the best way of ensuring results were comparable. A riding time of 5 h was selected, as this was estimated to be the maximum duration not requiring a micturition stop if participants were encouraged. In the absence of research on urinary frequency in trained cyclists during ultra-endurance rides, the average voiding frequency rates were assumed to be between 4 and 7 times a day, i.e., approximately every 3.5 to 6 h [26]. In 5 h, participants should be expected to cover between 120 km to 145 km before needing to urinate [27].
It is not known whether ultra-distance athletes exerting different levels of effort experience different amounts of mental workload over ultra-distances. Therefore, in order to ensure a meaningful comparison both within and between participants, it is necessary to establish a common level of effort. In the absence of evidence of the typical effort required for ultra-distance cycling, the choice of effort was based on the lead author’s experience of participation in ultra-distance races, where 65% of Functional Threshold Power (FTP) [28] is used as the maximum sustainable effort over hundreds of kilometres. Bikes fitted with a power meter enable the rider to moderate their effort to sustain a consistent power output [29].
Thus, this study sought to (1) measure mental workload changes before and after 5 h of continuous cycling effort at 65% FTP in a field setting (i.e., on public roads) and (2) compare the response in a field setting to that observed in a laboratory setting.

2.1. Participants

A power calculation was performed with input variables which compared performance in a 20 km time trial following a rapid information visual processing (RVP) test with performance in a 20 km time trial without the RVP test [17]. A minimum of seven participants were required in order to achieve a power of 0.95, with an alpha error of 0.05 and a large effect size (0.65).
Eleven male cyclists (mean age 47.8, SD 6.9 years), self-declared as healthy, were recruited from the local community using snowball sampling [30,31,32]. It was anticipated that a greater number of participants than the average would drop out before completion of all the tests, given the demanding nature of the tests involved. In a meta-analysis of drop-out rates, an anticipated drop-out of 11.5% was determined [33]. All participants met the definition of a ‘trained’ or ‘well trained’ cyclist [34]. Participants were asked to refrain from exercise for 72 h prior to all tests and to avoid alcohol and caffeine for 24 hours prior to all tests [35].

2.2. Measures

Because of its many interrelated facets, mental workload cannot be measured directly; instead it has to be inferred from what can be measured [9]. Mental workload can be measured subjectively, for example using the NASA Task Load Index questionnaire (NASA-TLX) [36]. It can also be inferred from psychophysiological measures [7,37]. The advantage of these psychophysiological measures is that they are largely outside the control of the individual and therefore remove the subjectivity of participant perception [38].
Given the time involved, the effort expended by the participants and the context in which this study took place, four measurements were used to infer mental workload. This provided an opportunity both to triangulate the results and to mitigate the risk of one or more measurements failing. These measures were heart rate variability (HRV), theta brain wave power, psychomotor vigilance and subjective assessment, as measured by the NASA-TLX questionnaire. The choice of measures used to infer mental workload was governed primarily by the constraints of the outdoor environment in which the research took place. The following principles were applied:
  • The assessment methods cannot compromise the safety of the rider, for example obscuring their view or requiring them to forgo the use of safety equipment such as a helmet.
  • Any device used does not compromise the participant’s ability to ride their bicycle as they would normally.
  • The technology needs to have sufficient battery capacity to last the duration of each test.
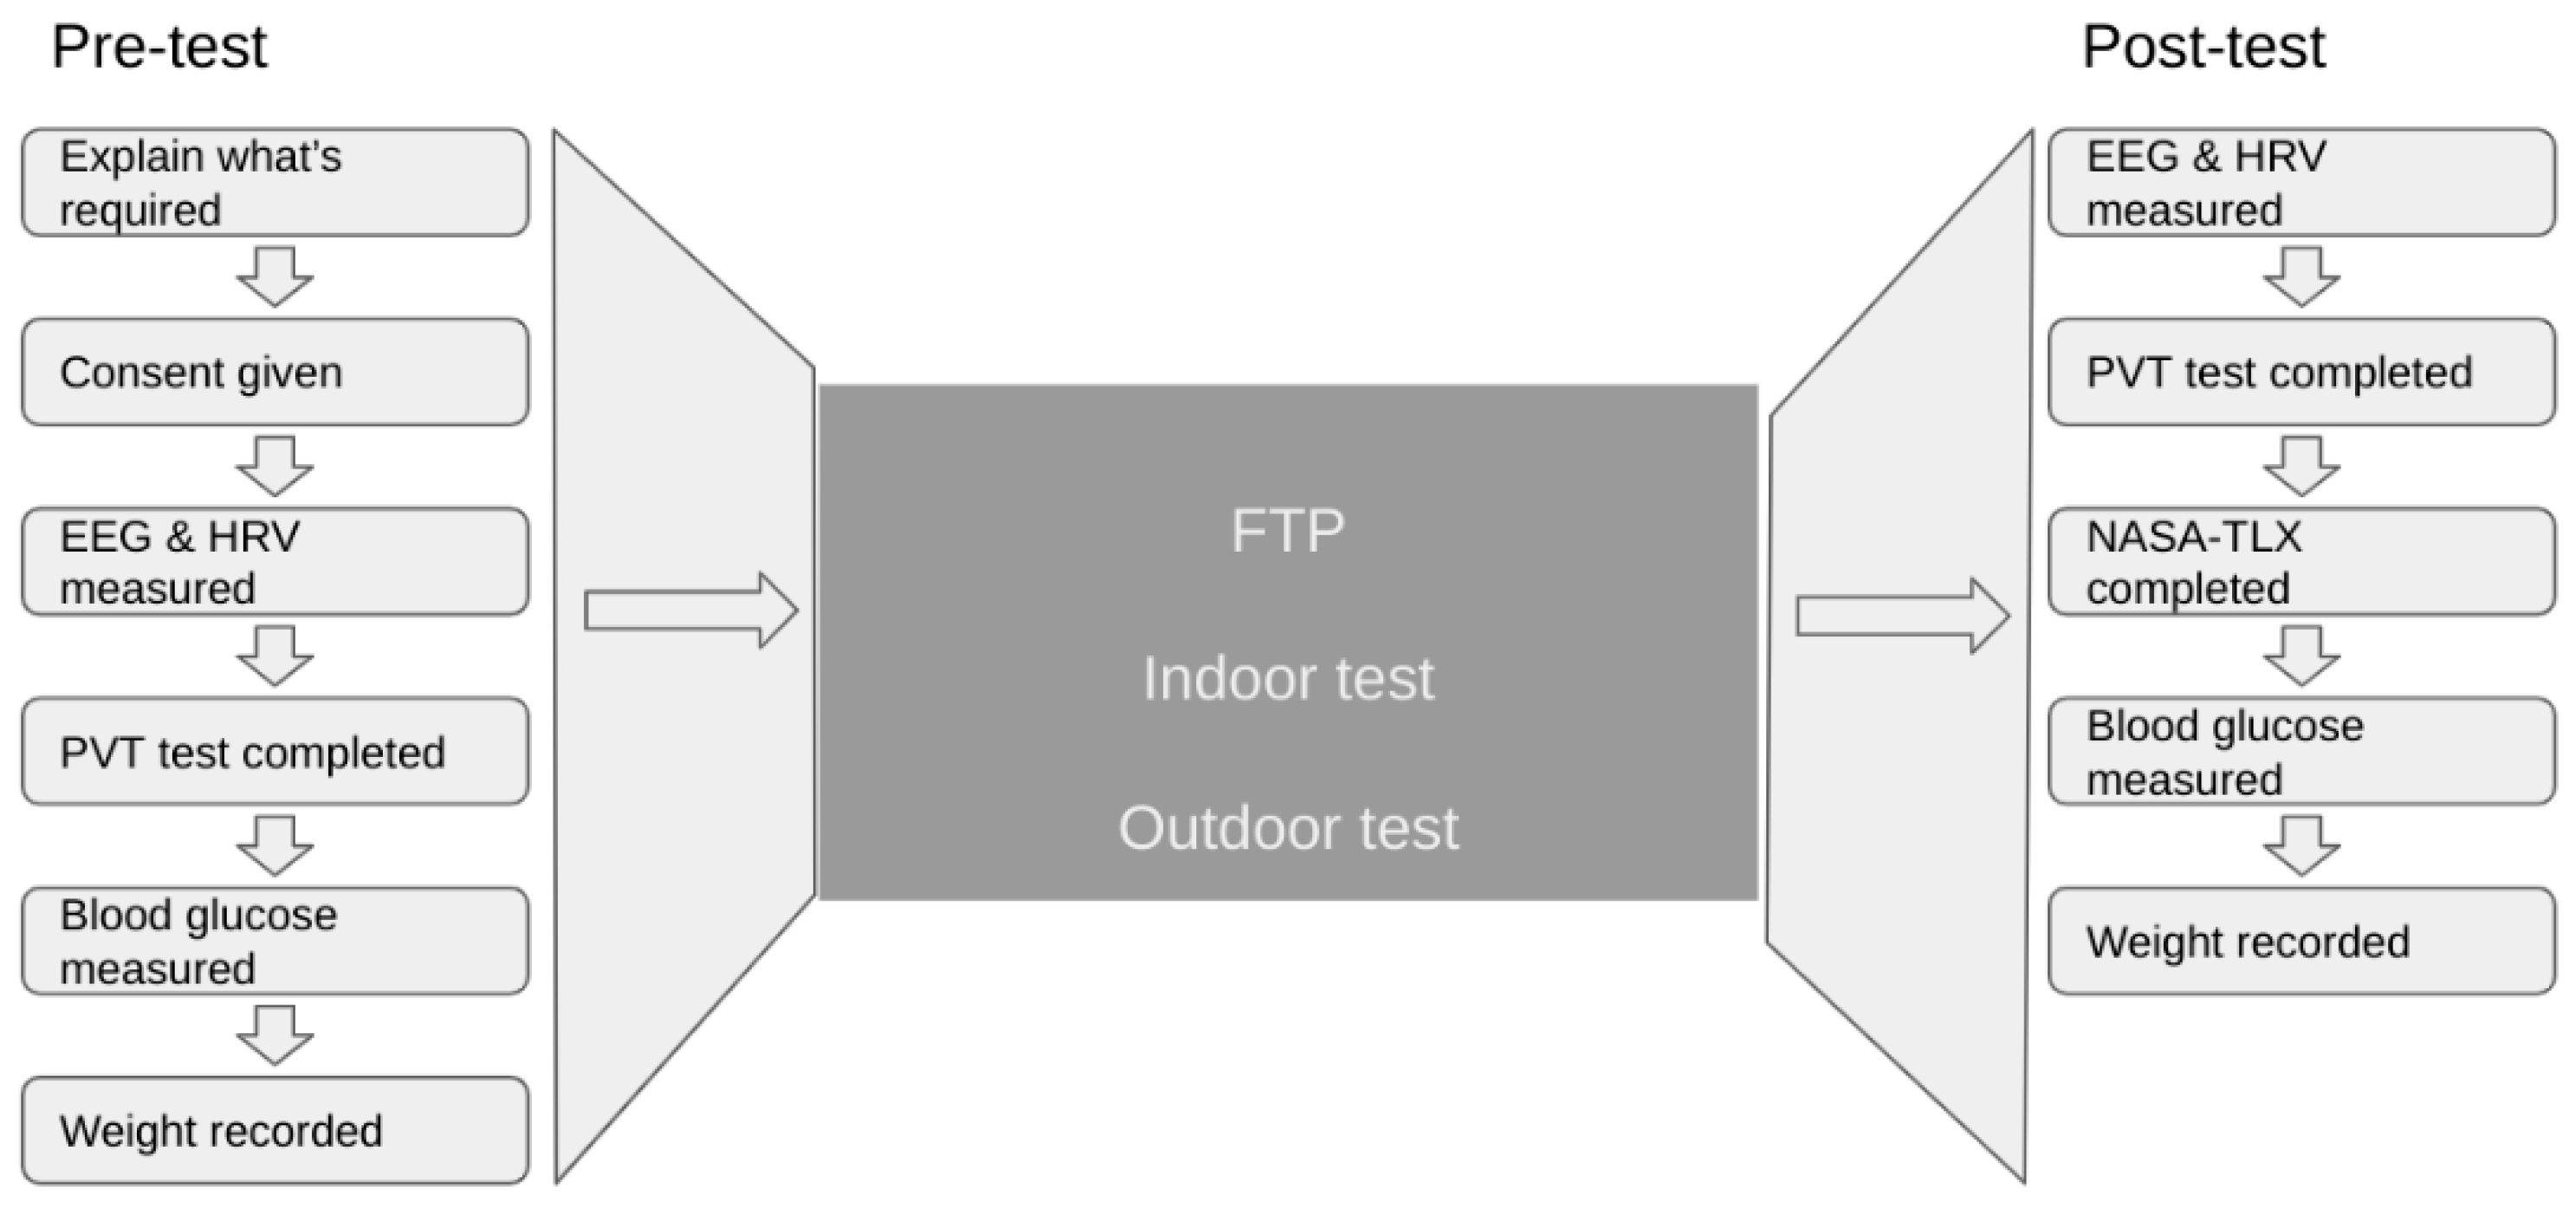
  • The equipment needs to be usable in a support vehicle at the end of each of the outdoor tests. EEG, PVT and NASA-TLX cannot easily be measured whilst the participant is cycling, therefore pre and post measurement of mental workload was chosen.
  • The delay between the end of the task and data recording should be minimized to reduce the period of recovery to a minimum.
EEG, PVT and NASA-TLX cannot easily be measured whilst the participant is cycling, as trying to gather a usable EEG signal from an athlete working hard, sweating, moving along at speeds up to 50 kph on public highways whilst wearing a safety helmet was untenable. Sweat bridges across electrodes would mean the number of artifacts in the data would result in unusable data. Similar constraints apply to conducting a vigilance test on a moving participant. Had we stopped the participant mid ride, we would no longer be measuring an endurance effort but rather a series of non-ultra-endurance rides interspersed with short rest periods. Therefore pre and post measurement of mental workload was chosen. Cycling and non cycling studies (e.g., [17,21,39,40]) have demonstrated that it is possible to measure mental workload after the primary task has finished.

2.3. EEG

Brain wave activity, as recorded by an electroencephalogram (EEG), is the most studied indicator of mental workload [6]. There is a strong relationship between EEG frequency-domain measures of cortical activation and mental workload, specifically an increase in power in the theta band (5–7 Hz) [7,11,24,41]. Theta activity also increases with the degradation of performance as a function of boredom [7], which could be a factor in ultra-distance cycling.
EEG was recorded using a MUSE headset (InteraXon Inc., Toronto, ON, Canada), a 4-channel device: AF7, AF8, TP9 and TP10 (with reference electrode Fpz). The MUSE headset is a convenient EEG device particularly suited to ecologically valid research [42,43,44]. The muse headset has been shown to be valid and reliable [45].

2.4. HRV

Cardiac activity is also one of the most commonly used measures in assessing mental workload [11,46,47,48], there being much evidence to support a direct link between cardiac activity and cognitive processing [49,50]. The NN.Mean, PNN50, total spectrum power and low frequency were the key measures for detecting mental fatigue (here used as a synonym of mental workload), specifically, RMSSD was positively associated with mental fatigue, whilst PNN50 and NN.Mean were negatively associated with mental fatigue [40]. The same measures of HRV that indicate mental workload (e.g., HF, SDNN, RMSSD) also change as a function of exercise [51,52,53]. Variations in the speed of HRV recovery exist, as well-trained endurance athletes recover faster in the first few minutes than non-well-trained individuals [51]. HRV can also vary depending on the level of effort expended as a function of changes in terrain [54], hence asking well-trained participants to maintain a constant effort. It was anticipated that the impact of the exercise undertaken in the current study would induce a significant reduction in HRV. HRV recovery is delayed after prolonged exercise duration [53]. As a result, a change in HRV is not necessarily indicative of an increase in workload but, when taken in conjunction with changes in theta brain wave power, vigilance and the results of the NASA-TLX, it will demonstrate whether ultra-distance cycling induces mental workload.
Concurrent with the EEG recording, HRV data were collected following the protocol outlined by [55]. Breathing was paced using a visual cue at 0.1 Hz using the ‘Breathe+’ app Breathe+ Simple Breath Trainer (Dynamic App Design LLC, www.dynamicdesign.com, accessed on 8 January 2022), whilst seated, with data collected for 5 min. The MUSE headset was set up in approximately 2 min, keeping to a minimum pre-data collection post ride recovery. HRV was captured using a Cardiosport TP5 chest band (Cardiosport, Waterlooville, Hampshire, UK), and the data was recorded on a Garmin 1030 head unit (Version 9.50; Garmin, Schaffhausen, Switzerland).

2.5. Vigilance

One element of cognitive performance is being able to maintain sustained focus on a task, referred to as vigilance [56,57]. Vigilance is measured in terms of reaction times and/or the number of errors made, which are referred to as vigilance decrement [58,59]. Measures of fatigue include lapses, where the participant fails to respond within 500ms, the average reaction time, and the fastest and slowest 10% of reaction times [60]. The method used for measuring vigilance was a psychomotor vigilance test (PVT) [61]. Vigilance is affected by circadian modulation [61] and a lack of sleep [62,63,64]. Psychomotor vigilance was recorded using the ‘Vigilance Buddy’ app (Research Buddies, Apple App Store) on a 6th generation iPad (Apple Inc., Cupertino, CA, USA). A touch screen psychomotor vigilance task was assessed and validated [60,65]. Participants were instructed to use the index finger of their dominant hand, whilst holding the iPad in landscape mode to tap the screen as soon as the stimuli appeared. The stimulus was a timer that counted up in milliseconds from 0 and stopped once the screen had been touched. The time at which the screen was touched was displayed for 1s. The maximum gap between each presentation of the stimulus was 3500 ms and the minimum was 500 ms. The duration of the test was 5 min.

2.6. NASA-TLX

The ‘gold standard’ of subjective measures of mental workload is the NASA-TLX [24,36,66,67,68,69]. NASA-TLX correlates significantly with cardiovascular and neurophysiological indicators of mental workload. The suitability of the NASA-TLX was used to assess mental workload in sport, specifically in swimming, although the duration of the test was considerably less than that of ultra-distance cycling [68].
The participants completed a NASA-TLX questionnaire on the iPad using the NASA-Task Load Index app (Human Systems Division, NASA, United States Government). Moroney et al. (1992, cited in [70]) demonstrated that a 15-minute delay between the task and test does not significantly interfere with the ratings given by participants. For this reason, the questionnaire was completed following the collection of HRV, EEG and PVT data, completion of which took ~15 min once the participant had completed each of the cycling tests.

2.7. Cycling Conditions

On their first session, on completion of EEG, HRV and PVT measurements, all participants completed an FTP test. This was followed by measurement of EEG, HRV and PVT and, in addition, the completion of a NASA-TLX questionnaire. The FTP result was used to determine the watts at which the subsequent sessions would be completed, and the other measurements were conducted to familiarize the participants with the procedure. In their second and third sessions, EEG, HRV and PVT measurements were taken, and then the participants completed either a 5 h continuous indoor ride at 65% of FTP (indoor ride) or an outdoor continuous 5 h ride at 65% of FTP (outdoor ride) followed by the measurement of EEG, HRV and PVT and the completion of the NASA-TLX questionnaire. The second and third sessions were performed in a counterbalanced order after random designation of the first participant. See Figure 1 for a summary of the process.
For the FTP test and the 5 h indoor ride, the bike was attached to a Wahoo Kickr Smart Trainer (Wahoo Fitness, Atlanta, GA, USA) set in resistance mode. Both the FTP test and the indoor ride were controlled using the app ‘TrainerRoad’ (Peaksware LLC, Boulder, CO, USA) loaded onto the iPad, with the screen, visible to the participant, displaying actual, average and target power, cadence and heart rate.
Up to three cooling fans were available for participants, if required. Reliable and valid power data over a broader and more appropriate range than the Kickr can be achieved using PowerTap P1 pedals; hence these were chosen. The PowerTap P1 pedals were validated [71,72,73] against a Scientific SRM system, and it was concluded they are a valid and reliable device to measure power output in cyclists, at power levels between 150 w and 350 w, with a cadence of 70 rev·min−1 [71,72]. This range of power covered the range of FTP of the participants.
Science In Sport (SIS, London, UK) energy bars, gels, energy drink and water were available ad libitum. These were placed next to the participant during the indoor ride, the gels and bars were placed in a bag on the top tube of the bike and the bottles in bottle cages for the participants during the outdoor ride. The participants were encouraged to consume between 60 and 90 g of carbohydrates per hour to ensure they were adequately fuelled throughout the ride. Blood sugar levels provide an indication of whether the participants had consumed adequate energy and were measured pre and post all tests using a Braun Omnitest 3 (Proctor and Gamble, Cincinnati, OH, USA). The participants were weighed pre and post-test, and the differences compared to provide an indication of hydration maintenance. All participants consumed the required amount of energy and fluid [73].
For the FTP test and the indoor ride, the participants followed a predefined session using Trainer Road. In this software, a workout can be programmed for a specific duration at a designated power output. TrainerRoad connects via Bluetooth to the Wahoo Kickr, PowerTap P1 pedals, Cardiosport heart rate strap and cadence sensor and displays the data received from each device.
The indoor ride included a 5 min warm up to the target power output. During the outdoor ride, the mean power output and actual power output were displayed on a Garmin 1030, alongside a map of the route. The outdoor ride route was 45 km, with 366 m of ascent. The participants cycled around the loop multiple times until 5 h of total riding were completed. At this point, a safe place was identified, and the participant stopped, dismounted from their bike and were seated in a vehicle. HRV, EEG, PVT, NASA-TLX, blood glucose and body mass were measured. Participants used their own bike for all tests.
The start point for the outdoor test was also the location for the FTP test and indoor ride. The test location was a well-lit, non-airconditioned room, maintained at a minimum of 15 °C. The walls were plain white, and the windows were translucent. A minimum rest period of 72 h was required between each test to allow time for adequate recovery [74]. The gap between the trials was on average 10 days. In addition to establishing each participant’s FTP, attendance for the FTP test was used as an opportunity to familiarize the participants with the experimental procedure.
Other than the iPad, no other electronic devices or music were available to the participants during the rides, and conversation with the participants was avoided. Because PVT is affected by circadian modulation [62], the tests started between 8 a.m. and 12 p.m. The participants reported the perceived quality of the previous night’s sleep on a scale of 1 to 5, where 1 was “slept very badly, hardly at all” and 5 was “great night’s sleep, feeling very rested.” No participant reported a score lower than 3.

2.8. Statistical Analysis

Descriptive statistics are reported as means and standard deviations; 95% confidence intervals of the differences between post and pre indoor ride and outdoor ride were calculated to detect significant changes.
EEG data were analysed using EEGLAB (Swartz Center for Computational Neuroscience, 9500 Gilan Dr, Dept 0523, La Jolla, CA 92083, USA). Bandpass filters <1 Hz and >30 Hz were applied, as was a notch filter at 50 Hz. Artifact rejection was set at 75 microvolts. The power for theta band was calculated using Fast Fourier Transformation (FFT). The obtained power values were averaged across the data collection period [6,41]. In the analysis of the PVT results, reaction times ≤100 ms (less than the anticipation time) were excluded from further analysis for each participant. Reaction times exceeding 500 ms were treated as lapses. EEG, HRV and PVT were analysed by applying a two-way (22) repeated-measures ANOVA to examine the differences between pre and post ride and outdoor and indoor ride. The Huynh–Feldt correction was applied. The statistical analysis was conducted using SPSS software, version 27.0. A 5% significance level was adopted in all tests.

3. Results

Body mass was a little lower at the end of the tests than it was at the beginning (mean change in weight [pre indoor ride − post indoor ride] = 0.4 kg, SD = 1.25; mean change in weight [pre outdoor ride post outdoor ride] = 0.7 kg, SD = 0.82). Blood glucose increased by the end of the test (mean change in blood glucose [pre indoor ride − post indoor ride] = −2.34 mmol, SD = 1.72; mean change in blood glucose [pre outdoor ride − post outdoor ride] = −1.4 mmol, SD = 2.16). The average distance covered in the outdoor test was 127.2 km. Whereas the indoor test involved no stopping, during the outdoor ride, the average time stopped (at junctions or road works) was 25 s, during an average ride duration of 04:59:34. The variation from the required effort by the participants was −0.2 W for the indoor ride and −0.7 W for the outdoor ride. This represents 0.4% variation from the average target power output. There was no significant difference (p = 0.05) between the average power in the indoor ride and that in the outdoor ride (mean outdoor ride power 169.1 W ± SD 40.3; mean indoor ride power 168.5 W ± SD 40.7).
There was a significant decrease in the mental demand component of the NASA-TLX in the outdoor session compared to the mental demand in the indoor session (outdoor ride mean = 164.55 a.u., SD = 114.94; indoor ride mean = 319.55, SD = 125.60, t(10) = −3.231 p < 0.009).
One participant stopped once during the indoor ride to micturate. Another participant stopped three times during the indoor ride to micturate. Analysis of the results revealed for the second of these participants an indoor frustration score on the NASA-TLX of 400. This score contrasts with that of all other participants, for whom the average was 5. Another participant failed to complete their first indoor ride attempt (possibly due to inadequate intake of energy), completing it later in a second attempt, after which a very low mental demand score on the indoor ride (70) was recorded, compared to that of the remaining participants, for whom the average was 344.5. This suggests that familiarisation with the task may have helped with the perceived mental demand of the task. When participants 5 and 9 were excluded from the analysis, there was a significant decrease in mental demand in the outdoor session, compared to the mental demand in the indoor session (outdoor ride mean = 195 a.u., SD = 102.9, indoor mean = 337.33, SD = 105.24, t(8) = −2.672 p = 0.028). This suggests that indoor cycling was perceived as more mentally demanding than outdoor cycling. There were some differences recorded, specifically for the temporal, performance, effort and frustration scores on the NASA-TLX questionnaire, which were lower for the outdoor ride than for the indoor ride. In contrast, physical demand was greater for the outdoor ride than for the indoor ride. Taking all dimensions of the NASA-TLX together, there was a significant decrease in the weighted average in the outdoor session compared to the weighted average in the indoor session (outdoor ride mean = 48.88, SD = 18.44; indoor ride mean = 64.85, SD = 11.95, t(10) = −2.378 p = 0.039).
There were no significant interactions between outdoor/indoor ride and pre/post ride for any of the measures. For theta power, there was a significant main effect pre and post ride: F(1,10) = 4.97, p = 0.05. For components of HRV, there were significant main effects pre and post ride for the following: average RR intervals F(1,8) = 165.55, p = 0.000. RMSSD(ms2) F(1,8) = 10.06, p = 0.013. NN50 F(1,8) = 26.92, p = 0.001. LFPower(ms2) F(1,8) = 5.57, p = 0.046. LF:HF Ratio F(1,8) = 21.21, p = 0.002. There was no significant effect for Total Power. In the PVT results, there were significant main effects pre and post ride for the following: median score F(1,10) = 11.28, p = 0.007, slowest score F(1,10) = 5.71, p = 0.038, slowest 10% F(1,10) = 9.58, p = 0.011.
Subsequent post hoc analysis suggested an increase in theta power post indoor session (mean = 3.8, SD = 1.05) compared to pre indoor session (mean = 3.38, SD = 1.81, but this was not significant, t(10) = 0.665, p = 0.052). There was an increase in theta power post outdoor session (mean = 4.43, SD = 1.73) compared to pre outdoor session (mean = 3.18, SD = 0.72). The difference, however, was not significant (t(10) = 2.219 p > 0.051). There were significant differences in the average slowest 10% of responses in the PVT between post indoor ride and pre indoor ride t(10) = −3.992, p = 0.003. There were significant differences between post outdoor ride and pre outdoor ride responses for the average PVT response, t(10) = −2.708 = 0.022, and the median PVT response, t(10) = −3.166, p = 0.01. There were significant differences pre versus post indoor in the slowest 10% of responses t(10) = −3.992, p = 0.003 t(10) = −3.992, p = 0.003.
For HRV, there were significant results post and pre ride for both the indoor and the outdoor rides. Post versus pre indoor ride: mean RR versus pre indoor ride RR t(7) = −27.39, p = 0.000; RMSSD (ms2) t(7) = −4.54, p = 0.003. NN50 versus t(7) = −3.80, p = 0.007; LF Power(ms2) t(7) = −4.07, p = 0.005.;Total Power (ms2) t(7) = −3.81, p = 0.007. Indoor versus outdoor pre-ride LF/HF ratio t(7) = 2.95, p = 0.022. Post versus pre outdoor ride: mean RR versus pre indoor ride RR t(7) = −22.52, p = 0.000; RMSSD (ms2) t(7) = −3.98, p = 0.005. NN50 versus t(7) = −4.04, p = o.005; LF Power (ms2) t(7) = −3.13, p = 0.017; Total Power(ms2) t(7) = −2.91, p = 0.023. There were no significant differences between the indoor and outdoor post-ride measures.

4. Discussion

Both 5 h indoor rides and outdoor rides generated significant differences in physiological indicators of mental workload. The changes in HRV would be expected as a function of exercise, as well as mental workload, and so these significant changes alone are insufficient evidence of mental workload. The decrease in the slowest 10% of responses in the post indoor and outdoor rides indicates some increase in mental workload as does the decrease in the median response in the post outdoor ride compared to the pre outdoor ride. However, when taken in conjunction with the lack of changes in theta power, the conclusion is that the increase in mental workload was slight. Given these modest changes, the implication for the ultra-distance cyclist is that mental workload is unlikely to be a contributory factor to decreases in performance or to an increased likelihood of accident and injury. The perception of higher mental workload during the indoor ride, as measured using the NASA-TLX, was not matched by physiological changes recorded through EEG, theta power or PVT, as there were no significant differences between the outdoor rides and the indoor rides in these variables. These findings do not replicate research investigating shorter duration cycling efforts, e.g., 20 km time trials [17]; however, they are more in line with the findings that cognitive performance may reach a steady state or even improve over a 2 h period [22].
The perception of greater mental workload indoors when compared to outdoors, as indicated in the NASA-TLX data, may be explained by the attention restoration effect due to the natural environment in which the outdoor ride took place [75,76,77,78]. Two participants reported that they enjoyed the outdoor ride because the route was prescribed. Thus, in riding outdoors, there may have been a restorative effect on cognitive load. In contrast, the indoor ride was daunting because it greatly exceeded the amount of time any of the participants had previously spent cycling indoors, despite the fact that all riders used an indoor bike as part of their regular training programme. In addition, the use of music and/or video is commonplace when cycling indoors, and their absence may have had an impact on the perception of effort [79]. Music has been shown to increase parasympathetic activity [80], which might have reduced the difference in the mental demand score between the indoor ride and the outdoor ride. The protocol for recording HRV may have accelerated recovery as a function of breathing at 0.1 Hz, a frequency known to maximise the resonant frequency of HRV [81] and thus accelerate the parasympathetic response. This may have resulted in a more relaxed state, restoring theta power and HRV to their pre-ride levels and in turn resulting in a similar PVT response. Ultra-distance events typically involve cycling for periods substantially greater than the test duration used in this study (5 h). The limited impact on mental workload found in this study could be because the test duration was too short.

5. Conclusions

In the literature on mental workload in cycling, this study is unique in that its conclusions are based on a duration, distance and environment that reflect the milieu of the ultra-distance cyclist. Previous research into mental workload in cycling has tended to be laboratory-based and for shorter durations. Cycling for a period of 5 h, continuously at 65% of FTP, generates a limited measurable increase in mental workload as indicated by the pre and post ride measurement of theta brain wave power, psychomotor vigilance, and the post ride assessment of mental workload reported using the NASA-TLX.
The changes in HRV are commensurate with those expected from exercise but on their own insufficient to attribute them to the effects of mental workload. This contrasts with other modes of transport such as driving or flying, where increases in mental workload over time can lead to errors and increase the likelihood of an accident or injury. The findings from this research suggest that, from a mental workload perspective, activities such as ultra-distance cycling are not demanding.

Author Contributions

Conceptualization D.I., S.A.J. and J.P.W.; data curation, D.I.; formal analysis, D.I.; investigation, D.I.; methodology, D.I., S.A.J. and J.P.W., project administration, D.I.; writing original draft, D.I.; writing-reviewing and editing D.I., S.A.J. and J.P.W. All authors have read and agreed to the published version of the manuscript.

Funding

This research was funded by Epiphanies LLP, 5 Hawksworth St, Ilkley, West Yorkshire LS29 9DU.

Institutional Review Board Statement

The study was conducted according to the guidelines of the Declaration of Helsinki and approved by the Ethics Committee) of The University of Winchester, Faculty of Health and Wellbeing Ethics Committee (Approval Code: BLS/19/17).

Informed Consent Statement

Informed consent was obtained from all subjects involved in the study.

Data Availability Statement

The data presented in this study are available on request from the corresponding author. The data are not publicly available due to commitments made in accordance with consent provided by participants.

Acknowledgments

We gratefully acknowledge the contribution of Luis Fernando Ciria Perez in coding for the analysis of EEG data. The authors would like to thank all the participants who volunteered so much of their time to take part in the study.

Conflicts of Interest

The authors declare no conflict of interest.

References

  1. Jobson, S.; Irvine, D. Ultra-Distance Cycling: An Expert Guide to Endurance Cycling; Bloomsbury Publishing: London, UK, 2017; ISBN 9781472919892. [Google Scholar]
  2. Van Mead, N. Rise of the Ultra-Cyclists: A New Breed of Riders Go the Distance. The Guardian. 31 May 2018. Available online: https://www.theguardian.com/environment/bike-blog/2018/may/31/rise-ultra-cyclists-london-wales-london-audax (accessed on 3 November 2021).
  3. Stuiver, A.; Brookhuis, K.A.; de Waard, D.; Mulder, B. Short-Term Cardiovascular Measures for Driver Support: Increasing Sensitivity for Detecting Changes in Mental Workload. Int. J. Psychophysiol. 2014, 92, 35–41. [Google Scholar] [CrossRef] [PubMed]
  4. Deluca, J. Fatigue, Cognition and Mental Effort. In Fatigue as a Window to the Brain; MIT Press: Cambridge MA, USA, 2005; pp. 17–52. ISBN 9780262042277. [Google Scholar]
  5. Boksem, M.A.S.; Tops, M. Mental Fatigue: Costs and Benefits. Brain Res. Rev. 2008, 59, 125–139. [Google Scholar] [CrossRef] [PubMed] [Green Version]
  6. Puma, S.; Matton, N.; Paubel, P.-V.; Raufaste, É.; El-Yagoubi, R. Using Theta and Alpha Band Power to Assess Cognitive Workload in Multitasking Environments. Int. J. Psychophysiol. 2018, 123, 111–120. [Google Scholar] [CrossRef] [PubMed]
  7. Lal, S.K.L.; Craig, A. A Critical Review of the Psychophysiology of Driver Fatigue. Biol. Psychol. 2001, 55, 173–194. [Google Scholar] [CrossRef]
  8. Young, M.S.; Brookhuis, K.A.; Wickens, C.D.; Hancock, P.A. State of Science: Mental Workload in Ergonomics. Ergonomics 2015, 58, 1–17. [Google Scholar] [CrossRef]
  9. Pant, R.; Taukari, A.; Sharma, K. Cognitive Workload of Air Traffic Controllers in Area Control Center of Mumbai Enroute Airspace. J. Psychosoc. Res. 2012, 7, 279–284. [Google Scholar]
  10. Hockey, R. The Psychology of Fatigue: Work, Effort and Control. In The Psychology of Fatigue: Work, Effort and Control; Cambridge University Press: Cambridge, UK, 2013. [Google Scholar]
  11. Jaquess, K.J.; Gentili, R.J.; Lo, L.-C.; Oh, H.; Zhang, J.; Rietschel, J.C.; Miller, M.W.; Tan, Y.Y.; Hatfield, B.D. Empirical Evidence for the Relationship between Cognitive Workload and Attentional Reserve. Int. J. Psychophysiol. 2017, 121, 46–55. [Google Scholar] [CrossRef] [Green Version]
  12. Ranchet, M.; Morgan, J.C.; Akinwuntan, A.E.; Devos, H. Cognitive Workload across the Spectrum of Cognitive Impairments: A Systematic Review of Physiological Measures. Neurosci. Biobehav. Rev. 2017, 80, 516–537. [Google Scholar] [CrossRef] [Green Version]
  13. Zering, J.C.; Brown, D.M.Y.; Graham, J.D.; Bray, S.R. Cognitive Control Exertion Leads to Reductions in Peak Power Output and as Well as Increased Perceived Exertion on a Graded Exercise Test to Exhaustion. J. Sports Sci. 2017, 35, 1799–1807. [Google Scholar] [CrossRef]
  14. Impellizzeri, F.M.; Rampinini, E.; Coutts, A.J.; Sassi, A.; Marcora, S.M. Use of RPE-Based Training Load in Soccer. Med. Sci. Sports Exerc. 2004, 36, 1042–1047. [Google Scholar] [CrossRef]
  15. Boksem, M.A.S.; Meijman, T.F.; Lorist, M.M. Mental Fatigue, Motivation and Action Monitoring. Biol. Psychol. 2006, 72, 123–132. [Google Scholar] [CrossRef] [PubMed]
  16. Marquart, G.; Cabrall, C.; de Winter, J. Review of Eye-Related Measures of Drivers’ Mental Workload. Procedia Manuf. 2015, 3, 2854–2861. [Google Scholar] [CrossRef] [Green Version]
  17. Pires, F.O.; Silva-Júnior, F.L.; Brietzke, C.; Franco-Alvarenga, P.E.; Pinheiro, F.A.; de França, N.M.; Teixeira, S.; Meireles Santos, T. Mental Fatigue Alters Cortical Activation and Psychological Responses, Impairing Performance in a Distance-Based Cycling Trial. Front. Physiol. 2018, 9, 227. [Google Scholar] [CrossRef] [PubMed] [Green Version]
  18. Franco-Alvarenga, P.E.; Brietzke, C.; Canestri, R.; Goethel, M.F.; Hettinga, F.; Santos, T.M.; Pires, F.O. Caffeine Improved Cycling Trial Performance in Mentally Fatigued Cyclists, Regardless of Alterations in Prefrontal Cortex Activation. Physiol. Behav. 2019, 204, 41–48. [Google Scholar] [CrossRef]
  19. Möckel, T.; Beste, C.; Wascher, E. The Effects of Time on Task in Response Selection An ERP Study of Mental Fatigue. Sci. Rep. 2015, 5, 10113. [Google Scholar] [CrossRef] [Green Version]
  20. Smith, M.R.; Chai, R.; Nguyen, H.T.; Marcora, S.M.; Coutts, A.J. Comparing the Effects of Three Cognitive Tasks on Indicators of Mental Fatigue. J. Psychol. 2019, 153, 759–783. [Google Scholar] [CrossRef]
  21. Holgado, D.; Zabala, M.; Sanabria, D. No Evidence of the Effect of Cognitive Load on Self-Paced Cycling Performance. PLoS ONE 2019, 14, e0217825. [Google Scholar] [CrossRef]
  22. Paulus, M.P.; Potterat, E.G.; Taylor, M.K.; Van, K.F.; Bauman, J.; Momen, N.; Padilla, G.A.; Swain, J.L. A Neuroscience Approach to Optimizing Brain Resources for Human Performance in Extreme Environments. Neurosci. Biobehav. Rev. 2010, 33, 1080–1088. [Google Scholar] [CrossRef] [Green Version]
  23. White, C. 2022 Calendar of Bikepacking Races. Available online: https://ridefar.info/races/list/ (accessed on 3 November 2021).
  24. Abd Rahman, N.I.; Md Dawal, S.Z.; Yusoff, N. Driving Mental Workload and Performance of Ageing Drivers. Transp. Res. Part F Traffic Psychol. Behav. 2020, 69, 265–285. [Google Scholar] [CrossRef]
  25. Lal, S.K.L.; Craig, A. Driver Fatigue: Electroencephalography and Psychological Assessment. Psychophysiology 2002, 39, 313–321. [Google Scholar] [CrossRef]
  26. Vrijens, D.; Drossaerts, J.; van Koeveringe, G.; Van Kerrebroeck, P.; van Os, J.; Leue, C. Affective Symptoms and the Overactive Bladder a Systematic Review. J. Psychosom. Res. 2015, 78, 95–108. [Google Scholar] [CrossRef] [PubMed]
  27. Priego Quesada, J.I.; Kerr, Z.Y.; Bertucci, W.M.; Carpes, F.P. The Categorization of Amateur Cyclists as Research Participants: Findings from an Observational Study. J. Sports Sci. 2018, 36, 2018–2024. [Google Scholar] [CrossRef] [PubMed]
  28. Allen, H.; Cohggan, A.R.; McGregor, S. Training and Racing with a Power Meter, 3rd ed.; Velopress: Boulder, CO, USA, 2019; ISBN 9781937715939. [Google Scholar]
  29. Inglis, E.C.; Iannetta, D.; Passfield, L.; Murias, J.M. Maximal Lactate Steady State Versus the 20-Minute Functional Threshold Power Test in Well-Trained Individuals: “Watts” the Big Deal? Int. J. Sports Physiol. Perform. 2020, 15, 541–547. [Google Scholar] [CrossRef] [Green Version]
  30. Lee, C.-F.; Chen, P.-T.; Huang, H.-I. Attributes of Destination Attractiveness in Taiwanese Bicycle Tourism: The Perspective of Active Experienced Bicycle Tourists. Int. J. Hosp. Tour. Adm. 2014, 15, 275–297. [Google Scholar] [CrossRef]
  31. Waters, J. Snowball Sampling: A Cautionary Tale Involving a Study of Older Drug Users. Int. J. Soc. Res. Methodol. 2015, 18, 367–380. [Google Scholar] [CrossRef]
  32. Griffith, D.A.; Scott Morris, E.; Thakar, V. Spatial Autocorrelation and Qualitative Sampling: The Case of Snowball Type Sampling Designs. Ann. Am. Assoc. Geogr. 2016, 106, 773–787. [Google Scholar] [CrossRef]
  33. Cramer, H.; Haller, H.; Dobos, G.; Lauche, R. A Systematic Review and Meta-Analysis Estimating the Expected Dropout Rates in Randomized Controlled Trials on Yoga Interventions. Evid. Based. Complement. Alternat. Med. 2016, 2016, 5859729. [Google Scholar] [CrossRef] [Green Version]
  34. Jeukendrup, A.E.; Craig, N.P.; Hawley, J.A. The Bioenergetics of World Class Cycling. J. Sci. Med. Sport 2000, 3, 414–433. [Google Scholar] [CrossRef]
  35. Hernando, D.; Garatachea, N.; Almeida, R.; Casajús, J.A.; Bailón, R. Validation of Heart Rate Monitor Polar RS800 for Heart Rate Variability Analysis During Exercise. J. Strength Cond. Res. 2018, 32, 716–725. [Google Scholar] [CrossRef]
  36. Hart, S.G.; Staveland, L.E. Development of NASA-TLX (Task Load Index): Results of Empirical and Theoretical Research. Adv. Psychol. 1988, 52, 139–183. [Google Scholar]
  37. Cinaz, B.; Arnrich, B.; La Marca, R.; Tröster, G. Monitoring of Mental Workload Levels during an Everyday Life Office-Work Scenario. Pers. Ubiquit. Comput. 2013, 17, 229–239. [Google Scholar] [CrossRef]
  38. Foy, H.J.; Chapman, P. Mental Workload Is Reflected in Driver Behaviour, Physiology, Eye Movements and Prefrontal Cortex Activation. Appl. Ergon. 2018, 73, 90–99. [Google Scholar] [CrossRef] [PubMed]
  39. Holgado, D.; Troya, E.; Perales, J.C.; Vadillo, M.A.; Sanabria, D. Does Mental Fatigue Impair Physical Performance? A Replication Study. EJSS 2021, 21, 762–770. [Google Scholar] [CrossRef] [PubMed]
  40. Huang, S.; Li, J.; Zhang, P.; Zhang, W. Detection of Mental Fatigue State with Wearable ECG Devices. Int. J. Med. Inform. 2018, 119, 39–46. [Google Scholar] [CrossRef] [PubMed]
  41. Käthner, I.; Wriessnegger, S.C.; Müller-Putz, G.R.; Kübler, A.; Halder, S. Effects of Mental Workload and Fatigue on the P300, Alpha and Theta Band Power during Operation of an ERP (P300) Brain-Computer Interface. Biol. Psychol. 2014, 102, 118–129. [Google Scholar] [CrossRef]
  42. Debener, S.; Minow, F.; Emkes, R.; Gandras, K.; de Vos, M. How about Taking a Low-Cost, Small, and Wireless EEG for a Walk? Psychophysiology 2012, 49, 1617–1621. [Google Scholar] [CrossRef]
  43. Li, W.; He, Q.-C.; Fan, X.-M.; Fei, Z.-M. Evaluation of Driver Fatigue on Two Channels of EEG Data. Neurosci. Lett. 2012, 506, 235–239. [Google Scholar] [CrossRef]
  44. Krigolson, O.E.; Williams, C.C.; Norton, A.; Hassall, C.D.; Colino, F.L. Choosing MUSE: Validation of a Low-Cost, Portable EEG System for ERP Research. Front. Neurosci. 2017, 11, 109. [Google Scholar] [CrossRef] [Green Version]
  45. LaRocco, J.; Le, M.D.; Paeng, D.-G. A Systemic Review of Available Low-Cost EEG Headsets Used for Drowsiness Detection. Front. Neuroinform. 2020, 14, 553352. [Google Scholar] [CrossRef]
  46. Galy, E.; Cariou, M.; Mélan, C. What Is the Relationship between Mental Workload Factors and Cognitive Load Types? Int. J. Psychophysiol. 2012, 83, 269–275. [Google Scholar] [CrossRef]
  47. Pendleton, D.M.; Sakalik, M.L.; Moore, M.L.; Tomporowski, P.D. Mental Engagement during Cognitive and Psychomotor Tasks: Effects of Task Type, Processing Demands, and Practice. Int. J. Psychophysiol. 2016, 109, 124–131. [Google Scholar] [CrossRef] [PubMed]
  48. Perlman, D.; Samost, A.; Domel, A.G.; Mehler, B.; Dobres, J.; Reimer, B. The Relative Impact of Smartwatch and Smartphone Use While Driving on Workload, Attention, and Driving Performance. Appl. Ergon. 2019, 75, 8–16. [Google Scholar] [CrossRef] [PubMed]
  49. Thayer, J.F.; Lane, R.D. Claude Bernard and the Heart-Brain Connection: Further Elaboration of a Model of Neurovisceral Integration. Neurosci. Biobehav. Rev. 2009, 33, 81–88. [Google Scholar] [CrossRef] [PubMed]
  50. Grässler, B.; Hökelmann, A.; Cabral, R.H. Resting Heart Rate Variability as a Possible Marker of Cognitive Decline. Kinesiology 2020, 52, 72–84. [Google Scholar] [CrossRef]
  51. Danieli, A.; Lusa, L.; Potočnik, N.; Meglič, B.; Grad, A.; Bajrović, F.F. Resting Heart Rate Variability and Heart Rate Recovery after Submaximal Exercise. Clin. Auton. Res. 2014, 24, 53–61. [Google Scholar] [CrossRef]
  52. Kaikkonen, P.; Rusko, H.; Martinmäki, K. Post-Exercise Heart Rate Variability of Endurance Athletes after Different High-Intensity Exercise Interventions. Scand. J. Med. Sci. Sports 2008, 18, 511–519. [Google Scholar] [CrossRef]
  53. Kaikkonen, P.; Hynynen, E.; Mann, T.; Rusko, H.; Nummela, A. Can HRV Be Used to Evaluate Training Load in Constant Load Exercises? Eur. J. Appl. Physiol. 2010, 108, 435–442. [Google Scholar] [CrossRef]
  54. Vallverdú, M.; Ruiz-Muñoz, A.; Roca, E.; Caminal, P.; Rodríguez, F.A.; Irurtia, A.; Perera, A. Assessment of Heart Rate Variability during an Endurance Mountain Trail Race by Multi-Scale Entropy Analysis. Entropy 2017, 19, 658. [Google Scholar] [CrossRef] [Green Version]
  55. Shaffer, F.; McCraty, R.; Zerr, C.L. A Healthy Heart Is Not a Metronome: An Integrative Review of the Heart’s Anatomy and Heart Rate Variability. Front. Psychol. 2014, 5, 1040. [Google Scholar] [CrossRef] [Green Version]
  56. Pattyn, N.; Neyt, X.; Henderickx, D.; Soetens, E. Psychophysiological Investigation of Vigilance Decrement: Boredom or Cognitive Fatigue? Physiol. Behav. 2008, 93, 369–378. [Google Scholar] [CrossRef]
  57. Evirgen, N.; Oniz, A.; Ozgoren, M. The Development of A Psychomotor Vigilance Test Battery and the Assessment of Vigilance Change in Reaction to Mental Work Load. J. Neurol. Sci. 2015, 32, 494–506. [Google Scholar]
  58. Lim, J.; Wu, W.-C.; Wang, J.; Detre, J.A.; Dinges, D.F.; Rao, H. Imaging Brain Fatigue from Sustained Mental Workload: An ASL Perfusion Study of the Time-on-Task Effect. Neuroimage 2010, 49, 3426–3435. [Google Scholar] [CrossRef] [PubMed] [Green Version]
  59. Molina, E.; Sanabria, D.; Jung, T.-P.; Correa, Á. Electroencephalographic and Peripheral Temperature Dynamics during a Prolonged Psychomotor Vigilance Task. Accid. Anal. Prev. 2019, 126, 198–208. [Google Scholar] [CrossRef] [PubMed]
  60. Arsintescu, L.; Kato, K.H.; Cravalho, P.F.; Feick, N.H.; Stone, L.S.; Flynn-Evans, E.E. Validation of a Touchscreen Psychomotor Vigilance Task. Accid. Anal. Prev. 2019, 126, 173–176. [Google Scholar] [CrossRef]
  61. Knufinke, M.; Nieuwenhuys, A.; Maase, K.; Moen, M.H.; Geurts, S.A.E.; Coenen, A.M.L.; Kompier, M.A.J. Effects of Natural Between-Days Variation in Sleep on Elite Athletes’ Psychomotor Vigilance and Sport-Specific Measures of Performance. J. Sports Sci. Med. 2018, 17, 515–524. [Google Scholar]
  62. Graw, P.; Kräuchi, K.; Knoblauch, V.; Wirz-Justice, A.; Cajochen, C. Circadian and Wake-Dependent Modulation of Fastest and Slowest Reaction Times during the Psychomotor Vigilance Task. Physiol. Behav. 2004, 80, 695–701. [Google Scholar] [CrossRef]
  63. Drummond, S.P.A.; Bischoff-Grethe, A.; Dinges, D.F.; Ayalon, L.; Mednick, S.C.; Meloy, M.J. The Neural Basis of the Psychomotor Vigilance Task. Sleep 2005, 28, 1059–1068. [Google Scholar] [CrossRef]
  64. Jones, M.J.; Dunican, I.C.; Murray, K.; Peeling, P.; Dawson, B.; Halson, S.; Miller, J.; Eastwood, P.R. The Psychomotor Vigilance Test: A Comparison of Different Test Durations in Elite Athletes. J. Sports Sci. 2018, 36, 2033–2037. [Google Scholar] [CrossRef]
  65. Arsintescu, L.; Mulligan, J.B.; Flynn-Evans, E.E. Evaluation of a Psychomotor Vigilance Task for Touch Screen Devices. Hum. Factors 2017, 59, 661–670. [Google Scholar] [CrossRef] [Green Version]
  66. Muth, E.R.; Moss, J.D.; Rosopa, P.J.; Salley, J.N.; Walker, A.D. Respiratory Sinus Arrhythmia as a Measure of Cognitive Workload. Int. J. Psychophysiol. 2012, 83, 96–101. [Google Scholar] [CrossRef]
  67. Finomore, V.S., Jr.; Shaw, T.H.; Warm, J.S.; Matthews, G.; Boles, D.B. Viewing the Workload of Vigilance through the Lenses of the NASA-TLX and the MRQ. Hum. Factors 2013, 55, 1044–1063. [Google Scholar] [CrossRef] [PubMed] [Green Version]
  68. Schnitzler, C.; Seifart, L.; Chollet, D. Assessing Mental Workload at Maximal Intensity in Swimming Using the NASA-TLX Questionnaire. Conf. Proc. Biomech. Med. Swim. 2010, 11, 286–288. [Google Scholar]
  69. Zheng, B.; Jiang, X.; Tien, G.; Meneghetti, A.; Panton, O.N.M.; Atkins, M.S. Workload Assessment of Surgeons: Correlation between NASA TLX and Blinks. Surg. Endosc. 2012, 26, 2746–2750. [Google Scholar] [CrossRef] [PubMed]
  70. Cao, A.; Chintamani, K.K.; Pandya, A.K.; Ellis, R.D. NASA TLX: Software for Assessing Subjective Mental Workload. Behav. Res. Methods 2009, 41, 113–117. [Google Scholar] [CrossRef] [PubMed]
  71. Pallarés, J.G.; Lillo-Bevia, J.R. Validity and Reliability of the PowerTap P1 Pedals Power Meter. J. Sports Sci. Med. 2018, 17, 305–311. [Google Scholar]
  72. Whittle, C.; Smith, N.; Jobson, S.A. Validity of PowerTap P1 Pedals during Laboratory-Based Cycling Time Trial Performance. Sports 2018, 6, 92. [Google Scholar] [CrossRef] [Green Version]
  73. Thomas, D.T.; Erdman, K.A.; Burke, L.M. American College of Sports Medicine Joint Position Statement. Nutrition and Athletic Performance. Med. Sci. Sports Exerc. 2016, 48, 543–568. [Google Scholar] [CrossRef]
  74. Rodrigues, P.; Wassmansdorf, R.; Salgueirosa, F.M.; Hernandez, S.G.; Nascimento, V.B.; Daros, L.B.; Wharton, L.; Osiecki, R. Time-Course of Changes in Indirect Markers of Muscle Damage Responses Following a 130-Km Cycling Race. Braz. J. Kinanthropometry Hum. Perform. 2016, 18, 322–331. [Google Scholar] [CrossRef] [Green Version]
  75. Olafsdottir, G.; Cloke, P.; Schulz, A.; van Dyck, Z.; Eysteinsson, T.; Thorleifsdottir, B.; Vögele, C. Health Benefits of Walking in Nature: A Randomized Controlled Study Under Conditions of Real-Life Stress. Environ. Behav. 2020, 52, 248–274. [Google Scholar] [CrossRef]
  76. Van der Jagt, A.P.N.; Craig, T.; Brewer, M.J.; Pearson, D.G. A View Not to Be Missed: Salient Scene Content Interferes with Cognitive Restoration. PLoS ONE 2017, 12, e0169997. [Google Scholar] [CrossRef] [Green Version]
  77. Berman, M.G.; Jonides, J.; Kaplan, S. The Cognitive Benefits of Interacting With Nature. Cimprich 2003, 1992, 1993. [Google Scholar] [CrossRef] [PubMed]
  78. Berto, R. The Role of Nature in Coping with Psycho-Physiological Stress: A Literature Review on Restorativeness. Behav. Sci. 2014, 4, 394–409. [Google Scholar] [CrossRef] [PubMed] [Green Version]
  79. Elliott, D.; Carr, S.; Orme, D. The Effect of Motivational Music on Sub-Maximal Exercise. null 2005, 5, 97–106. [Google Scholar] [CrossRef]
  80. Jia, T.; Ogawa, Y.; Miura, M.; Ito, O.; Kohzuki, M. Music Attenuated a Decrease in Parasympathetic Nervous System Activity after Exercise. PLoS ONE 2016, 11, e0148648. [Google Scholar] [CrossRef] [PubMed]
  81. Shaffer, F.; Meehan, Z.M. A Practical Guide to Resonance Frequency Assessment for Heart Rate Variability Biofeedback. Front. Neurosci. 2020, 14, 570400. [Google Scholar] [CrossRef]
Figure 1. Sequence of activities before and after the test.
Sports 10 00067 g001
Publisher’s Note: MDPI stays neutral with regard to jurisdictional claims in published maps and institutional affiliations.

