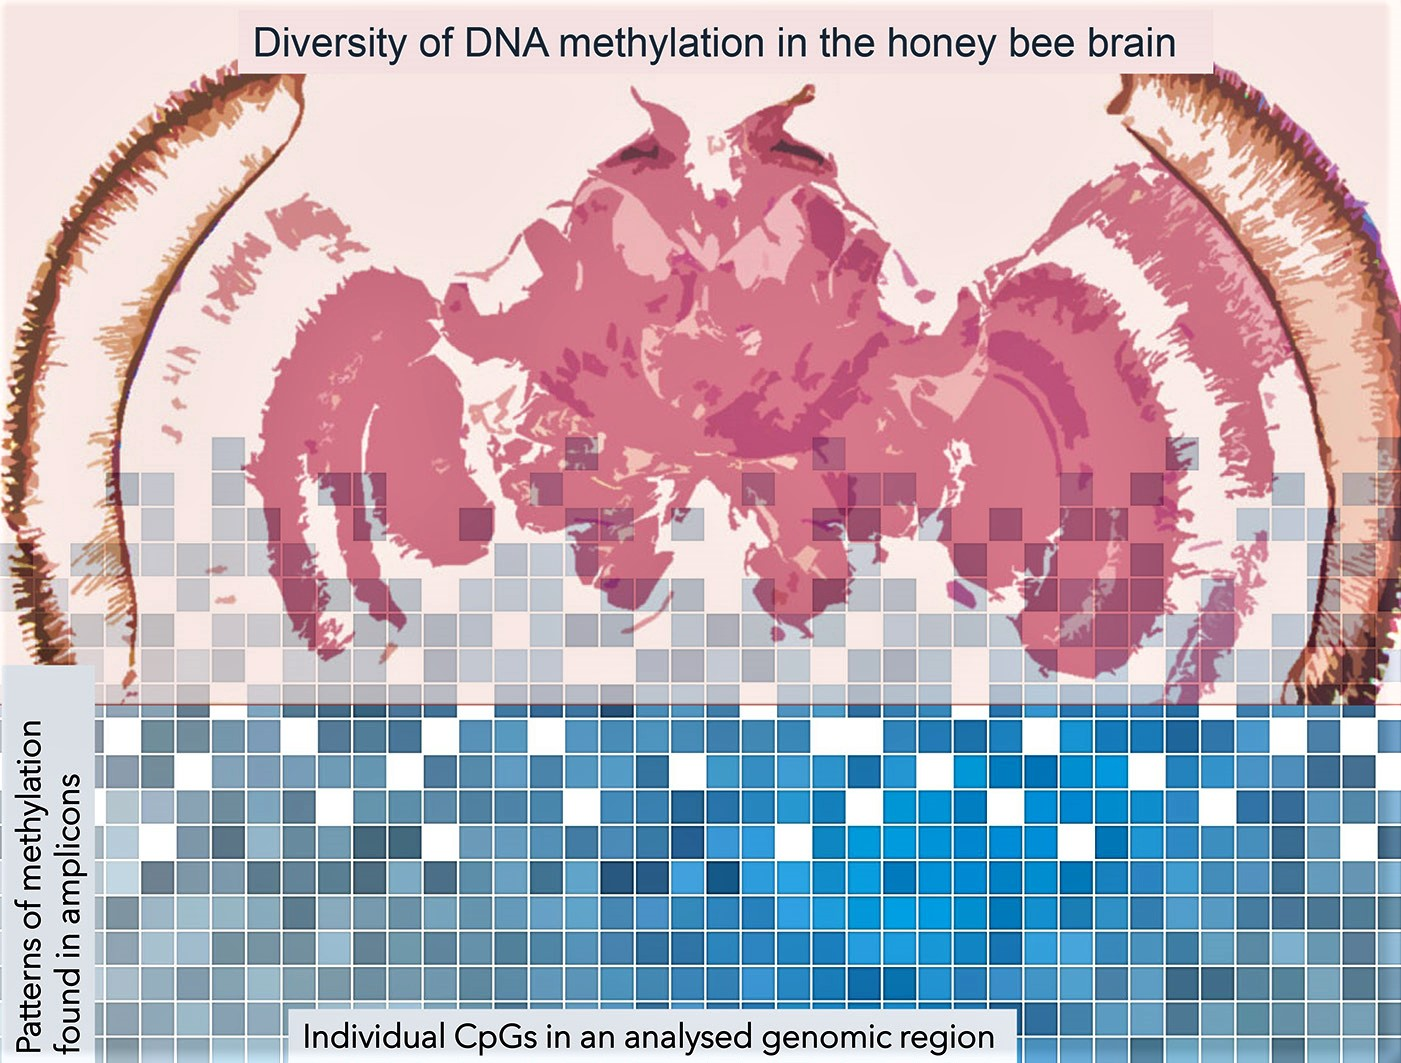
Exploring DNA Methylation Diversity in the Honey Bee Brain by Ultra-Deep Amplicon Sequencing


Abstract

1. Introduction
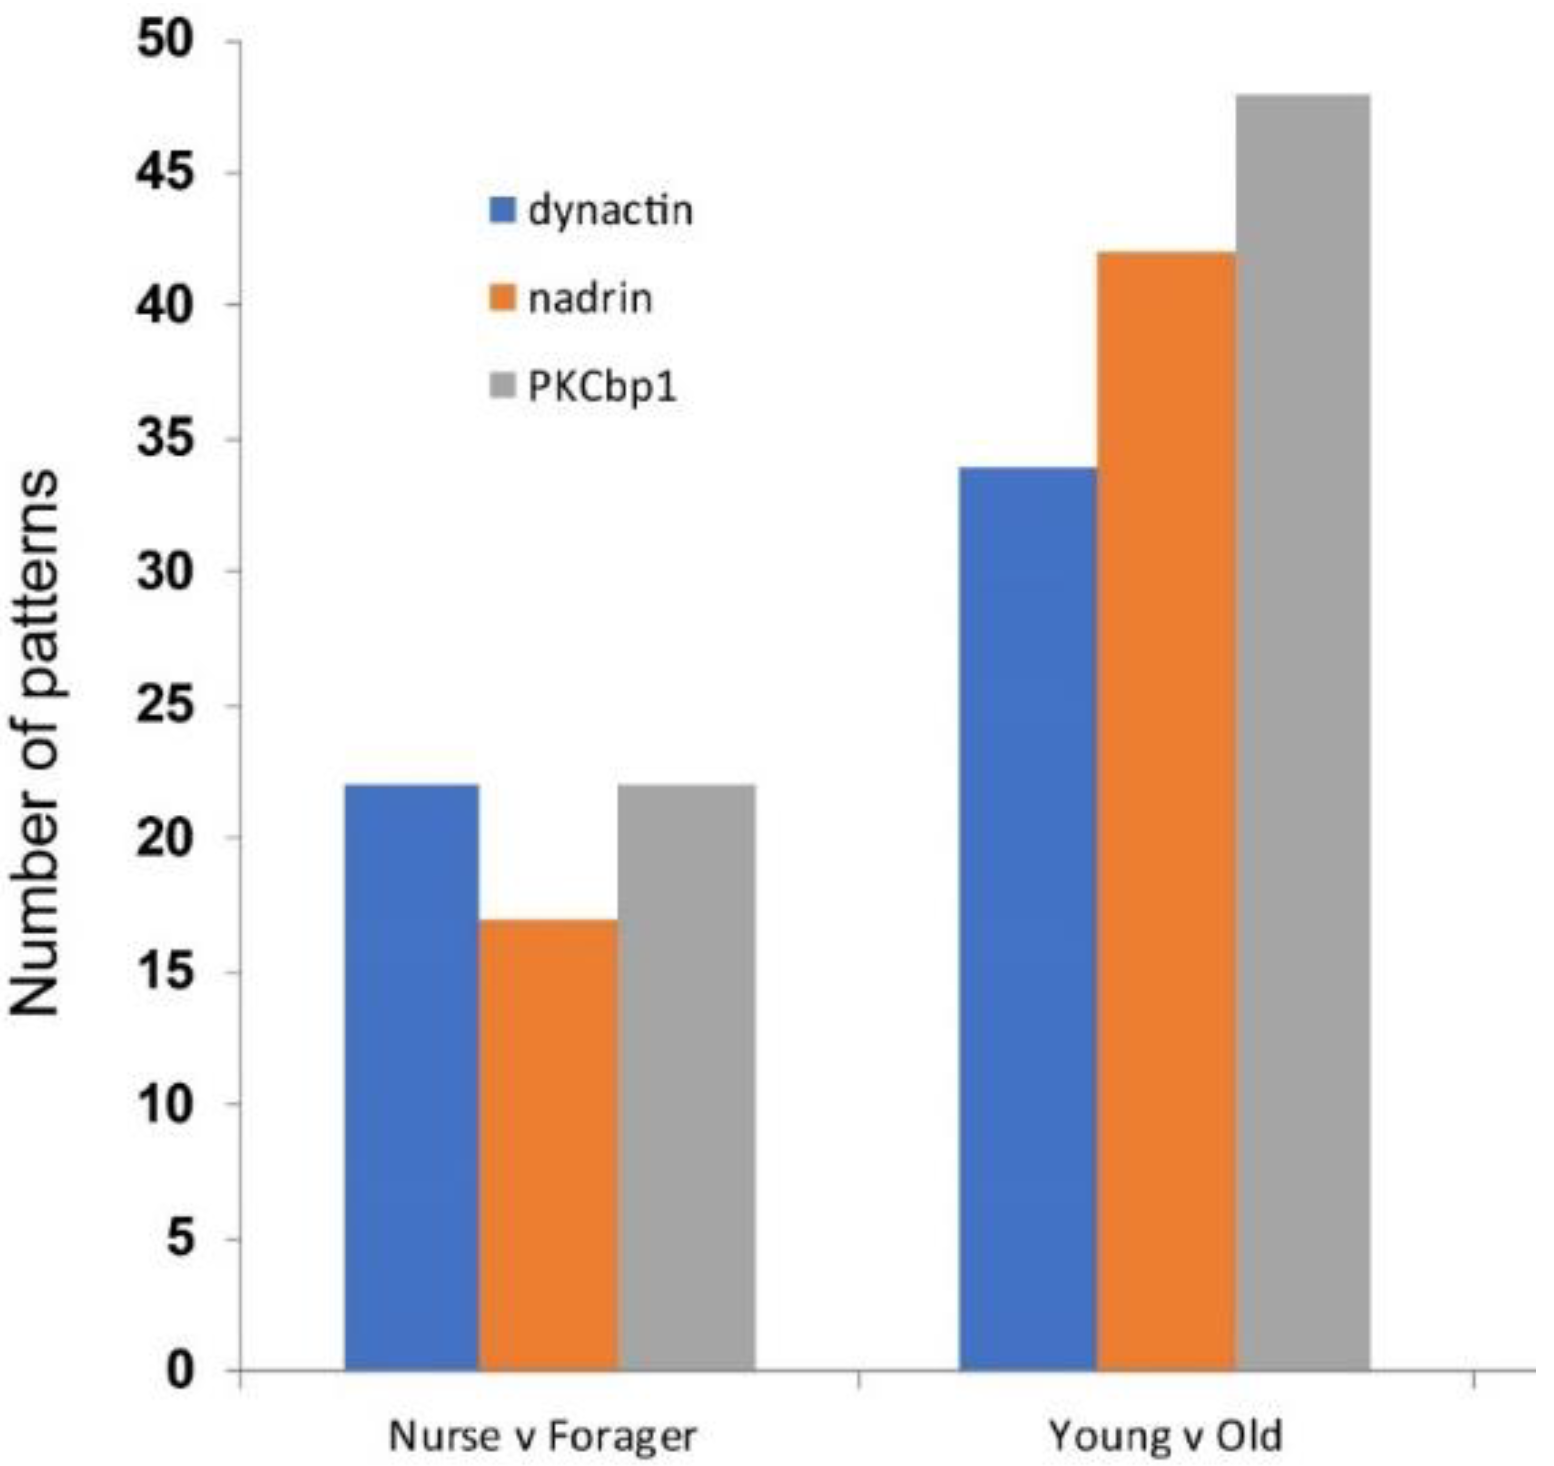
2. Results

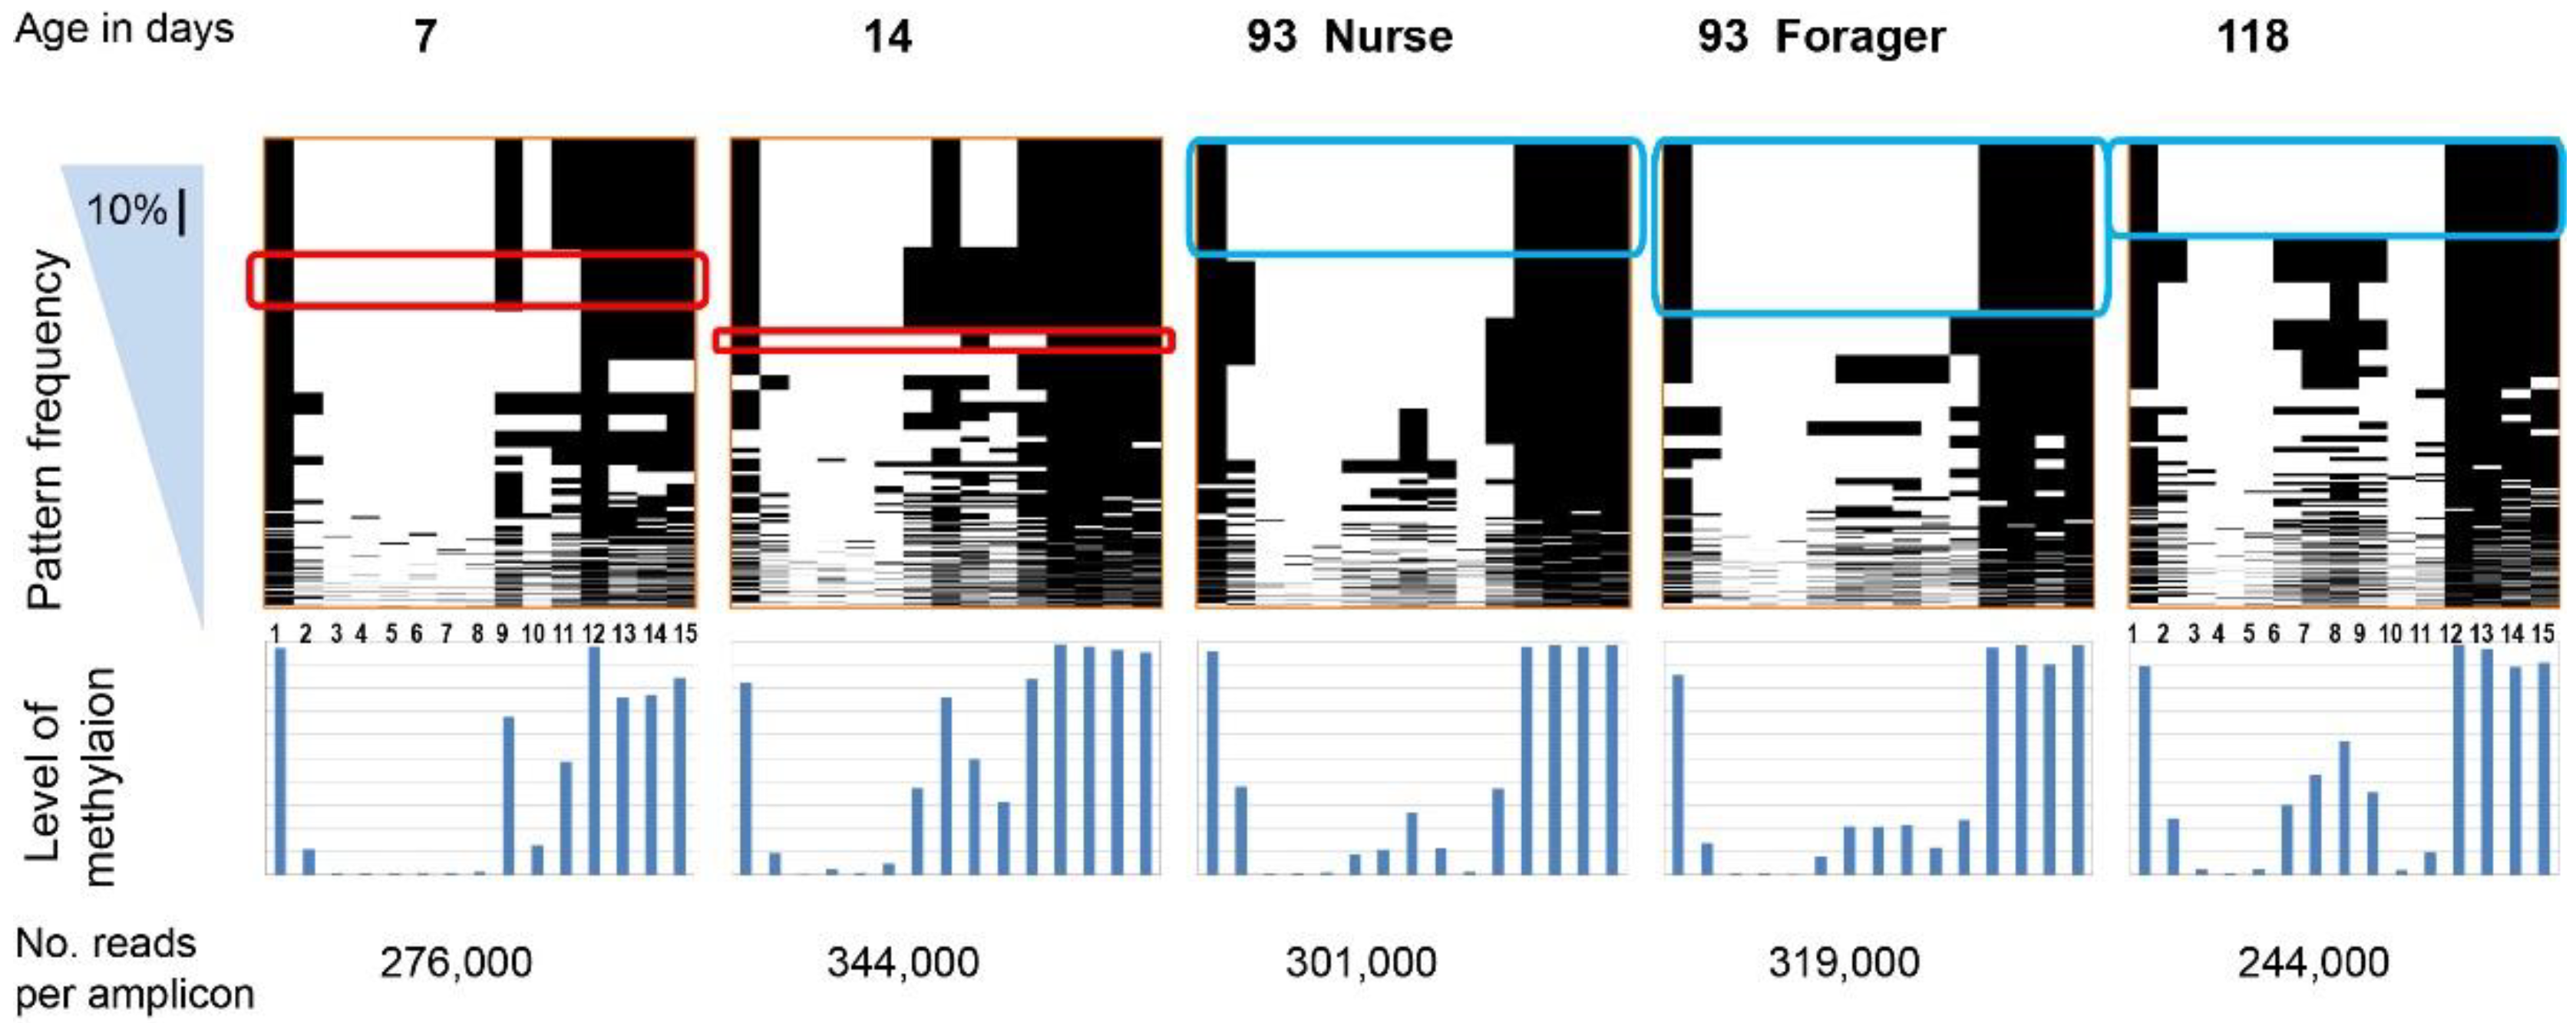
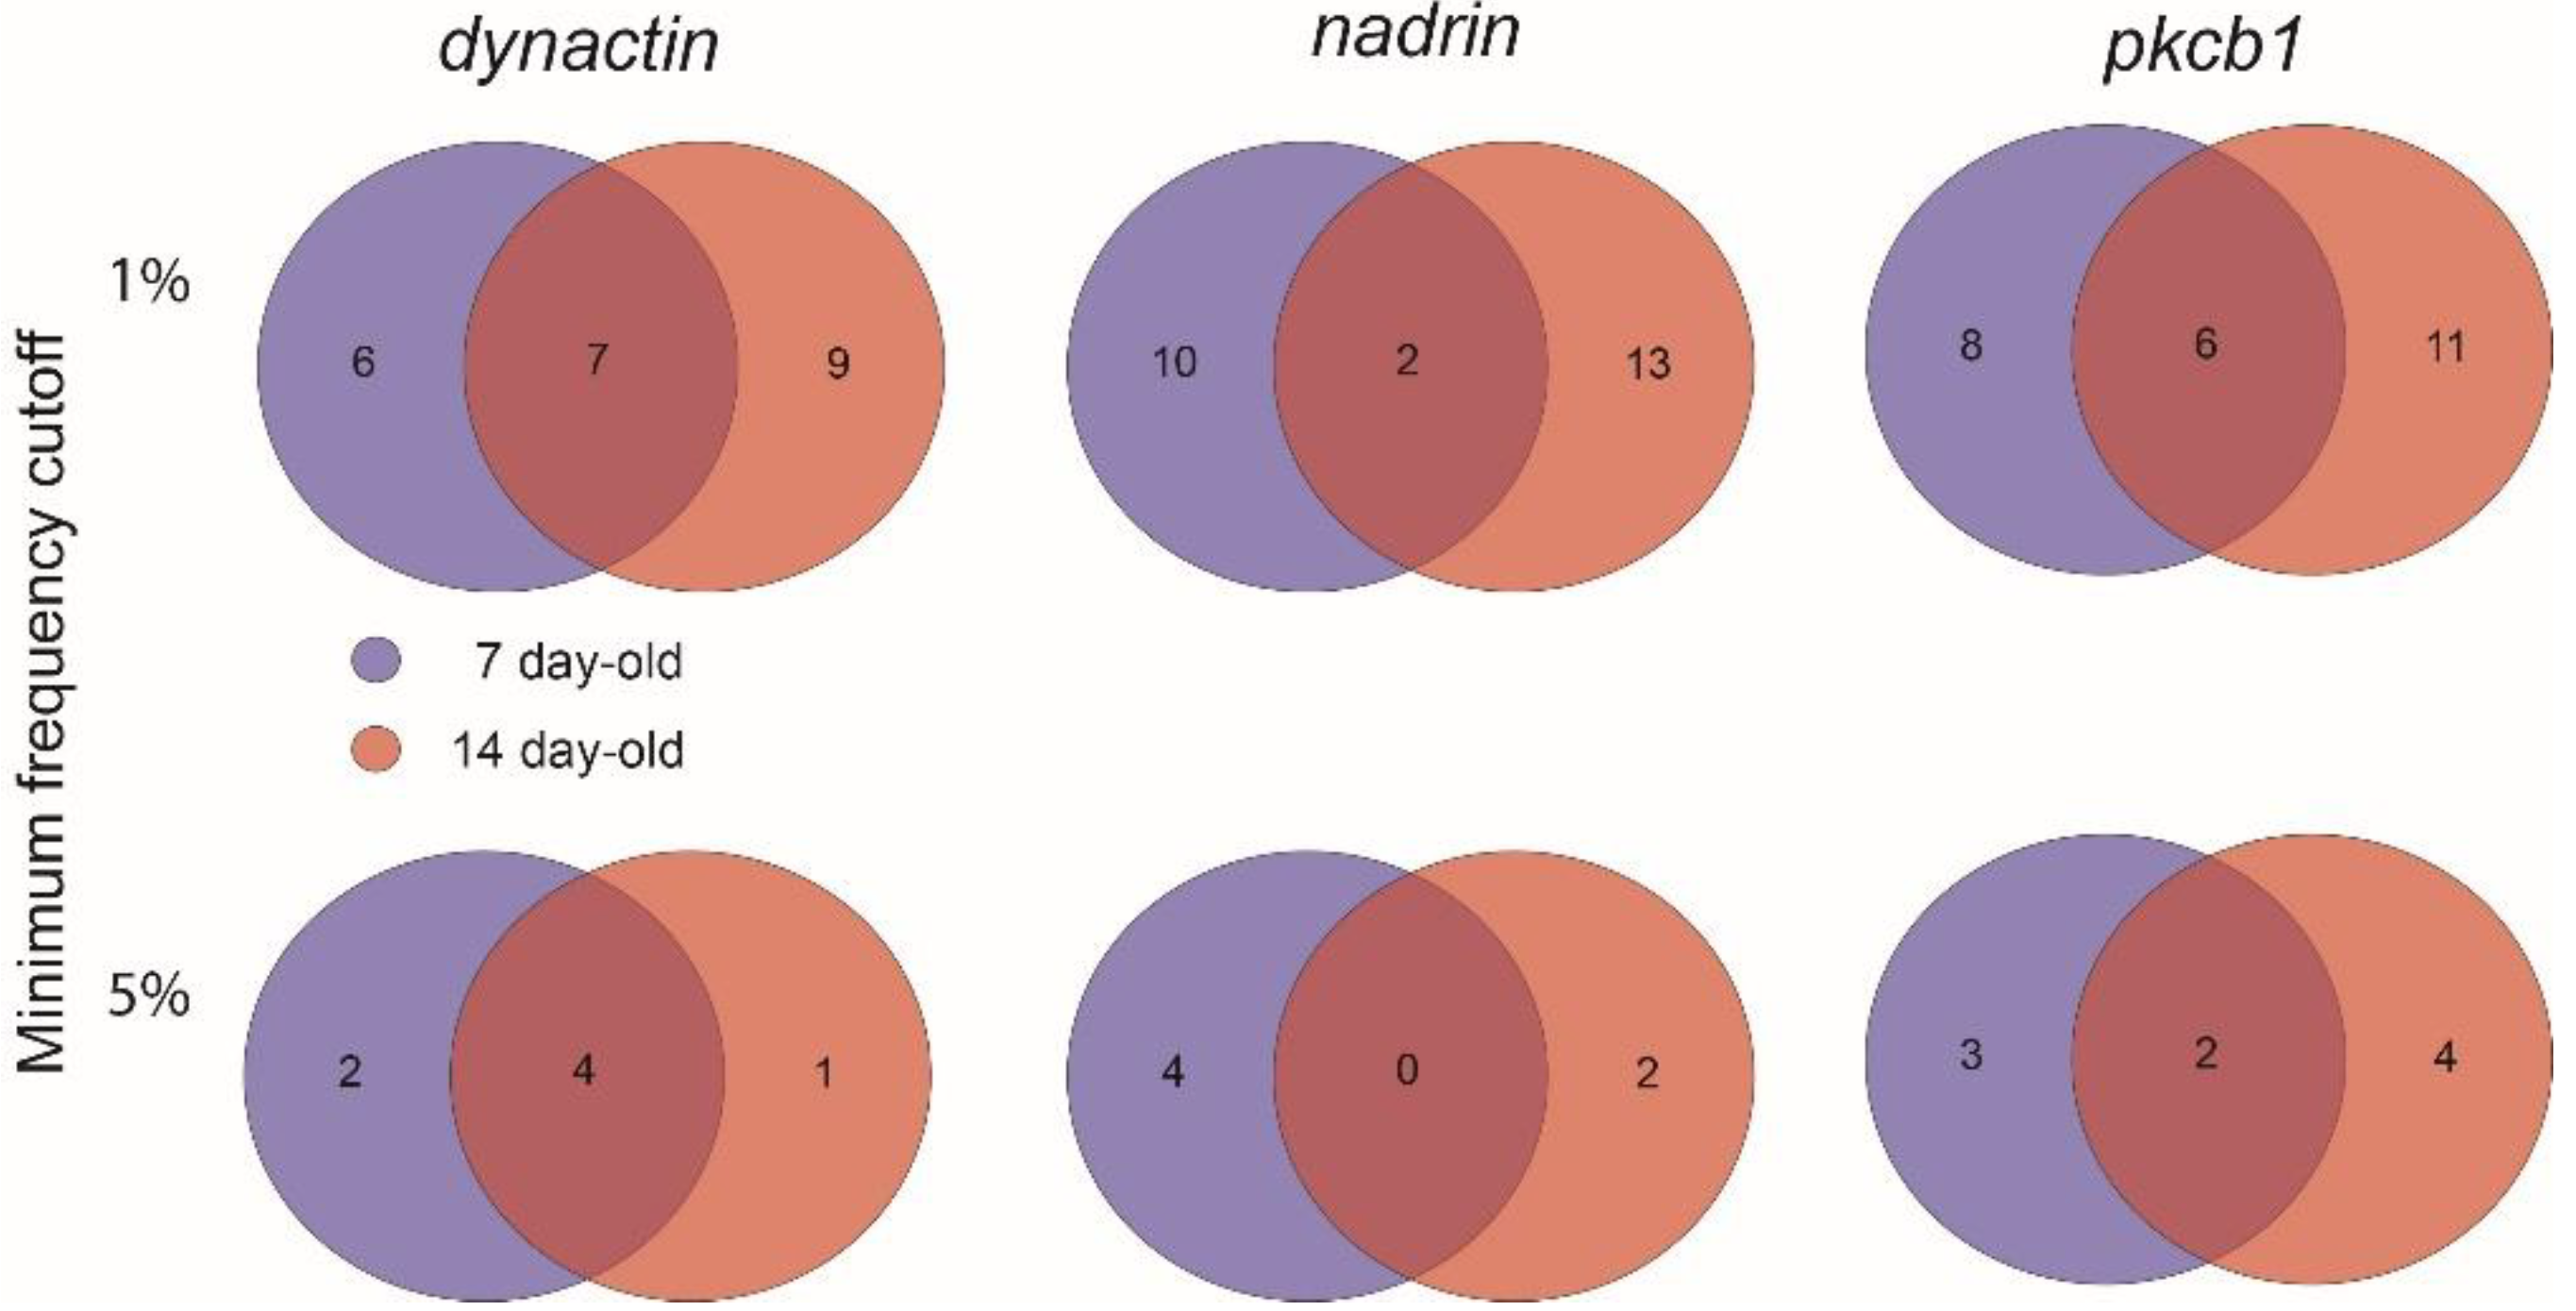
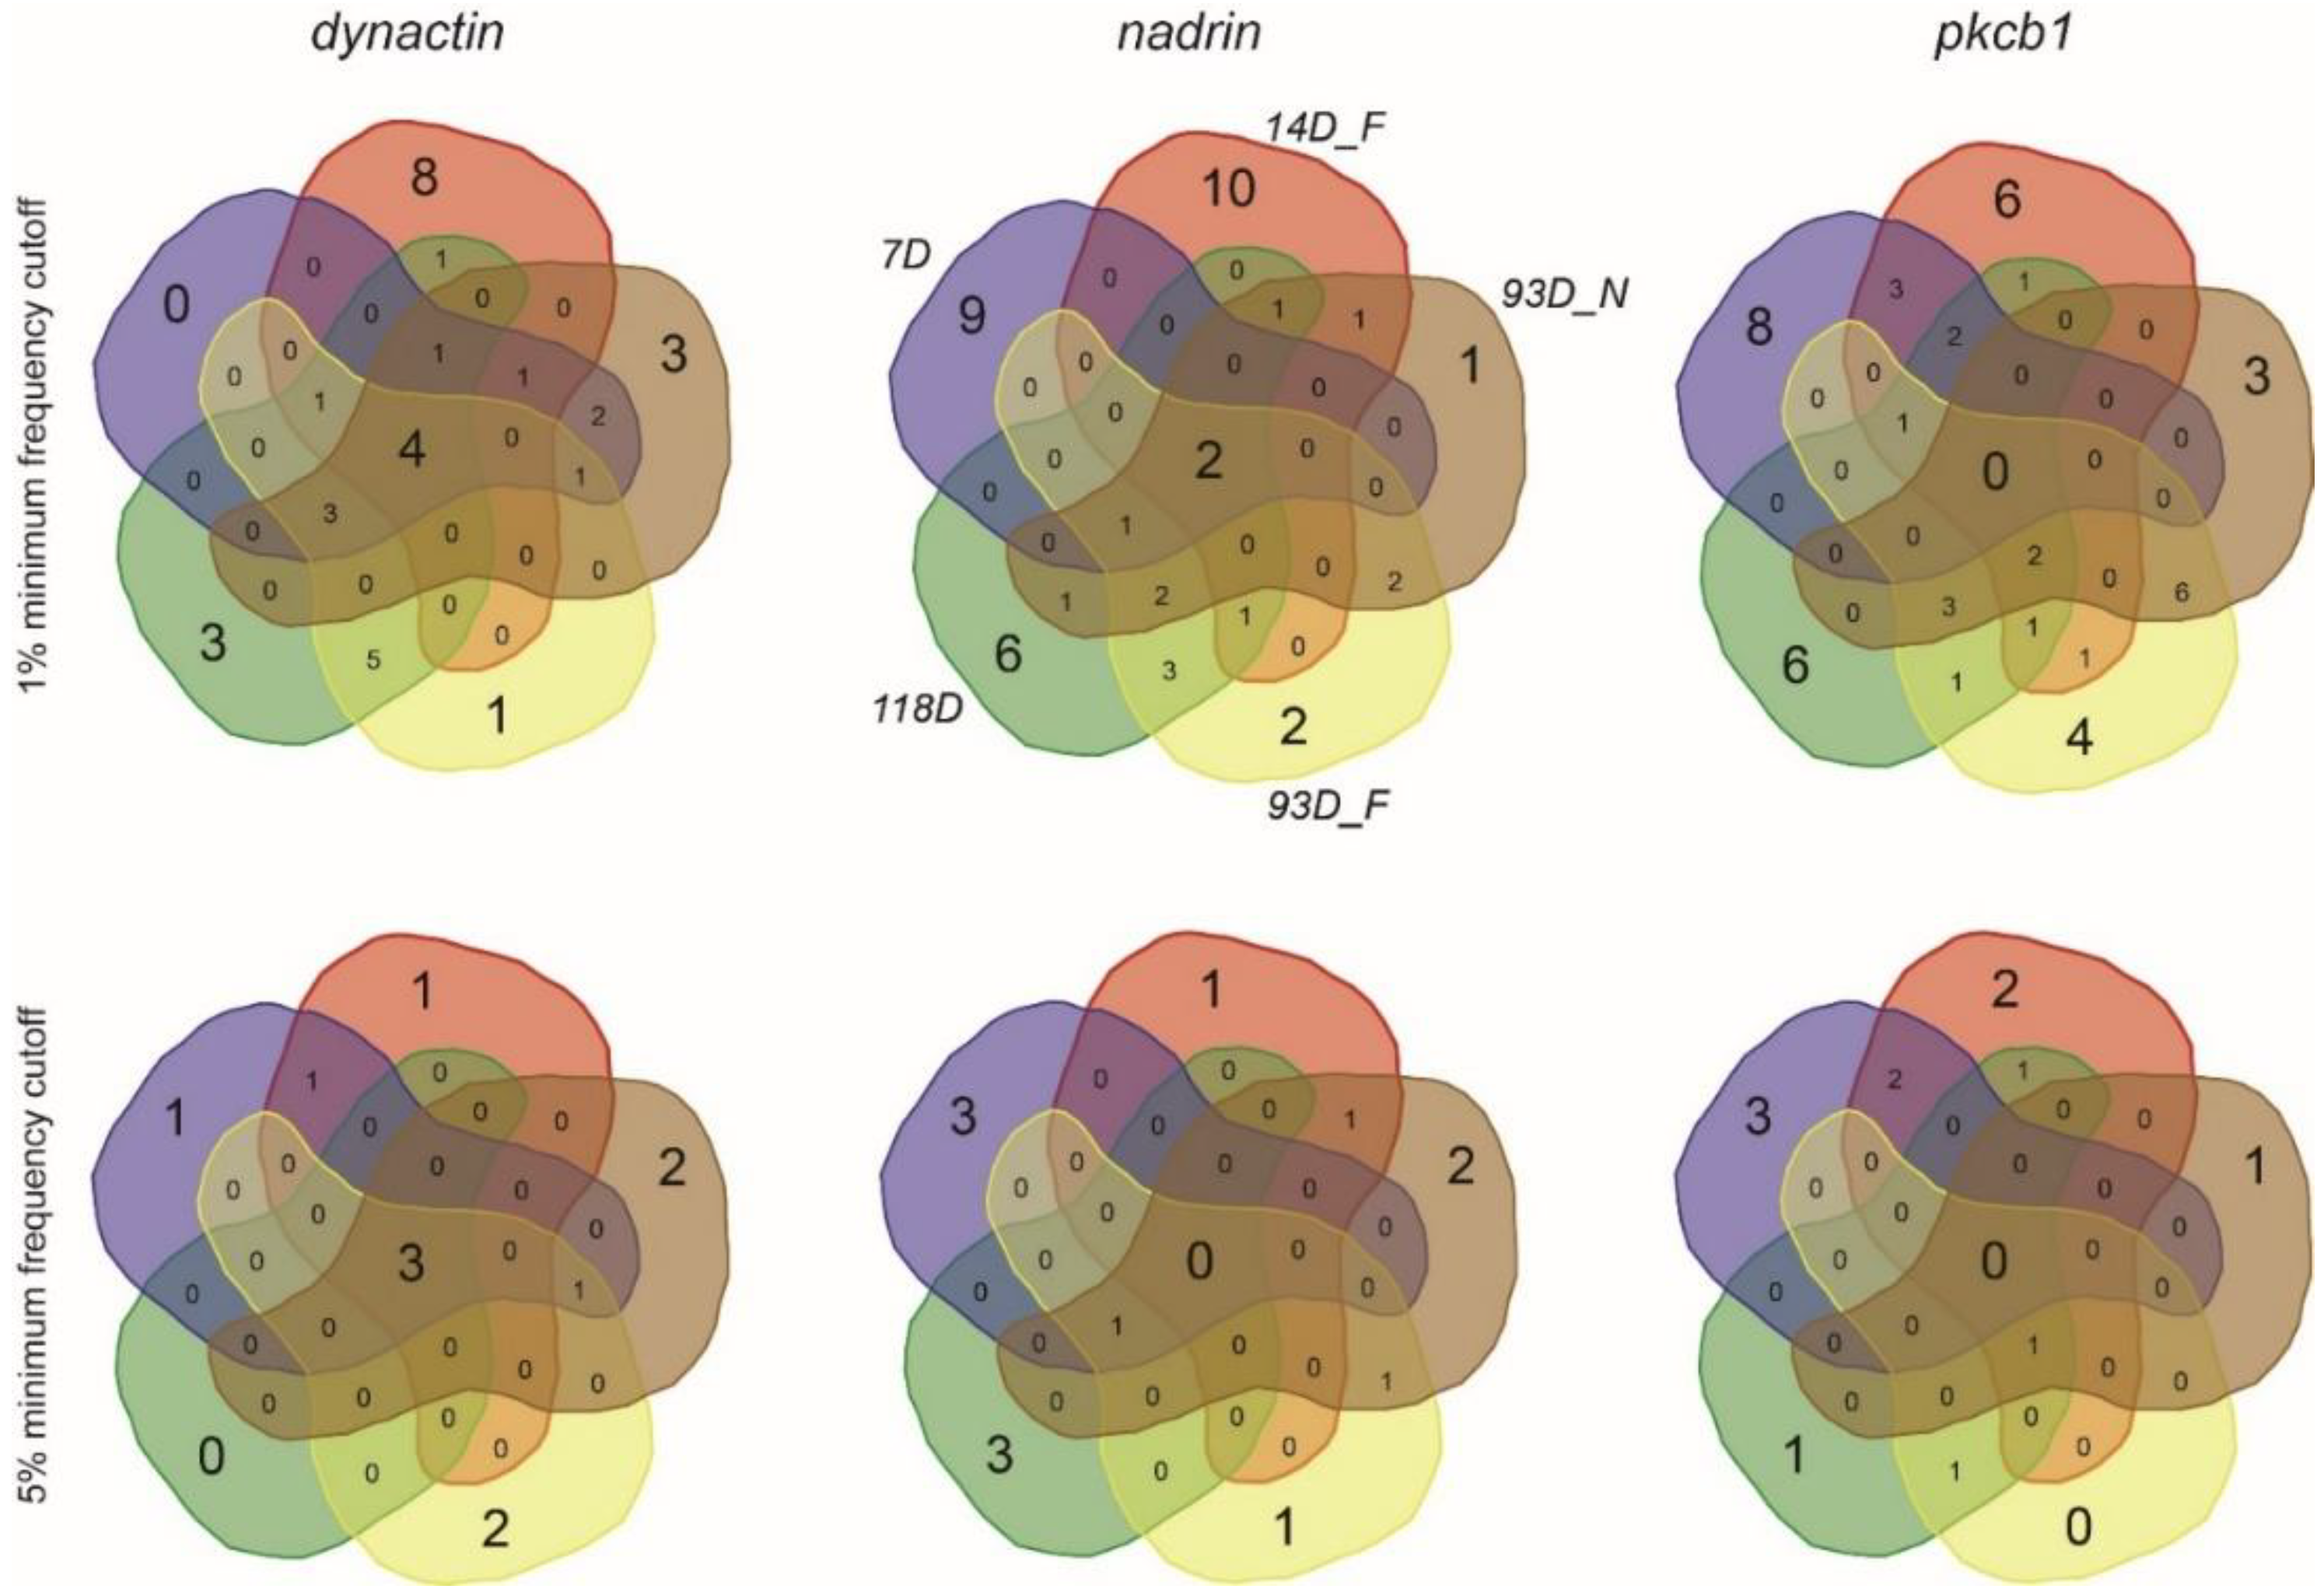
| Gene | NCBI IDs | Analysed Exons | Amplicon Length (bp) ** | mCpGs/ Amplicon | Comments |
|---|---|---|---|---|---|
| Dynactin * dctn4 subunit 4 | XP_006560650 | 4, 5, 6 | 551 | 10 | Differentially spliced, methylated in queen and worker adult brain and in larval head |
| Nadrin, rho GTPase-activating protein | XP_006572269 | 10 | 405 | 15 | Differentially spliced, methylated in queen and worker brain |
| PKCbp1, protein kinase C-binding protein | XP_016769618 | 5, 6 | 401 | 10 | Methylated gene, different isoforms expressed in adult brains and larval heads |
3. Discussion
3.1. What Is the Meaning of the Novel Methylation Patterns Uncovered by this Study?
3.2. Experimental Inferences
4. Materials and Methods
4.1. Honey Bees and Brain Dissections
| Age of Bees (Days) | Functional Status | Comments |
|---|---|---|
| 7 | Caged bees reared in a dark incubator | No social colony-level environment, no specialised behavioural experience. Medium HPGs * |
| 14 | Hive bees that undertook orientation flights | These individuals were preparing for foraging. Medium HPGs |
| 93 | Mature hive nurse bees | Large HFGs, no indication of foraging experience (e.g., wing damage) |
| 93 | Mature foragers | Collected carrying pollen. Vestigial HPGs, evidence of wing damage |
| 118 | Very old nurse bees | Large HFGs, possibly some prior foraging experience, but external body damage, e.g., hair loss might be related to age |
4.2. DNA Bisulphite Conversion and Amplicon Preparation
4.3. NGS Library Preparation and MiSeq Sequencing
4.4. Analysis of Bisulfite Sequencing Results
Supplementary Materials
Author Contributions
Funding
Conflicts of Interest
References
- Albright, T.D.; Jessell, T.M.; Kandel, E.R.; Posner, M.I. Neural science: A century of progress and the mysteries that remain. Cell 2000, 100, S1–S55. [Google Scholar] [CrossRef]
- Bargmann, C.I.; Marder, E. From the connectome to brain function. Nat. Methods 2013, 10, 483–490. [Google Scholar] [CrossRef] [PubMed]
- Miklos, G.L.G.; Maleszka, R. Epigenomic communication systems in humans and honey bees: From molecules to behavior. Horm. Behav. 2011, 59, 399–406. [Google Scholar] [CrossRef]
- Yang, M.Y.; Armstrong, J.D.; Vilinsky, I.; Strausfeld, N.J.; Kaiser, K. Subdivision of the Drosophila mushroom bodies by enhancer-trap expression patterns. Neuron 1995, 15, 45–54. [Google Scholar] [CrossRef]
- Ko, Y.; Ament, S.A.; Eddy, J.A.; Caballero, J.; Earls, J.C.; Hood, L.; Price, N.D. Cell type-specific genes show striking and distinct patterns of spatial expression in the mouse brain. Proc. Natl. Acad. Sci. USA 2013, 110, 3095–3100. [Google Scholar] [CrossRef]
- Montano, C.M.; Irizarry, R.A.; Kaufmann, W.E.; Talbot, K.; Gur, R.E.; Feinberg, A.P.; Taub, M.A. Measuring cell-type specific differential methylation in human brain tissue. Genome Biol. 2013, 14, R94. [Google Scholar] [CrossRef]
- Turner, B.M. Defining an epigenetic code. Nat. Cell Biol. 2007, 9, 2–6. [Google Scholar] [CrossRef]
- Maleszka, R. Epigenetic code and insect behavioural plasticity. Curr. Opin. Insect Sci. 2016, 15, 45–52. [Google Scholar] [CrossRef]
- Lister, R.; Pelizzola, M.; Dowen, R.H.; Hawkins, R.D.; Hon, G.; Tonti-Filippini, J.; Nery, J.R.; Lee, L.; Ye, Z.; Ngo, Q.M.; et al. Human DNA methylomes at base resolution show widespread epigenomic differences. Nature 2009, 462, 315–322. [Google Scholar] [CrossRef]
- Lister, R.; Mukamel, E.A.; Nery, J.R.; Urich, M.; Puddifoot, C.A.; Johnson, N.D.; Lucero, J.; Huang, Y.; Dwork, A.J.; Schultz, M.D.; et al. Global epigenomic reconfiguration during mammalian brain development. Science (N. Y.) 2013, 341, 629–640. [Google Scholar] [CrossRef]
- Maleszka, R. Epigenetic integration of environmental and genomic signals in honey bees: The critical interplay of nutritional, brain and reproductive networks. Epigenetics 2008, 3, 188–192. [Google Scholar] [CrossRef] [PubMed]
- Lyko, F.; Maleszka, R. Insects as innovative models for functional studies of DNA methylation. Trends Genet. 2011, 27, 127–131. [Google Scholar] [CrossRef] [PubMed]
- Wang, Y.; Jorda, M.; Jones, P.L.; Maleszka, R.; Ling, X.; Robertson, H.M.; Mizzen, C.A.; Peinado, M.A.; Robinson, G.E. Functional CpG methylation system in a social insect. Science (N. Y.) 2006, 314, 645–647. [Google Scholar] [CrossRef]
- Menzel, R. The honeybee as a model for understanding the basis of cognition. Nat. Rev. Neurosci. 2012, 13, 758–768. [Google Scholar] [CrossRef]
- Lyko, F.; Foret, S.; Kucharski, R.; Wolf, S.; Falckenhayn, C.; Maleszka, R. The honey bee epigenomes: Differential methylation of brain DNA in queens and workers. PLoS Biol. 2010, 8, e1000506. [Google Scholar] [CrossRef]
- Foret, S.; Kucharski, R.; Pellegrini, M.; Feng, S.H.; Jacobsen, S.E.; Robinson, G.E.; Maleszka, R. DNA methylation dynamics, metabolic fluxes, gene splicing, and alternative phenotypes in honey bees. Proc. Natl. Acad. Sci. USA 2012, 109, 4968–4973. [Google Scholar] [CrossRef] [PubMed]
- Wedd, L.; Maleszka, R. DNA methylation and gene regulation in honeybees: From genome-wide analyses to obligatory epialleles. Adv. Exp. Med. Biol. 2016, 945, 193–211. [Google Scholar] [CrossRef] [PubMed]
- Yagound, B.; Smith, N.M.A.; Buchmann, G.; Oldroyd, B.P.; Remnant, E.J. Unique DNA methylation profiles are associated with cis-variation in honey bees. Genome Biol. Evol. 2019, 11, 2517–2530. [Google Scholar] [CrossRef]
- Kucharski, R.; Foret, S.; Maleszka, R. EGFR gene methylation is not involved in royalactin controlled phenotypic polymorphism in honey bees. Sci. Rep. 2015, 5, 14070. [Google Scholar] [CrossRef]
- Welsh, L.; Maleszka, R.; Foret, S. Detecting rare asymmetrically methylated cytosines and decoding methylation patterns in the honeybee genome. R. Soc. Open Sci. 2017, 4, 170248. [Google Scholar] [CrossRef]
- Lockett, G.A.; Kucharski, R.; Maleszka, R. DNA methylation changes elicited by social stimuli in the brains of worker honey bees. Genes Brain Behav. 2012, 11, 235–242. [Google Scholar] [CrossRef]
- Witthoft, W. Anzahl und Verteilung der Zellen im Hirn der Honigbiene. Z. Morphol. Tiere 1967, 61, 160–184. [Google Scholar] [CrossRef]
- Wojciechowski, M.; Rafalski, D.; Kucharski, R.; Misztal, K.; Maleszka, J.; Bochtler, M.; Maleszka, R. Insights into DNA hydroxymethylation in the honeybee from in-depth analyses of TET dioxygenase. Open Biol. 2014, 4, 140110. [Google Scholar] [CrossRef] [PubMed]
- Ashby, R.; Foret, S.; Searle, I.; Maleszka, R. MicroRNAs in honey bee caste determination. Sci. Rep. 2016, 6, 18794. [Google Scholar] [CrossRef] [PubMed]
- Wedd, L.; Kucharski, R.; Maleszka, R. Differentially methylated obligatory epialleles modulate context-dependent LAM gene expression in the honeybee Apisb mellifera. Epigenetics 2016, 11, 1–10. [Google Scholar] [CrossRef] [PubMed]
- Zhang, V.; Kucharski, R.; Landers, C.; Richards, S.N.; Bröer, S.; Martin, R.E.; Maleszka, R. Characterization of a dopamine transporter and its splice variant reveals novel features of dopaminergic regulation in the honey bee. Front. Physiol. 2019, 10, 1375. [Google Scholar] [CrossRef]
- Tedjakumala, S.R.; Rouquette, J.; Boizeau, M.L.; Mesce, K.A.; Hotier, L.; Massou, I.; Giurfa, M. A tyrosine-hydroxylase characterization of dopaminergic neurons in the honey bee brain. Front. Syst. Neurosci. 2017, 11, 47. [Google Scholar] [CrossRef]
- Wojciechowski, M.; Lowe, R.; Maleszka, J.; Conn, D.; Maleszka, R.; Hurd, P.J. Phenotypically distinct female castes in honey bees are defined by alternative chromatin states during larval development. Genome Res. 2018, 28, 1532–1542. [Google Scholar] [CrossRef]
- Wagner, J.R.; Busche, S.; Ge, B.; Kwan, T.; Pastinen, T.; Blanchette, M. The relationship between DNA methylation, genetic and expression inter-individual variation in untransformed human fibroblasts. Genome Biol. 2014, 15, R37. [Google Scholar] [CrossRef]
- Lea, A.J.; Vockley, C.M.; Johnston, R.A.; Del Carpio, C.A.; Barreiro, L.B.; Reddy, T.E.; Tung, J. Genome-wide quantification of the effects of DNA methylation on human gene regulation. eLife 2018, 7, e37513. [Google Scholar] [CrossRef]
- Eichten, S.R.; Briskine, R.; Song, J.; Li, Q.; Swanson-Wagner, R.; Hermanson, P.J.; Waters, A.J.; Starr, E.; West, P.T.; Tiffin, P.; et al. Epigenetic and genetic influences on dna methylation variation in maize populations. Plant Cell 2013, 25, 2783–2797. [Google Scholar] [CrossRef] [PubMed]
- Wu, H.; Coskun, V.; Tao, J.; Xie, W.; Ge, W.; Yoshikawa, K.; Li, E.; Zhang, Y.; Sun, Y.E. Dnmt3a-dependent nonpromoter DNA methylation facilitates transcription of neurogenic genes. Science (N. Y.) 2010, 329, 444–448. [Google Scholar] [CrossRef] [PubMed]
- Harris, C.J.; Scheibe, M.; Wongpalee, S.P.; Liu, W.; Cornett, E.M.; Vaughan, R.M.; Li, X.; Chen, W.; Xue, Y.; Zhong, Z.; et al. A DNA methylation reader complex that enhances gene transcription. Science (N. Y.) 2018, 362, 1182–1186. [Google Scholar] [CrossRef] [PubMed]
- Maleszka, J.; Barron, A.B.; Helliwell, P.G.; Maleszka, R. Effect of age, behaviour and social environment on honey bee brain plasticity. J. Comp. Physiol. 2009, 195, 733–740. [Google Scholar] [CrossRef] [PubMed]
- Evans, J.D.; Schwarz, R.S.; Chen, Y.P.; Budge, G.; Cornman, R.S.; De la Rua, P.; de Miranda, J.R.; Foret, S.; Foster, L.; Gauthier, L.; et al. Standard methods for molecular research in Apis mellifera. J. Apic. Res. 2013, 52, 1–53. [Google Scholar] [CrossRef]
- Lin, P.; Foret, S.; Wilson, S.R.; Burden, C.J. Estimation of the methylation pattern distribution from deep sequencing data. BMC Bioinform. 2015, 16, 145. [Google Scholar] [CrossRef]
- Becker, N.; Kucharski, R.; Rossler, W.; Maleszka, R. Age-dependent transcriptional and epigenomic responses to light exposure in the honey bee brain. FEBS Open Bio 2016, 6, 622–639. [Google Scholar] [CrossRef]


© 2020 by the authors. Licensee MDPI, Basel, Switzerland. This article is an open access article distributed under the terms and conditions of the Creative Commons Attribution (CC BY) license (http://creativecommons.org/licenses/by/4.0/).
Share and Cite
Kucharski, R.; Maleszka, R. Exploring DNA Methylation Diversity in the Honey Bee Brain by Ultra-Deep Amplicon Sequencing. Epigenomes 2020, 4, 10. https://doi.org/10.3390/epigenomes4020010
Kucharski R, Maleszka R. Exploring DNA Methylation Diversity in the Honey Bee Brain by Ultra-Deep Amplicon Sequencing. Epigenomes. 2020; 4(2):10. https://doi.org/10.3390/epigenomes4020010
Chicago/Turabian StyleKucharski, Robert, and Ryszard Maleszka. 2020. "Exploring DNA Methylation Diversity in the Honey Bee Brain by Ultra-Deep Amplicon Sequencing" Epigenomes 4, no. 2: 10. https://doi.org/10.3390/epigenomes4020010
APA StyleKucharski, R., & Maleszka, R. (2020). Exploring DNA Methylation Diversity in the Honey Bee Brain by Ultra-Deep Amplicon Sequencing. Epigenomes, 4(2), 10. https://doi.org/10.3390/epigenomes4020010