Sub-Antarctic Freshwater Invertebrate Thermal Tolerances: An Assessment of Critical Thermal Limits and Behavioral Responses


Abstract
1. Introduction
2. Materials and Methods
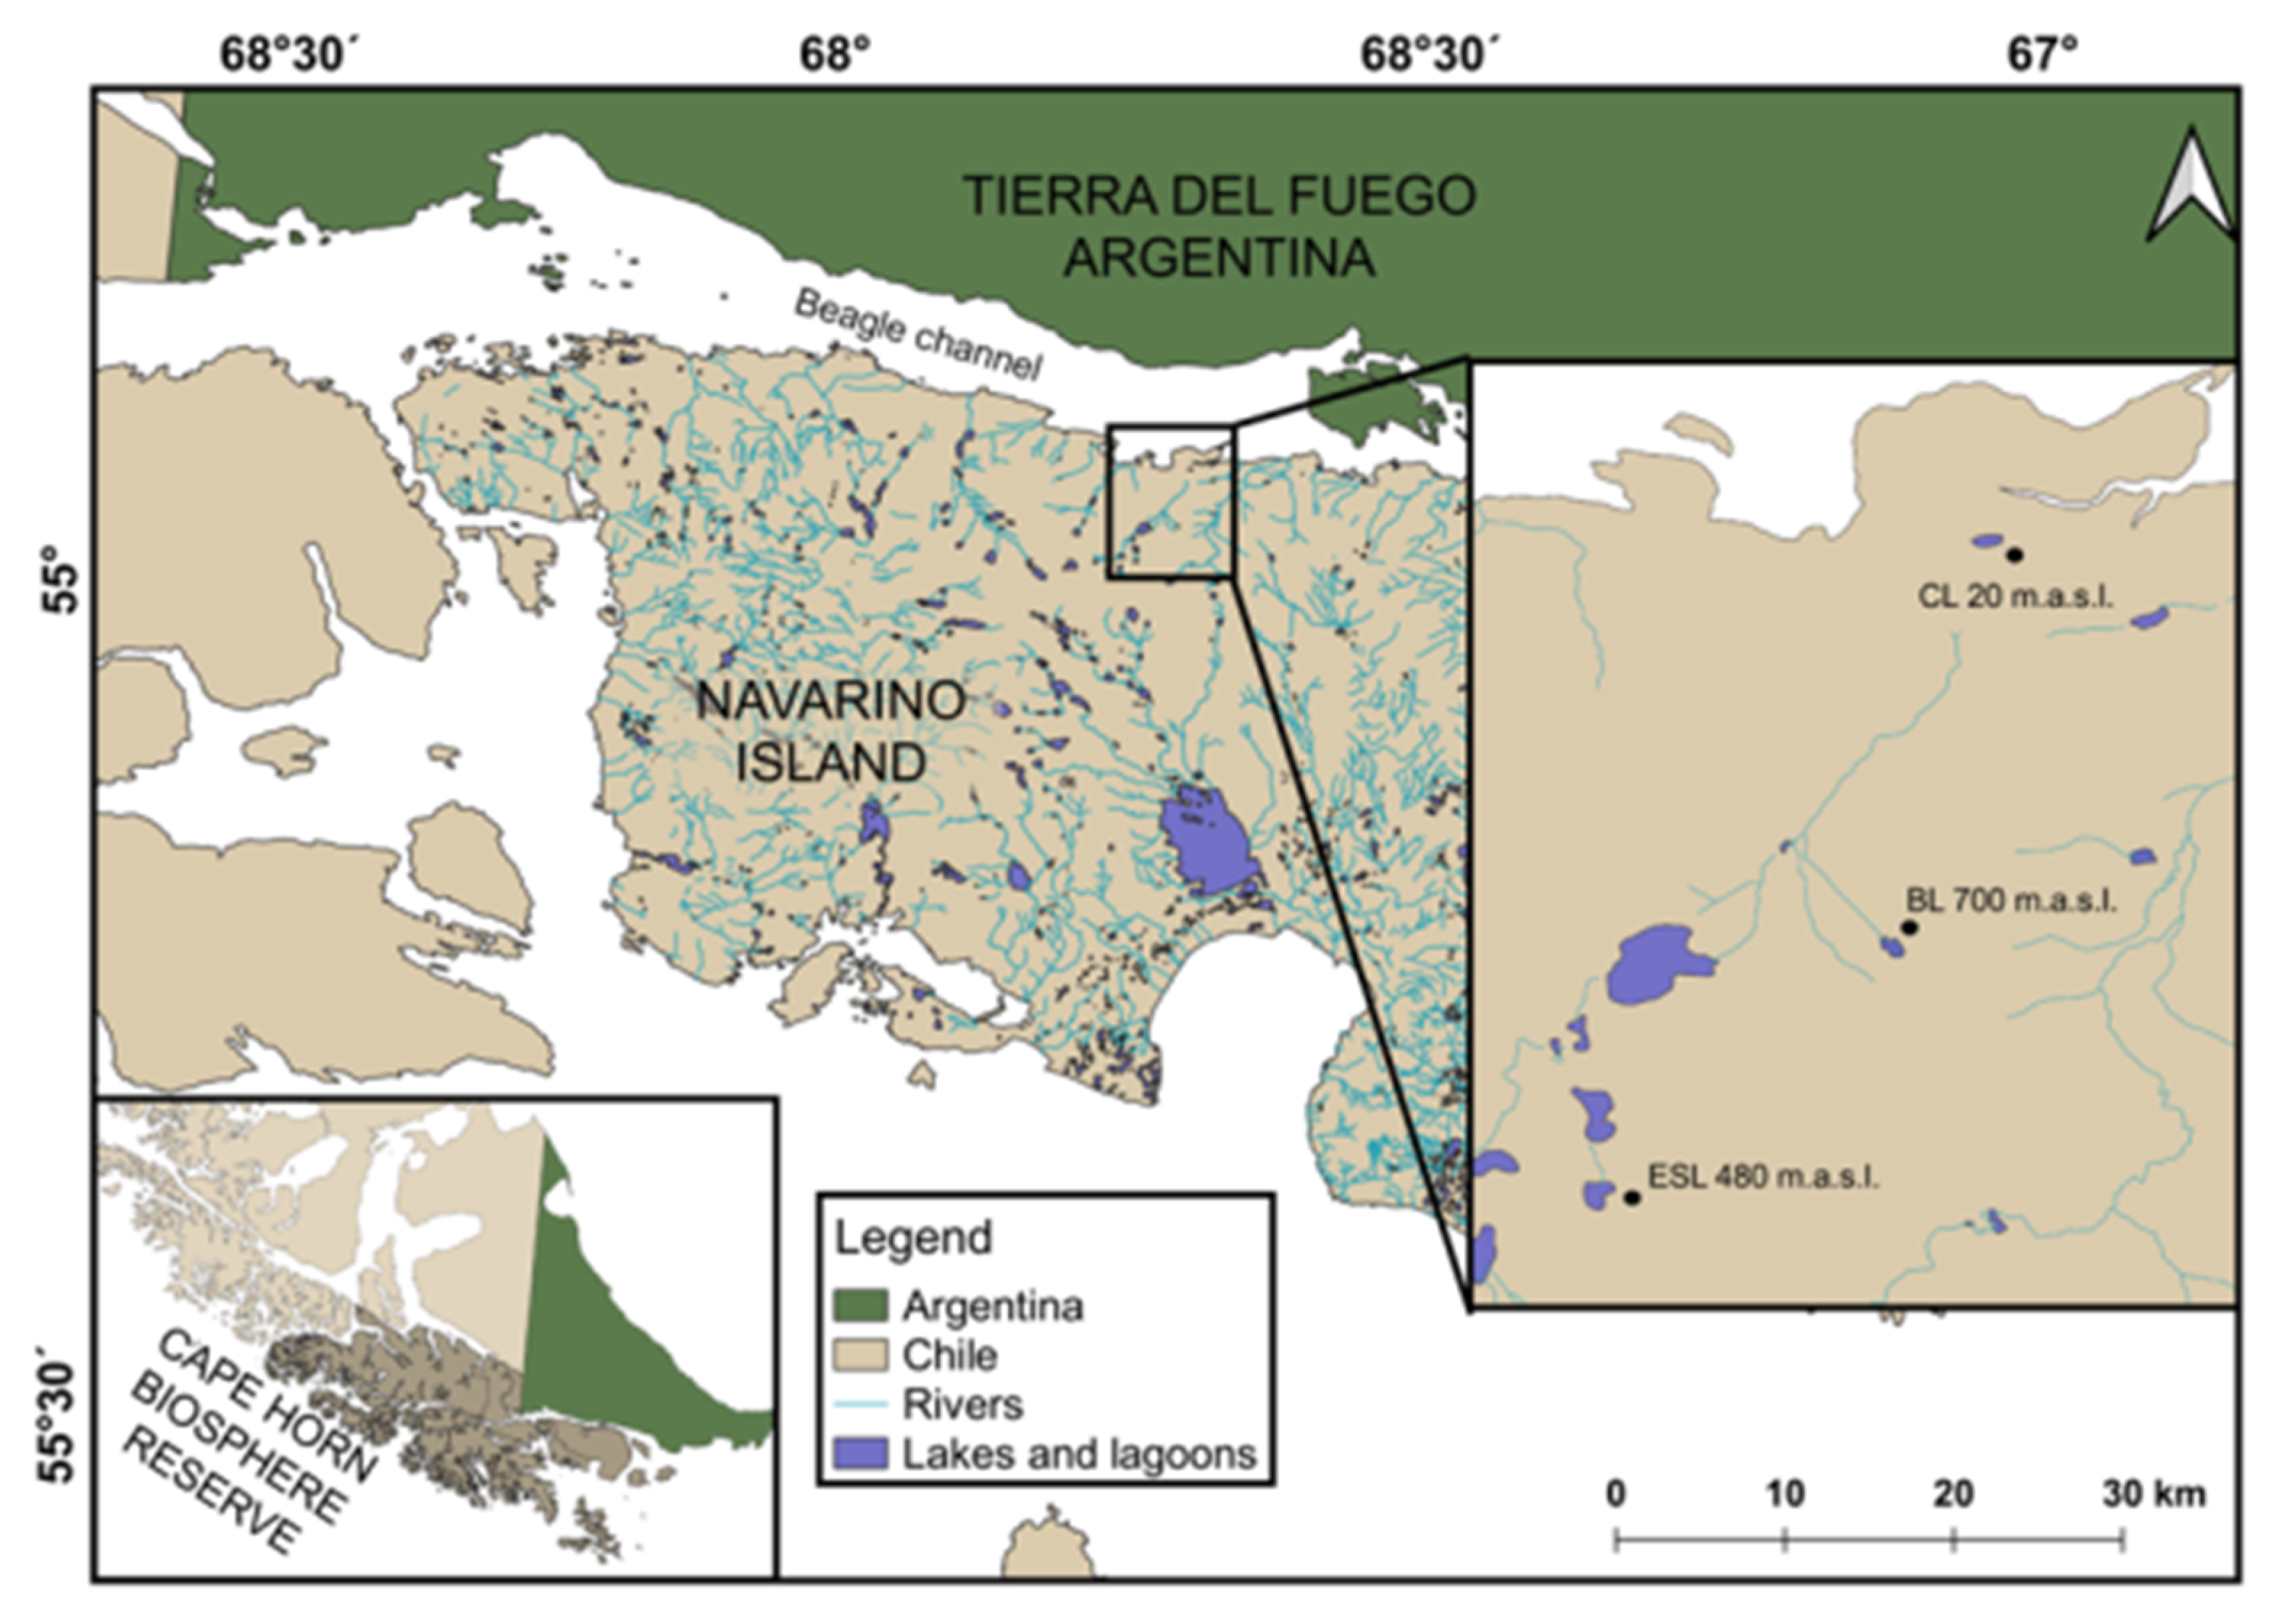
2.1. Area of Study
2.2. Site Description
2.3. Water Temperature
2.4. Collection of Study Organisms
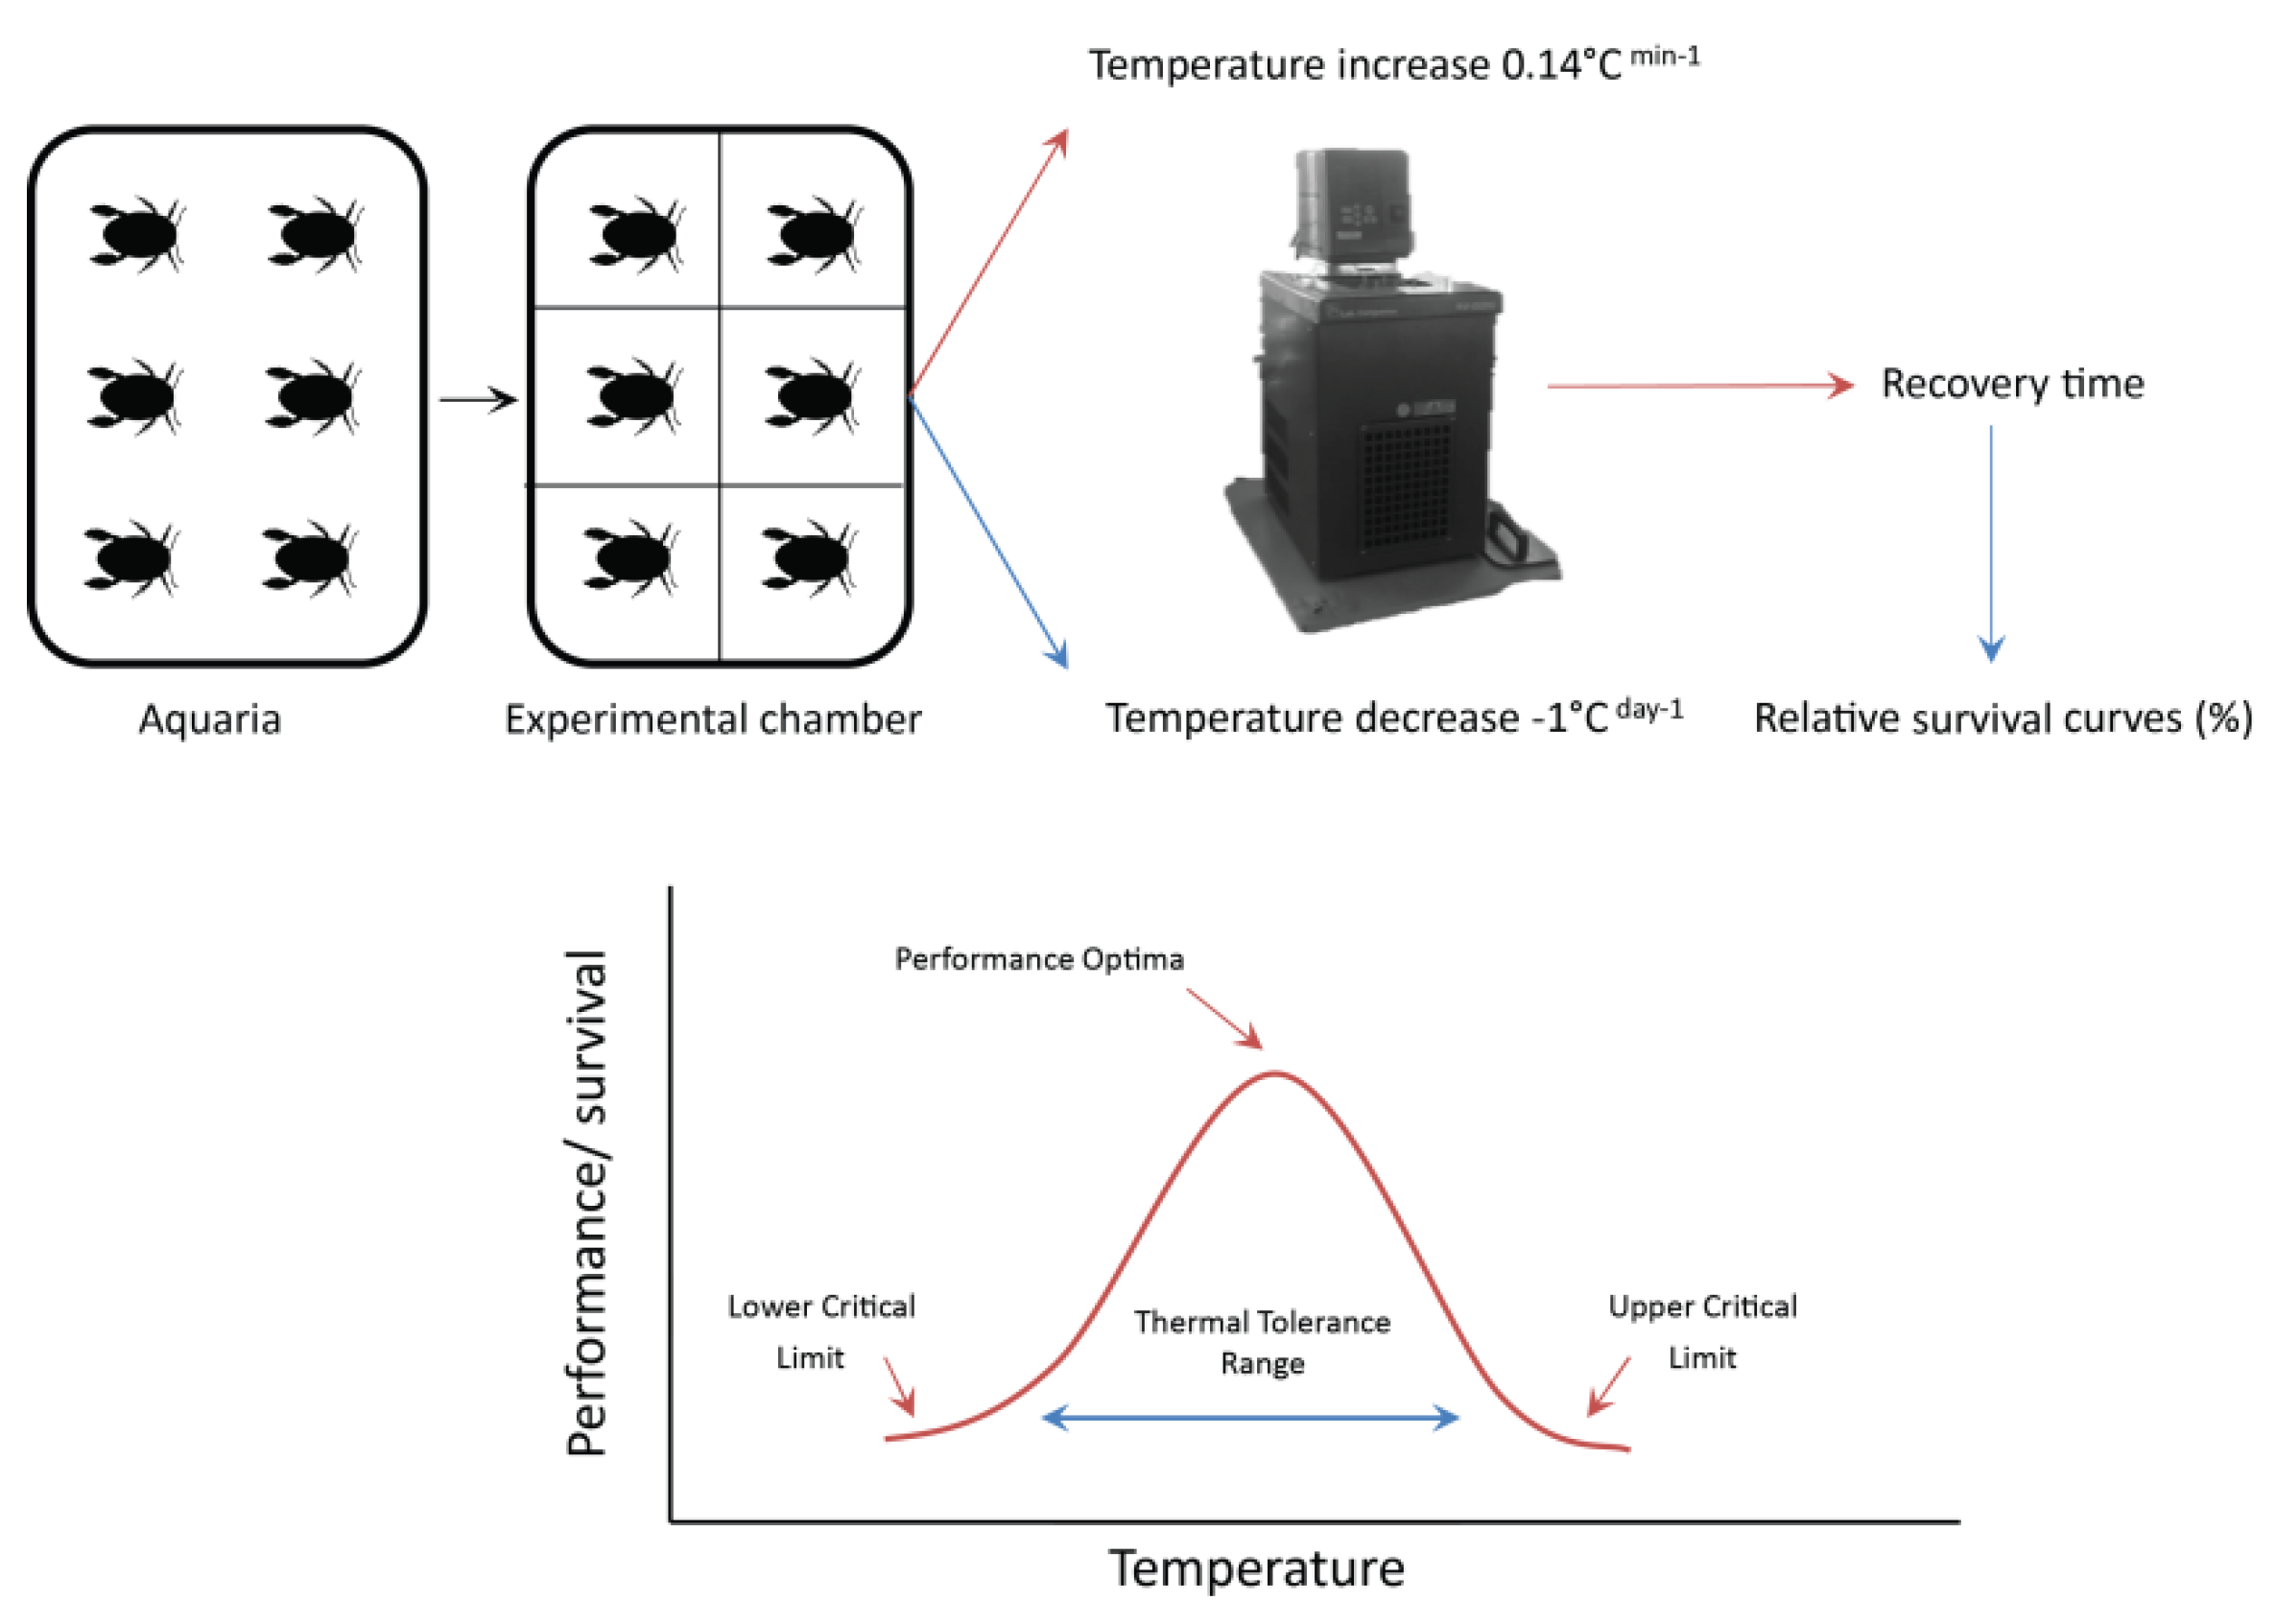
2.5. Critical Thermal Limits
2.6. Assessment of Suitability and Thermal Sensitivity Ranks
2.7. Statistical Analyses
3. Results
3.1. Water Temperature Variability
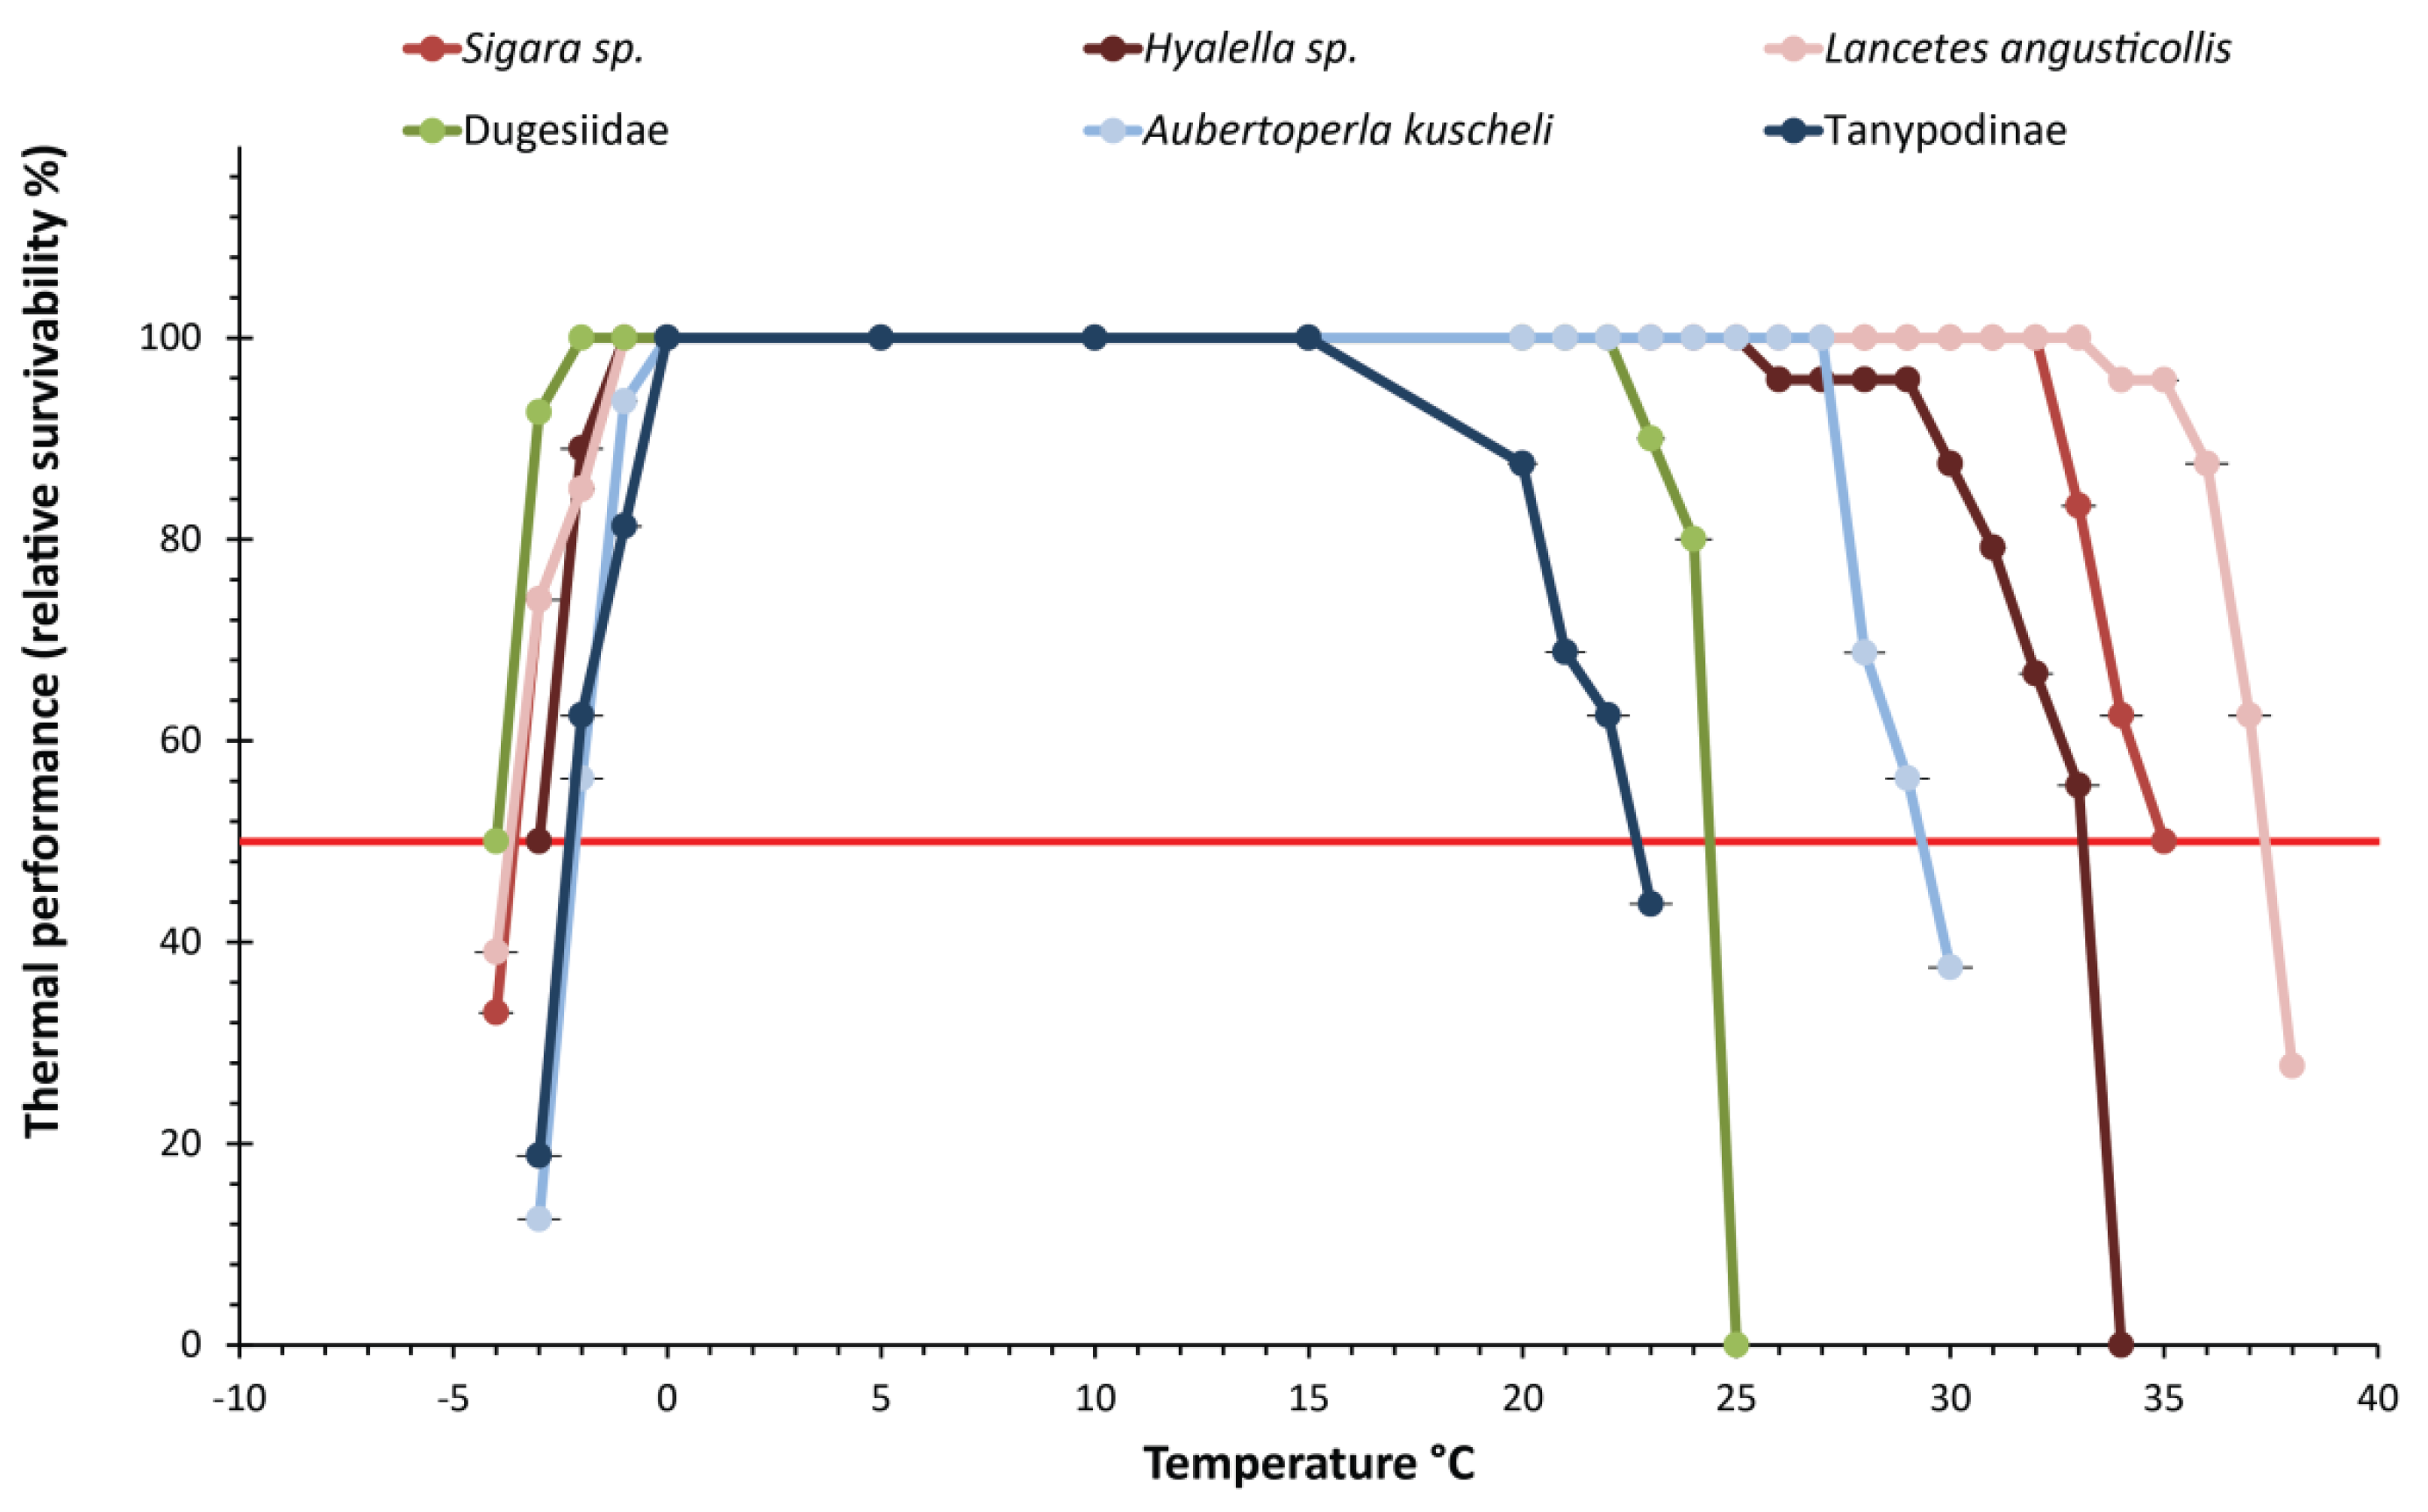
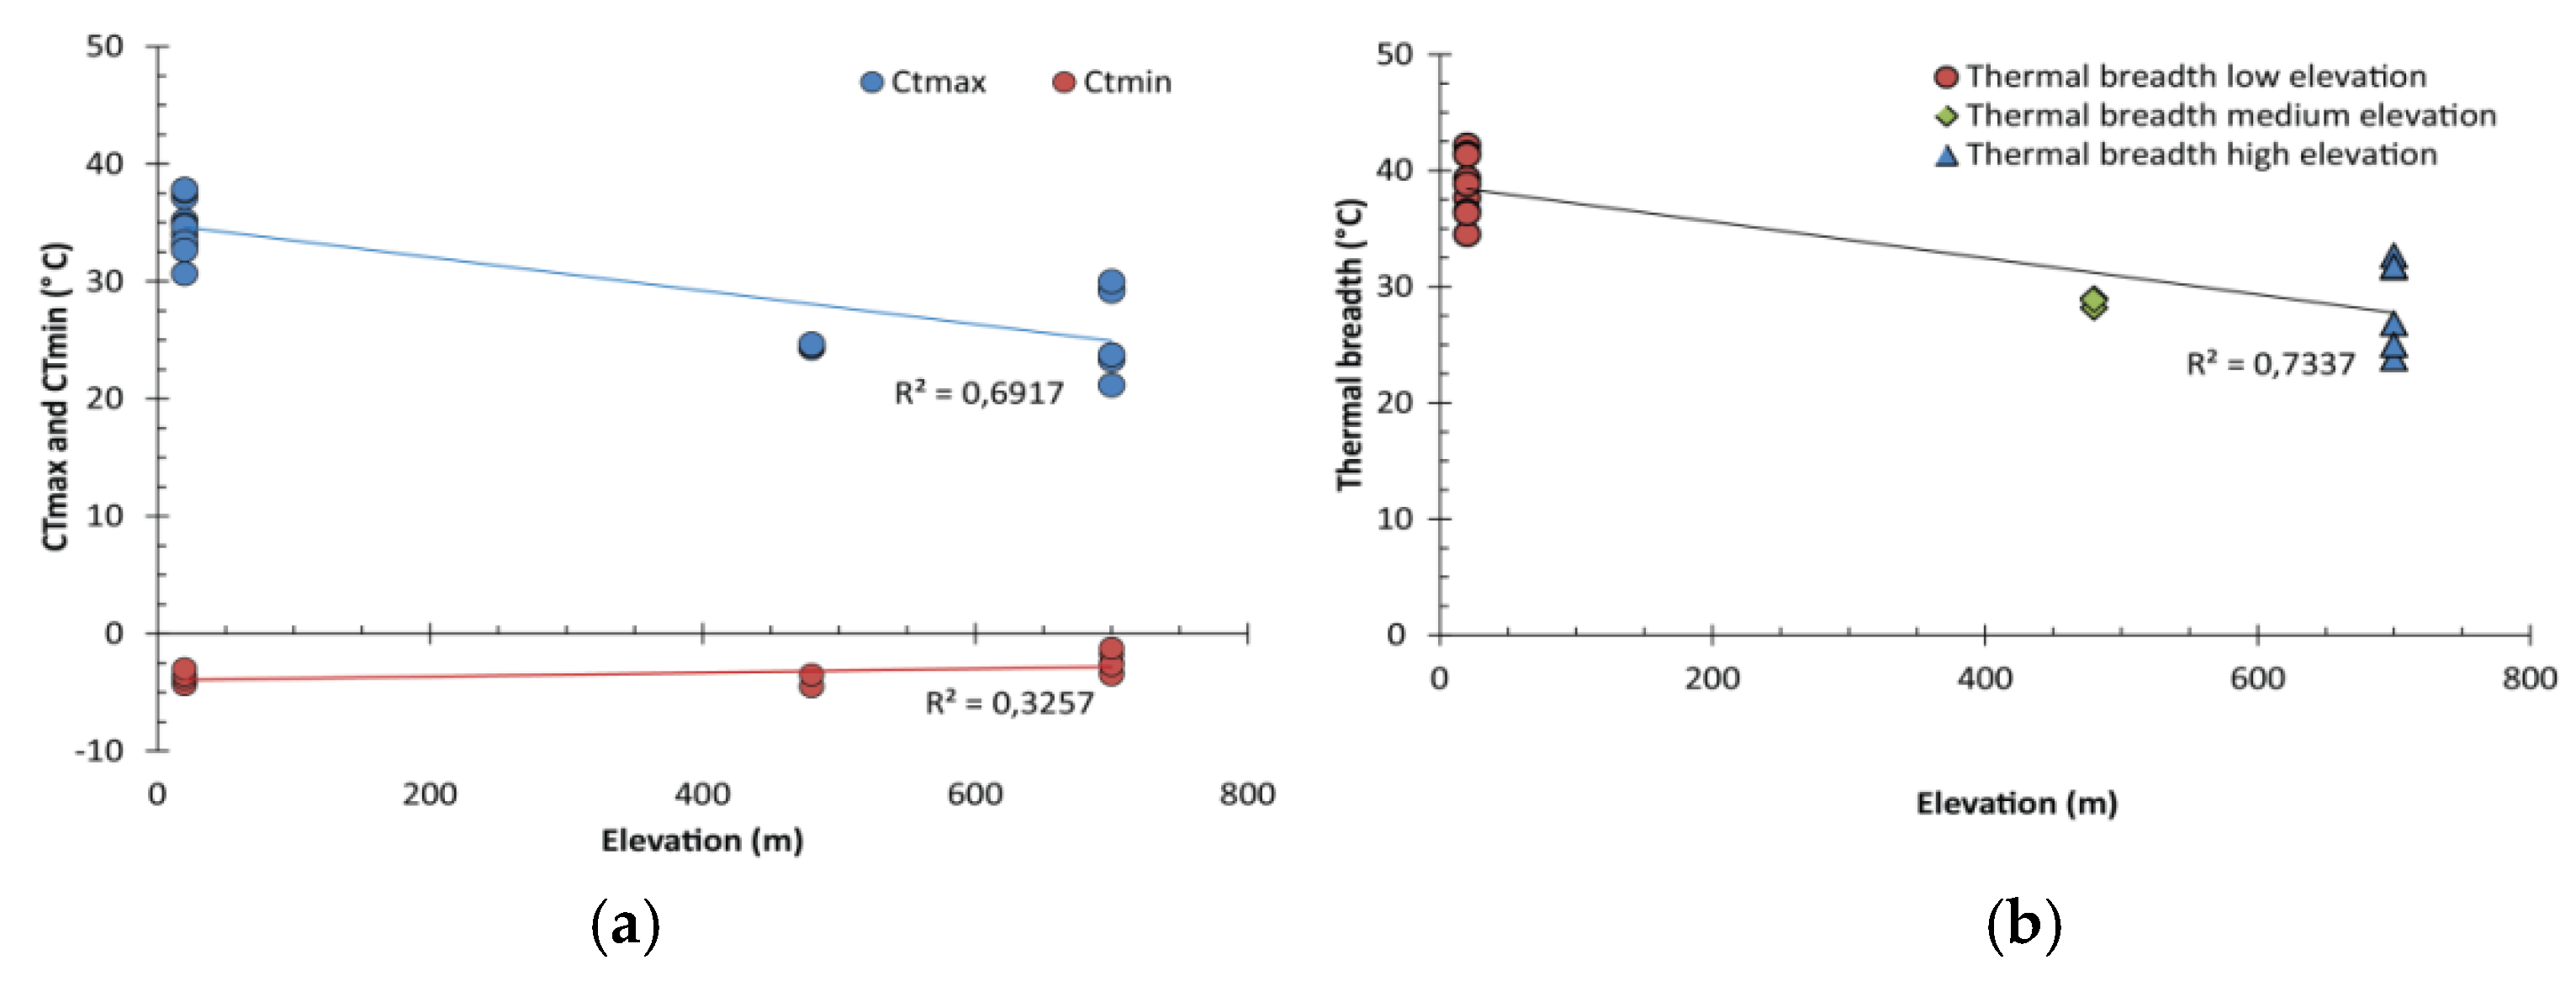
3.2. Critical Thermal Maxima and Minima of Macroinvertebrates Restricted to Low Elevation
3.3. Critical Thermal Maxima and Minima of Macroinvertebrates Restricted to High Elevation
3.4. Behavioral Responses, Suitability, and Thermal Sensitivity Ranks
4. Discussion
5. Conclusions
Supplementary Materials
Author Contributions
Funding
Acknowledgments
Conflicts of Interest
References
- Lomolino, M. Elevation gradients of species-density: Historical and prospective views. Glob. Ecol. Biogeogr. 2001, 10, 3–13. [Google Scholar] [CrossRef]
- Bozinovic, F.; Calosi, P.; Spicer, J.I. Physiological correlates of geographic range in animals. Annu. Rev. Ecol. Evol. Syst. 2011, 42, 155–179. [Google Scholar] [CrossRef]
- Spicer, J.I.; Gaston, K.J. Physiological Diversity and its Ecological Implications; Blackwell Sci.: Oxford, UK, 1999; p. 241. [Google Scholar]
- Angilletta, M.J. Thermal Adaptation: A Theoretical and Empirical Synthesis; Oxford University Press: Oxford, UK, 2009; p. 289. [Google Scholar]
- Gaston, K.J.; Chown, S.L. Why Rapoport´s rule does not generalize. Oikos 1999, 84, 309–312. [Google Scholar] [CrossRef]
- Janzen, D.H. Why mountain passes are higher in the tropics. Am. Nat. 1967, 101, 233–249. [Google Scholar] [CrossRef]
- Stevens, G.C. The latitudinal gradient in geographical range: How so many species coexist in the tropics. Am. Nat. 1989, 133, 240–256. [Google Scholar] [CrossRef]
- Shah, A.; Gill, B.; Encalada, A.; Flecker, A.; Funk, W.C.; Guayasamin, J.; Kondratieff, B.; LeRoy Poff, W.; Thomas, S.; Zamudio, K.; et al. Climate variavility predicts thermal limits of aquatic insects across elevation and latitude. Funct. Ecol. 2017, 31, 2118–2127. [Google Scholar] [CrossRef]
- Hoffmann, A.A.; Chown, S.L.; Clusella-Trullas, S. Upper thermal limits in terrestrial ectotherms: How constrained are they? Funct. Ecol. 2013, 27, 934–949. [Google Scholar] [CrossRef]
- Sunday, J.M.; Bates, A.E.; Dulvy, N.K. Global analysis of thermal tolerance and latitude in ectotherms. Proc. R. Soc. B 2011, 278, 1823–1830. [Google Scholar] [CrossRef]
- Addo-Bediako, A.; Chown, S.L.; Gaston, K.J. Thermal tolerance, climatic variability and latitude. Proc. R. Soc. B 2000, 174, 595–612. [Google Scholar] [CrossRef]
- Ghalambor, C.K.; Huey, R.B.; Martin, P.R.; Tewksbury, J.J.; Wang, G. Are mountain passes higher in the tropics? Janzen’s hypothesis revisited. ICB 2006, 46, 5–17. [Google Scholar] [CrossRef]
- Sheldon, K.S.; Tewksbury, J.J. The impact of seasonality in temperature on thermal tolerance and elevational range size. Ecology 2014, 95, 2134–2143. [Google Scholar] [CrossRef] [PubMed]
- Oyen, K.J.; Giri, S.; Dillon, M.E. Altitudinal variation in bumble bee (Bombus) critical thermal limits. J. Therm. Biol. 2016, 59, 52–57. [Google Scholar] [CrossRef] [PubMed]
- Čiamporová-Zaťovičová, Z.; Hamerlík, L.; Šporka, F.; Bitušík, P. Littoral benthic macroinvertebrates of alpine lakes (Tatra Mts) along an altitudinal gradient: A basis for climate change assessment. Hydrobiologia 2010, 648, 19–34. [Google Scholar] [CrossRef]
- Dallas, H.F. Water temperature and riverine ecosystems: An overview of knowledge and approaches for assessing biotic response, with special reference to South Africa. Water SA 2008, 34, 393–404. [Google Scholar] [CrossRef]
- Dallas, H.F.; Rivers-Moore, N.A. Critical thermal maxima of aquatic macroinvertebrates: Towards identifying bioindicators of thermal alteration. Hydrobiologia 2012, 679, 61–76. [Google Scholar] [CrossRef]
- Chown, S.L.; Terblanche, J.S. Physiological diversity in insects: Ecological and evolutionary contexts. Adv. Insect Physiol. 2007, 33, 50–152. [Google Scholar]
- Allen, J.L.; Clusella-Trullas, S.; Chown, S.L. The effects of acclimation and rates of temperature change on critical thermal limits in Tenebrio molitor (Tenebrionidae) and Cyrtobagous salviniae (Curculionidae). J. Insect Physiol. 2012, 58, 669–678. [Google Scholar] [CrossRef]
- Rezende, E.L.; Castañeda, L.E.; Santos, M. Tolerance landscapes in thermal ecology. Funct. Ecol. 2014, 28, 799–809. [Google Scholar] [CrossRef]
- Bates, A.E.; McKelvie, C.M.; Sorte, C.J.; Morley, S.A.; Jones, N.A.; Mondon, J.A.; Bird, T.J.; Quien, G. Geographical range, heat tolerance and invasion success in aquatic species. Proc. R. Soc. B 2013, 280, 20131958. [Google Scholar] [CrossRef]
- Chown, S.L.; Hoffmann, A.A.; Kristensen, T.N.; Angilletta Jr, M.J.; Stensenth, N.C.; Pertoldi, C. Adapting to climate change: A perspective from evolutionary physiology. Clim. Res. 2010, 43, 3–15. [Google Scholar] [CrossRef]
- Chown, S.L.; Duffy, G.A.; Sørensen, J.G. Upper thermal tolerance in aquatic insects. Curr. Opin. Insect Sci. 2015, 11, 78–83. [Google Scholar] [CrossRef] [PubMed]
- Gutiérrez-Pesquera, L.M.; Tejedo, M.; Olalla-Tárraga, M.Á.; Duarte, H.; Nicieza, A.; Solé, M. Testing the climate variability hypothesis in thermal tolerance limits of tropical and temperate tadpoles. J. Biogeogr. 2016, 43, 1166–1178. [Google Scholar] [CrossRef]
- Jumbam, K.R.; Terblanche, J.S.; Deere, J.A.; Somers, M.J.; Chown, S.L. Critical thermal limits and their responses to acclimation in two sub-Antarctic spiders: Myro kerguelenensis and Prinerigone vagans. Pol. Biol. 2008, 31, 215–220. [Google Scholar] [CrossRef]
- Rozzi, R.; Armesto, J.J.; Gutiérrez, J.; Massardo, F.; Likens, G.; Anderson, C.B.; Poole, A.; Moses, K.; Hargrove, G.; Mansilla, A.; et al. Integrating ecology and environmental ethics: Earth stewardship in the southern end of the Americas. BioScience 2012, 62, 226–236. [Google Scholar] [CrossRef]
- Contador, T.; Kennedy, J.H.; Rozzi, R.; Ojeda, J. Sharp altitudinal gradients in Magellanic Sub-Antarctic streams: Patterns along a fluvial system in the Cape Horn Biosphere Reserve (55° S). Polar Biol. 2015, 38, 1853–1866. [Google Scholar] [CrossRef]
- Rendoll Cárcamo, J.; Contador, T.; Gañán, M.; Pérez Troncoso, C.; Maldonado Márquez, A.; Convey, P.; Kennedy, J.; Rozzi, R. Altitudinal gradients in Magellanic sub-Antarctic lagoons: The effect of elevation on freshwater macroinvertebrate diversity and distribution. PeerJ 2019, 7, e7128. [Google Scholar] [CrossRef]
- Rozzi, R.; Massardo, F.; Berghöfer, A.; Anderson, C.; Mansilla, A.; Mansilla, M.; Plana, J.; Berghöfer, U.; Barros, E.; Araya, P. La Reserva de Biosfera Cabo de Hornos. Programa MaB-UNESCO; Ediciones Universidad de Magallanes: Punta Arenas, Chile, 2006. [Google Scholar]
- Hedin, L.O.; Armesto, J.J.; Johnson, A.H. Patterns of nutrient loss from unpolluted, old-growth temperate forests: Evaluation of biogeochemical theory. Ecology 1995, 76, 493–509. [Google Scholar] [CrossRef]
- Weathers, K.C.; Lovett, G.M.; Likens, G.; Caraco, N.F.M. Cloudwater inputs of nitrogen to forest ecosystems in southern Chile: Forms, fluxes, and sources. Ecosystems 2000, 3, 590–595. [Google Scholar] [CrossRef]
- Mach, P.M.; Winfield, J.L.; Aguilar, R.A.; Wright, K.C.; Verbeck, G.F. A portable mass spectrometer study targeting anthropogenic contaminants in Sub-Antarctic Puerto Williams, Chile. Int. J. Mass Spectrom. 2016, 422, 148–153. [Google Scholar] [CrossRef]
- Méndez, M.; Rozzi, R.; Cavieres, L. Flora vascular y no-vascular en la zona altoandina de la isla Navarino (55° S), Reserva de Biosfera Cabo de Hornos, Chile. Gayana Botánica 2013, 70, 337–343. [Google Scholar] [CrossRef]
- Contador, T.; Kennedy, J.H.; Ojeda, J.; Feinsinger, P.; Rozzi, R. Ciclos de vida de insectos dulceacuícolas y cambio climático global en la ecorregión subantártica de Magallanes: Investigaciones ecológicas a largo plazo en el Parque Etnobotánico Omora, Reserva de Biosfera Cabo de Hornos (55° S). Revista Bosque 2014, 35, 429–437. [Google Scholar] [CrossRef]
- Barry, R.G. Mountain Weather and Climate; Cambridge University Press: Cambridge, UK, 2008; p. 506. [Google Scholar]
- Ernst, M.; Beitinger, T.; Stewart, K. Critical maxima of nymphs of three Plecoptera species from an Ozark foothill stream. Freshw. Invertebr. Biol. 1984, 3, 80–85. [Google Scholar] [CrossRef]
- Sprague, J. Resistance of four freshwater crustaceans to lethal high temperatures and low oxygen. J. Fish. Res. Board Can. 1963, 20, 387–415. [Google Scholar] [CrossRef]
- Suren, A.M. Bryophytes as invertebrate habitat in two New Zealand streams. Freshw. Biol. 1991, 26, 399–418. [Google Scholar] [CrossRef]
- Suren, A.M.; Winterbourn, M.J. The influence of periphyton, detritus and shelter on invertebrate colonization of aquatic bryophytes. Freshw. Biol. 1992, 27, 327–339. [Google Scholar] [CrossRef]
- Terblanche, J.S.; Deere, J.A.; Clusella-Trullas, S.; Janion, C.; Chown, S.L. Critical thermal limits depend on methodological context. Proc. R. Soc. B 2007, 274, 2935–2942. [Google Scholar] [CrossRef]
- Buchanan, J.A.; Stewart, B.A.; Davies, B.R. Thermal acclimation and tolerance to lethal high temperature in the mountain stream amphipod Paramelita nigroculus (Barnard). Comp. Biochem. Phys. A 1988, 89, 425–431. [Google Scholar] [CrossRef]
- Garten, C.T.; Gentry, J.B. Thermal tolerance of dragonfly nymphs. II. Comparison of nymphs from control and thermally altered environments. Physiol. Zool. 1976, 49, 206–213. [Google Scholar] [CrossRef]
- Heiman, D.R.; Knight, A.W. Upper lethal temperature relations of the nymphs of the stonefly. Paragnetina Media Hydrobiol. 1972, 39, 479–493. [Google Scholar] [CrossRef]


| Macroinvertebrate Taxa | Taxon Elevation Range | n CTmax | n CTmin | Site | Lat/Long | Elevation (m a.s.l.) |
|---|---|---|---|---|---|---|
| Lancetes angusticollis (Dytiscidae) | Broad (from 20 m to 380 m a.s.l.) | 24 | 18 | CL | 54°56′19′′ S/67°38′15′′ W | 20 |
| Sigara sp. (Corixidae) | Narrow (only near sea level) | 24 | 18 | CL | 54°56′19′′ S/67°38′15′′ W | 20 |
| Hyalella sp. (Hyalellidae) | Family with broad range, morpho-species narrow range. | 24 | 18 | CL | 54°56′19′′ S/67°38′15′′ W | 20 |
| Dugesiidae (Tricladida) | Narrow (only found at medium elevation) | 18 | 14 | ESL | 54°59′26′′ S/67°40′56′′ W | 480 |
| Aubertoperla kuscheli (Gripopterygidae) | Narrow (only found at high elevation) | 16 | 16 | BL | 54°58′26′′ S/67°38′41′′ W | 700 |
| Tanypodinae (Chironomidae) | Family with broad range, morpho-species narrow range. | 16 | 16 | BL | 54°58′26′′ S/67°38′41′′ W | 700 |
| Macroinvertebrate Taxa | Mean CTmax | Mean CTmin | Mean Thermal Breadth |
|---|---|---|---|
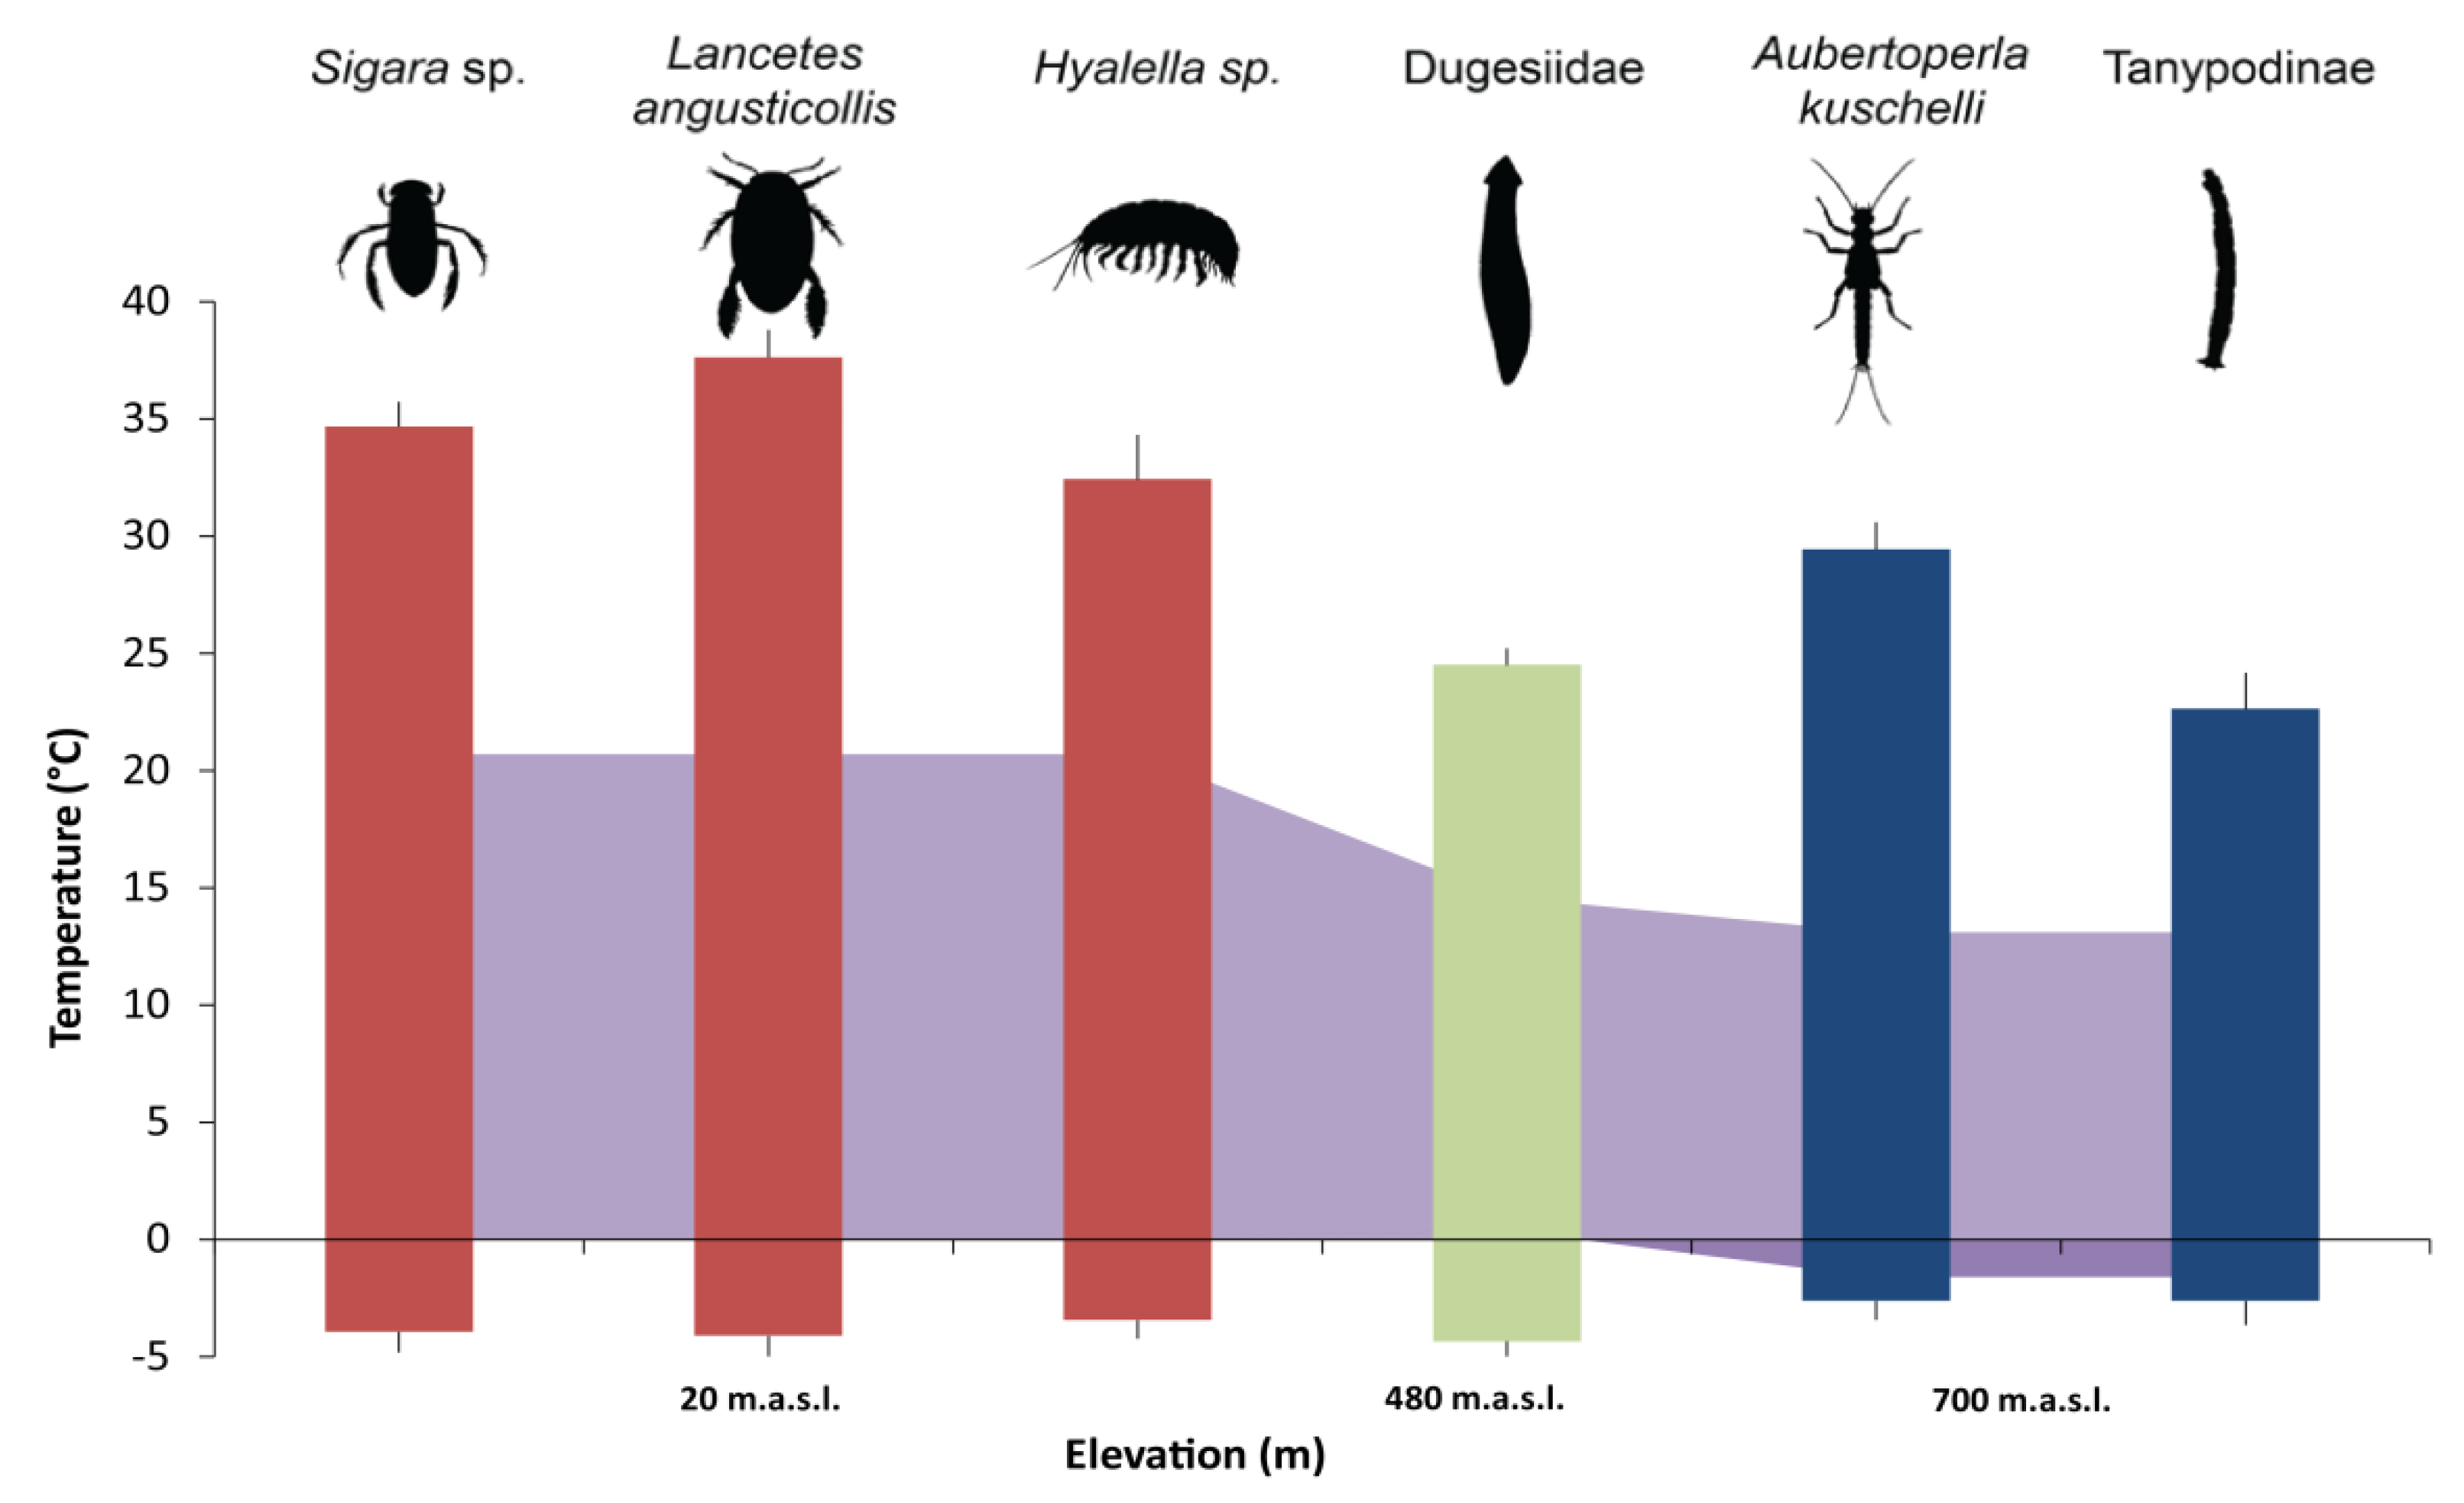
| Sigara sp. (Corixidae) | 34.7 (±1.05) | −3.9 (±0.87) | 38.6 (±1.24) |
| Lancetes angusticollis (Dytiscidae) | 37.6 (±1.17) | −4.1 (±0.90) | 41.7 (±1.52) |
| Hyalella sp. (Hyalellidae) | 32.4 (±1.91) | −3.4 (±0.78) | 35.9 (±2.59) |
| Dugesiidae (Tricladida) | 24.5 (±0.71) | −4.4 (±0.63) | 28.9 (±1.07) |
| Aubertoperla kuscheli (Gripopterygidae) | 29.4 (±1.15) | −2.6 (±0.81) | 32.1 (±1.29) |
| Tanypodinae (Chironomidae) | 22.6 (±1.54) | −2.6 (±1.02) | 25.3 (±1.69) |
| Total Treatments | H | p | |
|---|---|---|---|
| CTmax | 20 | 114.09 | <0.00001 |
| CTmin | 17 | 56.272 | 0.0043 |
| Thermal Breadth | 5 | 92.736 | <0.00001 |
| Macroinvertebrate Taxa | Behavioral Response | SR | TSR |
|---|---|---|---|
| Amphipoda: Hyalellidae Hyalella sp. | Before temperature increase, individuals swam intermittently in the experimental chambers, moving from bottom to top, and vice-versa. The PTR was apparent as a substantial decrease in swimming speed. The CTE was identified when individuals remained at the bottom of the chamber and stopped swimming. The only detectable movement was then from the antennae and hind legs. | 2 | 3 |
| Coleptera: Dytiscidae Lancetes angusticollis | Before temperature increase, individuals swam intermittently in the experimental chambers, moving from bottom to top, and vice-versa. The PTR was apparent as a substantial increase in movement, constantly grabbing air bubbles with difficulty in maintaining them. The CTE was identified as inactivity at the bottom of the chamber, or floating near the surface. | 3 | 3 |
| Hemiptera: Corixidae Sigara sp. | Before temperature increase, individuals swam intermittently in the experimental chambers, moving from bottom to top, and vice-versa. The PTR was apparent when individuals started to accelerate their movement. The CTE was reached when individuals sank to the bottom of the chamber, or floated at the top with no detectable movement other than the palas (anterior legs). | 3 | 3 |
| Rhabditophora: Tricladida Dugesiidae | Before temperature increase, individuals crawled on the bottom of the chamber. The PTR was apparent when individuals start to agitate their bodies sideways. When the CTE was reached, individuals started to expose their digestive structures outside their bodies and remained almost immobile at the bottom of the chamber. | 2 | 1 |
| Plecoptera: Gripopterygidae Aubertoperla kuscheli | Before temperature increase, individuals crawled on the bottom of the chamber, started moving their legs and cerci. As the PTR was reached individuals lost their grip and start swimming slowly. The CTE was identified when individuals lost grip and swimming capacity, floating at the top of the chamber and remaining immobile with the exception of antennal movement. | 2 | 2 |
| Diptera: Chironomidae Tanypodinae | Before temperature increase, individuals crawled on the bottom of the experimental chamber. The PTR was apparent when individuals started to move and shake at the bottom of the chamber. When they reached the CTE, individuals lost the ability to remain attached to the bottom and floated virtually motionless. | 1 | 1 |
© 2020 by the authors. Licensee MDPI, Basel, Switzerland. This article is an open access article distributed under the terms and conditions of the Creative Commons Attribution (CC BY) license (http://creativecommons.org/licenses/by/4.0/).
Share and Cite
Rendoll-Cárcamo, J.; Contador, T.; Convey, P.; Kennedy, J. Sub-Antarctic Freshwater Invertebrate Thermal Tolerances: An Assessment of Critical Thermal Limits and Behavioral Responses. Insects 2020, 11, 102. https://doi.org/10.3390/insects11020102
Rendoll-Cárcamo J, Contador T, Convey P, Kennedy J. Sub-Antarctic Freshwater Invertebrate Thermal Tolerances: An Assessment of Critical Thermal Limits and Behavioral Responses. Insects. 2020; 11(2):102. https://doi.org/10.3390/insects11020102
Chicago/Turabian StyleRendoll-Cárcamo, Javier, Tamara Contador, Peter Convey, and James Kennedy. 2020. "Sub-Antarctic Freshwater Invertebrate Thermal Tolerances: An Assessment of Critical Thermal Limits and Behavioral Responses" Insects 11, no. 2: 102. https://doi.org/10.3390/insects11020102
APA StyleRendoll-Cárcamo, J., Contador, T., Convey, P., & Kennedy, J. (2020). Sub-Antarctic Freshwater Invertebrate Thermal Tolerances: An Assessment of Critical Thermal Limits and Behavioral Responses. Insects, 11(2), 102. https://doi.org/10.3390/insects11020102