The Year of the Honey Bee (Apis mellifera L.) with Respect to Its Physiology and Immunity: A Search for Biochemical Markers of Longevity

 , , , ,
Abstract
1. Introduction
2. Materials and Methods
2.1. Experimental Bees
2.2. Haemolymph Collection
2.3. Physiological Parameters
2.4. Cellular Immunity
2.5. Humoral Immunity
2.6. Data Presentation and Statistical Analysis
3. Results
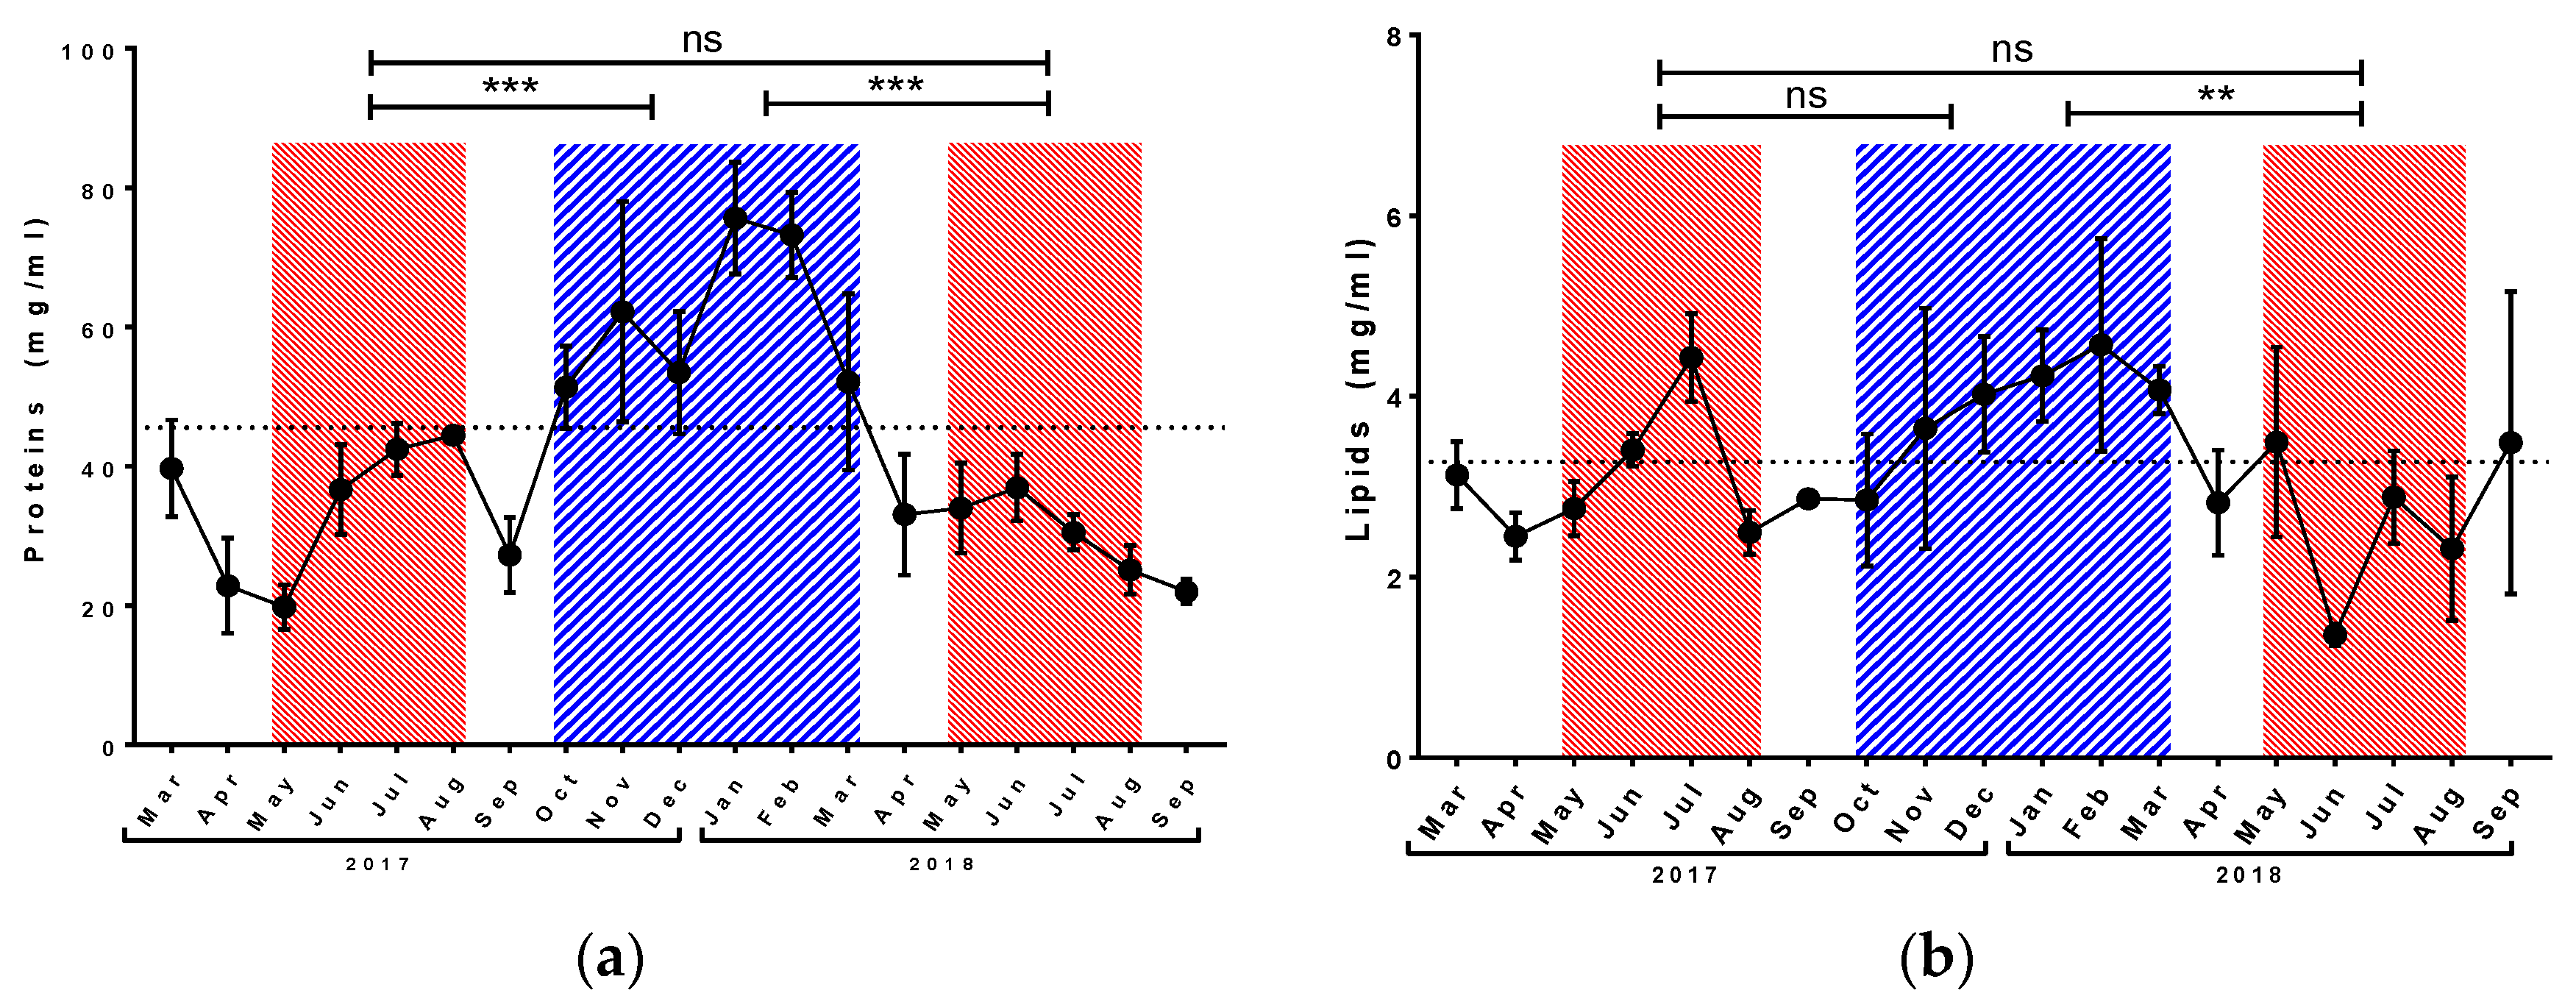
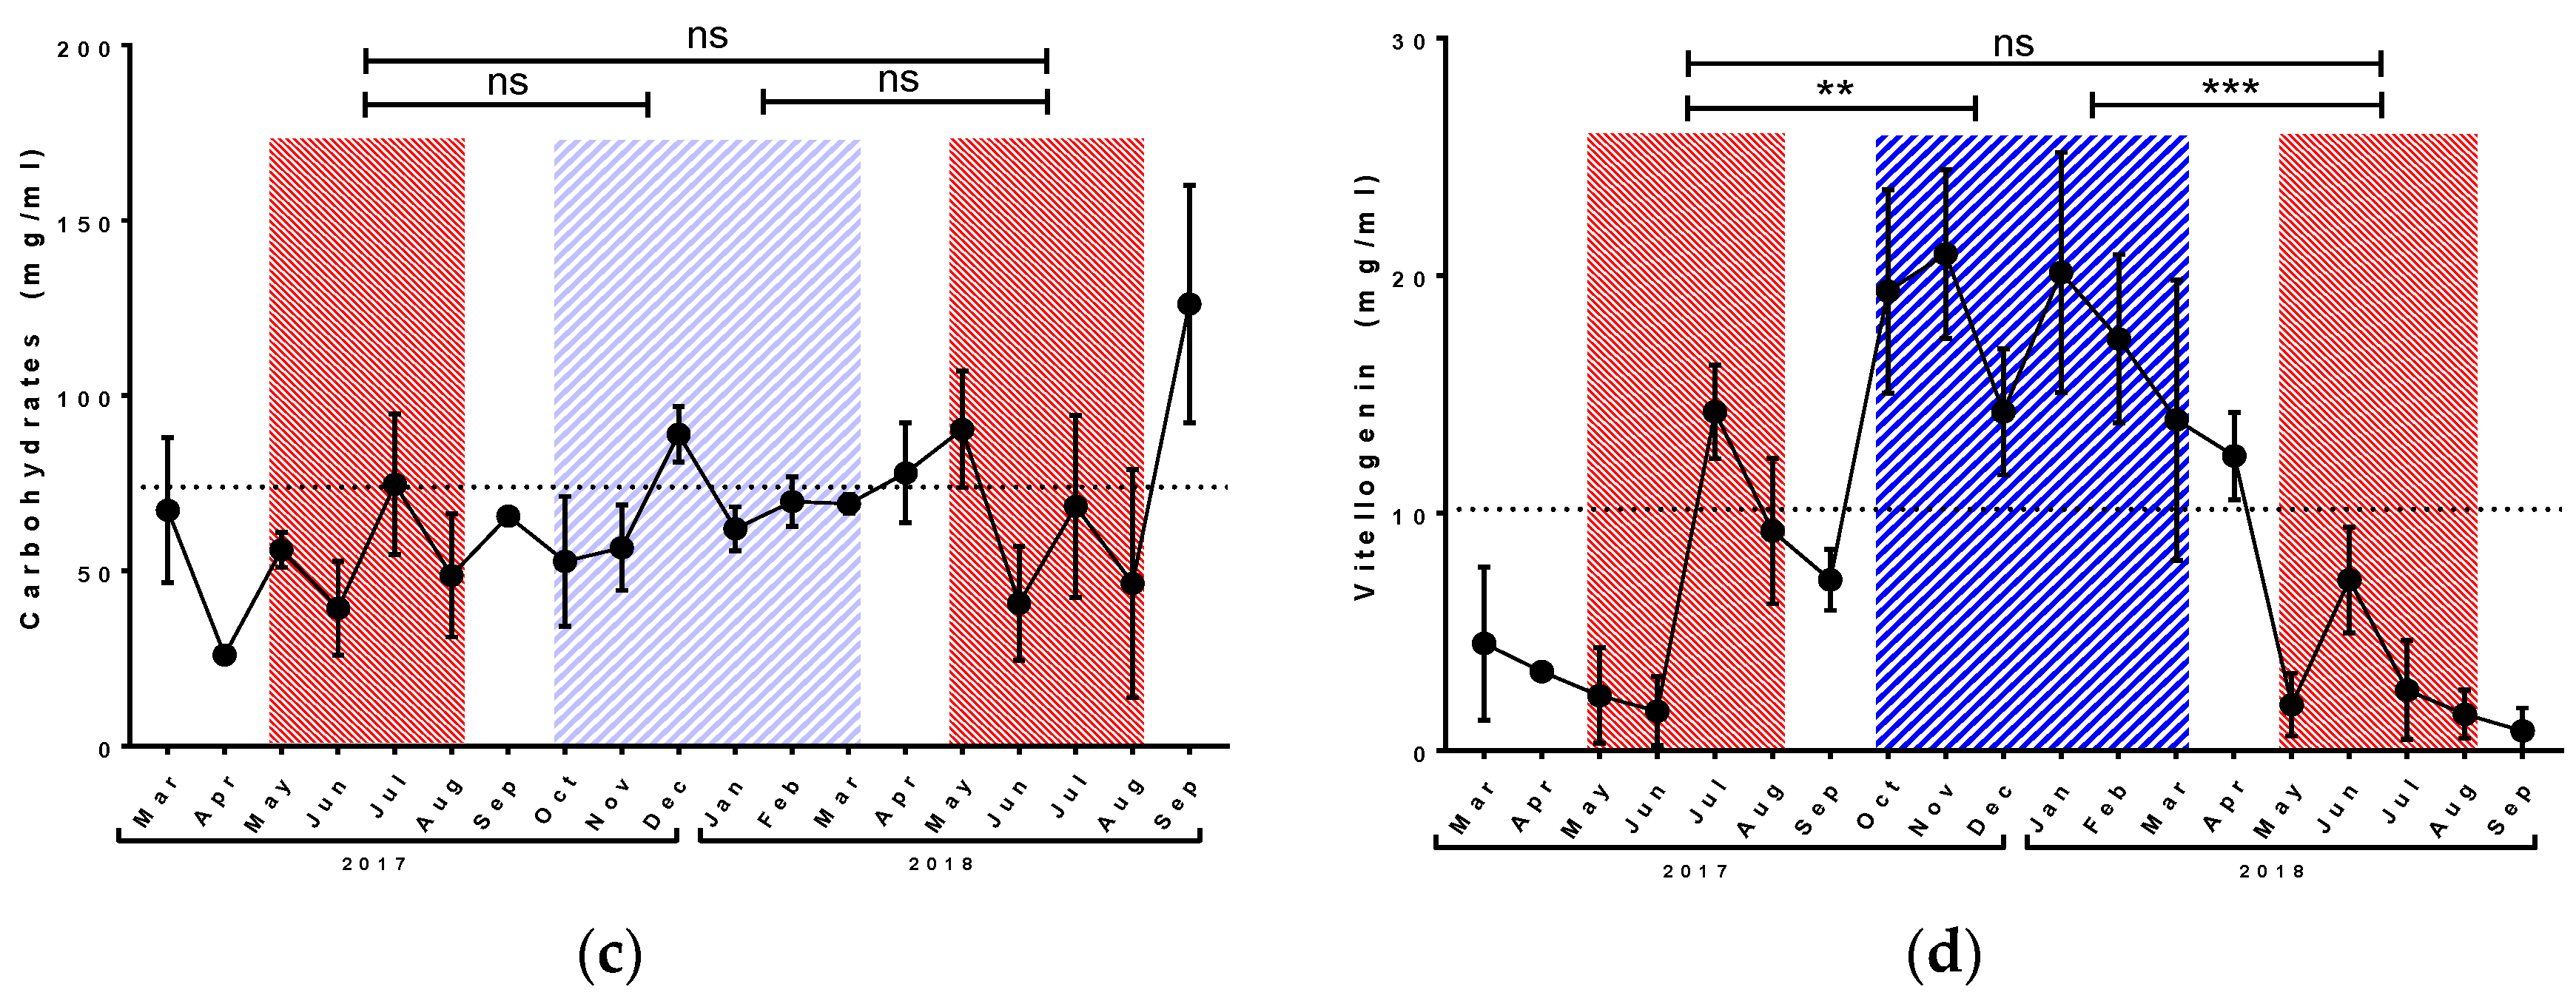
3.1. Physiological Parameters
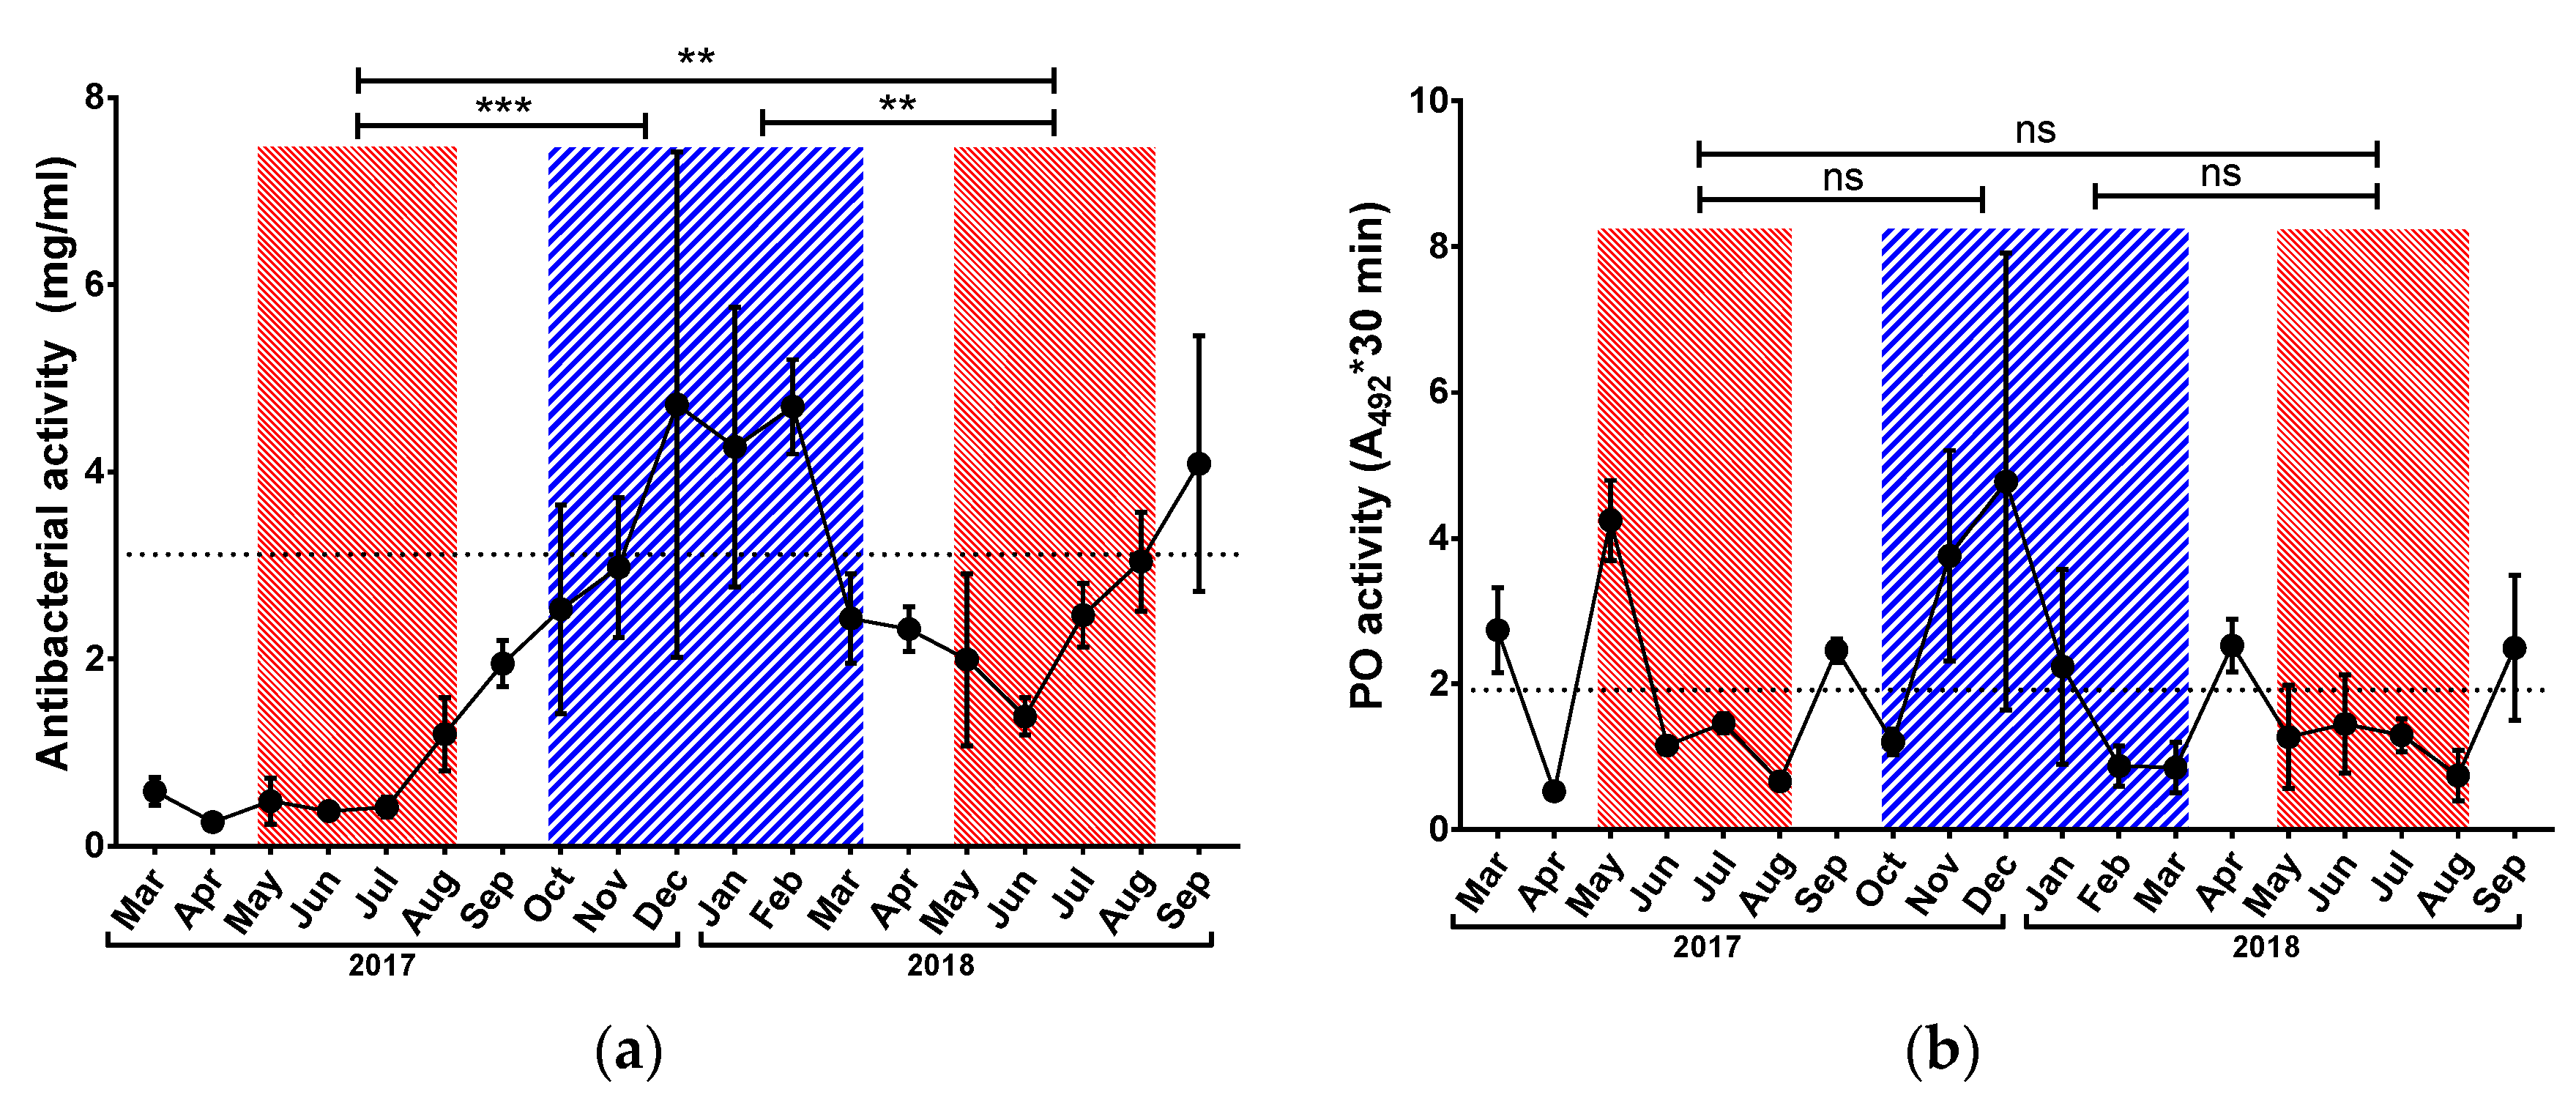
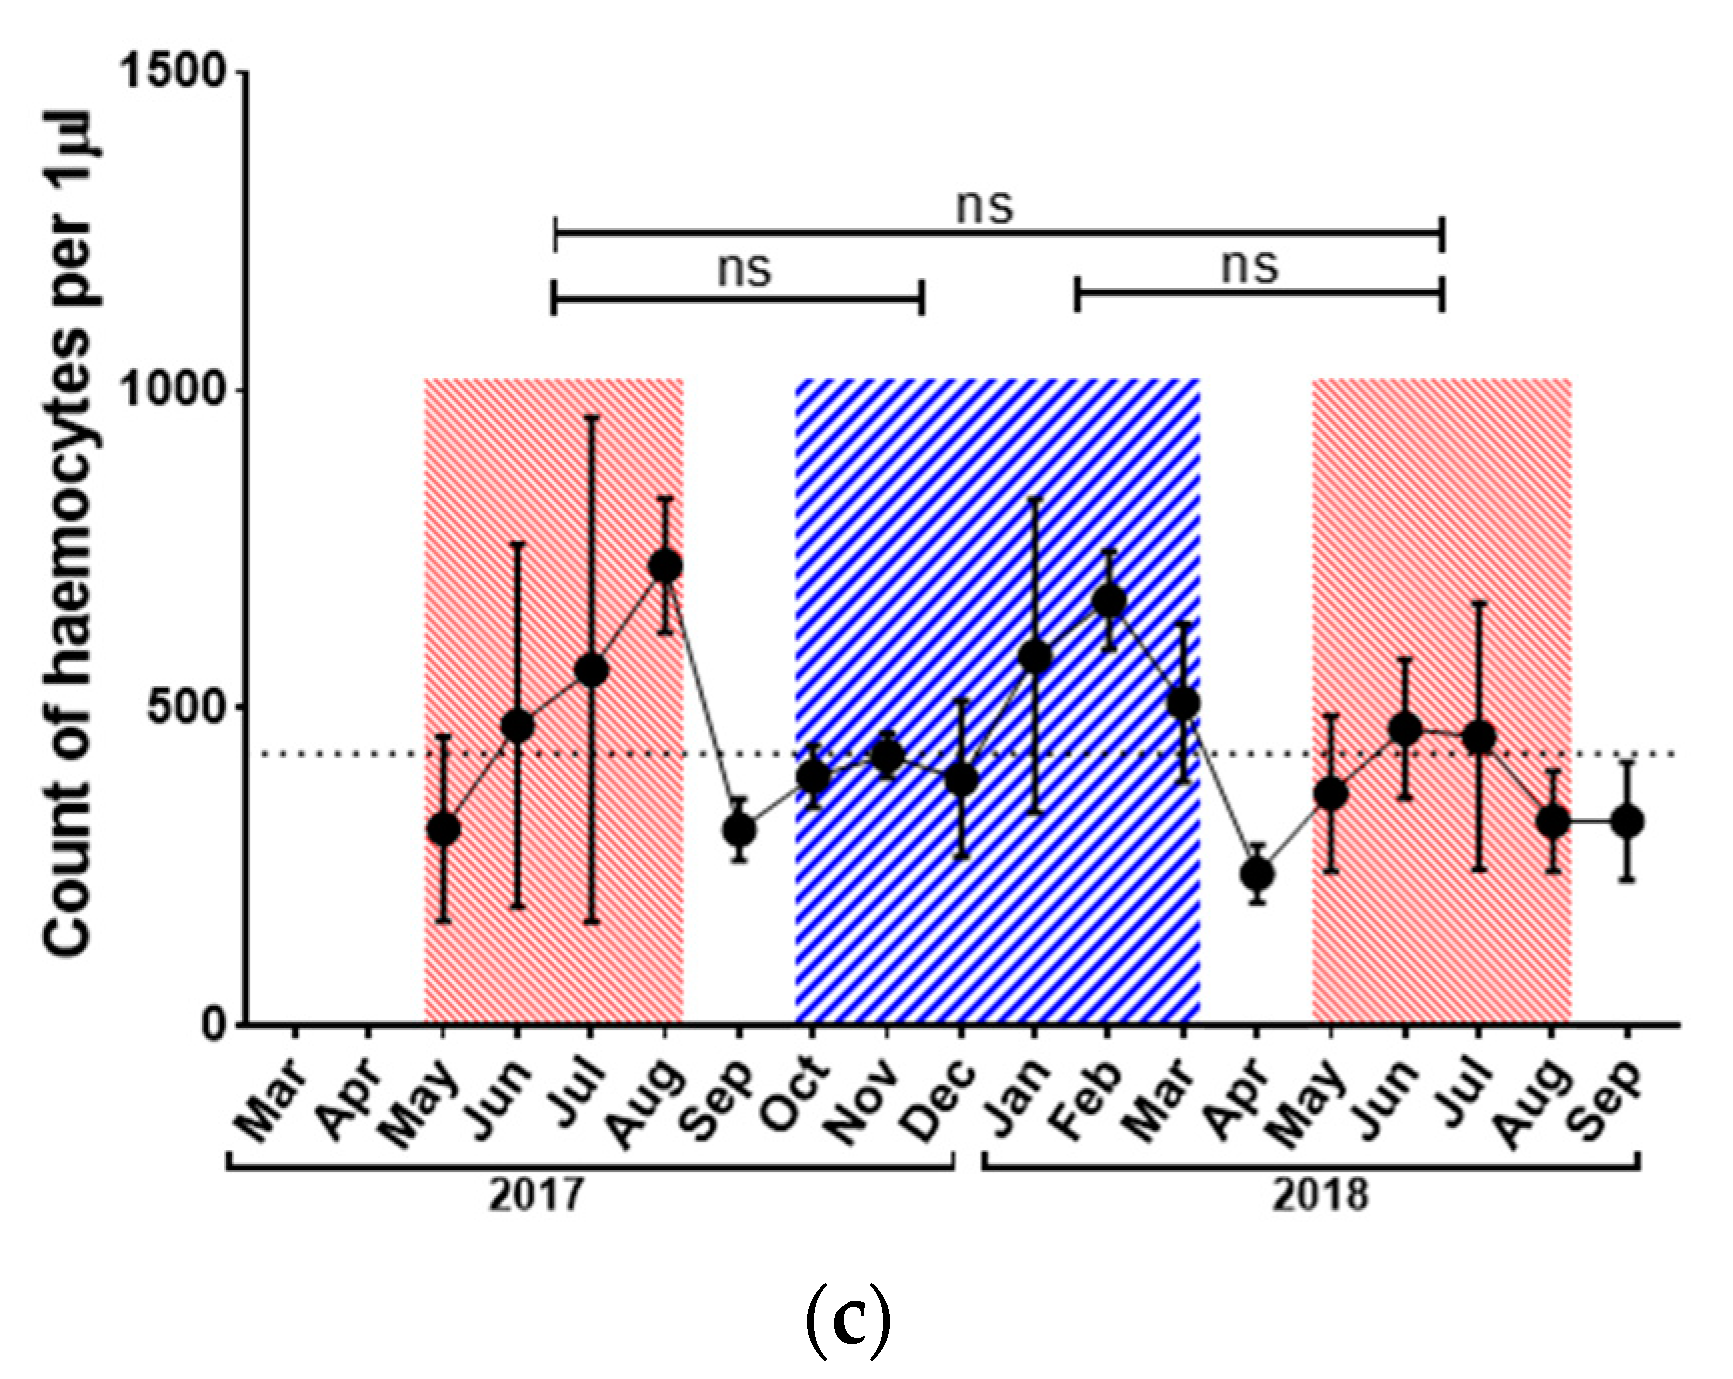
3.2. Immunological Parameters
4. Discussion
5. Conclusions
Supplementary Materials
Author Contributions
Funding
Acknowledgments
Conflicts of Interest
References
- Klatt, B.K.; Holzschuh, A.; Westphal, C.; Clough, Y.; Smit, I.; Pawelzik, E.; Tscharntke, T. Bee pollination improves crop quality, shelf life and commercial value. Proc. R. Soc. B Biol. Sci. 2013, 281, 20132440. [Google Scholar] [CrossRef] [PubMed]
- Klein, A.M.; Vaissière, B.E.; Cane, J.H.; Steffan-Dewenter, I.; Cunningham, S.A.; Kremen, C.; Tscharntke, T. Importance of pollinators in changing landscapes for world crops. Proc. R. Soc. B Biol. Sci. 2007, 274, 303–313. [Google Scholar] [CrossRef] [PubMed]
- Potts, S.G.; Biesmeijer, J.C.; Kremen, C.; Neumann, P.; Schweiger, O.; Kunin, W.E. Global pollinator declines: Trends, impacts and drivers. Trends Ecol. Evol. 2010, 25, 345–353. [Google Scholar] [CrossRef] [PubMed]
- Steinhauer, N.; Kulhanek, K.; Antúnez, K.; Human, H.; Chantawannakul, P.; Chauzat, M.P.; vanEngelsdorp, D. Drivers of colony losses. Curr. Opin. Insect Sci. 2018, 26, 142–148. [Google Scholar] [CrossRef] [PubMed]
- Williams, G.R.; Tarpy, D.R.; VanEngelsdorp, D.; Chauzat, M.P.; Cox-Foster, D.L.; Delaplane, K.S.; Neumann, P.; Pettis, J.S.; Rogers, R.E.L.; Shutler, D. Colony collapse disorder in context. BioEssays 2010, 32, 845–846. [Google Scholar] [CrossRef]
- vanEngelsdorp, D.; Evans, J.D.; Saegerman, C.; Mullin, C.; Haubruge, E.; Nguyen, B.K.; Frazier, M.; Frazier, J.; Cox-Foster, D.; Chen, Y.; et al. Colony collapse disorder: A descriptive study. PLoS ONE 2009, 4, e6481. [Google Scholar] [CrossRef] [PubMed]
- Danihlík, J.; Škrabišová, M.; Lenobel, R.; Šebela, M.; Omar, E.; Petřivalský, M.; Crailsheim, K.; Brodschneider, R. Does the pollen diet influence the production and expression of antimicrobial peptides in individual honey bees? Insects 2018, 9, 79. [Google Scholar] [CrossRef]
- Chauzat, M.-P.; Carpentier, P.; Martel, A.-C.; Bougeard, S.; Cougoule, N.; Porta, P.; Lachaize, J.; Madec, F.; Aubert, M.; Faucon, J.-P. Influence of Pesticide Residues on Honey Bee (Hymenoptera: Apidae) Colony Health in France. Environ. Entomol. 2009, 38, 514–523. [Google Scholar] [CrossRef]
- Settele, J.; Bishop, J.; Potts, S.G. Climate Change Impacts on Cold Climates. Treatise Geomorphol. 2016, 2, 430–459. [Google Scholar]
- Dainat, B.; Evans, J.D.; Chen, Y.P.; Gauthier, L.; Neumann, P. Predictive markers of honey bee colony collapse. PLoS ONE 2012, 7, e32151. [Google Scholar] [CrossRef]
- van Dooremalen, C.; Gerritsen, L.; Cornelissen, B.; van der Steen, J.J.M.; van Langevelde, F.; Blacquière, T. Winter survival of individual honey bees and honey bee colonies depends on level of varroa destructor infestation. PLoS ONE 2012, 7, e36285. [Google Scholar] [CrossRef] [PubMed]
- Fluri, P. Wie alt werden die Arbeitsbienen? Schweiz. Bienen Ztg. 1990, 113, 620–625. [Google Scholar]
- Mattila, H.R.; Harris, J.L.; Otis, G.W. Timing of production of winter bees in honey bee (Apis mellifera) colonies. Insectes Soc. 2001, 48, 88–93. [Google Scholar] [CrossRef]
- Seeley, T.D.; Visscher, P.K. Survival of honeybees in cold climates: The critical timing of colony growth and reproduction. Ecol. Entomol. 1985, 10, 81–88. [Google Scholar] [CrossRef]
- Eischen, F.A. Overwintering performance of honey bee colonies heavily infested with Acarapis woodi. Apidologie 1987, 18, 293–304. [Google Scholar] [CrossRef]
- Bowen-Walker, P.L.; Martin, S.J.; Gunn, A. Preferential distribution of the parasitic mite, Varroa jacobsoni Oud. on overwintering honeybee (Apis mellifera L.) workers and changes in the level of parasitism. Parasitology 1997, 114, 151–157. [Google Scholar] [CrossRef]
- Guzmán-Novoa, E.; Eccles, L.; Calvete, Y.; Mcgowan, J.; Kelly, P.G.; Correa-Benítez, A. Varroa destructor is the main culprit for the death and reduced populations of overwintered honey bee (Apis mellifera) colonies in Ontario, Canada. Apidologie 2010, 41, 443–450. [Google Scholar] [CrossRef]
- Highfield, A.C.; El Nagar, A.; Mackinder, L.C.M.; Noël, L.M.L.J.; Hall, M.J.; Martin, S.J.; Schroeder, D.C. Deformed wing virus implicated in overwintering honeybee colony losses. Appl. Environ. Microbiol. 2009, 75, 7212–7220. [Google Scholar] [CrossRef]
- Robinson, G.E. Regulation of division of labor in insect societies. Annu. Rev. Entomol. 1992, 37, 637–665. [Google Scholar] [CrossRef]
- Huang, Z.Y.; Robinson, G.E. Seasonal changes in juvenile hormone titers and rates of biosynthesis in honey bees. J. Comp. Physiol. B 1995, 165, 18–28. [Google Scholar] [CrossRef]
- Amdam, G.V.; Aase, A.L.T.; Seehuus, S.C.; Fondrk, M.K.; Norberg, K.; Hartfelder, K. Social reversal of immunosenescence in honey bee workers. Exp. Gerontol. 2005, 40, 939–947. [Google Scholar] [CrossRef] [PubMed]
- Fluri, P.; Lüscher, M.; Wille, H.; Gerig, L. Changes in weight of the pharyngeal gland and haemolymph titres of juvenile hormone, protein and vitellogenin in worker honey bees. J. Insect Physiol. 1982, 28, 61–68. [Google Scholar] [CrossRef]
- Döke, M.A.; Frazier, M.; Grozinger, C.M. Overwintering honey bees: Biology and management. Curr. Opin. Insect Sci. 2015, 10, 185–193. [Google Scholar] [CrossRef] [PubMed]
- Fluri, P.; Wille, H.; Gerig, L.; Lüscher, M. Juvenile hormone, vitellogenin and haemocyte composition in winter worker honeybees (Apis mellifera). Experientia 1977, 33, 1240–1241. [Google Scholar] [CrossRef]
- Amdam, G.V.; Simões, Z.L.P.; Hagen, A.; Norberg, K.; Schrøder, K.; Mikkelsen, Ø.; Kirkwood, T.B.L.; Omholt, S.W. Hormonal control of the yolk precursor vitellogenin regulates immune function and longevity in honeybees. Exp. Gerontol. 2004, 39, 767–773. [Google Scholar] [CrossRef] [PubMed]
- Fluri, P.; Bogdanov, S. Effects of artificial shortening of the photoperiod on honeybee (Apis mellifera) polyethism. J. Apic. Res. 1987, 26, 83–89. [Google Scholar] [CrossRef]
- Steinmann, N.; Corona, M.; Neumann, P.; Dainat, B. Overwintering is associated with reduced expression of immune genes and higher susceptibility to virus infection in honey bees. PLoS ONE 2015, 10, e0129956. [Google Scholar] [CrossRef]
- Gätschenberger, H.; Azzami, K.; Tautz, J.; Beier, H. Antibacterial Immune Competence of Honey Bees (Apis mellifera) Is Adapted to Different Life Stages and Environmental Risks. PLoS ONE 2013, 8, e66415. [Google Scholar] [CrossRef]
- Schmid, M.R.; Brockmann, A.; Pirk, C.W.W.; Stanley, D.W.; Tautz, J. Adult honeybees (Apis mellifera L.) abandon hemocytic, but not phenoloxidase-based immunity. J. Insect Physiol. 2008, 54, 439–444. [Google Scholar] [CrossRef]
- Wilson-Rich, N.; Dres, S.T.; Starks, P.T. The ontogeny of immunity: Development of innate immune strength in the honey bee (Apis mellifera). J. Insect Physiol. 2008, 54, 1392–1399. [Google Scholar] [CrossRef]
- Le Conte, Y.; Alaux, C.; Martin, J.F.; Harbo, J.R.; Harris, J.W.; Dantec, C.; Séverac, D.; Cros-Arteil, S.; Navajas, M. Social immunity in honeybees (Apis mellifera): Transcriptome analysis of varroa-hygienic behaviour. Insect Mol. Biol. 2011, 20, 399–408. [Google Scholar] [CrossRef] [PubMed]
- Simone-Finstrom, M.; Spivak, M. Propolis and bee health: The natural history and significance of resin use by honey bees. Apidologie 2010, 41, 295–311. [Google Scholar] [CrossRef]
- Cremer, S.; Armitage, S.A.O.; Schmid-Hempel, P. Social Immunity. Curr. Biol. 2007, 17, 693–702. [Google Scholar] [CrossRef] [PubMed]
- Munch, D.; Kreibich, C.D.; Amdam, G.V. Aging and its modulation in a long-lived worker caste of the honey bee. J. Exp. Biol. 2013, 216, 1638–1649. [Google Scholar] [CrossRef]
- Free, J.B.; Racey, P.A. The effect of the size of honeybee colonies on food consumption, brood rearing and the longevity of the bees during winter. Entomol. Exp. Appl. 1968, 11, 241–249. [Google Scholar] [CrossRef]
- Rosenkranz, P.; Aumeier, P.; Ziegelmann, B. Biology and control of Varroa destructor. J. Invertebr. Pathol. 2010, 103, S96–S119. [Google Scholar] [CrossRef] [PubMed]
- Zollner, E.; Kirs, I.K. Uber die quantitative Bestimmung yon Lipoiden (Mikromethode) mittels der vielen natiirliehen Lipoiden (allen bekannten Plasmalipoiden) gemeinsamen Sulfophosphovanillin-Reaktion. Z. Gesamte Exp. Med. 1962, 135, 545–561. [Google Scholar] [CrossRef]
- Kodrík, D.; Socha, R.; Šimek, P.; Zemek, R.; Goldsworthy, G.J. A new member of the AKH/RPCH family that stimulates locomotory activity in the firebug, Pyrrhocoris apterus (Heteroptera). Insect Biochem. Mol. Biol. 2000, 30, 489–498. [Google Scholar] [CrossRef]
- Carroll, N.; Longley, R.; Roe, J. The Determination of Glycogen in Liver and Muscle by Use of Anthrone Reagent. J. Biol. Chem. 1956, 220, 583–593. [Google Scholar] [PubMed]
- Gatschenberger, H.; Gimple, O.; Tautz, J.; Beier, H. Honey bee drones maintain humoral immune competence throughout all life stages in the absence of vitellogenin production. J. Exp. Biol. 2012, 215, 1313–1322. [Google Scholar] [CrossRef] [PubMed]
- Panzarino, O.; Hyršl, P.; Dobeš, P.; Vojtek, L.; Vernile, P.; Bari, G.; Terzano, R.; Spagnuolo, M.; de Lillo, E. Rank-based biomarker index to assess cadmium ecotoxicity on the earthworm Eisenia andrei. Chemosphere 2016, 145, 480–486. [Google Scholar] [CrossRef] [PubMed]
- Jančaříková, G.; Houser, J.; Pavel, D.; Demo, G.; Hyršl, P.; Wimmerová, M. Characterization of novel bangle lectin from Photorhabdus asymbiotica with dual sugar-binding specificity and its effect on host immunity. PLoS Pathog. 2017, 13, e1006564. [Google Scholar] [CrossRef] [PubMed]
- Yang, W.; Tian, Y.; Han, M.; Miao, X. Longevity extension of worker honey bees (Apis mellifera) by royal jelly: Optimal dose and active ingredient. PeerJ 2017, 5, e3118. [Google Scholar] [CrossRef] [PubMed]
- Medina, R.G.; Paxton, R.J.; De Luna, E.; Fleites-Ayil, F.A.; Medina Medina, L.A.; Quezada-Euán, J.J.G. Developmental stability, age at onset of foraging and longevity of Africanized honey bees (Apis mellifera L.) under heat stress (Hymenoptera: Apidae). J. Therm. Biol. 2018, 74, 214–225. [Google Scholar] [CrossRef] [PubMed]
- Shehata, S.M.; Townsend, G.F.; Shuel, R.W. Seasonal Physiological Changes in Queen and Worker Honeybees. J. Apic. Res. 1981, 20, 69–78. [Google Scholar] [CrossRef]
- Erler, S.; Moritz, R.F.A. Pharmacophagy and pharmacophory: Mechanisms of self-medication and disease prevention in the honeybee colony (Apis mellifera). Apidologie 2016, 47, 389–411. [Google Scholar] [CrossRef]
- Frias, B.E.D.; Barbosa, C.D.; Lourenço, A.P. Pollen nutrition in honey bees (Apis mellifera): Impact on adult health. Apidologie 2016, 47, 15–25. [Google Scholar] [CrossRef]
- Casteels, P.; Ampe, C.; Riviere, L.; van Damme, J.; Elicon, C.; Fleming, M.; Jacobs, F.; Tempst, P. Isolation and characterization of abaecin, a major antibacterial response peptide in the honeybee (Apis mellifera). Eur. J. Biochem. 1990, 187, 381–386. [Google Scholar] [CrossRef]
- Evans, J.D.; Aronstein, K.; Chen, Y.P.; Hetru, C.; Imler, J.L.; Jiang, H.; Kanosi, M.; Thompson, G.J.; Zou, Z.; Hultmark, D. Immune pathways and defence mechanisms in honey bees Apis mellifera. Insect Mol. Biol. 2017, 15, 645–656. [Google Scholar] [CrossRef]
- Danihlík, J.; Aronstein, K.; Petřivalský, M. Antimicrobial peptides: A key component of honey bee innate immunity. J. Apic. Res. 2015, 54, 123–136. [Google Scholar] [CrossRef]
- Azzami, K.; Ritter, W.; Tautz, J.; Beier, H. Infection of honey bees with acute bee paralysis virus does not trigger humoral or cellular immune responses. Arch. Virol. 2012, 157, 689–702. [Google Scholar] [CrossRef]
- González-Santoyo, I.; Córdoba-Aguilar, A. Phenoloxidase: A key component of the insect immune system. Entomol. Exp. Appl. 2012, 142, 1–16. [Google Scholar] [CrossRef]
- Lourenço, A.P.; Zufelato, M.S.; Gentile Bitondi, M.M.; Paulino Simões, Z.L. Molecular characterization of a cDNA encoding prophenoloxidase and its expression in Apis mellifera. Insect Biochem. Mol. Biol. 2005, 35, 541–552. [Google Scholar] [CrossRef] [PubMed]
- Szymas, B.; Jedruszuk, A. The influence of different diets on haemocytes of adult worker honey bees, Apis mellifera. Apidologie 2003, 34, 97–102. [Google Scholar] [CrossRef]
- Segerstrom, S.C. Stress, energy, and immunity: An ecological view. Curr. Dir. Psychol. Sci. 2007, 16, 326–330. [Google Scholar] [CrossRef]
- Shattuck-Heidorn, H.; Reiches, M.W.; Prentice, A.M.; Moore, S.E.; Ellison, P.T. Energetics and the immune system: Trade-offs associated with non-acute levels of CRP in adolescent Gambian girls. Evol. Med. Public Health 2017, 2017, 27–38. [Google Scholar] [CrossRef]
- Lochmiller, R.L.; Deerenberg, C. Trade-offs in evolutionary immunology: Just what is the cost of immunity? Oikos 2000, 88, 87–98. [Google Scholar] [CrossRef]
- Wheeler, D.E.; Kawooya, J.K. Purification and characterization of honey bee vitellogenin. Arch. Insect Biochem. Physiol. 1990, 14, 253–267. [Google Scholar] [CrossRef]
- Seehuus, S.-C.; Norberg, K.; Krekling, T.; Fondrk, K.; Amdam, G.V. Immunogold Localization of Vitellogenin in the Ovaries, Hypopharyngeal Glands and Head Fat Bodies of Honeybee Workers, Apis mellifera. J. Insect Sci. 2009, 7, 52. [Google Scholar] [CrossRef]
- Amdam, G.V.; Norberg, K.; Omholt, S.W.; Kryger, P.; Lourenço, A.P.; Bitondi, M.M.G.; Simões, Z.L.P. Higher vitellogenin concentrations in honey bee workers may be an adaptation to life in temperate climates. Insectes Soc. 2005, 52, 316–319. [Google Scholar] [CrossRef]
- Aurori, C.M.; Buttstedt, A.; Dezmirean, D.S.; Mărghitaş, L.A.; Moritz, R.F.A.; Erler, S. What is the main driver of ageing in long-lived winter honeybees: Antioxidant enzymes, innate immunity, or vitellogenin? J. Gerontol. Ser. A Biol. Sci. Med. Sci. 2014, 69, 633–639. [Google Scholar] [CrossRef]
- Corona, M.; Velarde, R.A.; Remolina, S.; Moran-Lauter, A.; Wang, Y.; Hughes, K.A.; Robinson, G.E. Vitellogenin, juvenile hormone, insulin signaling, and queen honey bee longevity. Proc. Natl. Acad. Sci. USA 2007, 104, 7128–7133. [Google Scholar] [CrossRef]
- Pinto, L.Z.; Bitondi, M.M.G.; Simões, Z.L.P. Inhibition of vitellogenin synthesis in Apis mellifera workers by a juvenile hormone analogue, pyriproxyfen. J. Insect Physiol. 2000, 46, 153–160. [Google Scholar] [CrossRef]
- Cardoso-Júnior, C.A.; Guidugli-Lazzarini, K.R.; Hartfelder, K. DNA methylation affects the lifespan of honey bee (Apis mellifera L.) workers—Evidence for a regulatory module that involves vitellogenin expression but is independent of juvenile hormone function. Insect Biochem. Mol. Biol. 2018, 92, 21–29. [Google Scholar] [CrossRef]
- Amdam, G.V.; Norberg, K.; Hagen, A.; Omholt, S.W. Social exploitation of vitellogenin. Proc. Natl. Acad. Sci. USA 2003, 100, 1799–1802. [Google Scholar] [CrossRef]
- Trenczek, T.; Engels, W. Occurrence of vitellogenin in drone honeybees (Apis mellifica). Int. J. Invertebr. Reprod. Dev. 1986, 10, 307–311. [Google Scholar] [CrossRef]
- Trenczek, T.; Zillikens, A.; Engels, W. Developmental patterns of vitellogenin haemolymph titre and rate of synthesis in adult drone honey bees (Apis mellifera). J. Insect Physiol. 1989, 35, 475–481. [Google Scholar] [CrossRef]
- Piulachs, M.D.; Guidugli, K.R.; Barchuk, A.R.; Cruz, J.; Simões, Z.L.P.; Bellés, X. The vitellogenin of the honey bee, Apis mellifera: Structural analysis of the cDNA and expression studies. Insect Biochem. Mol. Biol. 2003, 33, 459–465. [Google Scholar] [CrossRef]
- Kunert, K.; Crailsheim, K. Seasonal changes in carbohydrate, lipid and protein content in emerging worker honeybees and their mortality. J. Apic. Res. 1988, 27, 13–21. [Google Scholar] [CrossRef]
- Amdam, G.V.; Omholt, S.W. The regulatory anatomy of honeybee lifespan. J. Theor. Biol. 2002, 216, 209–228. [Google Scholar] [CrossRef]
- De Souza, D.A.; Kaftanoglu, O.; De Jong, D.; Page, R.E.; Amdam, G.V.; Wang, Y. Differences in the morphology, physiology and gene expression of honey bee queens and workers reared in vitro versus in situ. Biol. Open 2018, 7, bio036616. [Google Scholar] [CrossRef]
- Otis, G.; Wheeler, D.E.; Buck, N.A.; Mattila, H.R. Storage proteins in winter honey bees. APIACATA 2004, 38, 352–357. [Google Scholar]
- Switanek, M.; Crailsheim, K.; Truhetz, H.; Brodschneider, R. Modelling seasonal effects of temperature and precipitation on honey bee winter mortality in a temperate climate. Sci. Total Environ. 2017, 579, 1581–1587. [Google Scholar] [CrossRef]
- Nielsen, A.; Reitan, T.; Rinvoll, A.W.; Brysting, A.K. Effects of competition and climate on a crop pollinator community. Agric. Ecosyst. Environ. 2017, 246, 253–260. [Google Scholar] [CrossRef]
- Dalmon, A.; Peruzzi, M.; Le Conte, Y.; Alaux, C.; Pioz, M. Temperature-driven changes in viral loads in the honey bee Apis mellifera. J. Invertebr. Pathol. 2019, 160, 87–94. [Google Scholar] [CrossRef]
- Huang, Z. Pollen nutrition affects honey bee stress resistance. Terr. Arthropod Rev. 2012, 5, 175–189. [Google Scholar] [CrossRef]
- Fine, J.D.; Shpigler, H.Y.; Ray, A.M.; Beach, N.J.; Sankey, A.L.; Ahmed-Casch, A.; Huang, Z.Y.; Astrauskaite, I.; Chao, R.; Zhao, H.; et al. Quantifying the effects of pollen nutrition on honey bee queen egg laying with a new laboratory system. PLoS ONE 2018, 13, e0203444. [Google Scholar] [CrossRef]
- Nürnberger, F.; Härtel, S.; Steffan-Dewenter, I. The influence of temperature and photoperiod on the timing of brood onset in hibernating honey bee colonies. PeerJ 2018, 6, e4801. [Google Scholar] [CrossRef]
- Medrzycki, P.; Sgolastra, F.; Bortolotti, L.; Bogo, G.; Tosi, S.; Padovani, E.; Porrini, C.; Sabatini, A.G. Influence of brood rearing temperature on honey bee development and susceptibility to poisoning by pesticides. J. Apic. Res. 2010, 49, 52–59. [Google Scholar] [CrossRef]
- Inouye, D.W. Effects of climate change on phenology, frost damage, and floral abundance of montane wildflowers. Ecology 2008, 89, 353–362. [Google Scholar] [CrossRef]
- Williams, C.M.; Henry, H.A.L.; Sinclair, B.J. Cold truths: How winter drives responses of terrestrial organisms to climate change. Biol. Rev. 2015, 90, 214–235. [Google Scholar] [CrossRef]
- Schenk, M.; Krauss, J.; Holzschuh, A. Desynchronizations in bee–plant interactions cause severe fitness losses in solitary bees. J. Anim. Ecol. 2018, 87, 139–149. [Google Scholar] [CrossRef]
- Langowska, A.; Zawilak, M.; Sparks, T.H.; Glazaczow, A.; Tomkins, P.W.; Tryjanowski, P. Long-term effect of temperature on honey yield and honeybee phenology. Int. J. Biometeorol. 2017, 61, 1125–1132. [Google Scholar] [CrossRef]


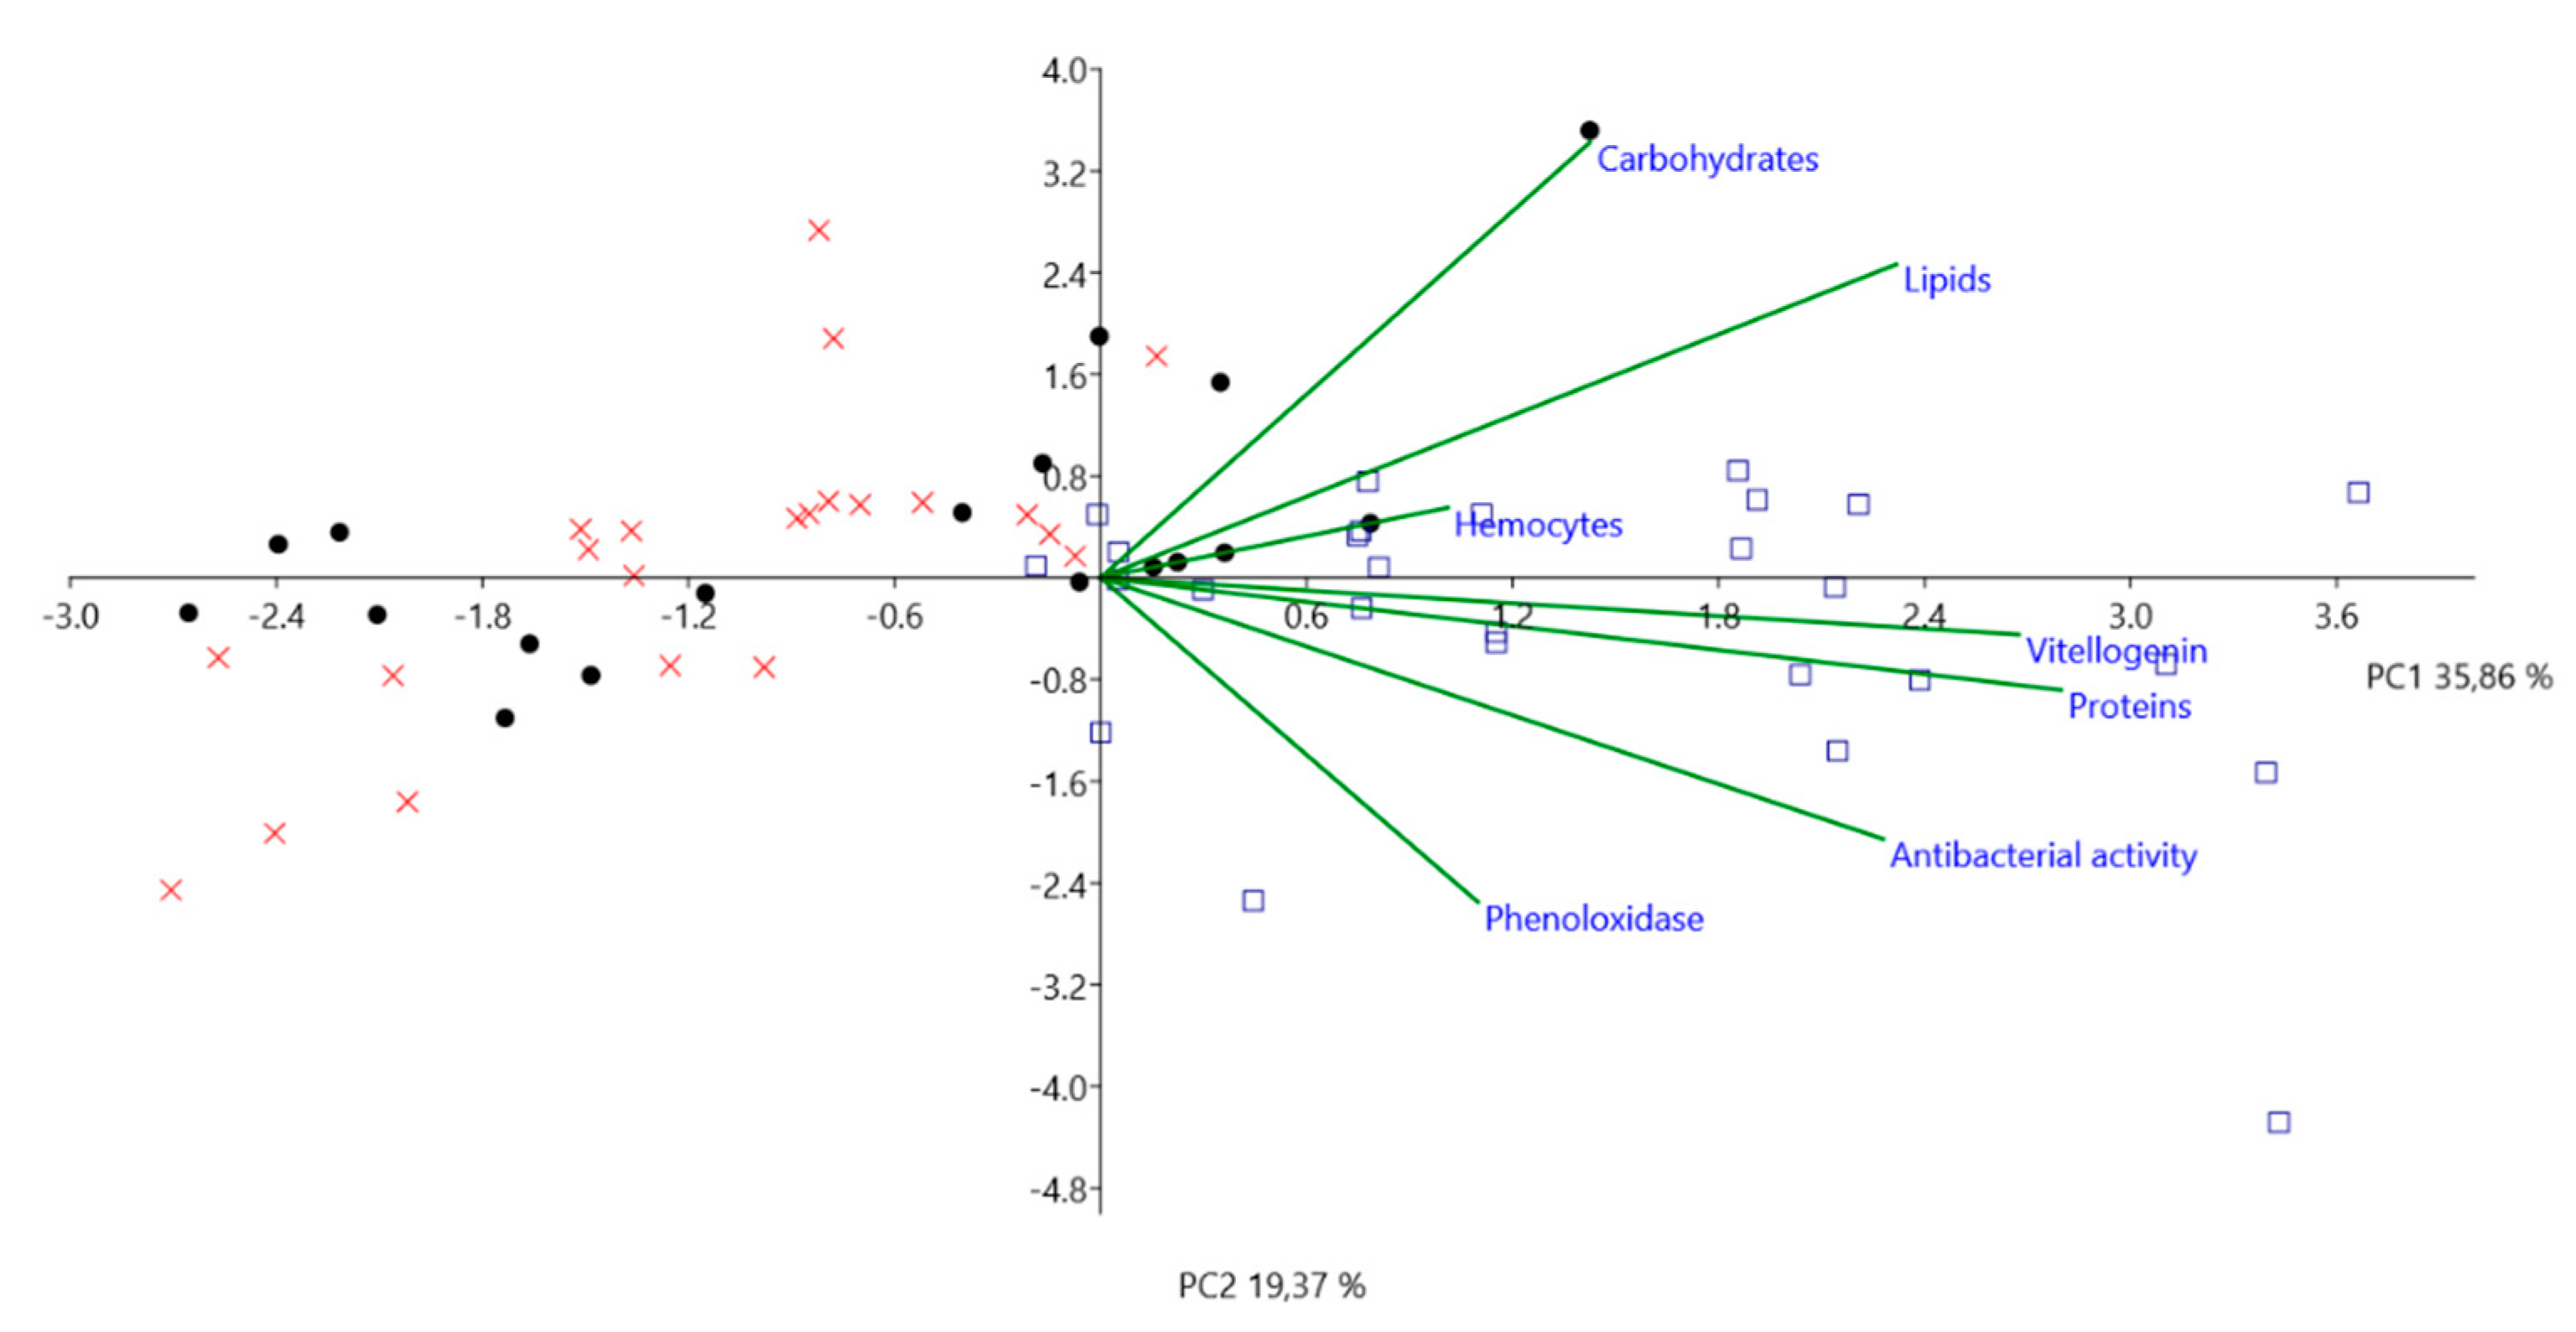
| Summer 2017 | |||
|---|---|---|---|
| Variable | by Variable | Spearman r | p Value |
| Antibacterial activity | Proteins | 0.648 | 0.026 |
| Proteins | Phenoloxidase | −0.81 | 0.022 |
| Proteins | Vitellogenin | 0.608 | 0.04 |
| Winter 2017/2018 | |||
| Variable | by Variable | Spearman r | pValue |
| Lipids | Haemocytes | 0.471 | 0.042 |
| Antibacterial activity | Proteins | 0.542 | 0.017 |
| Summer 2018 | |||
| Variable | by Variable | Spearman r | pValue |
| Lipids | Carbohydrates | 0.771 | 0.001 |
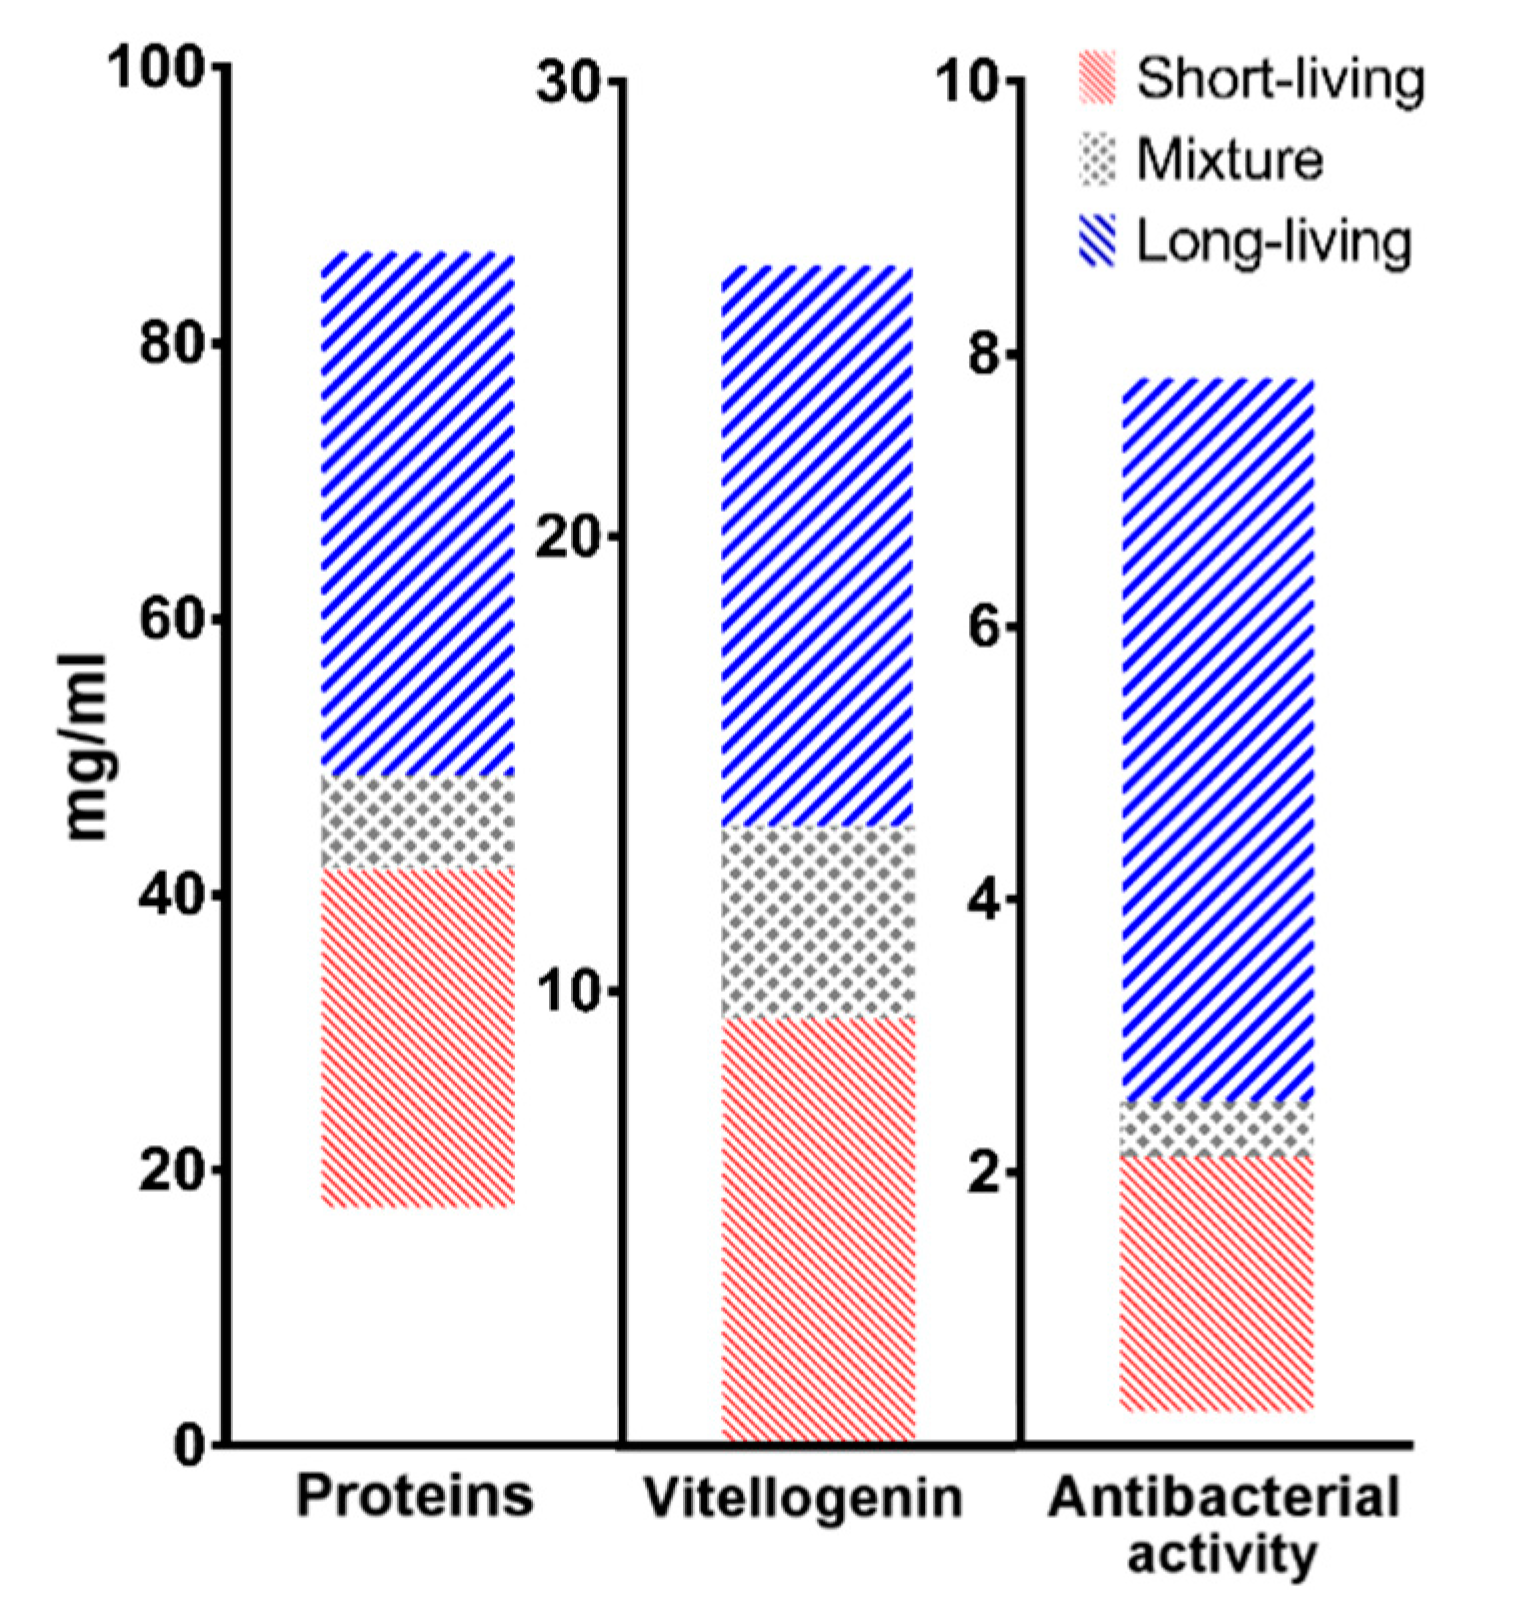
| Short-Living | Long-Living | |
|---|---|---|
| Proteins | 17–42 mg/mL | 49–87 mg/mL |
| Vitellogenin | 0–10 mg/mL | 14–26 mg/mL |
| Antibacterial activity | 0–2 mg/mL | 2.5–8 mg/mL |
© 2019 by the authors. Licensee MDPI, Basel, Switzerland. This article is an open access article distributed under the terms and conditions of the Creative Commons Attribution (CC BY) license (http://creativecommons.org/licenses/by/4.0/).
Share and Cite
Kunc, M.; Dobeš, P.; Hurychová, J.; Vojtek, L.; Poiani, S.B.; Danihlík, J.; Havlík, J.; Titěra, D.; Hyršl, P. The Year of the Honey Bee (Apis mellifera L.) with Respect to Its Physiology and Immunity: A Search for Biochemical Markers of Longevity. Insects 2019, 10, 244. https://doi.org/10.3390/insects10080244
Kunc M, Dobeš P, Hurychová J, Vojtek L, Poiani SB, Danihlík J, Havlík J, Titěra D, Hyršl P. The Year of the Honey Bee (Apis mellifera L.) with Respect to Its Physiology and Immunity: A Search for Biochemical Markers of Longevity. Insects. 2019; 10(8):244. https://doi.org/10.3390/insects10080244
Chicago/Turabian StyleKunc, Martin, Pavel Dobeš, Jana Hurychová, Libor Vojtek, Silvana Beani Poiani, Jiří Danihlík, Jaroslav Havlík, Dalibor Titěra, and Pavel Hyršl. 2019. "The Year of the Honey Bee (Apis mellifera L.) with Respect to Its Physiology and Immunity: A Search for Biochemical Markers of Longevity" Insects 10, no. 8: 244. https://doi.org/10.3390/insects10080244
APA StyleKunc, M., Dobeš, P., Hurychová, J., Vojtek, L., Poiani, S. B., Danihlík, J., Havlík, J., Titěra, D., & Hyršl, P. (2019). The Year of the Honey Bee (Apis mellifera L.) with Respect to Its Physiology and Immunity: A Search for Biochemical Markers of Longevity. Insects, 10(8), 244. https://doi.org/10.3390/insects10080244