Article

Erosion Mapping of Through-Thickness Toughened Powder Epoxy Gradient Glass-Fiber-Reinforced Polymer (GFRP) Plates for Tidal Turbine Blades

1
Department of Mechanical and Aerospace Engineering, University of Strathclyde, Glasgow G1 1XJ, UK
2
School of Engineering, Institute of Materials and Processes, University of Edinburgh, Edinburgh EH8 9YL, UK
*
Author to whom correspondence should be addressed.
Lubricants 2021, 9(3), 22; https://doi.org/10.3390/lubricants9030022
Submission received: 25 November 2020 / Revised: 15 January 2021 / Accepted: 18 February 2021 / Published: 25 February 2021

Abstract

:
Erosion of tidal turbine blades in the marine environment is a major material challenge due to the high thrust and torsional loading at the rotating surfaces, which limits the ability to harness energy from tidal sources. Polymer–matrix composites can exhibit leading-blade edge erosion due to marine flows containing salt and solid particles of sand. Anti-erosion coatings can be used for more ductility at the blade surface, but the discontinuity between the coating and the stiffer composite can be a site of failure. Therefore, it is desirable to have a polymer matrix with a gradient of toughness, with a tougher, more ductile polymer matrix at the blade surface, transitioning gradually to the high stiffness matrix needed to provide high composite mechanical properties. In this study, multiple powder epoxy systems were investigated, and two were selected to manufacture unidirectional glass-fiber-reinforced polymer (UD-GFRP) plates with different epoxy ratios at the surface and interior plies, leading to a toughening gradient within the plate. The gradient plates were then mechanically compared to their standard counterparts. Solid particle erosion testing was carried out at various test conditions and parameters on UD-GFRP specimens in a slurry environment. The experiments performed were based on a model of the UK marine environment for a typical tidal energy farm with respect to the concentration of saltwater and the size of solid particle erodent. The morphologies of the surfaces were examined by SEM. Erosion maps were generated based on the result showing significant differences for materials of different stiffness in such conditions.

Graphical Abstract

1. Introduction

Tidal stream energy in the European Union has been identified as a key pillar of diversification of the energy supply towards clean, low-carbon renewable sources and away from fossil fuels [1]. The ocean energy industry estimates [2] that 100 GW of wave and tidal energy capacity can be deployed in Europe by 2050, meeting 10% of Europe’s current electricity needs. To quote from [2], “Ocean energy produces electricity at different times from wind and solar. It is an essential solution to help a variable wind and solar production match with a variable power demand every hour of the day. This will become increasingly valuable as Europe reaches 80–100% renewable electricity. Ocean energy is a new industry, that can deliver 400,000 EU jobs by 2050, billions of euros in exports, and industrial activity—specifically in coastal regions, where this is most needed”. The United Kingdom possesses significant tidal resources, and the proper and full-scaled utilization of tidal energy could provide millions of people with power for their homes.
In contrast to wind energy, tidal energy is highly predictable and could therefore contribute to the UK electrical grid baseload [3]. In addition, the density of water is 800 times higher than the air, leading to a 20 to 1 watt generation ratio between tidal and air for the same turbine diameter [4,5]. Marine renewable energy aims to operate in the harshest conditions of environments deployed, however, leading to critical thrust and torsional loading on the tidal turbine blades [6,7]. Design, stress analysis and lifetime prediction of tidal turbine blades based on coupon-level composite laminate static and fatigue data has been developed [8,9,10] and furthered using bespoke finite element analysis software [11,12], assisted by blade test data generated with a number of tidal device developers [13].
There has been considerable research on the wet aging of glass and carbon fiber composites for marine structures over recent years, and the development of ocean energy has increased this activity, as reviewed by Alam et al. [14]. Test acceleration is usually achieved by increasing water temperature [15], although other factors such as reduced sample thickness or increased pressure may help to saturate samples more quickly. Weight gain kinetics data are then used to define diffusion models, which allow water profiles in more complex structures such as turbine blades to be estimated [16]. Relations between water content and mechanical properties can then be used to predict long-term mechanical behavior. This is a simplified approach; more complex methods which take account of strong coupling between water ingress and mechanical loading, and including swelling and viscoelastic response, are under development [17,18].
The presence of cavitation bubbles [19], silt and sand can have a major effect on the structural integrity of the blades, but this is often overlooked in the field. Erosion protection coatings can be applied, but they suffer from a distinct stiffness change from the composite underneath due to the intrinsic discrete nature of coatings, leading to poor interfacial stress transfer and ultimately decohesion [20].
In the literature of the solid particle abrasion and erosion of composite materials and also observed in slurry conditions [21,22,23], there have been some well-characterized trends observed on the performance. These include peaks in erosion as the function of impact angle changing depending on the volume fraction of reinforcement material. What has not been studied, however, is the change in erosion rate with impact angle for the matrix material of varying mechanical properties.
It is generally desirable to have a tougher resin at the surface of the composite laminate, as it is likely that erosion of the composite will be modified by a tougher surface matrix material. In general, the tougher a resin is, the lower its mechanical stiffness, and hence the lower will be the bulk mechanical properties (stiffness and strength) of the fiber-reinforced composite laminate (we might envisage that the ideal design of a laminate for tidal blade purposes would be one with a toughened resin only at the surface or close to the surface, and with an un-toughened resin in the remainder of the laminate, which would give the ideal mixture of surface erosion resistance with high laminate bulk mechanical properties).
When using standard liquid infusion manufacturing systems for composites, however, it is not possible to create a layered through-thickness difference or gradient in resins and resin properties. Design and production of structures from pre-impregnated tapes (prepreg) of differing properties would permit this gradient, but these prepreg systems are aimed at aerospace production in autoclaves and would be much too expensive for marine renewable structures such as tidal turbine blades. Recent developments in the use of powder epoxy systems for the manufacture of large, thick-section GFRP composites [24,25,26,27] do allow the possible production of such a layered system of resin toughness through the thickness of the blade.
The purpose of this paper is to examine the effect of solid particle erosion testing on UD-GFRP specimens in a slurry environment, using various test conditions and parameters. Furthermore, the novel GFRP manufacturing process using powdered epoxies will be investigated to examine the concept of employing a toughness gradient at the surface of a laminate in order to study whether we can identify any modification to the possible enhancement to resistance to erosion while leaving overall mechanical properties intact.

2. Materials and Methods

2.1. General Overview of the Different Experimental Procedures for Erosion and Mechanical Manufacturing and Testing

In this study, both mechanical and erosion properties were investigated, leading to different laminate configurations.
This study was performed in three steps:
  • First, a screening of mechanical properties was carried out to select the best experimental toughened epoxy for use as the composite matrix for the surface layer;
  • Second, a mechanical compatibility study between the standard and toughened epoxies was carried out to determine the cohesive ability between the two resin systems;
  • Third, an erosion study was completed using pure standard epoxy laminates and through-thickness gradient epoxy laminates.
The mechanical tests in this paper rely on test standards developed for composite materials in which the resin system is homogeneous through the thickness of the test specimens. For the mechanical testing specimens, the laminates were manufactured with either one resin system or a constant ratio of toughened and standard powder epoxies. This is not the case for the erosion tests, however, where the resin system toughness was varied through the thickness, as shown in Figure 1. Working with epoxy powders allows the user to change the toughened to the standard epoxy ratio in a discrete manner, resulting in a gradient through the laminate thickness, which is impossible to achieve with a liquid infusion system. This gradient allows for much better continuity of the toughened and un-toughened substrate layers and allows the user to avoid the interlayer decohesion that can happen with standard toughened protection systems (especially for underwater applications). The gradient samples in Figure 1 were compared to standard PE6405 epoxy samples to assess the benefits of the novel processing method.

2.2. Fibers

Composite materials are the optimum choice for making the most efficient types of tidal turbine blades, due to their specific strength and stiffness, along with a high fatigue resilience in water in comparison to metallic materials [28]. In this scope, glass-fiber-reinforced polymer (GFRP) is usually a good candidate for marine turbine blade applications due to its relatively low cost [29]. One drawback of GFRP, however, is its tendency to corrosion in the marine environment [30], making erosion protection even more important for glass-fiber FRP compared to basalt and carbon FRP [31]. In this project, two types of glass fibers were used, one for mechanical testing and one for erosion testing. A quasi-UD (10% weight in the transverse direction) glass fabric was used for mechanical testing (SAERTEX® E-Glass U-E-591 g/m2-1200 mm, Saerbeck, Germany), representative of standard structural composite systems. A 100% UD-glass-fiber fabric (Johns Manville© StarRov LFTPlus 871 E-Glass, Denver, CO, USA) was used for erosion testing purposes, as transversal fibers would have otherwise affected the erosion behavior independently to the epoxy powder matrix properties.

2.3. Epoxy Powders

A powder-based epoxy (PE6405) from FreiLacke (Bräunlingen, Germany) and Swiss CMT AG (Siebnen, Switzerland) was used in this study as the un-toughened, baseline epoxy resin. Due to a heat-activated catalyst technology, the powder epoxy provides significant advantages compared to its liquid equivalents: low minimal viscosity, low exotherm [24], ability to pre-shape different parts and co-cure them in a one-shot process and stability at ambient temperature (no refrigeration requirement) [25]. These advantages result in lower manufacturing costs and quicker production of mechanically superior composite parts [25] compared to standard liquid epoxy-based composites.
Additionally, a set of experimental toughened epoxy powders (VPB-22, VPB-25, VPB-26 and VPB-27) were provided by FreiLacke and Swiss CMT AG to the University of Edinburgh and compared with the commercial PE6405. Plates were tested using the mechanical testing procedure described further below. First, an initial screening of the toughened powder epoxies mechanical properties as GFRP in tension (ISO 527-5) and 4-point bending (ISO 14125) was performed in order to select the best candidate as well as to compare to the standard powder epoxy GFRP (PE6405). Then, the most suitable toughened epoxy candidate was mixed with the standard epoxy system at 50%, and 25% toughened epoxy volume ratios and mechanical properties were investigated. The compatibility of both epoxy systems was also investigated using a differential scanning calorimetry (DSC) temperature sweep to determine both their melting and curing temperatures.

2.4. GFRP Manufacturing Procedure

Laminates measuring 280 mm × 300 mm were manufactured at the desired thickness. In the case of erosion testing, the samples needed to be quite thick and were manufactured at 6 mm thickness, whereas in the case of mechanical testing, the standard thickness is 2 mm. Either unidirectional (UD) or cross-ply (CP) [0°/90°] s fiber orientations were laid up, the UD being used for fiber and transverse direction property measurement and the CP being used to measure the shear response of the material. It is important that the manufactured laminates are symmetric and balanced, meaning that plies above the midsurface must exist in the same orientation and same distance below the midsurface.
In both cases, the fabric layers were cut to fit in a steel frame sitting on a steel plate Figure 2. The mold was covered in PTFE for release after curing. All fabric layers were weighted, and the powder mass of individual interply layers was determined by targeting an overall laminate fiber volume fraction of 45%. The epoxy powder was sprinkled homogenously on top of each fabric layer, using adequate protective equipment (full face mask and fume hood). A steel top plate, fitting in the cavity frame and covered with PTFE, was placed on the system. Finally, the plate was enveloped in a peel ply, breather and vacuum bag and placed in an oven for consolidation.
The curing process was performed under a vacuum of one bar (controlled with a pressure gauge) to remove any voids for consolidation. No other external pressure was applied during the curing of the laminates. The curing cycle was as follows: first, the powder is dried for 8 h at 55 °C to reduce the risk of the formation of micropores. Then the temperature is increased close to the curing onset temperature, at 135 °C for 2 h to melt the powder and to allow the liquid system to achieve an ideal wetting of the fabric at very low dynamic viscosity. The plate finally undergoes the full curing temperature, at 185 °C, for 2 h and then the temperature is reduced slowly to room temperature over five hours (Figure 2).

2.5. Mechanical Test Procedure

All mechanical test samples were tested according to the standards displayed in Table 1.
Tension, in-plane shear, compression and 4-point bending were investigated. The fiber volume fraction was crosschecked with burn-off.

2.6. Erosion Test Protocol

In this study, the erosion performance of six types of GFRP grades was assessed for impact angles ranging from 15° to 90° (Figure 3). The list of these specimen types and the test parameters selected can be seen in Table 2 and Table 3 respectively. All specimens were machined from UD glass-fabric-reinforced laminates, with a 0° fabric orientation. Some specimens were machined at 45° and 90° to assess the impact of fiber angle on the erosion behavior (Figure 4). The assessment of the erosion process was carried out by mass loss analysis using an analytical scale with +/−0.01 mg accuracy, while a scanning electron microscope (SEM) was used to inspect the surface defects and get more detailed results regarding the type of erosion that seems to occur in UD-GFRP [32].
For the simulation of the erosive marine environments where tidal turbines are sited, a slurry impingement jet rig was used, shown in Figure 5. The jet impingement rig follows the design principles introduced by Hutchings [33]. The test rig consists of two chambers, the slurry chamber, containing the erodent, and the water chamber, containing water of 3.5% salinity. The water is circulated by a centrifugal pump. Using a T-shaped venturi chamber, the slurry is mixed in with the water solution prior to the impingement. Impingement velocity and particle concentration are controlled by changing the position and diameter of the inlet and outlet nozzles of the T-shaped chamber. For this set of tests, the selected impingement velocity was 9.04 m/s with a 3% sand particle concentration. The flat specimen sits on a bracket with adjustable positioning, allowing the testing of impingement angles ranging from 15° to 90°. Following impingement, the slurry falls back into the slurry chamber, and excess water flows into the water chamber while a mesh keeps the particles in the slurry chamber for them to be reused throughout the 30 min test duration.

2.7. Sand Analysis

The erodent particles used in the test series are no. 60 high silica sand (Minerals Marketing). In order to replicate the high wear conditions that tidal turbines can be subjected to, 300–600 µm diameter particles are used. The sand particles were separated using stainless steel mesh sieves of 600 µm and 300 µm grid, adhering to ISO 3310-1.
A simple and commonly used descriptor that has a validated relationship with wear rate is circularity. The circularity factor is a function of the perimeter and the area of the 2D image of the particle, developed by Riley in 1941 [34]. The circularity factor equation is given as:
CF = 4 π A / P 2
where A is the area and P is the perimeter of the 2D image of the particle.
Based on Equation (1), the circularity factor approaches the value of 1 as the particle shape approaches a perfect circle.
Images of particles at ×100 magnification were collected. The images were prepared for analysis in GIMP 2.8, and Matlab was then used to measure the perimeter, area and circularity factor (CF). The average CF was 0.819. Since quite often in wear studies, particles are referred to as angular or rounded without the use of a CF value, the angularity scale of Macleod [35] was used in order to relate these terms to CF values. The angularity scale contains particle drawings corresponding to descriptions ranging from well-rounded to angular. These drawings were processed and analyzed following the established CF analysis protocol. As it can be seen in Figure 6, the semi-spherical particle has a CF value very close to the 0.819 obtained for the No. 60 silica sand.
Particles used in erosion tests are subjected to repeated impacts and often shatter and lose their angularity. These changes in shape and size can have a significant effect on the erosion mechanism [36,37,38]. In order to determine if the said phenomenon was present in the tests conducted and presented in this work, particles that were used in the 30-min long erosion tests were collected, washed and dried. Following the pre-established protocol, at least 30 particles were analyzed. The CF exhibited a negligible reduction to 0.809, and no measurable size changes were detected. It appears that the ductile surface of the GFRP tested did not cause any impinging particle deformation or shattering.

3. Results and Discussion

3.1. Epoxy Powders Calorimetry and Fiber Volume Fraction Characterization

The standard and toughened epoxy powders were investigated using DSC tests, as shown in Figure 7, to assess the co-curing potential of both powders. First, both powders displayed an endothermic peak representing the sintering and melting of the powders. The standard epoxy displayed an earlier fusion onset, at approx. 51 °C compared to approx. 59 °C for the toughened one, with melting enthalpy values of 14 J/g and 5.4 J/g for the untoughened and toughened powders, respectively. The close melting temperature windows allowed for a homogeneous liquid mix of both epoxies.
The curing process for both resins involved a heat-activated catalyst, allowing for a substantial melt temperature window without any cure, enabling good consolidation before curing. The cure onset temperature of the toughened epoxy was c. 140 °C while it was c. 178 °C for the standard one. Although the difference is substantial, both resins were quickly heated from 135 °C to 185 °C, allowing for co-cure compatibility. One can notice that the exothermic curing enthalpy of the standard epoxy almost twice the value of the enthalpy of the toughened epoxy (140 J/g to 78 J/g). The authors believe this to be due to the toughening additive present in the toughened powder.
The fiber volume fraction (FVF) was crosschecked using the burn-off method (Table 4). It appears that the 25% toughened samples were slightly more fiber-rich than the 50% toughened samples. The edges of the mold allowed for some resin to spill out there. Although this was accounted for in the 45% FVF target calculation, the 50% toughened resin was more viscous, allowing for less material to escape. Still, with an average of 46.65% FVF for 25% toughened and 44.8% FVF for 50% toughened, the numbers are sufficiently close for direct comparison.

3.2. Initial Toughened Powder Screening

The initial mechanical comparison was performed in 0° tension (Figure 8a), 0° flexure and 90° flexure (Figure 8b), where 0° refers to the major fiber direction of the SAERTEX® E-Glass fabric. In every case, the VPB-25 outperformed all the other toughened powder composites, with a mean tensile strength of 427 MPa and a mean tensile modulus of 40.9 GPa. Note that the strain to failure of all 0° tensile specimens was approx. 2.65% and did not vary with matrix composition, as the 0° fiber dominates the failure. Still, it should be noted that all toughened powders performed poorly compared to the standard epoxy, especially in flexure. Indeed, the toughened powders were much more viscous and nonhomogeneous than the untoughened baseline powder (PE6405), leading to difficulties in infiltrating the closely packed fiber bundles, thus resulting in high void percentages and local stress and decohesion at the interface between the fiber and the matrix. Actually, according to the manufacturer data, VPB-25 was the least viscous of the toughened powder, with the lowest dynamic viscosity prior gel of 22 Pa.s, to be compared to the 1.26 Pa.s for the standard resin.

3.3. Toughened and Standard Epoxy Compatibility Study

In a second step, the compatibility of the toughened and standard powder epoxy systems was investigated. The powders were thoroughly mixed before manufacturing into 1/1 and 1/3 (ratio of toughened to un-toughened epoxy) volume ratios and then used for the production of glass fabric plates, as outlined in Section 2.4 above. The results in 0° tension highlight the large positive influence that the addition of PE6405 has on the mixed systems (Figure 9).
It is clear from Figure 9a that the longitudinal (0°) tensile properties are dependent on the volume content of toughened powder-epoxy (VPB-25). The red line shows the linear best-fit curve across the three different epoxy ratios, which is a suitable approximation for correlating 3 data points. The relationship indicates a 0.31% drop in 0° stress at break per additional volume percentage of VPB-25 toughened epoxy. Evidently, the addition of the toughened epoxy results in a loss in material tensile strength. It is hypothesized that this is attributed to the lower matrix stiffness, resulting in increased interfacial stresses for the more ductile epoxy. Ultimately, the toughened samples fail at lower stress due to the accumulation of local stress concentrations. The 0° tensile Young’s modulus, while not idealized by the linear trend, does see a significant drop in stiffness with the addition of toughened epoxy. The incorporation of 25% volume content of VPB-25 results in a drop in stiffness by roughly 9.1%. This initial drop may be attributed to the worsened transferability between the fiber and matrix (due to more ductile matrix). However, the further addition of VPB-25 only sees a further drop of 2.8%, perhaps suggesting that the degradation in stiffness plateaus towards a specific volume content of VPB-25. Nonetheless, it is clear that both strength and stiffness drop with the incorporation of the toughened powder-epoxy.
The 90° transverse tensile properties presented in Figure 9b characterize the matrix properties under tension. These properties also degrade with increased toughened epoxy content. It is difficult to conclude from only 3 data points whether the correlation is linear. It appears, however, that the 90° Young’s modulus closely matches the best-fit curve. Conversely, the material strength sees varying drops depending on the toughened epoxy content, which does not match the linear trend. Indeed, the standard deviation for the 25% data point does not coincide with the best-fit line, suggesting that the relationship is not linear for material strength. This is likely because the transverse properties are matrix-dominated, hence why they seem less linear trends.
The longitudinal (0°) compressive results are presented in Figure 9c The stress at break decreases with the increased volume content of toughened epoxy and is in accordance with the linear approximation; seeing a 0.42% drop in strength per percentage increase in volume content of VPB-25. Interestingly, the 0° compressive Young’s modulus initially increases at 25% VPB-25 volume content but is followed by a drop in stiffness at 50% VPB-25 volume content. The standard deviations associated with the compressive modulus values, however, deem the spread to be inconclusive, and so the compressive test would need to be repeated in order to validate the 0° compressive stiffness as a function of VPB-25 content.
It is hypothesized that the increased ductility from the toughened powder-epoxy results in a greater interfacial mismatch in the modulus between the fiber (Ef) and the matrix (Em). Figure 10 illustrates this difference in elastic modulus, where the modulus of the toughened epoxy (Em2) is lower than that of the standard epoxy (Em1). As such, the interfacial mismatch in the modulus is greater for the toughened matrix: Ef−Em1 < Ef−Em2. It follows that with a greater modulus mismatch, larger stress concentrations may arise at the interface between the fiber and the toughened matrix. It is argued that this mismatch, and the induced additional stresses, could result in premature plastic yielding. Similar effects can be seen between substrates and coating systems [20,39], and in this case, the toughening of the epoxy may be the reason for the weakened mechanical properties.

3.4. Slurry Erosion Tests

Fiber orientation plays a significant role in erosion of unidirectional GFRP; Reddy et al. and Liu et al. [40,41] have observed that at 90° fiber orientation the erosion rate is greater compared to other fiber orientations. As seen in Figure 11, at a 15° impingement angle, all three standard plate specimens (Std0, Std45 and Std90) experienced a small mass gain of a similar degree. The same behavior is also noticeable in Figure 12 at the same impingement angle for the 0° and 90° fiber orientation gradient plate GFRP, whereas the 45° fiber orientation specimen experienced mass loss instead. The high impingement velocity of 9.04 m/s combined with the acute angle of attack and ductile nature of the composites allowed the deposition of sand particles on the specimen surface, causing this observable mass gain.
As the impingement angle increases, there is a considerable increase in the mass loss across all specimen types. Namely, the mass loss of Std0 increases steadily with increasing impingement angle achieving a maximum mass loss at 60°, after which mass loss stabilizes. This behavior is in agreement with the solid particle erosion of GFRP results of Fouad et al. [42] for a range of erosion times and impingement pressures. On the other hand, Std45 and Std90 experience their highest mass loss at 75°, followed by a deep at 90°.
For the gradient plate GFRPs, Grd0 experiences an almost linear increase with a maximum mass loss at a 90° impingement angle. Grd90 also experiences its highest mass loss at 90°, but after a linear increase of mass loss up to 60°, it exhibits a considerable drop in the mass loss at 75°. Although polymers are fairly ductile, it is not unusual for them to behave in a brittle manner and exhibit their highest erosion rate at the impact of an angle of 90° as it has also been reported by Boggarapu et al. [43]. Grd45 has more erratic behavior; its mass loss increases at 30° and then decreases at 45°, followed by a steep increase to its maximum mass loss at 60°, a drop at 75° and a minor increase at 90°.
All the tested specimens present a fairly brittle response overall with max erosion rates occurring at 60°, 75° and 90° impact angle. By contrast, Sharifi et al. saw erosion peaking at 30° impact angle. Although the material composition used in both studies is similar, the completely different erosion trends can be explained by the use of a different testing apparatus. The slurry pot rig used by Sharifi et al. [44] subjects the GFRP to different erosion dynamics described by Clark and Burmeister [45] as particles concentrating at the impact surface forming a sliding bed which changes the mechanism of material removal from impact by isolated particles to abrasion by the sliding bed.

3.5. Standard versus Gradient Plate Comparison

Figure 13, Figure 14 and Figure 15 offer a comparison between the erosion performance of standard and gradient plates with 0°, 45° and 90° fiber orientation at 15°, 30°, 45°, 60°, 75° and 90° impingement angle.
As seen in Figure 13, although both GFRP types follow a similar trend, the mass loss of 0° fiber orientation gradient specimens is lower than that of the 0° fiber orientation standard specimens for almost all impingement angles. At 15°, both specimens experience a mass gain due to the deposition of sand and salt particles, as it was confirmed by the SEM analysis seen in Figure 16a. Mohan et al. also discovered that at lower impact angles (15°–30°), samples were gaining weight due to particles getting embedded into the material surface [22]. The high-pressure water jet impacting the specimen surface facilitates the diffusion of saline water through the matrix. Along with the interfaces of the glass fibers within the composite material, the matrix absorbed the saltwater. This absorption of saltwater enabled the debonding of the glass fibers in the composite matrix, as seen in Figure 16d [25]. As the impingement angle increases, there is a clear difference in the erosion behavior of the two types of GFRP. At 30° Std0 exhibits 75% higher mass loss than Grd0, at 45°, 60° and 75° the mass loss difference is further increased to 112%, 98% and 110% and finally, at 90°, the difference is reduced to 61%.
As it can be observed in Figure 14, similar to the Std0 behavior, at 15°, Std45 exhibits a mass gain; however, Grd45 exhibits a minute mass loss of 0.00049 g. This difference in performance could be attributed to the denser epoxy of Grd45, which minimizes the embedment of sand particles. At 30° impingement angle, there is barely any differentiation between the two specimens, with Grd45 outperforming Std45 by merely 7%, but at 45°, the performance disparity becomes clear with Std45 presenting a staggering 945% higher mass loss. This significant disparity in erosion performance can be explained by the different damage types identified by the SEM analysis and seen in Table 5. STD45 fibers were broken away, causing a significant mass loss, whereas the damage to GRD45 was mostly on the matrix, indicating some level of fiber protection by the polymer. At 60°, 75° and 90°, Std45 had 22%, 195% and 70% higher mass loss, respectively, than GRD45. It appears that at the higher impact angles, the ability of the toughened epoxy of Grd45 to absorb the kinetic energy of the impacting erodent is intensified.
Although both Grd0 and Grd45 exhibit a vastly superior erosion performance compared to the equivalent standard plates, the same cannot be said for Grd90, as seen in Figure 15. At 15° impingement angle, both Grd90 and Std90 experience mass gain, which was also observed for the 0° fiber orientation specimens. At 30°, 45° and 60° impingement angle, Grd90 exhibits 113%, 22% and 87% higher mass loss, respectively. At 75° and 90° impingement angles, though, Grd90 performs significantly better. Namely, the Grd90 mass loss is 68% and 18% lower than that of Std90 for 75 and 90° impingement angles, respectively.
Overall, the best performing specimen was found to be Grd45 which not only had the lowest average mass loss over the range of impingement angles, but it also had the best performance at 15, 45 and 90° impingement angles.
Erosion appears to be dominated by the toughness of the matrix when the force of the jet is perpendicular to the fibers (90° fiber orientation). When the force of the jet acts parallel to the fibers (0° fiber orientation), the mass loss is dominated by the fibers’ erosion resistance rather than the matrix. This is shown by the fact that the GRD materials show significantly less mass loss at 0° and 45° fiber orientations, where there is a 100% and 50% perpendicular component, respectively, of the force of the jet and impinging particles, with respect to the fiber direction, whereas the GRD materials show no improvement over the STD materials at 90° fiber orientation where there is no perpendicular component of the force of the jet, with respect to the fiber direction, the jet is entirely oriented parallel to the fibers.
As alternative means of presentation of the erosion rate results discussed, wastage maps were drawn (Figures 17 and 18).

3.6. Surface Optical Analysis

Although mass loss measurements can help us quantify the degree of erosion, surface analysis is required to further understand the erosion mechanisms in place. All specimens underwent optical analysis using an S700 tungsten filament scanning electron microscope (Hitachi) (W-SEM) after having a gold coating of roughly 5 µm thickness applied on their surface to enable the SEM analysis since GFRP is a non-conductive material [44]. The surface damage types that each specimen was subjected to are identified and listed in Table 5. As seen in Table 5, GRD and STD specimens of all fiber orientations subjected to erosion at 15° were found to have sand particles embedment in their surface following testing. This phenomenon can explain the extremely low mass loss and, in some cases, mass gain, recorded for 15° impingement angle erosion (Figure 11 and Figure 12). An example of the particle being embedded in the surface of the GFRP specimen can be seen in Figure 16a. As the impingement angle increases, the damage mechanism changes. At 30°, there were no embedded particles observed. The STD specimens suffered some fiber damage in the form of cracking and fracturing seen in Figure 16b. However, GRD specimens for the same impact angle suffered damage to their matrix, while their fibers were mostly undamaged (Figure 16c). At 45°, there is still a clear difference in the damage type and intensity between STD and GRD specimens which is also reflected by the mass loss results. STD specimens suffer some fiber damage in the form of fiber fracture and cracking, while the damage in GRD specimens is again mostly on the matrix as seen in Figure 16d,e respectively. At 60, 75 and 90° (Figure 16e–g), as it can also be seen by the mass loss results, the damage is severe for all specimens. At these impact angles, both GRD and STD type specimens suffer significant matrix and fiber damage without a clear pattern distinguishing their erosion behavior based on fiber orientation or epoxy type.

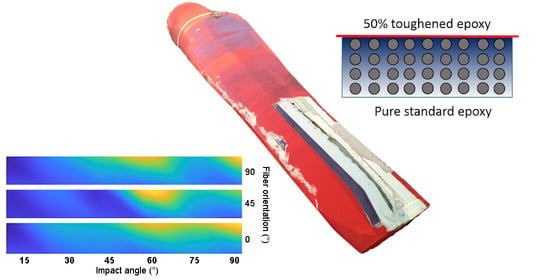
3.7. Erosion Wastage Maps

Wastage maps were produced as an alternative means of damage visualization. The construction of these maps followed the protocols described by Rasool et al. [46]. This visualization technique can help operators predict the level of safety during tidal turbine blade operation. The erosion wear maps describe the mass loss in (g) on both STD and gradient plates in three different fiber orientation 0°, 45° and 90°, at a constant speed of 9.04 m/s and impact angle between 15° to 90°. The color scheme of the map transitions from the blue for low erosion to green for medium erosion and yellow for high erosion.
As seen in Figure 17, for the 0° fiber orientation STD plate, there is medium wastage at 30° and 45° impingement angles, and as the impingement angle increases, the wastage transitions to high. For the 45° fiber orientation STD plate, medium wastage occurs at around 45° impingement angle, and it transitions to high wastage at angles greater than 60° with peak wastage at 75°. For the 90° fiber orientation STD plate, the wastage is fairly low for impingement angle 15°–65°, and there is an abrupt increase at angles 75° and 90°.
The GRD plate wastage maps, seen in Figure 18, differ significantly. For the 0° fiber orientation GRD plate, the wastage appears to increase with impingement angle transitioning to high wastage at 60° and peaking at 90° with a minor dip at 75°. For the 45° fiber orientation, GRD plate wastage is low for acute impingement angles. There is high wastage at 60°. Then it transitions to medium wastage at higher impingement angles. For the 90° fiber orientation GRD plate, the wastage is overall uniformly low, with some peaks of high wastage at 60° and 90° impingement angles. An easily observed difference between the STD plates and the GRD plates is the impingement angle at which they experience their peak erosion. STD plates’ erosion peaks at 75°, whereas it is 60° for the GRD plates. GRD plates also present overall lower wastage, but more importantly, their wastage is more uniform throughout the spectrum of the tested impingement angles. The erosion wastage uniformity in the GRD plates would translate to uniform erosion of blades which would make the prediction of damage easier.

4. Conclusions

In this study, we explored the toughening potential of a new hybrid coating/composite material in slurry (water, salt and sand) erosion testing designed to mimic the marine conditions experienced by the material of a tidal turbine blade.
Using a novel powder-epoxy manufacturing system, glass-fabric-reinforced laminates were produced with a gradient in epoxy matrix toughness, where the surface subject to marine erosion had the maximum matrix toughness, while the bulk of the laminate contained epoxy matrix with lower toughness but with higher stiffness and strength. The hypothesis was that this gradient-toughening approach could maintain the overall mechanical properties of the laminate (tensile, compressive, flexural strength) while providing more resistance to surface erosion.
Toughened powder epoxy systems were screened through mechanical testing as potential candidates for erosion protection for tidal turbine blade applications. Standard and toughened powders were then mixed, and discrete layers were placed in between the plies of dry UD glass fabrics with different ratios, creating a toughening gradient throughout the composite thickness. Mechanical testing was used to check the compatibility behavior between powders. New samples with different fiber orientations were tested using a slurry erosion system at different angles in order to create aqueous conditions simulating the tidal turbine environment. The main discoveries are listed below:
At 15° impingement angle, both types of epoxy plates performed similarly, displaying very low mass loss and sand particle embedment on the surface. At higher impingement angles, higher mass loss values were observed, and gradient-toughened (GRD) glass-fabric-reinforced epoxy plates generally outperformed the standard (STD) epoxy plates. The greatest performance discrepancy was observed for 0° and 45° surface fiber orientations. GRD plates appear to have a more ductile response to erosion, with mass loss peaking at a 60° impact angle compared to 90° for STD plates. Furthermore, their erosion performance was more uniform across the range of tested impingement angles making the lifetime prediction of the said materials easier.

Author Contributions

Conceptualization, E.H.; C.M.Ó.B.; M.M.S.; and C.R.; methodology, E.H.; and C.R.; software, C.R.; and E.H.; formal analysis, E.H.; M.M.S.; C.M.Ó.B.; and I.Z.; investigation, E.H.; C.R.; C.F.; T.P.; P.J.; resources, C.M.Ó.B.; M.M.S.; C.F.; T.P.; and P.J.; data curation, E.H.; and C.R.; writing—original draft preparation, E.H.; P.J.; C.R.; and I.Z.; writing—review and editing, C.M.Ó.B.; C.R.; I.Z.; and M.M.S.; visualization, E.H.; C.R.; M.M.S.; and I.Z.; supervision, C.M.Ó.B.; M.M.S.; C.R.; and I.Z.; project administration, C.M.Ó.B.; and M.M.S.; funding acquisition, C.M.Ó.B.; and M.M.S.; All authors have read and agreed to the published version of the manuscript.

Funding

This research was funded by EPSRC CAMREG, grant number EP/P007805/1 and Interreg (Northern Ireland—Ireland—Scotland) Special EU Programs Grant No SPIRE2_INT—VA—049 “Storage Platform for the Integration of Renewable Energy (SPIRE 2)”.

Acknowledgments

The authors would like to thank Freilacke and Swiss CMT AG for their provision of resin materials. Finally, this paper is also a tribute to the late Ghulam Rasool, and we thank him warmly for his help.

Conflicts of Interest

The authors declare no conflict of interest.

References

  1. A Oceans of Energy—European Ocean Energy Roadmap 2010–2050. Available online: https://www.icoe-conference.com/publication/oceans_of_energy_european_ocean_energy_roadmap_2010_2050/ (accessed on 22 February 2021).
  2. Ocean Energy Europe. Powering Homes Today, Powering Nations Tomorrow. 2019. Available online: https://www.oceanenergy-europe.eu/wp-content/uploads/2019/04/ETIP-Ocean-Integrated-Strategy-2019-LR.pdf (accessed on 22 February 2021).
  3. Giorgi, S.; Ringwood, J.V. Can tidal current energy provide base load? Energies 2013, 6, 2840–2858. [Google Scholar] [CrossRef] [Green Version]
  4. Siemens Gamesa Renewable Energy. Available online: https://www.siemensgamesa.com/en-int/about-us/company-history (accessed on 22 February 2021).
  5. Orbital Marine Power. Available online: https://orbitalmarine.com/index.php (accessed on 22 February 2021).
  6. Alan Walker. The Future of Marine Renewables; The Royal Academy of Engineering: London, UK, 2011. [Google Scholar]
  7. Arany, L.; Bhattacharya, S.; Macdonald, J.; Hogan, S.J. Simplified critical mudline bending moment spectra of offshore wind turbine support structures. Wind Energy 2015, 18, 2171–2197. [Google Scholar] [CrossRef] [Green Version]
  8. Kennedy, C.R.; Leen, S.B.; Ó Brádaigh, C.M. A preliminary design methodology for fatigue life prediction of polymer composites for tidal turbine blades. Proc. Inst. Mech. Eng. Part L J. Mater. Des. Appl. 2012, 226, 203–218. [Google Scholar] [CrossRef] [Green Version]
  9. Grogan, D.M.; Leen, S.B.; Kennedy, C.R.; Ó Brádaigh, C.M. Design of composite tidal turbine blades. Renew. Energy 2013, 57, 151–162. [Google Scholar] [CrossRef] [Green Version]
  10. Kennedy, C.R.; Jaksic, V.; Leen, S.B.; Ó Brádaigh, C.M. Fatigue life of pitch-and stall-regulated composite tidal turbine blades. Renew. Energy 2018, 121, 688–699. [Google Scholar] [CrossRef] [Green Version]
  11. Fagan, E.M.; Leen, S.B.; Kennedy, C.R.; Goggins, J. Finite element based damage assessment of composite tidal turbine blades. In Proceedings of the Journal of Physics: Conference Series; IOP Publishing: Bristol, UK, 2015; Volume 628, p. 12106. [Google Scholar]
  12. Fagan, E.M.; Kennedy, C.R.; Leen, S.B.; Goggins, J. Damage mechanics based design methodology for tidal current turbine composite blades. Renew. Energy 2016, 97, 358–372. [Google Scholar] [CrossRef]
  13. Fagan, E.; Wallace, F.; Jiang, Y.; Kazemi, A.; Goggins, J. Design and testing of a full-scale 2 MW tidal turbine blade. Engrxiv 2020. [Google Scholar] [CrossRef]
  14. Alam, P.; Robert, C.; Ó Brádaigh, C.M. Tidal turbine blade composites-A review on the effects of hygrothermal aging on the properties of CFRP. Compos. Part B Eng. 2018, 149, 248–259. [Google Scholar] [CrossRef]
  15. Kennedy, C.R.; Leen, S.B.; Ó Brádaigh, C.M. Immersed fatigue performance of glass fibre-reinforced composites for tidal turbine blade applications. J. Bio Tribo Corros. 2016, 2, 12. [Google Scholar] [CrossRef] [Green Version]
  16. Tual, N.; Carrere, N.; Davies, P.; Bonnemains, T.; Lolive, E. Characterization of sea water ageing effects on mechanical properties of carbon/epoxy composites for tidal turbine blades. Compos. Part A Appl. Sci. Manuf. 2015, 78, 380–389. [Google Scholar] [CrossRef] [Green Version]
  17. Humeau, C.; Davies, P.; Jacquemin, F. An experimental study of water diffusion in carbon/epoxy composites under static tensile stress. Compos. Part A Appl. Sci. Manuf. 2018, 107, 94–104. [Google Scholar] [CrossRef] [Green Version]
  18. Davies, P. Towards More Representative Accelerated Aging of Marine Composites. In Advances in Thick Section Composite and Sandwich Structures; Springer: Berlin/Heidelberg, Germany, 2020; pp. 507–527. [Google Scholar]
  19. Guobys, R.; Rodríguez, Á.; Chernin, L. Cavitation erosion of glass fibre reinforced polymer composites with unidirectional layup. Compos. Part B Eng. 2019, 177, 107374. [Google Scholar] [CrossRef]
  20. Lawn, B.R.; Deng, Y.; Miranda, P.; Pajares, A.; Chai, H.; Kim, D.K. Overview: Damage in brittle layer structures from concentrated loads. J. Mater. Res. 2002, 17, 3019–3036. [Google Scholar] [CrossRef]
  21. Wang, A.G.; Hutchings, I.M. Wear of alumina fibre–aluminium metal matrix composites by two-body abrasion. Mater. Sci. Technol. 1989, 5, 71–76. [Google Scholar] [CrossRef]
  22. Jana, B.D.; Stack, M.M. A note on threshold velocity criteria for modelling the solid particle erosion of WC/Co MMCs. Wear 2011, 270, 439–445. [Google Scholar] [CrossRef] [Green Version]
  23. Ahamed, R.A.R.; Johnstone, C.M.; Stack, M.M. Impact angle effects on erosion maps of GFRP: Applications to tidal turbines. J. Bio Tribo Corros. 2016, 2, 14. [Google Scholar] [CrossRef] [Green Version]
  24. Maguire, J.M.; Nayak, K.; Ó Brádaigh, C.M. Characterisation of epoxy powders for processing thick-section composite structures. Mater. Des. 2018, 139, 112–121. [Google Scholar] [CrossRef] [Green Version]
  25. Robert, C.; Pecur, T.; Maguire, J.M.; Lafferty, A.D.; McCarthy, E.D.; Ó Brádaigh, C.M. A novel powder-epoxy towpregging line for wind and tidal turbine blades. Compos. Part B Eng. 2020, 203, 108443. [Google Scholar] [CrossRef]
  26. Flanagan, T.; Maguire, J.; Ó Brádaigh, C.M.; Mayorga, P.; Doyle, A. Smart affordable composite blades for tidal energy. In Proceedings of the 11th European Wave and Tidal Energy Conference EWTEC2015, Nantes, France, 6–11 September 2015; pp. 6–11. [Google Scholar]
  27. Glennon, T.; Flanagan, T.; Doyle, A.; Kelly, G.; Ó Brádaigh, C.M.; Finnegan, W. Development of Novel Manufacturing Techniques for Composite Tidal Turbine Blades. In Proceedings of the SAMPE Europe Conference, Southampton, UK, 11–13 September 2018. [Google Scholar]
  28. Davies, P.; Arhant, M. Fatigue behaviour of acrylic matrix composites: Influence of seawater. Appl. Compos. Mater. 2019, 26, 507–518. [Google Scholar] [CrossRef] [Green Version]
  29. Sathishkumar, T.P.; Satheeshkumar, S.; Naveen, J. Glass fiber-reinforced polymer composites—A review. J. Reinf. Plast. Compos. 2014, 33, 1258–1275. [Google Scholar] [CrossRef]
  30. Rubino, F.; Nisticò, A.; Tucci, F.; Carlone, P. Marine Application of Fiber Reinforced Composites: A Review. J. Mar. Sci. Eng. 2020, 8, 26. [Google Scholar] [CrossRef] [Green Version]
  31. Rasool, G.; Johnstone, C.; Stack, M.M. Tribology of tidal turbine blades: Impact angle effects on erosion of polymeric coatings in sea water conditions. In Proceedings of the 3rd Asian Wave and Tidal Energy Conference (AWTEC 2016), Singapore, 24–28 October 2016; Volume 2, pp. 1016–1033. [Google Scholar]
  32. Bradbury, S.; Joy, D.C.; Ford, B.J. Scanning Electron Microscope. 2019. Available online: https://www.britannica.com/technology/scanning-electron-microscope (accessed on 22 February 2021).
  33. Zu, J.B.; Hutchings, I.M.; Burstein, G.T. Design of a slurry erosion test rig. Wear 1990, 140, 331–344. [Google Scholar] [CrossRef]
  34. Riley, N.A. Projection sphericity. J. Sediment. Res. 1941, 11, 94–95. [Google Scholar]
  35. MacLeod, N. Geometric morphometrics and geological shape-classification systems. Earth Sci. Rev. 2002, 59, 27–47. [Google Scholar] [CrossRef]
  36. Arabnejad, H.; Shirazi, S.A.; McLaury, B.S.; Subramani, H.J.; Rhyne, L.D. The effect of erodent particle hardness on the erosion of stainless steel. Wear 2015, 332–333, 1098–1103. [Google Scholar] [CrossRef]
  37. Levy, A.V.; Chik, P. The effects of erodent composition and shape on the erosion of steel. Wear 1983, 89, 151–162. [Google Scholar] [CrossRef] [Green Version]
  38. Tilly, G.P. A two stage mechanism of ductile erosion. Wear 1973, 23, 87–96. [Google Scholar] [CrossRef]
  39. Holmberg, K.; Laukkanen, A.; Ronkainen, H.; Wallin, K.; Varjus, S.; Koskinen, J. Tribological contact analysis of a rigid ball sliding on a hard coated surface: Part II: Material deformations, influence of coating thickness and Young’s modulus. Surf. Coat. Technol. 2006, 200, 3810–3823. [Google Scholar] [CrossRef]
  40. Reddy, M.K.; Babu, V.S.; Srinadh, K.V. Investigation on effect of fibre volume and fiber orientation on erosive wear behavior of carbon fiber reinforced epoxy (CFRP) composites. Mater. Sci. Forum 2019, 969, 134–139. [Google Scholar] [CrossRef]
  41. Liu, B.; Bao, L.; Xu, A. Effect of fabric orientation and impact angle on the erosion behavior of high-performance thermoplastic composites reinforced with ductile fabric. Wear 2016, 352, 24–30. [Google Scholar] [CrossRef]
  42. Fouad, Y.; El-Meniawi, M.; Afifi, A. Erosion behaviour of epoxy based unidirectionl (GFRP) composite materials. Alexandria Eng. J. 2011, 50, 29–34. [Google Scholar] [CrossRef] [Green Version]
  43. Boggarapu, V.; Gujjala, R.; Ojha, S. A critical review on erosion wear characteristics of polymer matrix composites. Mater. Res. Express 2020, 7, 22002. [Google Scholar] [CrossRef]
  44. Sharifi, S.; Johnstone, C.; Stack, M.M. Tribological challenges of scaling up tidal turbine blades. In Proceedings of the 11th European Wave and Tidal Energy Conference (EWTEC2015), Nantes, France, 6–11 September 2015. [Google Scholar]
  45. Clark, H.M.; Burmeister, L.C. The influence of the squeeze film on particle impact velocities in erosion. Int. J. Impact Eng. 1992, 12, 415–426. [Google Scholar] [CrossRef]
  46. Rasool, G.; Stack, M.M. Some views on the mapping of erosion of coated composites in tidal turbine simulated conditions. Tribol. Trans. 2019, 62, 512–523. [Google Scholar] [CrossRef]
Figure 1. Cross-sectional view of the laminates with standard: toughened matrix gradient properties manufactured for erosion tests fibers.
Lubricants 09 00022 g001
Figure 2. Schematic of the special mold used for manual layup (left) and cure cycle of powder epoxy systems (right).
Lubricants 09 00022 g002
Figure 3. Schematic of the test specimen position in respect to the exit nozzle for the range of impingement angles tested.
Lubricants 09 00022 g003
Figure 4. Schematic representation of fiber orientation with respect to the impingement jet.
Lubricants 09 00022 g004
Figure 5. Schematic diagram of the slurry test rig with the aqueous solution containing particles.
Lubricants 09 00022 g005
Figure 6. SEM image of sand particles after the experiment.
Lubricants 09 00022 g006
Figure 7. Differential scanning calorimetry of (a) standard and (b) toughened powder epoxies for compatibility investigation.
Lubricants 09 00022 g007
Figure 8. Mechanical properties of glass-fabric-reinforced toughened and standard epoxies in ((a), left) longitudinal tension; and ((b), right) longitudinal and transverse 4-point bending.
Lubricants 09 00022 g008
Figure 9. ((a), top left) 0° tensile; ((b), top right) 90° tensile; and ((c), bottom) 0° compression properties of glass-fabric-reinforced standard epoxy powder (PE6405) and mixed standard/toughened powder samples at 1:1 and 3:1 volume ratios.
Lubricants 09 00022 g009aLubricants 09 00022 g009b
Figure 10. Illustration of stiffness mismatch between fiber and matrix.
Lubricants 09 00022 g010
Figure 11. Mass loss of GFRP standard plates with three different surface fiber orientations 0°, 45° and 90° subjected to erosion at 15°, 30°, 45°, 60°, 75° and 90° at 9.04 m/s impact velocity.
Lubricants 09 00022 g011
Figure 12. Mass loss of GFRP gradient plates with three different fiber orientations 0°, 45° and 90° subjected to erosion at 15°, 30°, 45°, 60°, 75° and 90° at 9.04 m/s impact velocity.
Lubricants 09 00022 g012
Figure 13. Mass loss of STD0 and GRD0 subjected to erosion at 15°, 30°, 45°, 60°, 75° and 90° at 9.04 m/s impact velocity.
Lubricants 09 00022 g013
Figure 14. Mass loss of STD45 and GRD45 subjected to erosion at 15°, 30°, 45°, 60°, 75° and 90° at 9.04 m/s impact velocity.
Lubricants 09 00022 g014
Figure 15. Mass loss of STD90 and GRD90 subjected to erosion at 15°, 30°, 45°, 60°, 75° and 90° at 9.04 m/s impact velocity.
Lubricants 09 00022 g015
Figure 16. SEM micrograph of GRD45 at 15° impingement angle (a), STD45° at 30° impingement angle (b), GRD45 at 30° impingement angle (c), STD45 at 45° impingement angle (d), GRD45 at 45° impingement angle (e), GRD45 at 60° impingement angle (f), GRD45 at 75° impingement angle (g), STD90 at 90° impingement angle (h).
Lubricants 09 00022 g016
Figure 17. Erosion wastage map for STD plates.
Lubricants 09 00022 g017
Figure 18. Erosion wastage map for GRD plates.
Lubricants 09 00022 g018
Table 1. Mechanical test standards and dimensions.
Test DescriptionNominal Sample Length (mm)Nominal Sample Width (mm)Nominal Sample Thickness (mm)
Tensile 0° and 90°
(ISO 527-4 and ISO 527-5)
250252
Compression 0° and 90°
(ASTM D6641)
140132
4 point bending 90° 0° and
(ISO 14125-Class III)
60152
Fiber volume fraction
(ASTM D2734)
10102
Table 2. Specimen codes for erosion testing.
Specimen CodenameDescription
Std0GFRP standard plate with 0° surface fiber orientation
Std45GFRP standard plate with 45° surface fiber orientation
Std90GFRP standard plate with 90° surface fiber orientation
Grd0GFRP gradient plate with 0° surface fiber orientation
Grd45GFRP gradient plate with 45° surface fiber orientation
Grd90GFRP gradient plate with 90° surface fiber orientation
Table 3. Erosion test parameters.
ParameterValue
Impingement angle15°, 30°, 45°, 60°, 75°, 90°
SolutionsSalt and Sand
Salinity (wt %)3.5
Sand concentration (wt %)3
Test duration (min/sample)30
Sand particle size (µm)300–600
Impact velocity (ms−1)9.04
Table 4. Fiber volume fraction for both toughened powder-epoxy ratios.
SampleMass of Composite
(g)
Mass of Fibers
(g)
Volume of Composites
(cm3)
Volume of Fibers
(cm3)
FVF
(%)
25% Toughened (1)1.0600.6880.5720.26546.3
25% Toughened (2)1.1030.7230.5920.27847.0
50% Toughened (3)1.0620.6640.5870.25543.5
50% Toughened (4)1.3710.8650.7540.33344.1
Table 5. List of defect types based on SEM analysis.
Impingement AngleDefect Type
STD 0° fiber orientation
15°Exposed fiber, fiber fracture, particle embedment
30°Fiber fracture
45°Fiber fracture
60°Fiber cracking
75°Particle embedment, matrix cutting, fiber fracture
90°Fiber fragmentation, fiber cracks
STD 45° fiber orientation
15°Particle embedment, matrix cutting
30°Fiber fracture, fiber cracking
45°Fiber fragmentation
60°Matrix cutting, fiber fragmentation
75°Fiber fragmentation
90°Fiber fracture, fiber cracking
STD 90° fiber orientation
15°Particle embedment
30°Matrix cutting, fiber exposure
45°Matrix debonding, fiber exposure, fiber cracking
60°Fiber cracking
75°Matrix cutting, fiber fracture
90°Matrix cutting, fiber fragmentation
GRD 0° fiber orientation
15°Fiber exposure, fiber cracking, particle embedment
30°NaCl deposition, fiber cracking, matrix debonding
45°Matrix cutting, fiber exposure
60°Fiber cracking, matric cutting
75°Fiber cracking
90°Fiber fracture, matrix cutting
GRD 45° fiber orientation
15°Particle embedment
30°Matrix debonding
45°Matrix cutting, matrix debonding
60°Fiber fracture
75°Matrix debonding, fiber cracking
90°Particle embedment, matrix cutting, fiber fracture
GRD 90° fiber orientation
15°Fiber exposure, particle embedment
30°Matrix cutting, NaCl deposition
45°Fiber exposure, matrix debonding,
60°Fiber cracking, matrix cutting
75°Fiber fragmentation
90°Matrix cutting, Matrix debonding, fiber fragmentation, fiber cracking
Publisher’s Note: MDPI stays neutral with regard to jurisdictional claims in published maps and institutional affiliations.

