1. Introduction
For safe and economic railway operation, the coefficient of friction between the rail head surface and the wheel tread should stay within an optimal range. Undesirable low friction values are caused by a variety of substances in the wheel–rail interface. These include, for example leaves and leaf mulch, especially in combination with water [
1,
2,
3,
4,
5]); oil contamination of the surface and oil/water mixtures [
2,
6]; water with salt [
7]; or little amounts of water in combination with iron oxides and wear debris on the surface [
7,
8,
9,
10,
11]. Low friction values may prevent the safe braking of vehicles and lead to wheel flats, thus compromising safe railway operation. Low friction values are also of concern for the acceleration of vehicles by limiting the available traction and with respect to wheel slips. The standard measure to increase the coefficient of friction in the wheel–rail interface is sanding [
2,
3,
12]. The application of traction enhancers [
13,
14] has also been shown to increase the friction level effectively. Novel rail cleaning technologies to increase the coefficient of friction, such as dry ice blasting [
15], microwave plasma conditioning, pulsed laser ablation, and controlled water addition, are currently being trialled [
16].
High friction values between the rail head surface and the wheel tread are also undesirable. Top-of-rail (TOR) products reduce and maintain the coefficient of friction in the wheel–rail contact at intermediate levels [
17] in order to reduce squealing noise, corrugation, rolling contact fatigue, wear, and energy consumption [
17,
18,
19]. Products can be applied either wayside [
19,
20] or vehicle-based [
21].
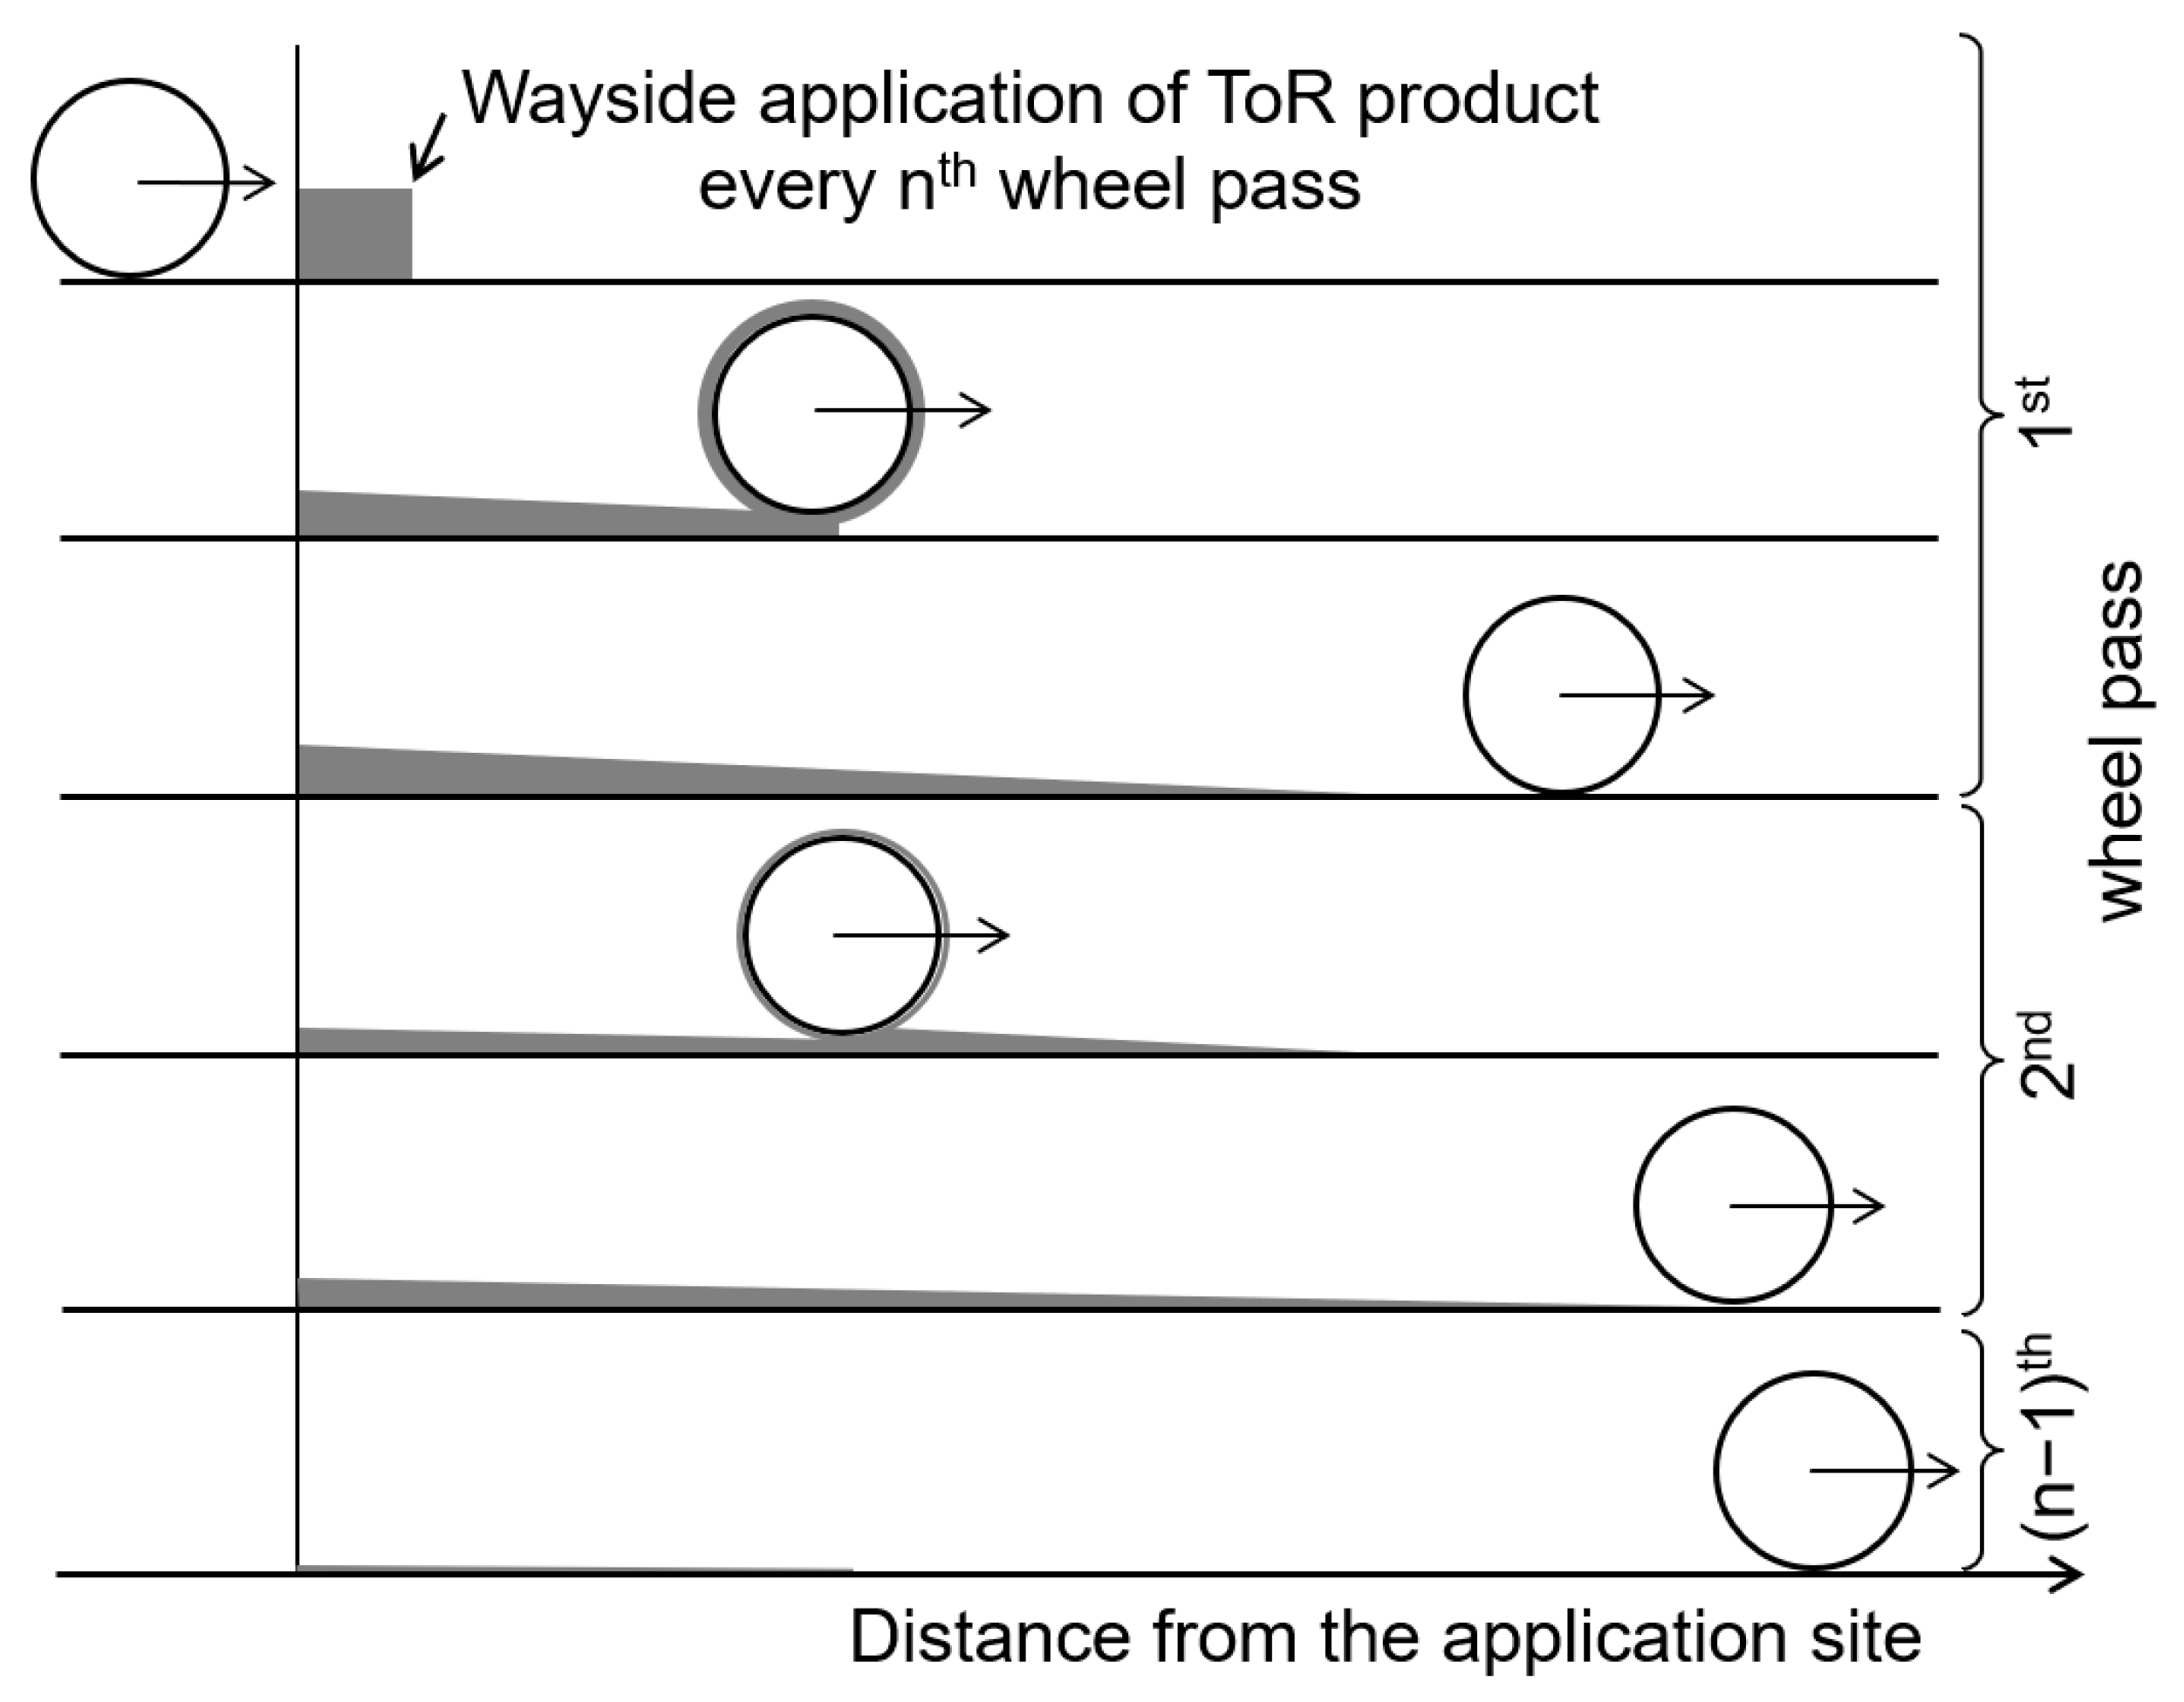
Figure 1 illustrates the spreading of TOR products along the rail in the case of a wayside application. Passing wheels continuously pick-up and re-deposit products on the wheel and rail surfaces. At the same time, products are consumed/degraded and mixed with third-body layer constituents (such as wear debris and iron oxides) in the wheel–rail interface depending on the contact conditions. Water-based products transition from a “wet” state (liquid) at the application site to a “dry” state (solid) at some distance down the track. These processes take place simultaneously and determine the amount of product, its properties, and thus the frictional condition along the rail.
Models describing the removal of contaminants from the wheel–rail interface and the associated change in the frictional condition have been published in the past. Allotta et al. [
22] modelled adhesion recovery from degraded adhesion conditions to recovered adhesion conditions by an exponential relationship based on the (instantaneous) value of the specific frictional work per unit rolling distance. Voltr and Lata [
23] investigated adhesion level changes due to varying longitudinal creepage for oil-contaminated conditions on a tram wheel test rig. In their model, the transition from contaminated conditions to dry (clean) conditions was modelled proportional to the specific dissipated work over a time interval. Differences in adhesion with respect to increasing creepage and decreasing creepage (hysteresis effect) were considered based on the time derivative of the creep velocity. Vollebregt et al. [
24] recently surveyed advances in modelling wheel–rail friction and highlighted the transient nature of the coefficient of friction.
The carry-on behaviour due to repeated wheel–rail contacts has been investigated experimentally but no model predicting the carry-on behaviour of products is known to the authors. Hibbert [
25] investigated the carry-on behaviour of a water-based drying top-of-rail friction modifier (TOR-FM) product using a modified band saw. Results showed that most of the liquid TOR-FM is squeezed out of the contact during a wheel pass so that little product remains in the contact area. The TOR-FM was carried forward by the edges of the contact and was transferred from the wheel to the rail in subsequent wheel–rail interactions. A dry layer of TOR-FM transferred from the wheel to the rail and vice versa at a low rate and was not squeezed out of the contact area. Khan et al. [
26] investigated the carry-on distance of TOR-FM at a Swedish iron ore line. Product was detected up to 450 m from the wayside application site on the rail surface. In the contact band on the wheel, product was detectable up to 340 m from the application site. However, at the edges of the contact band on the wheel surface, product was still present after 3 km from the application site. This observation is consistent with results published earlier by Eadie et al. [
27]. Under North American unidirectional freight conditions, a reduction of lateral forces was measured even in a case where a single TOR application unit was installed 3.2 km before the measurement site on a continuously curved track.
In this work, a model is presented that predicts the frictional condition in the wheel–rail interface for wayside TOR product application. The novelty of the model is that it considers both the transfer of product between contacting surfaces (pick-up of product from the rail and re-depositing product on rail) and product consumption in one model, as well as the relationship of these mechanisms with the coefficient of friction. This allows for predictions of the evolution of the frictional condition in the wheel–rail interface as a function of the distance from the application site and the number of wheel passes. The model development has been accompanied by experiments to provide data for the model parameterization. While small-scale twin disc experiments provided information about product consumption, full-scale wheel–rail rig experiments provided data about both product pick-up and product consumption under realistic wheel–rail contact conditions. The model may assist train operators and infrastructure maintainers in determining the best approach for the wayside application of TOR products because the influence of different application positions, applied product amounts, and application patterns, as well as operating conditions such as wheel loads, creepage, and curve radius on the frictional condition along the track, can be evaluated much quicker through modelling than by field trials.
The methodology is described in
Section 2, followed by experimental results and the model parameterization in
Section 3.
Section 4 discusses the influence of certain model parameters on the frictional conditions along the rail. Final conclusions are drawn and an outlook is given in
Section 5.
2. Methodology
2.1. Introduction
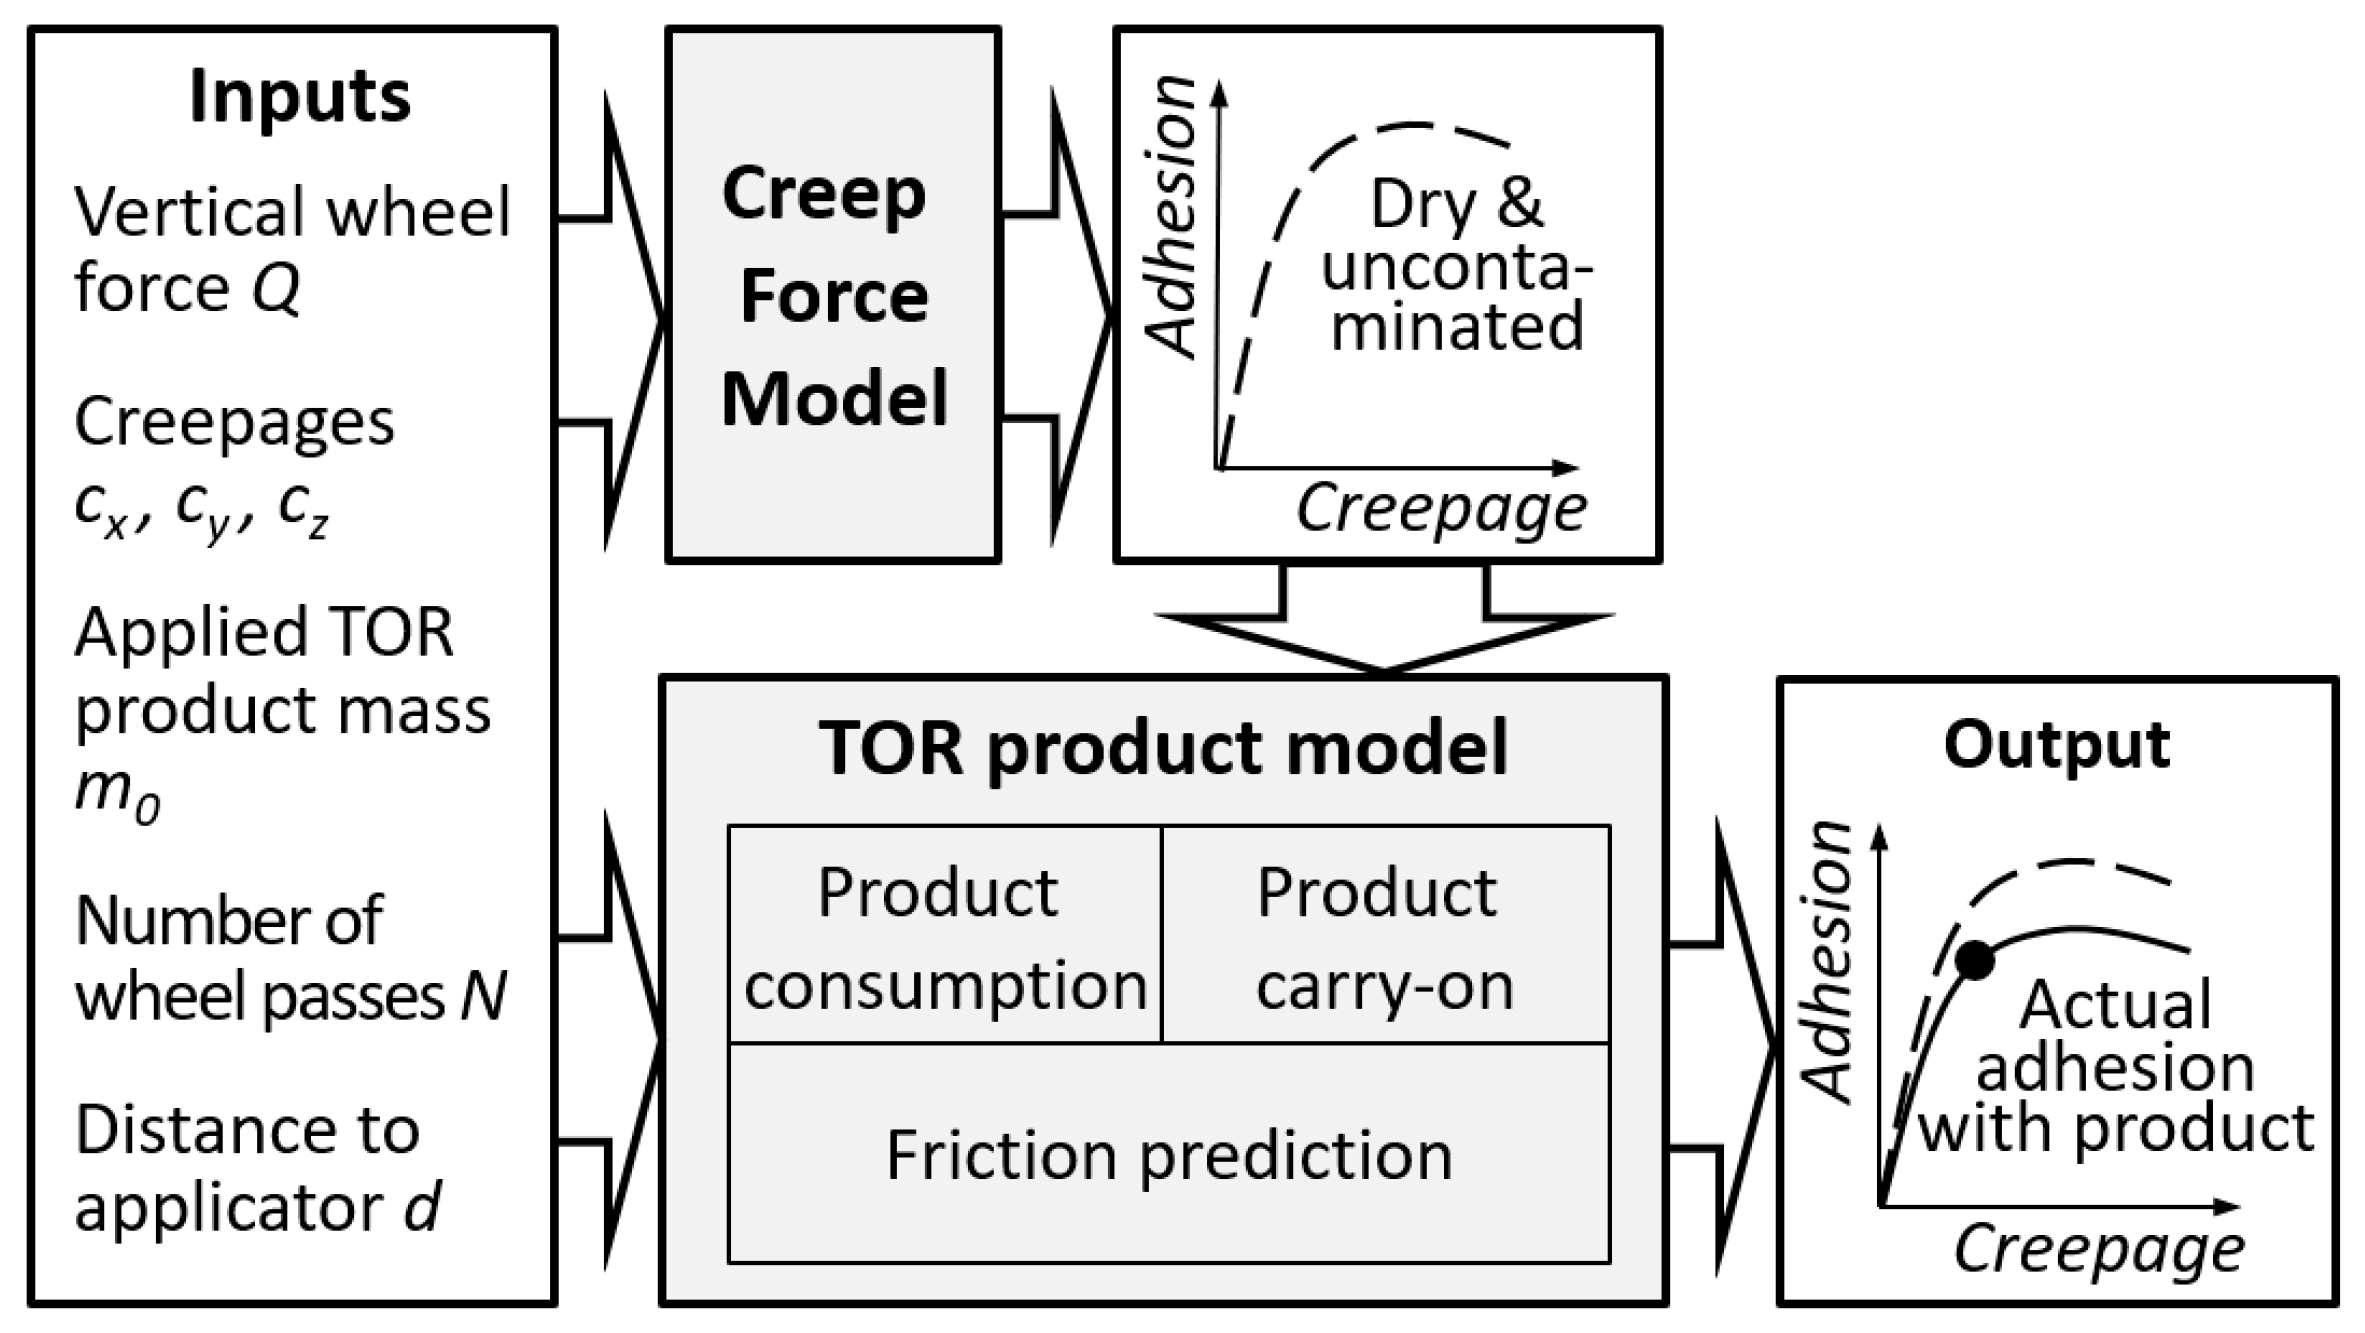
Figure 2 shows the modelling approach. Input data to the model are the vertical wheel force
Q, longitudinal creepage
cx, lateral creepage
cy, spin creepage
cz, the TOR product mass
m0 applied at the application site, and the number of wheel passes
N. The model calculates the coefficient of adhesion
T/N (ratio of the tangential contact friction force to the normal contact force) in the wheel–rail contact at the distance
d from the application site as an output depending on the contact conditions.
The simulation model consists of two parts: A creep force model that relates the relative movement of the contacting surfaces in terms of creepages to frictional tangential forces in the contact patch for uncontaminated, dry conditions, and a TOR product model. The TOR product model addresses the mechanisms of product consumption and product carry-on that determine how the product distributes along the track. In the friction prediction step, the (local) product masses in the wheel–rail contact area are related to the coefficient of friction and the creep curve is appropriately scaled. The individual parts of the model are described in detail in the following sections.
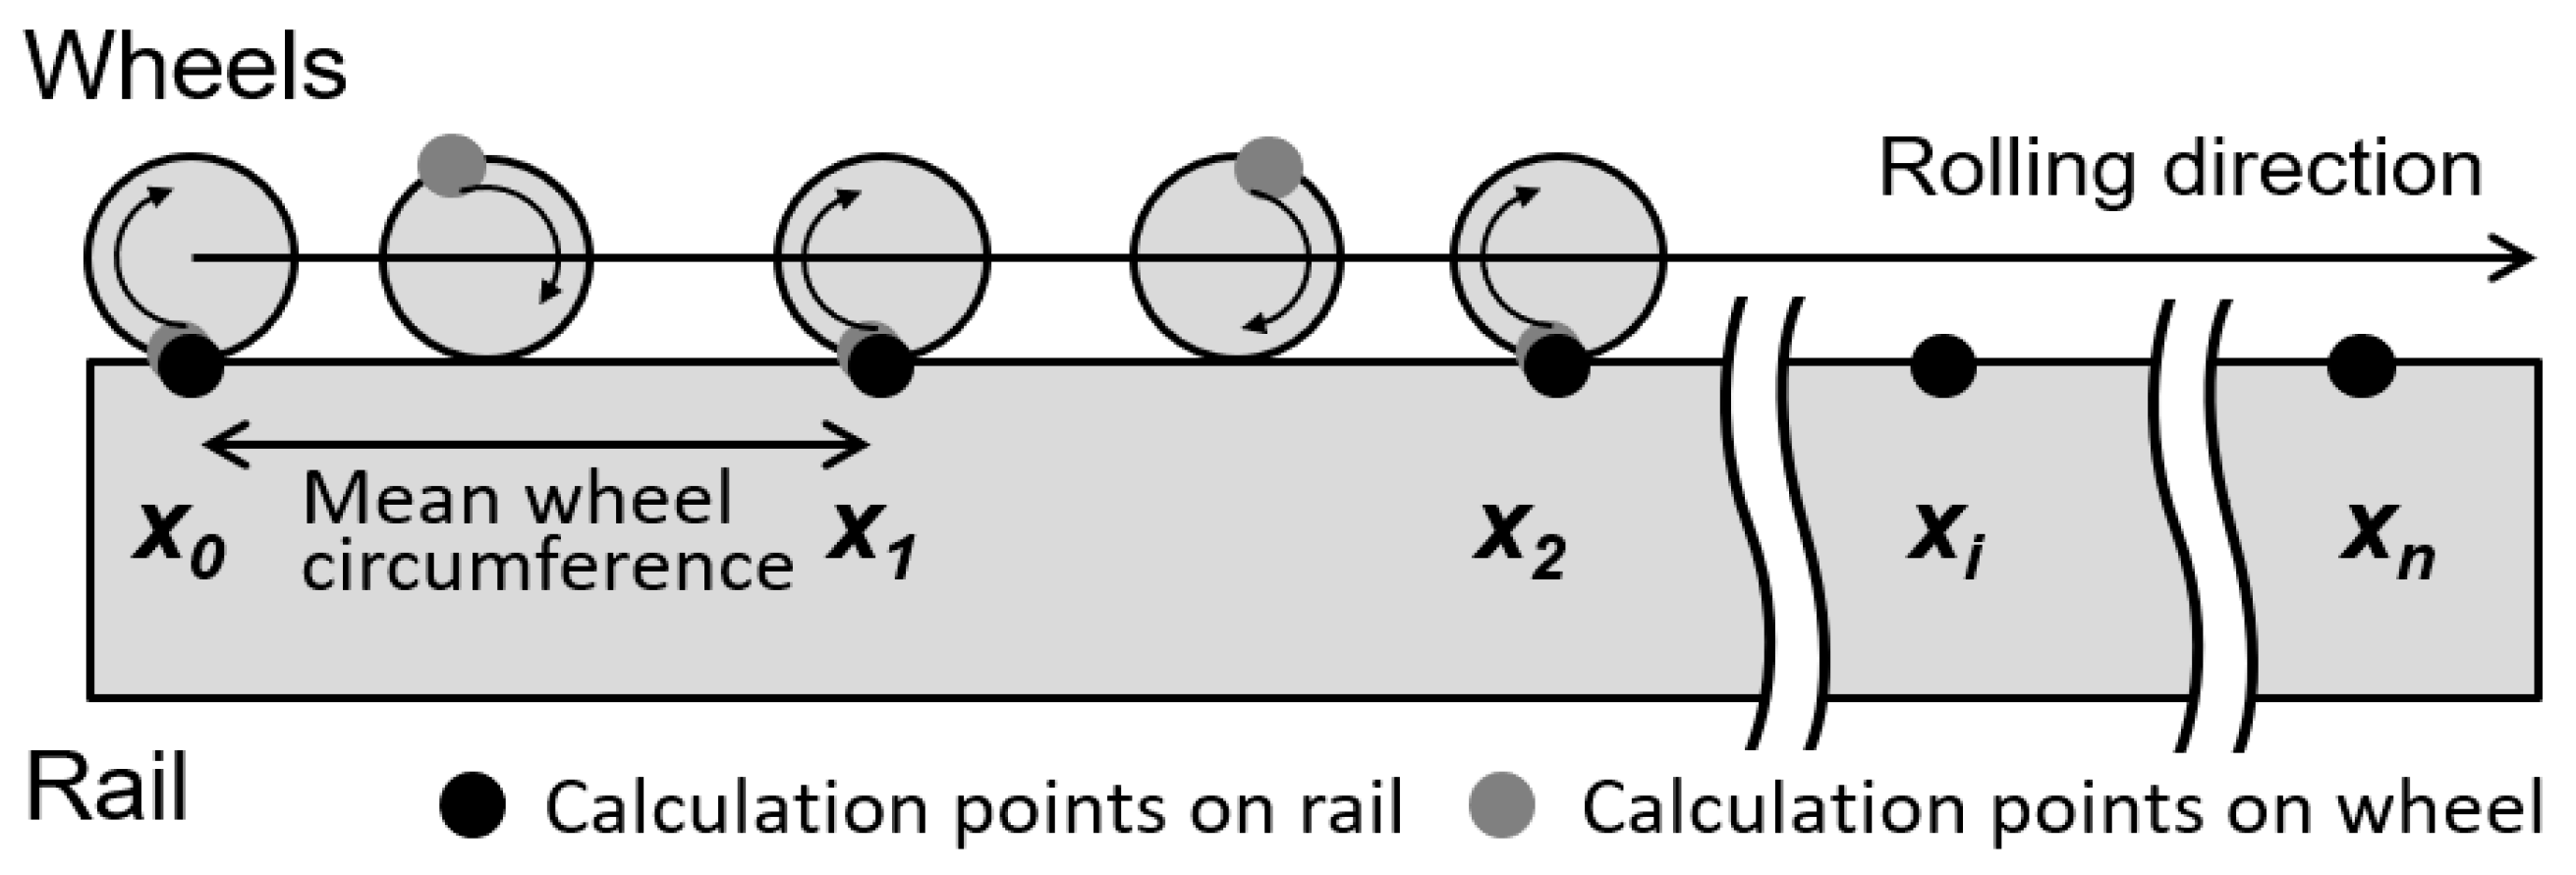
2.2. Model Discretization
The frictional condition along the rail is calculated for equidistant points
xi that are spaced by the mean circumference of the wheels that roll over the rail (see
Figure 3). This means that a specific point on the wheel surface that is in repeated contact with the rail surface is followed in the simulation. The assumption of equidistant calculation points on the rail is a simplification. In railway operation, wheels roll at varying effective diameters, which are determined by the nominal diameter, the wheel and rail profile shapes, and the lateral shift of the wheelset. In addition, longitudinal creepage occurs, which changes the circumferential length of the wheel surface that is in contact with the rail per distance rolled.
A product mass m is assigned to each calculation point that represents the mass of product in an average typical contact area at this position. The model could be formulated in terms of mass per contact area or in terms of a (local) product height/thickness in a more sophisticated approach. This may provide more insight into the interplay between TOR products and the surface roughness as well as into the effect of mixing iron oxides, wear debris, and TOR products. However, this is inconvenient for practical applications of the model to railway operating scenarios where information about applied product masses or volumes may be available, but little or no information is often available about the actual contact conditions. The mass m should therefore be seen as an internal model variable that determines the frictional condition under the assumption of typical wheel–rail contact conditions in operations.
The model describes the average frictional conditions in the contact area. For simplicity, it is assumed that the lateral contact positions on the surfaces of the wheel and rail do not change (significantly) after the application site. This is reasonable for modelling constant radius curves in the case of the stationary curving behaviour of vehicles. If there are different lateral contact patch positions for leading and trailing wheels of a bogie (such as frequently observed on high rails in tight curves), two simulations are required that simulate the contacts on the rail surface independently: one for the contact between the wheel flange root and the gauge corner (leading wheels in the bogie), and one for the contact between the wheel tread and the top of the rail (trailing wheels in the bogie). On low rails in curves, the lateral contact positions are often similar for all wheels so that usually only one simulation with all wheels needs to be carried out.
2.3. Creep Force Model
The creep force model relates the relative movement of the contacting surfaces (described by the longitudinal, lateral, and spin creepage) to the coefficient of adhesion (ratio of the resulting tangential contact force to the normal contact force) in rolling contacts. This is done with a model that has been published by Polach [
28,
29]. This model is widely used in multi-body simulations of railway vehicles.
2.4. Modelling of Product Consumption
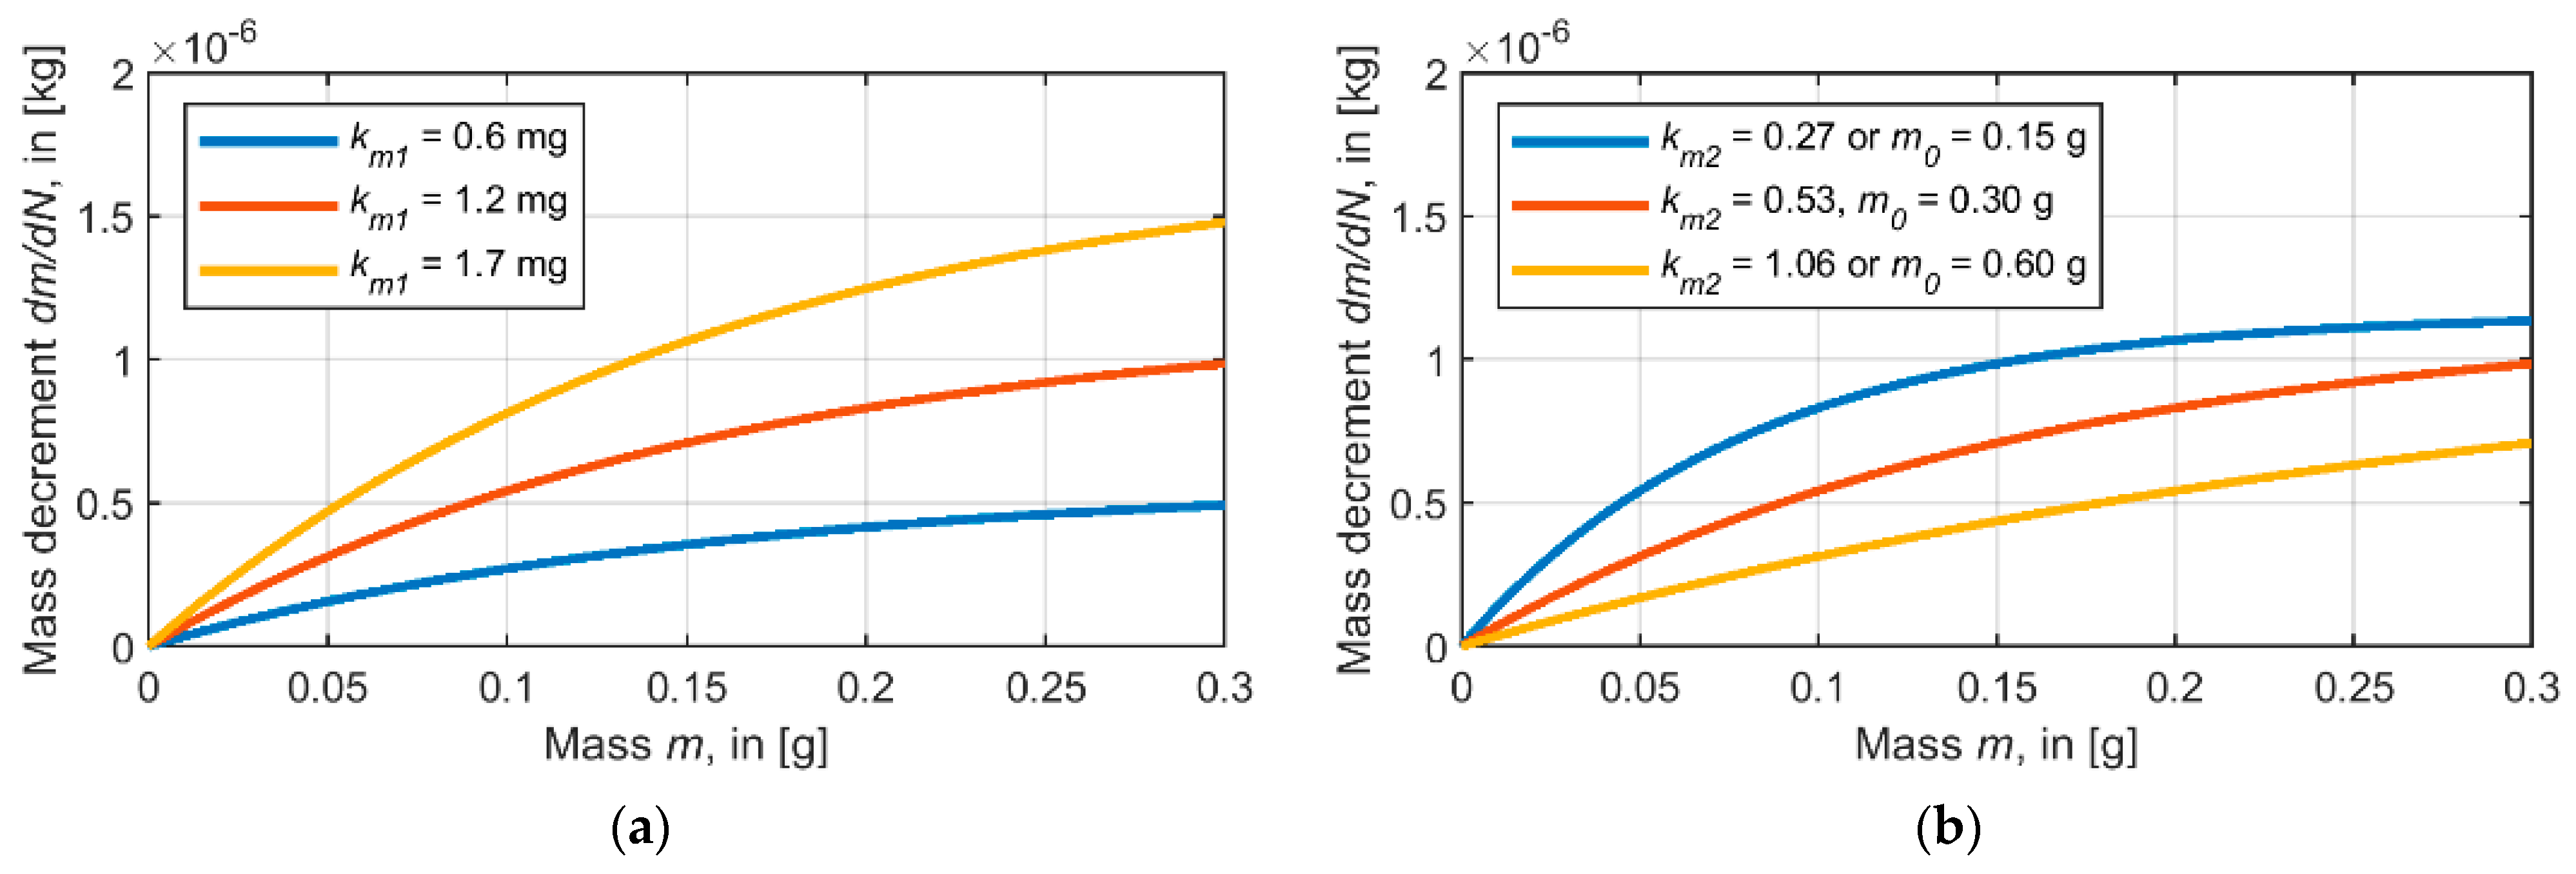
The reduction of product amount that is affecting the coefficient of friction in the contact area is subsumed by the term “product consumption”. It is quantified by the product mass decrement per cycle
dm/
dN in the model. This quantity is comprised of the combined effect of both the product degradation and the product squeezed out of the contact area. The following expression has been chosen based on experimental observations (see
Section 3):
For
m >>
m0·
km2 and assuming
fp =
fc = 1, the product consumption rate d
m/d
N =
k0 +
km1 is constant. For
m ≈ (
m0·
km2), the consumption rate decreases in an exponential way.
k0,
km1, and
km2 are parameters that have been determined from experiments (see
Section 3).
m0 represents the initially applied product mass.
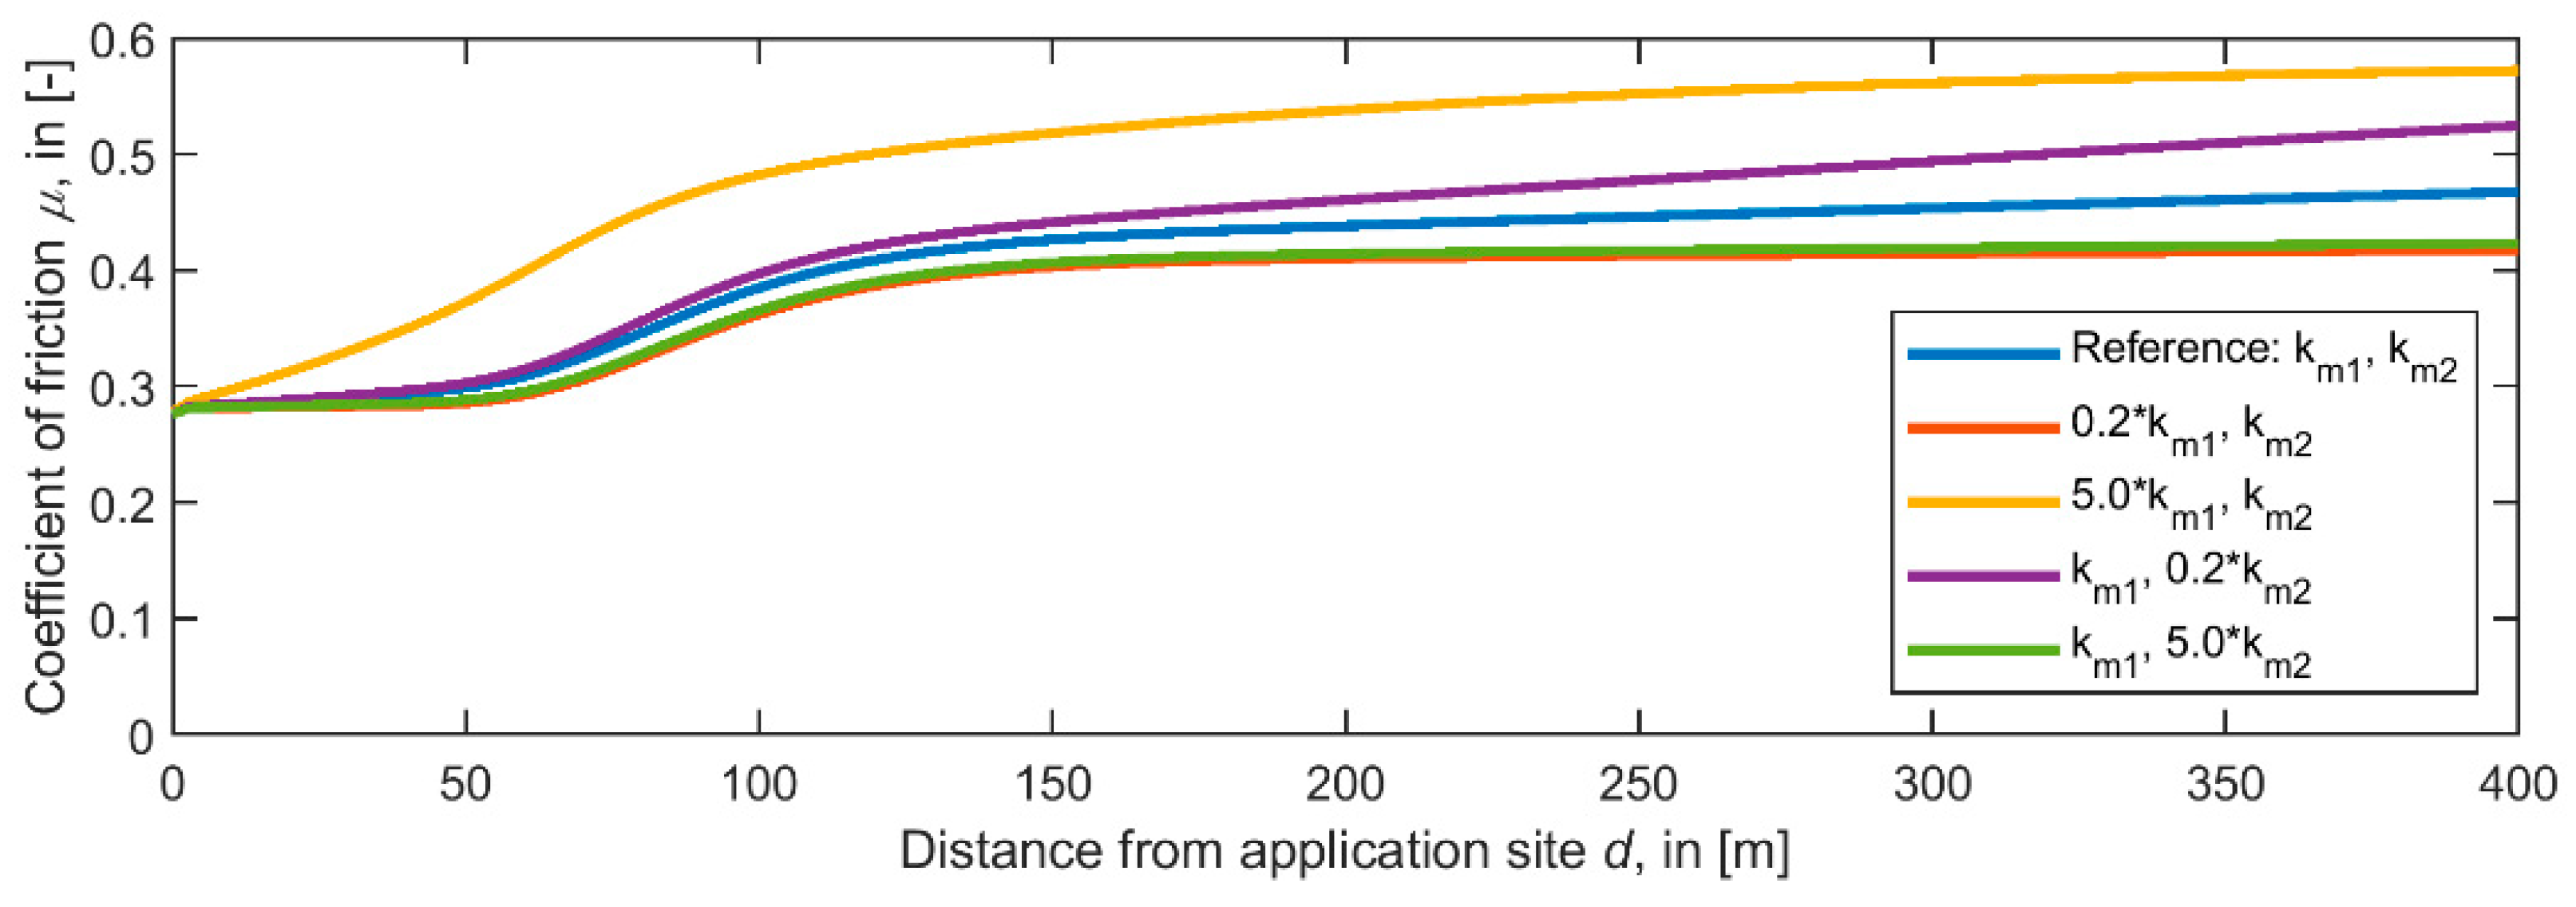
Figure 4 shows the product mass decrement d
m/d
N for varying values of
km1,
km2, and
m0.
Data obtained from twin disc experiments showed a slower adhesion recovery rate with an increased product mass applied [
30]. This behaviour is accounted for by the initial mass
m0 in Equation (1).
fp describes the influence of the mean normal contact pressure
pm on the consumption rate, while
fc describes the influence of the longitudinal creepage
cx and the lateral creepage
cy. Equations (2) and (3) satisfactorily describe the experimental results in twin disc experiments, taking the reference condition as 1178 MPa mean normal pressure and 1% longitudinal creep.
kp and
kc are empirical parameters that are fitted to experimental results.
2.5. Modelling of Coefficient of Friction
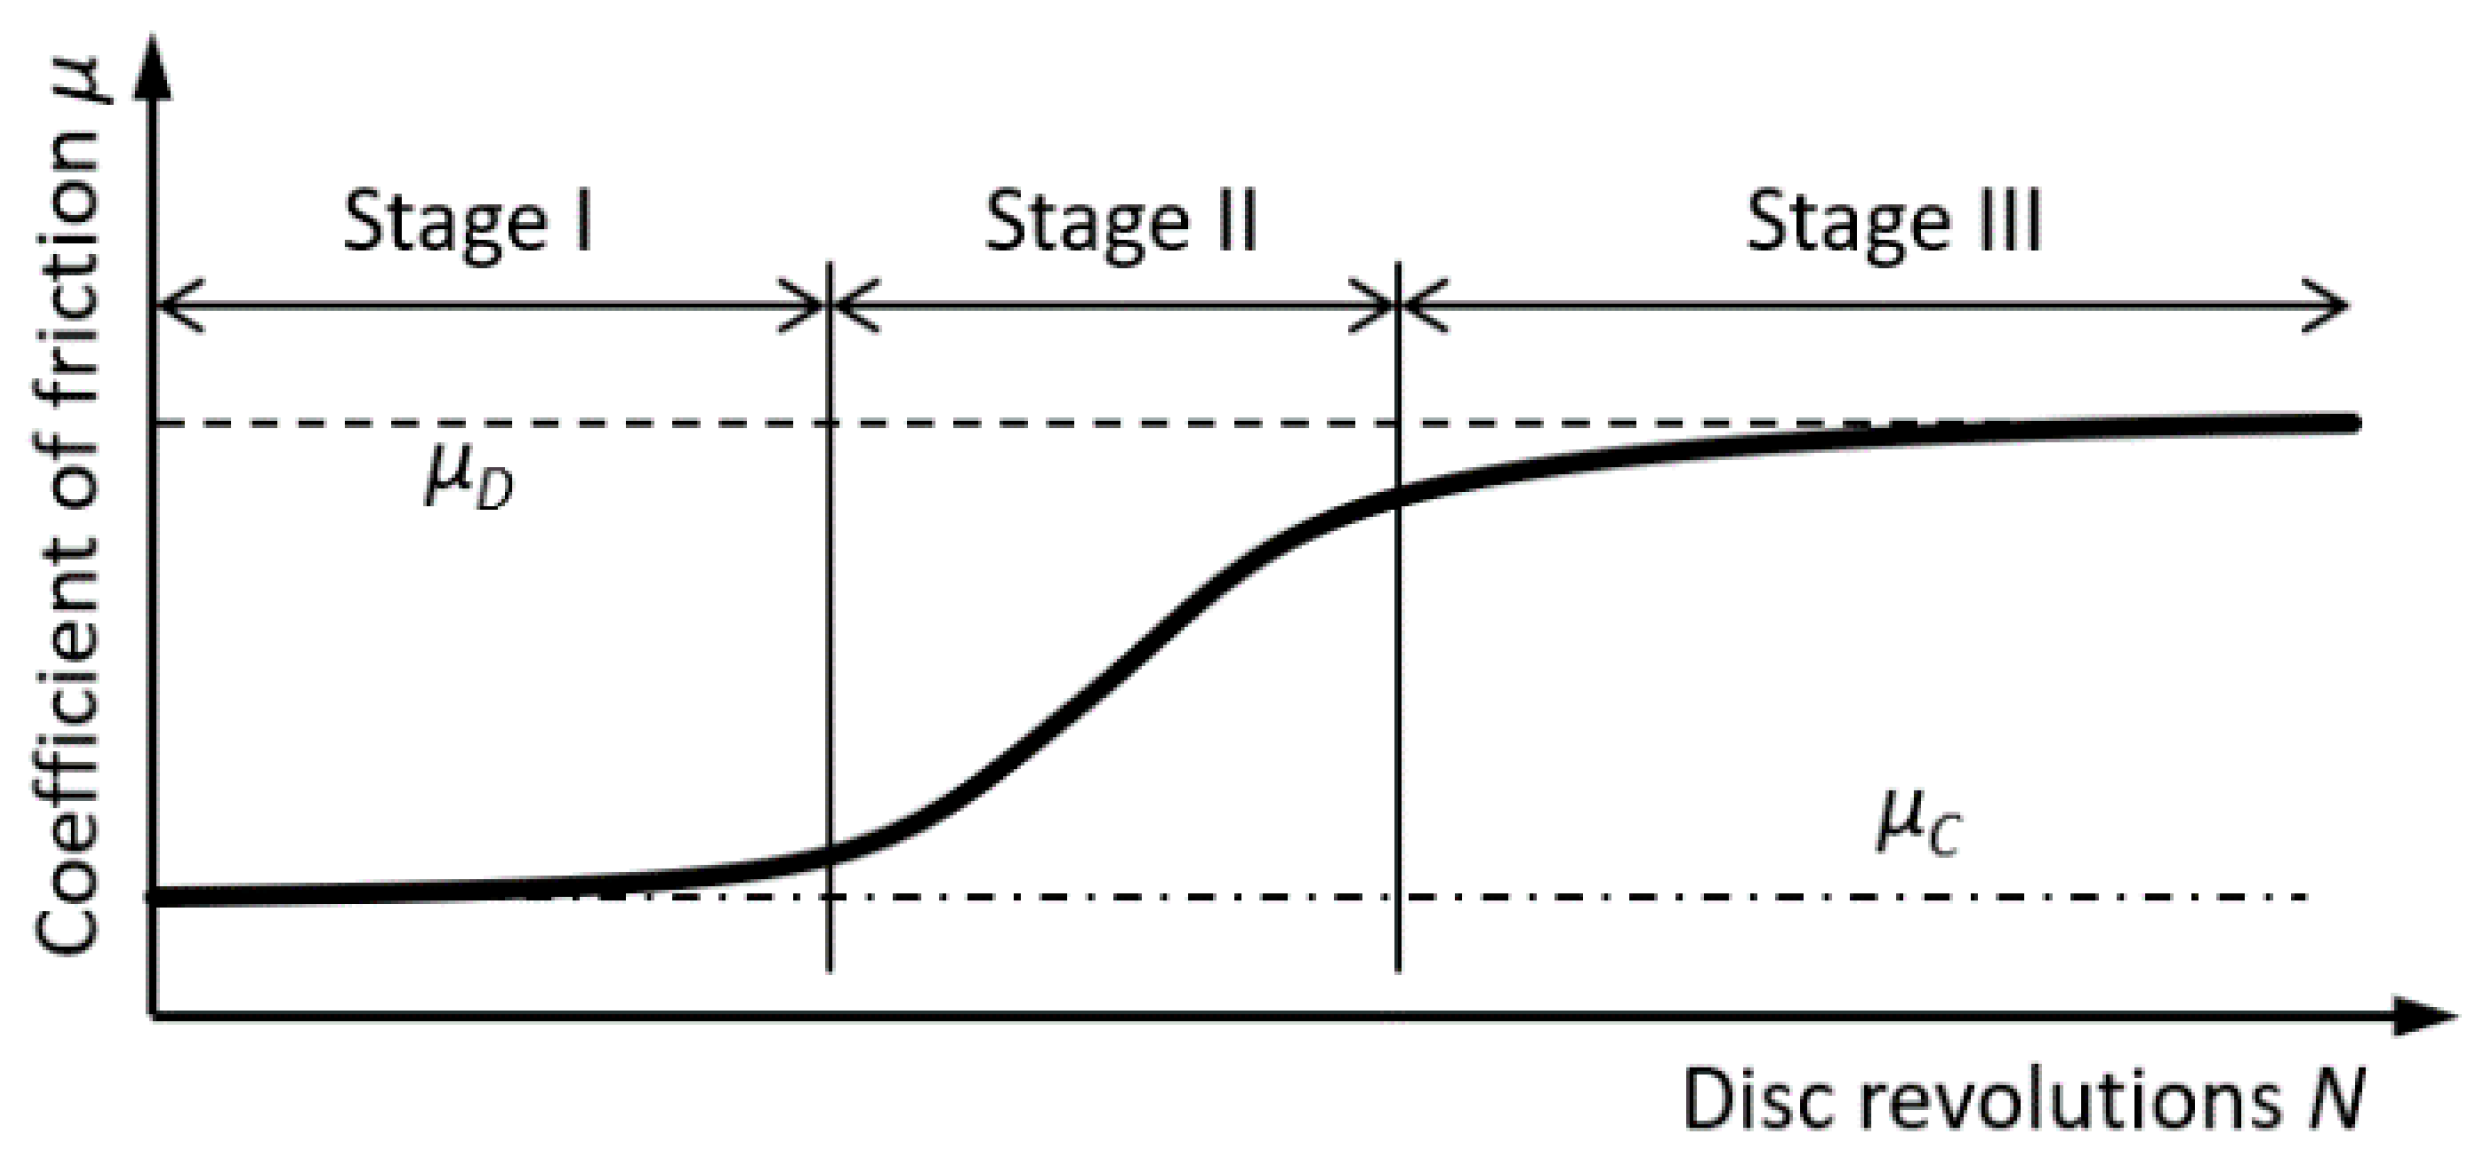
The evolution of the coefficient of friction with the number of disc revolutions in twin disc experiments generally shows three stages [
30,
31] (see
Figure 5): Stage I has a constant and low coefficient of friction
µC, Stage II has an increasing coefficient of friction, and Stage III represents dry and clean surface conditions where the coefficient of friction stabilizes on a high level described by
µD.
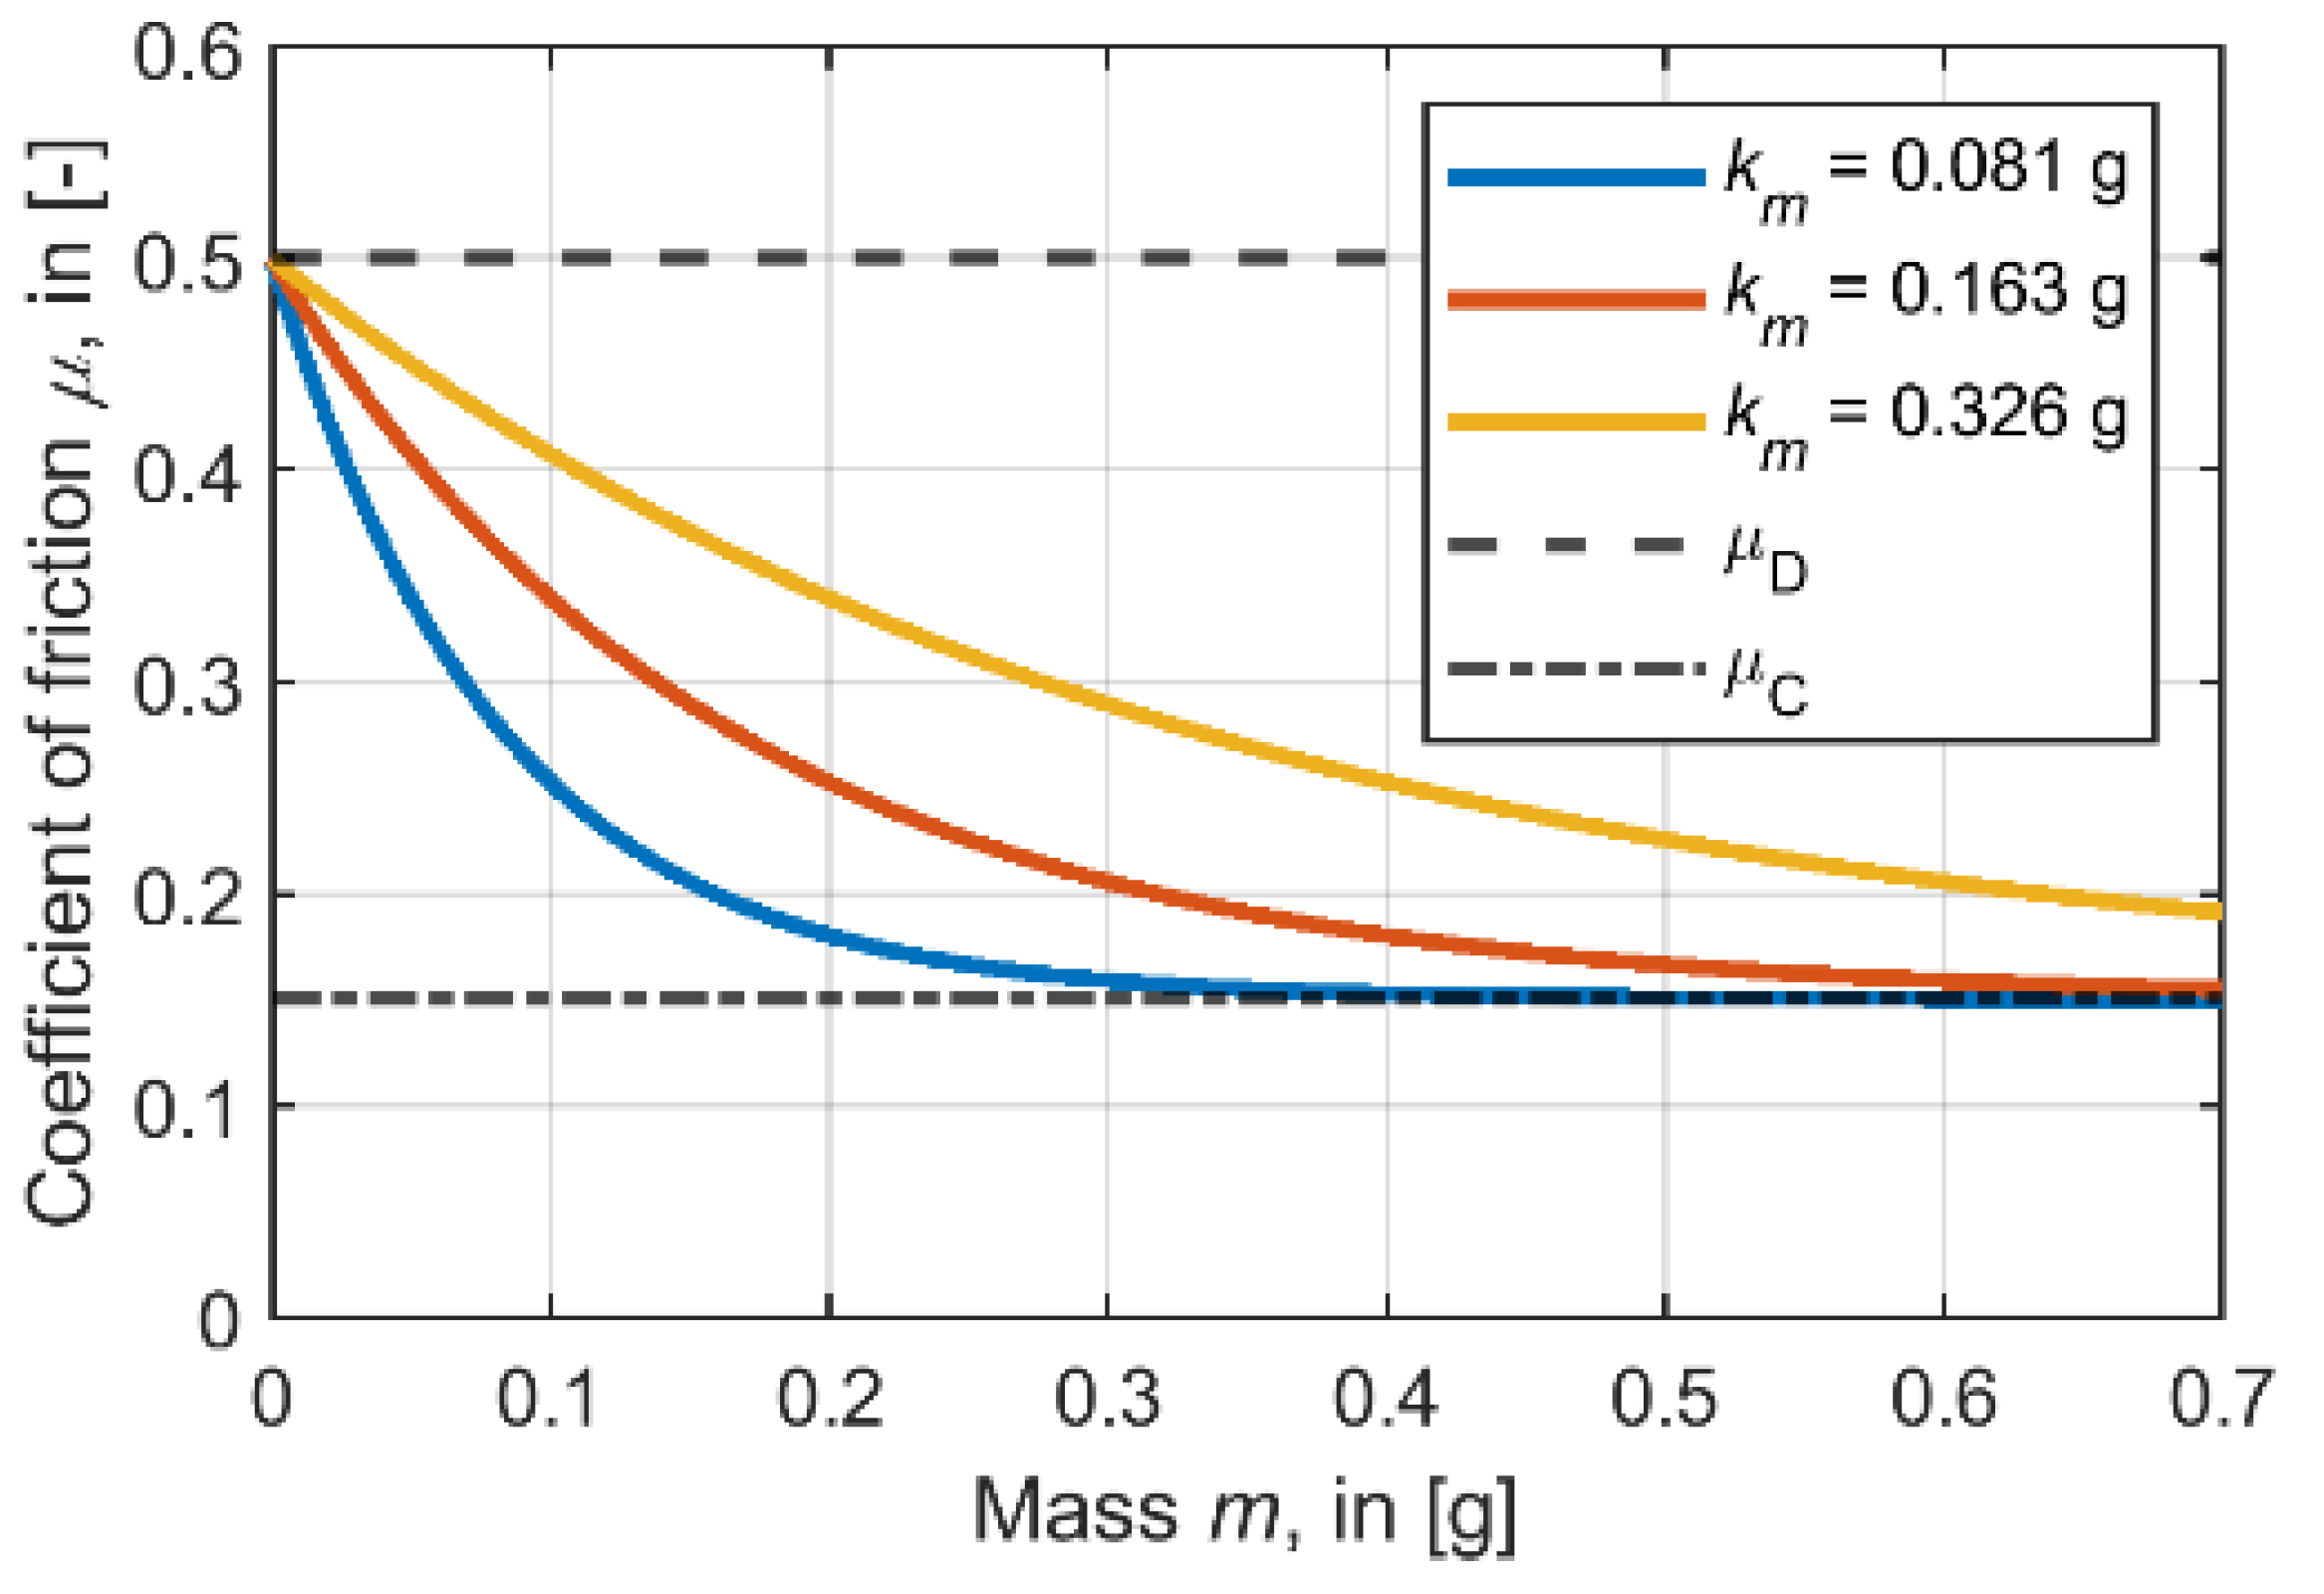
The relation between the coefficient of friction
µ and the product mass
m has been chosen as an exponential relationship, based on experimental observations, as:
µD is the limiting coefficient of friction with no product in the contact area (dry and clean surface), while
µC is the limiting coefficient of friction with surplus product in the contact area.
km is a parameter that describes the exponential decay of the coefficient of friction with increasing product mass
m.
Figure 6 shows the change of the coefficient of friction
µ as a function of the product mass
m for varying values of
km.
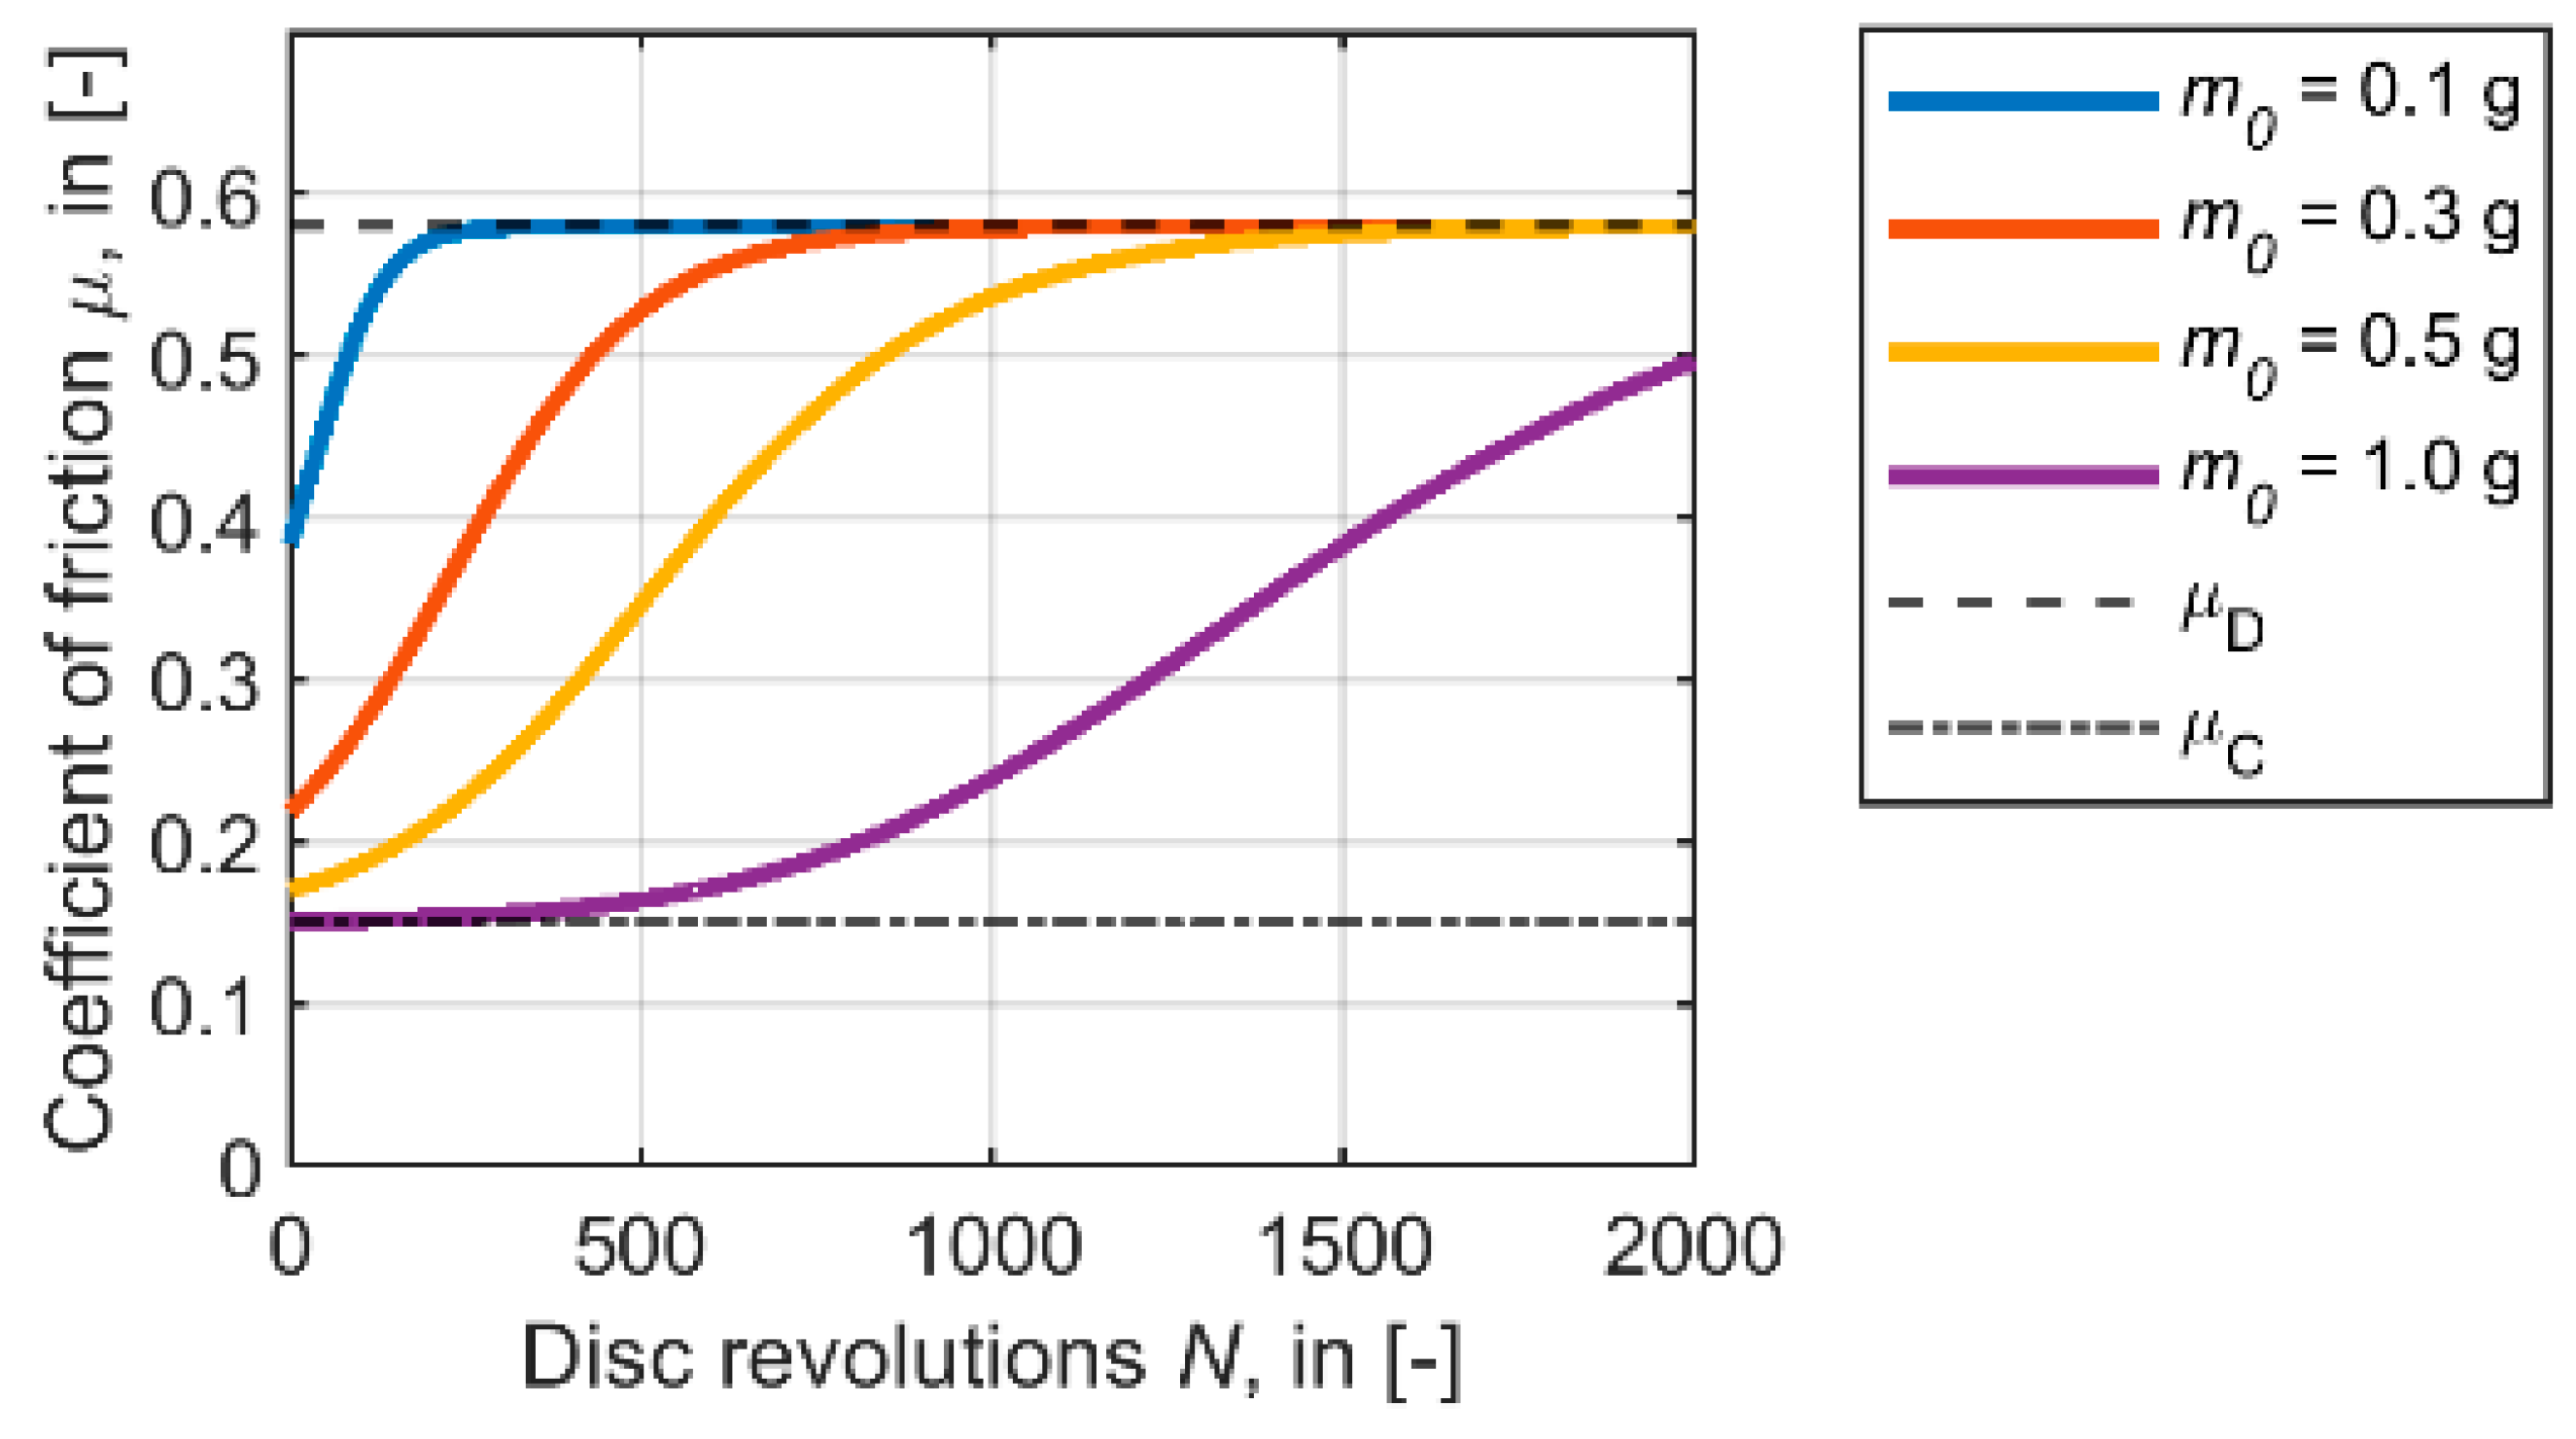
The combination of Equation (1) with Equation (4) produces S-shaped curves of the coefficient of friction
µ when plotted as a function of the number of disc revolutions
N, as shown in
Figure 7, for different amounts of applied TOR product
m0. Applying little product (case
m0 = 0.1 g) causes a rapid increase of the coefficient of friction towards
µD. When the applied product amount is increased (cases
m0 = 0.3 g and
m0 = 0.5 g), the coefficient of friction drops initially towards
µC, followed by an increase towards
µD. If a large amount of product is applied, the coefficient of friction is low for a number of cycles before the coefficient of friction gradually increases following an S-shaped characteristic. Such curves have been observed for grease-based lubricants in lubrication starvation tests in twin disc experiments [
31].
Increasing the amount of applied product
m0 shifts the transition between
µC and
µD to higher numbers of disc revolutions and decreases the slope of the curve in the transition region. In the twin disc lubrication starvation tests with grease in [
31], this effect was weak, but it was prominent in ball-on-disc experiments with oil-based TOR products in [
30].
2.6. Modelling of Product Carry-On
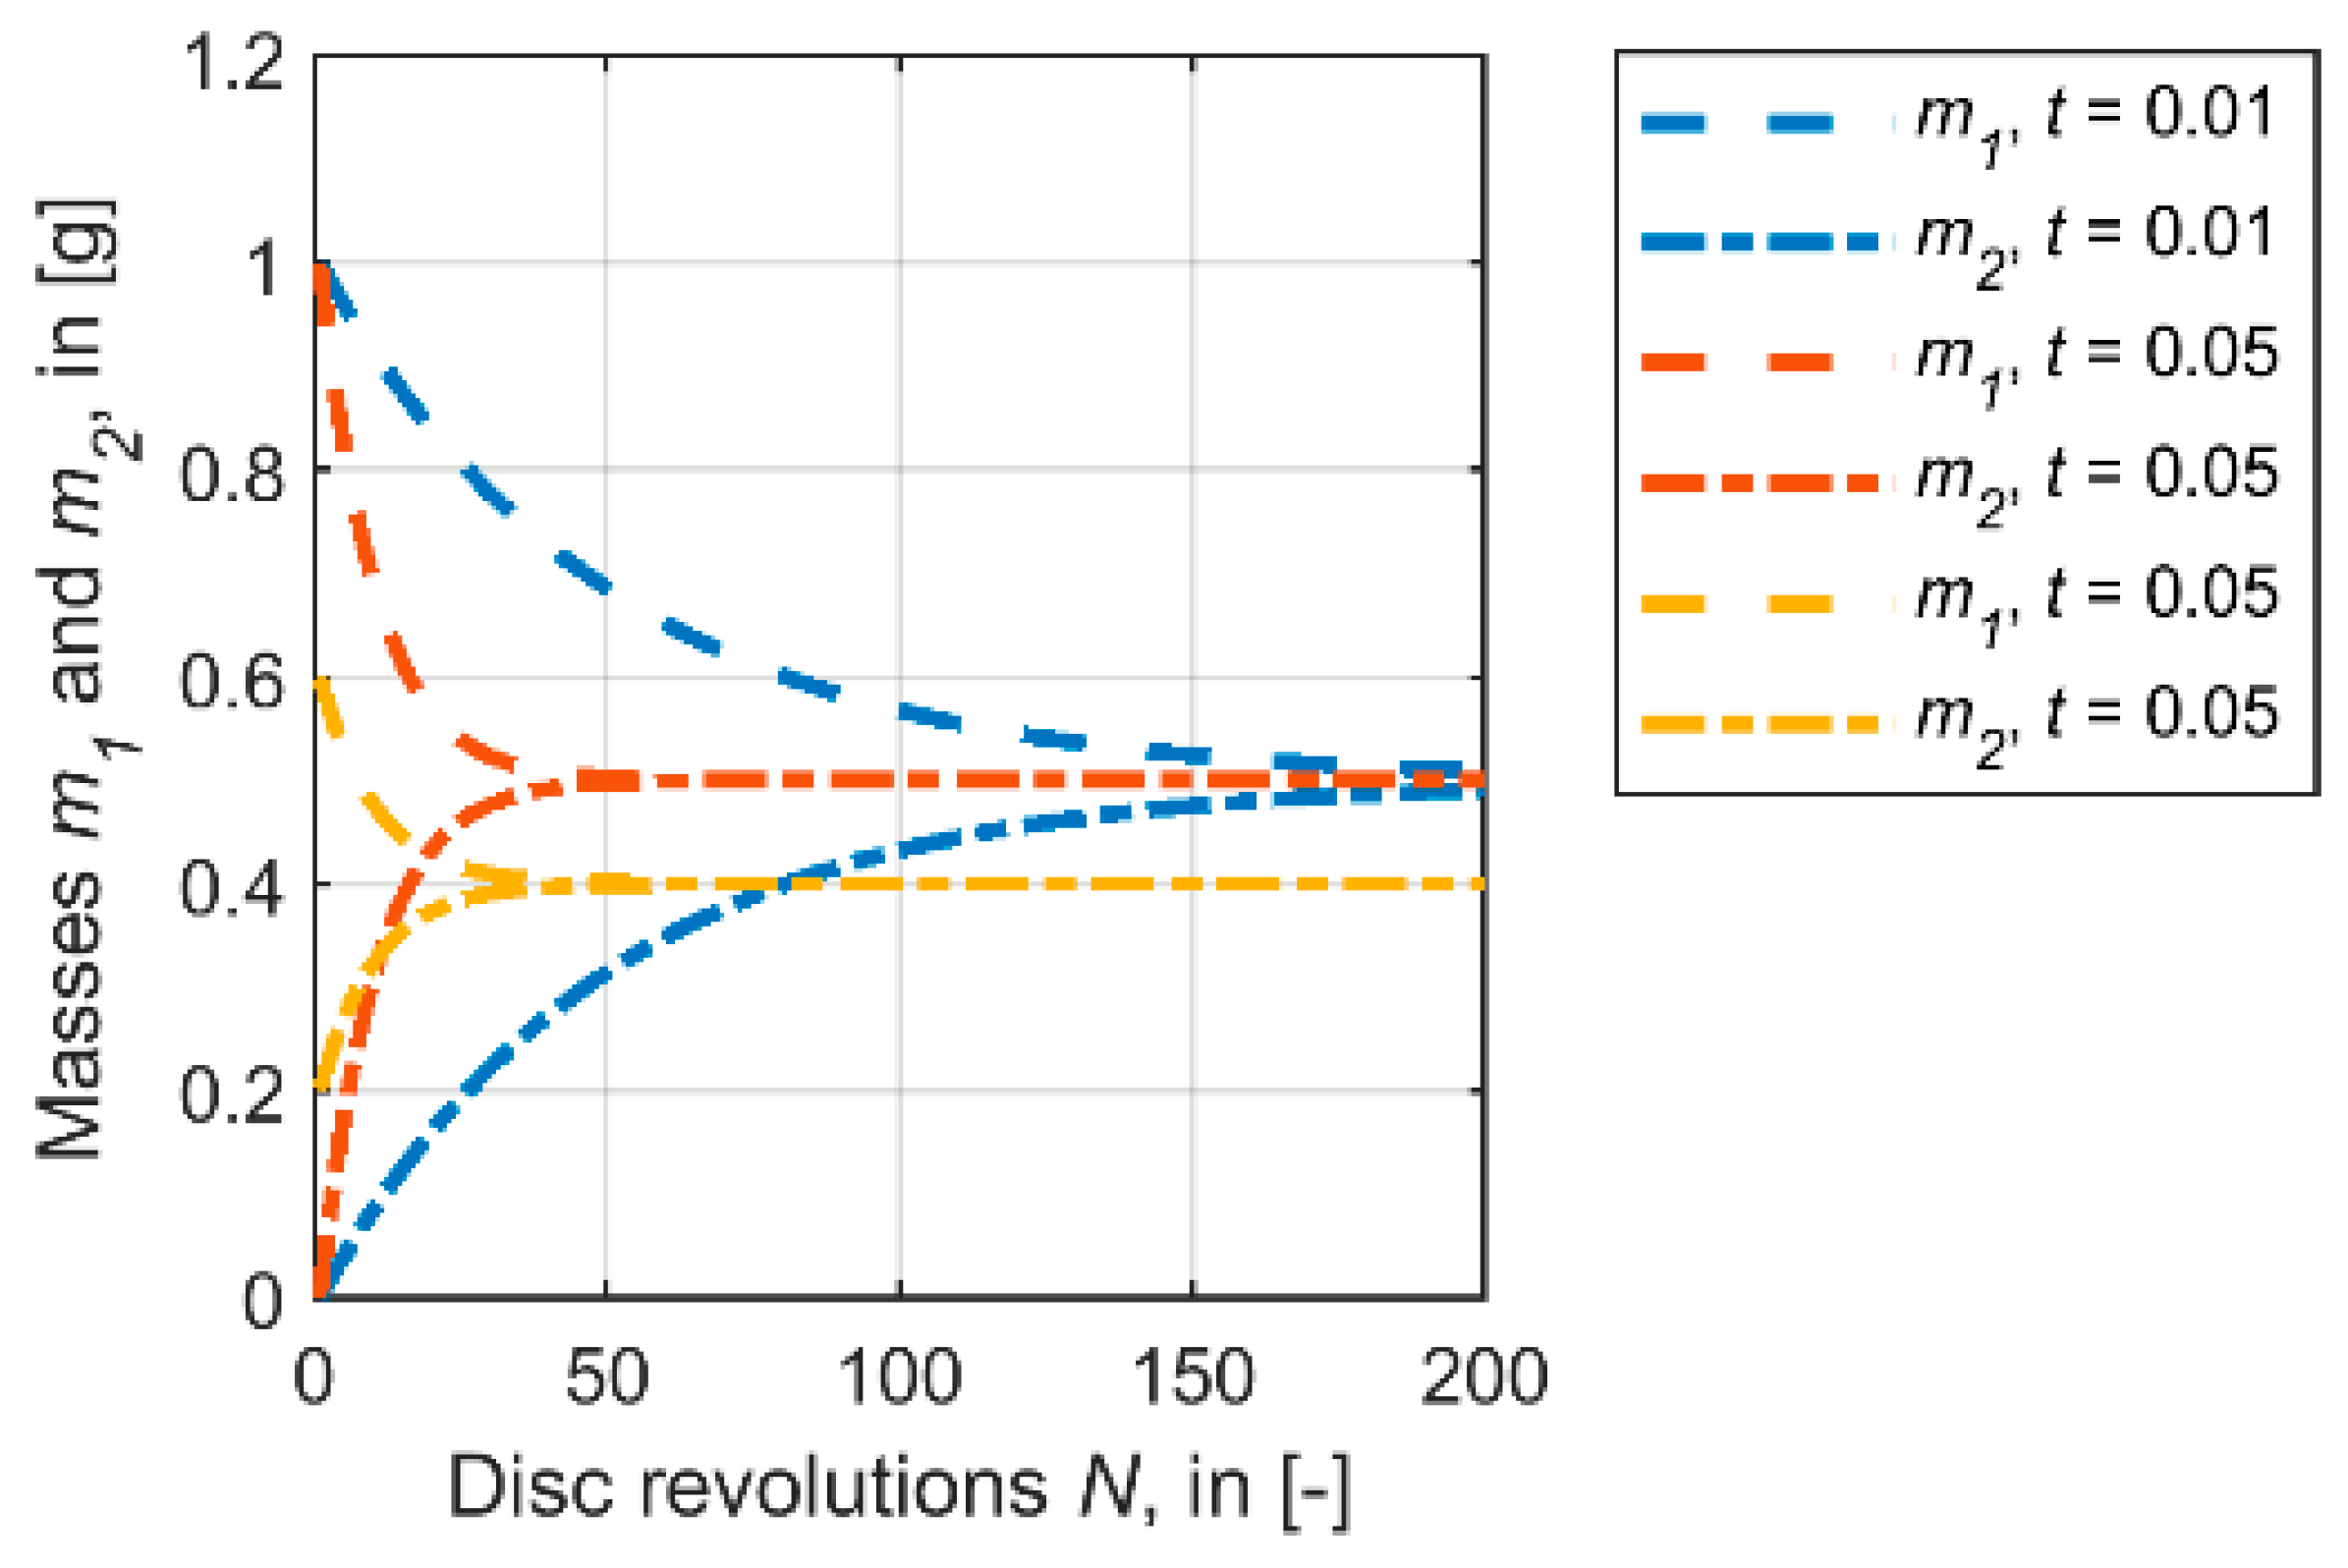
When the surfaces of the wheel and rail separate at the trailing edge of the contact, some product will stick to the wheel while the rest remains on the rail. The (re-)distribution of product between the wheel and rail surfaces is important for the product carry-on because only the product on the wheel surface is carried further along the rail and re-enters the contact patch again after one revolution of the wheel.
It is assumed that during one contact event, only a fraction of the product on the side with more product is transferred to the counter surface. If there is repeated contact, it is expected that the amount of product distributes equally after a number of contact cycles regardless of the initial amounts applied to the surfaces. The product transfer between the surfaces is described by the transfer function
t in the model that defines the amount of product
dm1 that is transferred to the counter surface:
Figure 8 illustrates the evolution of product masses
m1 and
m2 on two surfaces for different constant values of the transfer function
t without product consumption in a twin disc set-up. After a certain number of disc revolutions
N, the product amount on both surfaces is equal.
The transfer function
t in the model depends on the mass
m and the number of wheel revolutions/contact cycles
N (see Equation (6)). This function has been shown to fit experimental data from pick-up experiments on a full-scale wheel–rail rig (see
Section 3).
cm and
cN are constants that are determined from experiments (see
Section 3). Parameter
kt is related to the product pick-up efficiency at the application site which depends on the details of the application system and the local contact conditions. This value is set to
kt = 0.5 by default.
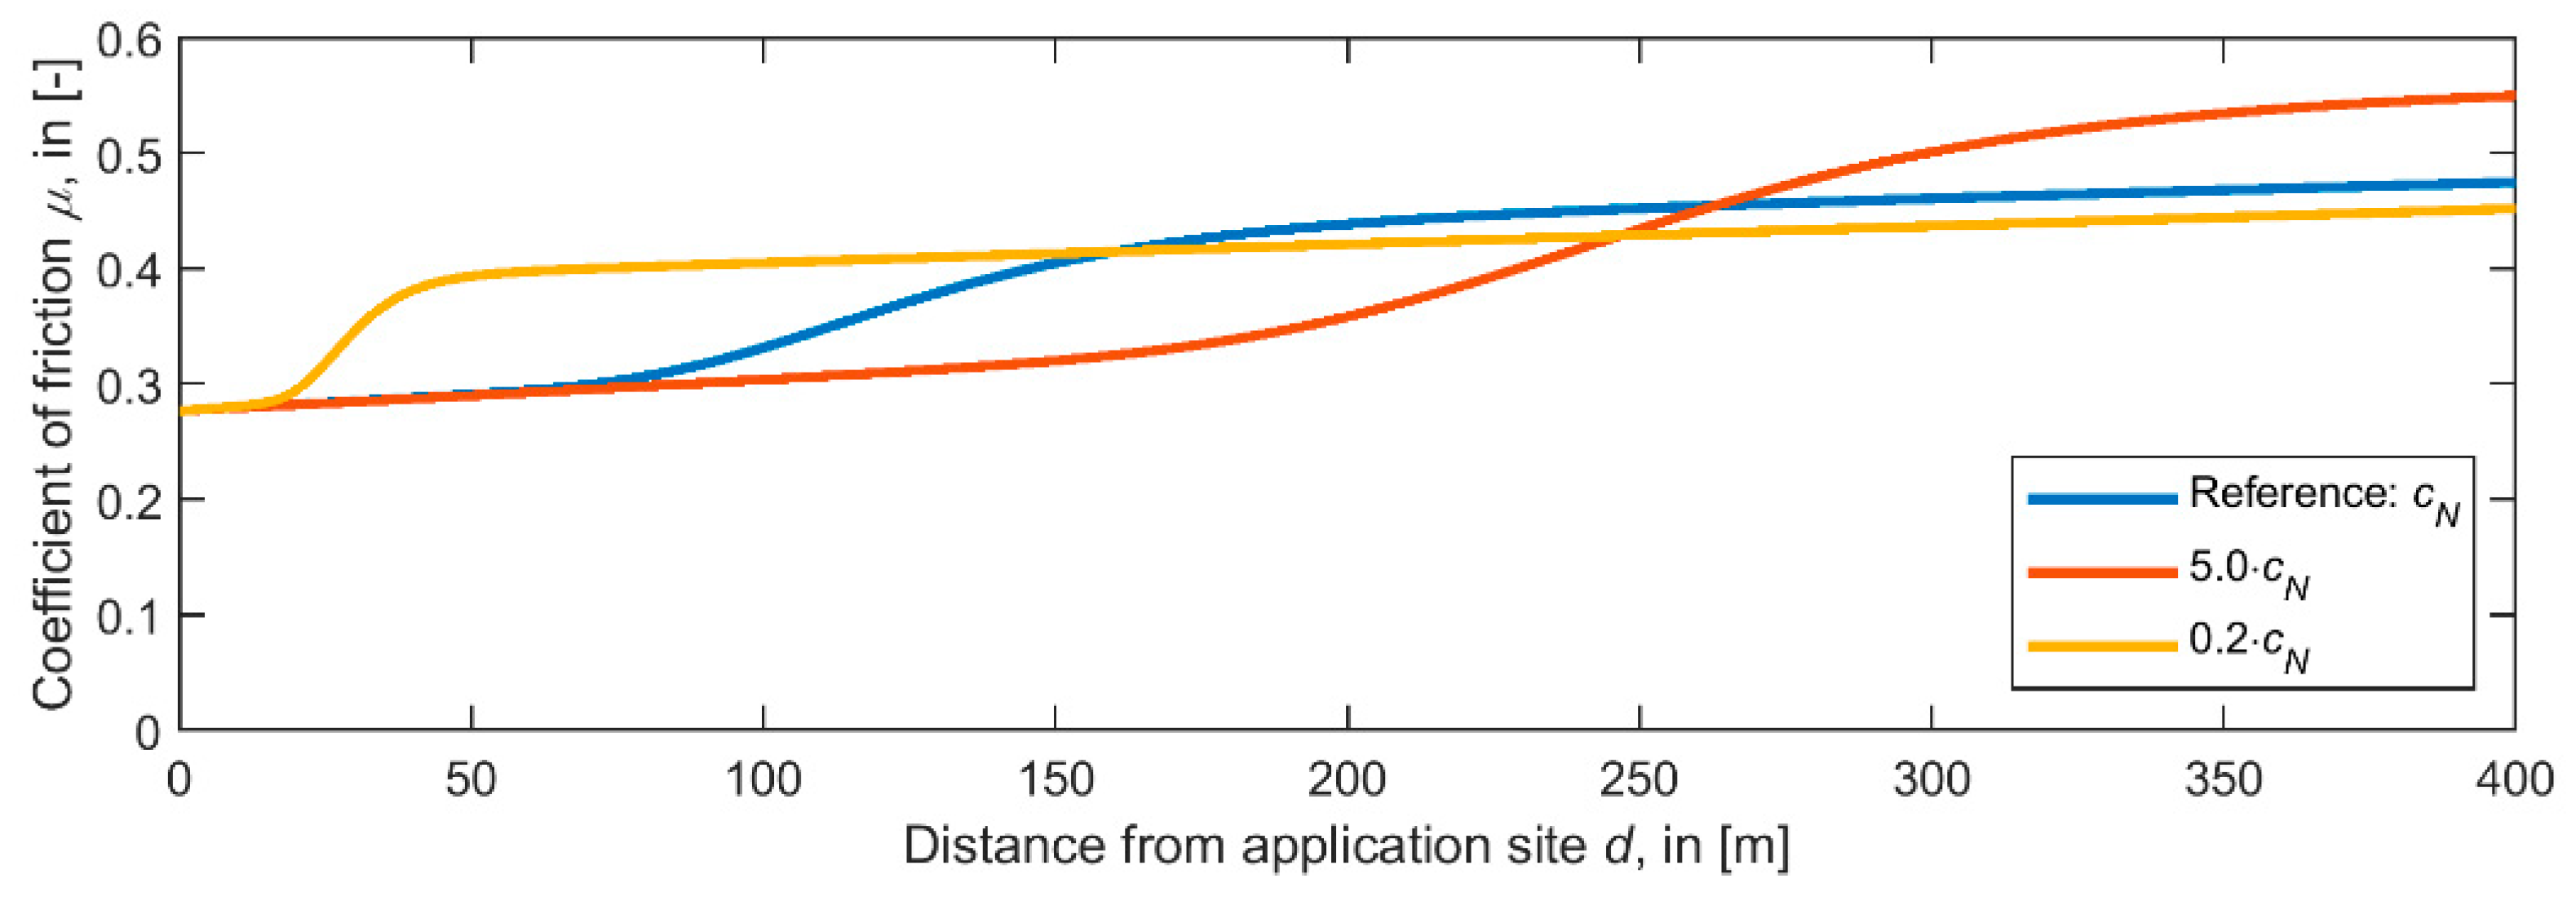
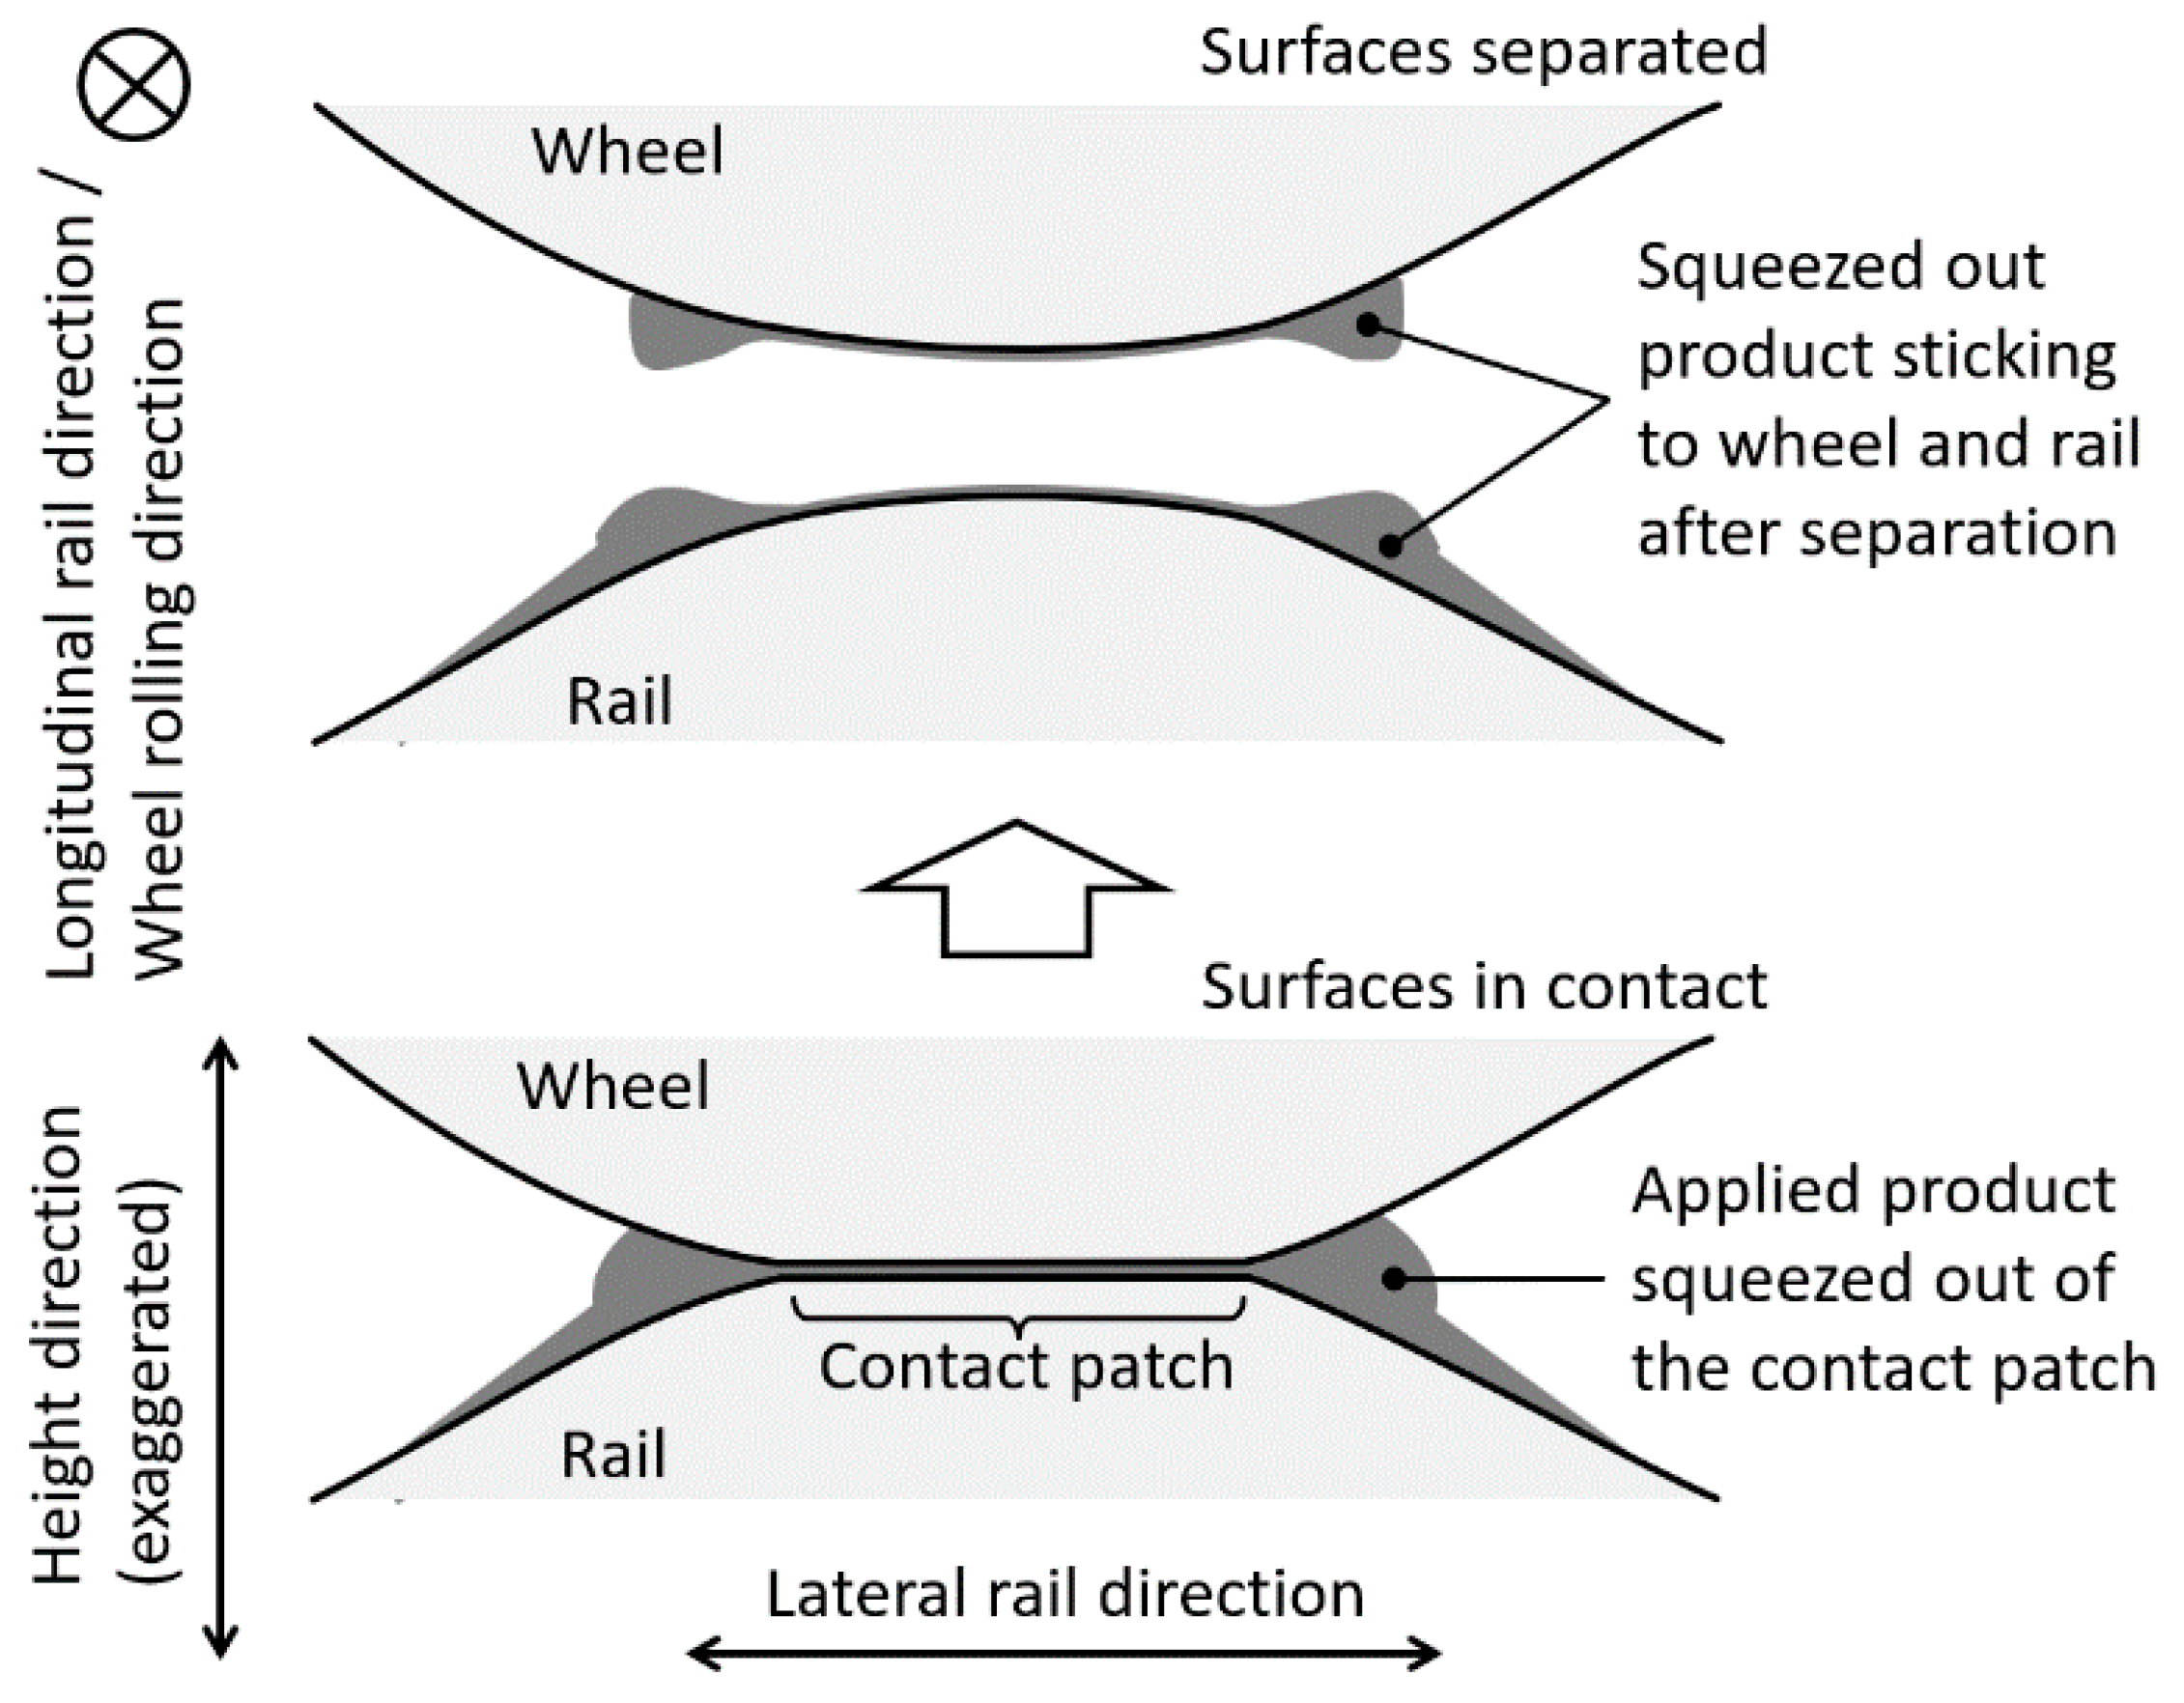
Transfer reduces with reducing mass m, which is attributed to the increasing difficulty of transferring (little) amounts of product to the counter-surface that is present in troughs and valleys of a rough surfaces. The term exp(−(N − 1)/cN) accounts for the combined effect of the decrease of product transfer in the contact patch due to the squeezing out of product and the change of transfer properties due to mixing of third body layer constituents on the surface. This term may also implicitly account for the reduction of transfer in the case of water-based, drying products when the product changes from a “wet” state to a “dry” state. The drying time for the transition from the liquid state after application to the solid state at some distance from the application at a typical vehicle speed may be approximated by the number of wheel revolutions.
The squeezing out of product to the side of the contact area is illustrated in
Figure 9. The product sticks to the surface beside the contact area on the wheel and rail after separation. However, some product transfer is expected to take place across the narrow gap near the contact patch edge in subsequent contact events even if contact width and the lateral contact positions on the wheel and rail do not change. At the application site, it is assumed that consecutive wheels can pick up remaining product on the rail surface due to slightly different lateral contact positions.
3. Experimental Results and Model Parameterization
The consumption part of the simulation model has been parameterized based on experimental results from two test rigs at the University of Sheffield: A twin disc rig (TDR), and a full-scale wheel–rail rig (FSR). A brief description of both rigs can be found in [
32].
At the TDR, two discs 47 mm in diameter and 10 mm in width were brought into rolling contact with constant longitudinal creepage
cx at a rotational speed of 400 rpm. During the experiment, the evolution of the torque on the driving shaft of the machine was continuously recorded from which the coefficient of adhesion
T/N was calculated as a function of the number of disc revolutions
N. The experiments start with 1000 disc revolutions in dry conditions, followed by five product applications at intervals of 3000 revolutions using a syringe.
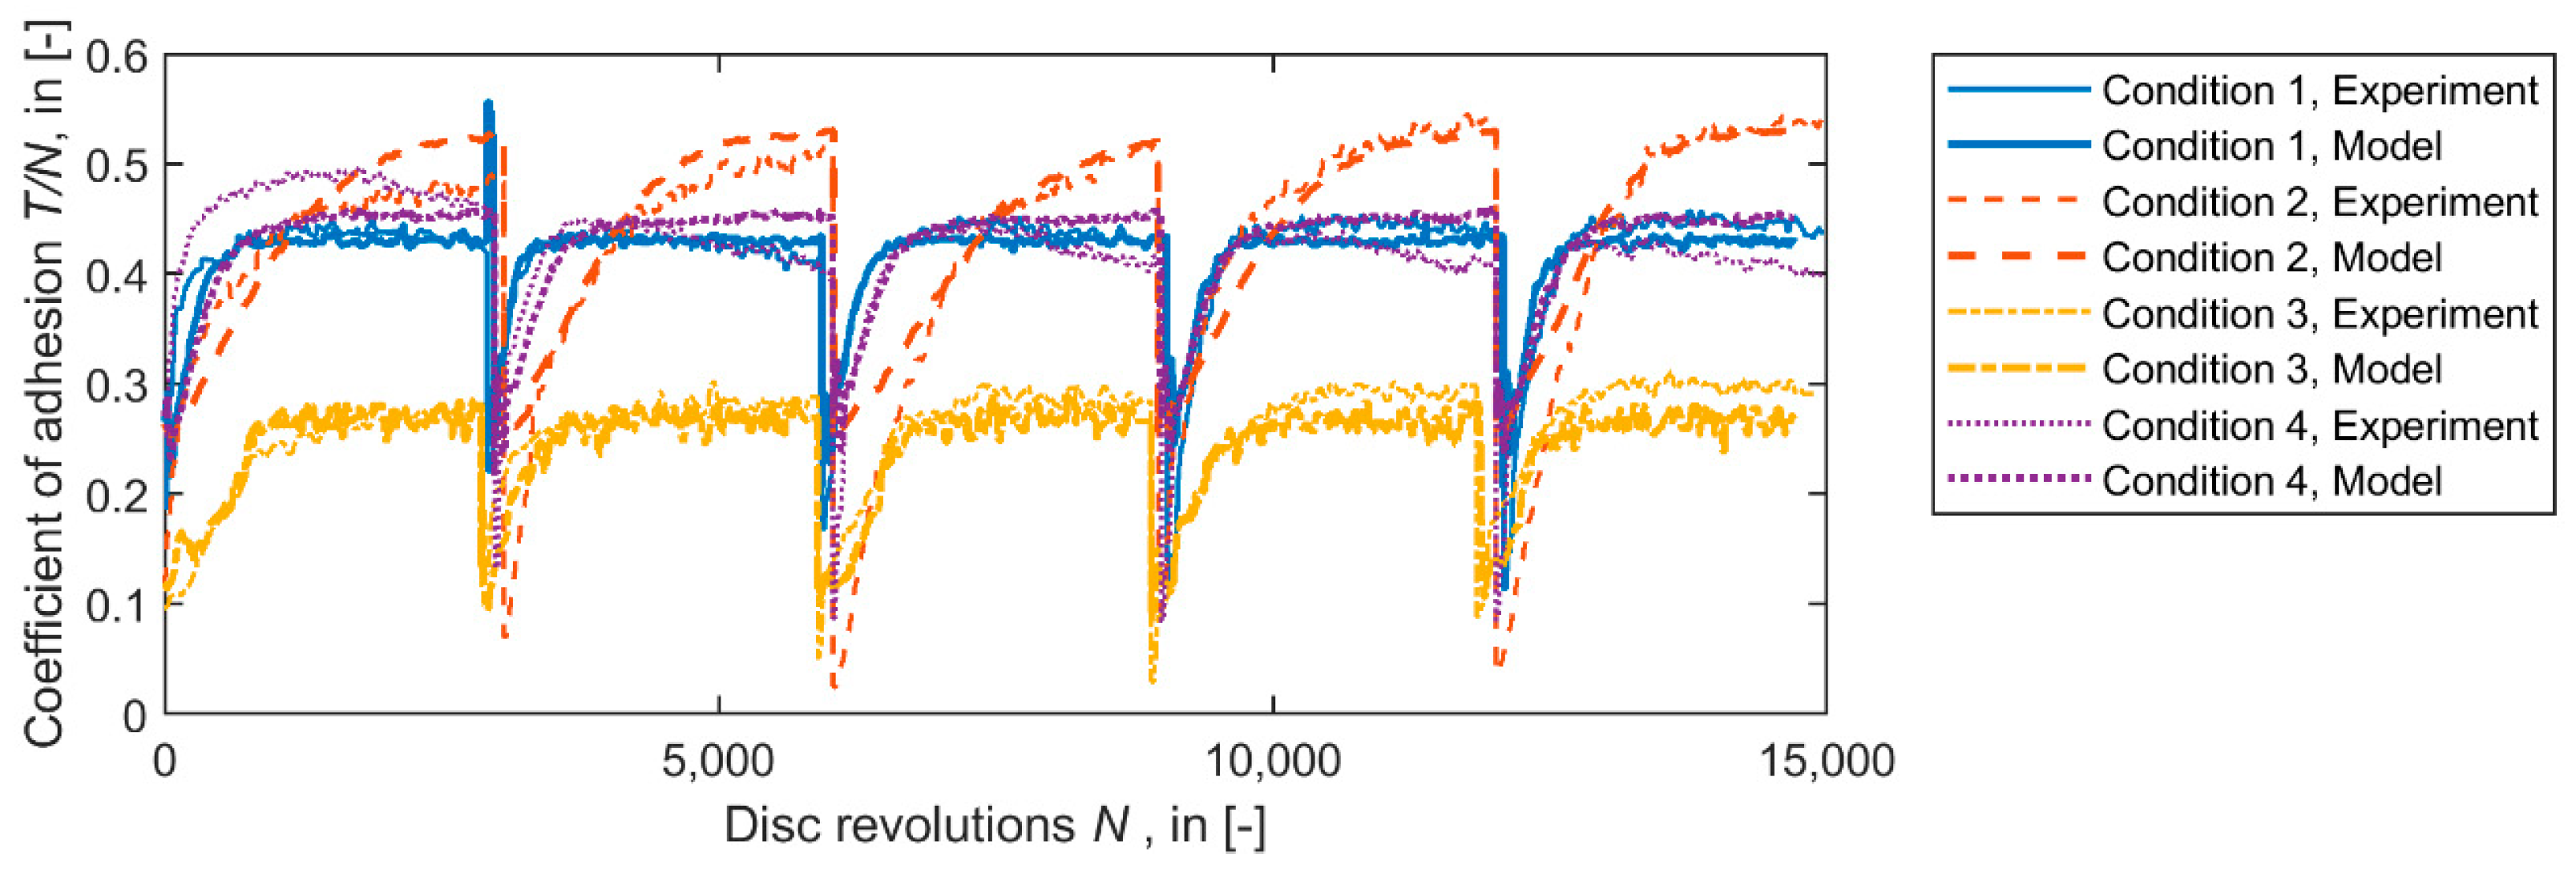
Table 1 states the experimental conditions that were used for the model parameterization of a water-based TOR friction modifier. Experiments were carried out at room temperature.
Figure 10 shows the experimental data and the corresponding model results after the parameterization process for the four conditions given in
Table 1. The initial 1000 revolutions in dry conditions are not shown in the figure. Each product applications caused a rapid drop of the adhesion value, followed by adhesion recovery. The shape and rate of the adhesion recovery provides the information that is necessary for the model parameterization.
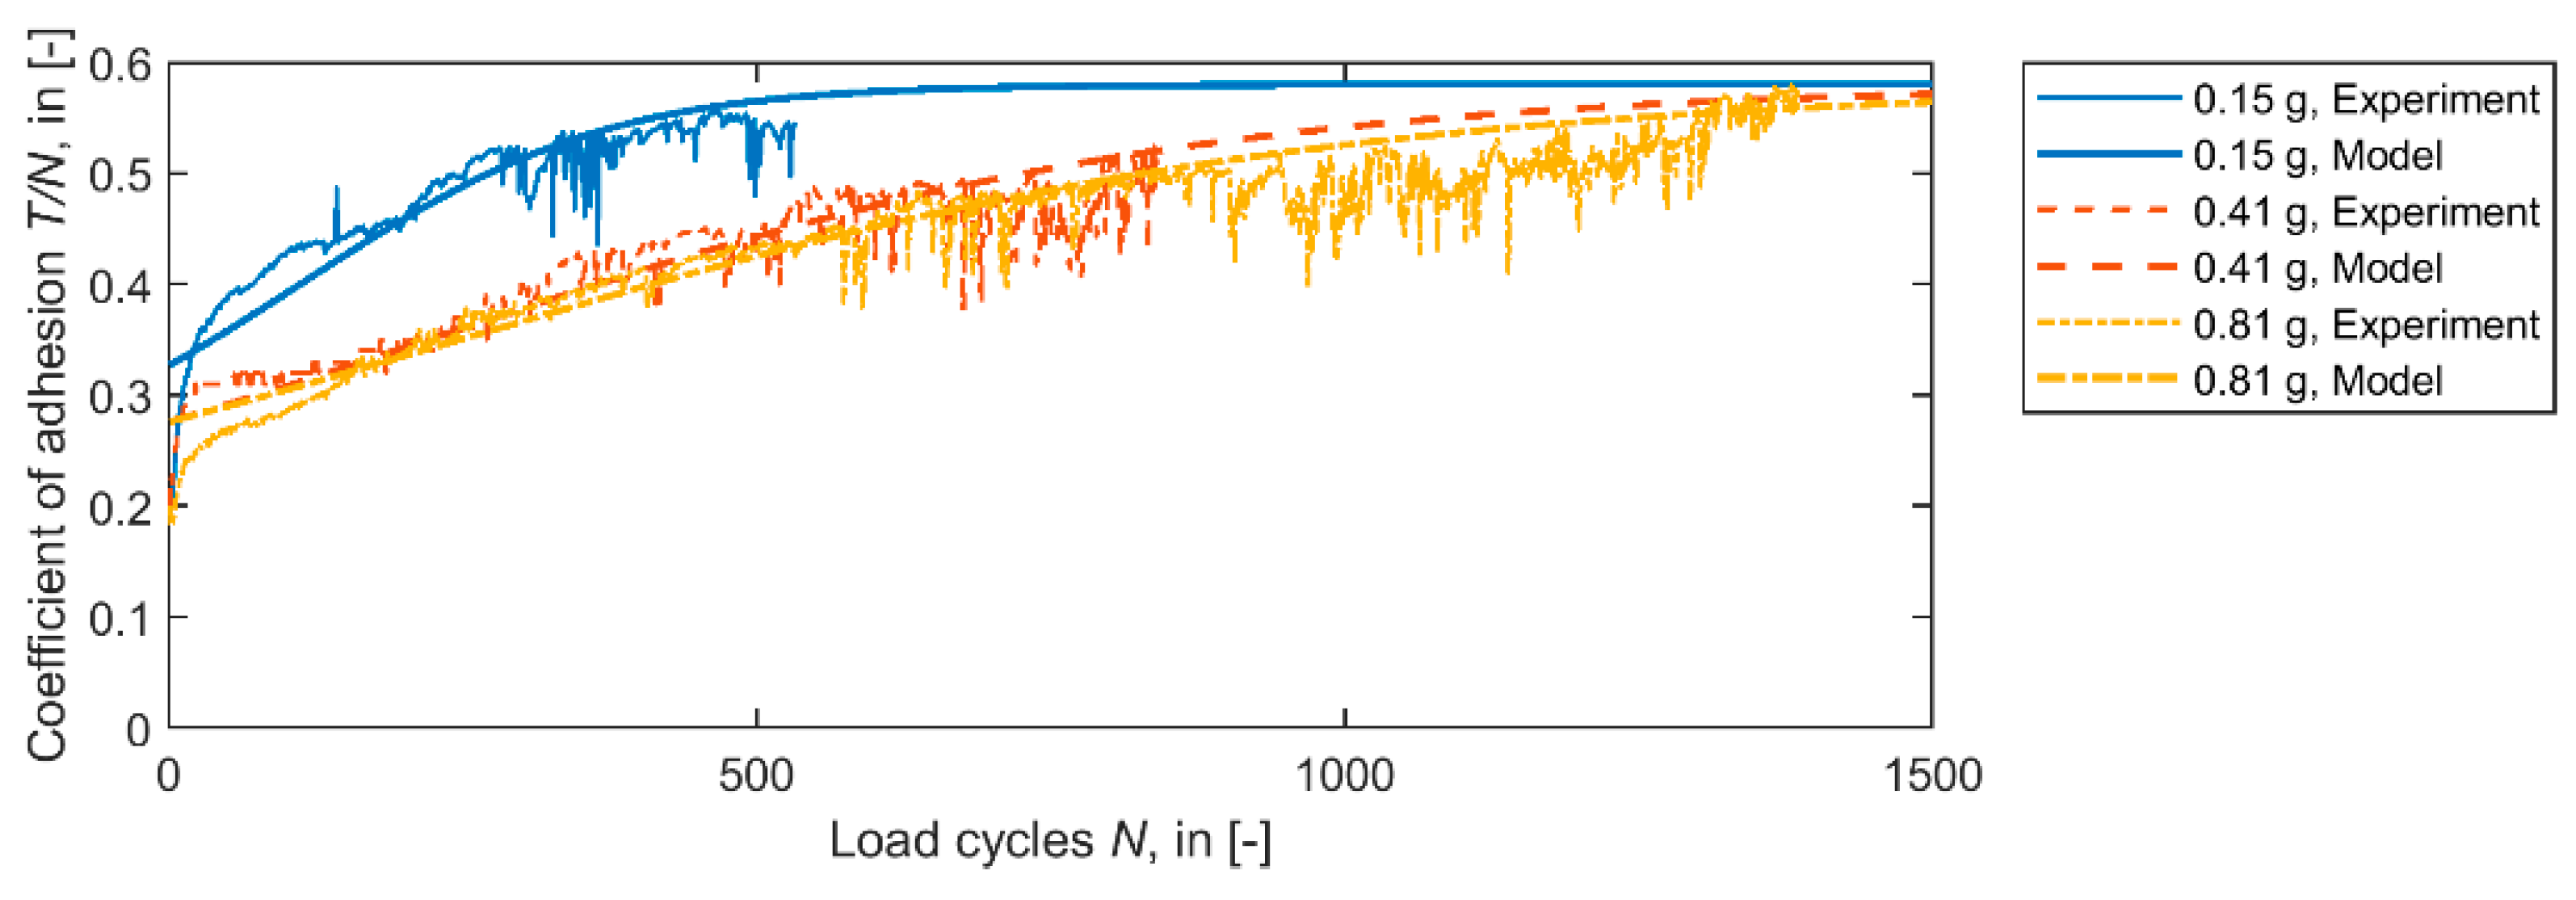
Three experiments were carried out at the full-scale wheel–rail test rig where a railway wheel rolled repeatedly over a piece of rail. The experiments for the model parameterization were run at 80 kN normal force and 5% longitudinal creepage at room temperature. Different amounts of product were applied to the rail before the first rolling cycle.
Figure 11 shows the evolution of the coefficient of adhesion with the number of load cycles. Increasing the amount of product applied decreased the friction level and increased the number of cycles with the reduced friction. However, when a threshold amount of the applied product mass was exceeded, the friction level did not decrease further, which helps to prevent low coefficients of friction when the product is overapplied.
A similar behaviour was observed in high pressure torsion experiments [
33] in which the frictional behaviour of a water-based friction modifier was tested in quasi-static annular steel–steel contact set-up at realistic wheel–rail normal contact pressures. Increasing the amount of dried friction modifier per area reduced the coefficient of friction to a minimum limiting value of 0.1. Partially dried and wet friction modifiers reduced the coefficient of friction to about 0.05 in the case of overapplication. These results help to interpret the steep increase of the coefficient of adhesion at the start of the full-scale wheel–rail rig experiments, as depicted in
Figure 11. It is attributed to a quick reduction of the product amount in the contact area and to the drying of the product during the initial cycles.
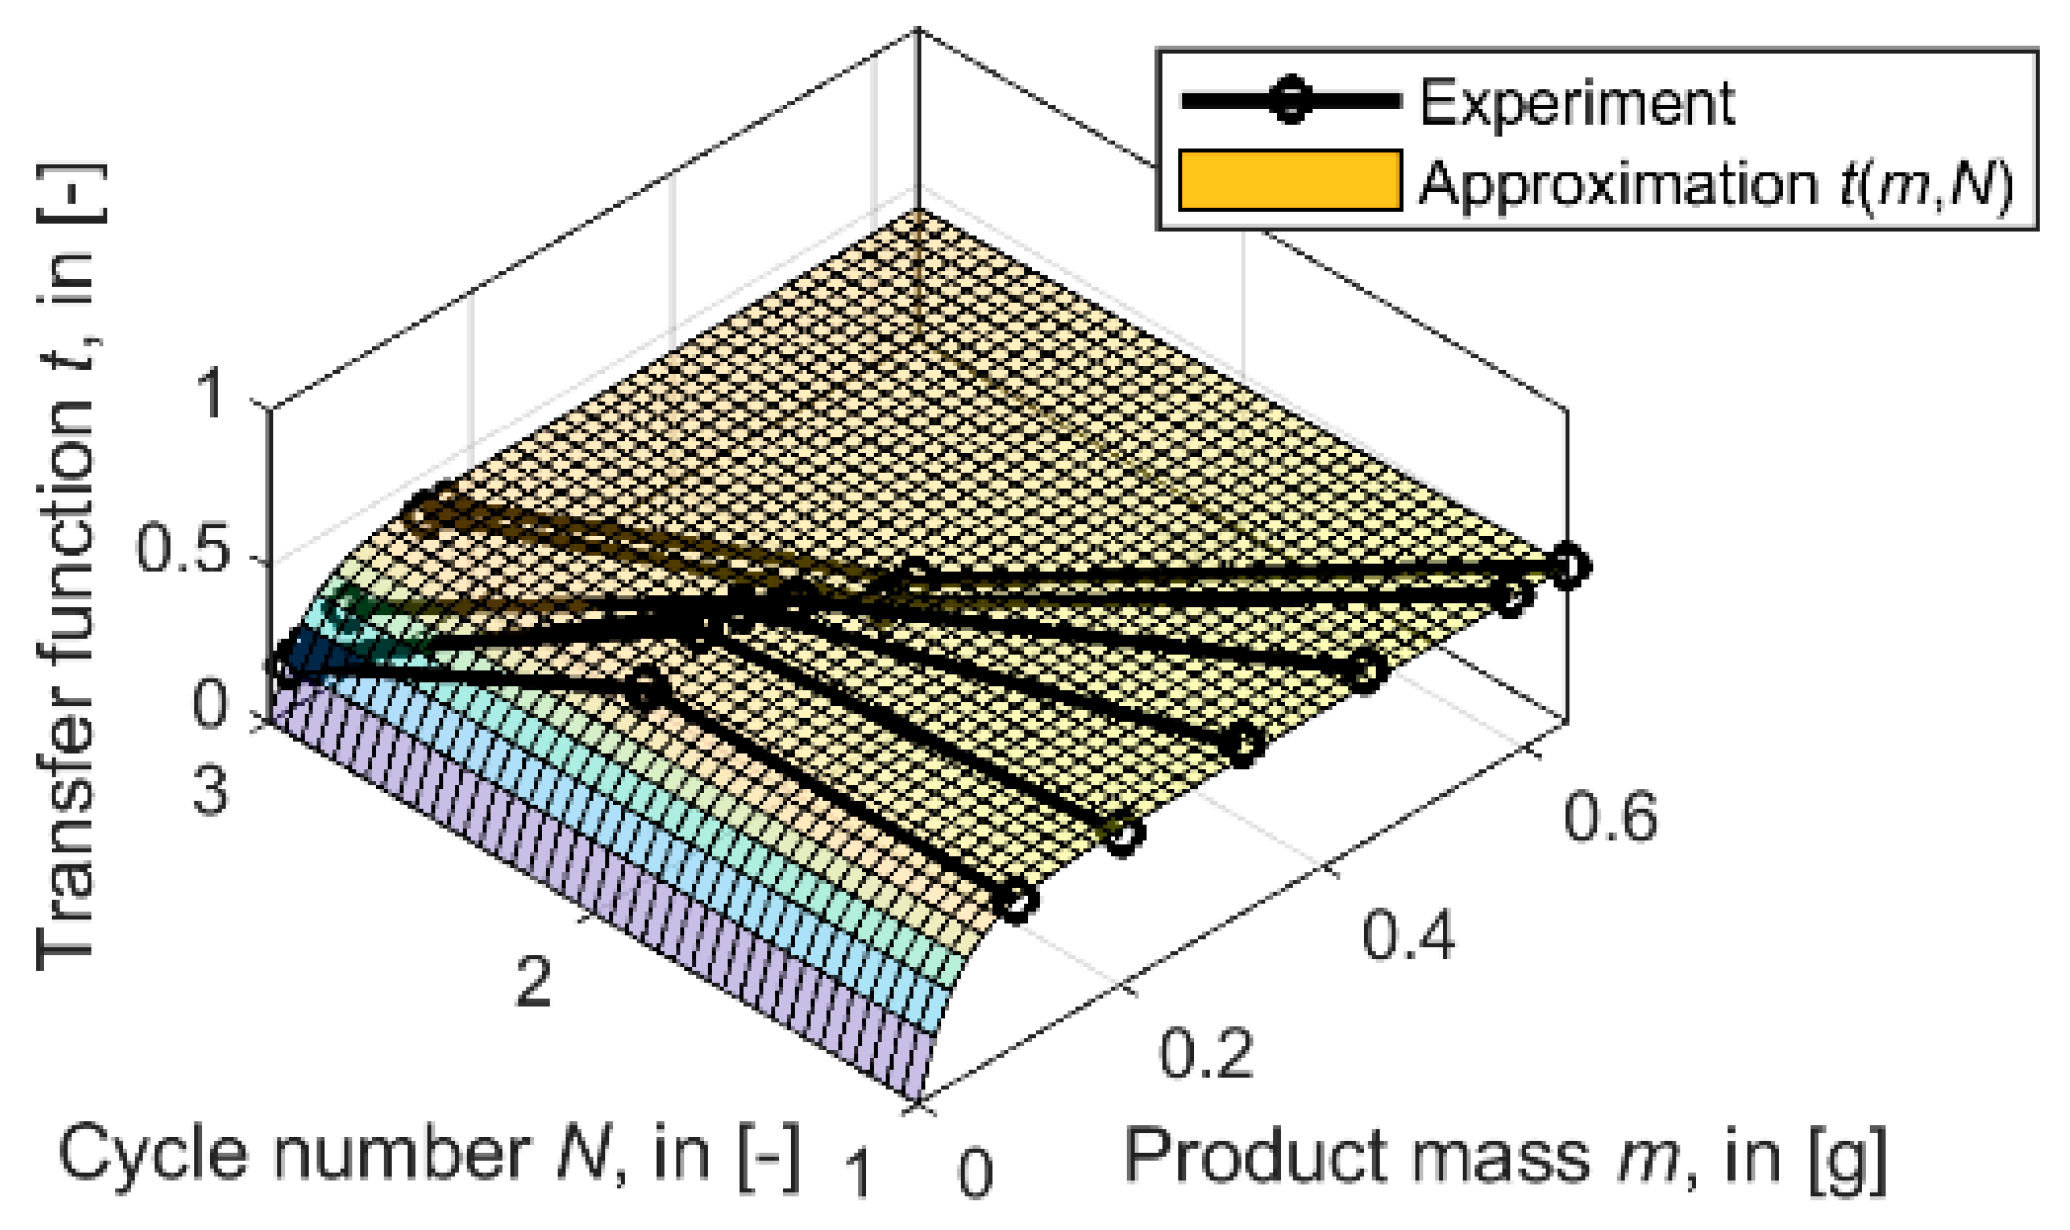
The transfer function t was parameterized based on experimental data from “pick-up” experiments at the FSR. In these experiments, pre-defined amounts of product were applied in the contact area on the rail head surface. Then, the wheel had been rolled over the application site to ensure that the product was distributed on the rail and wheel surfaces. After one rolling cycle, the product on the wheel surface was removed by thorough cleaning of the surface with a cloth. The amount of product was determined by weighing the cloth before and after cleaning the surface. This procedure was repeated three times. After the third rolling cycle, the amount of product on the rail surface was also determined. From the series of mass measurements, the transfer function t could be calculated for the first three rolling cycles.
Figure 12 shows the transfer function
t for the investigated product. Each datapoint is the average of three experiments. The surface shown in
Figure 12 is a fit of the experimental data by Equation (6) with the method of least squares. The parameters are given in
Table 2. For this product, it was observed that some of the product fell on the contact area when the contact patch left the application area. Product was picked-up again by the wheel in following cycles at the same lateral position. This behaviour is related to the viscosity and tackiness of the product.
To fit the model to the experimental results from both test rigs (see
Figure 10 and
Figure 11) with one set of model parameters, it was necessary to increase the product mass in the simulations of the TDR experiments by a factor of 5. This is believed to result from the different contact sizes, contact area shapes (line contact at the TDR, point contact at the FSR), and pressure distributions at the two rigs. Differences in the surface roughness, in the product spreading behaviour in the rolling direction, and in the lateral squeezing out of the product may have also contributed to the observed behaviour. The mean normal pressure and the longitudinal creepage are well controlled for on both test rigs and have been considered in the parameterization process. The parameters that fit the experimental data best are given in
Table 2. The maximum amount of product in the calculation is limited to 0.20 g.
5. Conclusions and Outlook
This paper presents a model for predicting the evolution of the coefficient of friction in railway operations for top-of-rail products. How the product spreads along the rail surface and how it modifies the coefficient of friction is the combined effect of: (1) the pick-up of product by the wheel at the application site; (2) the product transfer behaviour between the wheel and rail surfaces as the wheel travels along the rail; and (3) the product consumption behaviour. The relative influence of these mechanisms and of the associated parameters have been studied in detail for a water-based TOR friction modifier for which the model has been parameterized for. Results show that all three mechanisms (pick-up, transfer, and consumption) may limit the achievable carry-on distance and thus the distance where intermediate values of the coefficient of friction can be achieved. Simulations emphasize that a better understanding and a better quantification of the transfer behaviour involving little product at large cycle numbers are important to improve carry-on distance predictions.
Twin-disc test rig experiments and full-scale wheel–rail test rig experiments have been used to investigate the evolution of the coefficient of friction with the number of disc revolutions/wheel passes and the transfer behaviour of the product between contacting surfaces. These data have been used to parameterize the model.
To improve the predictions of the coefficient of friction, future work is planned to account for the changing lateral positions on the surfaces of the wheel and rail. Due to changing lateral contact positions on the wheel and rail surfaces, product adhering to the wheel may be stored on the surface because no contact takes place on this lateral position for a certain number of revolutions. However, this wheel surface part may come into contact with the rail again far from the application site (depending on the track layout, rail profiles, etc.) and influence the coefficient of friction there. This model extension is important to simulate complex track layouts that involve sequences of straight track sections, transition zones, and curves.
Considering that the wheel–rail contact in railway operations is an open tribological system, there are many parameters that influence the evolution of the coefficient of friction along the track. While it is unlikely that environmental parameters, such as air temperature and humidity, solar radiation, and precipitation, are known locally along the track in railway operations for the prediction of the frictional condition, it is certainly worthwhile to carry out investigations to estimate the influence of these parameters systematically.
Nevertheless, the model presented here is believed to provide valuable insight into the effect and interactions of the mechanisms that govern the evolution of the coefficient of friction when TOR products are applied to the wheel–rail interface. In addition, the model is believed to help train operators and infrastructure maintainers to investigate the effect of TOR products under different operating conditions.


