Article

Influence of Solid Lubricants on the Tribological Performance of Photocurable Resins for Vat Photopolymerization

1
Faculty of Polymer Technology, Ozare 19, 2380 Slovenj Gradec, Slovenia
2
Polymer Competence Center Leoben GmbH, Roseggerstraße 12, 8700 Leoben, Austria
*
Author to whom correspondence should be addressed.
Lubricants 2020, 8(12), 104; https://doi.org/10.3390/lubricants8120104
Submission received: 3 November 2020 / Revised: 30 November 2020 / Accepted: 3 December 2020 / Published: 4 December 2020

Abstract

:
New developments in additive manufacturing (AM) are enabling the use of 3D printed parts in increasingly demanding applications, such as in mechanical power transmission systems, where excellent build quality and tribological performance are required. The tribological properties of thermoplastic-based AM technologies are well knowninject, whereas the performance of photopolymer-based AM technologies is very rarely explored. This study aims to provide new insight into the tribological performance of 3D printed parts produced using vat photopolymerization (VPP). Photocurable resins based on aliphatic urethane acrylate oligomers were modified with different solid lubricants (polytetrafluoroethylene (PTFE), graphite and molybdenum disulfide (MoS2)) and 3D printed using Digital Light Processing (DLP). The mechanical and thermal properties were studied using the tensile tests, Charpy impact tests, Shore D, and dynamic mechanical analysis (DMA). The tribological performance was studied using a Pin-on-Disk tribometer. Among the lubricants, PTFE had the highest impact on the coefficient of friction (µ) and the specific wear rate (ws). The hybrid lubricant system (PTFE/MoS2) resulted in excellent tribological performance, where the µ was reduced by up to 52% and ws by up to 92%.

1. Introduction

In many mechanical devices, power needs to be transmitted, preferably as efficiently as possible, often over a wide range of conditions [1]. Furthermore, the wear behavior of these power transmission systems has great importance since the device must operate for a certain amount of time, without significant deterioration of performance [2]. The performance of the power transmission system is dependent not only on design but also on the accuracy and surface finish of the individual components, and the mechanical, thermal, and tribological properties of the materials [3,4,5,6]. The accuracy of a tribological component (e.g., gear) is an essential factor that influences not only the precision of the system but also the amount of load the system can withstand and its reliability. The gear trade relies on different standards, such as Deutsches Institut für Normung (DIN) 3963 and American Gear Manufacturers Association (AGMA) 2000-A88. Both standards classify gears in different quality levels that can be placed into six major levels of accuracy [3,7]. Another important factor to consider is also the material combination, which strongly depends on the application and operating boundary conditions. Polymers are a very attractive group of the materials for tribological systems, where they are often used in pairs with harder materials (metals and ceramics). Such systems provide a low coefficient of friction (from 0.05–0.6) in unlubricated low-load applications [8]. While low and medium accuracy polymeric gears can be produced with injection molding (IM), which offers very high productivity, gears of higher accuracy levels must be produced using less productive subtractive techniques [9].
Additive manufacturing (AM) is a technology that has recently experienced enormous growth and promises to change the way things are manufactured [10,11,12]. In contrast to conventional subtractive and formative manufacturing methodologies, where parts are produced by the selective removal of material or by the application of pressure to a body of raw material, AM works by joining materials to make parts from 3D model data, usually in layer upon layer fashion [13]. This enables AM to produce parts with almost no limitations in their geometry, zero material waste, and with almost no need for planning of manufacturing process [10,12]. AM has been shown to be a promising methodology for the manufacturing of tribological components, where it enables fast and effortless production of complex parts such as gears [14,15,16]. Since AM practically removes geometrical complexity restrictions, it enables easy implementation of topology optimization to parts being produced [17]. For example, with AM, it is possible to manufacture topologically optimized tribological components that exhibit reduced noise, vibrations, and weight, while maintaining necessary structural stability [18]. Although AM offers many advantages to conventional processes for the production of tribological components, it also has its downsides, such as low levels of positioning and accuracy, a backlash of manufactured gearboxes, and weakness of building materials [15]. Another major drawback of implementing AM is a lack of knowledge on the tribological behavior of the produced parts. It has been shown that the tribological properties of AM produced parts can be drastically different from parts produced by conventional manufacturing technologies, such as IM [19,20].
To overcome these challenges, many efforts have been made to study and improve the tribological properties of AM parts. Most studies on the AM of polymers focused on technologies that use thermoplastic materials, such as Material Extrusion (ME) or Powder Bed Fusion (PBF), where tribological properties can be improved with the addition of different functional additives, such as hard inorganic fillers [21,22,23,24] and solid lubricants [25,26], or by optimizing the processing parameters [27,28].
Vat photopolymerization (VPP) is an AM process in which liquid photopolymer in a vat is selectively cured by light-activated photopolymerization [13]. Stereolithography (SLA) is a VPP technique that was introduced by Charles Hull in 1984 and is the first invented AM process [29]. Instead of building the parts by melting thermoplastic materials, such as ME or PBF, the VPP builds parts by polymerizing basic building blocks (monomers and oligomers) into a crosslinked macromolecular structure. The SLA solidifies the photopolymer by scanning the laser beam over the surface in a point-wise fashion. More recently, alternative VPP techniques that utilize the mask projection approach, where the large radiation beam is patterned by another device, such as a Digital Micromirror Device (DMD) or Liquid Crystal Display (LCD) [12]. Although VPP is the oldest AM technique, with its new developments that include super-fast AM by Continuous Liquid Interface Production (CLIP), rapid volumetric fabrication using holographic patterning of light fields [30], and multi-material 4D printing capability [31], it is certainly not outdated by any means.
The main advantage of VPP lies in its ability to produce features with a very high resolution and excellent surface finish [12]. The resolution of the classical one-photon VPP process is limited by the law of optical diffraction (d = 1.22 × λ × f/D). For a typical Digital Light Processing (DLP) setup using a wavelength (λ) of 400 nm, a focal length (f) of 400 nm, and a circular aperture diameter (D) of 30 mm, the resolution is 6.5 µm [15], while micro-SLA can offer resolutions down to 0.4 µm [32]. Two-photon VPP processes can achieve even higher resolutions (bellow 50 nm) [33]. Furthermore, the properties of the materials can be elegantly tailored to the specific application by changing the chemistry of the resin [34,35] or by adding functional additives [36,37,38].
Despite the seemingly high potential of VPP technologies for the production of tribological components, there is very little known about the tribological properties of manufactured parts. The first studies investigated the tribological behavior of injection molding blocks produced using SLA in contact with various thermoplastic materials for the purpose of optimizing adhesion during the injection molding [39]. Berger et al. manufactured different tribological components using SLA and studied the accuracy and precision of parts manufactured using SLA, Fused Filament Fabrication (FFF), and Fused Deposition Modelling (FDM) 3D printers [14,15]. It was found that parts produced using SLA 3D exhibited significantly lower processing uncertainty and higher accuracy that parts produced using FFF and FDM. Berger also tested gears produced using SLA, FDM, and Arburg Plastic Freeforming (APF) process and found that gear produced using SL did not show any wear, nor did it break, whereas gears produced using FDM and APF failed during the test [15]. Furthermore, we also reported good tribological performance of DLP 3D printed components in linear actuator for automatic doors [40].
Dunnigan et al. modified photocurable resins for SLA with waste polyester and polyamide 6 powder and evaluated the tribological performance of 3D printed parts. With the increasing concentration of polyester and polyamide powder in the photocurable resin, both µ and ws were significantly decreased [41].
A common strategy for improving the tribological performance of polymeric materials is to compound them with solid lubricants, such as polytetrafluoroethylene (PTFE), graphite and MoS2, to obtain the composites, which usually exhibit significantly decreased µ and ws, but at the cost of decreased mechanical performance [42,43,44,45,46]. While such strategies were successfully applied to different thermoplastic and thermoset materials, they were not yet applied for the modification of photocurable acrylates used for VPP AM.
This study aimed to develop photocurable resins with the improved tribological performance for the manufacturing of tribological components using VPP. Photocurable resins were modified with solid lubricants that are commonly used for improving the tribological performance of polymeric materials. In the first part of the study, the 3D printing behavior of modified resins was empirically studied to determine the boundary conditions for further tests. Then, photocurable resins containing different solid lubricants were prepared, 3D printed and evaluated for their performance in comparison to unmodified resins. It was hypothesized that the combination of solid lubricants might provide a synergetic effect in terms of improving tribological performance. Therefore, hybrid lubricant systems containing multiple lubricants were also evaluated.

2. Materials and Methods

2.1. Materials

High molecular weight aliphatic urethane acrylate oligomer (CN964A85) and isobornyl acrylate (SR506D) were kindly provided by Arkema Sartomer (Colombes, France). Photoinitiator (Irgacure 819) was a product of Glorious Chemical (Huaian, China). Light absorber (Sudan I) was a product of Acros Organics (Carlsbad, CA, USA). Polytetrafluoroethylene (PTFE) powder (Fluon 1710) was kindly provided by AGC Chemicals (Japan). The PTFE particle size D50 was 5.8 µm, and D90 was 16 µm. Synthetic graphite (Imery KS6) was kindly provided by Imerys Graphite & Carbon (Bironico, Switzerland). The graphite particle size D50 was 3.4 µm and D90 6.5 µm. MoS2 (Molysulfide Superfine) was kindly provided by Climax Molybdenum (Ann Arbor, MI, USA). MoS2 particle size D50 was 0.9–1.6 µm, and D90 was 7 µm.

2.2. Formulation of the Resins

This study aimed to prepare photocurable resins with good tribological properties while retaining good processability properties required for 3D printing. Incorporation of fillers into the resins, such as solid lubricants used in this study, significantly affects the processing by influencing the curing and flow behavior of the resin. When light passes beneath the surface of the resin, it is attenuated by absorption from dyes, pigments, and photoinitiators. Absorption depends on the concentration and extinction coefficients of absorbing species. Light is also attenuated by scattering from particles, which depends on the filler volume fraction, particle size, and refractive index difference between the filler and the liquid. In order for polymerization to occur, a sufficient quantity of the radicals must be present in the resin. Monomers and oligomers are stabilized with inhibitors that prevent premature polymerization. Furthermore, the oxygen present in the resin also has a significant effect on free-radical polymerization. The critical energy dose parameter (Ec) estimates the needed energy for triggering the polymerization. The critical dose energy model hypothesizes that polymerization is that Ec is given by the dose of UV photons that are not absorbed by the fillers and that produce enough free radicals to exhaust the population of inhibitors in the mixture, as well as to provide a surplus for triggering of polymerization [47]. Different models are available for estimating the viscosity of the suspensions. However, in general, if interactions between the particles are neglected, the viscosity of the suspension is related to the viscosity of the dispersing media, the volume fraction of the suspended particles, and particles shape [48]. During the 3D printing, the resin is usually allowed to settle in the equilibrium state, and this is a function of resins viscosity [49]. Furthermore, during the movement of the building platform in high-viscosity resin, the forces generated are much higher. Both factors significantly influence the building speed to the point that the material is not possible to process. Experimental design boundary conditions were empirically determined by preparing resins with different concentrations of fillers and tested in terms of curing and flow behavior. Curing behavior was studied by curing one layer of resins at different curing times and measuring the curing layer thickness (curing depth), whereas flow behavior was determined by testing the resins directly on a 3D printer. Graphite and MoS2 both strongly absorb the light at curing wavelength (around 400 nm), whereas PTFE is practically translucent at this wavelength. Hence, the limiting factor for the incorporation of graphite and MoS2 into resin was the attenuation of light, and, for PTFE, the limiting factor was resin viscosity. Concentration of graphite and MoS2 were set to yield around 60 µm of curing depth at 15 s of curing time. The concentration of the PTFE was set in a way that the increased viscosity of the resin did not drastically impair 3D printing behavior at ordinary speeds. To compensate, the light attenuation effect of the graphite and MoS2, 0.04% wt.% of Sudan I was added to the mixture to provide the same curing depth. Composition of the samples is presented in Table 1. The samples are abbreviated based on the used filler systems, where R, P, G and M stands for reference resin, PTFE-filled resin, graphite-filled resin and MoS2-filled resin, respectively. Hybrid filler systems are abbreviated using a combination of abbreviations of the used filler system (for example, a sample containing PTFE and graphite is abbreviated as PG).
It has to be noted that these compositions were found to be suitable for our particular experimental setup. When using fillers of different particle sizes or different curing systems, the boundary conditions may completely change, especially for the graphite and the MoS2.

2.3. Sample Preparation

Resins were prepared by mixing oligomer (CN964A85) and monomer (SR605D) in a weight ratio of 7:3, respectively. Photoinitiator (2 wt.%) and a suitable concentration of the fillers and/or dye was added to the mixture. The mixture was stirred at 50 °C until achieving the complete dissolution of the components. Test specimens (tensile test specimen according to ISO 527 5B standard, Pin-on-Disk (PoD) specimen (diameter 8 mm, height 20 mm) based on ASTM G99 standard, dynamic mechanical analysis (DMA) specimen dimensions of 2 × 5 × 20 mm and Charpy specimen dimensions of 4 × 10 × 44 mm) were prepared using the top-down DLP 3D printer manufactured by Doorson (Maribor, Slovenia). The 3D printer was equipped with a DLP projector (Acer H6510BD, Taipei, Taiwan) as a light device. The processing conditions for the preparation of the test specimens are summarized in Table 2. Samples were post-cured in a UV curing system (UVITRON Intelli-Ray 600, West Springfield, MA, USA) at 100% intensity for 900 s on each side.

2.4. Characterization

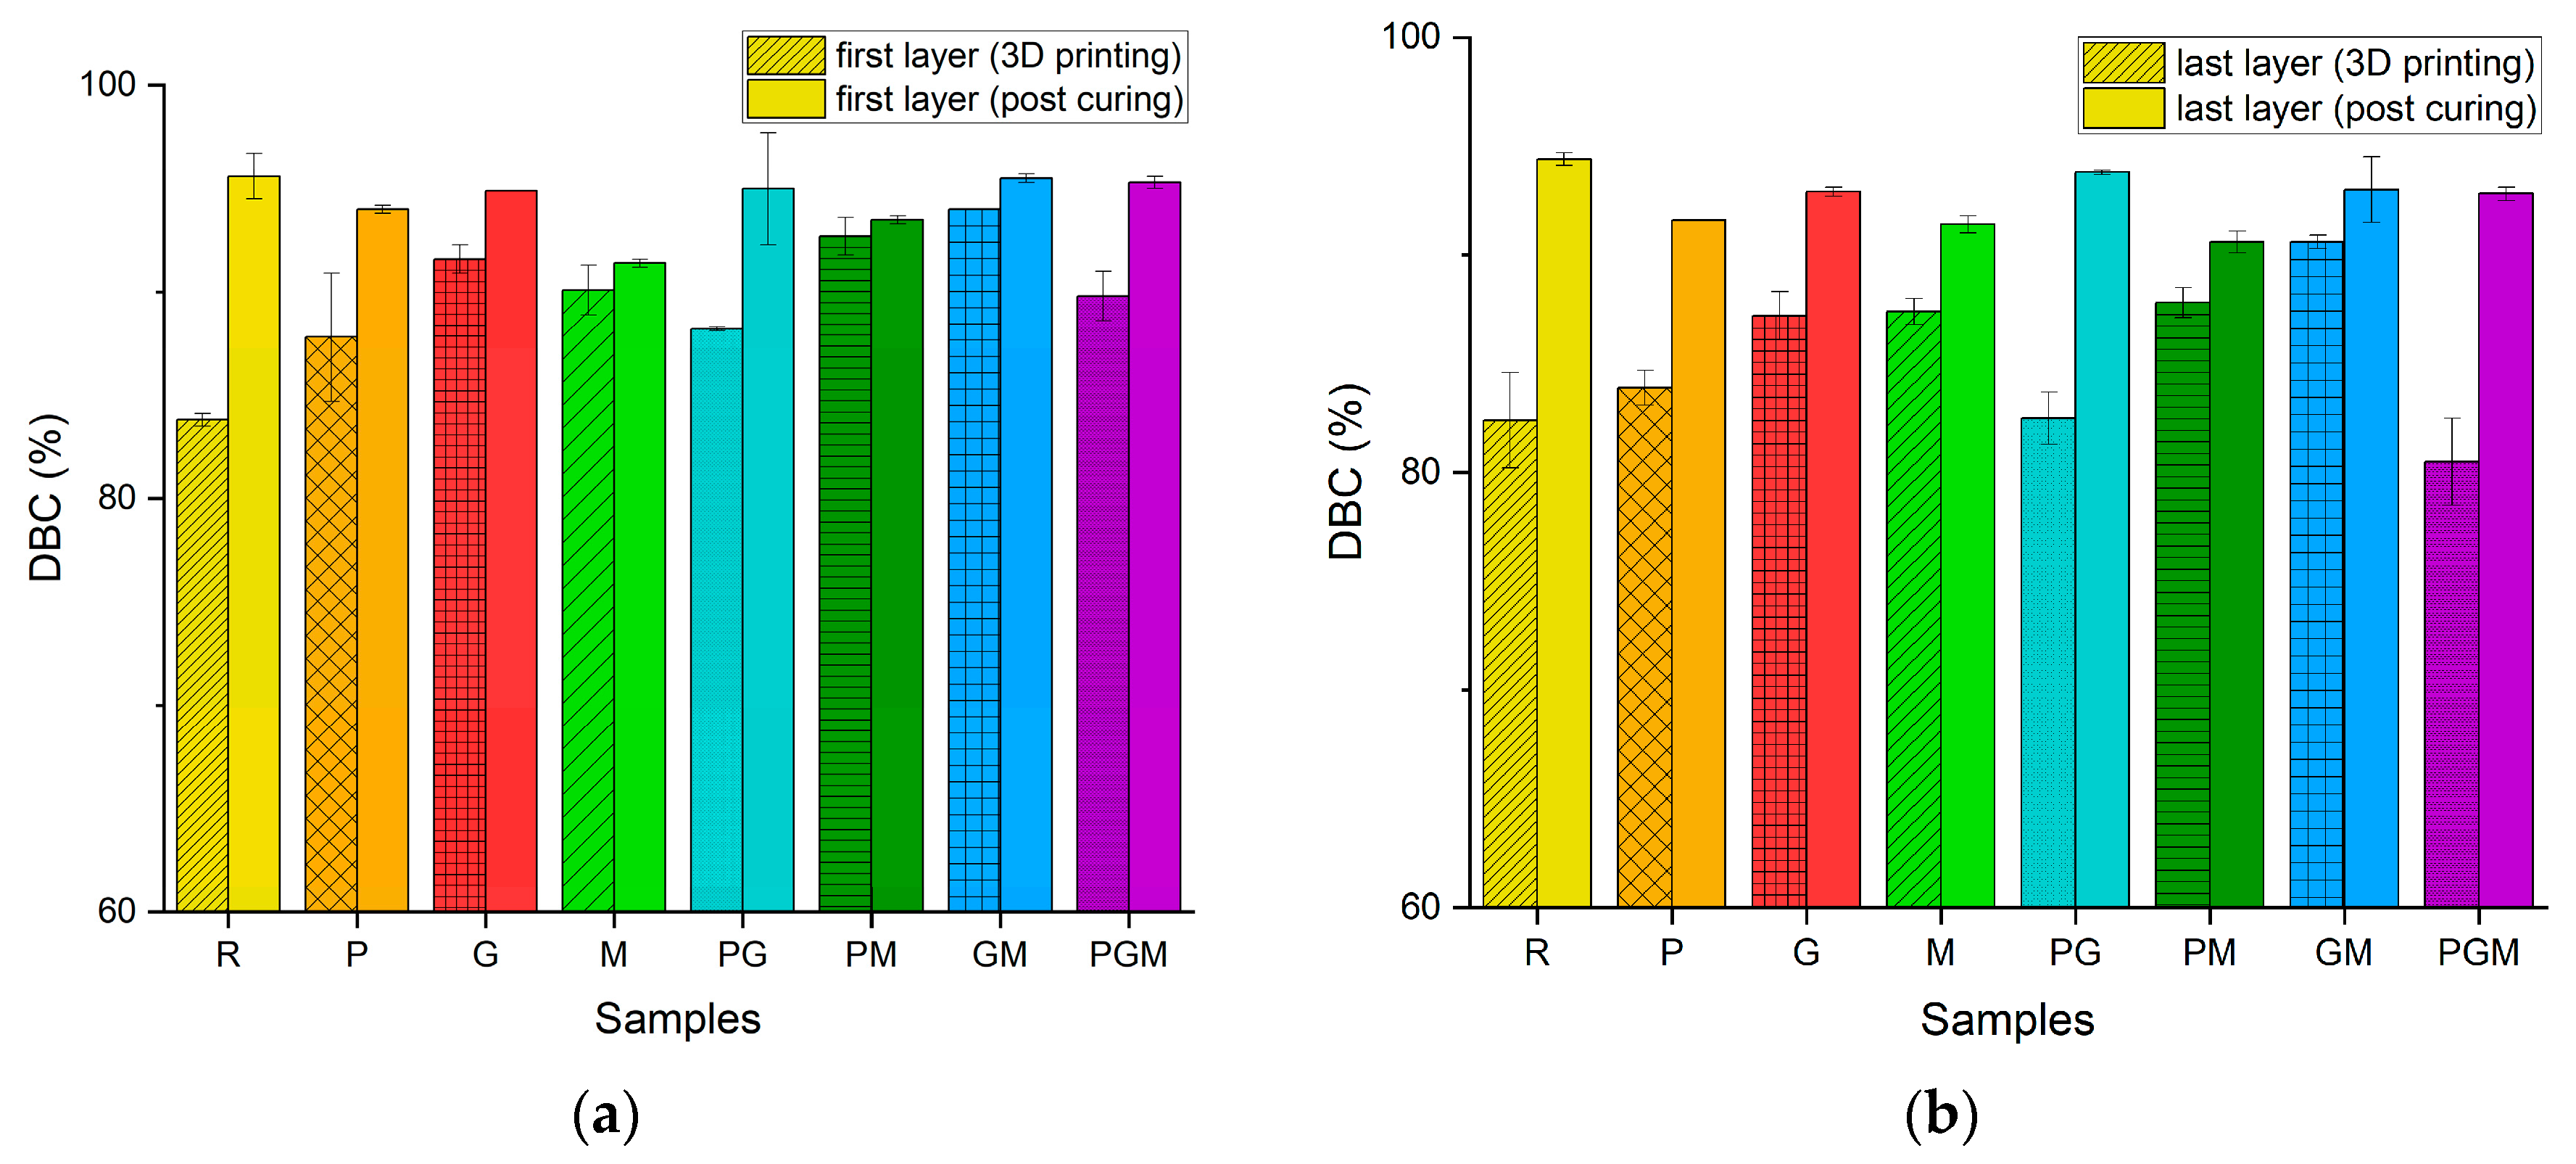
2.4.1. FT-IR Spectroscopy

Double bond conversion (DBC) was determined using a Fourier transform infrared spectrometer (Perkin Elmer Spectrum 65, Waltham, MA, USA) with attenuated total reflectance (ATR) technique. The FT-IR measurements were performed on 2 spots on each side of the DMA specimen. Four scans were made for each measurement from 4000 cm−1 to 600 cm−1, with 4 cm−1 resolution. DBC was calculated according to the following equation:
DBC   ( % )   =   ( 1   C 1 / C 2 )   ×   100 ,
where:
  • C1 is a coefficient between the surface area of the double bond absorption band (810 cm−1) and the surface area of the carbonyl group absorption band (1724 cm−1) of the crosslinked specimen.
  • C2 is a coefficient between the surface area of the double bond absorption band and surface area of the carbonyl group of the uncured resin.

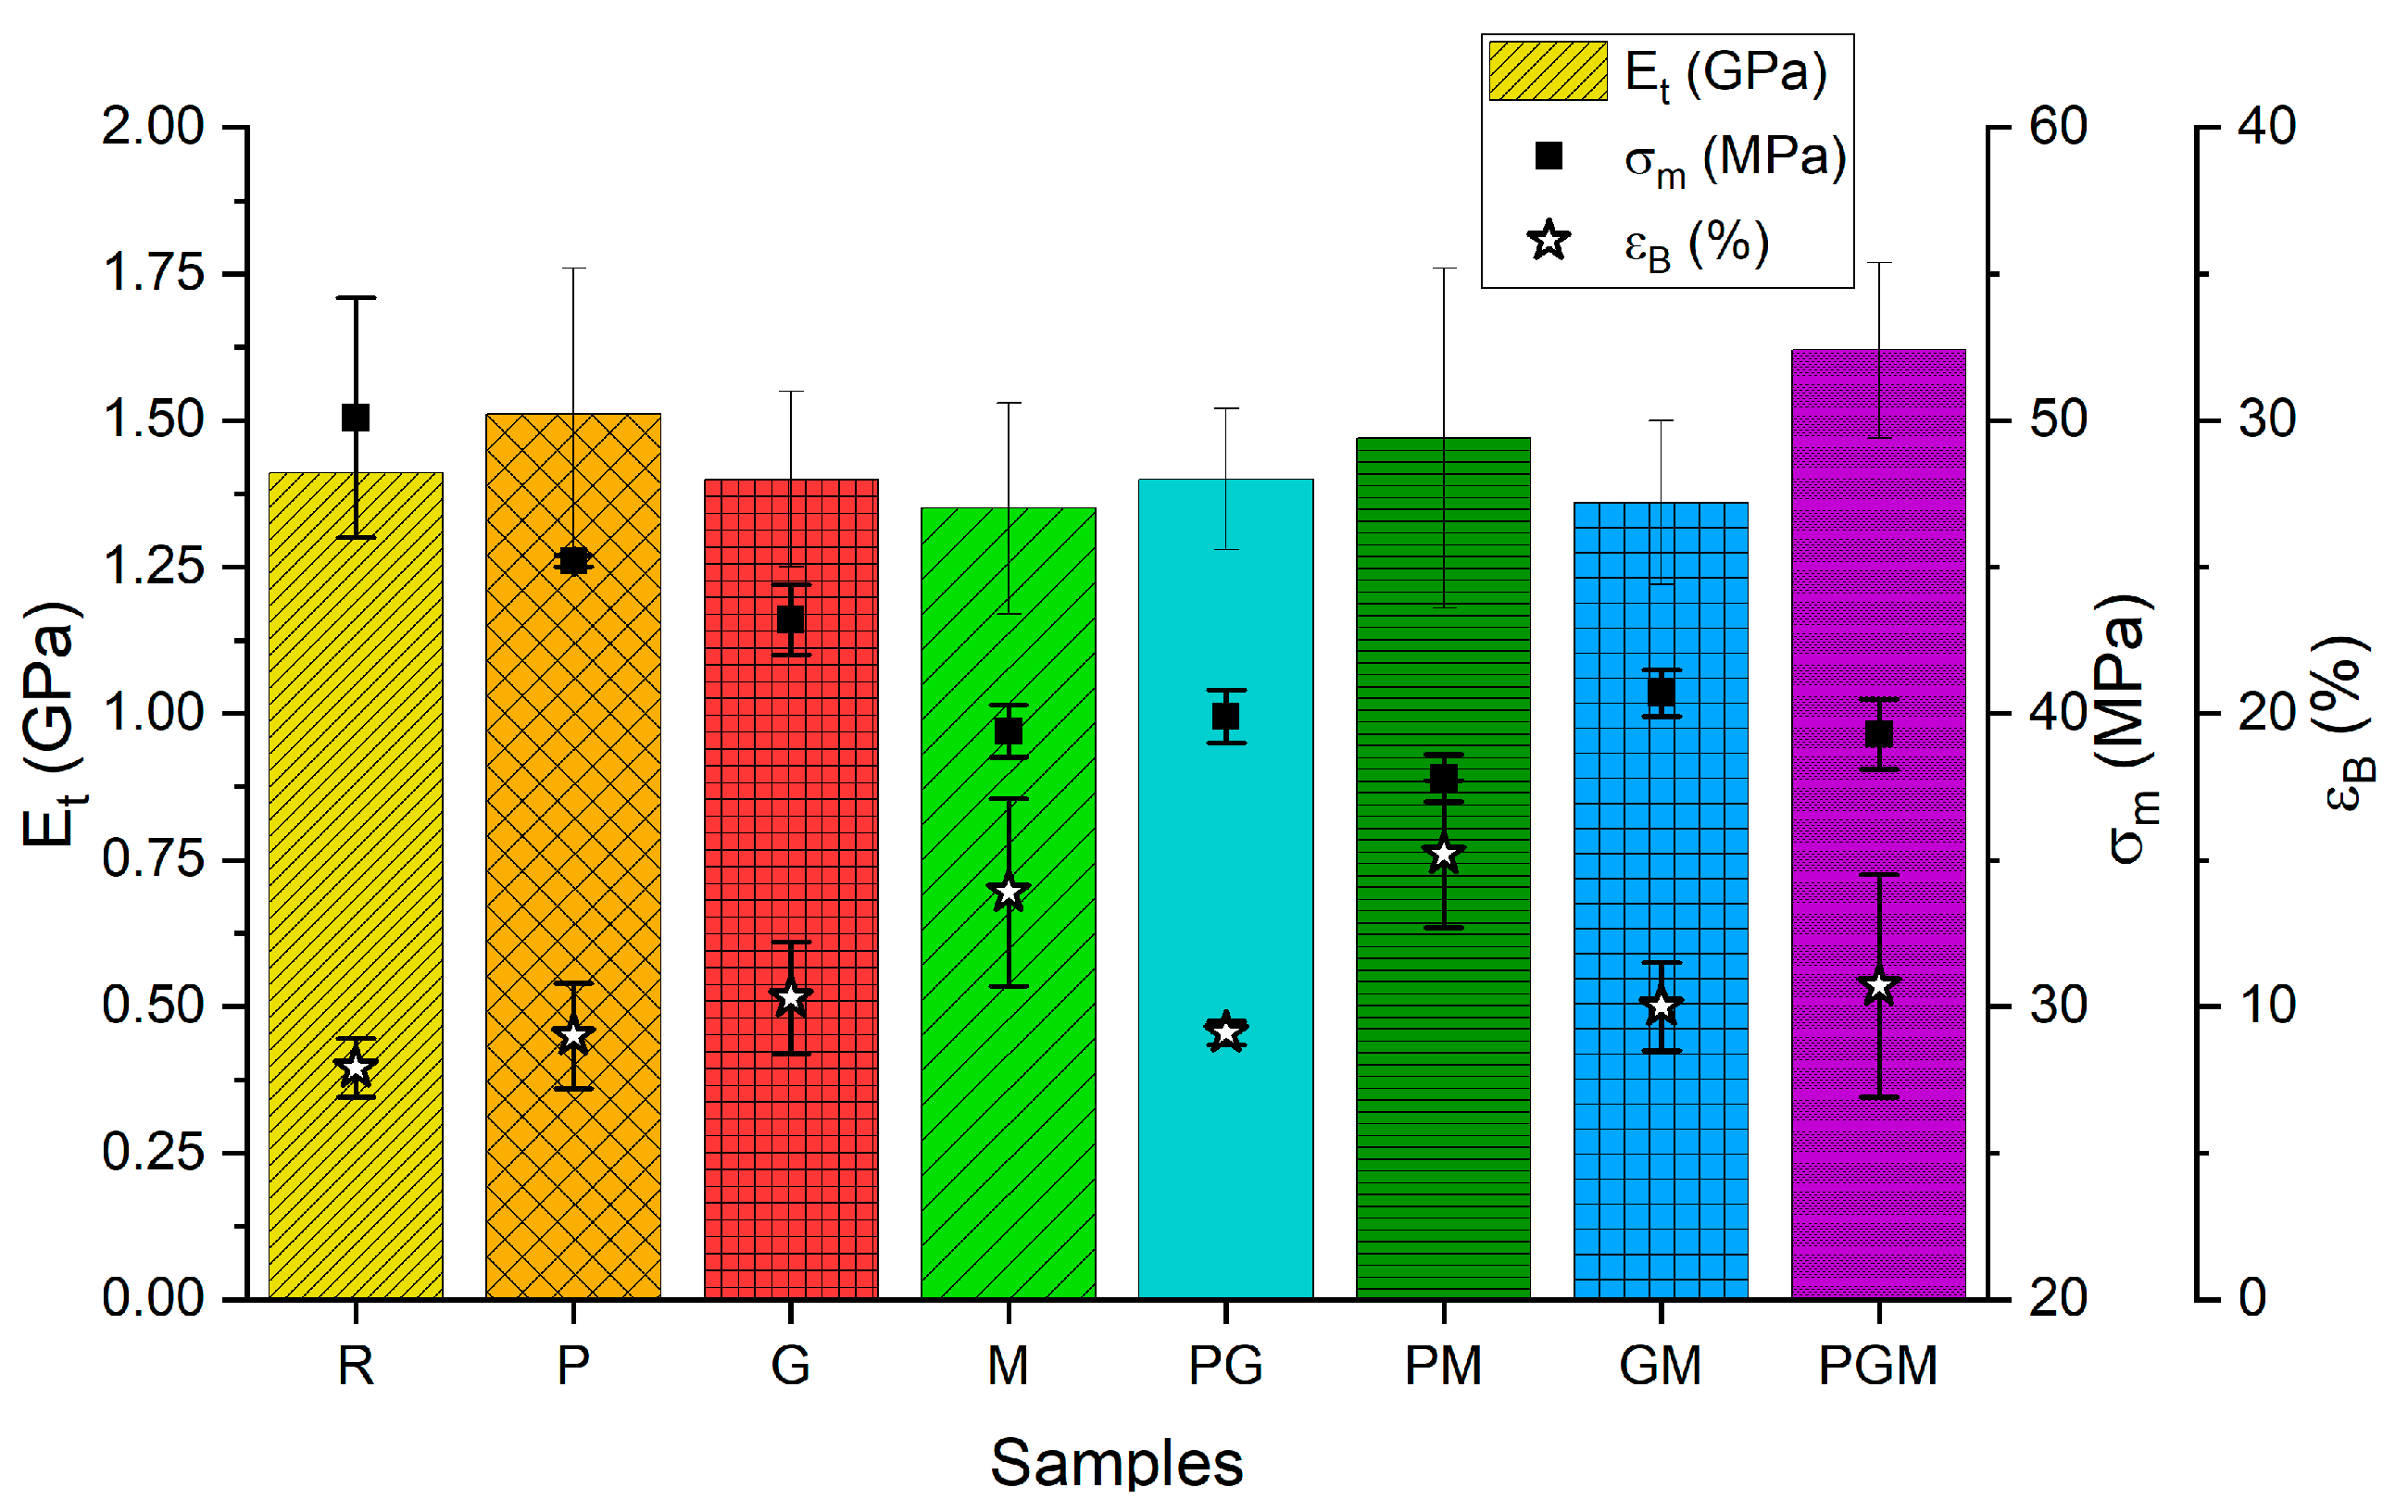
2.4.2. Tensile Tests

Tensile properties were determined on a universal testing machine (Shimadzu Ag-X plus 10 kN, Kyoto, Japan) according to the ISO 527 standard. The gauge length was set to 20 mm, preload at 1 N, and the testing speed was 1 mm/min to 0.25% strain and then 50 mm/min.

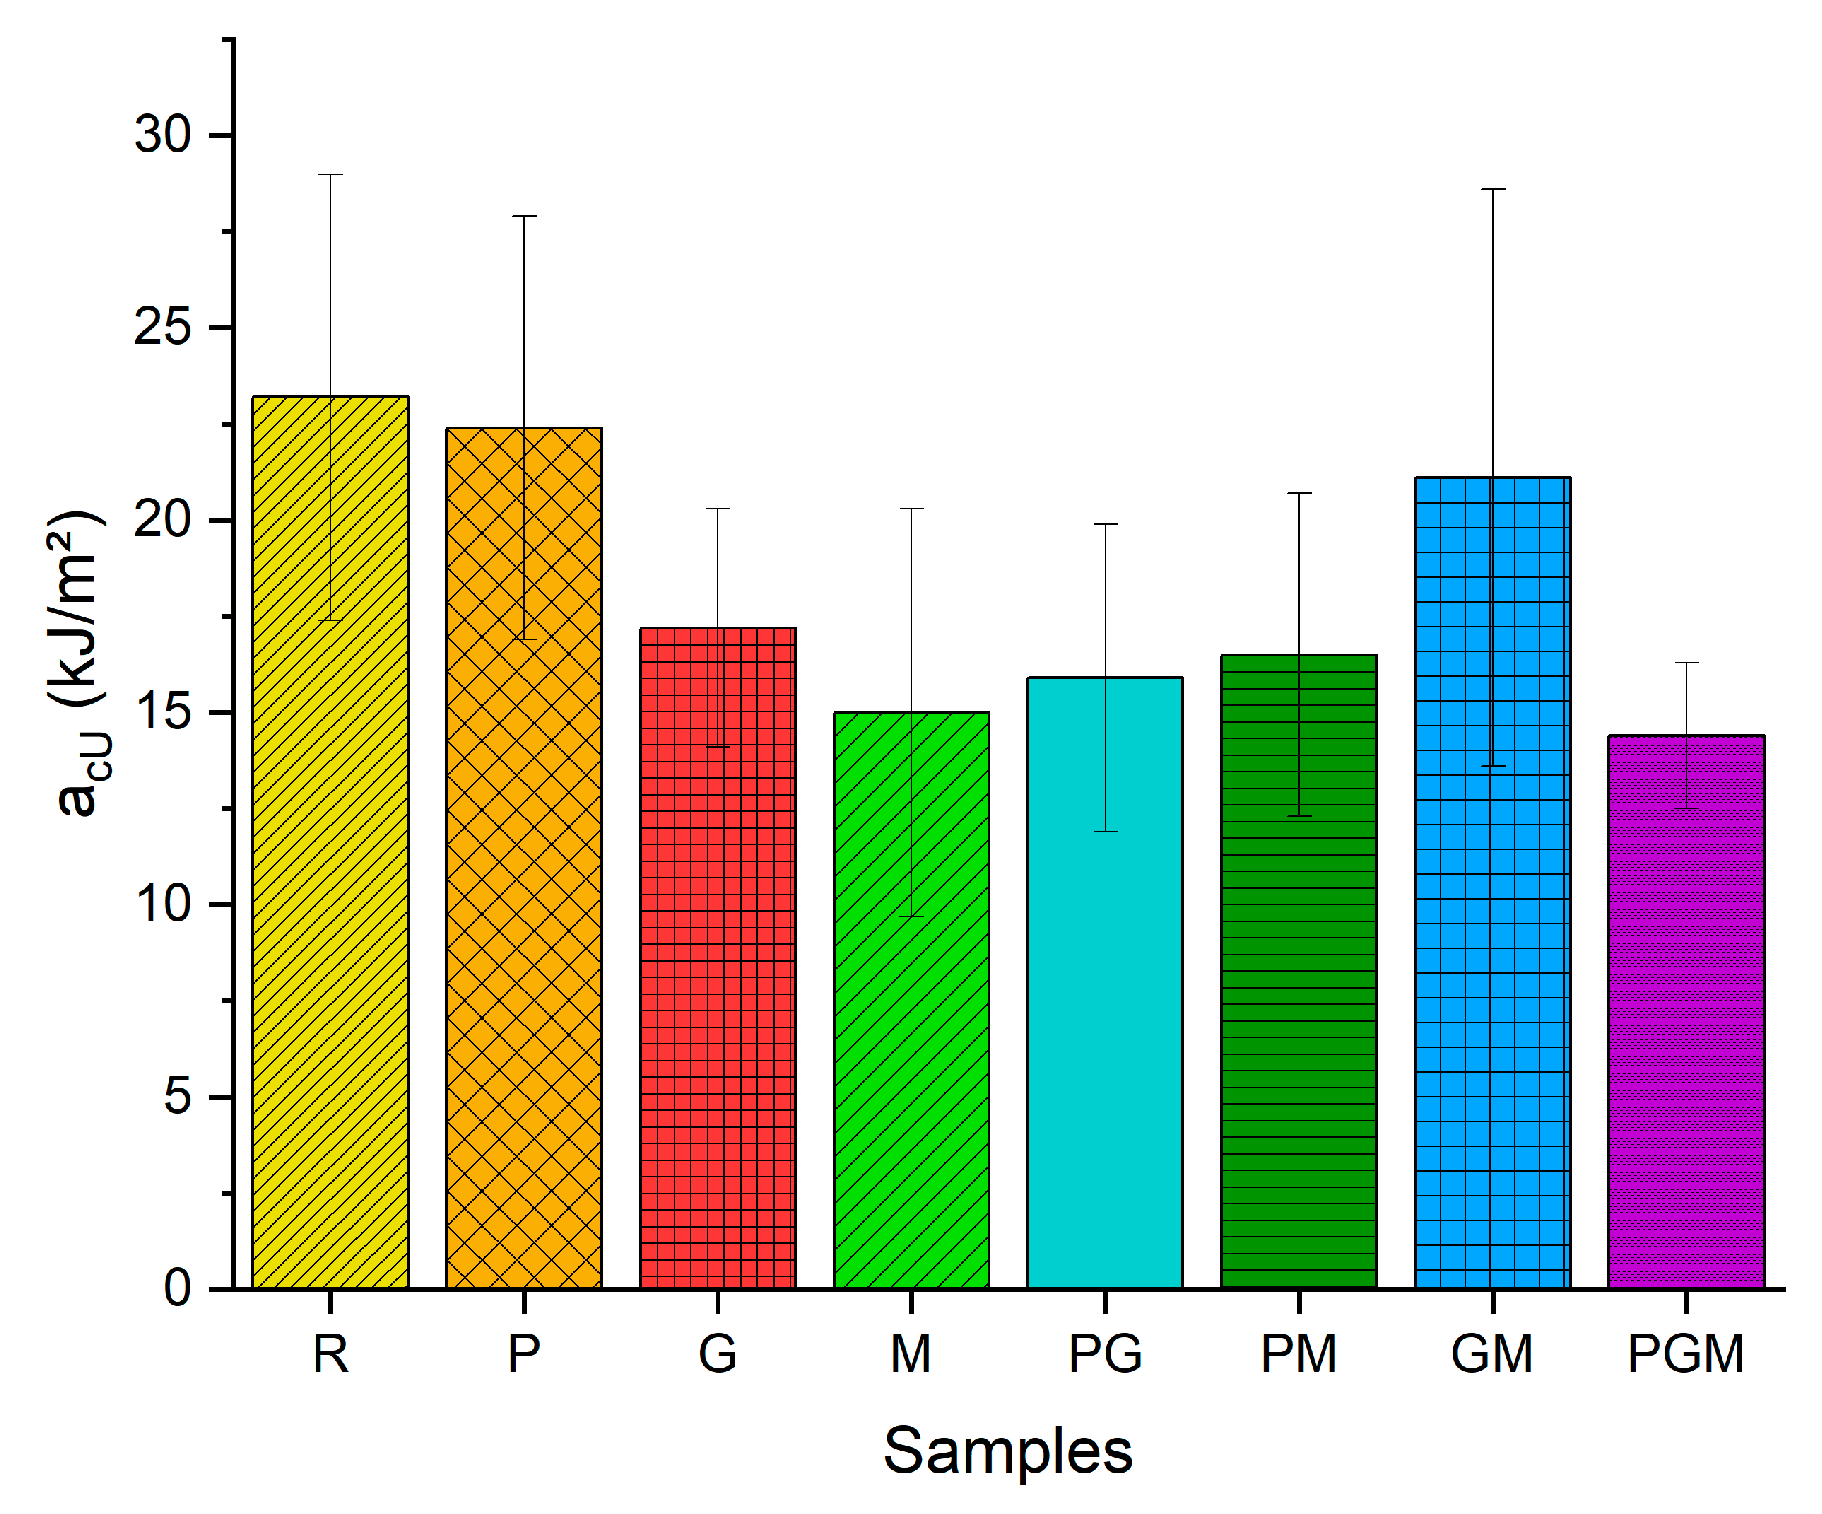
2.4.3. Charpy Impact Tests

The Charpy impact strength was determined using pendulum impact tester (LIYI LY-XJJD5, Dongguan, China). Unnotched samples were tested using a flatwise impact configuration. The distance between supports was 35 mm. Samples were tested with a 2 J hammer.

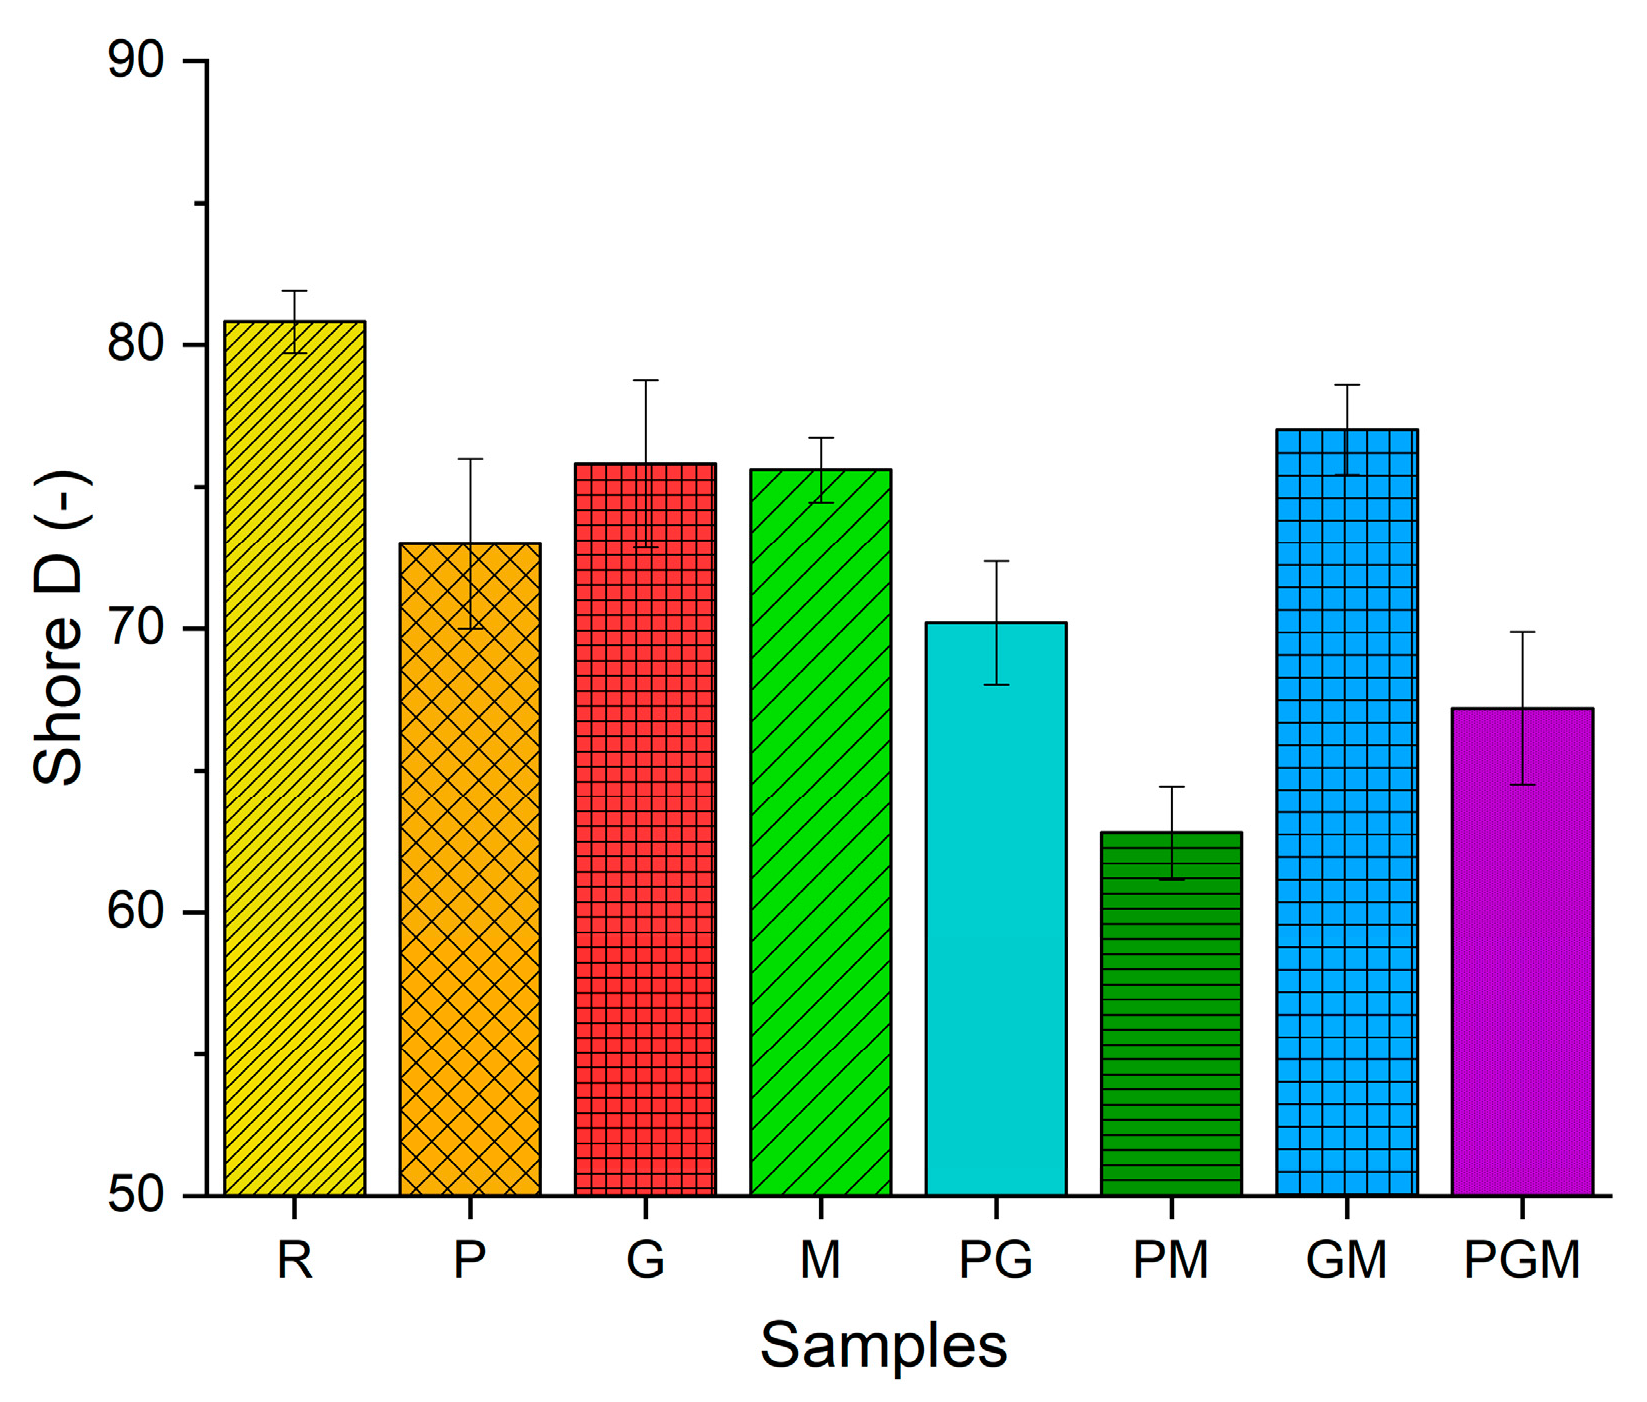
2.4.4. Shore D Hardness

The hardness measurements of all samples were done with Shore D according to the ISO 868 standard.

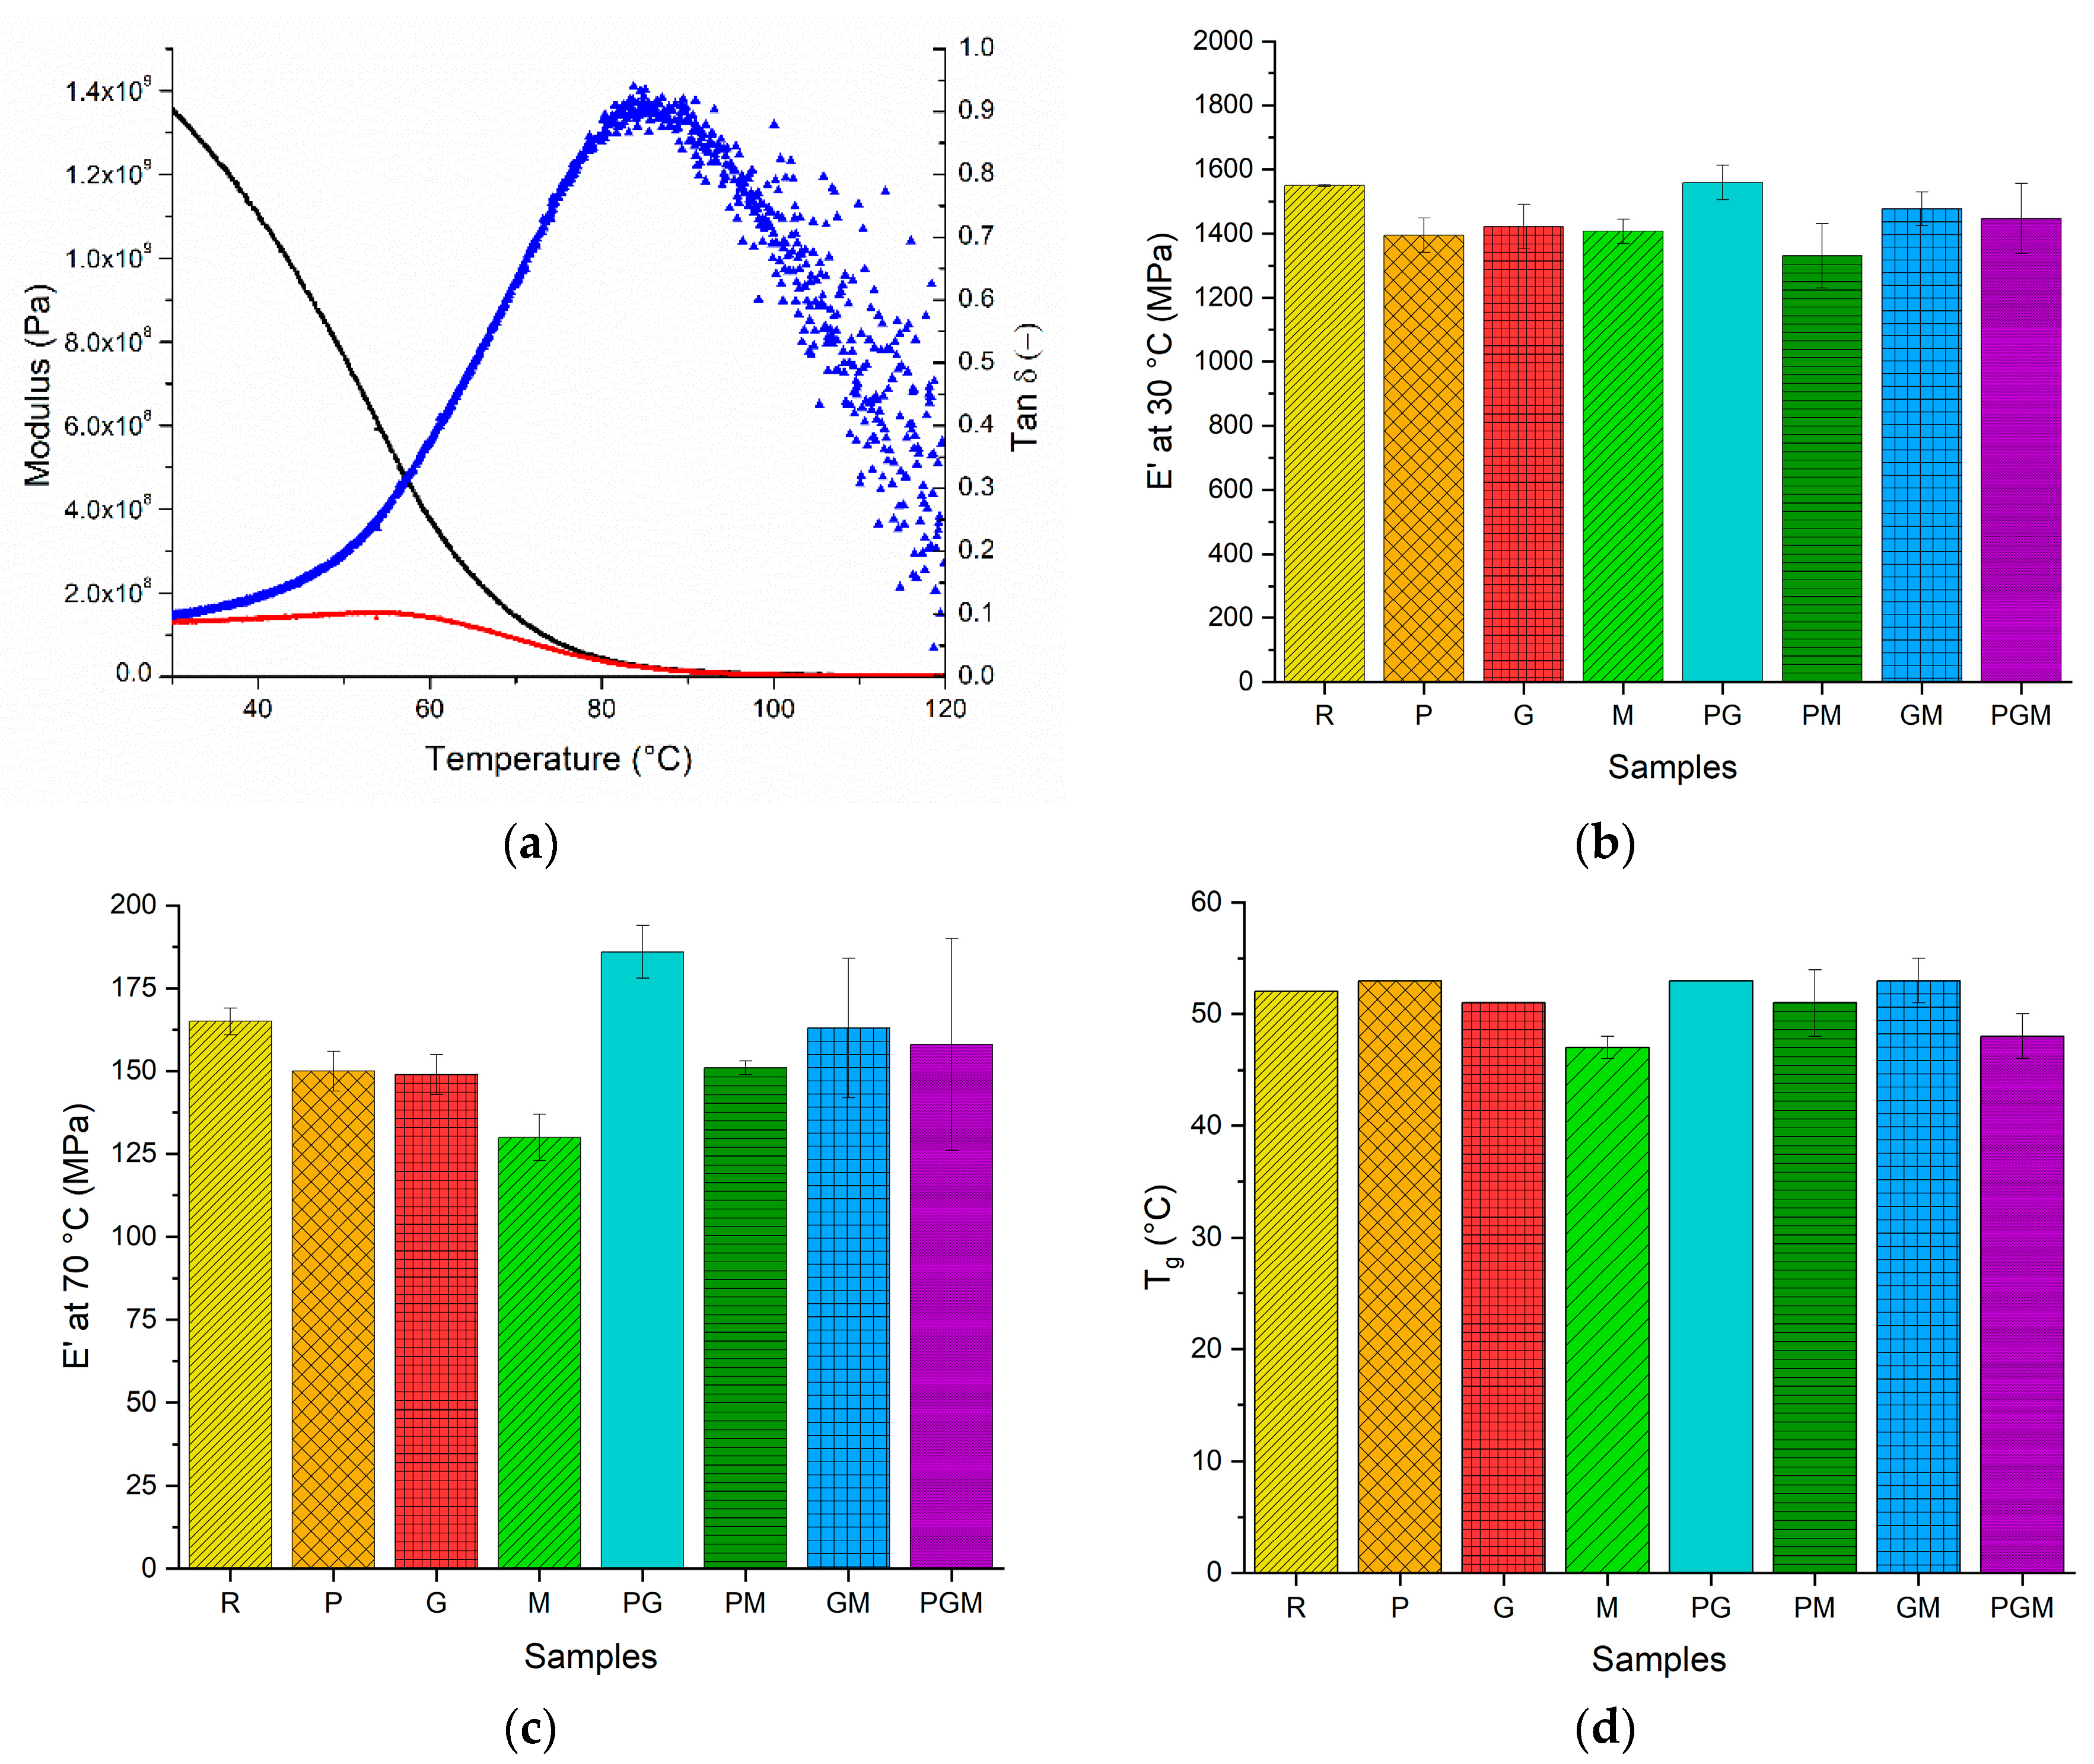
2.4.5. Dynamic Mechanical Analysis

Dynamic mechanical properties were determined using a dynamic mechanical analyzer (Perkin Elmer 8000, Waltham, MA, USA) according to the ASTM D5418 standard. Samples were tested in flexure using a dual cantilever beam supports. The frequency was 10 Hz and the amplitude was 0.02 mm. Samples were heated from 28 to 120 °C, with the heating rate of 2 °C/min. For each sample, two measurements were performed and the average value was calculated as a result.

2.4.6. Tribological Testing

Tribological properties (the µ and ws) were determined with a PoD test setup based on ASTM G99 at a universal mechanical tester UMT-2 (Bruker Nano Surfaces Division, Campbell, CA, USA). The cylindrical specimens were tested against 100Cr6 steel disks with an average roughness of Ra ≈ 0.3 µm (according to DIN EN ISO 25178). The materials were tested in two moving types, a constant rotating movement with a speed of 250 mm/s and a cyclic direction changing movement with speed up to 500 mm/s. Both methods were conducted with an applied normal force of 25 N. Unidirectional tests were done for one hour, while the cyclic tests consisted of an accelerating clock-wise movement (5 s), followed by a counter-clock-wise movement (5 s) and a resting time of 8 s. This cycle was repeated 40 times. For the unidirectional tests, the µ was determined as an average value of two measurements. For the cyclic tests, the µ was taken as an average of two measurements over cycle numbers of 1–4, 16–20, and 36–40.

2.4.7. Optical Microscopy

The surface analysis of the tribologically tested specimens was investigated with a light microscope Olympus SZX12 (Olympus IMS, Tokyo, Japan).

3. Results and Discussion

3.1. FT-IR Spectroscopy

FT-IR spectroscopy was used to study the influence of the fillers on curing behavior. As the free-radical polymerization progresses, the concentration of the double bonds is decreased. Hence, the DBC provides a good estimate of the degree of polymerization (Dp) and the reactivity of the material [50]. After DLP 3D printing, the parts are usually not fully cured due to weak light emitted by the projector. Thus, the post-curing using a stronger UV light is required to increase the Dp. Nevertheless, it is desired that after the 3D printing, the parts already have high Dp and good mechanical strength to ensure a more robust manufacturing process. Since the first printed layers receive a larger dose of photons due to the long curing times and penetration of light during the curing of subsequent layers, the DBC on this side of the specimen is usually higher. The DBC of the samples is presented in Figure 1. After the 3D printing, all samples had relatively high DBC (above 80%). Monofunctional acrylates such as isobornyl acrylate used in this study are known to exhibit high values of DBC after the curing due to linear chain formation and delayed gel effect compared to the more crosslinked systems [51]. The DBC of the filled 3D printed samples were in general higher than DBC of the unfilled sample, except for sample PGM (measured on the side with the last printed layer). As expected, all samples had higher DBC on the side with the first printed layers. Otherwise, no clear correlations could be observed between the resin formulation and DBC of the 3D printed samples. After the post-curing process, the DBC conversion increased to values between 90% and 95%, which is a reasonable range for such systems. The DBC after the post-curing of the unfilled material was slightly higher than DBC of the filled materials. This effect was ascribed to the different light absorption properties of Sudan I dye and the fillers. The azo dyes such as Sudan I used in this study are well known to be prone to photocatalytic degradation and bleaching, thus reducing their light absorption capacity during the post-curing [52]. On the other hand, the solid lubricants, such as graphite and MoS2, are very UV stable. A consequence of this was that it was harder to fully cure the samples containing fillers in comparison to a sample containing only a dye.

3.2. Tensile Tests

Mechanical properties of the material play an important role in the tribological performance of the system. Tribological properties, such as µ and ws, are well correlated to the mechanical properties [53,54]. Furthermore, when parts are used in tribological applications, such as gears, the material must withstand high mechanical loads during the transmission of power. The tribological contact represents a very complex loading situation combining tensile, compression, and shear stresses in the contact area. Nevertheless, the tensile tests provide good insight into the influence of fillers on the mechanical performance of the material. The addition of fillers into photo-curable resins can influence mechanical properties by the direct effect of the filler particles with specific properties (shape, size, modulus, etc.) or by influencing the photo-curing behavior of the resin. Figure 2 summarizes the tensile properties of the tested samples. The addition of fillers did not significantly (α = 0.05) affect the tensile modulus (Et) except for the sample PGM, which had slightly increased Et. For all filled materials, the tensile strength (σm) decreased. This effect was ascribed to the low interfacial strength between the matrix and the fillers, and the lower Dp of the filled samples (discussed in more detail in Section 3.1). σm decreased from 50.1 to 45.2 MPa, 43.2 MPa, and 39.4 MPa, for samples R, P, G, and M, respectively. For the mixed filler systems, the σm was further decreased to 39.9, 37.8, 40.7, and 39.2 MPa for the samples PG, PM, GM, and PGM, respectively. It can be concluded that the fillers decreased σm in the order MoS2 > graphite > PTFE. For all filled materials, the strain at break (εb) increased from 7.9% to 9.0%, 10.3%, 13.9% for samples R, P, G, and M, respectively. This was ascribed to the lower Dp of the filled samples. For samples containing mixed fillers, no clear trends between the composition and the εb can be observed. It must be noted that samples with the highest εb values (sample M and PM) also exhibited the lowest DBC values after the post-curing process, indicating the lowest Dp. Decrease in the strength by the solid lubricants could be potentially reduced by using improved curing strategies, or by optimizing resins composition, for example, by using an acrylate-epoxy hybrid system, where parts could also be thermally post-cured or by optimizing current curing strategies.

3.3. Charpy Impact Tests

Photocurable resins for additive manufacturing are well known to be brittle, and the addition of fillers can further decrease the impact strength [55]. Thus, it is important that, for practical tribological applications, these materials have sufficient impact strength to endure the loads during the part operation. Figure 3 summarizes Charpy unnotched impact strength (acU) of the tested samples. The acU of the samples R, P, and GM was not significantly different (α = 0.05). The impact strength of samples G, M, PG, and PM decreased from 23.2 kJ/m2 for sample R to values around 16 kJ/m2 (±1 kJ/m2). Sample PGM exhibits the lowest value of acU (14.4 kJ/m2). On the first look, one of the biggest disadvantages of VPP technologies compared to thermoplastic-based AM is certainty low impact strength, since engineering thermoplastics, such as polyamides, exhibit higher acU than around 20 kJ/m2, as reported for the resins in this study. While an advantage of thermoplastic-based technologies is obvious at first glance, it must be noted that this may not always be true, especially since parts produced using material extrusion AM are well known to exhibit high levels of anisotropy, while VPP-produced parts are more or less isotropic [56,57]. Moreover, in recent years, great efforts have been made to overcome these challenges. Considerable progress comes from developing new materials on one side, and on the other side new technologies, such as Hot Lithography, which enables the VPP of highly viscous resins, resulting in parts with a higher impact strength [58,59].

3.4. Shore D Hardness

The hardness of photo-cured resins is dependent on many factors, all the way from photopolymer chemistry and structure, curing conditions, and fillers. As discussed in Section 3.1, the incorporation of a solid lubricant has a significant effect on the curing behavior of the resins, usually resulting in lower DBC conversion and, thus, lower Dp. The other main effect of solid lubricants on the hardness comes from the direct effect of solid lubricants. When soft PTFE (Shore D ≈ 55) is incorporated into relatively hard resin, this will result in lower hardness. The effect of the graphite and MoS2 on the hardness of the resins is a bit harder to predict (except on the curing behavior) since both fillers can increase or decrease the hardness of polymer systems [60,61,62]. In Figure 4, all Shore D hardness values are illustrated. Sample R exhibited the highest hardness (Shore D ≈ 80), followed by samples GM, G, and M, where hardness was slightly lower (Shore D ≈ 75). On the other hand, the samples containing PTFE exhibited significantly decreased hardness, where Shore D of sample R was, while, for the samples PG, PGM, and PGM, the hardness was further decreased to Shore D values of 70, 67 and 63, respectively.

3.5. Dynamic Mechanical Analysis

Contrary to most metallic and ceramic materials, polymers upon deformation exhibit characteristic viscoelastic behavior. This time-dependent viscoelastic behavior is a significant factor to consider when designing a tribological system [4,8]. DMA is an instrumental technique for studying the viscoelastic properties of polymers over a wide range of conditions that provides information about the elastic material response (storage modulus (E’)), plastic response (loss modulus (E’’)), and damping behavior (tan δ) [63]. Some performance characteristics of the tribological systems, such as operating noise, vibrations, and power transmission efficiency, are strongly correlated to the damping characteristics of the materials [4,5]. Furthermore, as properties can be determined over a wide temperature range, important information about the temperature dependency of viscoelastic properties can be obtained. In Figure 5, the dynamic mechanical properties of samples are presented. All samples exhibited very similar dynamic mechanical behavior, with typical thermograms presented in Figure 5a. Upon heating, the E’ of samples decreased at a similar rate until around 50 °C, where glass transition temperature (Tg) in the form of E’’ peak was reached. Around the glass transition temperature of samples (45–55 °C) the rate of decline of E’ was obviously the highest, up to around 60 °C, where the rate of decline was significantly decreased. The E’’ reached a peak at around 50 °C, whereas the tan delta (tan δ) reached a peak at around 85 °C. At around 90 °C, the E’ was practically zero, which is the reason for highly scattered tan δ data points above this temperature. Due to this high scattering of data, the E’’ peak was taken as a glass transition temperature. Building on our knowledge obtained from previous work, where we developed a system for tailoring mechanical and thermal properties of photocurable resins for VPP, the resin composition used in this study was intentionally chosen to provide required properties for intended application of the resin—components in the power transmissions system of automatic doors. Instead of choosing a more cross-linked system that has a higher modulus at elevated temperatures, our approach was to use tough and flexible oligomer, combined with monofunctional monomer, to provide high toughness and a relatively low glass transition temperature. During use, the component will operate in the material glass transition region, thus providing excellent vibration and noise damping behavior, desired in the operation of automatic doors. The drawback of using this approach is that properties are highly dependent on temperature. Only a slight increase in temperature brings a dramatic drop in modulus as well as higher expected power losses as a result of the dissipation of mechanical forces into heat. As presented in Figure 5b the addition of fillers slightly decreased E’ at 30 °C for all samples except for sample PG where E’ at 30 °C was at the same level. E’ decreased from 1550 MPa for sample R to values around 1400 MPa for samples P, G, and M, to 1330 MPa for sample PM and to values around 1450 MPa for samples GM and PGM. For the E’ at 70 °C, the similar trend was shown, except for sample M, which had significantly lower E’ at 70 °C. The E’ at 70 °C decreased from 165 MPa for the sample R to around 150 MPa for samples P, G, and PM, to values around 160 MPa for samples GM and PGM, to 130 MPa for sample M and it increased to 186 MPa for sample PG (Figure 5c). These results are in good correlation with the DBC values after the post-curing. All samples exhibited Tg values slightly above 50 °C except for sample M and sample PGM, which had slightly lower Tg (Figure 5d).
Whereas thermoplastic-based AM technologies are using polymers as a feedstock, the VPP uses basic building blocks (monomers and oligomers) and polymerize them during the 3D printing. Since thermoplastic polymers are usually already polymerized by large material manufacturers, so their structure or chemistry is more or less determined. On the other hand, VPP provides the user with the opportunity to elegantly tailor the structure and chemistry of the material by combining different monomers and oligomers. In this way, the viscoelastic spectrum of the material could also be adjusted for the specific applications. For example, contrary to our approach, for applications where high power transmission efficiency is needed, one has the opportunity to decrease the hysteresis loop for that particular loading conditions by tailoring the resin composition, thus decreasing power losses.

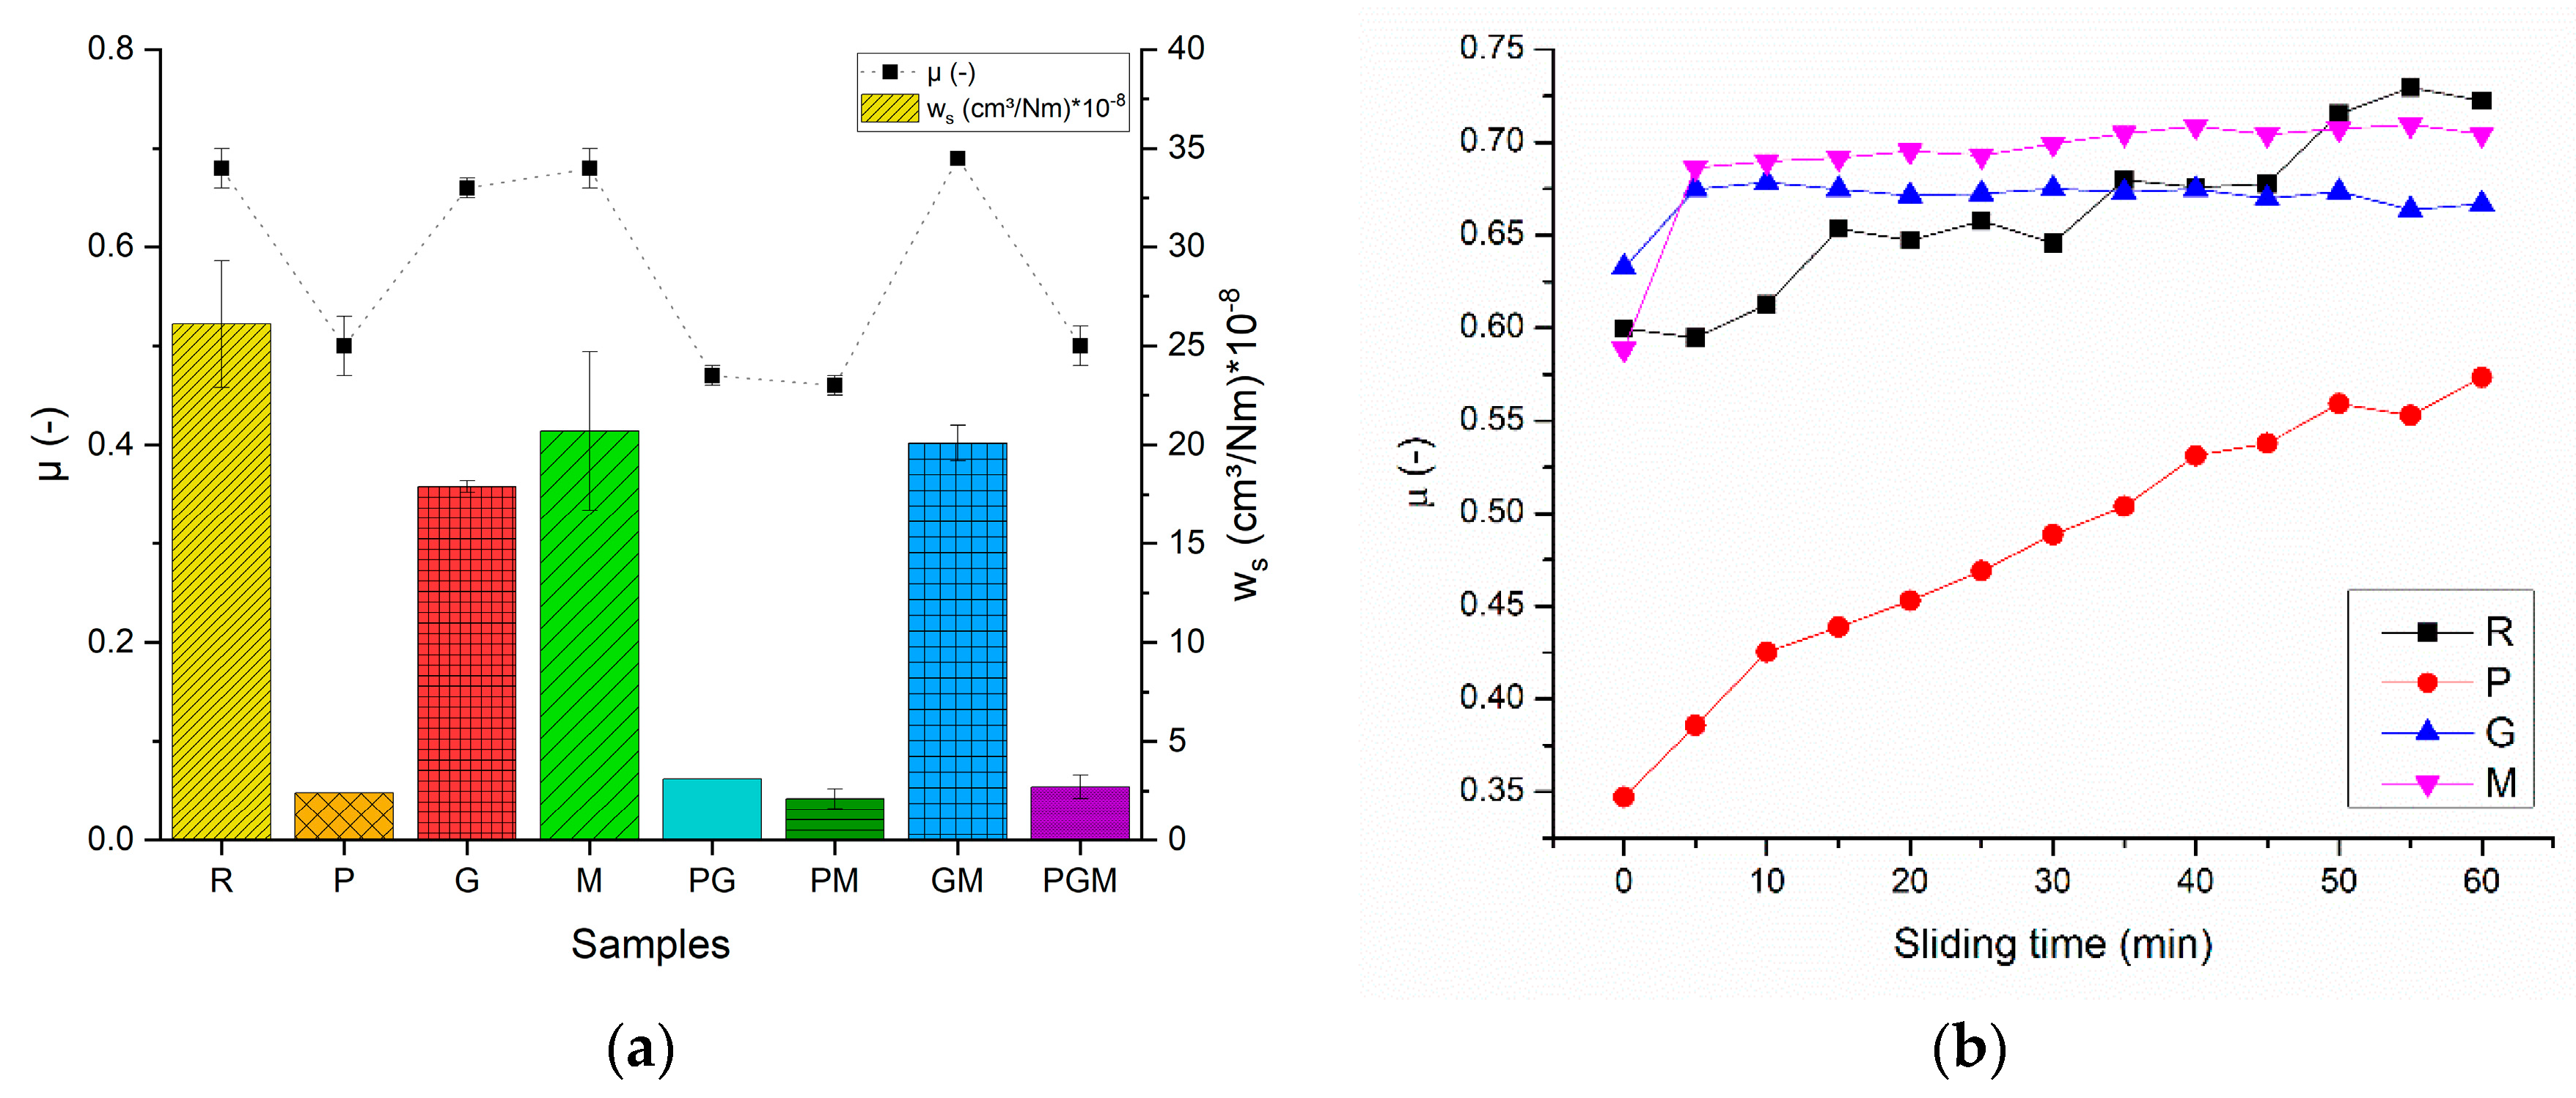
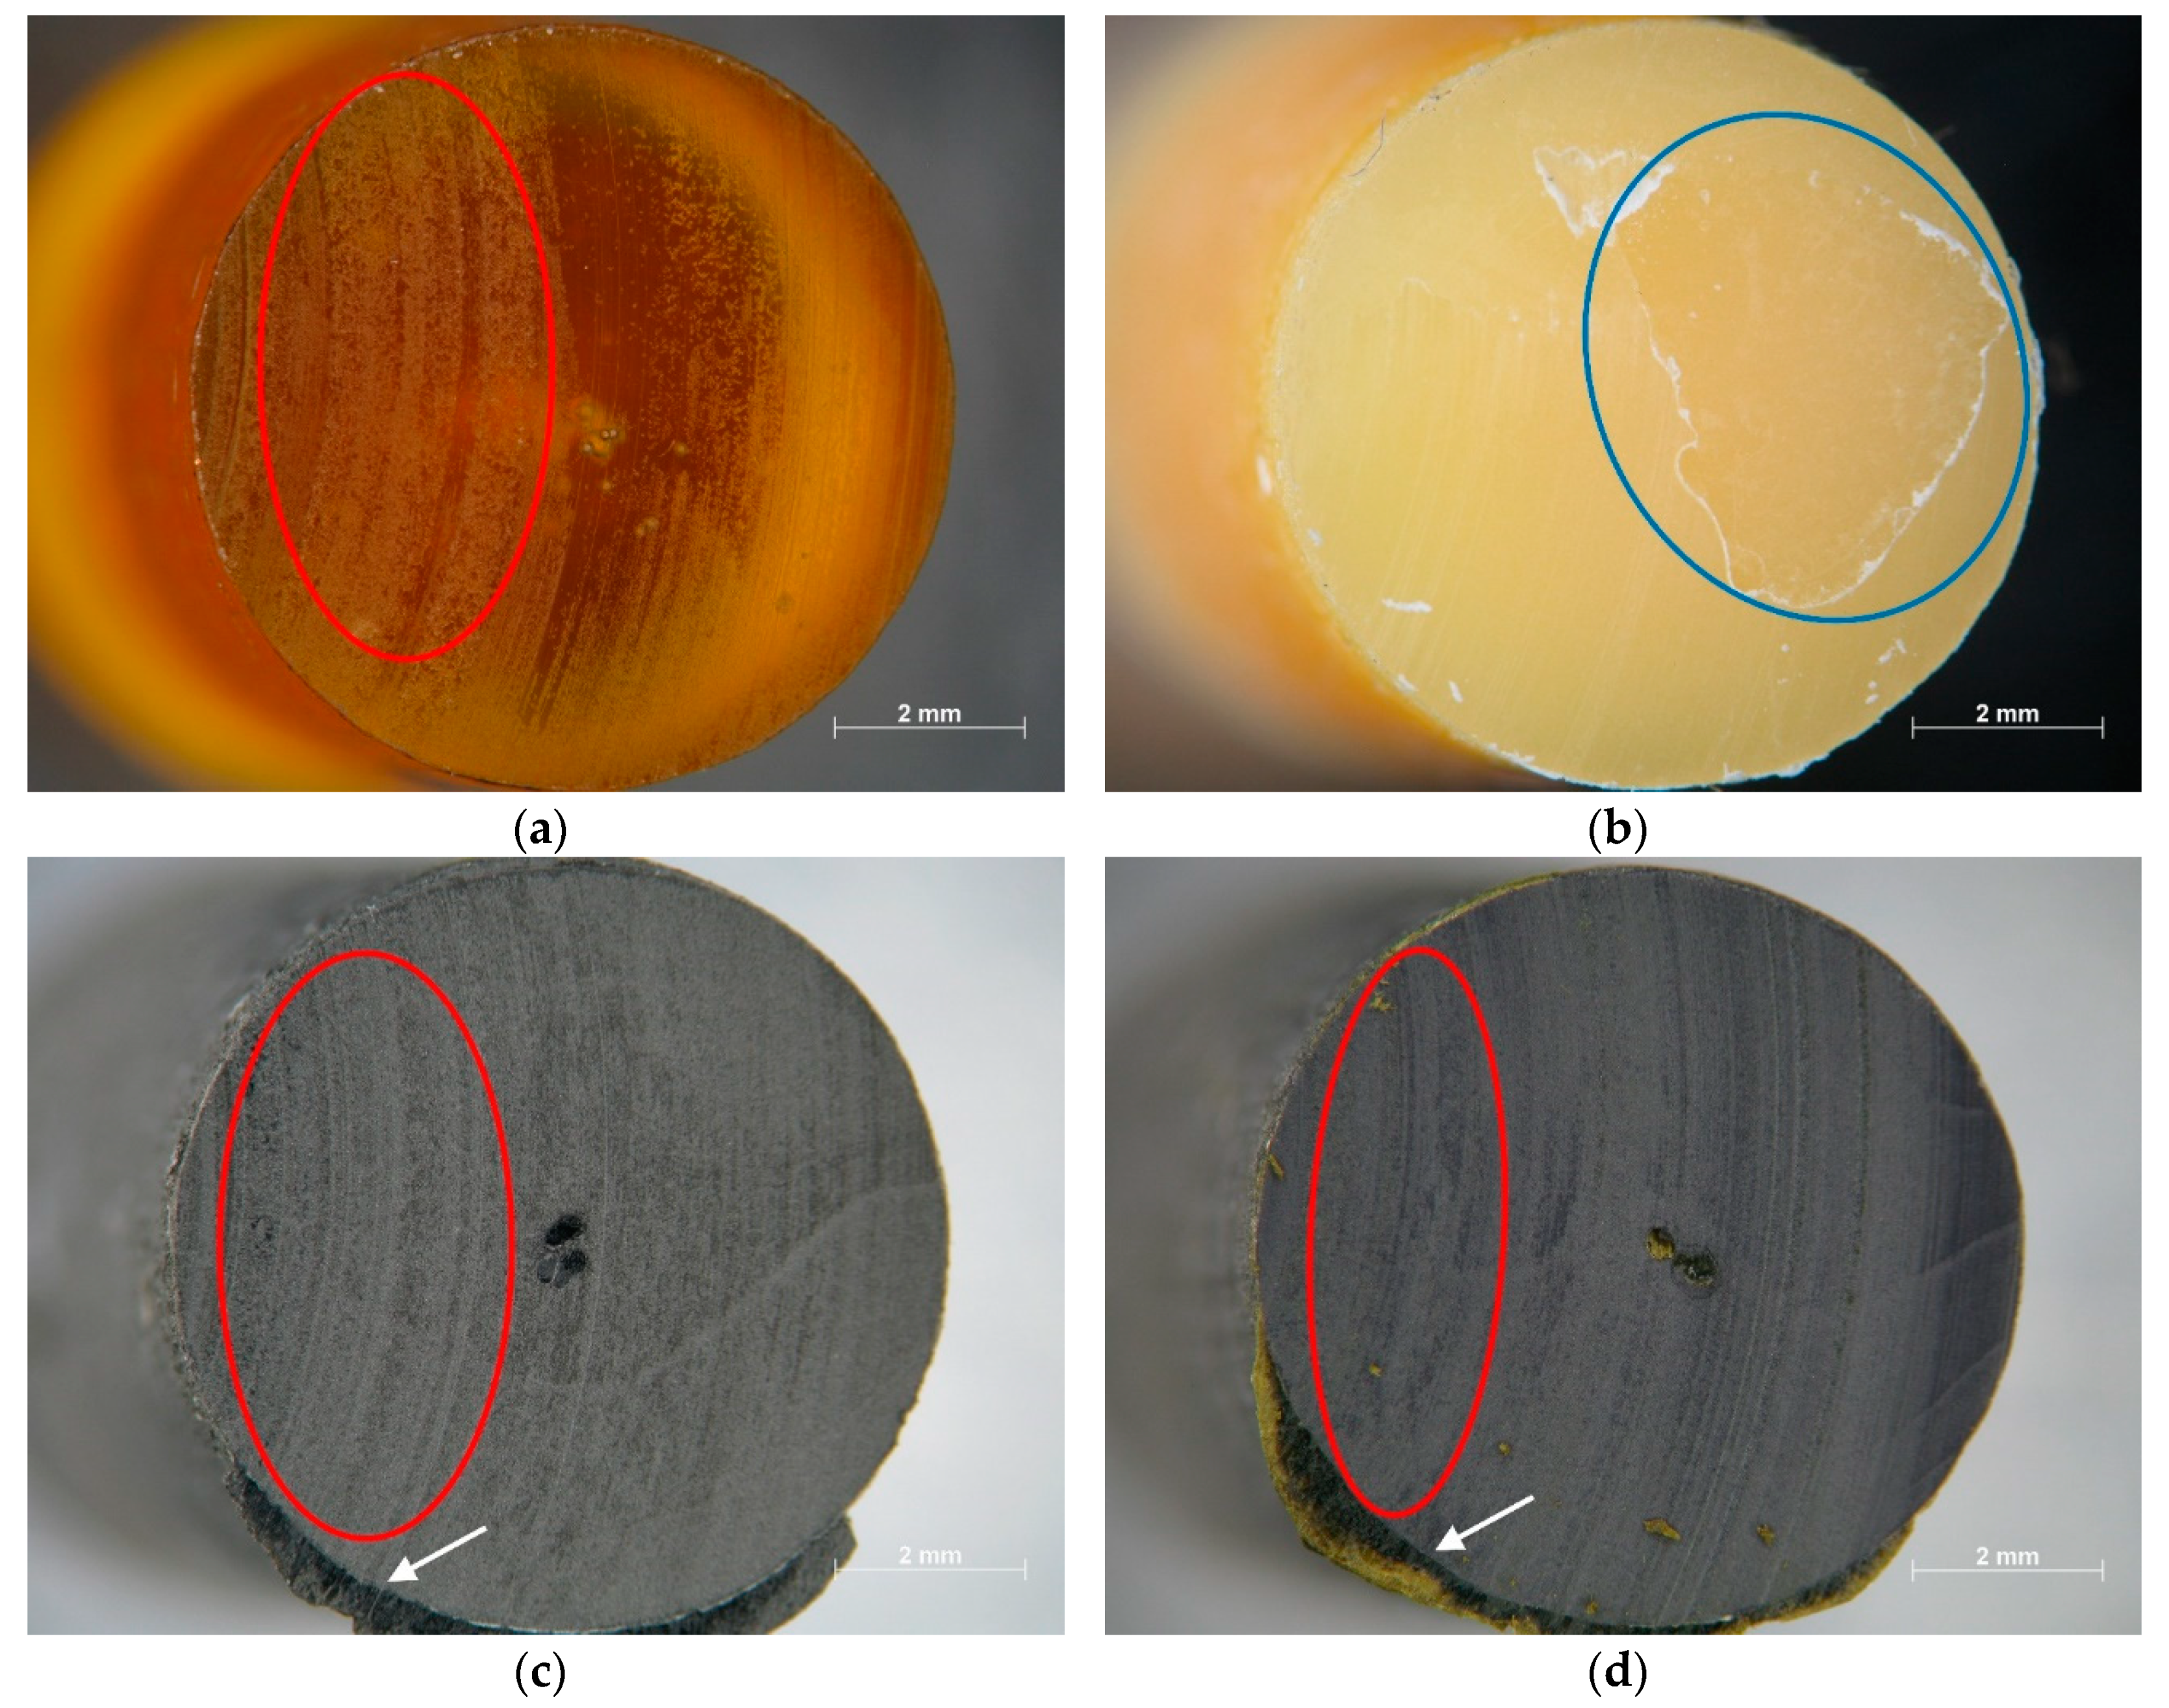
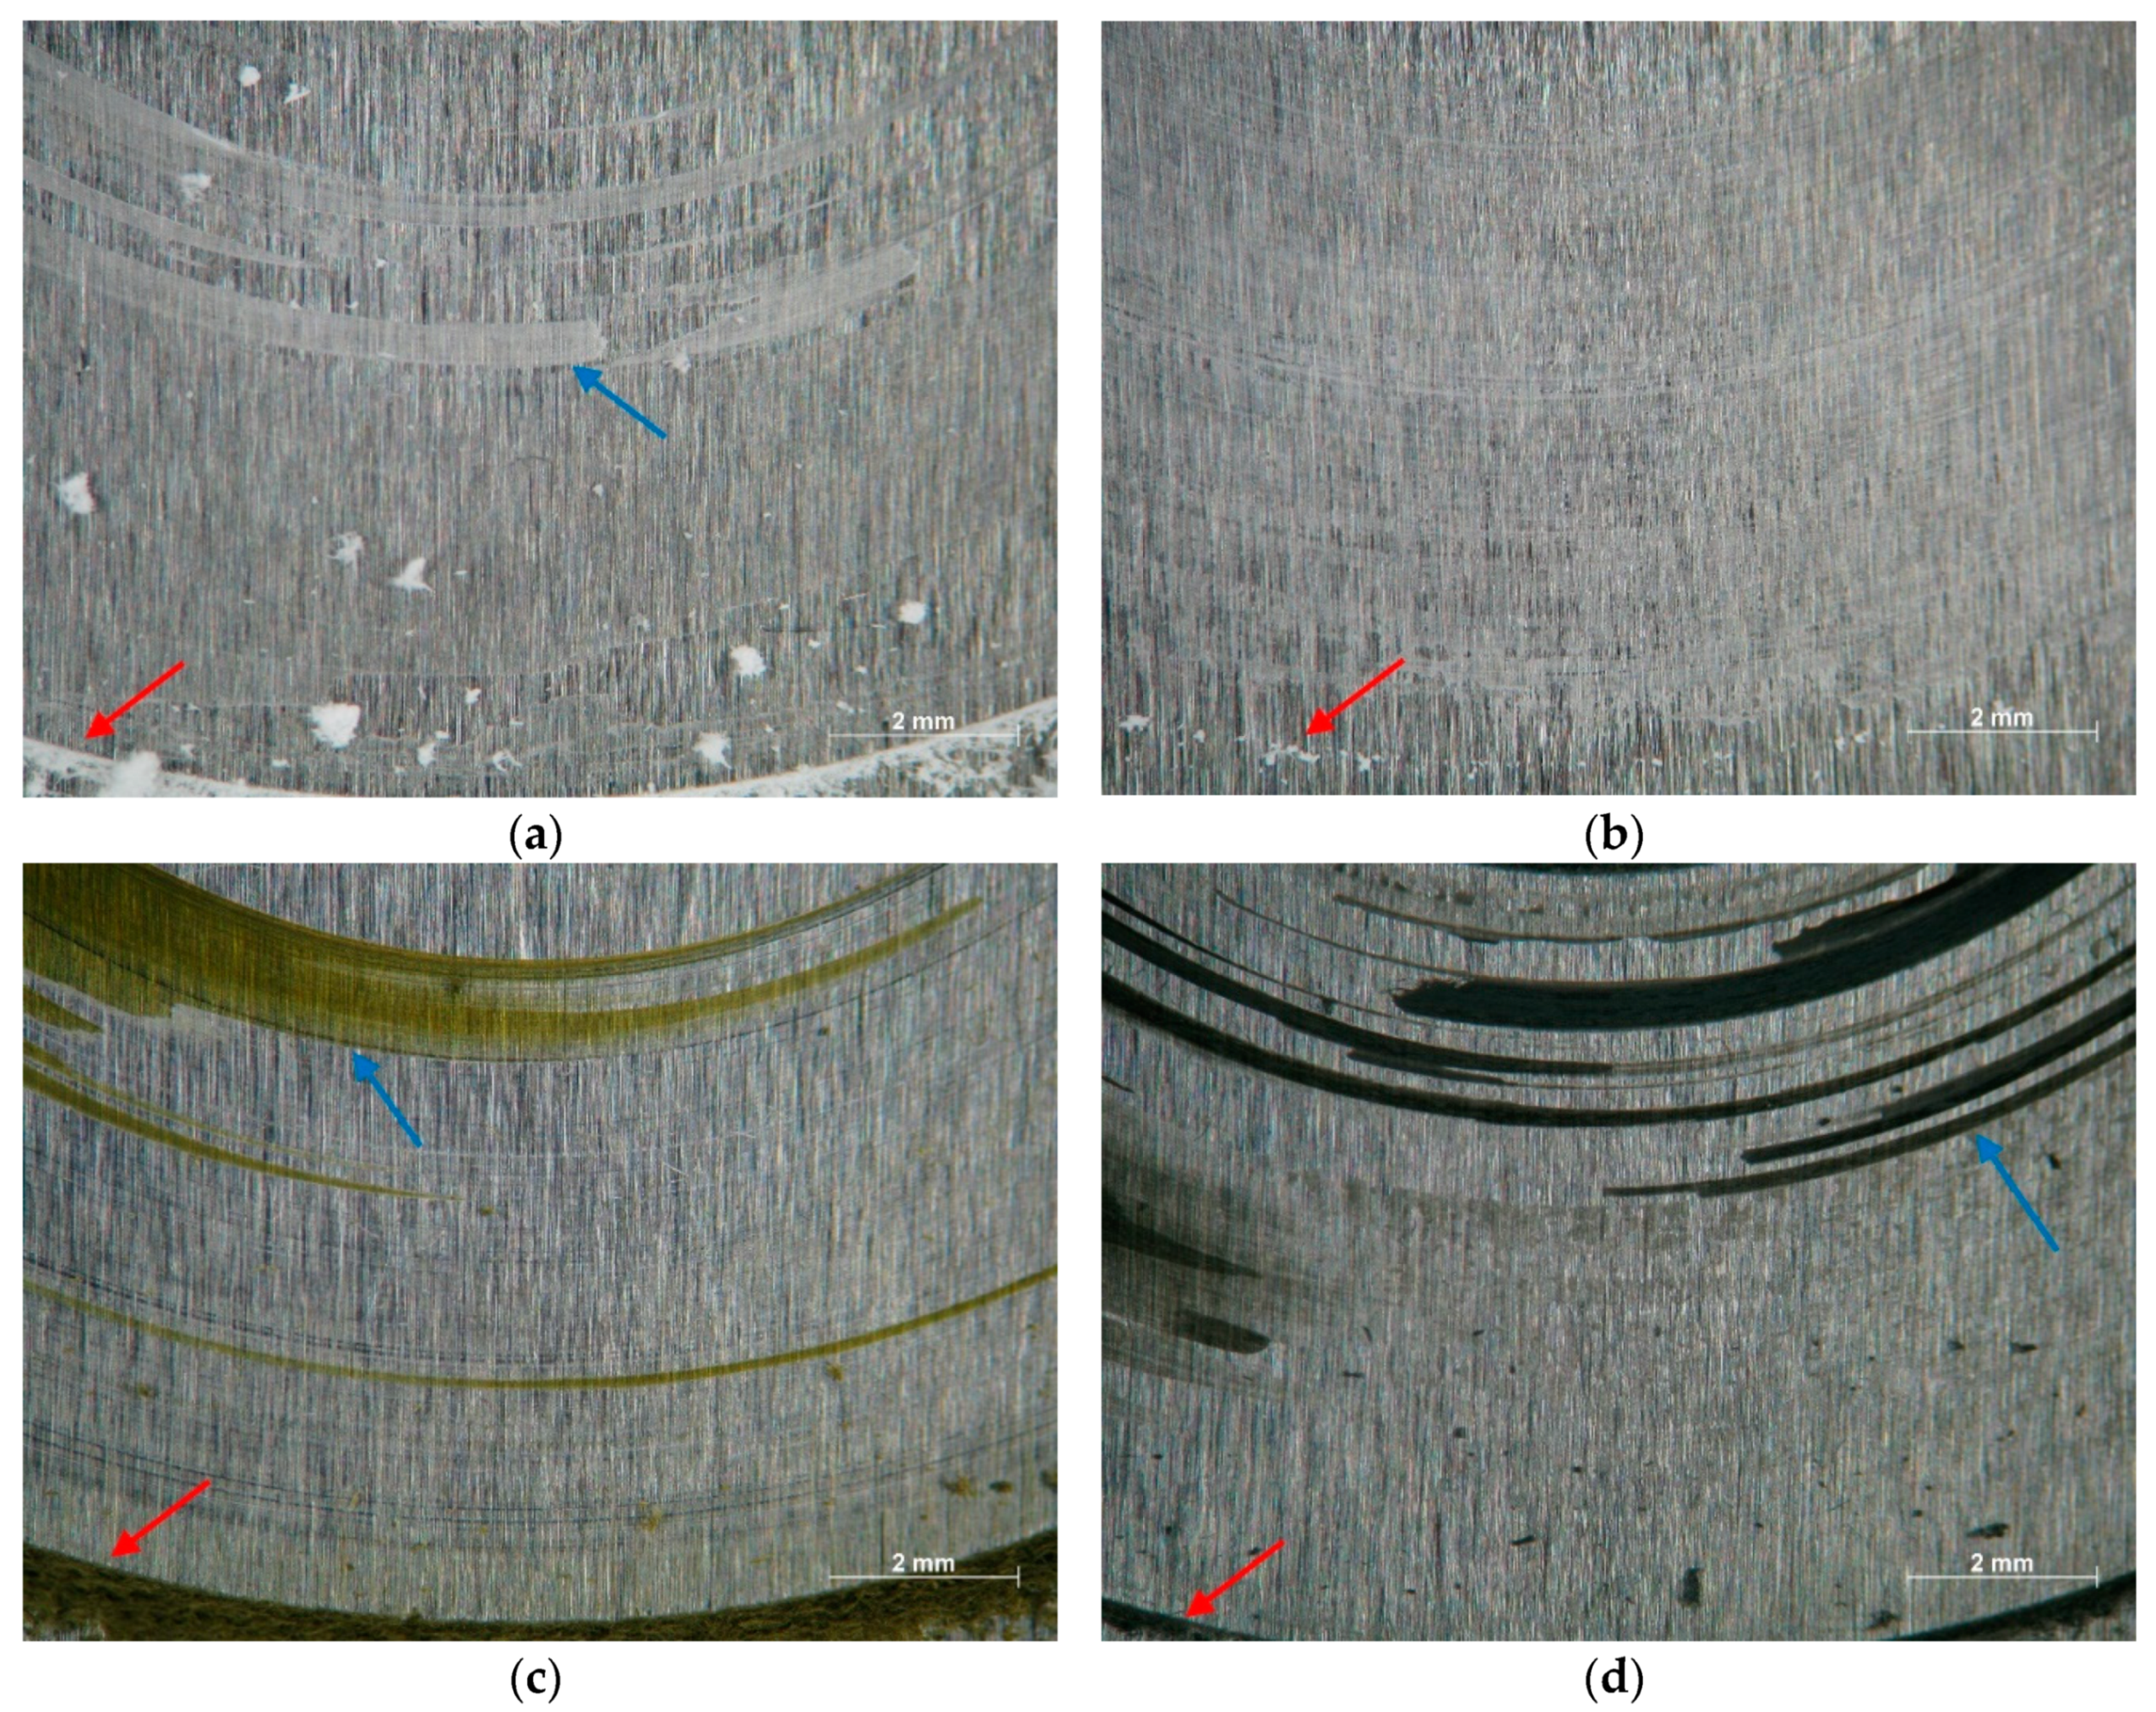
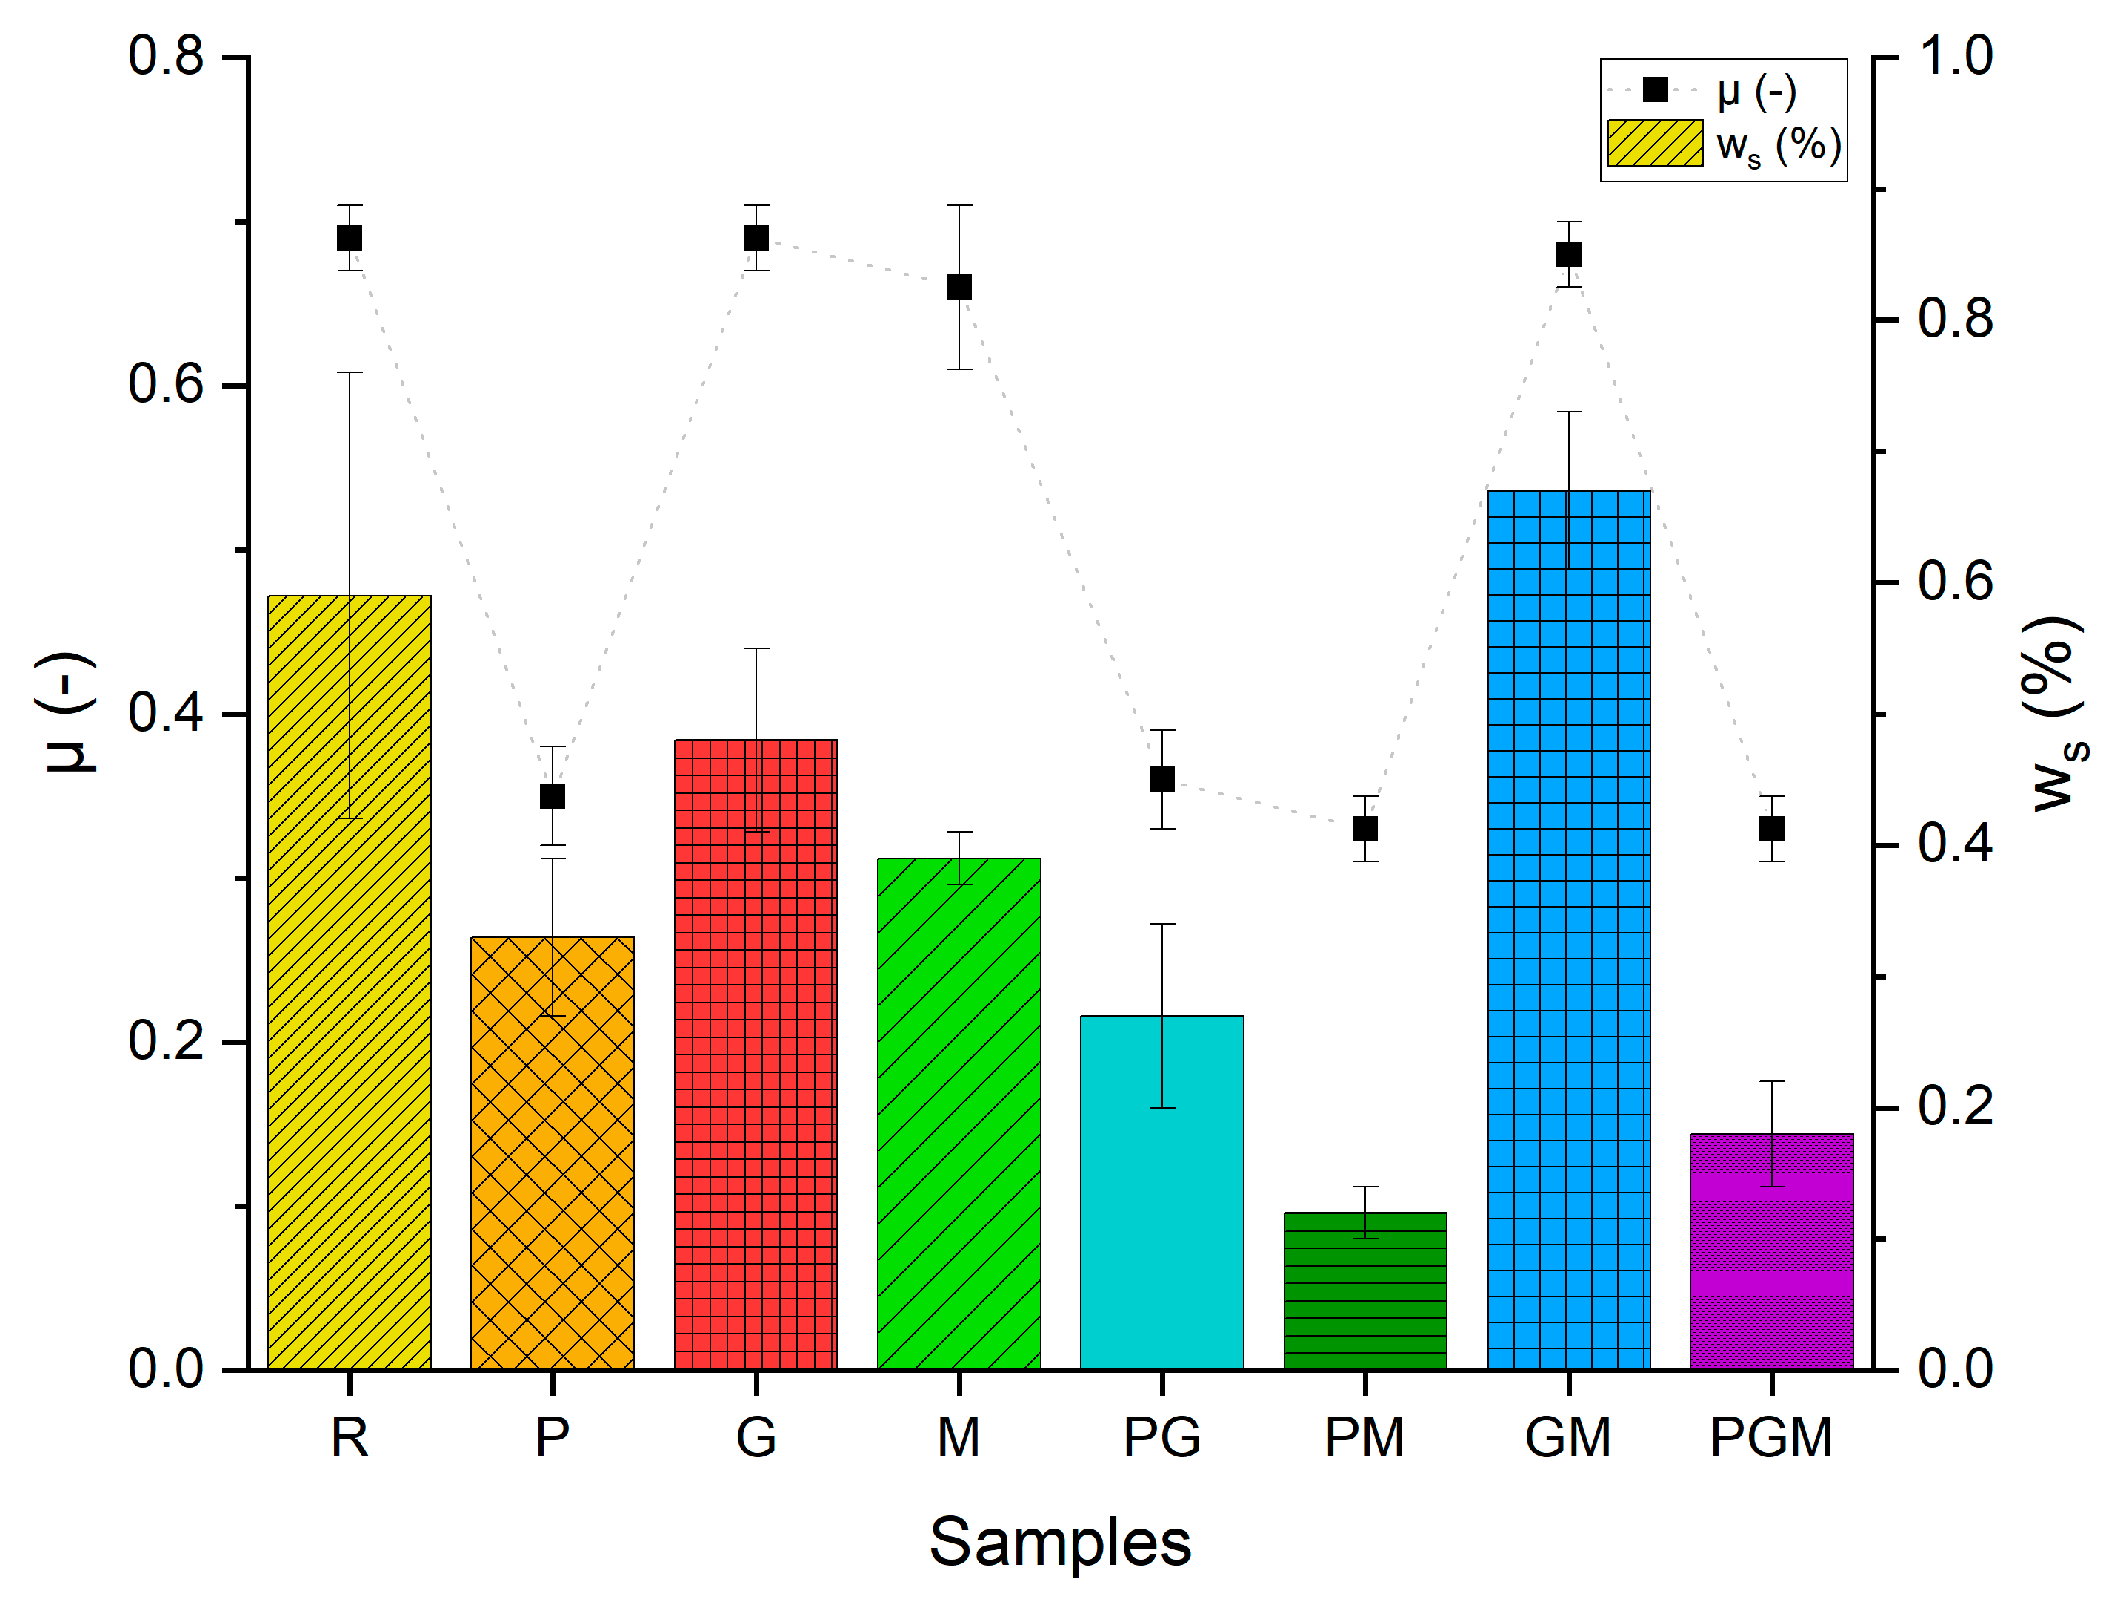
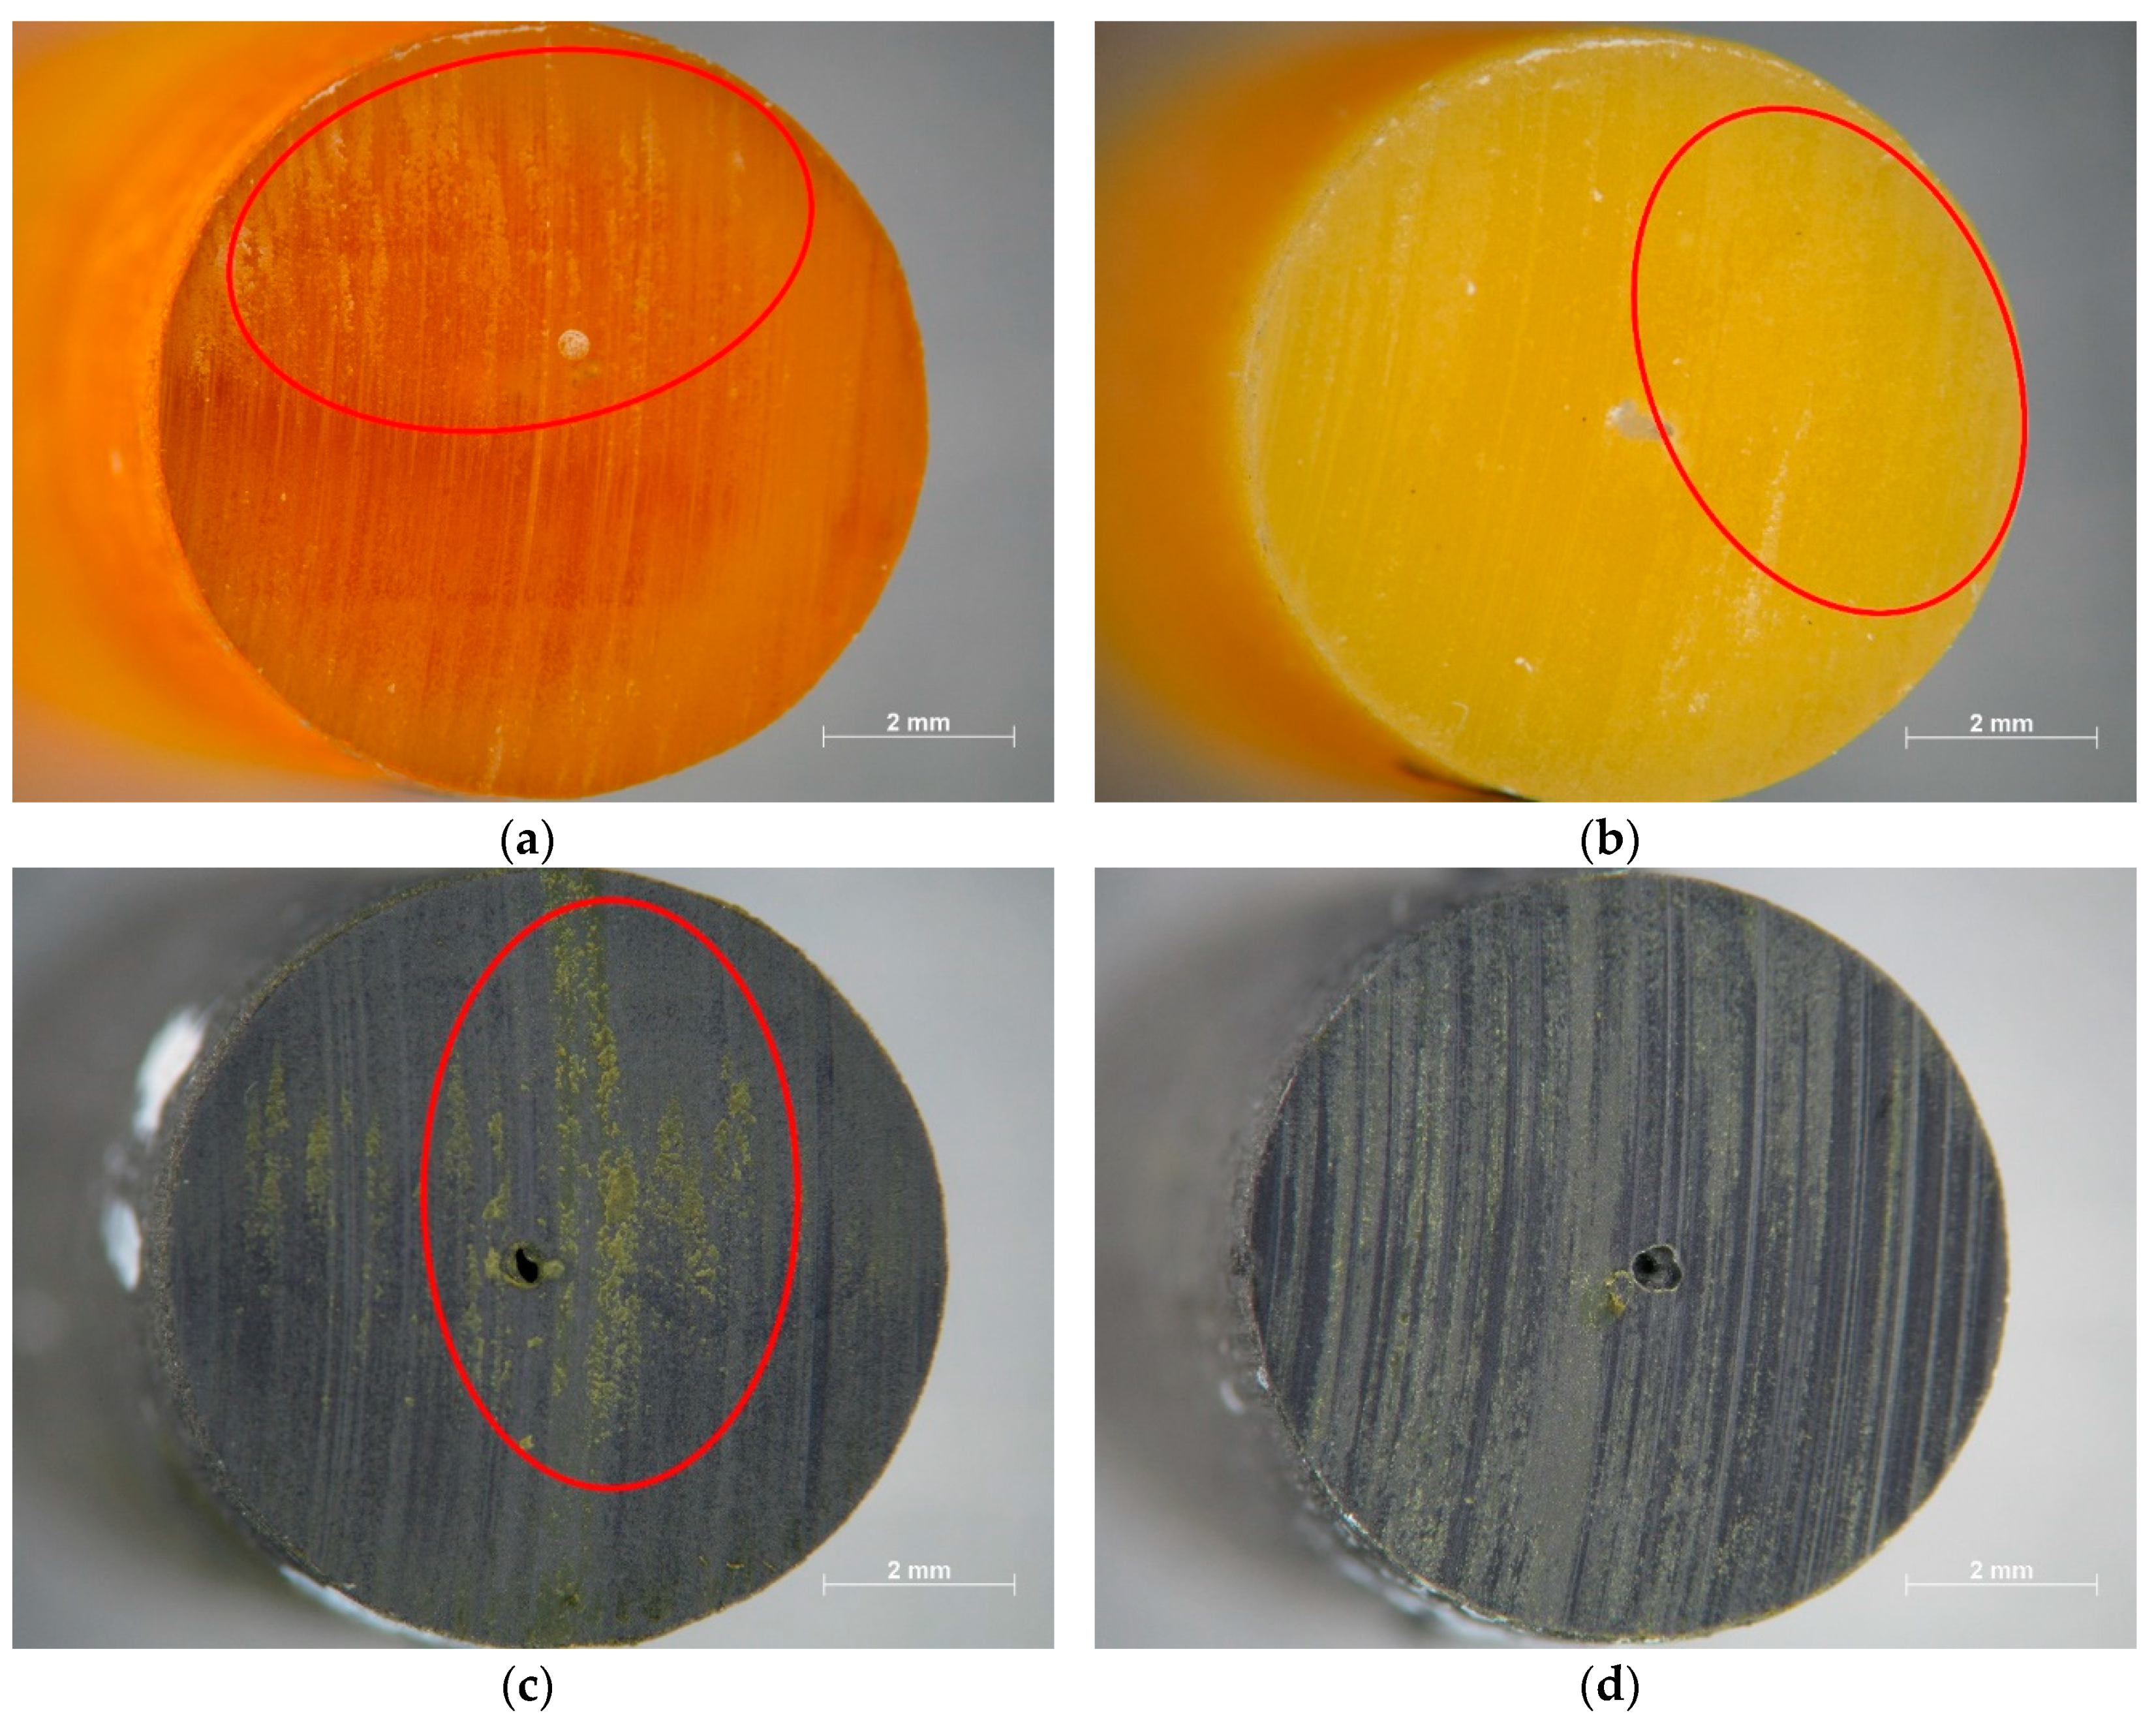
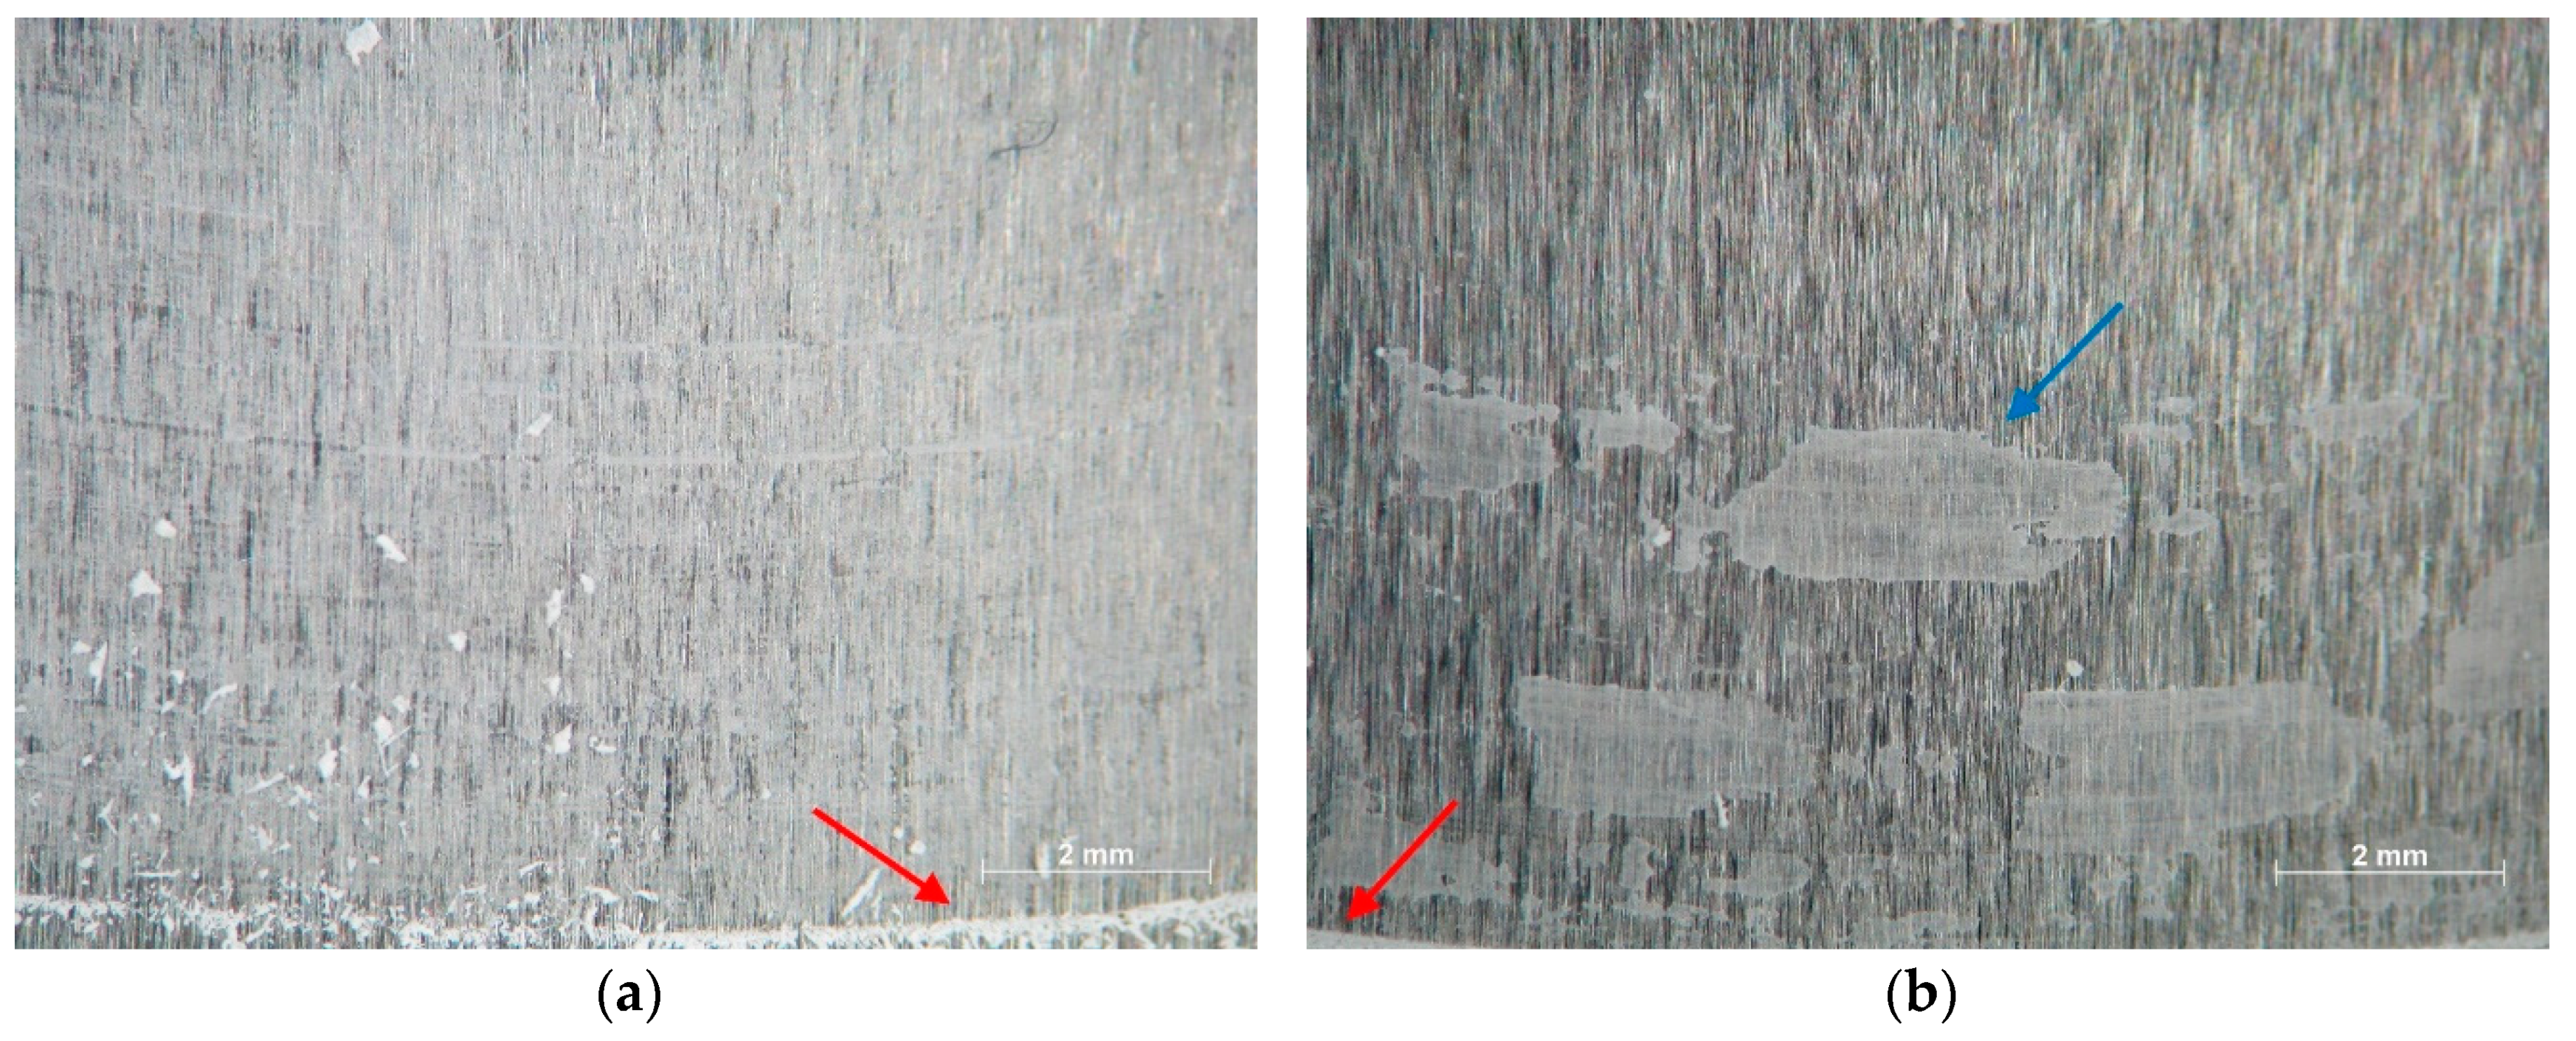
3.6. Tribological Testing and Damage Analysis

Two different testing methods were conducted, first to gain general information about the material behavior and second about the application’s relevant performance. The 250 mm/s unidirectional rotating tests should provide general information about the material behavior, whereas the 500 mm/s cyclic test imitated the application case–drive system for automatic doors. The tribological properties of samples determined using a unidirectional test are presented in Figure 6a. It is obvious that PTFE had the highest effect on the tribological behavior of the 3D printed specimens. All samples containing PTFE exhibited a decrease in µ from values around 0.7 to around 0.5. Samples containing only graphite and MoS2 exhibited similar average values of µ as the unlubricated material. A similar trend was also given for the ws, where all samples containing PTFE exhibited an enormous decline in ws from around 2.5 × 10⁻⁷ cm3/Nm to values ranging from 2.0 × 10⁻⁸ cm3/Nm to 3.0 × 10⁻⁸ cm3/Nm, which is a decrease in order of magnitude. Samples containing only graphite and MoS2 exhibited just a small decrease in ws to the values of 1.8 × 10⁻⁷ cm3/Nm and 2.0 × 10⁻⁷ cm3/Nm, respectively. When looking at Figure 6b, where the µ is presented as a function of sliding time, it is evident that despite the similar average values of µ for samples R, G, and M, the friction development was different. At the beginning of the tests, the µ of samples R, G, and M was in the same range at values around 0.6. The µ of sample R slowly increased over time, whereas the µ of samples G and M quickly increased up the testing time of 5 min, then a more or less steady state was observed. The samples G and M had a lower curing degree and thus also lower modulus, strength, and hardness. At the beginning of the test, when transfer films were not well developed, the harder sample R had lower µ, but, towards the end of the test, the µ of sample R surpassed the µ of samples G and M. On the other hand, PTFE-filled samples exhibited different development of friction, where the µ was much lower and constantly increasing over time at a similar rate. This was ascribed to the quick development of PTFE transfer films that enabled low friction sliding of the pin over the steel counterpart. As the test progressed, the temperature of the specimen was slowly increased, resulting in a decrease of modulus and hardness and an increase in µ.
The tribological behavior can be further explained by looking at the optical micrographs of the tested pins presented in Figure 7. All surfaces of the samples without PTFE were damaged as a result of the combination of adhesive and abrasive wear. This is evident in the regions marked with red ellipses, where specimens had deformed regions that were formed as a result of the softening of the material combined with scratched from abrasive wear. Samples containing graphite and MoS2 had regions where removed material redeposited back on pins (shown by white arrows in Figure 7). Surfaces of the samples filled with PTFE had only slight signs of abrasive wear in the form of small scratches, with some regions having an original surface structure (blue ellipse in Figure 7b). Furthermore, contrary to other samples, the surfaces of PTFE samples were covered with white particles that were ascribed to deposited PTFE powder that was pulled out of the matrix. The samples containing MoS2 had yellow regions present in the material and wear debris, suggesting the involvement of mechanochemical reactions. Under harsh conditions of the tribological test, the MoS2 can decompose by cleavage into Mo and S atoms, which further react with oxygen and iron in the counterpart to form MoO3, FeS, and other oxidized sulfur compounds [26].
Corresponding counterparts presented in Figure 8 further confirm that, for samples without PTFE, both adhesive wear and abrasive wear were present. The regions highlighted with blue arrows had thick transfer film strips present at the counterpart surface. Contrary to thermoplastic materials, thermosets, such as acrylates used in this study, do not melt. Furthermore, thermoset materials are usually harder and exhibit much less plasticity than results in a lower possibility of effective transfer film formation. Nevertheless, most studies report the development of thermoset transfer films when sliding against hard surfaces, such as steel. Samples containing PTFE developed much thinner transfer films with no thick material strips. Thin transfer film has a much higher contact area compared to the area between material strips and the pins, resulting in a higher load transfer capacity. It is well known that PTFE can be easily pulled out of the matrix and deposited on the counterpart in a form of thin third-body transfer film, which reduces the µ and ws by providing low adhesion between the different surfaces. In contrast, the adhesion between thermoset material strips and the specimen is much higher since both materials have the same surface energy and thus strong interactions, resulting in high adhesive wear. A high amount of wear debris (red arrows in Figure 8) was present at the counterparts of samples without PTFE, while counterparts of PTFE-filled samples had only traces of the wear debris present at the counterparts.
A quite similar trend was observed for the cyclic test, with resulting tribological properties presented in Figure 9. For this movement, the µ significantly declined for PTFE-containing samples, but this time to an even greater extent. This could be explained by taking a deeper look into both testing methods as well as on mechanical and thermal properties of samples. During the unidirectional test, the temperature slowly increased to the point of steady-state conditions, where the system achieved the thermodynamic equilibrium. This effect is nicely illustrated by the friction development curves in Figure 6b, where reference and PTFE-containing samples exhibited a constant increase in friction as a result of heat development and softening of the material. In contrast, graphite-containing samples quickly reached the steady state. During the cycling test, the specimen is subjected to only 10 s of sliding, followed by 8 s of resting time. Since there is no friction during the resting time, no heat is developed, which allows for the fast cooling of the specimen surface by conductive heat transfer into highly conductive steel parts. This should result in much lower overall heat development, which, combined with high dependence of mechanical properties, discussed in Section 3.5, results in much lower µ of well-performing systems. Furthermore, during the cyclic test, the velocity was constantly changing, and it reached much higher values than during the cyclic test. Combined with the fact that the viscoelastic properties of polymers are time dependent, this will result in totally different material behavior, even at the same temperature. The described behavior of the investigated tribological systems has important implications in terms of the practical applications of the materials. Photocurable resins based on the investigated compositions are more suitable for low-temperature applications without significant heat development during an operation, which results in an increased temperature and in turn deteriorated tribological performance. The ws of lubricated samples was again decreased compared to the reference material similarly as in the unidirectional test, but, this time, an addition of PTFE provided less benefit. In the unidirectional test, the PTFE provided an enormous decrease in wear in order of magnitude, while, in the cyclic test, the wear was only decreased approximately by two-fold. The MoS2-containing sample closely followed the PTFE, with an only slight difference in wear, while the graphite-containing sample performed the worst among lubricated materials. In the case of the cyclic test, the performance of PTFE containing a hybrid lubricant system was significantly better, especially for the MoS2-containing samples, indicating a synergistic effect between the PTFE and MoS2.
The tribological performance of samples can be well explained by looking at the micrographs of the tested pins presented in Figure 10 combined with counterparts presented in Figure 11. After the cyclic test, all samples were damaged as a result of both abrasive and adhesive wear. It seems that the adhesive wear was more dominant compared to the unidirectional test, with large damaged regions present at the surfaces of the specimens (red ellipses). This time, PTFE also containing samples had visible damage caused by adhesive wear. The surface of the PM sample (Figure 11c) had similar damage, combining both signs of adhesive and abrasive wear, but to a much lesser extent, with less deep scratches.
Looking at the micrographs of corresponding counterparts shown in Figure 11 gives further hints on present wear mechanisms. The surface of a counterpart of the reference sample (Figure 11a) was covered with a transfer film, this time without visible strips (Figure 11a). On the other hand, PTFE-containing samples (Figure 11b) left similar strips of material on the surface of counterparts as samples without PTFE in a unidirectional test. This can be explained by the nature of the two tests. During the unidirectional tests, the transfer film can be much more easily developed and maintained since there is no changing of moving direction. Meanwhile, during the cyclic tests, the transfer film can get easily destroyed by the change of the direction. Here, the adhesion of the transfer film to the counterpart plays a much higher role than in unidirectional tests. Counterparts of MoS2-containing samples were covered with small lumps of material (blue arrows in Figure 11a,b) that were quite uniformly distributed over the surface, combined with thin transfer film, visible by the yellow color. This “lumpy transfer” is a common transfer mechanism for polymers that do not result in improved wear and friction characteristics. Therefore, the most benefit of MoS2 to the friction and wear should come from a thin layer of transfer film. It seems that this type of transfer layer was best developed for the MoS2-containing samples. This may be linked back to the mechanochemical reactions between the MoS2 and the steel. It has been suggested that the formation of FeS on the counterparts should lead to enhanced adhesion of the slide layers to the counterparts [26]. Enhanced adhesion may be responsible for the good performance of the sample PM in the cycling test, where transfer film can be easily destroyed. Similarly, as for the unidirectional test, counterparts of poor-performing samples had a high amount of wear debris, marked with red arrows at the bottom of the micrographs in Figure 11.

4. Conclusions

In the present study, the photocurable resins for additive manufacturing with improved tribological properties were successfully prepared by modifying photocurable acrylates with different solid lubricants. The solid lubricants reduced the coefficient of friction and wear rate of 3D printed parts in the order of PTFE > MoS2 > graphite. The resins with the hybrid filler system (PTFE/MoS2) exhibited the best overall tribological properties, indicating a synergistic effect between the PTFE and MoS2. Compared to the unmodified photocurable resins, filled systems exhibited a reduced coefficient of friction and wear rate up to 52% and 92%, respectively. The developed photocurable resins are suitable for AM of components, which are not subjected to high temperatures and where a good damping performance is desired. Although present research provides information about the principal effects of the solid lubricants on the properties of photocurable resins, the effect of shape and particle size of the fillers was not explored and presents a potential direction for further research. This paper tries to provide basic guidelines for improving the tribological performance of photocurable resins for VPP and points out a few potential advantages of VPP for the production of tribological components, namely, high building accuracy and surface finish, a simple modification of the resins, ability to fine-tune the material viscoelastic spectrum, and low anisotropy of 3D printed parts. Despite the promising results of this study, additional effort is required for further development of VPP to the point that it is ready for industrial implementation. With the large pool of different commercially available building blocks (monomers and oligomers) and additives, combined with ease of material modification and rise of low-cost VPP 3D printers, there seems to be a great potential for further improving the tribological properties of VPP 3D printed parts and developing this field.

Author Contributions

Conceptualization, J.S., T.W. and A.H.; methodology, J.S., A.H.; validation, J.S., T.S., T.W. and A.H.; formal analysis, J.S., T.S. and A.H.; investigation, J.S., T.S. and A.H.; resources J.S., T.W. and A.H.; data curation, J.S and A.H.; writing—original draft preparation, J.S.; writing—review and editing, J.S., T.S. and A.H.; visualization, J.S., T.S.; supervision, T.W. and A.H.; project administration, J.S., T.W. and A.H.; funding acquisition, J.S., T.W. and A.H. All authors have read and agreed to the published version of the manuscript.

Funding

This research was funded by Doorson d.o.o. (Slovenia), Faculty of Polymer Technology (Slovenia) and Polymer Competence Center Leoben (PCCL).

Conflicts of Interest

The authors declare no conflict of interest.

References

  1. Bell, P.C. Mechanical Power Transmission; Bell, P.C., Ed.; Palgrave Macmillan Press Limited: London, UK, 1971; ISBN 978-1-349-01197-1. [Google Scholar]
  2. Hu, C.; Smith, W.A.; Randall, R.B.; Peng, Z. Development of a gear vibration indicator and its application in gear wear monitoring. Mech. Syst. Signal Process. 2016, 76–77, 319–336. [Google Scholar] [CrossRef]
  3. Radzevich, S.P. Dudley’s Handbook of Practical Gear Design and Manufacture, 2nd ed.; Radzevich, S.P., Ed.; CRC Press: Boca Raton, FL, USA, 2012; ISBN 9780429109065. [Google Scholar]
  4. Kirupasankar, S.; Gurunathan, C.; Gnanamoorthy, R. Transmission efficiency of polyamide nanocomposite spur gears. Mater. Des. 2012, 39, 338–343. [Google Scholar] [CrossRef]
  5. Senthilvelan, S.; Gnanamoorthy, R. Fiber reinforcement in injection molded nylon 6/6 spur gears. Appl. Compos. Mater. 2006, 13, 237–248. [Google Scholar] [CrossRef]
  6. Li, S.; Vaidyanathan, A.; Harianto, J.; Kahraman, A. Influence of design parameters on mechanical power losses of helical gear pairs. J. Adv. Mech. Des. Syst. Manuf. 2009, 3, 146–158. [Google Scholar] [CrossRef] [Green Version]
  7. Wang, X.Y.; Shi, Z.Y.; Shu, Z.H.; Fu, S. Study on evaluation system of gear accuracy based on statistical analysis. In Proceedings of the International Gear Conference 2014, Lyon, France, 26–28 August 2014; pp. 905–913. [Google Scholar]
  8. Bhushan, B. Principles and Applications of Tribology, 2nd ed.; John Wiley & Sons, Ltd.: Chichester, UK, 2013; ISBN 9781118403020. [Google Scholar]
  9. Plastics, G.E. A Guide to Plastic Gearing; General Electric Company: Boston, MA, USA, 2006. [Google Scholar]
  10. Attaran, M. The rise of 3-D printing: The advantages of additive manufacturing over traditional manufacturing. Bus. Horiz. 2017, 60, 677–688. [Google Scholar] [CrossRef]
  11. Li, N.; Huang, S.; Zhang, G.; Qin, R.; Liu, W.; Xiong, H.; Shi, G.; Blackburn, J. Progress in additive manufacturing on new materials. J. Mater. Sci. Technol. 2019, 35, 242–269. [Google Scholar] [CrossRef]
  12. Gibson, I.; Rosen, D.; Stucker, B. Additive Manufacturing Technologies: 3D Printing, Rapid Prototyping, and Direct Digital Manufacturing, 2nd ed.; Springer: New York, NY. USA, 2015; ISBN 9781493921133. [Google Scholar]
  13. ISO/ASTM 52900:2015 Standard Terminology for Additive Manufacturing–General Principles–Terminology; International Organization for Standardization: Geneva, Switzerland, 2015.
  14. Berger, U.; Mäule, B. Rapid manufacturing of high reduction polymer gears by use of stereolithography. In Proceedings of the 2009 IEEE/ASME International Conference on Advanced Intelligent Mechatronics, Singapore, 14–17 July 2009; pp. 613–617. [Google Scholar]
  15. Berger, U. Aspects of accuracy and precision in the additive manufacturing of plastic gears. Virtual Phys. Prototyp. 2015, 10, 49–57. [Google Scholar] [CrossRef]
  16. Friedrich, K. Polymer composites for tribological applications. Adv. Ind. Eng. Polym. Res. 2018, 1, 3–39. [Google Scholar] [CrossRef]
  17. Liu, J.; Gaynor, A.T.; Chen, S.; Kang, Z.; Suresh, K.; Takezawa, A.; Li, L.; Kato, J.; Tang, J.; Wang, C.C.L.; et al. Current and future trends in topology optimization for additive manufacturing. Struct. Multidiscip. Optim. 2018, 57, 2457–2483. [Google Scholar] [CrossRef] [Green Version]
  18. Ramadani, R.; Belsak, A.; Kegl, M.; Predan, J.; Pehan, S. Topology optimization based design of lightweight and low vibration gear bodies. Int. J. Simul. Model. 2018, 17, 92–104. [Google Scholar] [CrossRef]
  19. Dawoud, M.; Taha, I.; Ebeid, S.J. Mechanical behaviour of ABS: An experimental study using FDM and injection moulding techniques. J. Manuf. Process. 2016, 21, 39–45. [Google Scholar] [CrossRef]
  20. Amiruddin, H.; Abdollah, M.F.B.; Norashid, N.A. Comparative study of the tribological behaviour of 3D-printed and moulded ABS under lubricated condition. Mater. Res. Express 2019, 6, 085328. [Google Scholar] [CrossRef]
  21. Boparai, K.; Singh, R.; Singh, H. Comparison of tribological behaviour for Nylon6-Al-Al2O3 and ABS parts fabricated by fused deposition modelling. Virtual Phys. Prototyp. 2016, 10, 59–66. [Google Scholar] [CrossRef]
  22. Singh, R.; Singh, S.; Fraternali, F. Development of in-house composite wire based feed stock filaments of fused deposition modelling for wear-resistant materials and structures. Compos. Part B 2016, 98, 244–249. [Google Scholar] [CrossRef]
  23. Golbang, A.; Harkin-Jones, E.; Wegrzyn, M.; Campbell, G.; Archer, E.; McIlhagger, A. Production and characterization of PEEK/IF-WS2 nanocomposites for additive manufacturing: Simultaneous improvement in processing characteristics and material properties. Addit. Manuf. 2020, 31, 100920. [Google Scholar] [CrossRef]
  24. Arif, M.F.; Alhashmi, H.; Varadarajan, K.M.; Koo, J.H.; Hart, A.J.; Kumar, S. Multifunctional performance of carbon nanotubes and graphene nanoplatelets reinforced PEEK composites enabled via FFF additive manufacturing. Compos. Part B Eng. 2020, 184, 107625. [Google Scholar] [CrossRef]
  25. Dawoud, M.; Taha, I.; Ebeid, S.J. Effect of processing parameters and graphite content on the tribological behaviour of 3D printed acrylonitrile butadiene styrene. Materwiss Werksttech 2015, 46, 1185–1195. [Google Scholar] [CrossRef]
  26. Bai, J.; Song, J.; Wei, J. Tribological and mechanical properties of MoS2 enhanced polyamide 12 for selective laser sintering. J. Mater. Process. Technol. 2019, 264, 382–388. [Google Scholar] [CrossRef]
  27. Esakki, B.; Rajamani, D.; Arunkumar, P. Modeling and prediction of optimal process parameters in wear behaviour of selective inhibition sintered high density polyethylene parts. Prog. Addit. Manuf. 2018, 3, 109–121. [Google Scholar] [CrossRef]
  28. Palma, T.; Munther, M.; Damasus, P.; Salari, S.; Beheshti, A.; Davami, K. Multiscale mechanical and tribological characterizations of additively manufactured polyamide 12 parts with different print orientations. J. Manuf. Process. 2019, 40, 76–83. [Google Scholar] [CrossRef]
  29. Hull, C.W. Apparatus for Production of Three-Dimensional Objects by Stereolithography. U.S. Patent 4575330A, 11 March 1986. [Google Scholar]
  30. Shusteff, M.; Browar, A.E.M.; Kelly, B.E.; Henriksson, J.; Weisgraber, T.H.; Panas, R.M.; Fang, N.X.; Spadaccini, C.M. One-step volumetric additive manufacturing of complex polymer structures. Sci. Adv. 2017, 3, eaao5496. [Google Scholar] [CrossRef] [PubMed] [Green Version]
  31. Schwartz, J.J.; Boydston, A.J. Multimaterial actinic spatial control 3D and 4D printing. Nat. Commun. 2019, 10, 1–10. [Google Scholar] [CrossRef] [PubMed]
  32. Maruo, S.; Ikuta, K. Submicron stereolithography for the production of freely movable mechanisms by using single-photon polymerization. Sensors Actuators A Phys. 2002, 100, 70–76. [Google Scholar] [CrossRef]
  33. Emons, M.; Obata, K.; Binhammer, T.; Ovsianikov, A.; Chichkov, B.N.; Morgner, U. Two-photon polymerization technique with sub-50 nm resolution by sub-10 fs laser pulses. Opt. Mater. Express 2012, 2, 942–947. [Google Scholar] [CrossRef]
  34. Stampfl, J.; Baudis, S.; Heller, C.; Liska, R.; Neumeister, A.; Kling, R.; Ostendorf, A.; Spitzbart, M. Photopolymers with tunable mechanical properties processed by laser-based high-resolution stereolithography. J. Micromech. Microeng. 2008, 18, 125014. [Google Scholar] [CrossRef]
  35. Slapnik, J.; Pulko, I. Tailoring properties of photopolymers for additive manufacturing with mixture design. Prog. Addit. Manuf. 2020. [Google Scholar] [CrossRef]
  36. Malas, A.; Isakov, D.; Couling, K.; Gibbons, G.J. Fabrication of high permittivity resin composite for vat photopolymerization 3D printing: Morphology, thermal, dynamic mechanical and dielectric properties. Materials 2019, 12, 3818. [Google Scholar] [CrossRef] [Green Version]
  37. Zuo, Y.; Yao, Z.; Lin, H.; Zhou, J.; Lu, J.; Ding, J. Digital light processing 3D printing of graphene/carbonyl iron/polymethyl methacrylate nanocomposites for efficient microwave absorption. Compos. Part B 2019, 179, 107533. [Google Scholar] [CrossRef]
  38. Markandan, K.; Lai, C.Q. Enhanced mechanical properties of 3D printed graphene-polymer composite lattices at very low graphene concentrations. Compos. Part A Appl. Sci. Manuf. 2020, 129, 105726. [Google Scholar] [CrossRef]
  39. Gonçalves, M.W.; Salmoria, G.V.; Ahrens, C.H.; Pouzada, A.S. Study of tribological properties of moulds obtained by stereolithography. Virtual Phys. Prototyp. 2007, 2, 29–36. [Google Scholar] [CrossRef] [Green Version]
  40. Slapnik, J.; Gradec, S.; Stiller, T.; Competence, P.; Hausberger, A.; Competence, P. Stereolitografija: Pripravljena na izdelavo končnih izdelkov? In Vir Znanja in Izkušenj za Stroko: Zbornik Foruma, Proceedings of the 11. Industrijski Forum IRT, Portorož, Slovenia, 3–4 July 2019; Profidtp: Škofljica, Slovenia, 2010; pp. 47–250. [Google Scholar]
  41. Dunnigan, R.; Clemens, J.; Cavalli, M.N.; Kaabouch, N.; Gupta, S. Beneficial usage of recycled polymer particulates for designing novel 3D printed composites. Prog. Addit. Manuf. 2018, 3, 33–38. [Google Scholar] [CrossRef]
  42. Alajmi, M.; Alrashdan, K.R.; Alsaeed, T.; Shalwan, A. Tribological characteristics of graphite epoxy composites using adhesive wear experiments. J. Mater. Res. Technol. 2020, 9, 13671–13681. [Google Scholar] [CrossRef]
  43. Li, X.; Gao, Y.; Xing, J.; Wang, Y.; Fang, L. Wear reduction mechanism of graphite and MoS2 in epoxy composites. Wear 2004, 257, 279–283. [Google Scholar] [CrossRef]
  44. Padhan, M.; Marathe, U.; Bijwe, J. A complex interdependence of thermal conductivity and lubricity of two solid lubricants to control the tribo-performance of PAEK based composites. Wear 2020, 458–459, 203406. [Google Scholar] [CrossRef]
  45. Bajpai, A.; Saxena, P.; Kunze, K. Tribo-mechanical characterization of carbon fiber-reinforced cyanate ester resins modified with fillers. Polymers 2020, 12, 1725. [Google Scholar] [CrossRef]
  46. Zhang, X.; Liao, G.; Jin, Q.; Feng, X.; Jian, X. On dry sliding friction and wear behavior of PPESK filled with PTFE and graphite. Tribol. Int. 2008, 41, 195–201. [Google Scholar] [CrossRef]
  47. Halloran, J.W. Ceramic stereolithography: Additive manufacturing for ceramics by photopolymerization. Annu. Rev. Mater. Res. 2016, 46, 19–40. [Google Scholar] [CrossRef]
  48. Frankel, N.A.; Acrivos, A. On the viscosity of a concentrated suspension of solid spheres. Chem. Eng. Sci. 1967, 22, 847–853. [Google Scholar] [CrossRef]
  49. Salonitis, K. Stereolithography. Compr. Mater. Process. 2014, 10, 19–67. [Google Scholar]
  50. Dworak, C.; Kopeinig, S.; Hoffmann, H.; Liska, R. Photoinitiating monomers based on Di- and Triacryloylated hydroxylamine derivatives. J. Polym. Sci. Part A Polym. Chem. 2008, 47, 392–403. [Google Scholar] [CrossRef]
  51. Schuster, M.; Turecek, C.; Mateos, A.; Stampfl, J.; Liska, R.; Varga, F. Evaluation of Biocompatible Photopolymers II: Further Reactive Diluents. Monatshefte Für Chemie-Chem. Mon. 2007, 138, 261–268. [Google Scholar] [CrossRef]
  52. Skorb, E.V.; Ustinovich, E.A.; Kulak, A.I.; Sviridov, D.V. Photocatalytic activity of TiO2:In2O3 nanocomposite films towards the degradation of arylmethane and azo dyes. J. Photochem. Photobiol. A Chem. 2008, 193, 97–102. [Google Scholar] [CrossRef]
  53. Chand, N.; Sharma, P.; Fahim, M. Correlation of mechanical and tribological properties of organosilane modified cenosphere filled high density polyethylene. Mater. Sci. Eng. A 2010, 527, 5873–5878. [Google Scholar] [CrossRef]
  54. Alajmi, M.; Shalwan, A. Correlation between mechanical properties with specific wear rate and the coefficient of friction of graphite/epoxy composites. Materials 2015, 8, 4162–4175. [Google Scholar] [CrossRef] [PubMed] [Green Version]
  55. Ligon-Auer, S.C.; Schwentenwein, M.; Gorsche, C.; Stampfl, J.; Liska, R. Toughening of photo-curable polymer networks: A review. Polym. Chem. 2016, 7, 257–286. [Google Scholar] [CrossRef]
  56. Popescu, D.; Zapciu, A.; Amza, C.; Baciu, F.; Marinescu, R. FDM process parameters influence over the mechanical properties of polymer specimens: A review. Polym. Test. 2018, 69, 157–166. [Google Scholar] [CrossRef]
  57. Raju, B.S.; Shekar, U.C.; Venkateswarlu, K.; Drakashayani, D.N. Establishment of process model for rapid prototyping technique (stereolithography) to enhance the part quality by Taguchi method. Procedia Technol. 2014, 14, 380–389. [Google Scholar] [CrossRef] [Green Version]
  58. Dorfinger, P.; Stampfl, J.; Liska, R. Toughening of photopolymers for stereolithography (SL). Mater. Sci. Forum 2015, 825–826, 53–59. [Google Scholar] [CrossRef]
  59. Steyrer, B.; Busetti, B.; Harakály, G.; Liska, R.; Stampfl, J. Hot Lithography vs. room temperature DLP 3D-printing of a dimethacrylate. Addit. Manuf. 2018, 21, 209–214. [Google Scholar] [CrossRef]
  60. Sathees Kumar, S.; Kanagaraj, G. Investigation on mechanical and tribological behaviors of PA6 and graphite-reinforced PA6 polymer composites. Arab. J. Sci. Eng. 2016, 41, 4347–4357. [Google Scholar] [CrossRef]
  61. Panin, S.V.; Kornienko, L.A.; Nguen Suan, T.; Ivanova, L.R.; Poltaranin, M.A.; Shil’ko, S.V. Wear resistance of composites based on ultrahigh molecular weight polyethylene filled with graphite and molybdenum disulfide microparticles. J. Frict. Wear 2014, 35, 290–296. [Google Scholar] [CrossRef]
  62. Diani, J.; Gall, K. Microstructure, thermal, physico–mechanical and tribological characteristics of molybdenum disulphide-filled polyamide 66/carbon black composites. Polym. Eng. Sci. 2013, 53, 1676–1686. [Google Scholar]
  63. Menard, K. Dynamic Mechanical Analysis: A Practical Introduction, 2nd ed.; CRC Press: Boca Raton, FL, USA, 2008; ISBN 9781420053128. [Google Scholar]
Figure 1. Double bond conversion of the unmodified resin and resins modified with different solid lubricants (polytetrafluoroethylene (PTFE), graphite and MoS2) after 3D printing and after post-curing: (a) side with first 3D printed layers, (b) side with the last 3D printed layers.
Lubricants 08 00104 g001
Figure 2. Tensile modulus, strength, and strain at break of the unmodified resin and resins modified with different solid lubricants (PTFE, graphite and MoS2).
Lubricants 08 00104 g002
Figure 3. Charpy impact strength of unmodified resin and resins modified with different solid lubricants (PTFE, graphite and MoS2).
Lubricants 08 00104 g003
Figure 4. Shore D hardness of unmodified resin and resins modified with different solid lubricants (PTFE, graphite and MoS2).
Lubricants 08 00104 g004
Figure 5. Dynamic mechanical properties of the unmodified resin and resins modified with different solid lubricants (PTFE, graphite and MoS2): (a) dynamic mechanical analysis (DMA) thermograms of the PTFE-filled resin (storage modulus—black curve, loss modulus—red curve, tan delta—blue curve); (b) storage modulus at 30 °C; (c) storage modulus at 70 °C; (d) glass transition temperatures.
Lubricants 08 00104 g005
Figure 6. Tribological properties of the unmodified resin and resins modified with different solid lubricants (PTFE, graphite and MoS2): determined using a unidirectional test at 250 mm/s: (a) coefficient of friction and wear rate of samples; (b) coefficient of friction as a function of sliding time for the reference resin and PTFE, graphite and MoS2 modified resins.
Lubricants 08 00104 g006
Figure 7. Optical micrographs of the pins after the unidirectional test at 250 mm/s: (a) reference resin; (b) PTFE-filled resin; (c) graphite-filled resin; (d) MoS2-filled resin.
Lubricants 08 00104 g007
Figure 8. Optical micrographs of steel counterparts after the unidirectional test at 250 mm/s: (a) reference resin; (b) PTFE-filled resin; (c) graphite-filled resin; (d) MoS2-filled resin.
Lubricants 08 00104 g008
Figure 9. Wear rate and coefficient of friction of the unmodified resin and resins modified with different solid lubricants (PTFE, graphite and MoS2) determined using a cyclic test at 500 mm/s.
Lubricants 08 00104 g009
Figure 10. Optical micrographs of pins after a cyclic test at 500 mm/s: (a) reference resin; (b) PTFE-filled resin; (c) graphite-filled resin; (d) PTFE and MoS2-filled resin.
Lubricants 08 00104 g010
Figure 11. Optical micrographs of steel counterparts after a cyclic test at 500 mm/s: (a) reference resin; (b) PTFE-filled resin; (c) graphite-filled resin; (d) PTFE and MoS2-filled resin.
Lubricants 08 00104 g011aLubricants 08 00104 g011b
Table 1. Concentrations of the fillers in samples.
SamplePTFE (%)Graphite (%)MoS2 (%)
R///
P5//
G/1/
M//1.6
PG510
PM5/1.6
GM/0.50.8
PGM50.50.8
Table 2. Processing conditions used for the preparation of the test specimens.
ParameterValue
Vat floorFluorinated ethylene propylene
Layer height50 µm
Curing time of first layers30 s
Number of first layers3
Curing time15 s
Resting time before curing2 s
Build platform lift height3 mm
Lift speed30 mm/s
Retraction speed150 mm/s
Publisher’s Note: MDPI stays neutral with regard to jurisdictional claims in published maps and institutional affiliations.

