Numerical Methodology for Determining the Energy Losses in Auxiliary Systems and Friction Processes Applied to Low Displacement Diesel Engines

Abstract
1. Introduction
2. Energy Loss Models for Auxiliary Systems
2.1. Fuel Injection System
2.2. Lubrication System
2.3. Cooling System
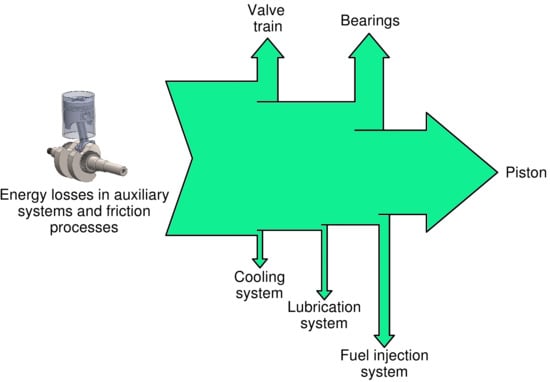
3. Energy Loss Models for Friction Processes
3.1. Energy Losses in the Valve Train
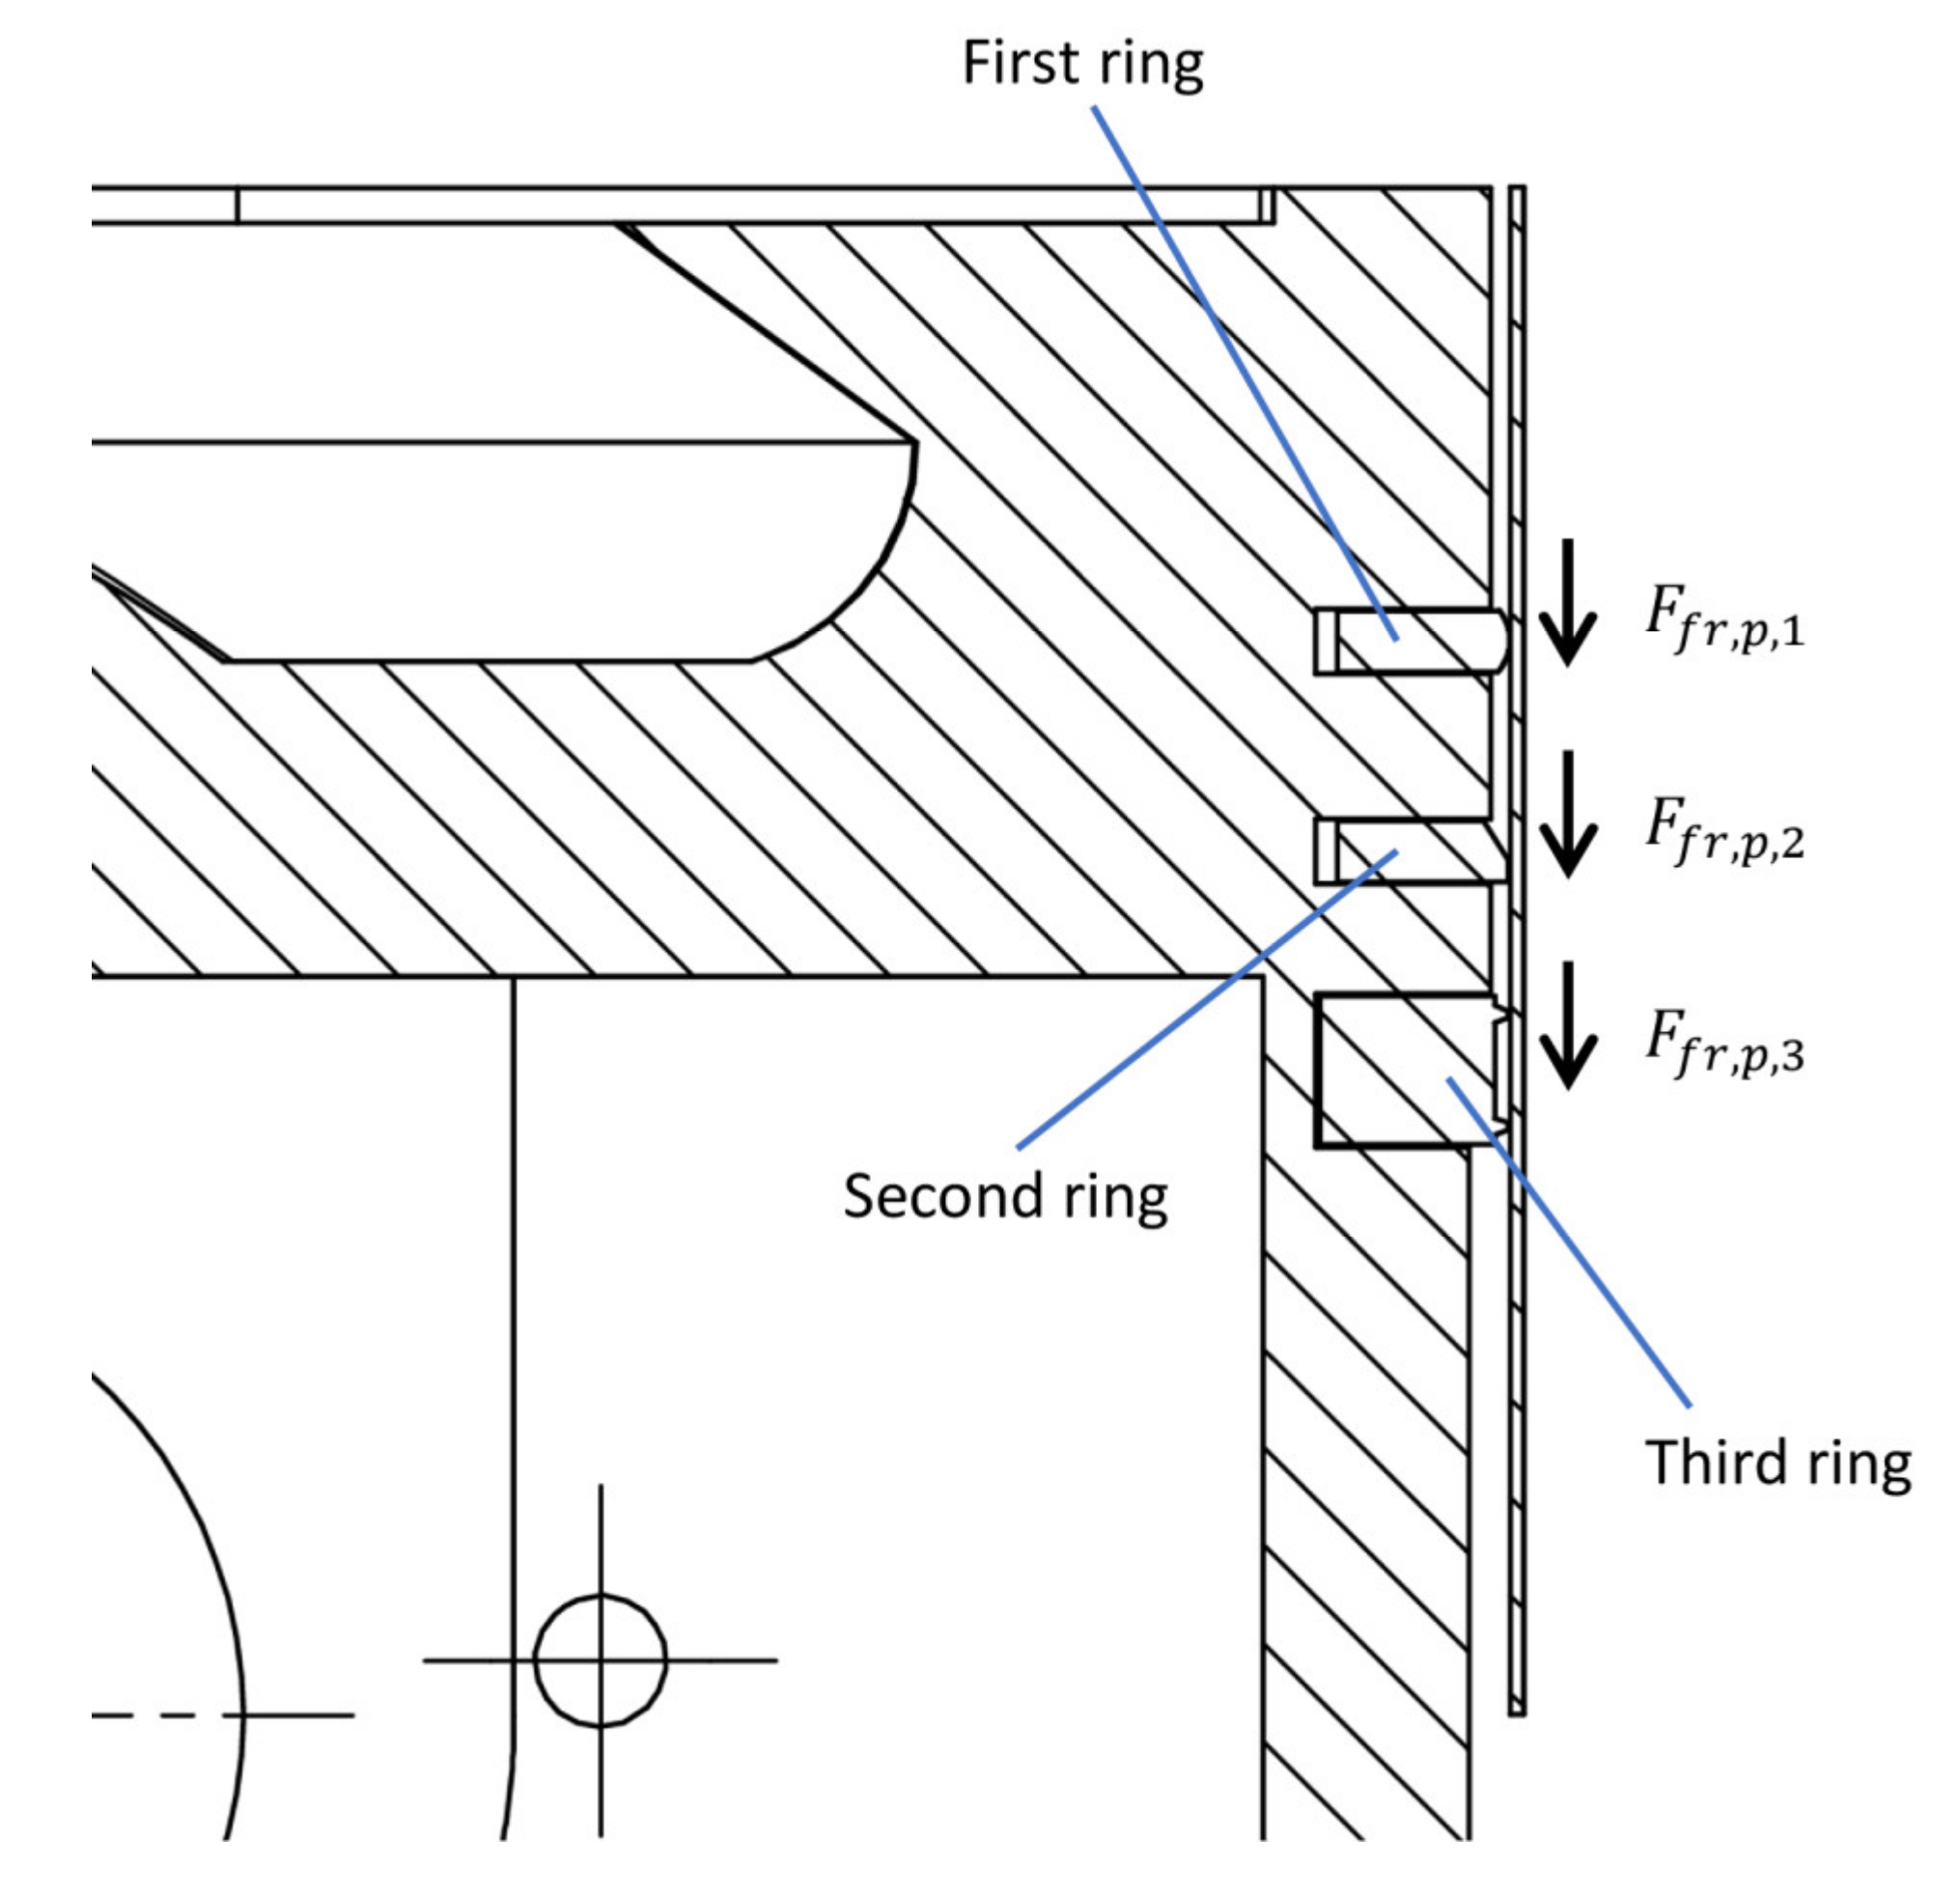
3.2. Energy Losses in the Piston
- The inner diameter of the ring is considered rigid, so radial inertial forces are ignored.
- Flow processes are considered isothermal.
- The radial and tangential friction forces are calculated based on the Stribeck function.
- The Reynolds equation is used to determine the damping force.
- The flow of gas pressures is considered stationary.
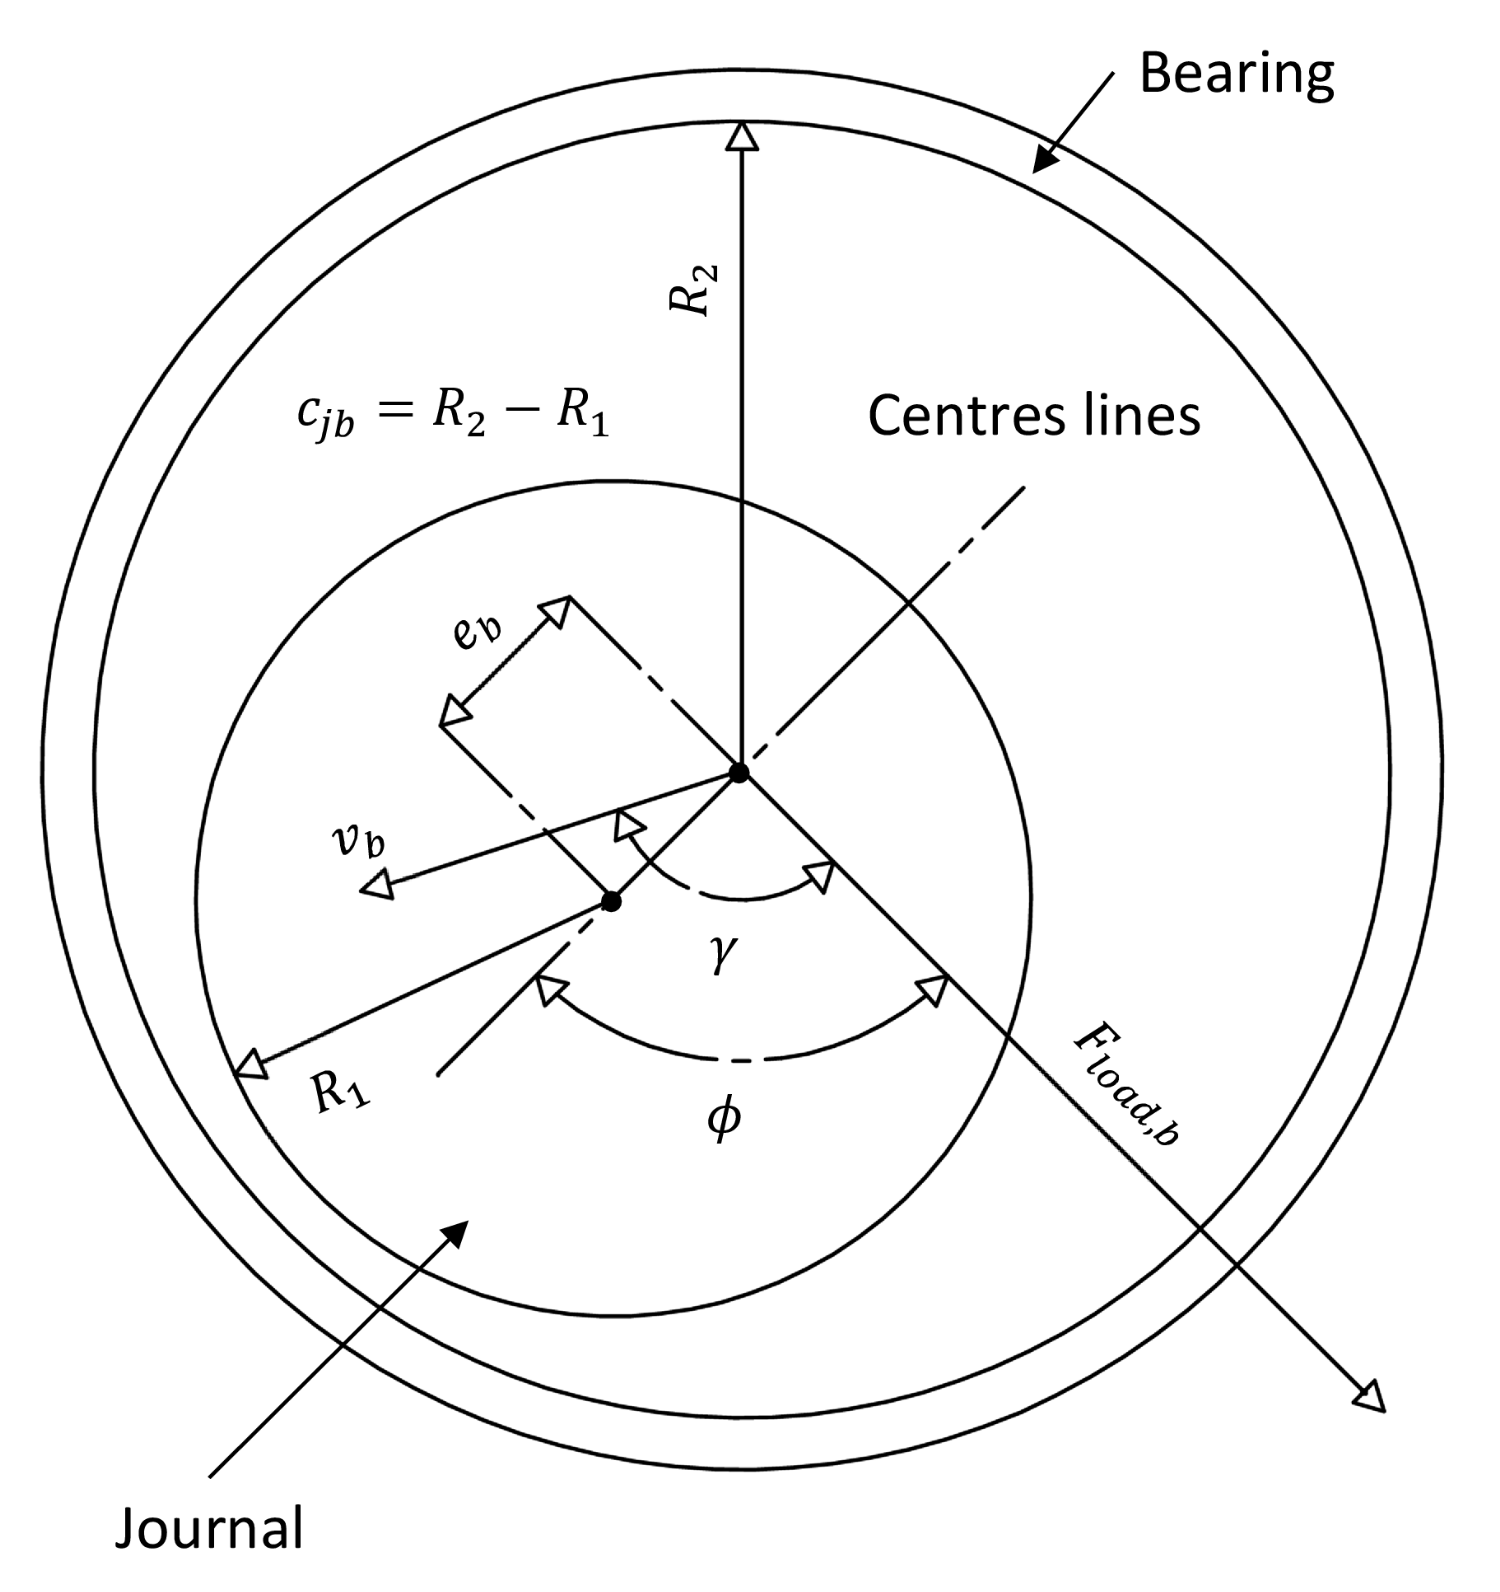
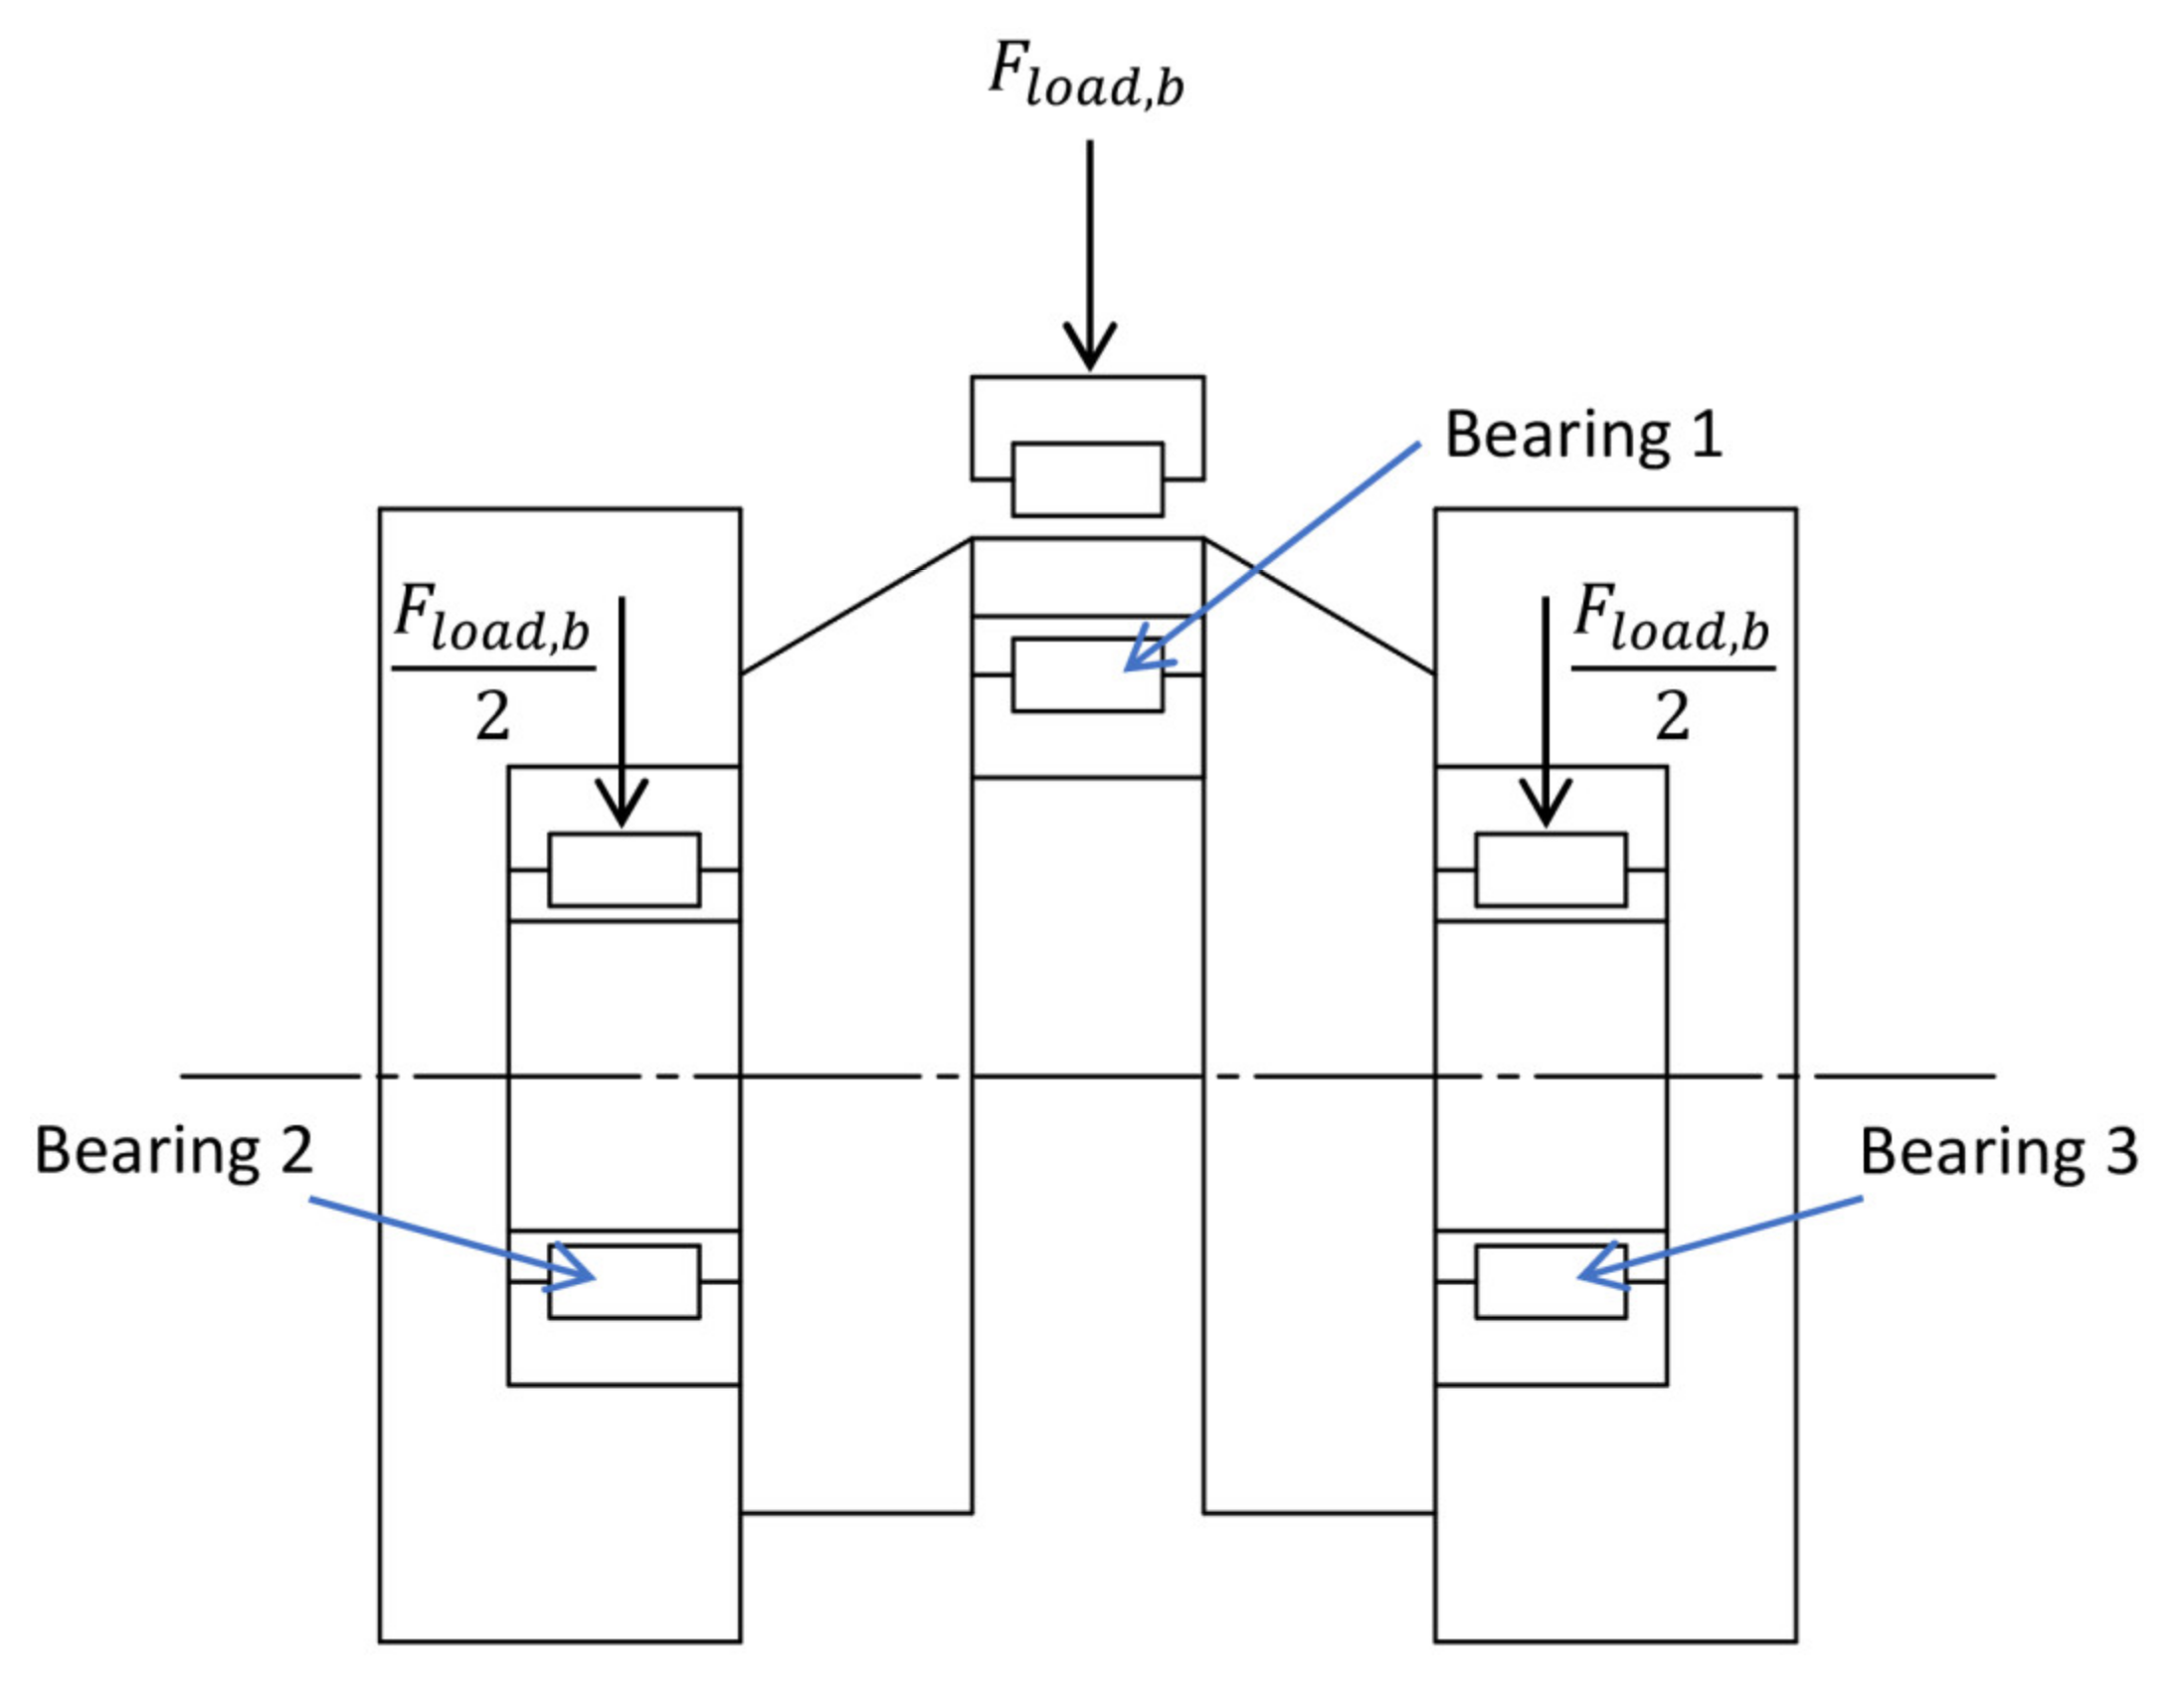
3.3. Energy Losses in Bearings
4. Numerical Methodology
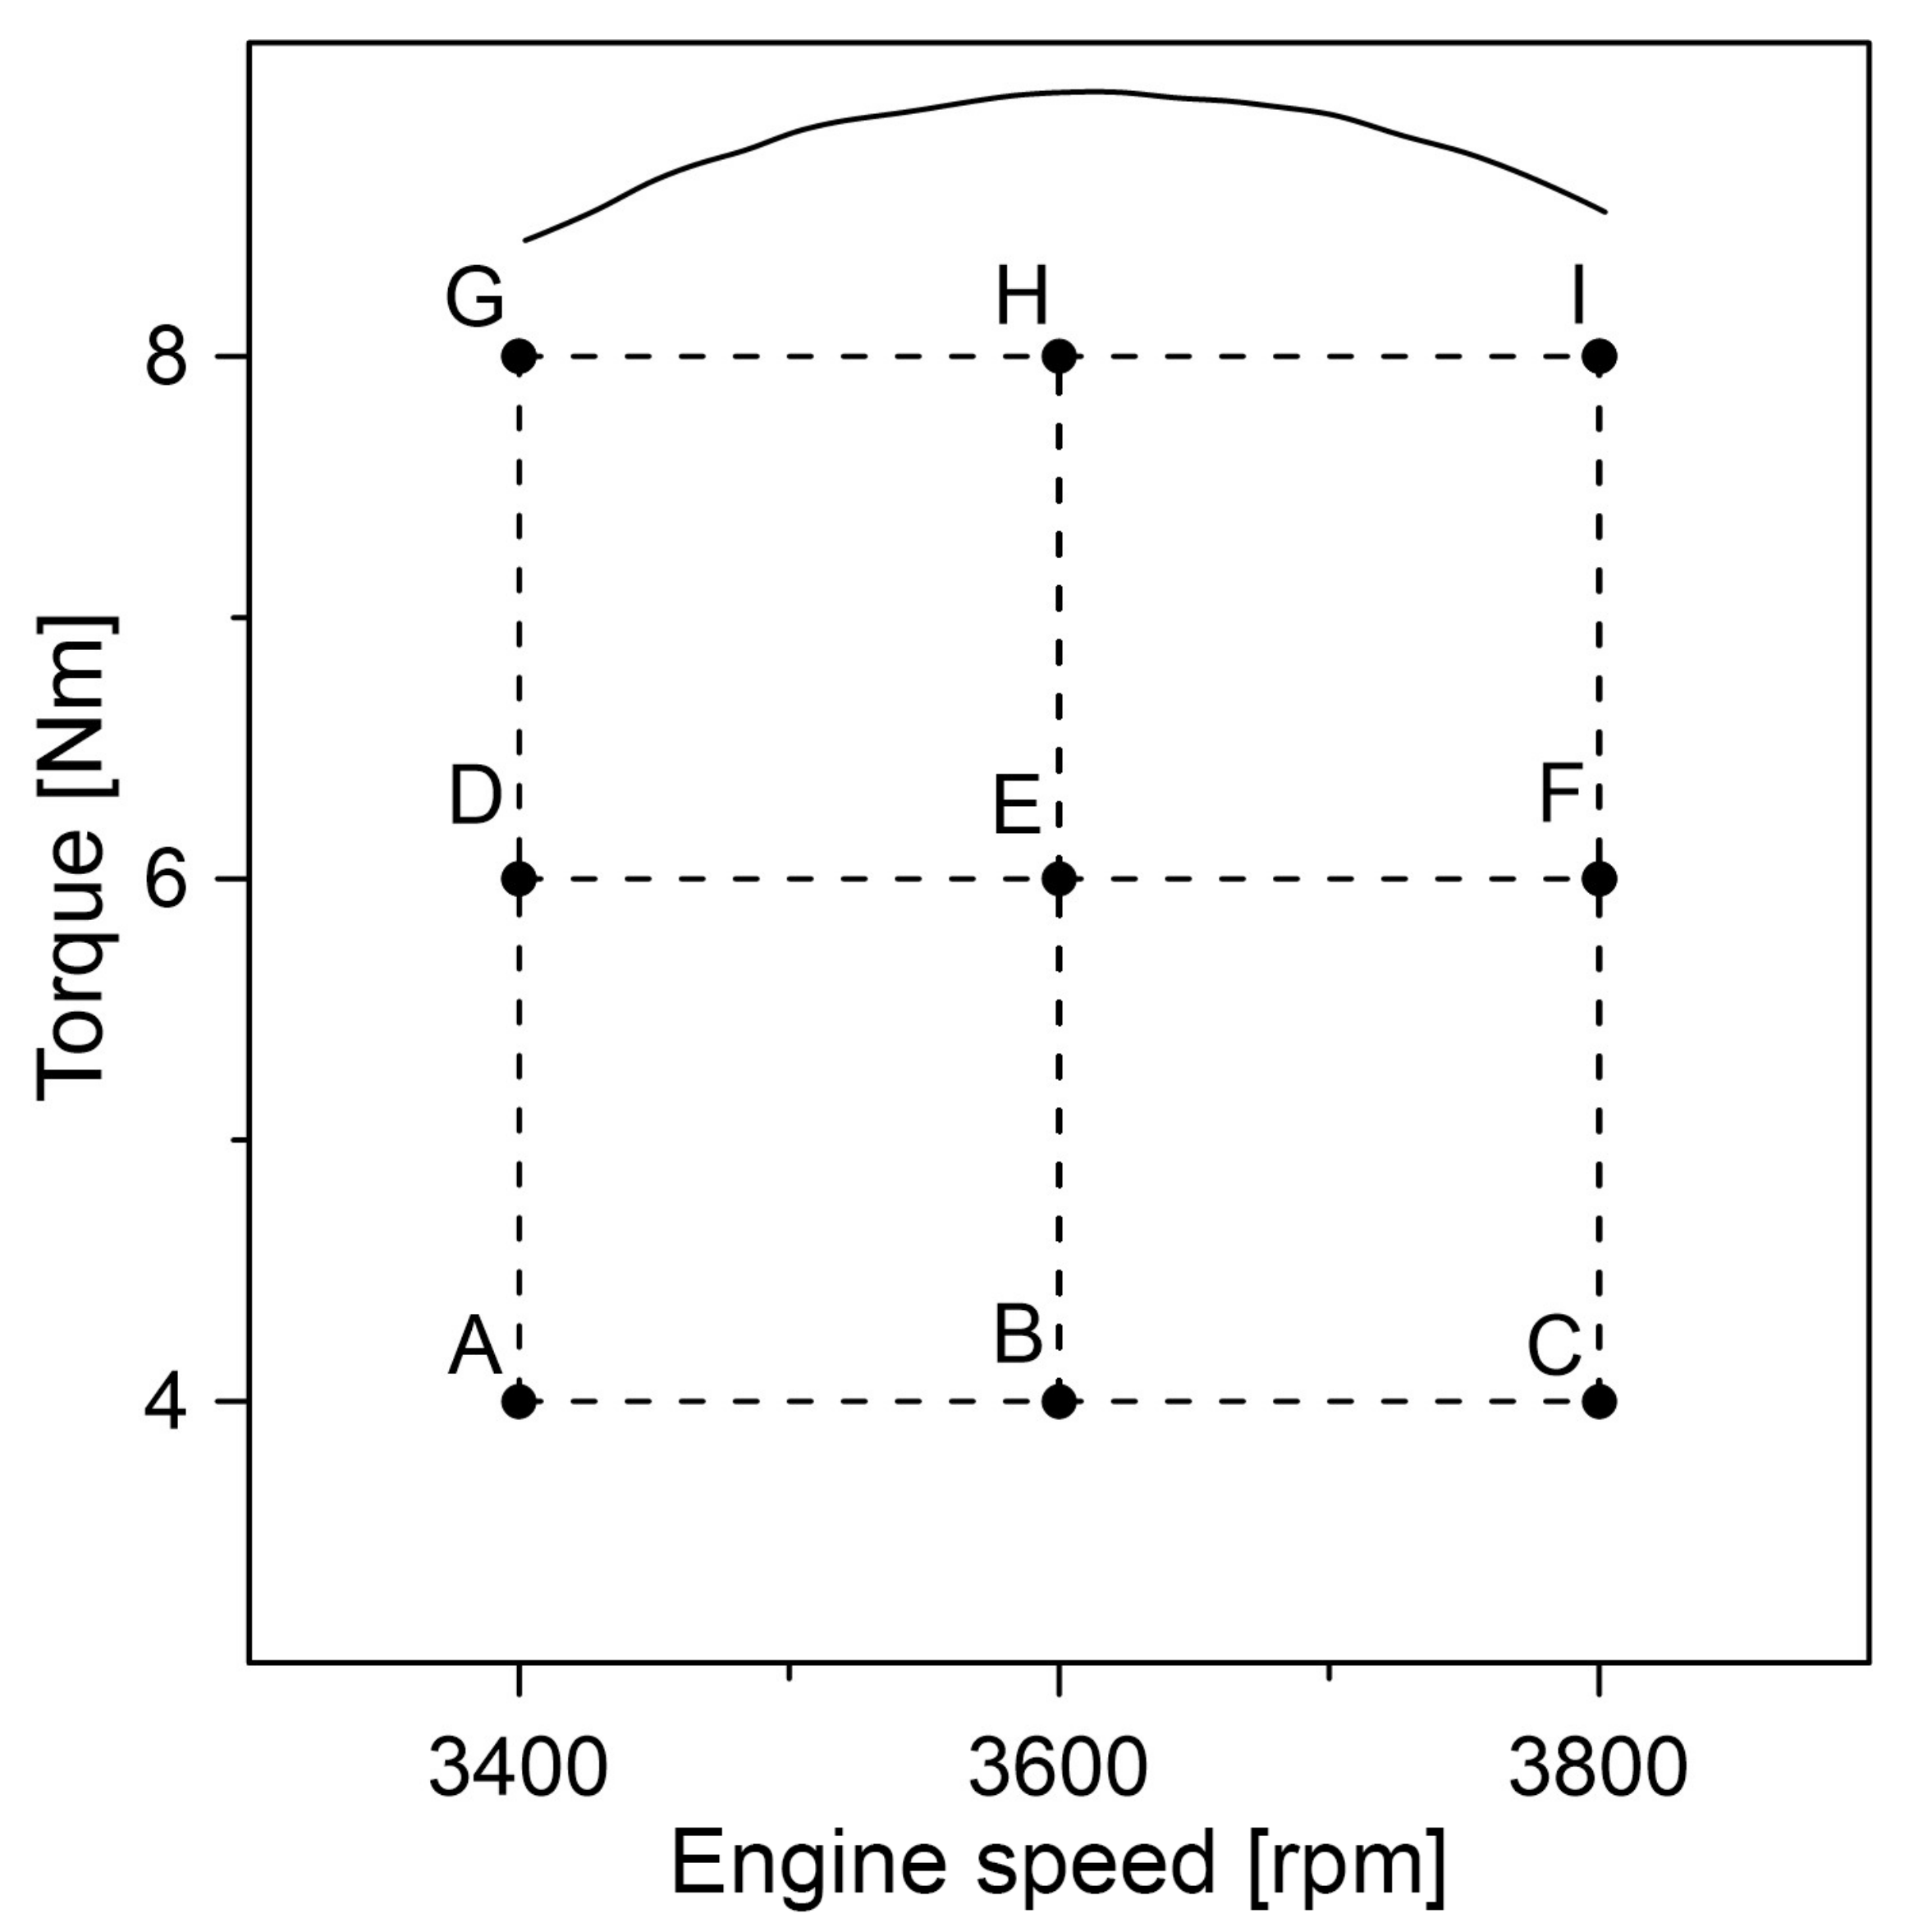
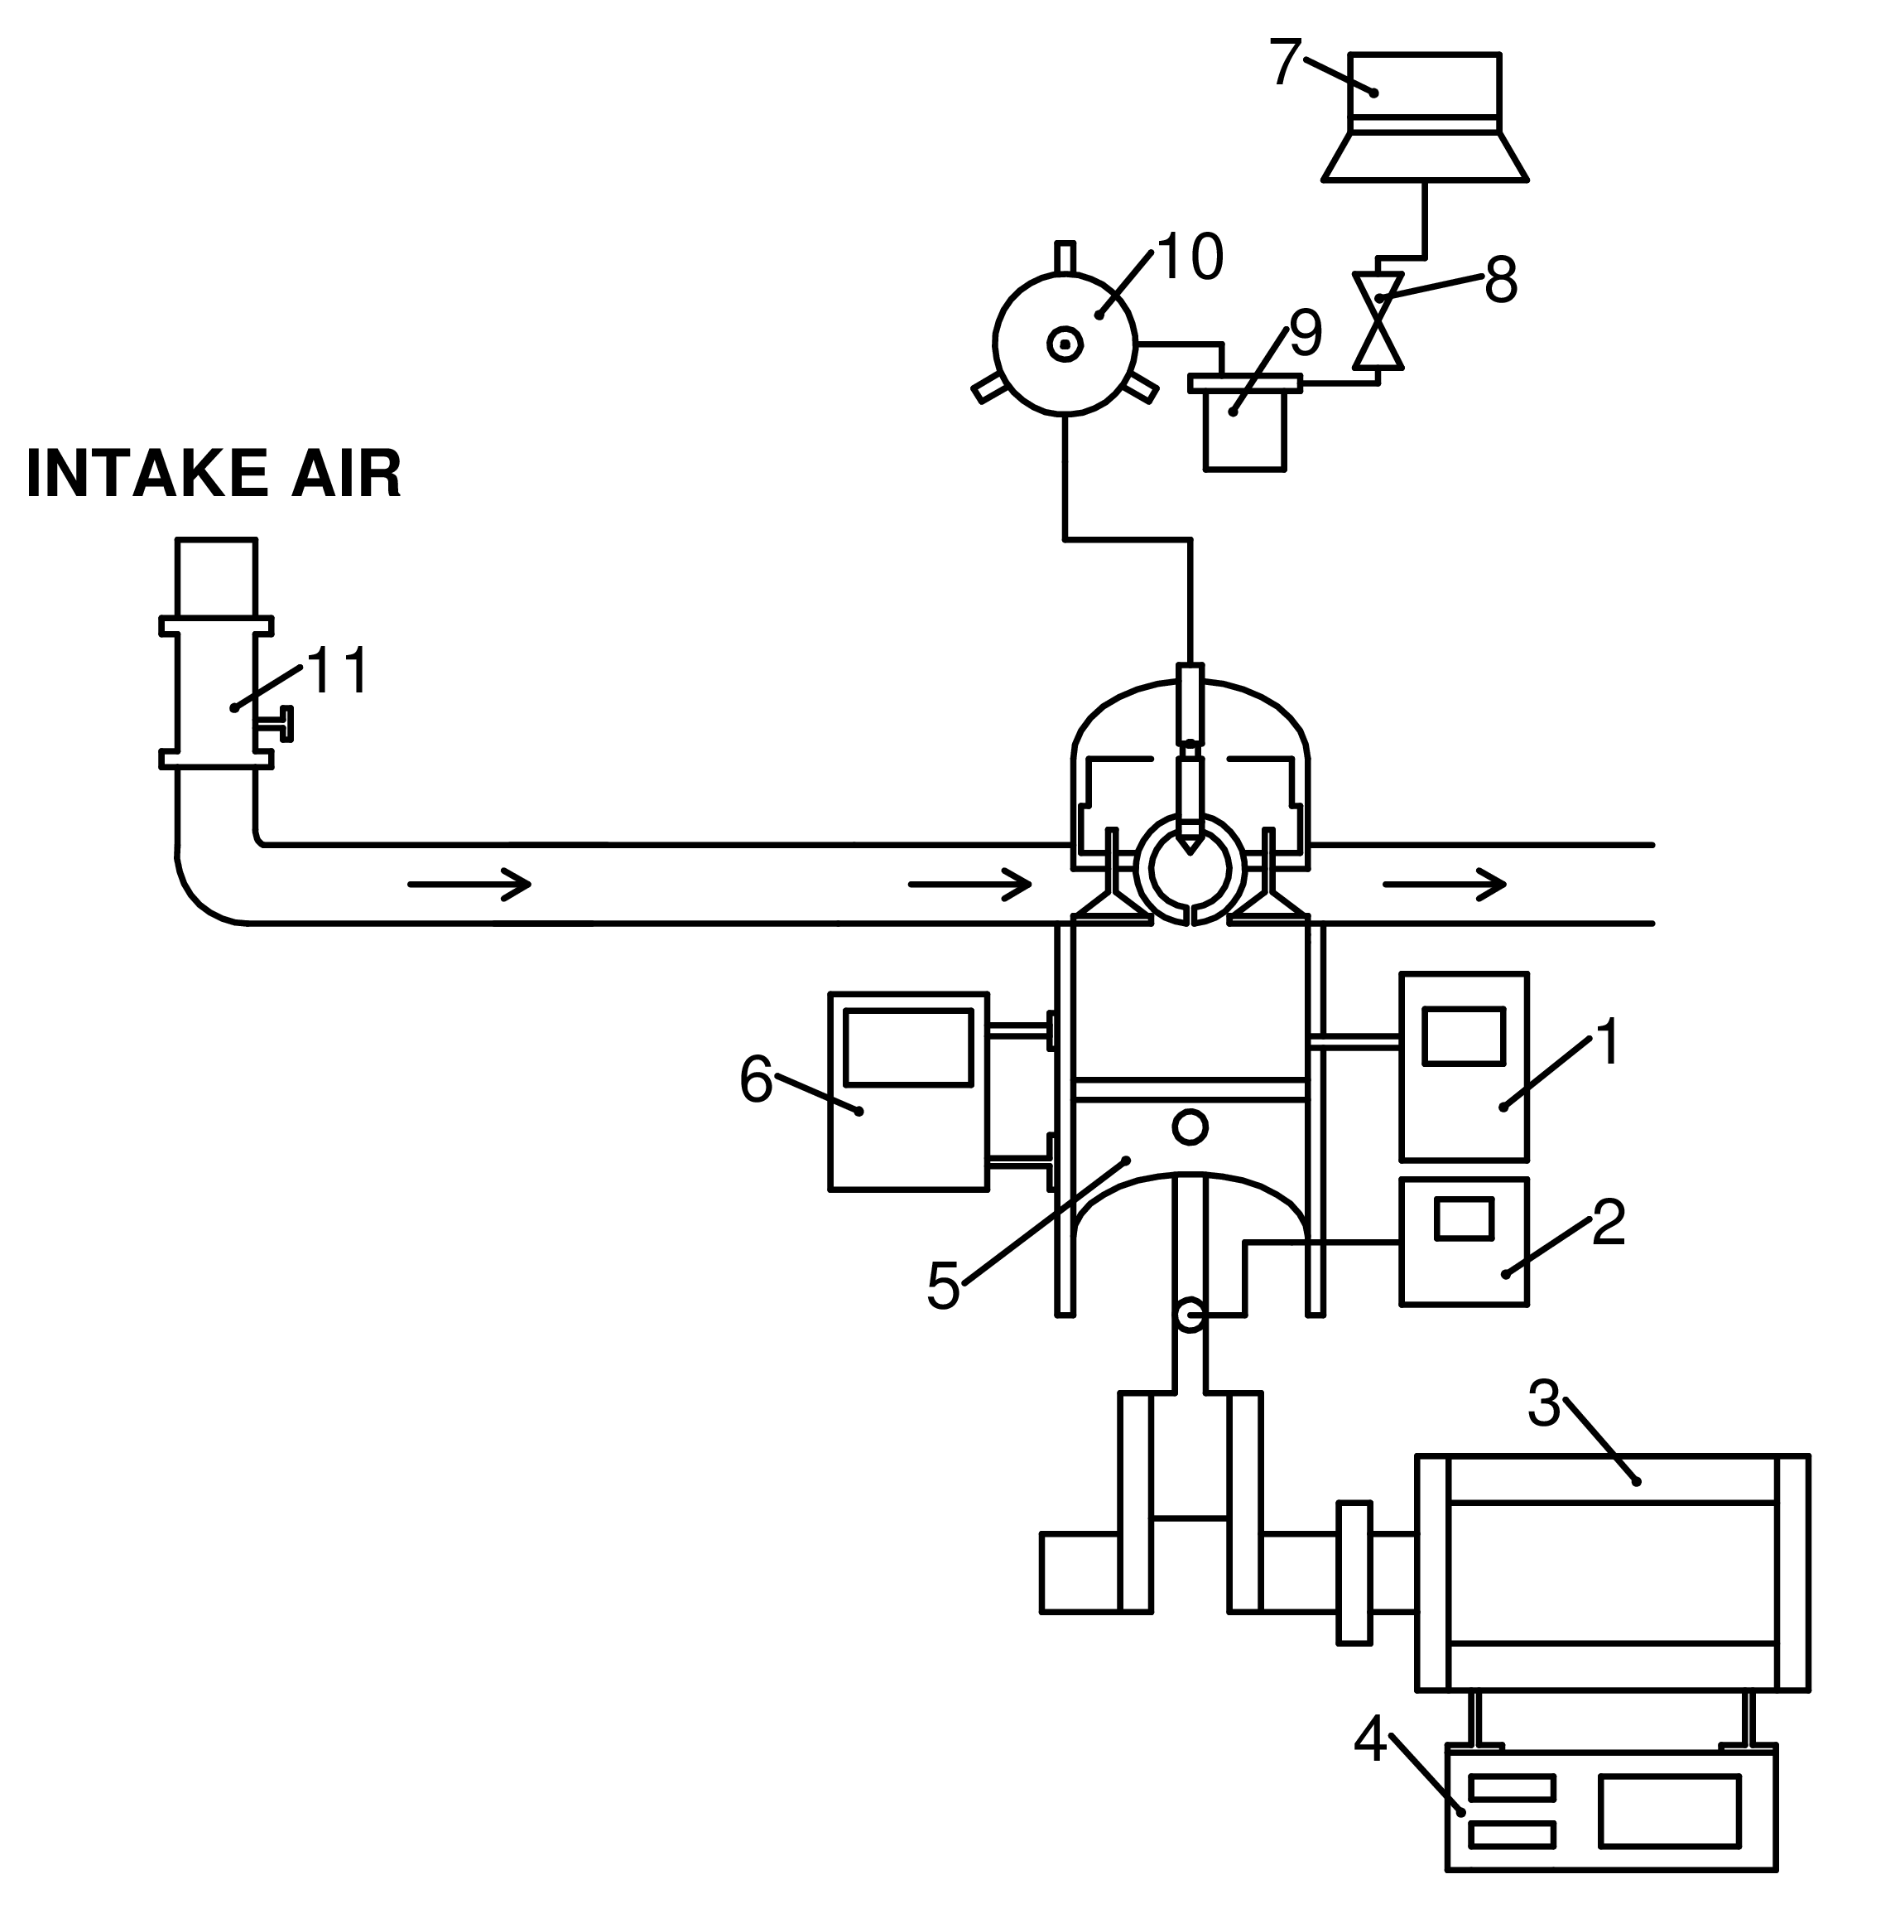
5. Experimental Methodology
6. Results and Discussions
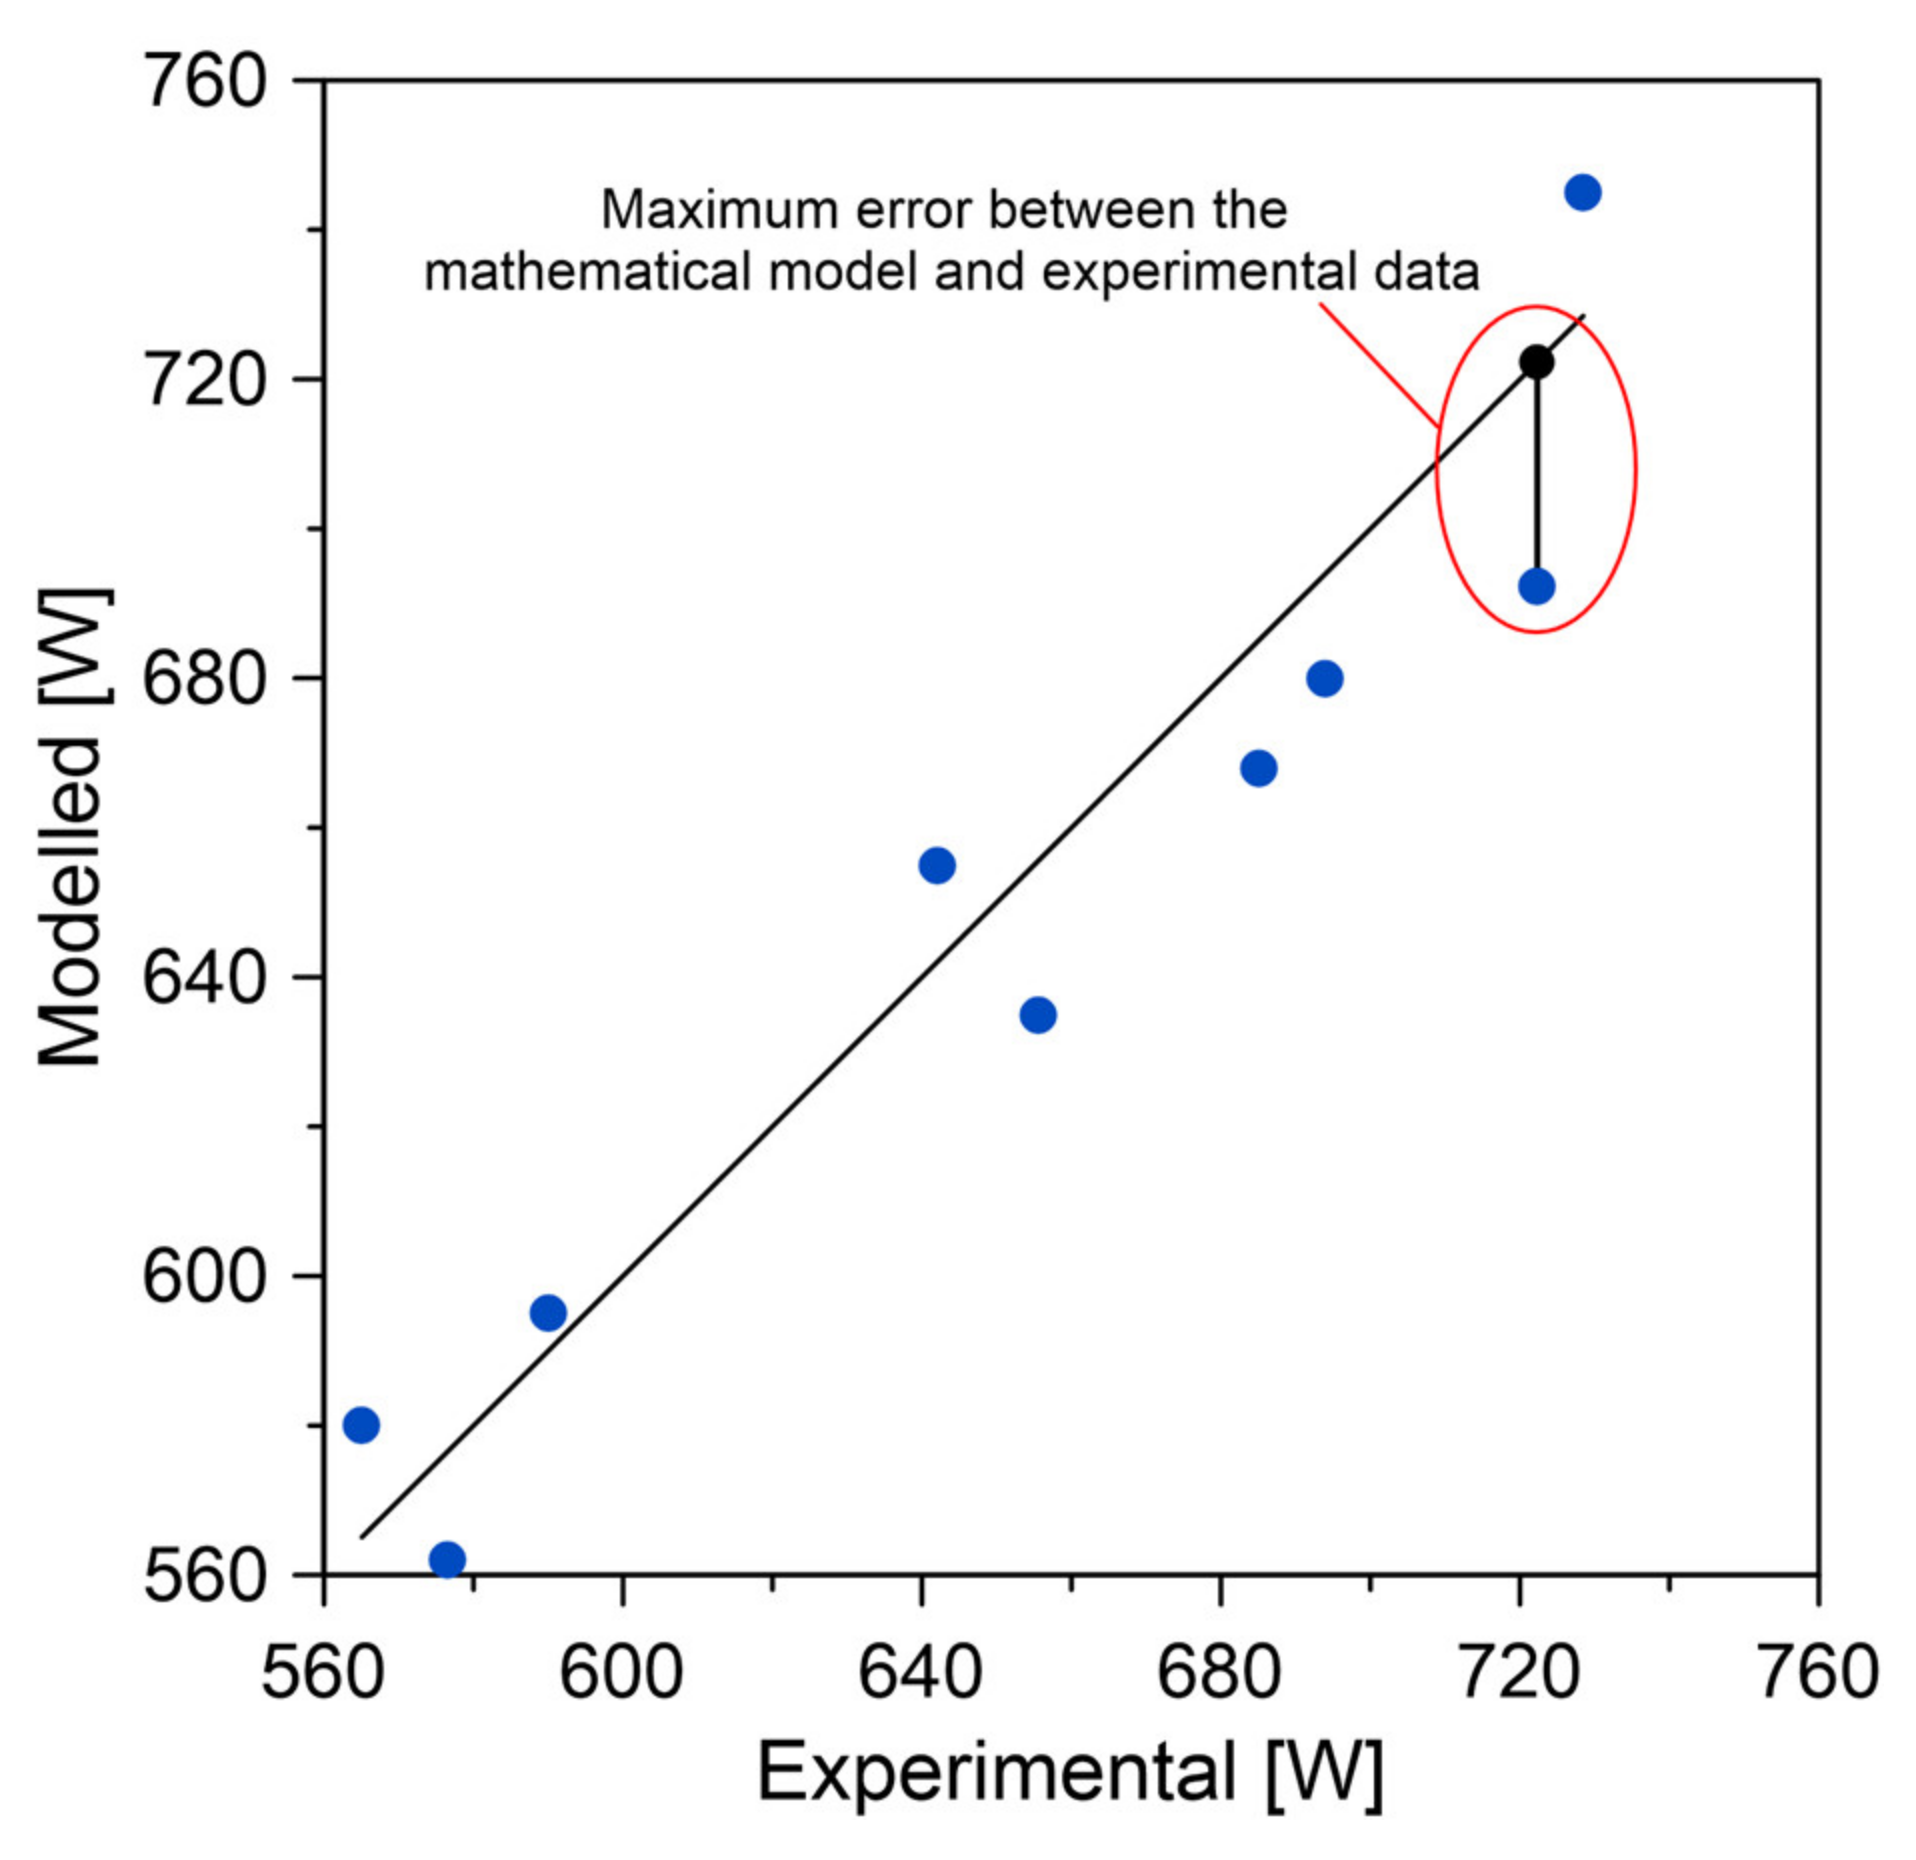
6.1. Experimental Validation
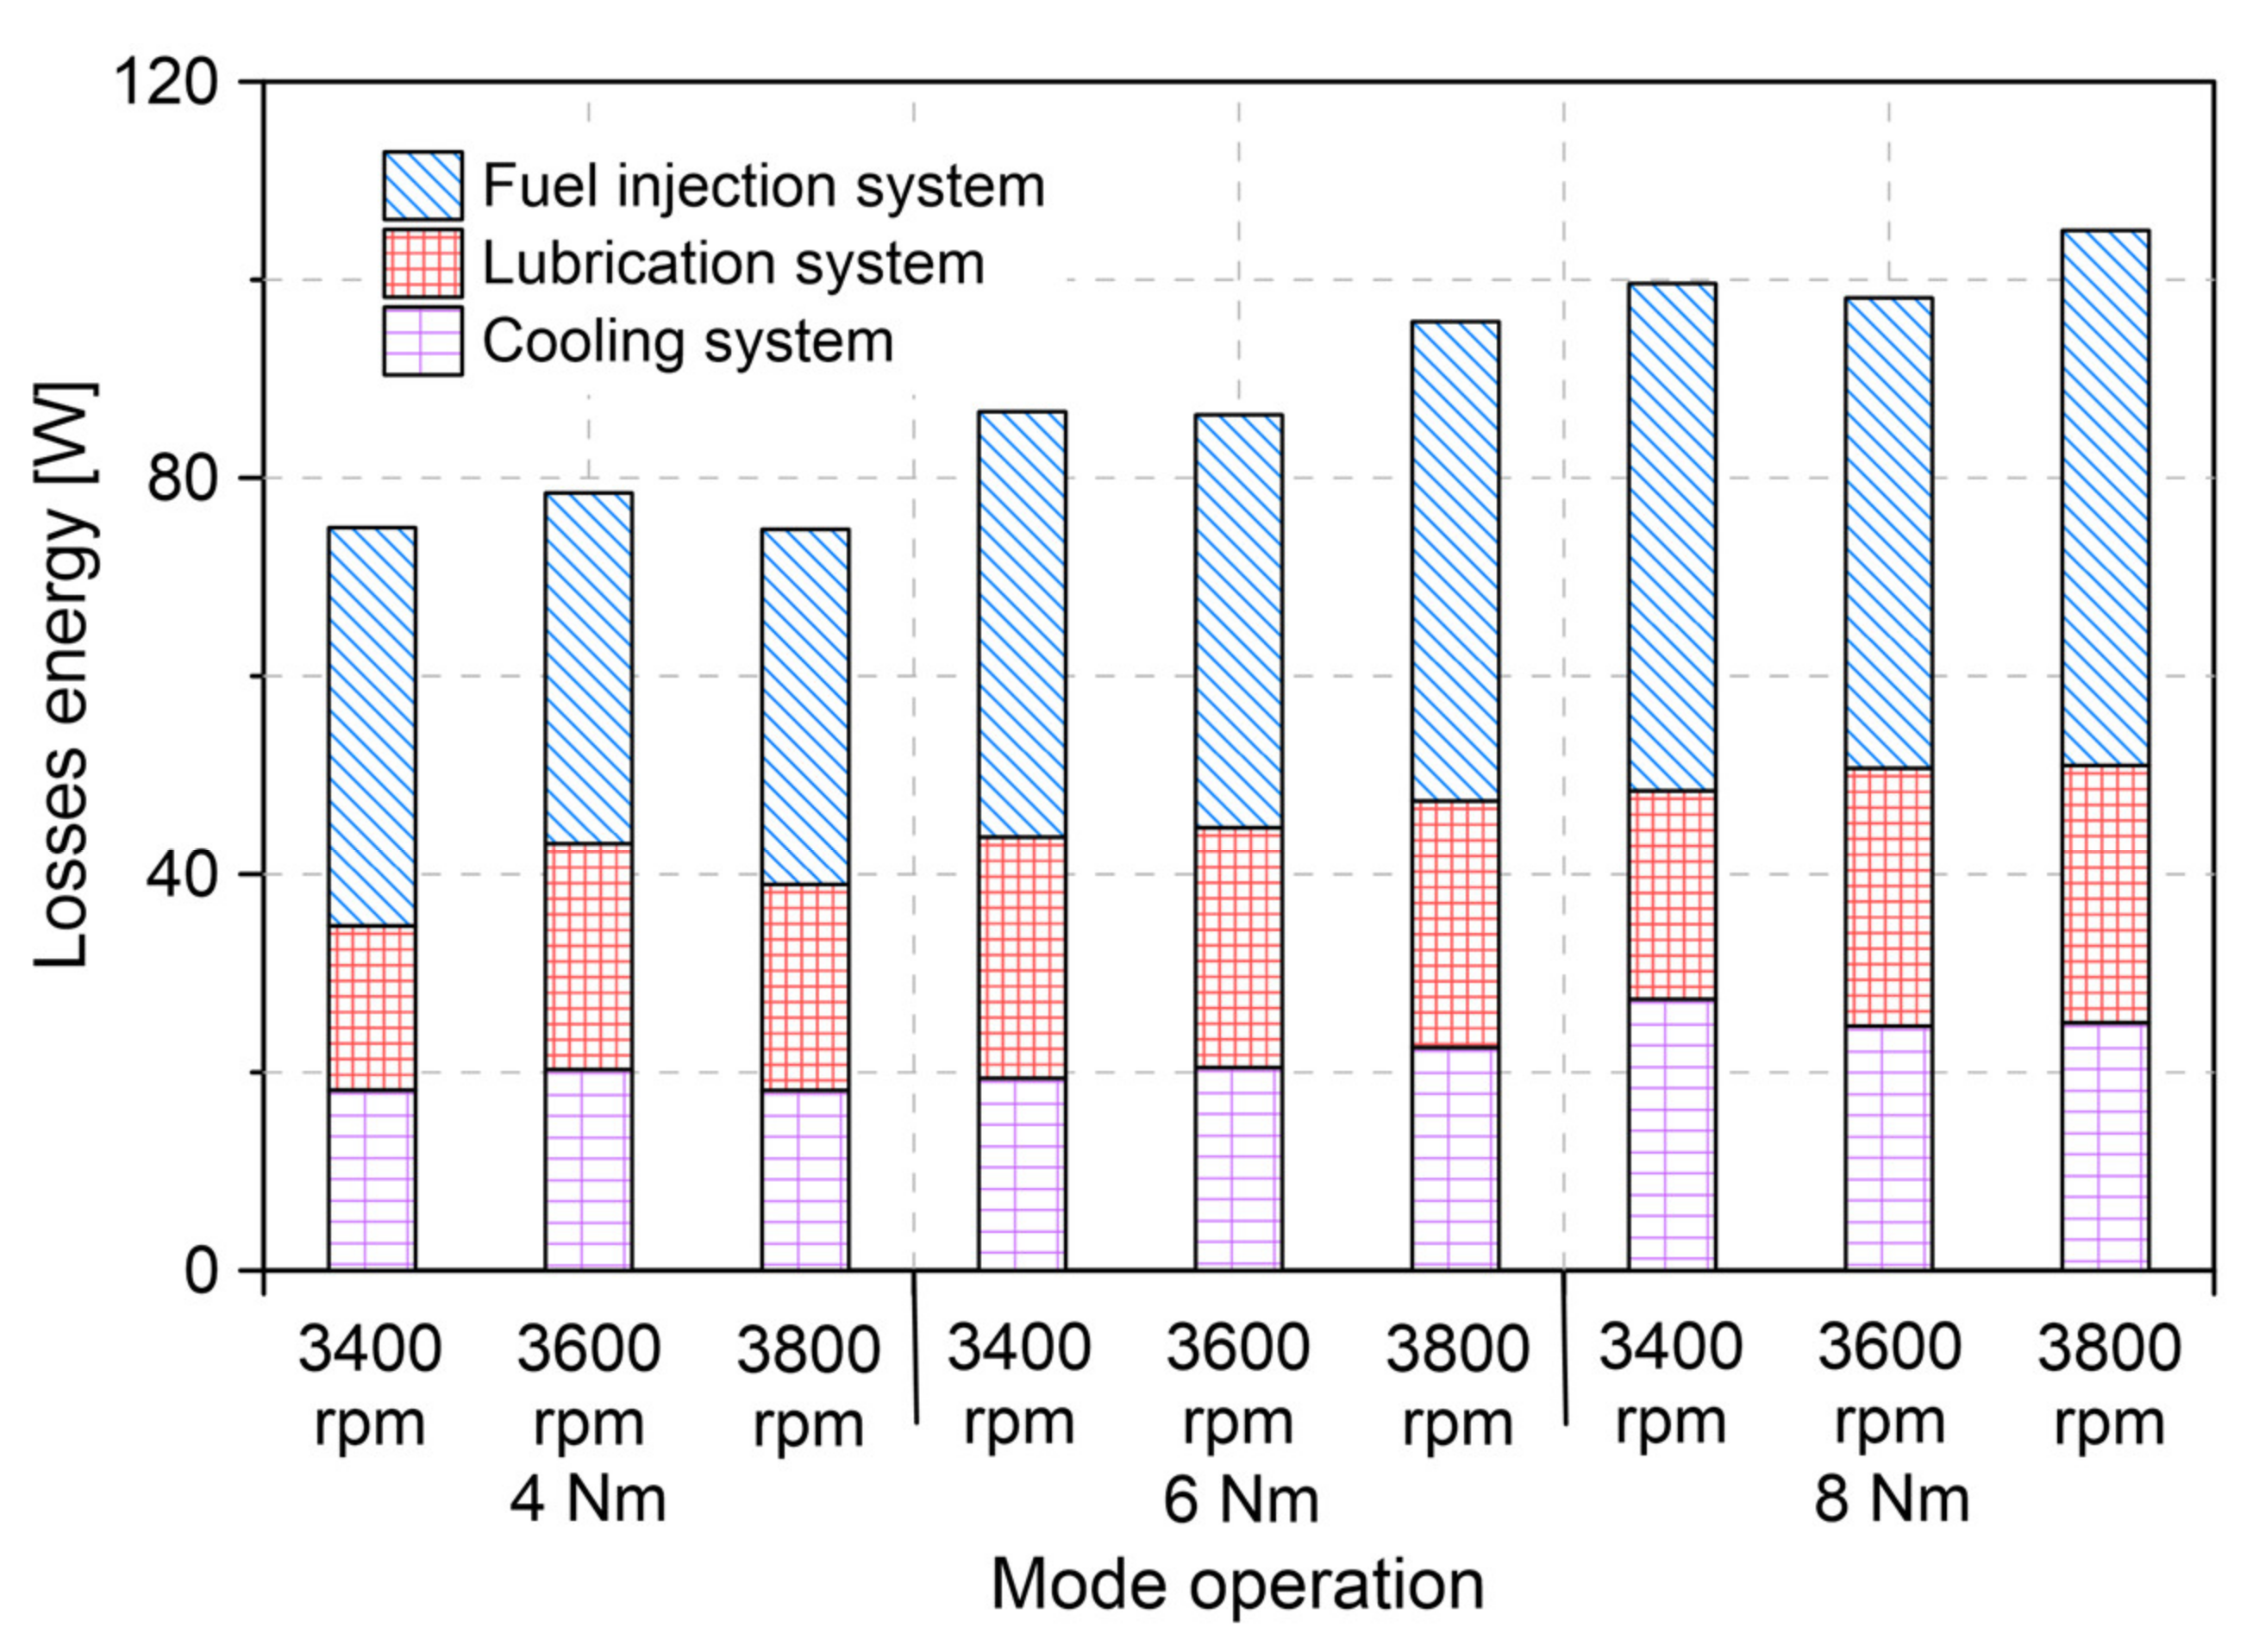
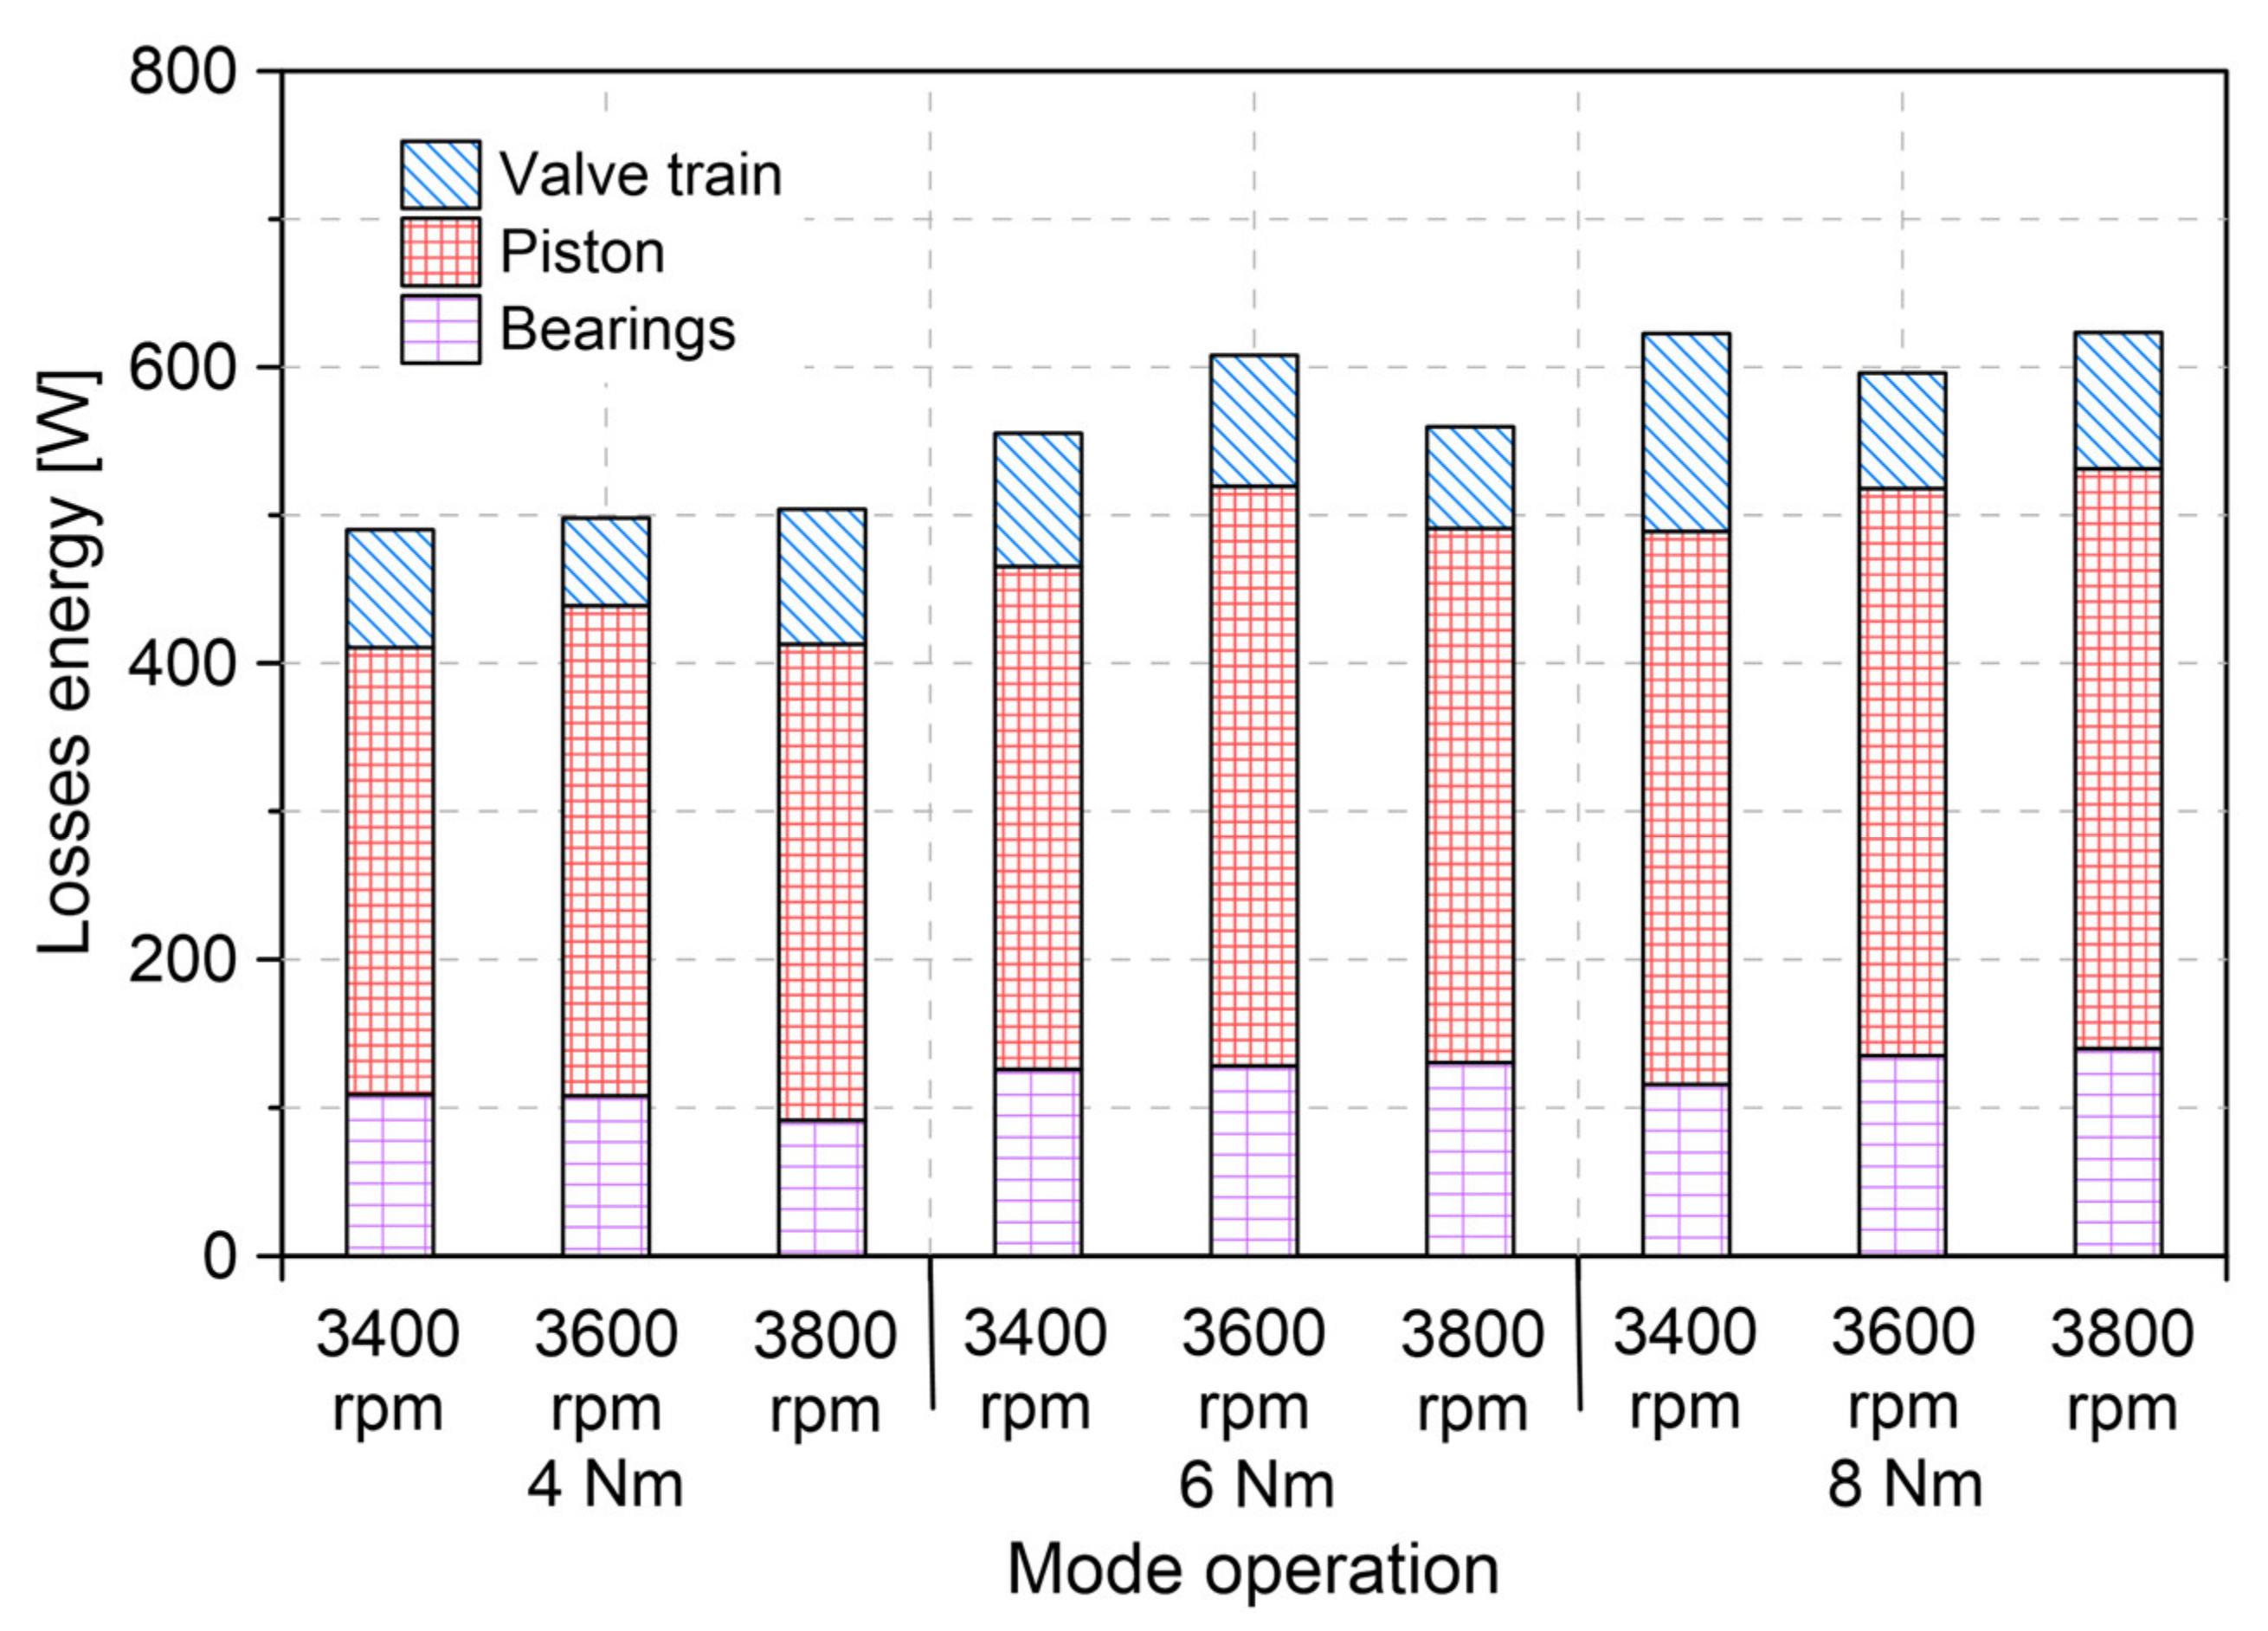
6.2. Analysis of Energy Losses in the Engine
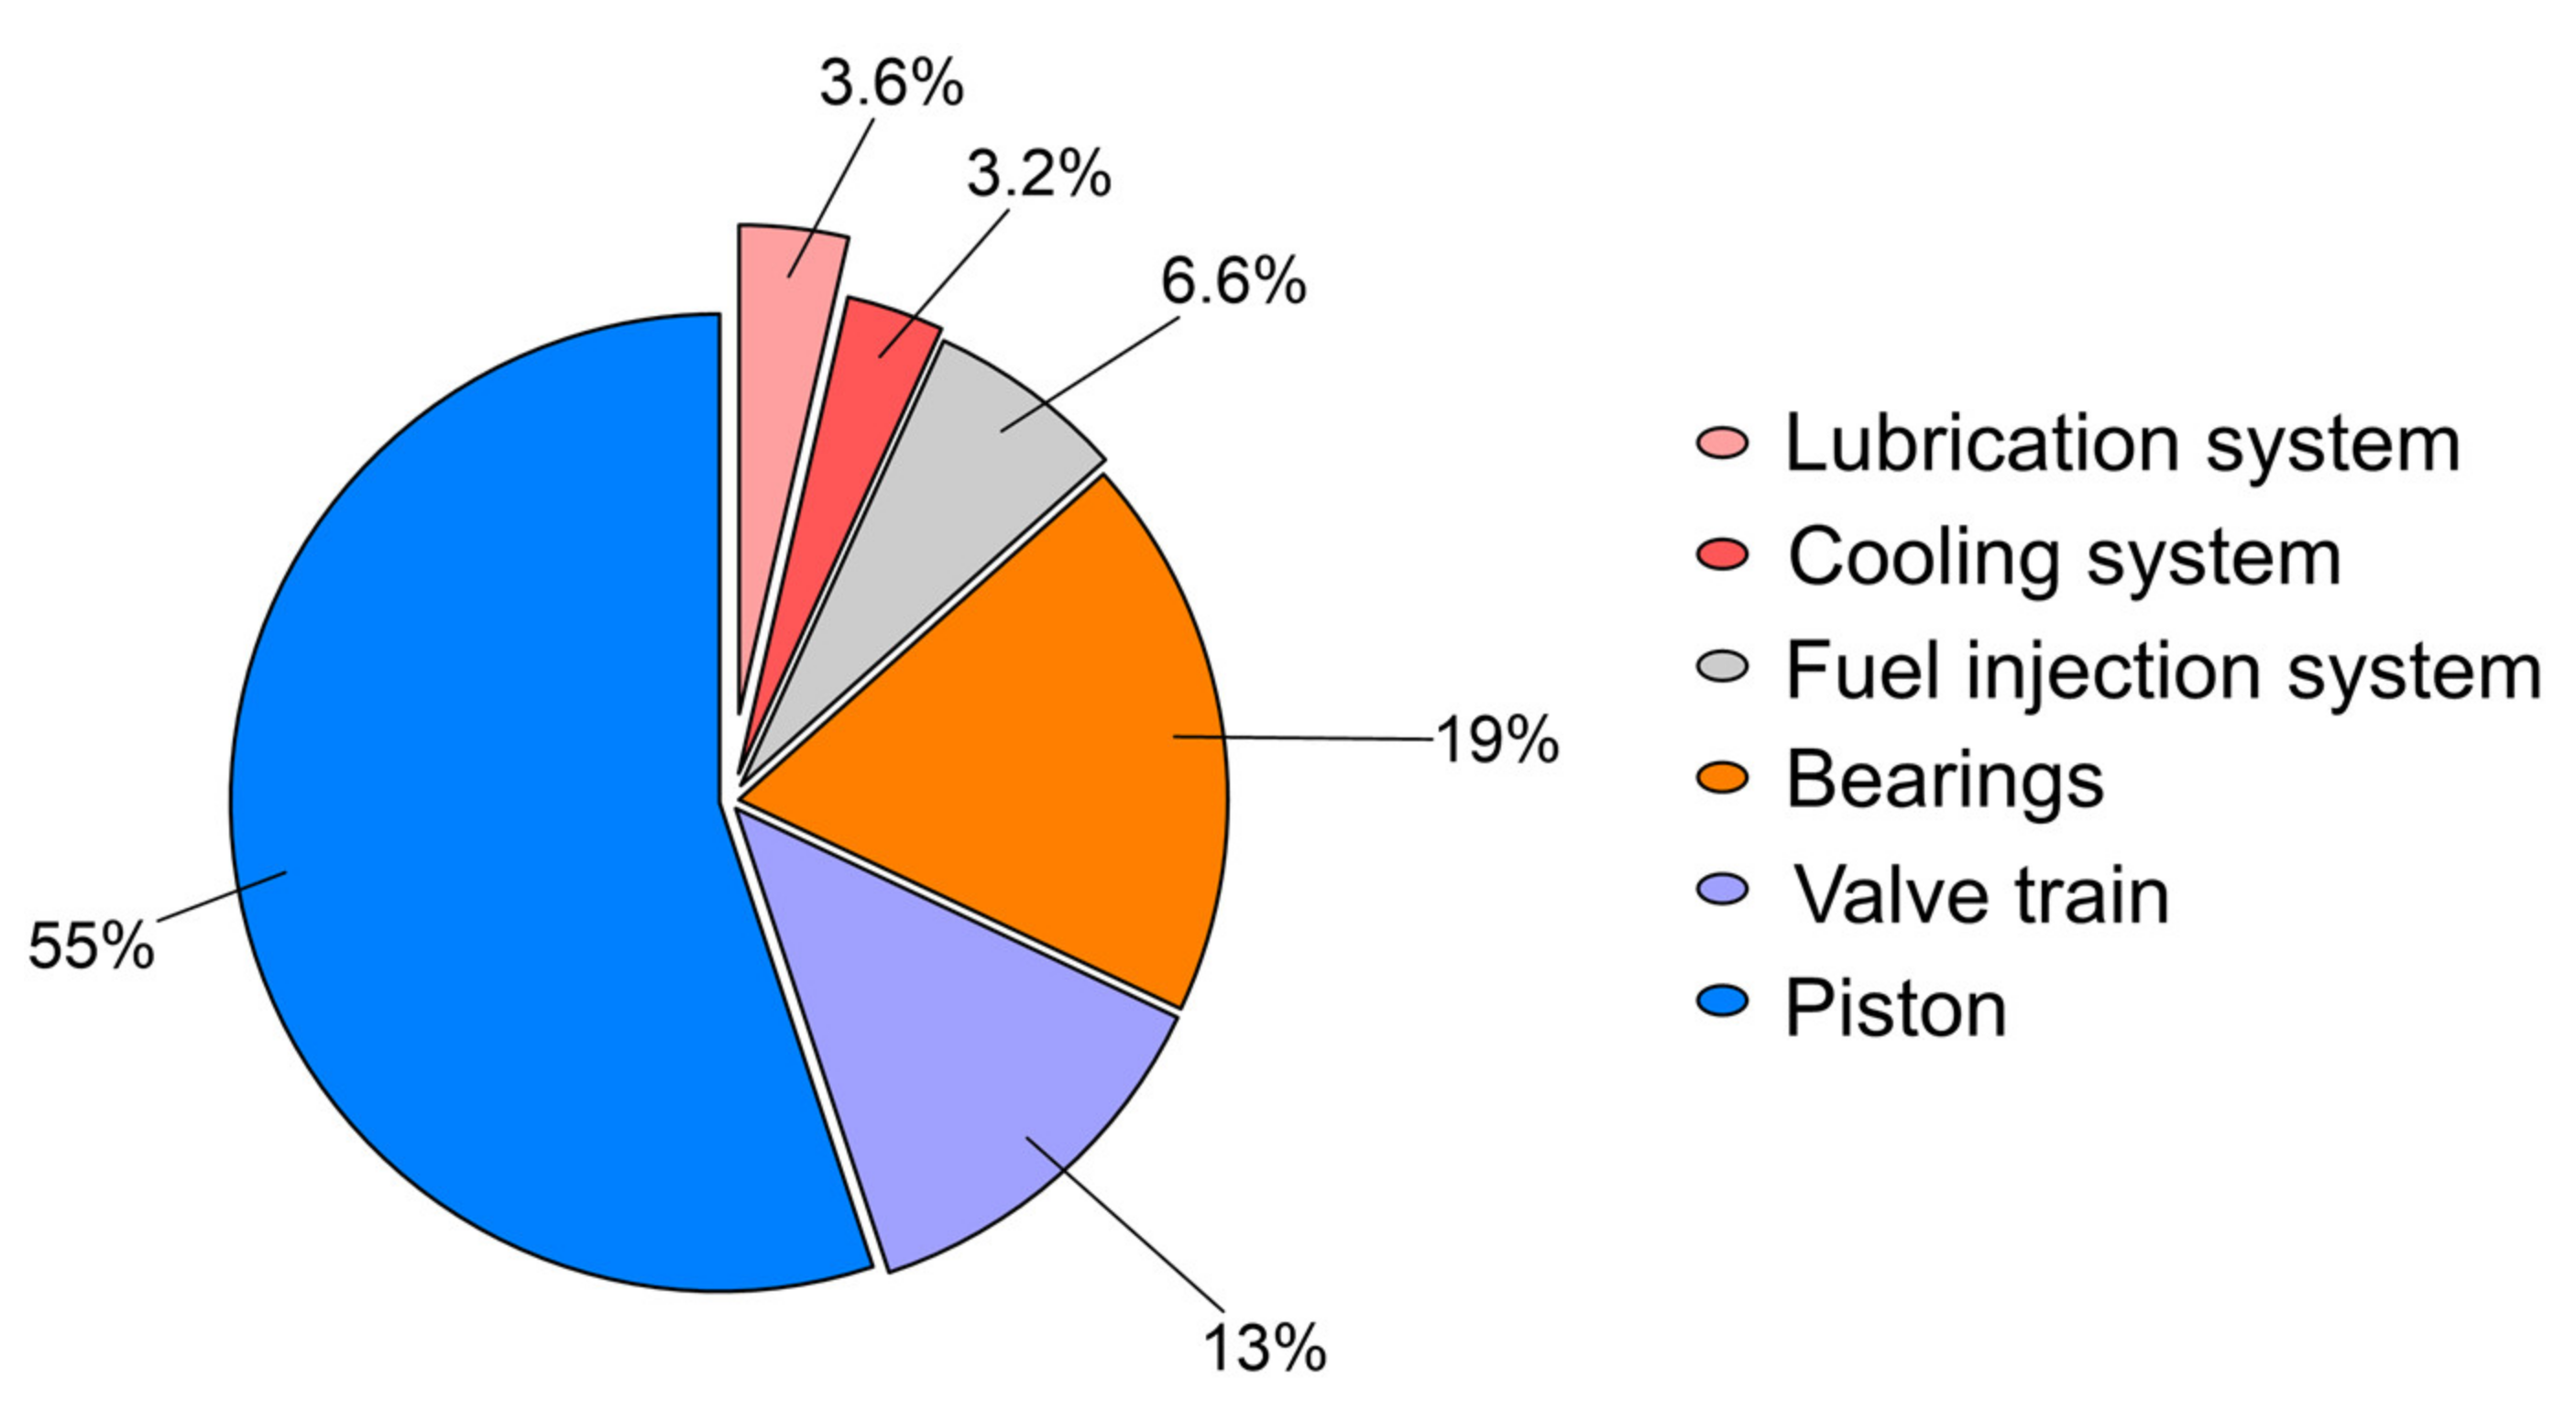
6.3. Analysis of Energy Loss Distributions
6.4. Lubrication Film Analysis
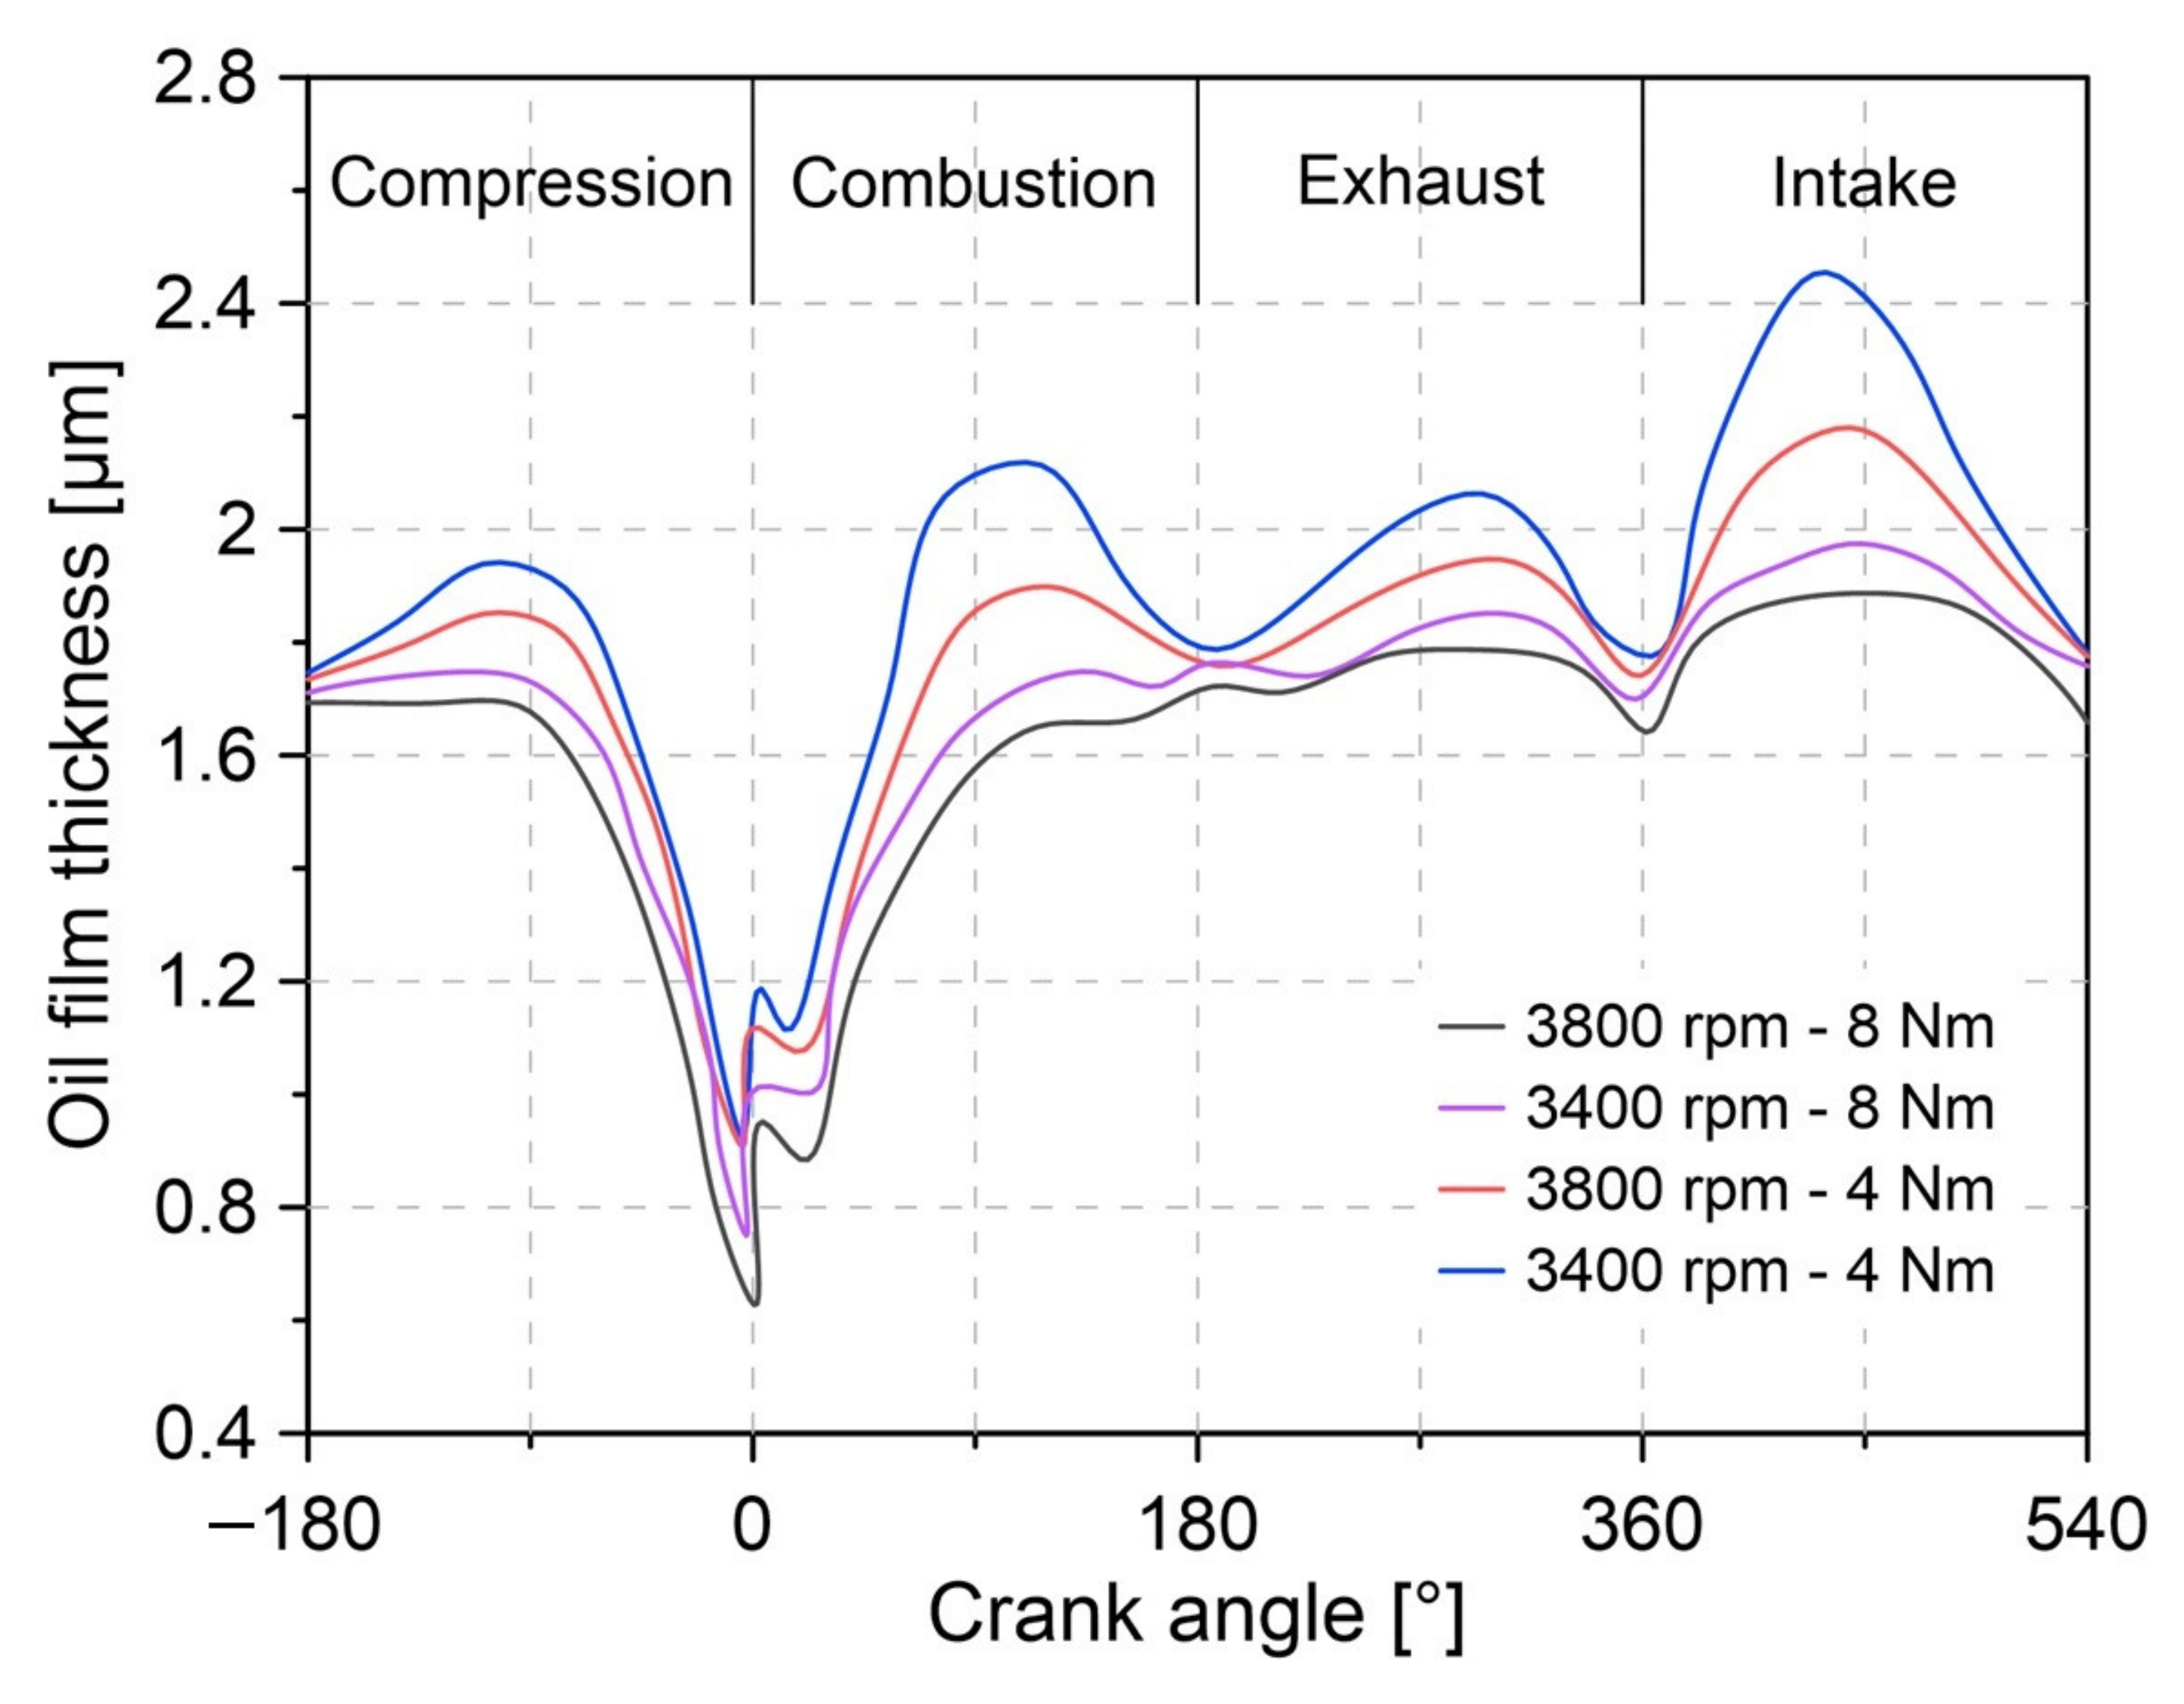
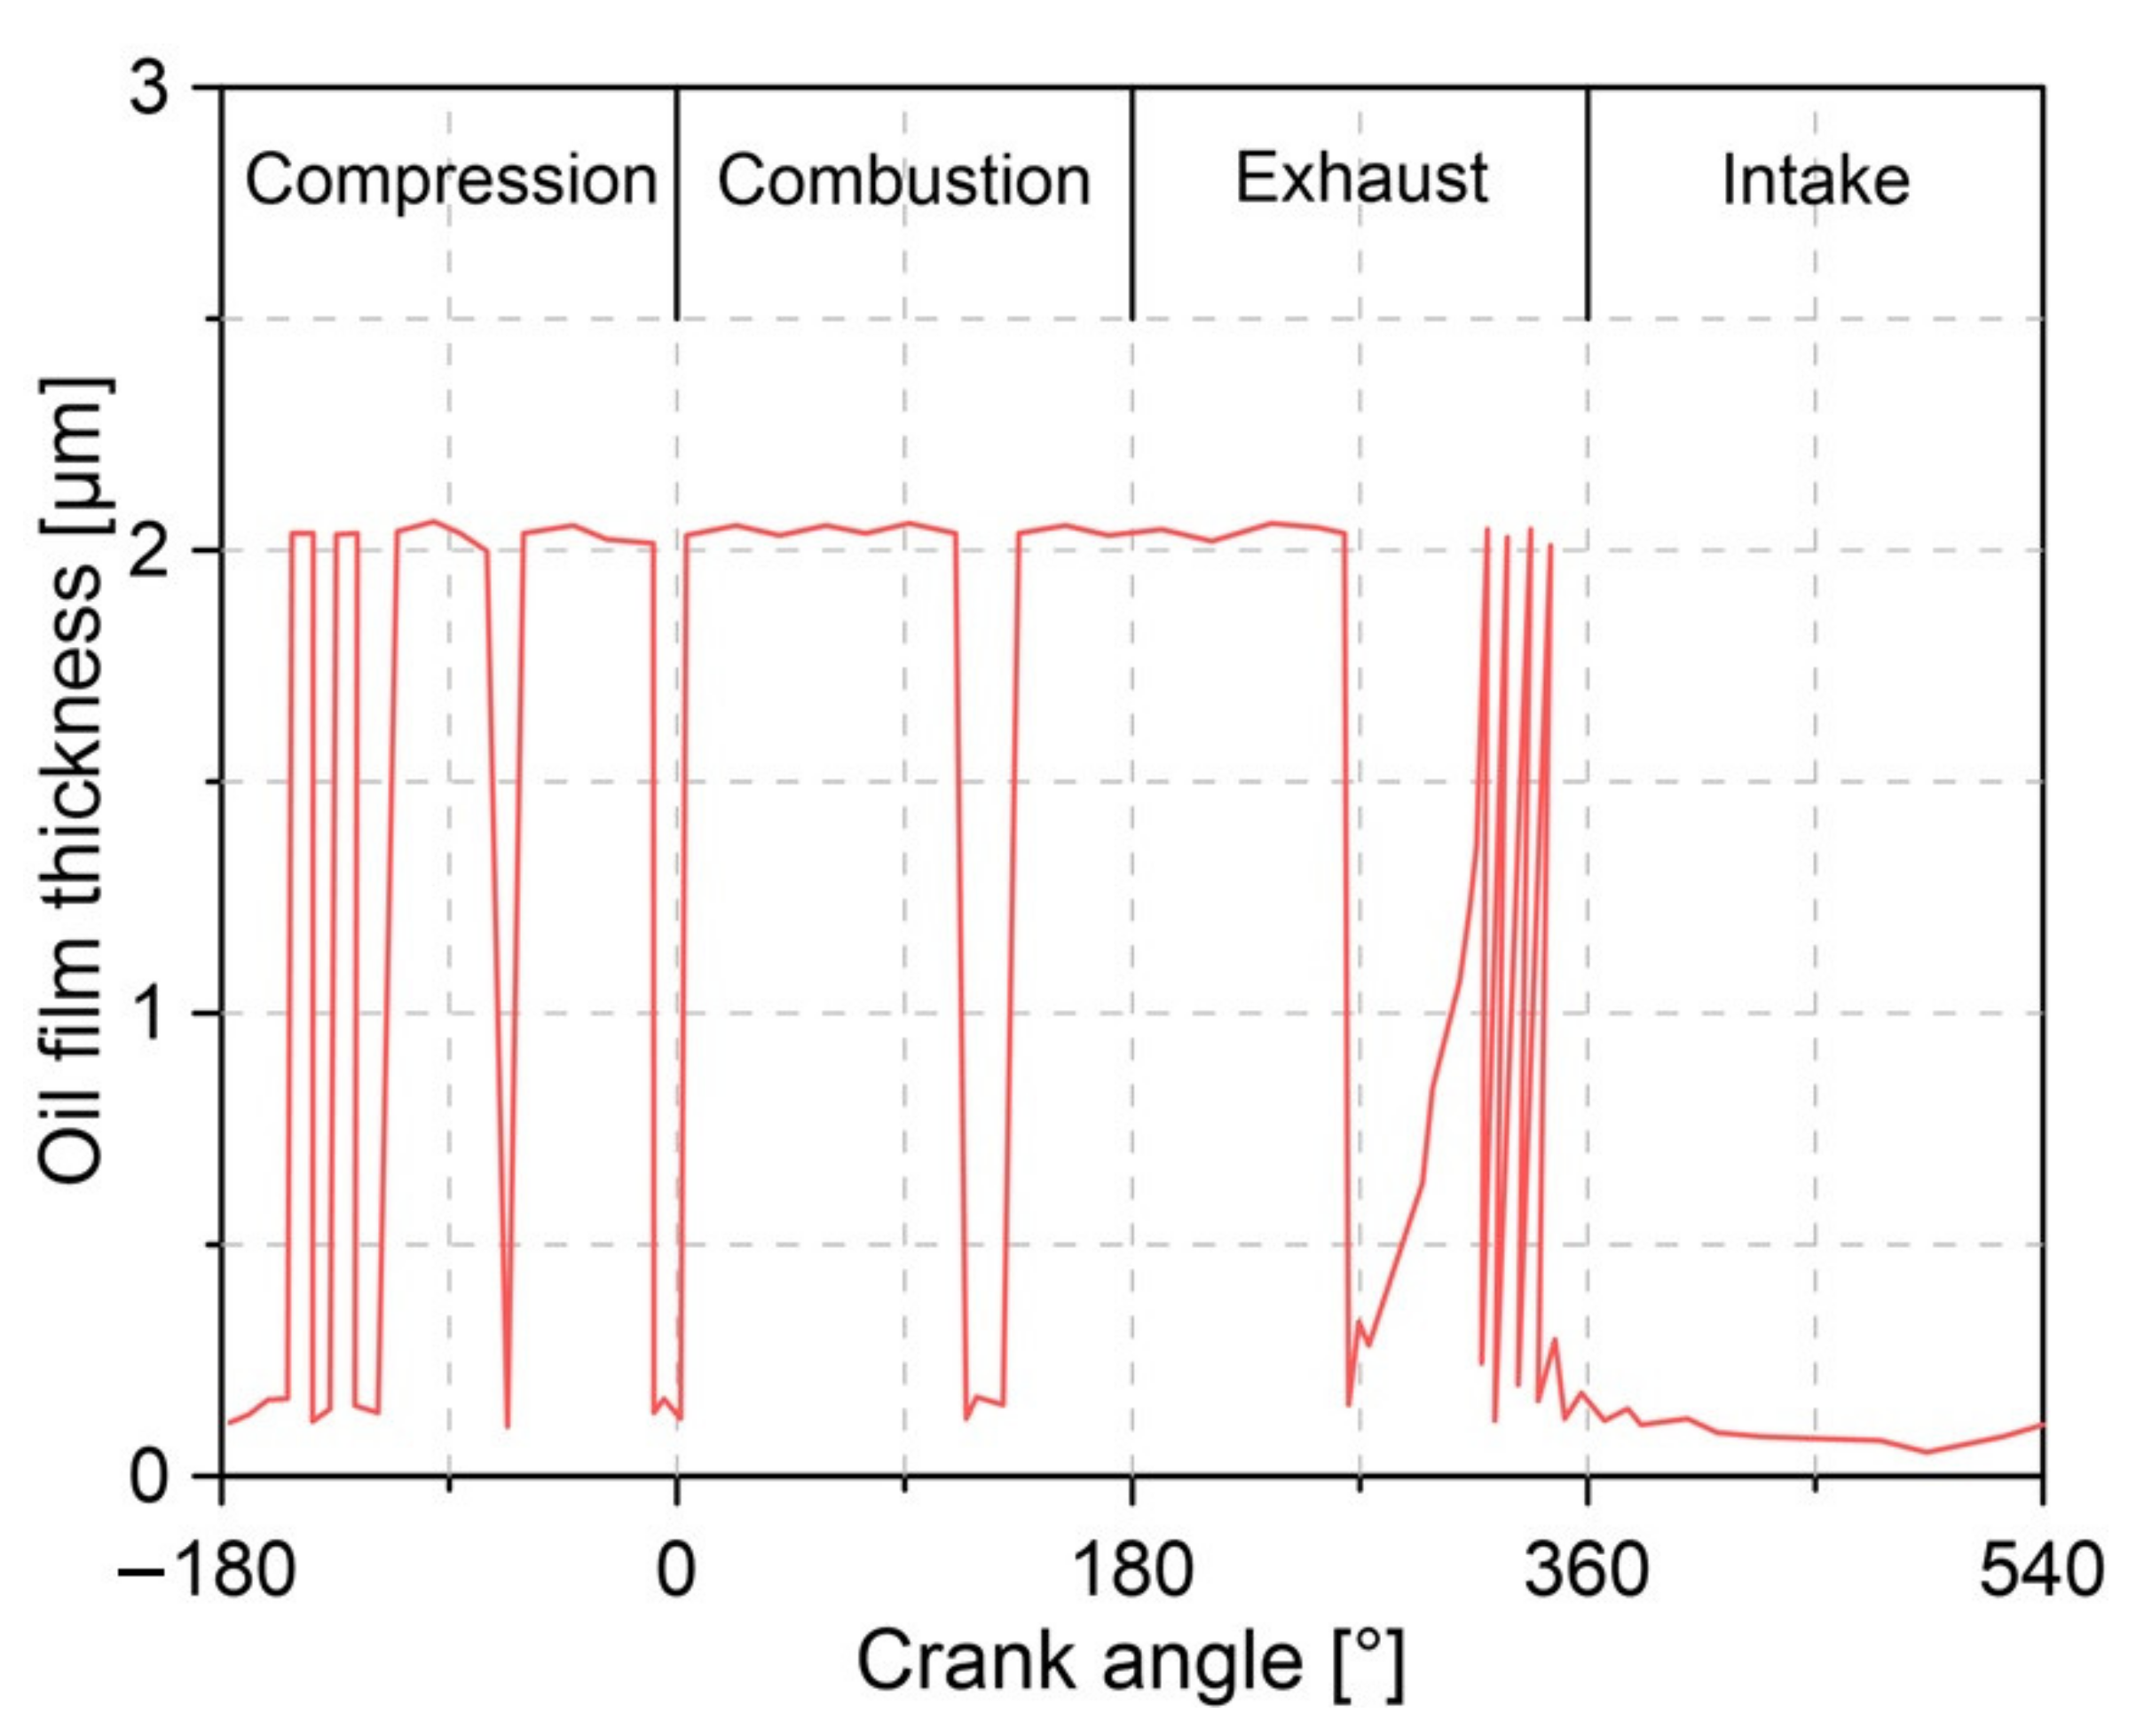
6.4.1. Piston
6.4.2. Valve Train
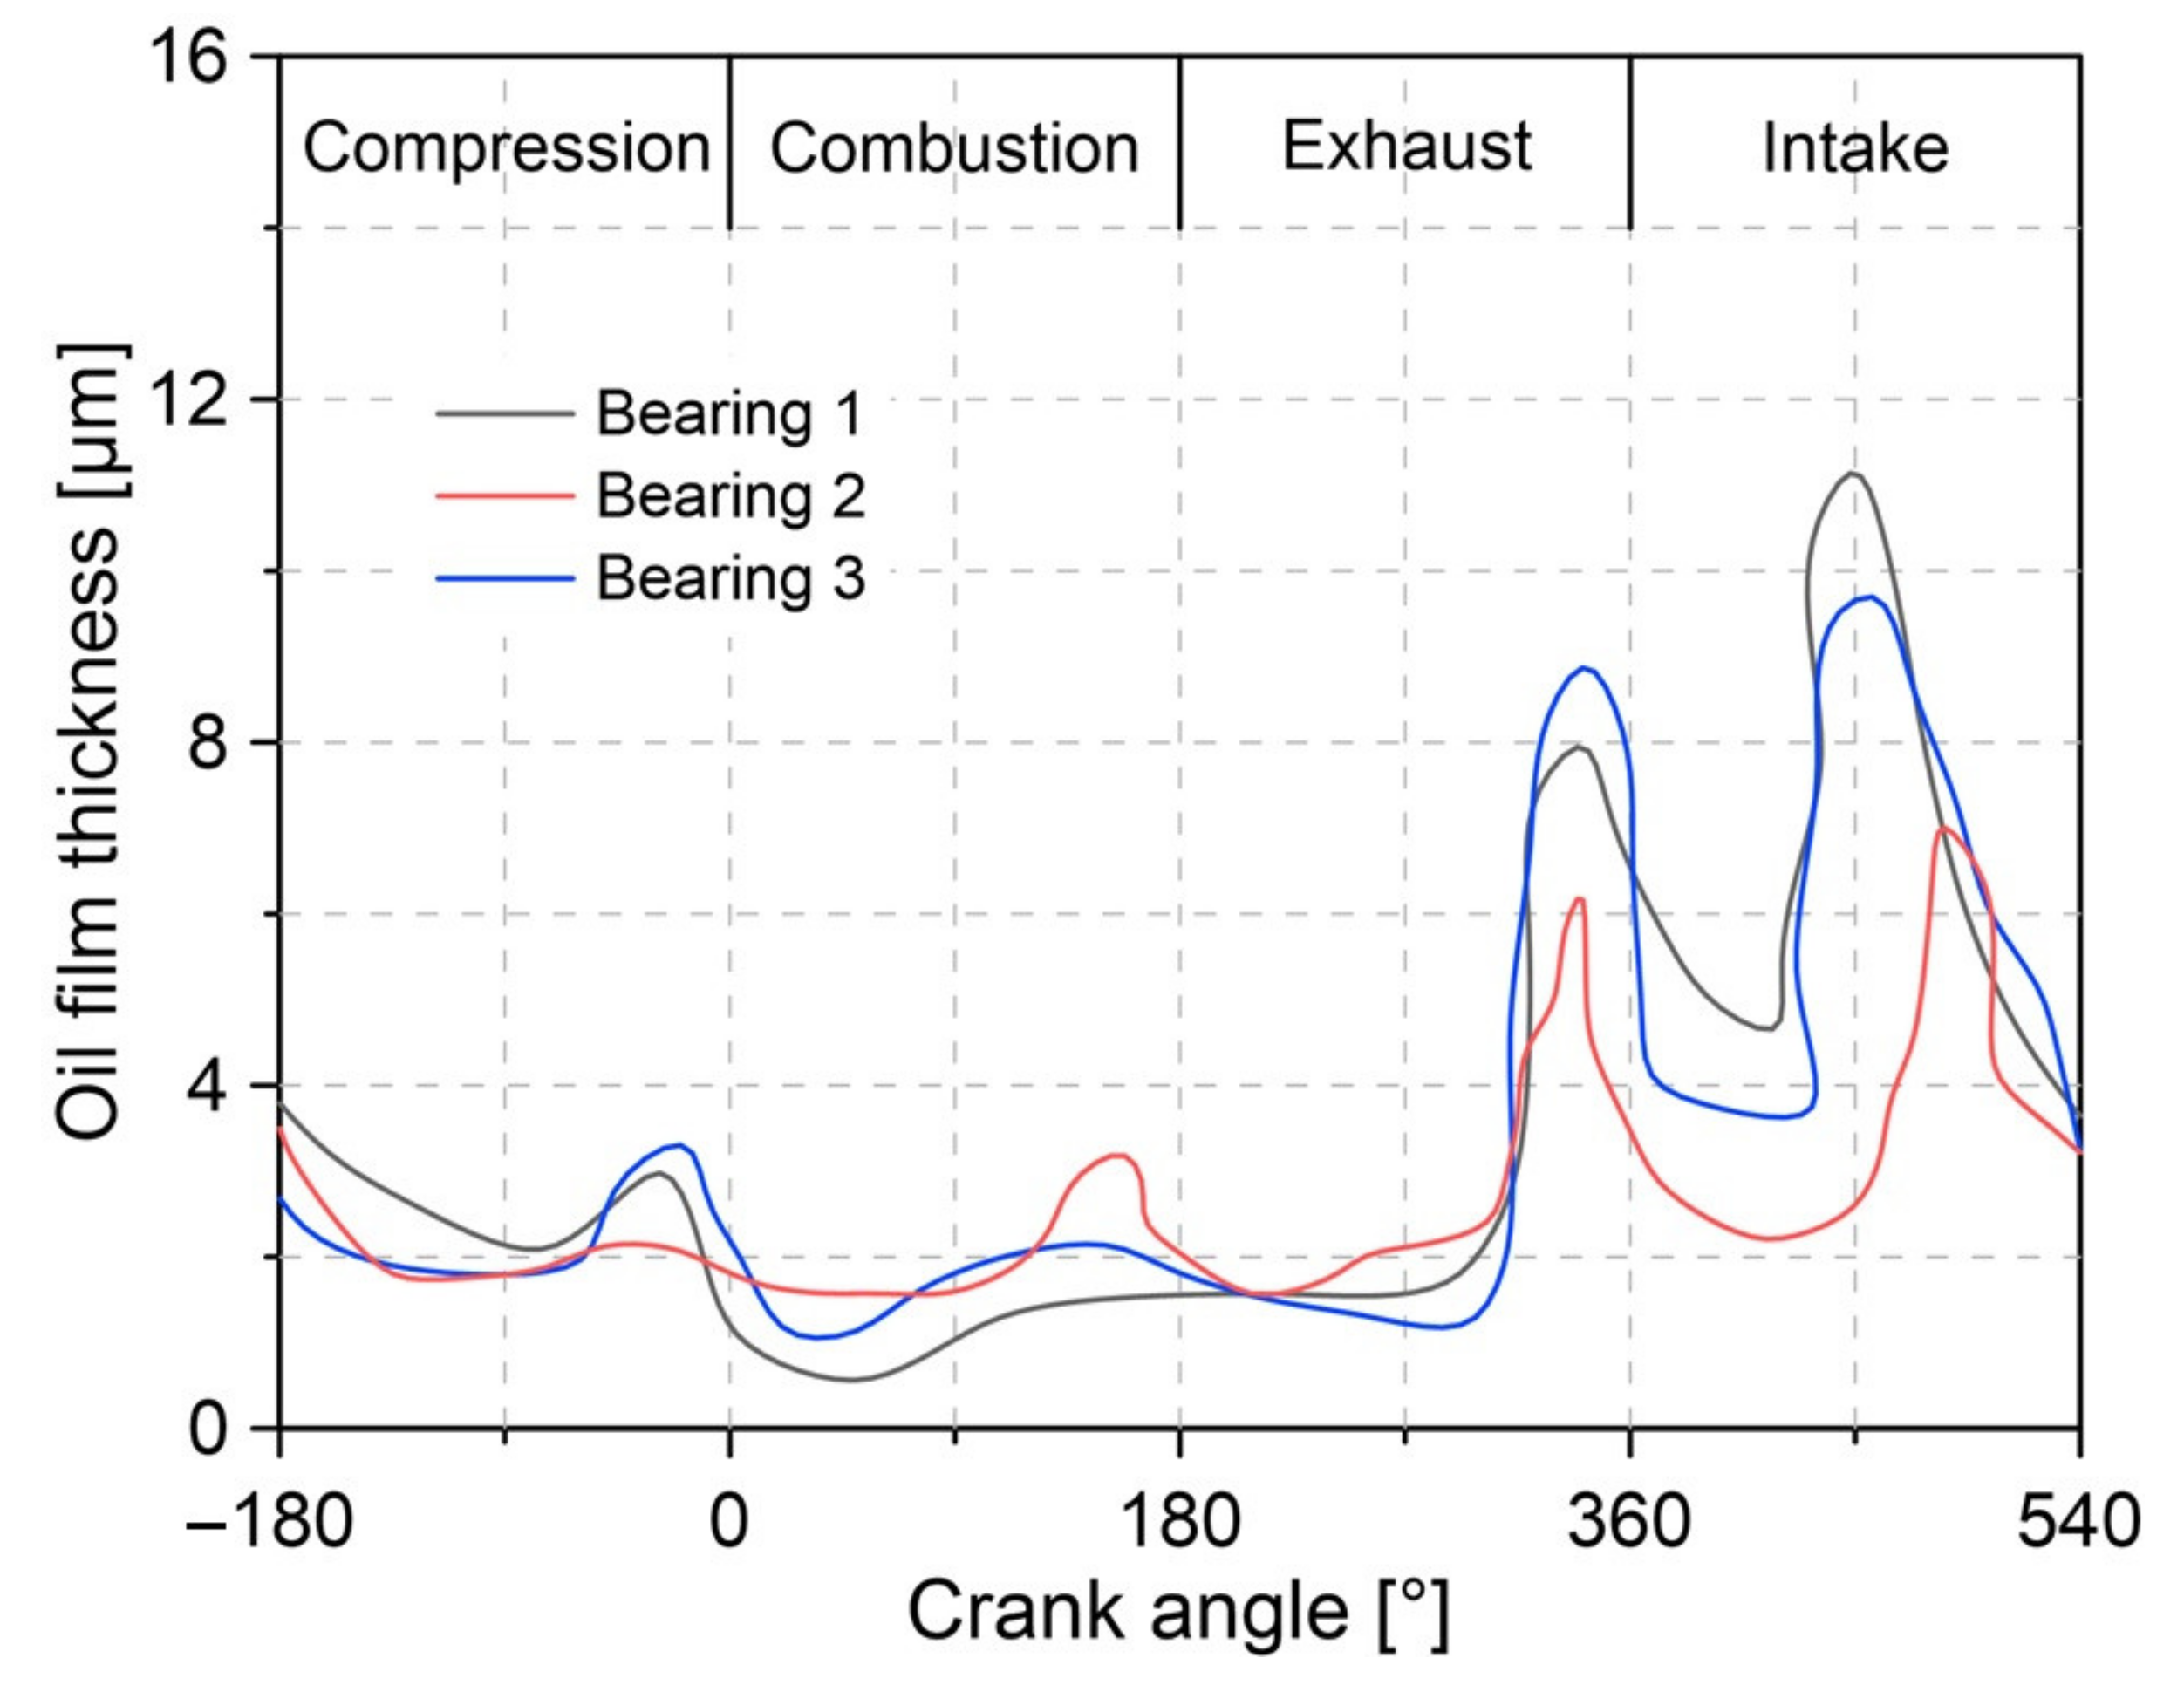
6.4.3. Bearings
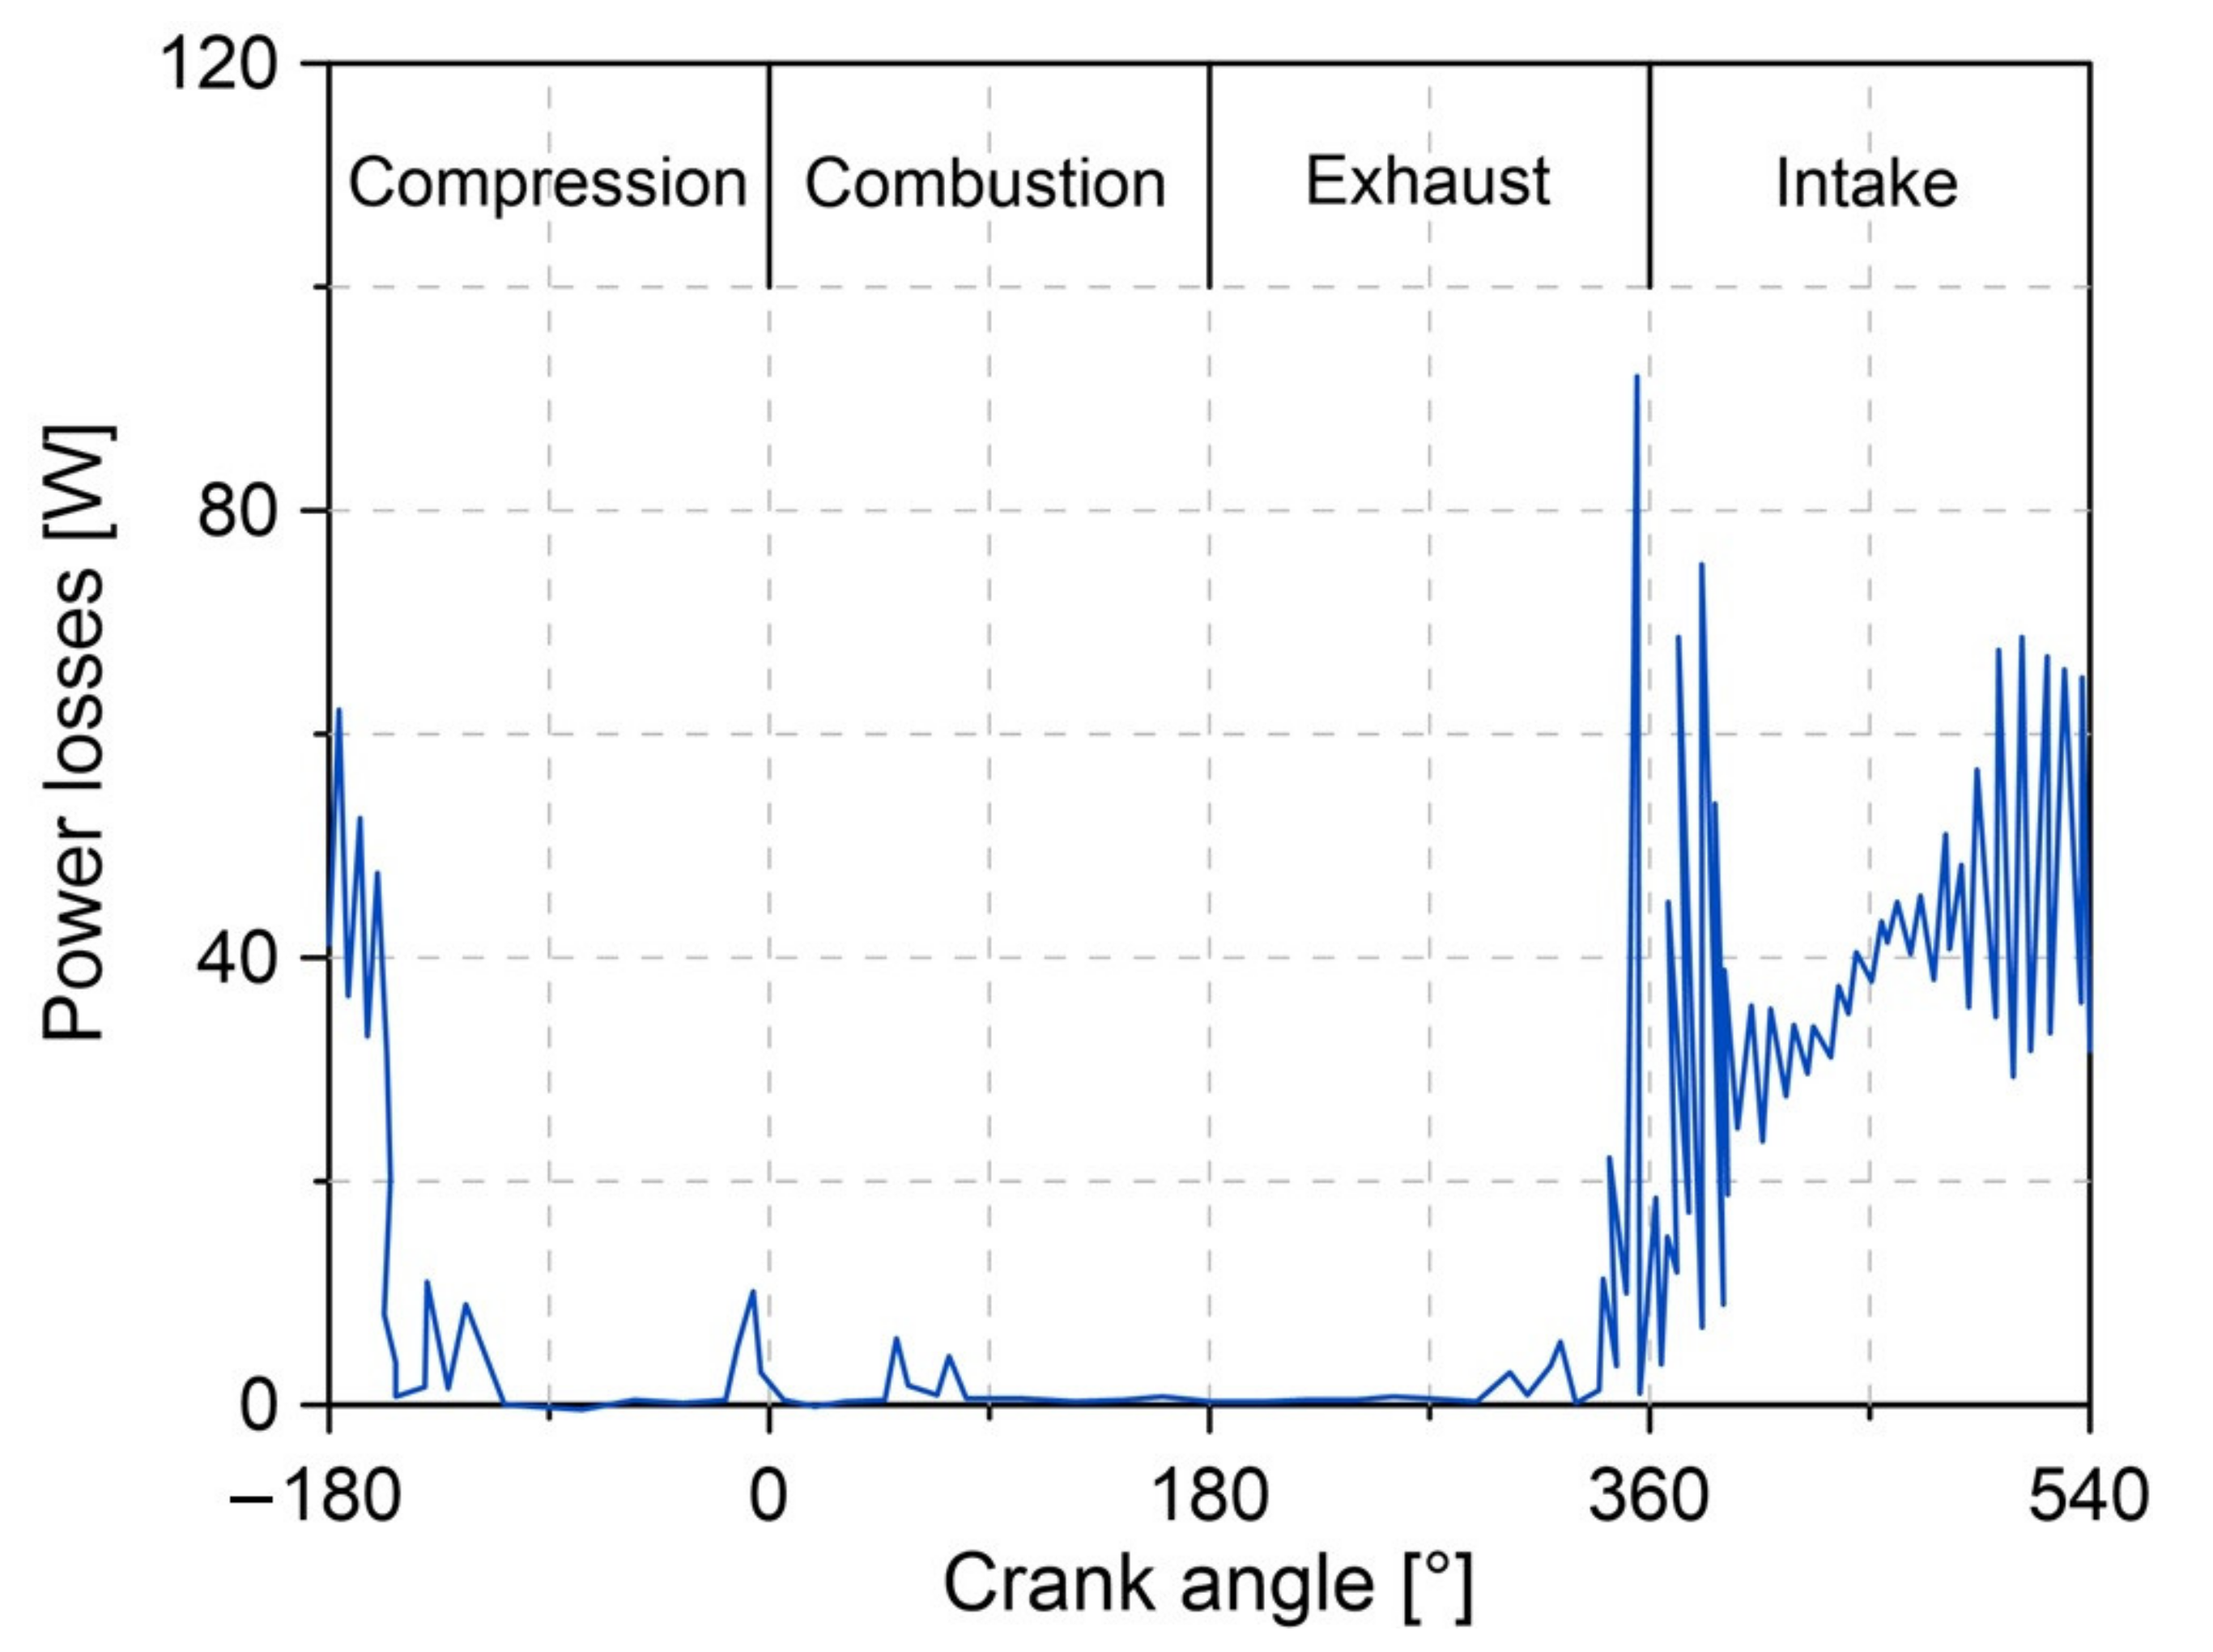
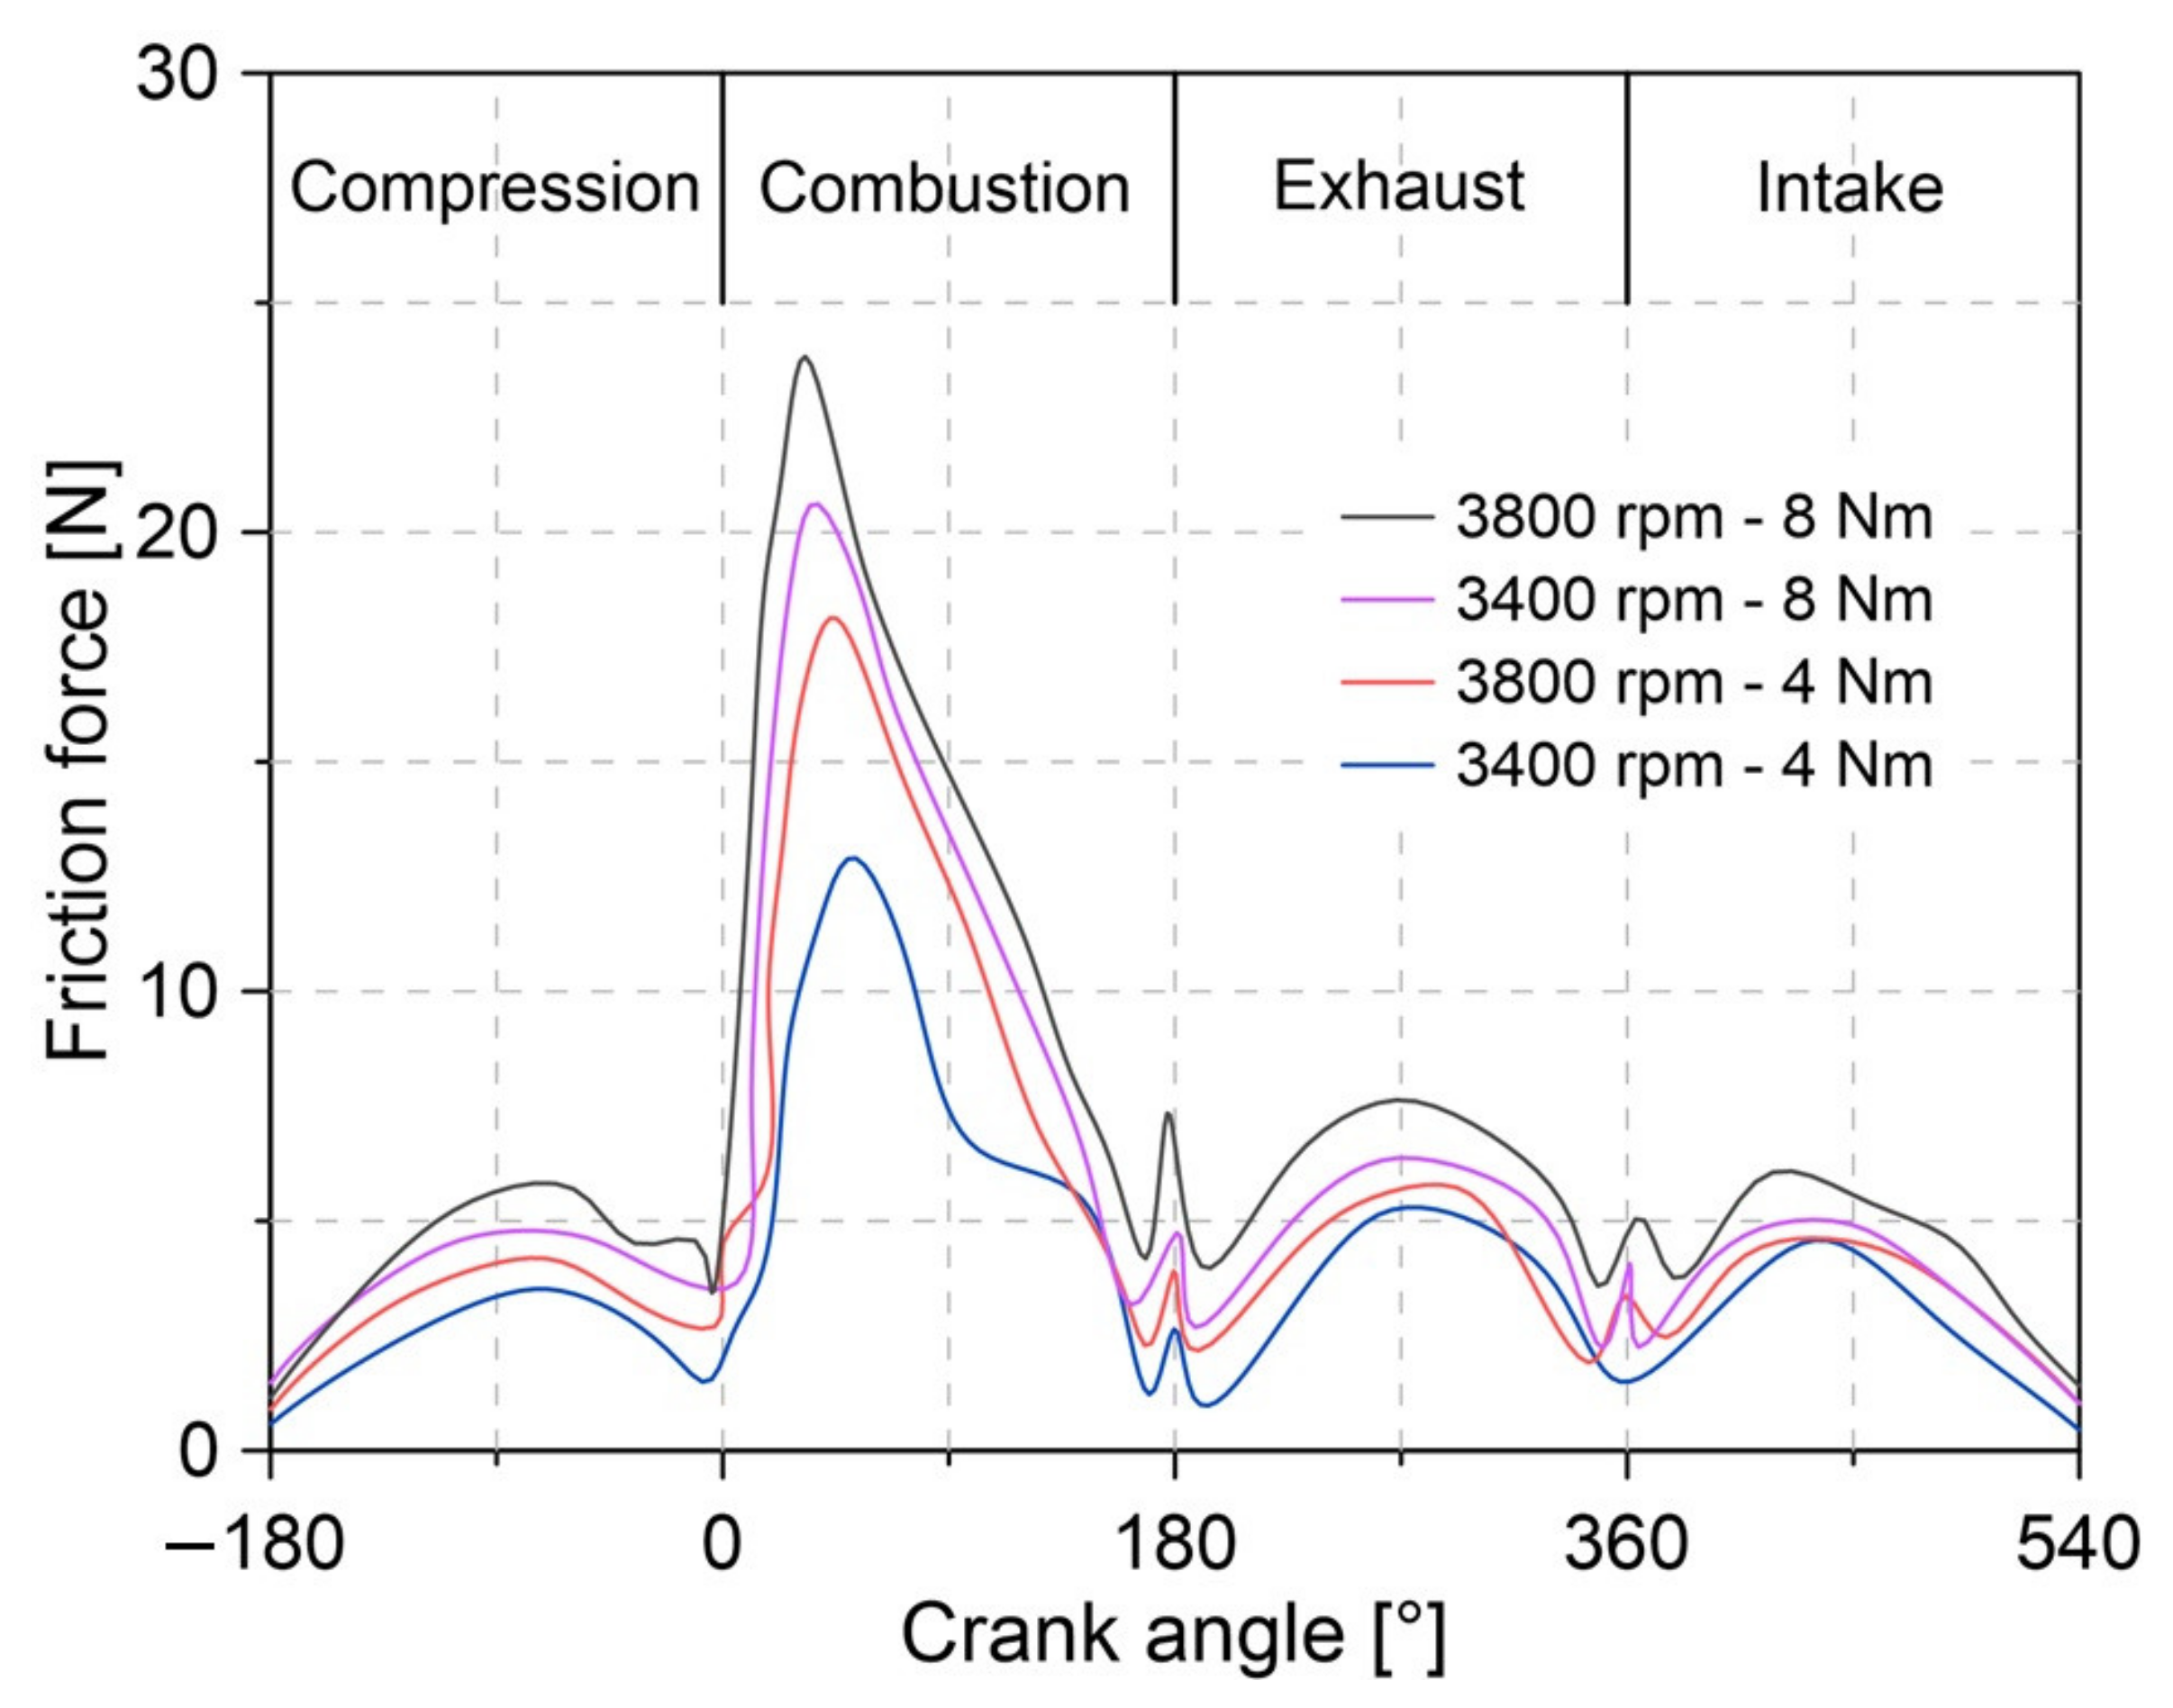
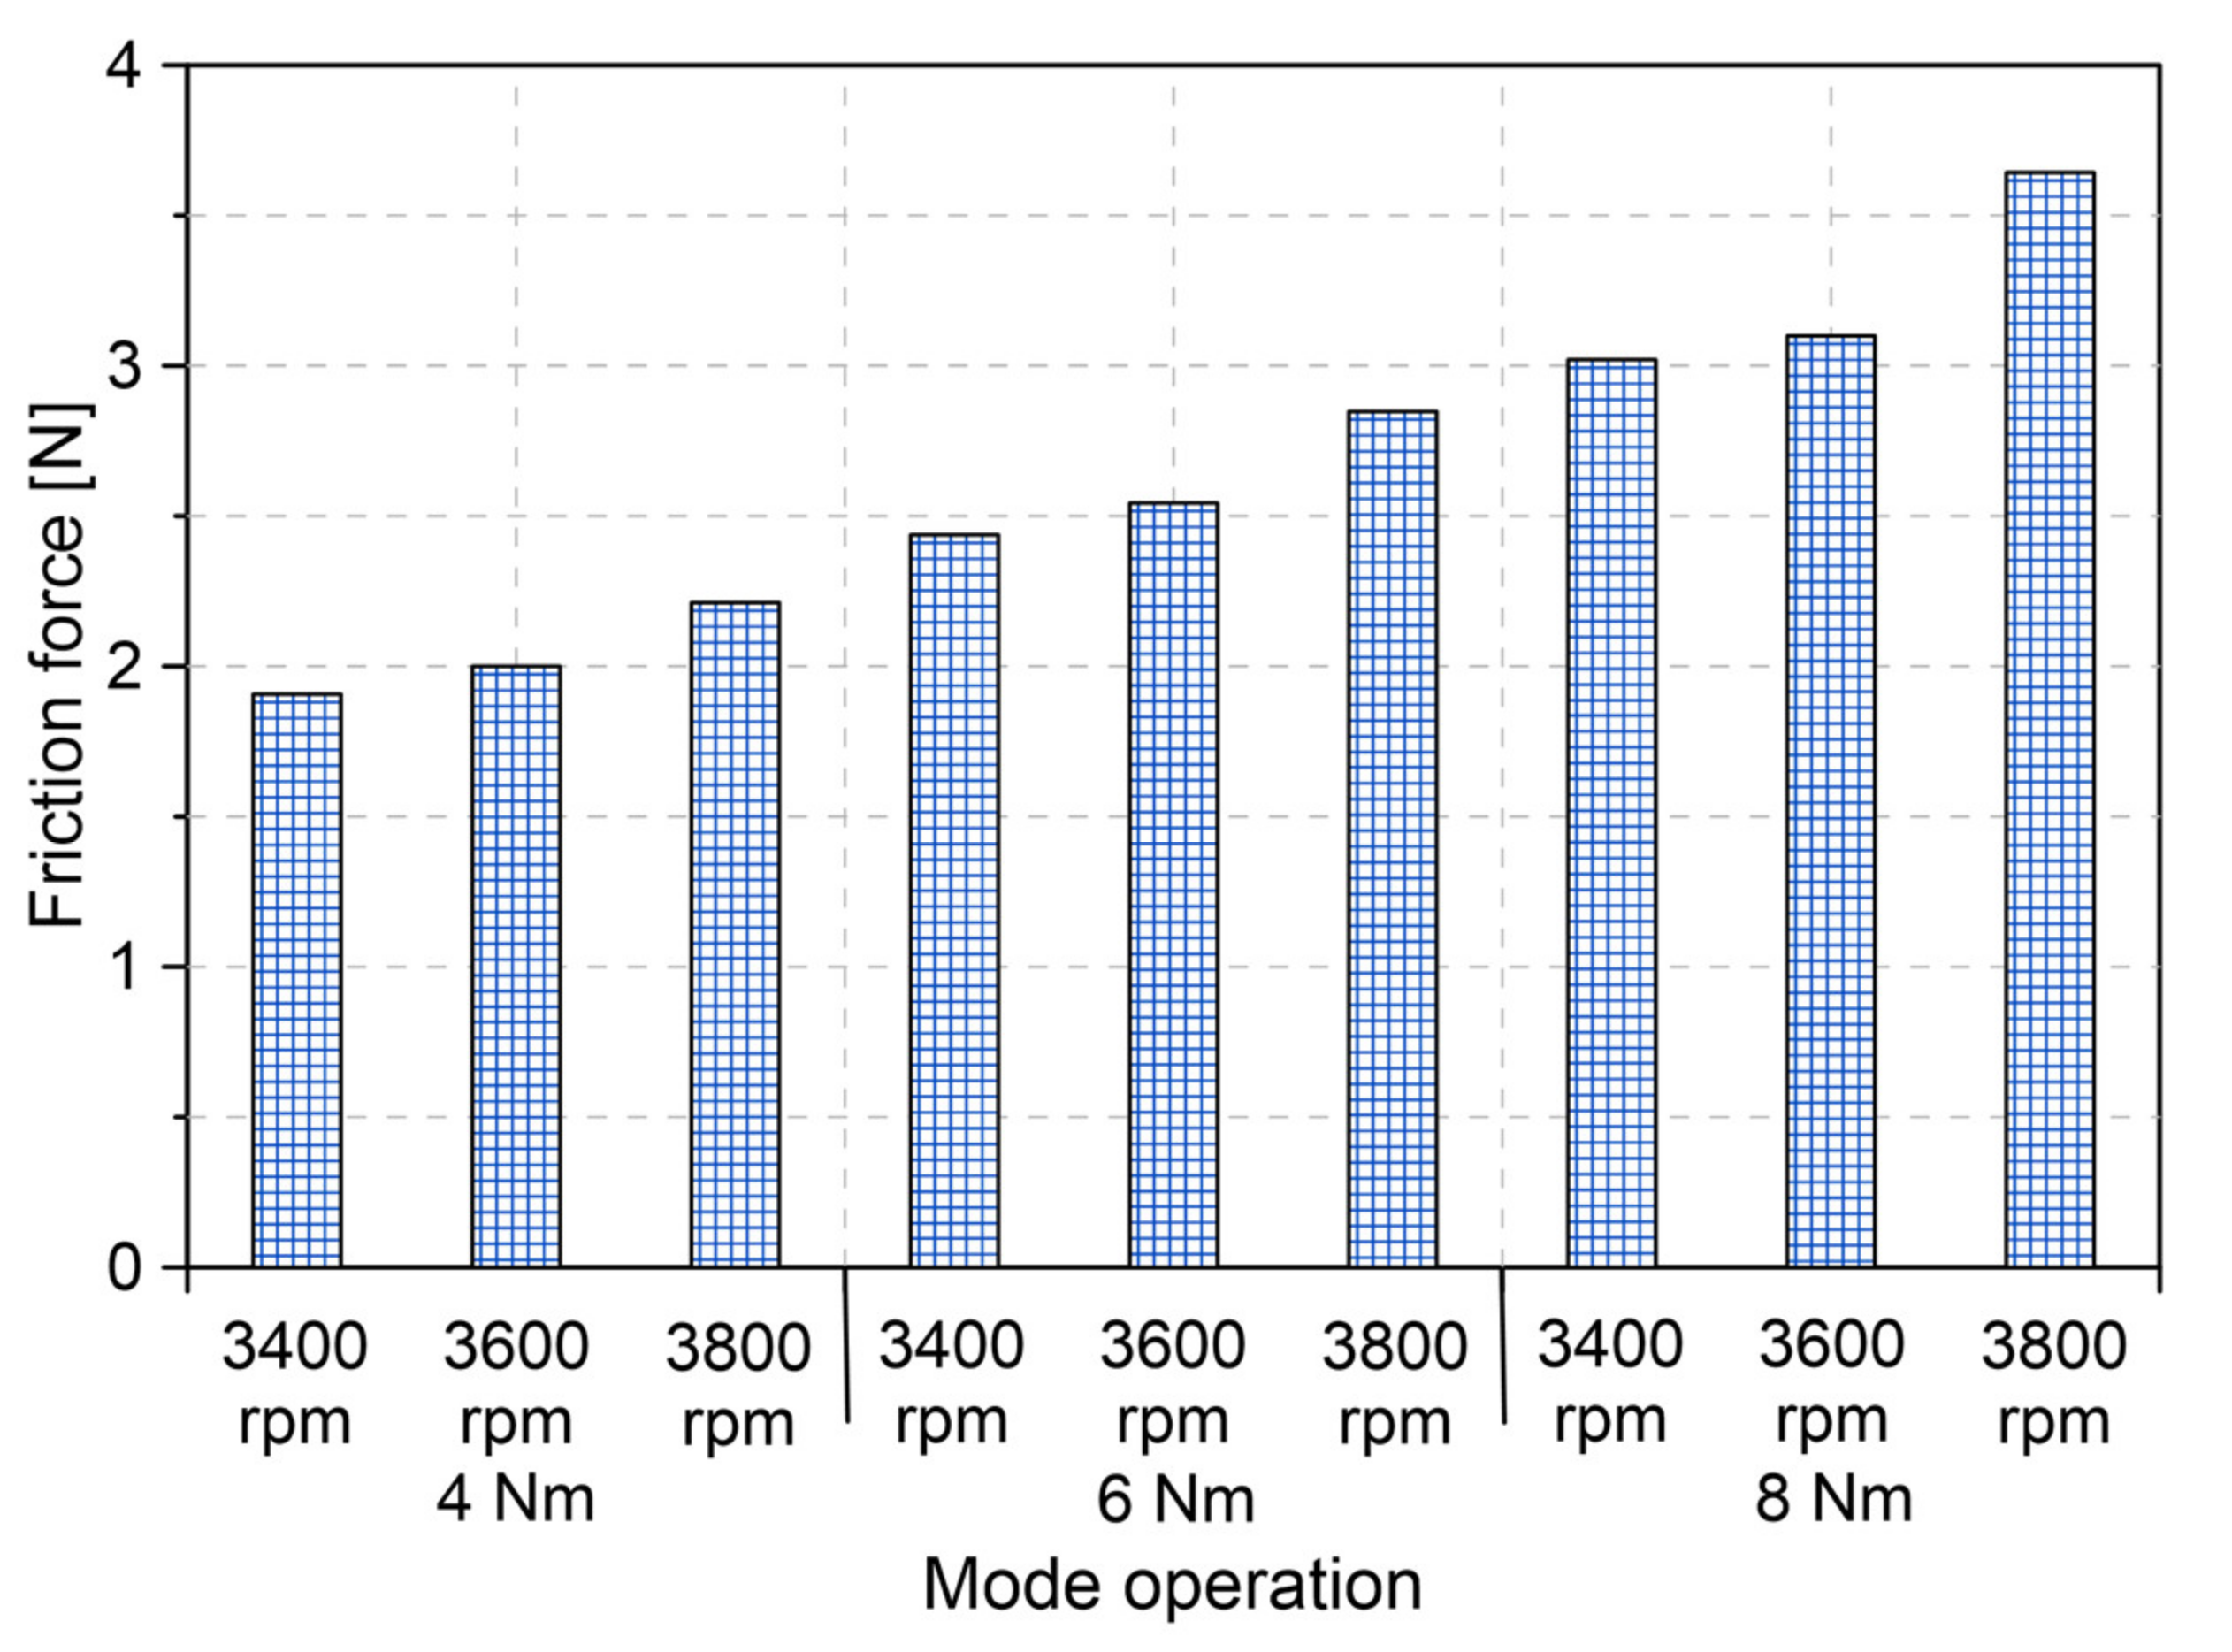
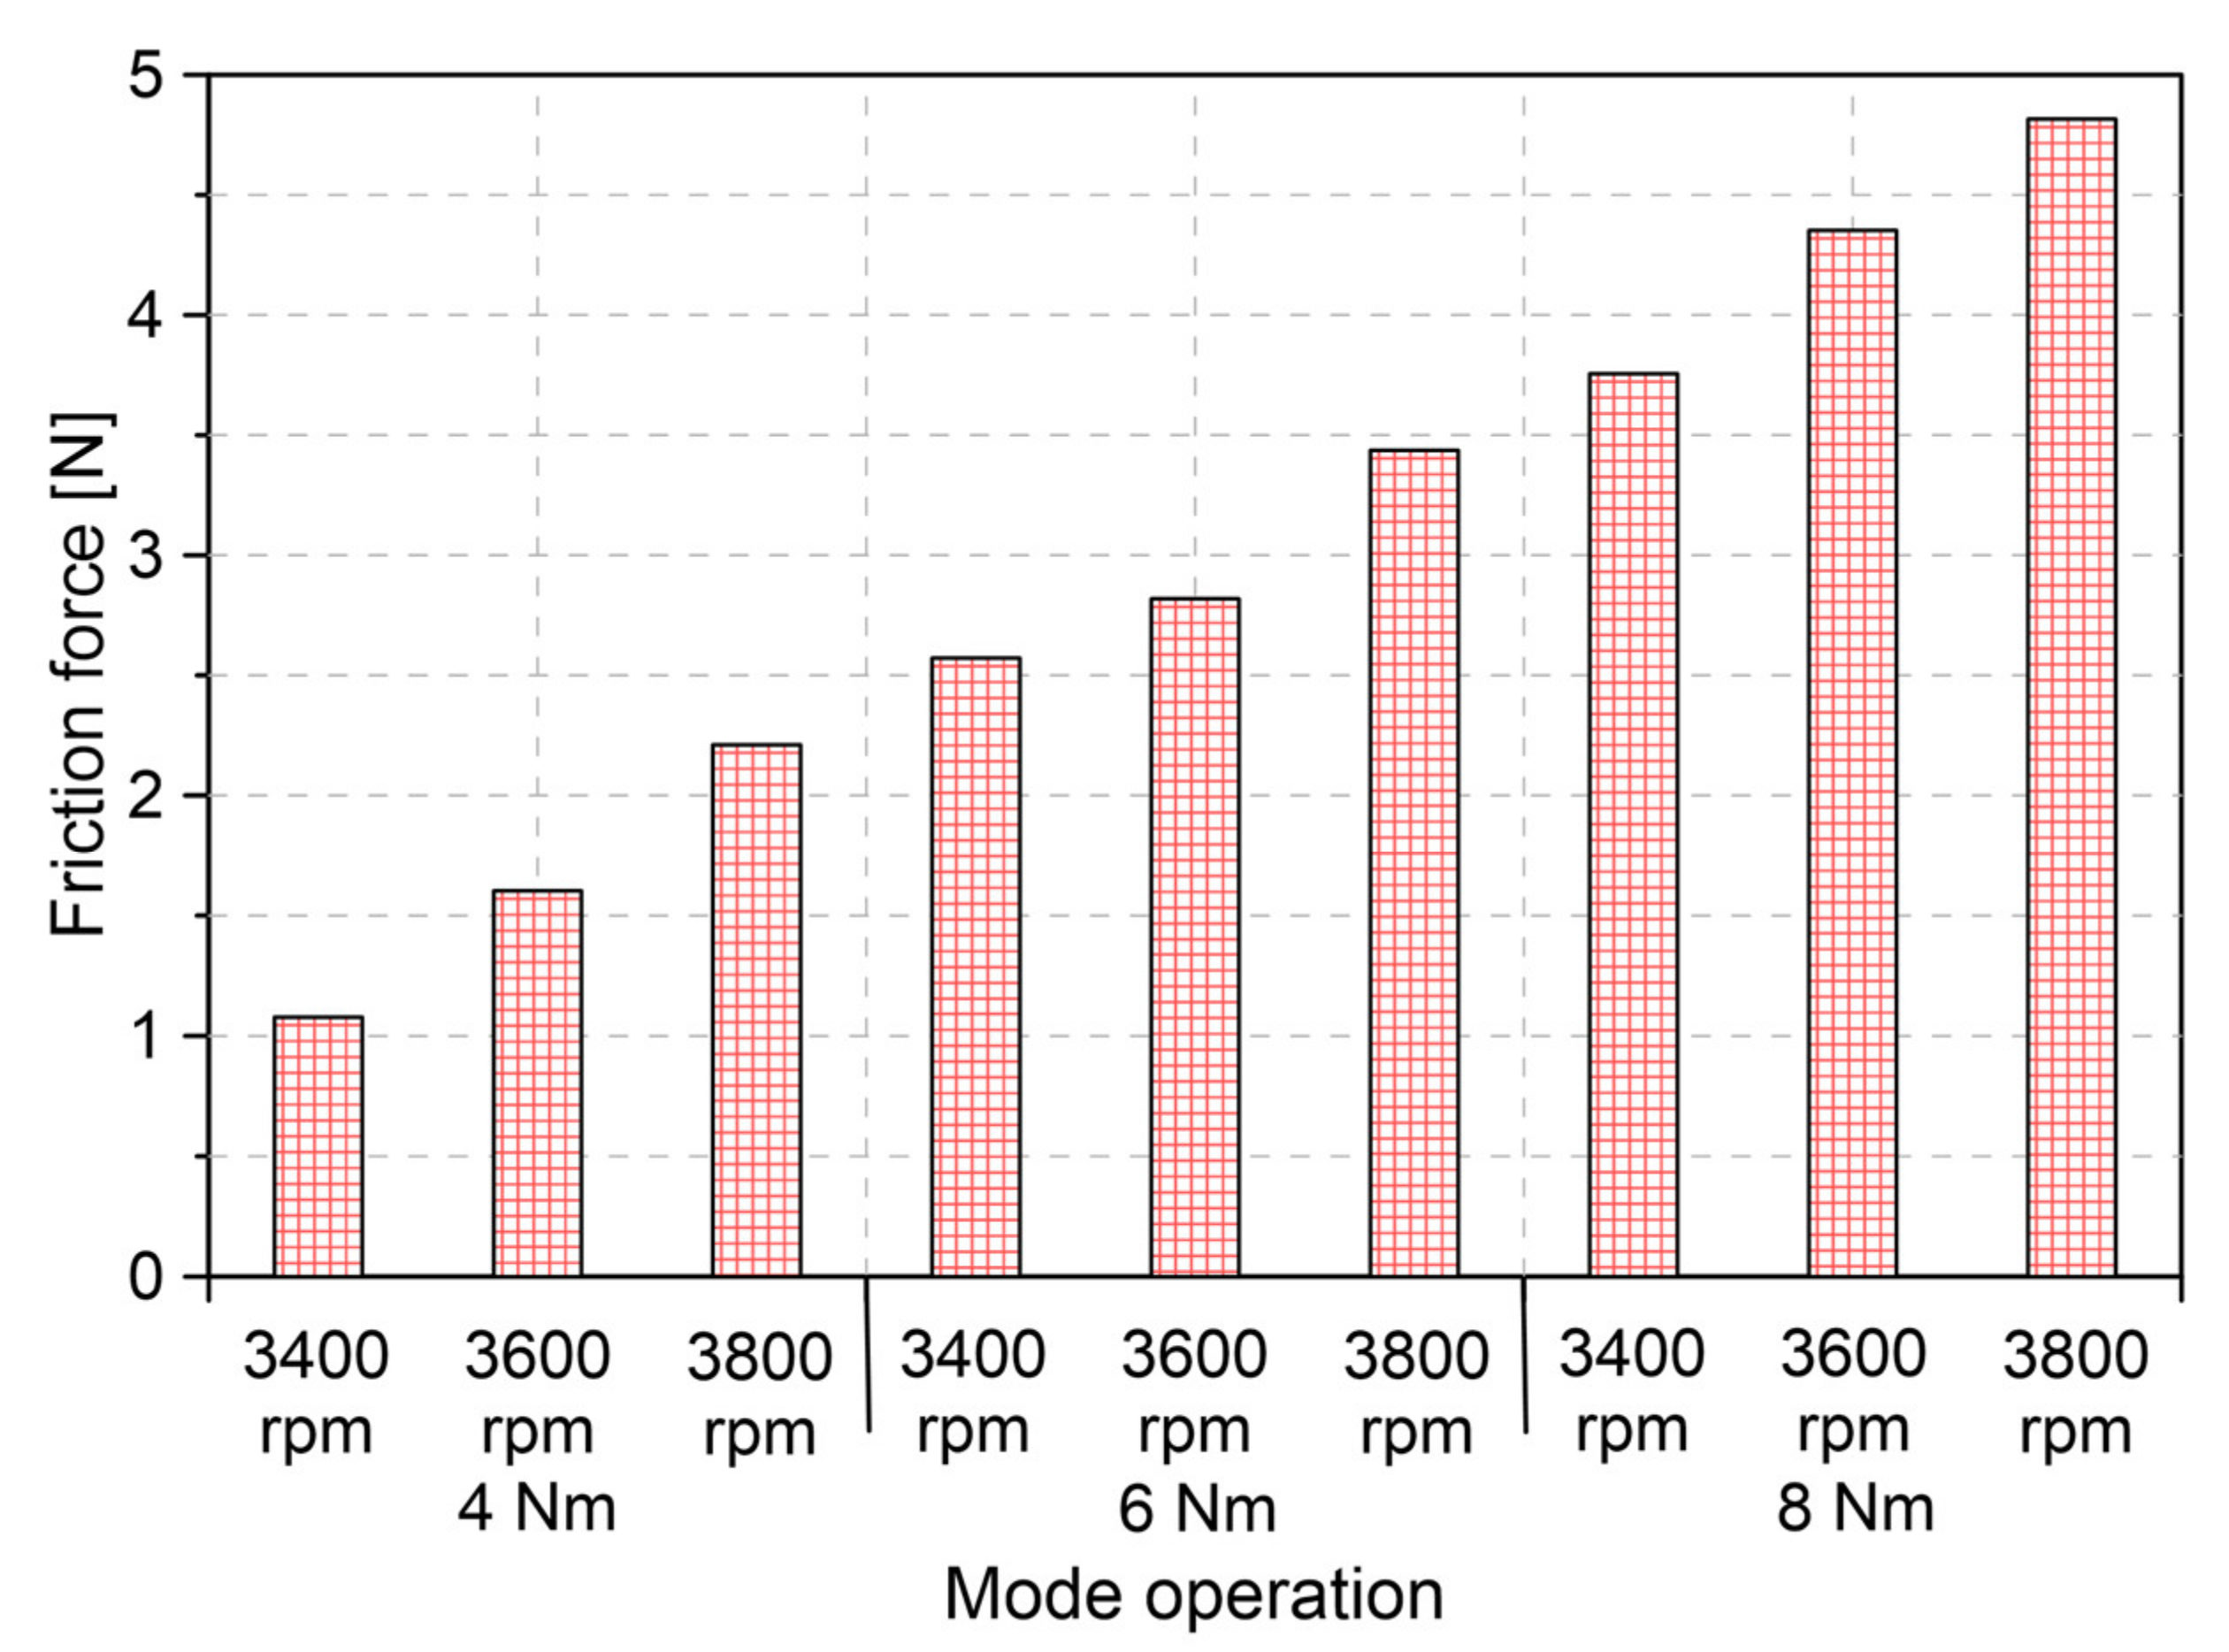
6.5. Friction Force Analysis
7. Conclusions
Author Contributions
Funding
Acknowledgments
Conflicts of Interest
Abbreviations
| Energy losses | |
| Volumetric flow of fuel | |
| Common rail pressure | |
| Mass flow | |
| Pressure drop | |
| Diameter | |
| Length | |
| Friction factor | |
| Gravity | |
| Roughness | |
| Rotational speed | |
| Fan factor | |
| Supply voltage | |
| Electric current | |
| Contact friction between the follower and the cam | |
| Asperity contact force between the follower and the cam | |
| Viscous friction force between the follower and the cam | |
| Coefficient of the shear strength | |
| Load carried by the asperities | |
| Asperity area | |
| Eyring shear stress | |
| Composite surface roughness parameter | |
| Asperities radius of curvature | |
| Asperity density | |
| Effective elastic modulus | |
| Hertzian contact area | |
| Equivalent radius of curvature | |
| Cam width | |
| Force normal | |
| Poisson ratio of the follower | |
| Poisson ratio of the cam | |
| Young module of the follower and cam | |
| Young module of the cam | |
| Statistical function | |
| Separation parameter | |
| Thickness of the lubrication film | |
| Pressure viscosity coefficient | |
| Combined radius of curvature | |
| Entrainment velocity | |
| Contact velocity | |
| Number of intake valves | |
| Number of exhaust valves | |
| Piston velocity | |
| Lubrication film pressure | |
| Frictional force produced between the ring face and the cylinder liner | |
| Asperity friction force between the ring face and the cylinder liner | |
| Viscous friction force between the ring face and the cylinder liner | |
| Piezoelectric viscosity | |
| Thermo-viscosity indice | |
| Thermo-viscosity coefficients | |
| Atmospheric piezo-viscosity | |
| Metal-metal friction coefficient | |
| Asperity contact pressure | |
| Radius of curvature of asperities | |
| Asperity density of the surface | |
| Surface roughness of the cylinder liner | |
| Surface roughness of the piston ring | |
| Gaussian roughness distribution | |
| Angular speed | |
| Bearing length | |
| Bearing length | |
| Clearance between journal and bearing | |
| Speed of the bearing centre displacement | |
| Eccentricity ratio | |
| Eccentricity between the bearing centre and journal | |
| Instantaneous load applied to the bearing | |
| Radial clearance | |
| Greek Letters | |
| Efficiency | |
| Dynamic viscosity | |
| Density | |
| Subscripts | |
| Fuel injection system | |
| Oil pump | |
| Atmospheric conditions | |
| Cooling system | |
References
- Zhang, Q.; Chen, G.; Zheng, Z.; Liu, H.; Xu, J.; Yao, M. Combustion and emissions of 2,5-dimethylfuran addition on a diesel engine with low temperature combustion. Fuel 2013, 103, 730–735. [Google Scholar] [CrossRef]
- Xiao, H.; Guo, F.; Li, S.; Wang, R.; Yang, X. Combustion performance and emission characteristics of a diesel engine burning biodiesel blended with n-butanol. Fuel 2019, 258, 115887. [Google Scholar] [CrossRef]
- Aydin, H.; Ilkılıç, C. Effect of ethanol blending with biodiesel on engine performance and exhaust emissions in a CI engine. Appl. Therm. Eng. 2010, 30, 1199–1204. [Google Scholar] [CrossRef]
- Xiao, H.; Guo, F.; Wang, R.; Yang, X.; Li, S.; Xiao, H. Combustion performance and emission characteristics of diesel engine fueled with iso-butanol/biodiesel blends. Fuel 2020, 268, 117387. [Google Scholar] [CrossRef]
- Erdoğan, S.; Balki, M.K.; Aydın, S.; Sayın, C. Performance, emission and combustion characteristic assessment of biodiesels derived from beef bone marrow in a diesel generator. Energy 2020, 207, 118300. [Google Scholar] [CrossRef]
- Mejía, A.; Leiva, M.; Rincón-Montenegro, A.; Gonzalez-Quiroga, A.; Duarte, J. Experimental assessment of emissions maps of a single-cylinder compression ignition engine powered by diesel and palm oil biodiesel-diesel fuel blends. Case Stud. Therm. Eng. 2020, 19, 100613. [Google Scholar] [CrossRef]
- Ochoa, G.V.; Acevedo, C.; Duarte, J. Thermo-Economic Assessment of a Gas Microturbine-Absorption Chiller Trigeneration System under Different Compressor Inlet Air Temperatures. Energies 2019, 12, 4643. [Google Scholar] [CrossRef]
- Singh, D.; Sharma, D.; Soni, S.; Inda, C.S.; Sharma, S.; Sharma, P.K.; Jhalani, A. A comprehensive review of physicochemical properties, production process, performance and emissions characteristics of 2nd generation biodiesel feedstock: Jatropha curcas. Fuel 2021, 285, 119110. [Google Scholar] [CrossRef]
- European Commission. Setting emisison performace standards for new passenger cars as part of the community’s integrated approach to reduce CO2 emissions from light-duty vehicles. Off. J. Eur. Commun. 2009, 140, 5–6. [Google Scholar]
- Duarte, J.; Garcia, J.; Jimenez, J.; Sanjuan, M.E.; Bula, A.; Gonzalez, J. Auto-ignition control in spark-ignition engines using internal model control structure. J. Energy Res. Technol. 2017, 139, 022201. [Google Scholar] [CrossRef]
- Pietikäinen, M.; Väliheikki, A.; Oravisjärvi, K.; Kolli, T.; Huuhtanen, M.; Niemi, S.; Virtanen, S.; Karhu, T.; Keiski, R.L. Particle and NOx emissions of a non-road diesel engine with an SCR unit: The effect of fuel. Renew. Energy 2015, 77, 377–385. [Google Scholar] [CrossRef]
- Beatrice, C.; Di Iorio, S.; Guido, C.; Napolitano, P. Detailed characterization of particulate emissions of an automotive catalyzed DPF using actual regeneration strategies. Exp. Therm. Fluid Sci. 2012, 39, 45–53. [Google Scholar] [CrossRef]
- Diaz, G.A.; Duarte, J.; Rincon, A.; Fontalvo, A.; Bula, A.; Padilla, R.V.; Orozco, W. Characteristics of Auto-Ignition in Internal Combustion Engines Operated With Gaseous Fuels of Variable Methane Number. J. Energy Resour. Technol. 2017, 139, 042205. [Google Scholar] [CrossRef]
- Diaz, G.A.; Duarte, J.; Garcia, J.; Rincon, A.; Fontalvo, A.; Bula, A.; Padilla, R.V. Maximum Power From Fluid Flow by Applying the First and Second Laws of Thermodynamics. J. Energy Resour. Technol. 2017, 139, 032903. [Google Scholar] [CrossRef]
- Ochoa, G.V.; Isaza-Roldan, C.; Duarte, J. Economic and Exergo-Advance Analysis of a Waste Heat Recovery System Based on Regenerative Organic Rankine Cycle under Organic Fluids with Low Global Warming Potential. Energies 2020, 13, 1317. [Google Scholar] [CrossRef]
- Forero, J.D.; Ochoa, G.V.; Alvarado, W.P. Study of the Piston Secondary Movement on the Tribological Performance of a Single Cylinder Low-Displacement Diesel Engine. Lubricants 2020, 8, 97. [Google Scholar] [CrossRef]
- Duarte Forero, J.; Valencia Ochoa, G.; Piero Rojas, J. Effect of the Geometric Profile of Top Ring on the Tribological Characteristics of a Low-Displacement Diesel Engine. Lubricants 2020, 8, 83. [Google Scholar] [CrossRef]
- Knauder, C.; Allmaier, H.; Sander, D.E.; Salhofer, S.; Reich, F.M.; Sams, T. Analysis of the Journal Bearing Friction Losses in a Heavy-Duty Diesel Engine. Lubricants 2015, 3, 142–154. [Google Scholar] [CrossRef]
- Morawitz, U.; Mehring, J.; Schramm, L. Benefits of Thermal Spray Coatings in Internal Combustion Engines, with Specific View on Friction Reduction and Thermal Management. SAE Tech. Pap. Ser. 2013. [Google Scholar] [CrossRef]
- Tormos, B.; Ramírez, L.; Johansson, J.; Björling, M.; Larsson, R. Fuel consumption and friction benefits of low viscosity engine oils for heavy duty applications. Tribol. Int. 2017, 110, 23–34. [Google Scholar] [CrossRef]
- Tomanik, E. Friction and wear bench tests of different engine liner surface finishes. Tribol. Int. 2008, 41, 1032–1038. [Google Scholar] [CrossRef]
- Consuegra, F.; Bula, A.; Guillín, W.; Sánchez, J.; Duarte, J. Instantaneous in-Cylinder Volume Considering Deformation and Clearance due to Lubricating Film in Reciprocating Internal Combustion Engines. Energies 2019, 12, 1437. [Google Scholar] [CrossRef]
- Hoshi, M. Reducing friction losses in automobile engines. Tribol. Int. 1984, 17, 185–189. [Google Scholar] [CrossRef]
- Dowson, D.; Taylor, C.M.; Yang, L. Friction modelling for internal combustion engines. In Tribology Series; Elsevier: Amsterdam, The Netherlands, 1996; pp. 301–318. [Google Scholar]
- DuBois, G.B.; Ocvirk, F.W. Analytical Derivation and Experimental Evaluation of Short-Bearing Approximation for Full Journal Bearings. Natl. Advis. Comm. Aeronaut. 1953, 1157, 1–32. [Google Scholar]
- Taraza, D.; A Henein, N.; Bryzik, W. Friction Losses in Multi-Cylinder Diesel Engines; SAE International: Warrendale, PA, USA, 2000. [Google Scholar]
- Furuhama, S.; Sasaki, S. Effect of oil properties on piston frictional forces. Int. J. Veh. Des. 1986. [Google Scholar] [CrossRef]
- Tian, T. Dynamic behaviours of piston rings and their practical impact. Part 2: Oil transport, friction and wear of ring/liner interface and the effects of piston and ring dynamics. Proc. Inst. Mech. Eng. Part J: J. Eng. Tribol. 2002, 216, 229–248. [Google Scholar] [CrossRef]
- Liu, C.; Lu, Y.; Zhang, Y.-F.; Li, S.; Müller, N. Numerical study on the lubrication performance of compression ring-cylinder liner system with spherical dimples. PLoS ONE 2017, 12, e0181574. [Google Scholar] [CrossRef]
- Avan, E.Y.; Spencer, A.; Dwyer-Joyce, R.S.; Almqvist, A.; Larsson, R. Experimental and numerical investigations of oil film formation and friction in a piston ring–liner contact. Proc. Inst. Mech. Eng. Part J J. Eng. Tribol. 2012, 227, 126–140. [Google Scholar] [CrossRef]
- Jocsak, J.; Wong, V.W.; Tian, T. The Effects of Cylinder Liner Finish on Piston Ring-Pack Friction. In Proceedings of the ASME 2004 Internal Combustion Engine Division Fall Technical Conference, Long Beach, CA, USA, 24–27 October 2004; pp. 841–849. [Google Scholar] [CrossRef]
- Allmaier, H.; Sander, D.E.; Reich, F. Simulating Friction Power Losses in Automotive Journal Bearings. Procedia Eng. 2013, 68, 49–55. [Google Scholar] [CrossRef][Green Version]
- Sander, D.; Allmaier, H.; Priebsch, H.; Reich, F.; Witt, M.; Füllenbach, T.; Skiadas, A.; Brouwer, L.; Schwarze, H. Impact of high pressure and shear thinning on journal bearing friction. Tribol. Int. 2015, 81, 29–37. [Google Scholar] [CrossRef]
- Turturro, A.; Rahmani, R.K.; Rahnejat, H.; Delprete, C.; Magro, L. Assessment of Friction for Cam-Roller Follower Valve Train System Subjected to Mixed Non-Newtonian Regime of Lubrication. In ASME 2012 Internal Combustion Engine Division Spring Technical Conference; ASME International: New York, NY, USA, 2012; pp. 917–923. [Google Scholar]
- Masjedi, M.; Khonsari, M. Film Thickness and Asperity Load Formulas for Line-Contact Elastohydrodynamic Lubrication With Provision for Surface Roughness. J. Tribol. 2012, 134, 011503. [Google Scholar] [CrossRef]
- Priest, M.; Taylor, C. Automobile engine tribology—Approaching the surface. Wear 2000, 241, 193–203. [Google Scholar] [CrossRef]
- Offner, G. Friction Power Loss Simulation of Internal Combustion Engines Considering Mixed Lubricated Radial Slider, Axial Slider and Piston to Liner Contacts. Tribol. Trans. 2013, 56, 503–515. [Google Scholar] [CrossRef]
- Westerfield, Z.; Totaro, P.; Kim, D.; Tian, T. An Experimental Study of Piston Skirt Roughness and Profiles on Piston Friction Using the Floating Liner Engine; SAE International: Warrendale, PA, USA, 2016. [Google Scholar]
- Mufti, R.A.; Priest, M. Experimental and Theoretical Study of Instantaneous Engine Valve Train Friction. J. Tribol. 2003, 125, 628–637. [Google Scholar] [CrossRef]
- Marušić-Paloka, E.; Pažanin, I. Effects of boundary roughness and inertia on the fluid flow through a corrugated pipe and the formula for the Darcy-Weisbach friction coefficient. Int. J. Eng. Sci. 2020, 152, 103293. [Google Scholar] [CrossRef]
- Moody, L.F. Approximate formula for pipe friction factors. Mech. Eng. 1947, 69, 1005–1011. [Google Scholar]
- Wang, T.T.; Jagarwal, A.; Wagner, J.R.; Fadel, G. Optimization of an automotive radiator fan array operation to reduce power consumption. IEEE ASME Trans. Mechatronics 2014, 20, 2359–2369. [Google Scholar] [CrossRef]
- Teodorescu, M.; Taraza, D.; Henein, N.A.; Bryzik, W. Simplified Elasto-Hydrodynamic Friction Model of the Cam-Tappet Contact. SAE Tech. Pap. Ser. 2003. [Google Scholar] [CrossRef]
- Guo, J.; Zhang, W.; Zou, D. Investigation of dynamic characteristics of a valve train system. Mech. Mach. Theory 2011, 46, 1950–1969. [Google Scholar] [CrossRef]
- Greenwood, J.A.; Williamson, J.B.P. Contact of nominally flat surfaces. Proc. R. Soc. London. Ser. A Math. Phys. Sci. 1966, 295, 300–319. [Google Scholar] [CrossRef]
- Sadeghi, F.; Slack, T. Handbook of Lubrication and Tribology; CRC Press: Boca Raton, FL, USA, 2012; Volume II. [Google Scholar] [CrossRef]
- Goksem, P.G.; Hargreaves, R.A. The Effect of Viscous Shear Heating on Both Film Thickness and Rolling Traction in an EHL Line Contact—Part I: Fully Flooded Conditions. J. Lubricants Technol. 1978, 100, 346–352. [Google Scholar] [CrossRef]
- Dowson, D.; Higginson, G.R. Elasto-Hydrodynamic Lubrication; Pergamon: Oxford, UK, 1977. [Google Scholar]
- Menacer, B.; Bouchetara, M. The compression ring profile influence on hydrodynamic performance of the lubricant in diesel engine. Adv. Mech. Eng. 2020, 12, 168781402093084. [Google Scholar] [CrossRef]
- Delprete, C.; Razavykia, A.; Baldissera, P. Detailed analysis of piston secondary motion and tribological performance. Int. J. Engine Res. 2020, 21, 1647–1661. [Google Scholar] [CrossRef]
- Jang, S.; Cho, J. Effects of skirt profiles on the piston secondary movements by the lubrication behaviors. Int. J. Automot. Technol. 2004, 5, 23–31. [Google Scholar]
- Delprete, C.; Razavykia, A. Piston dynamics, lubrication and tribological performance evaluation: A review. Int. J. Engine Res. 2020, 21, 725–741. [Google Scholar] [CrossRef]
- Jeng, Y.-R. Theoretical Analysis of Piston-Ring Lubrication Part I—Fully Flooded Lubrication. Tribol. Trans. 1992, 35, 696–706. [Google Scholar] [CrossRef]
- Greenwood, J.A.; Tripp, J.H. The Contact of Two Nominally Flat Rough Surfaces. Proc. Inst. Mech. Eng. 1970, 185, 625–633. [Google Scholar] [CrossRef]
- Teodorescu, M.; Balakrishnan, S.; Rahnejat, H. Integrated Tribological Analysis within a Multi-physics Approach to System Dynamics. Tribol. Metal Cutt. 2005, 48, 725–737. [Google Scholar] [CrossRef]
- Taylor, C. Engine tribology. Tribol. Int. 1997, 30, 464–465. [Google Scholar] [CrossRef]
- Internal combustion engine fundamentals. Choice Rev. Online 1988, 26, 26. [CrossRef]
- Nikolakopoulos, P.G.; Mavroudis, S.; Zavos, A. Lubrication Performance of Engine Commercial Oils with Different Performance Levels: The Effect of Engine Synthetic Oil Aging on Piston Ring Tribology under Real Engine Conditions. Lubricants 2018, 6, 90. [Google Scholar] [CrossRef]


| Engine | SOKAN |
|---|---|
| Model | SK-MDF300 |
| Compression ratio | 20:1 |
| Number of cylinders | 1 |
| Fuel injection system | Direct injection |
| Cylinder stroke/bore [mm] | 63/78 |
| Intake system | Naturally Aspirated |
| Volume [cc] | 300 |
| Cycle | 4 Strokes |
| SAE15W-40 | |
|---|---|
| Density at 20 °C | 0.864 g/cm3 (DIN 51757) |
| Pourpoint | −33 °C (ISO 3016) |
| Viscosity at 40 °C | 91.76 mm2/s |
| Flashpoint | 224 °C (DIN ISO 2592) |
| Lower explosion limit | 0.6 vol% |
| Upper explosion limit | 6.5 vol% |
| Properties | Units | Diesel | Hydroxy Gas |
|---|---|---|---|
| Density | kg/m3 | 0.827 | 0.084 |
| Kinematic viscosity | cSt | 3.2 | - |
| Flash point | °C | 74 | - |
| Calorific value | MJ/kg | 41 | 115 |
| Parameter | Instrument | Manufacturer | Range | Accuracy |
|---|---|---|---|---|
| Angle | Crankshaft angle | Beck Arnley 180-0420 | 5–9999 RPM | 0.03% |
| Cylinder pressure | Piezoelectric transducer | KISTLER type 7063-A | 0–250 bar | < ±0.5% |
| Airflow | Air mass sensor | BOSCH OE-22680 7J600 | 0–125 g/s | 1% |
| Fuel measuring | Gravimetric meter | OHAUS-PA313 | 0–310 g | 1.5% |
| Temperature | Temperature sensor | Type K | −200–1370 °C | 0.1% |
| Pressure | Pressure sensor | KISTLER Type 4067-E | 0–200 bar | 1% |
Publisher’s Note: MDPI stays neutral with regard to jurisdictional claims in published maps and institutional affiliations. |
© 2020 by the authors. Licensee MDPI, Basel, Switzerland. This article is an open access article distributed under the terms and conditions of the Creative Commons Attribution (CC BY) license (http://creativecommons.org/licenses/by/4.0/).
Share and Cite
Abril, S.O.; Piero Rojas, J.; Flórez, E.N. Numerical Methodology for Determining the Energy Losses in Auxiliary Systems and Friction Processes Applied to Low Displacement Diesel Engines. Lubricants 2020, 8, 103. https://doi.org/10.3390/lubricants8120103
Abril SO, Piero Rojas J, Flórez EN. Numerical Methodology for Determining the Energy Losses in Auxiliary Systems and Friction Processes Applied to Low Displacement Diesel Engines. Lubricants. 2020; 8(12):103. https://doi.org/10.3390/lubricants8120103
Chicago/Turabian StyleAbril, Sofia Orjuela, Jhan Piero Rojas, and Eder Norberto Flórez. 2020. "Numerical Methodology for Determining the Energy Losses in Auxiliary Systems and Friction Processes Applied to Low Displacement Diesel Engines" Lubricants 8, no. 12: 103. https://doi.org/10.3390/lubricants8120103
APA StyleAbril, S. O., Piero Rojas, J., & Flórez, E. N. (2020). Numerical Methodology for Determining the Energy Losses in Auxiliary Systems and Friction Processes Applied to Low Displacement Diesel Engines. Lubricants, 8(12), 103. https://doi.org/10.3390/lubricants8120103