A Multi-Scale Simulation Approach to Investigate Local Contact Temperatures for Commercial Cu-Full and Cu-Free Brake Pads


Abstract
:
1. Introduction
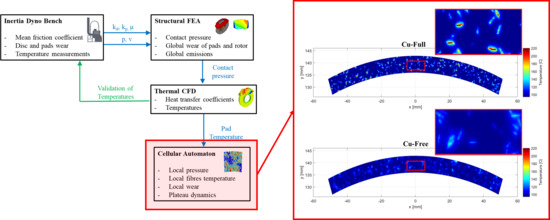
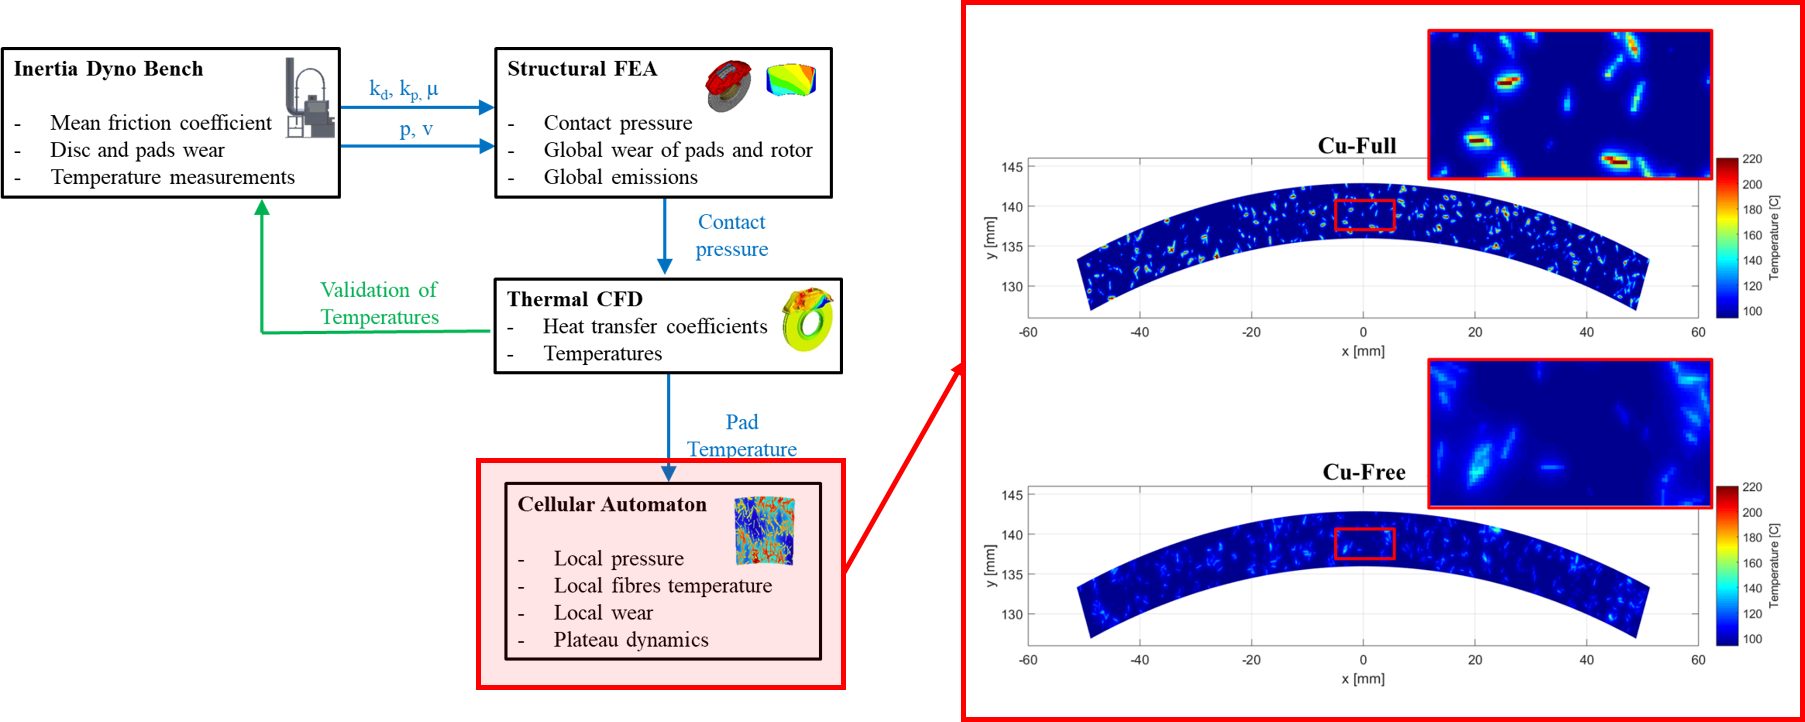
2. Methodology
2.1. Inertia Dyno Bench
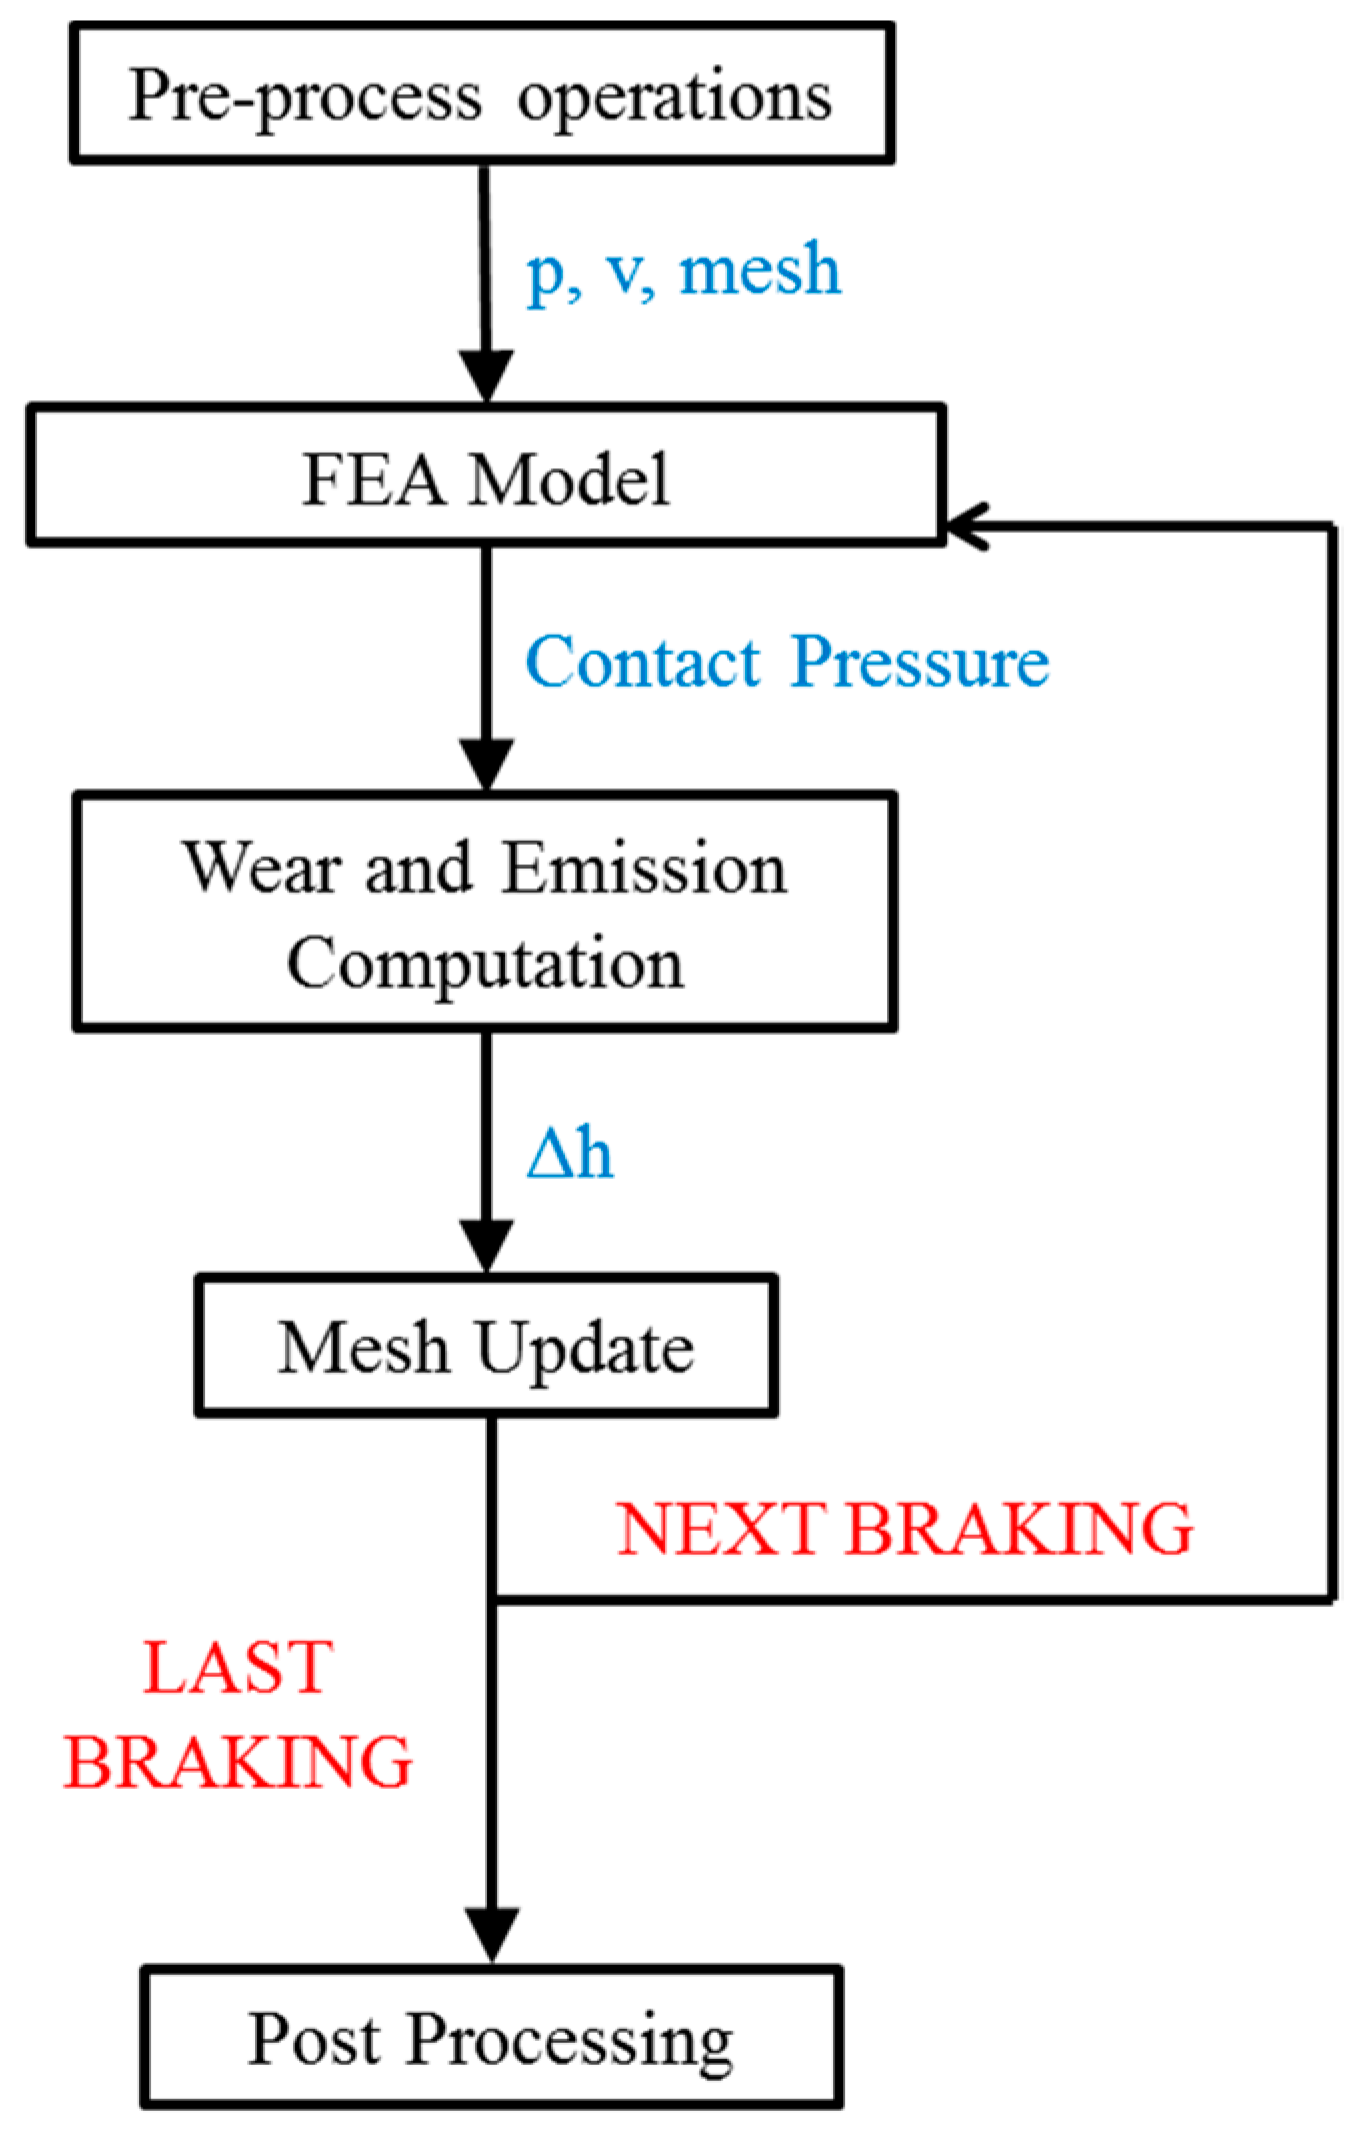
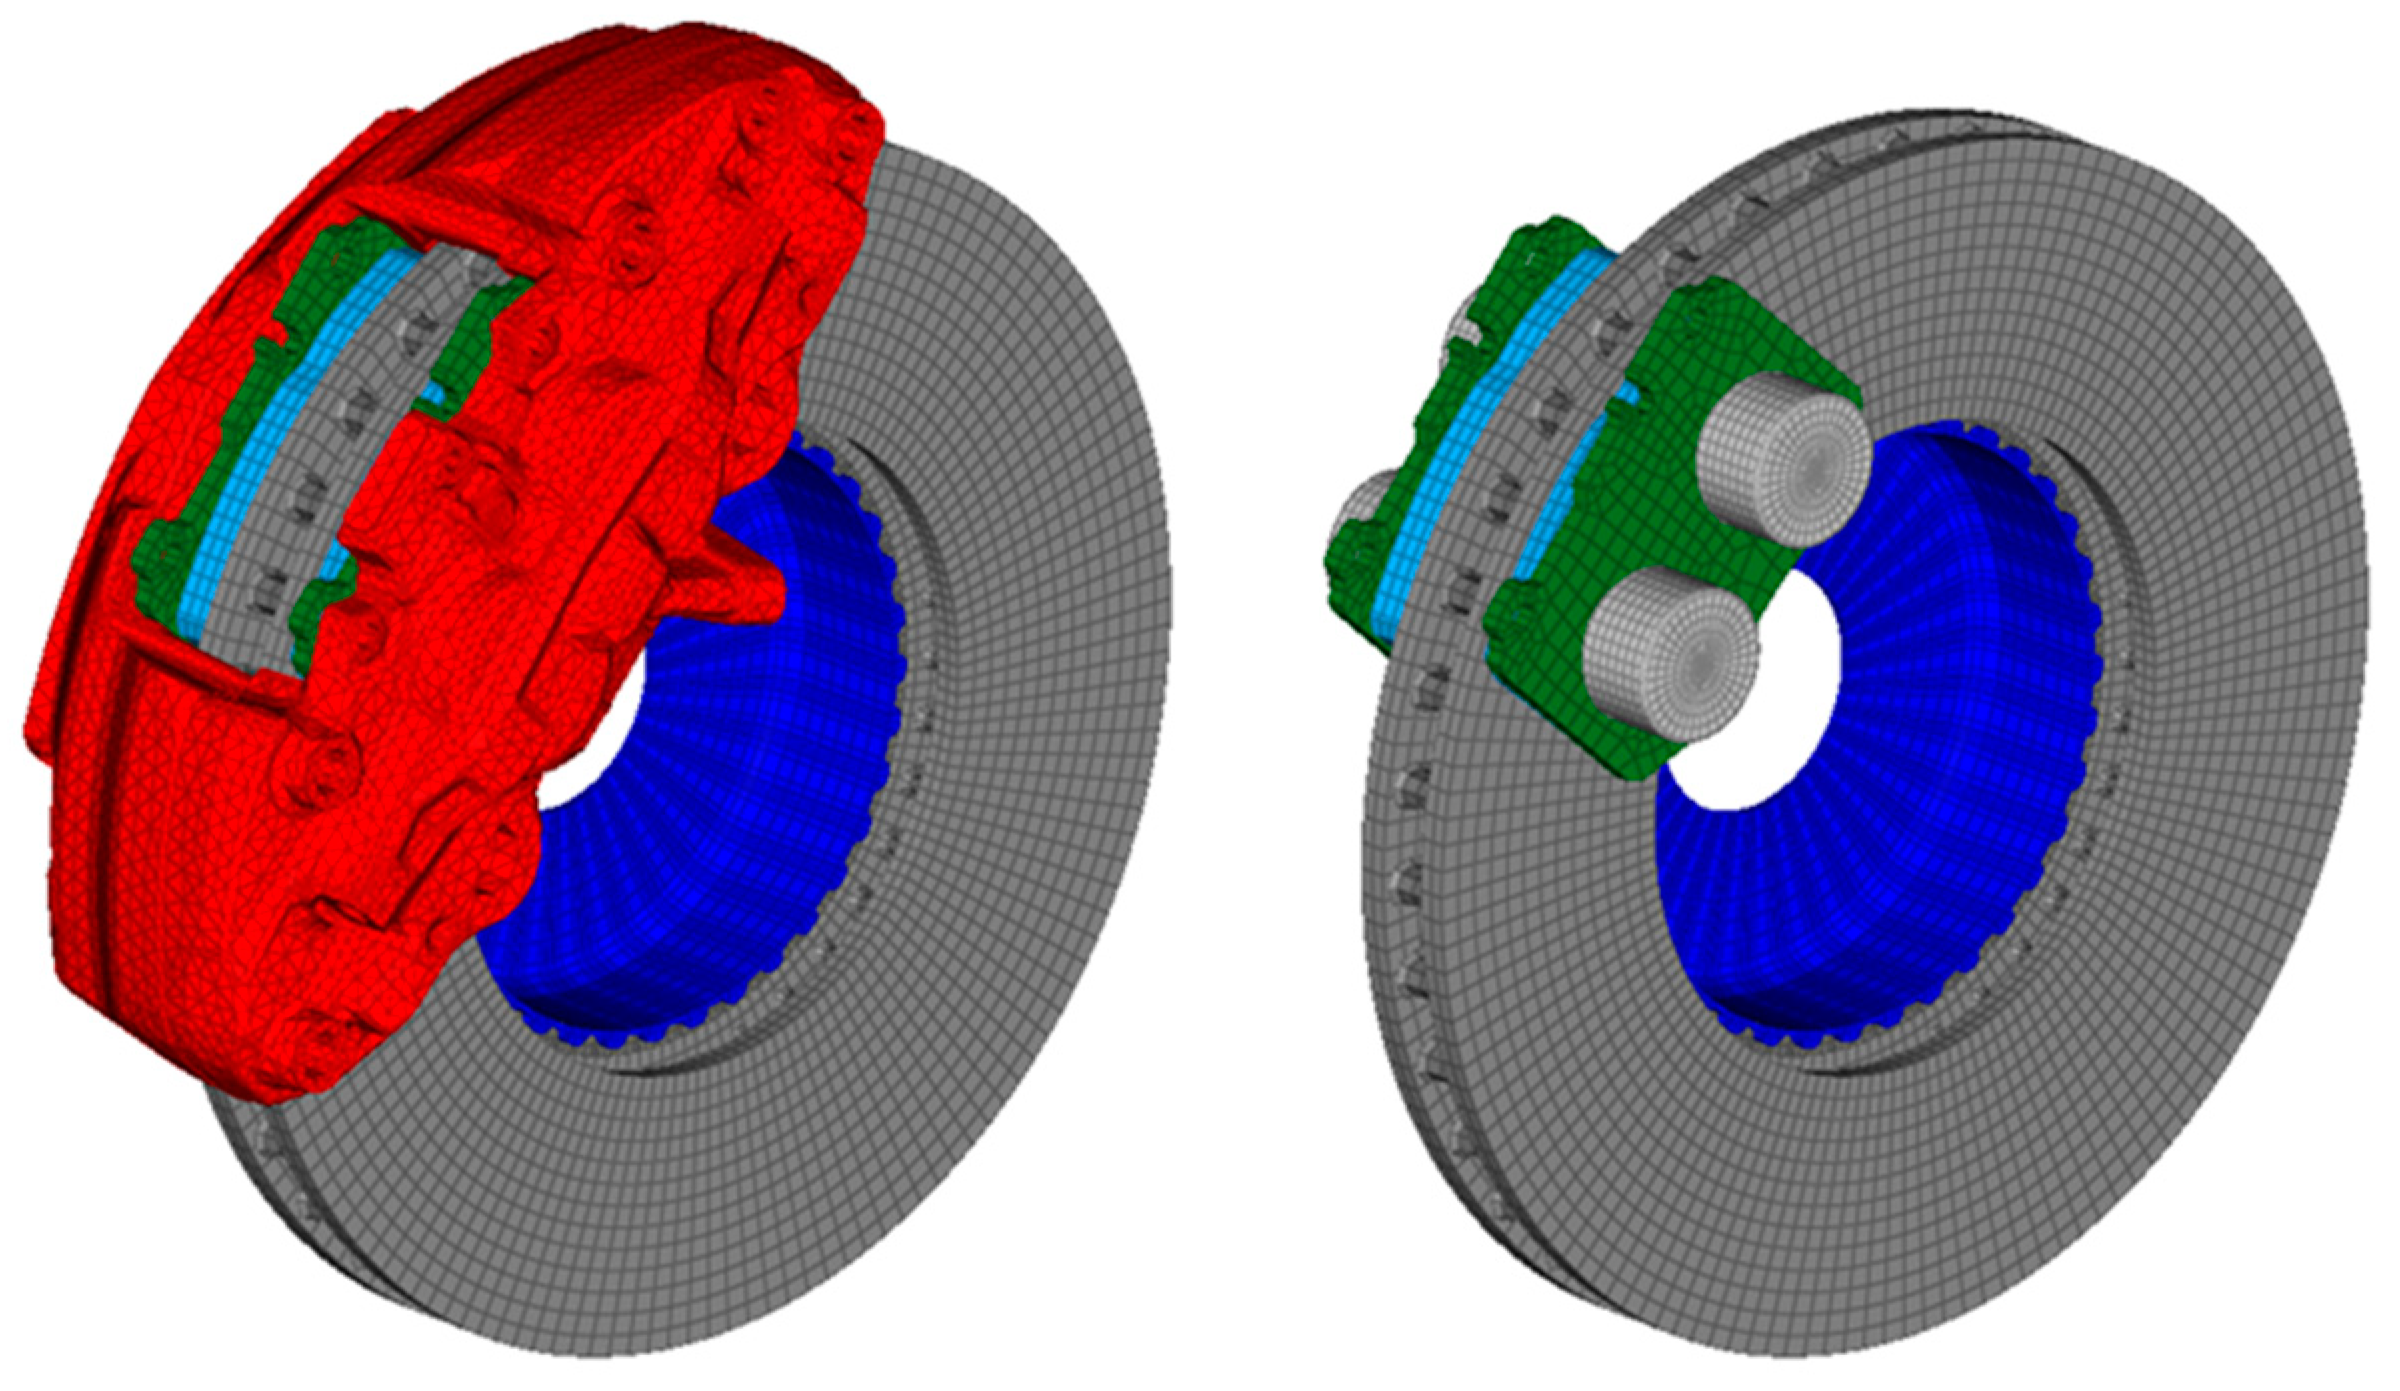
2.2. Structural FEA
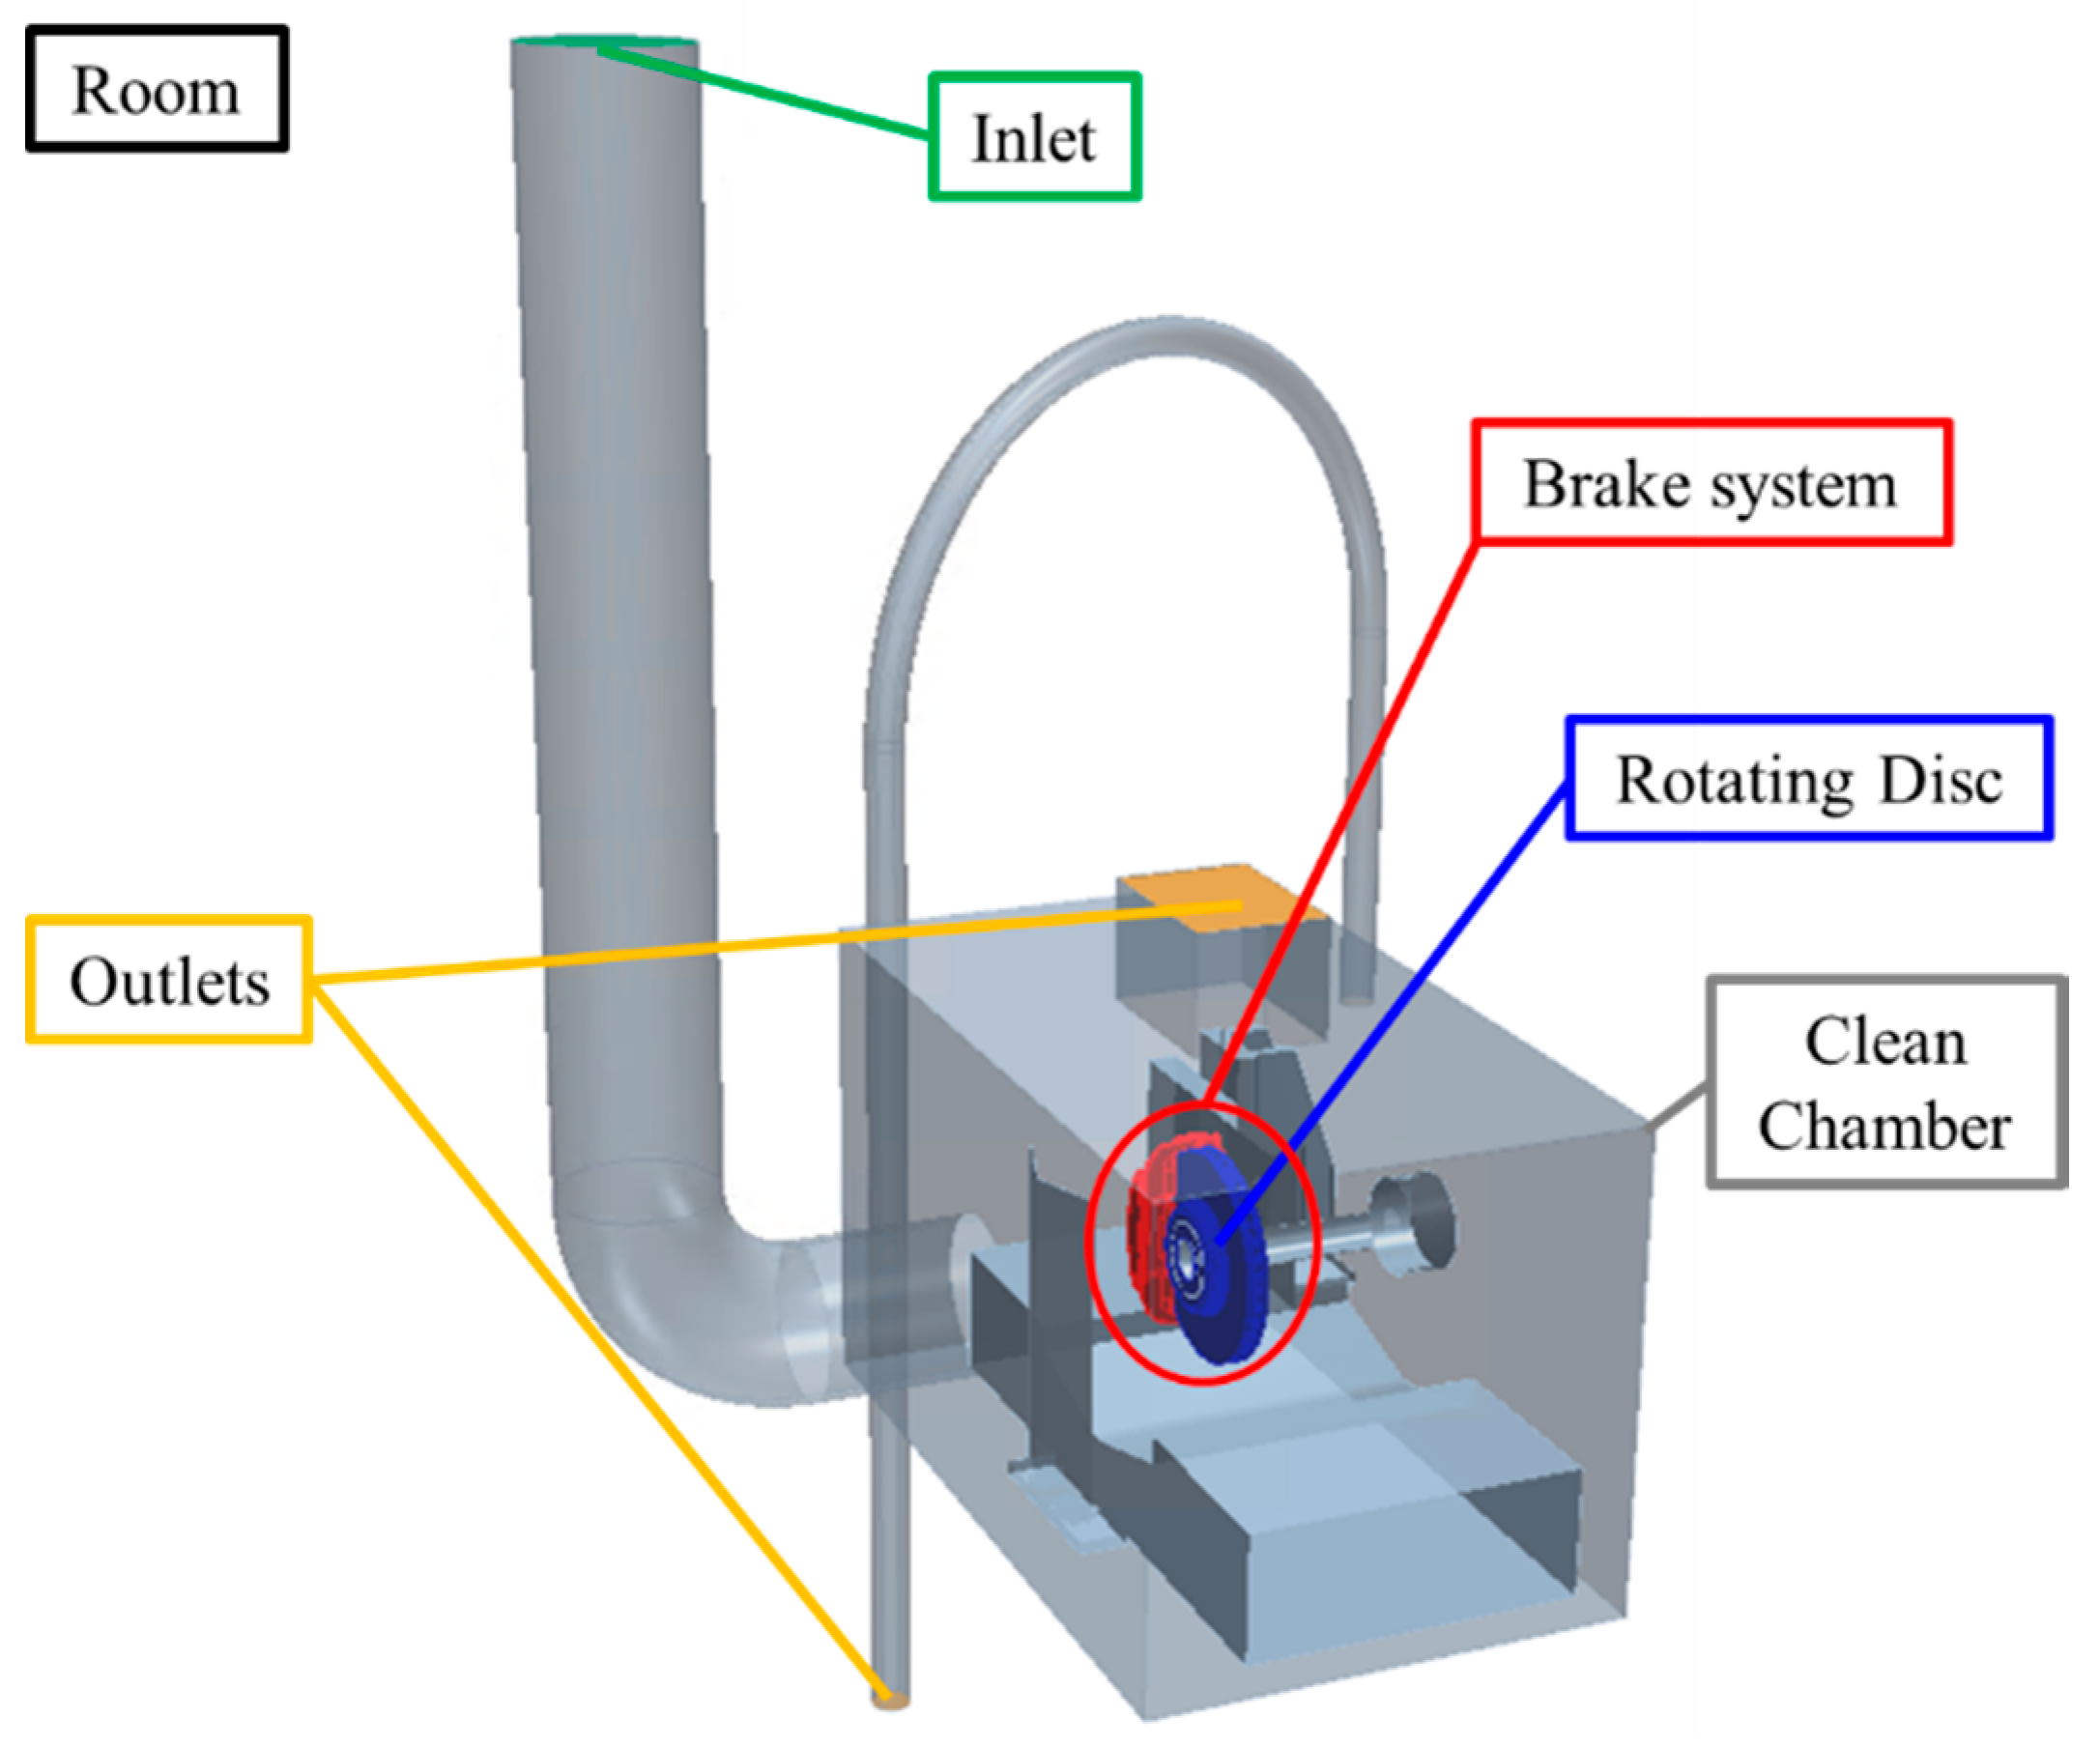
2.3. Thermal-CFD
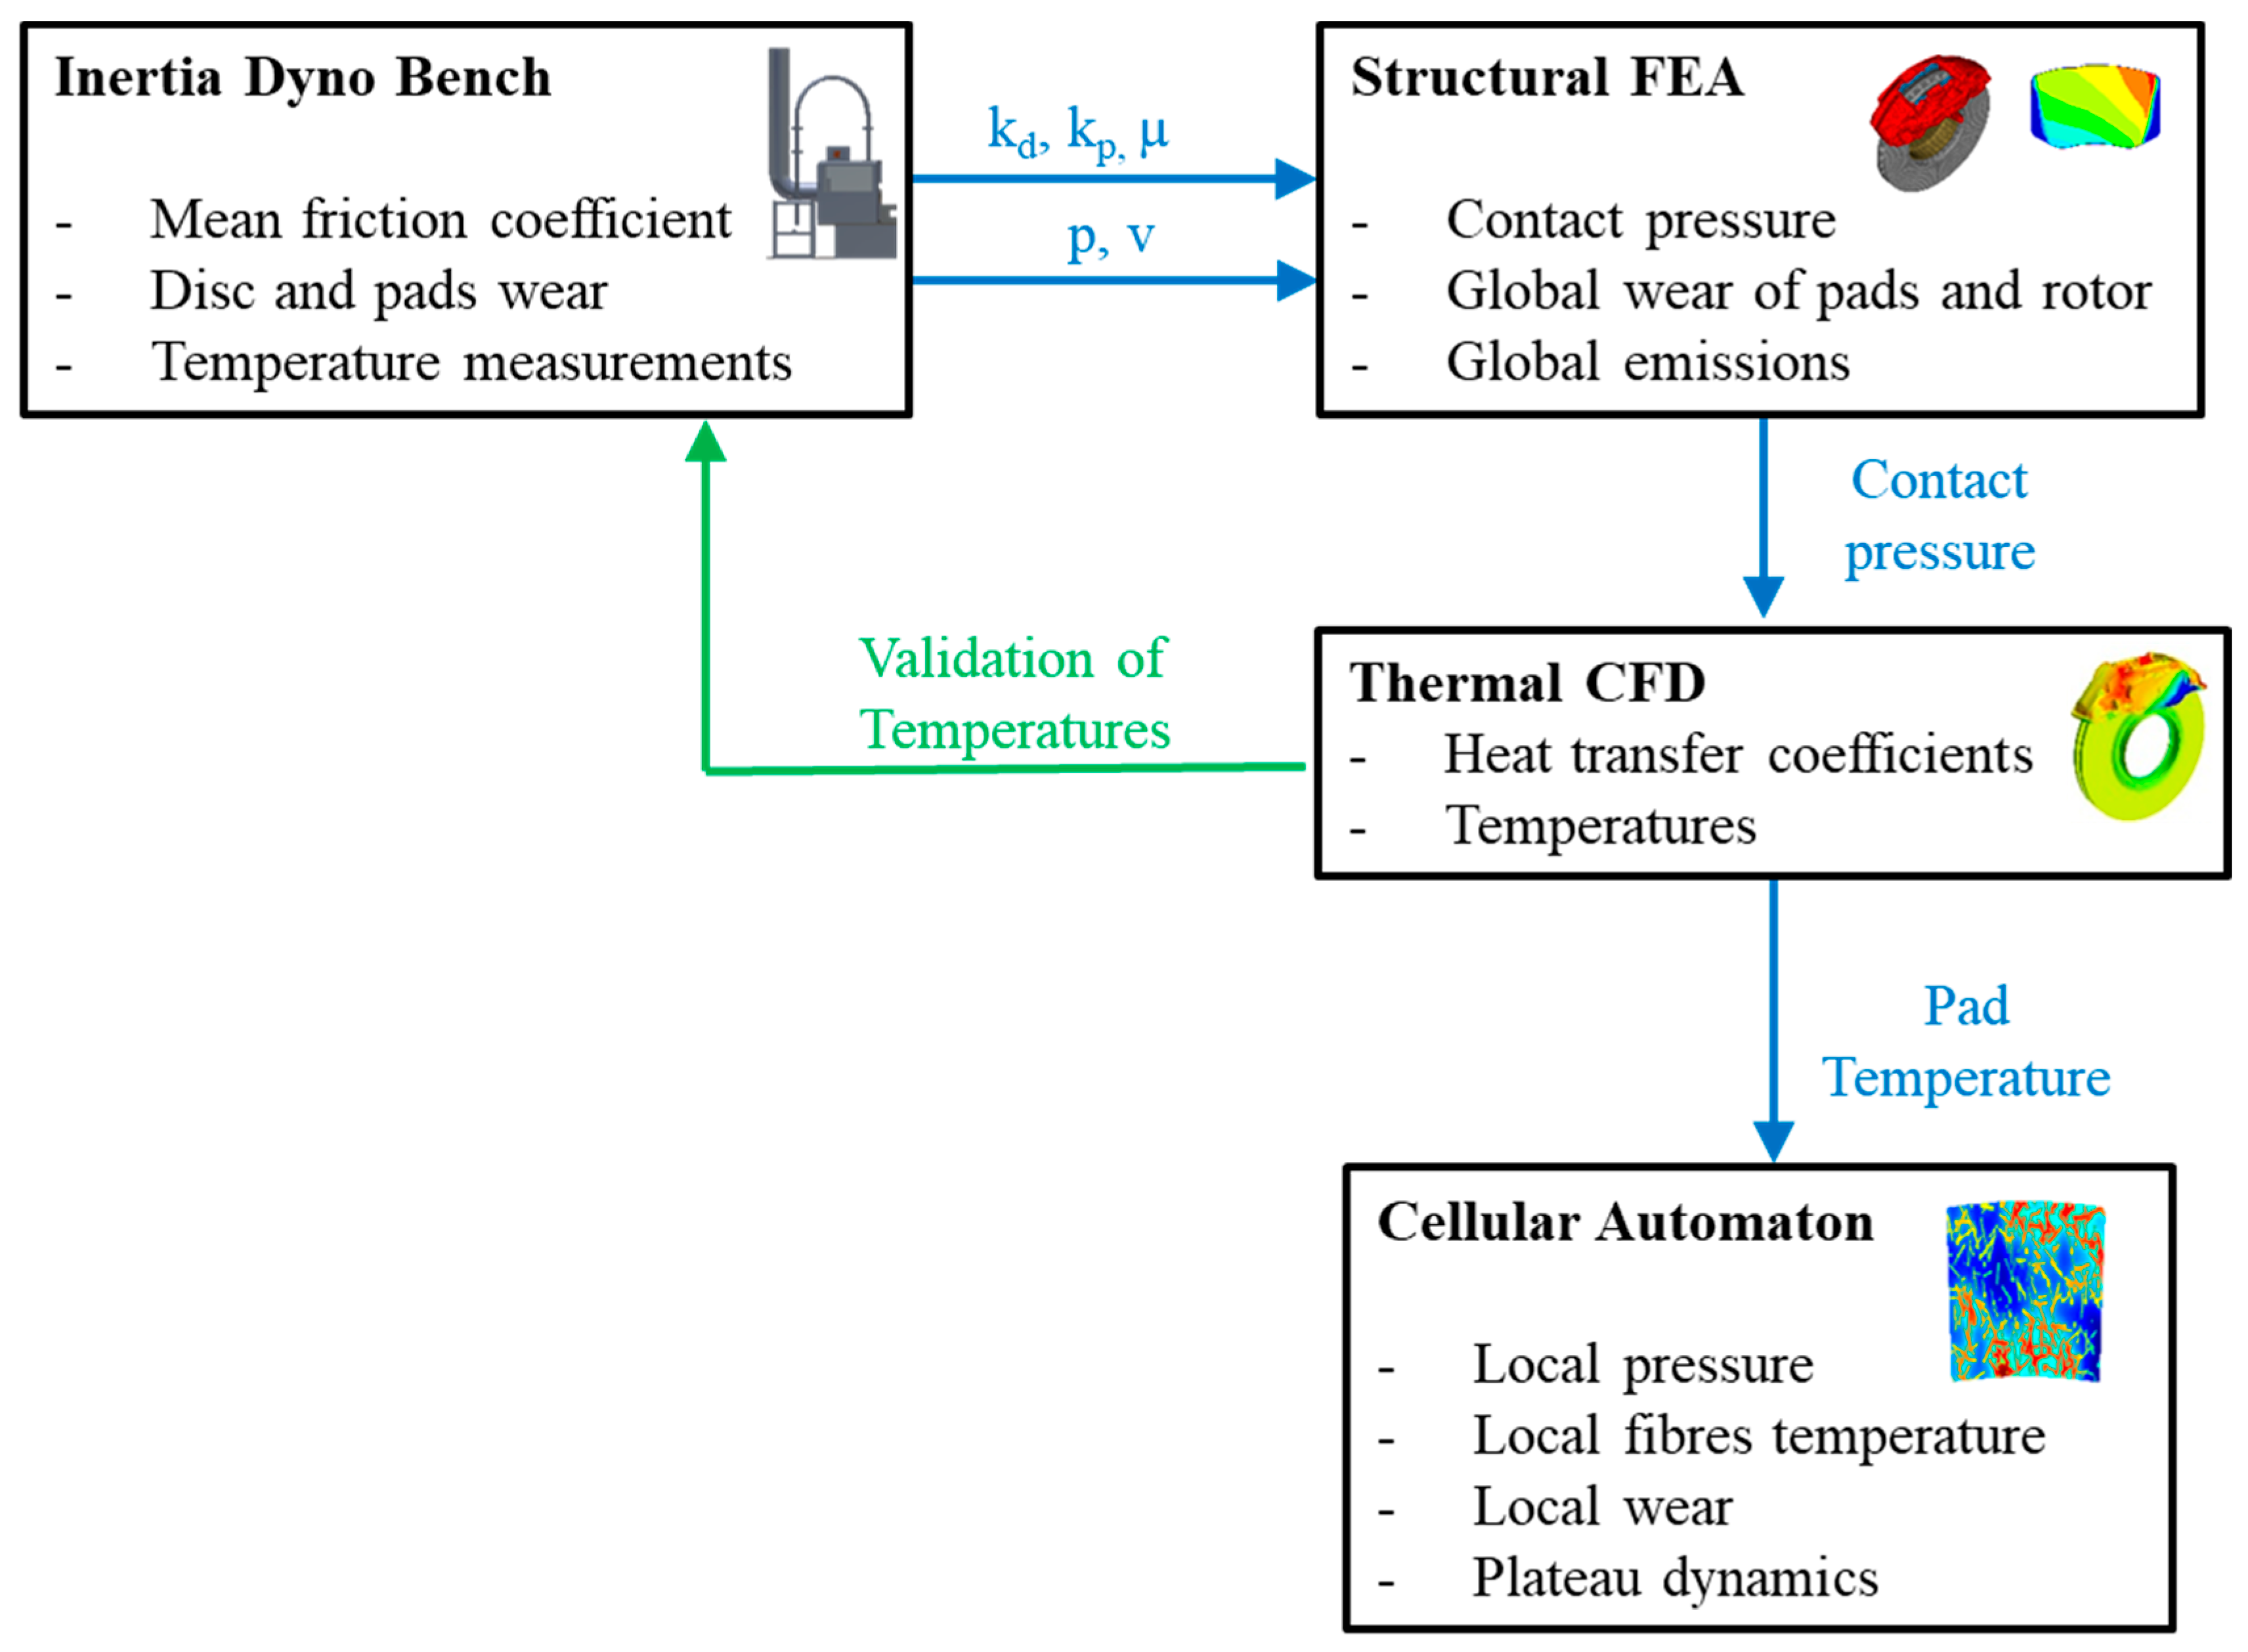
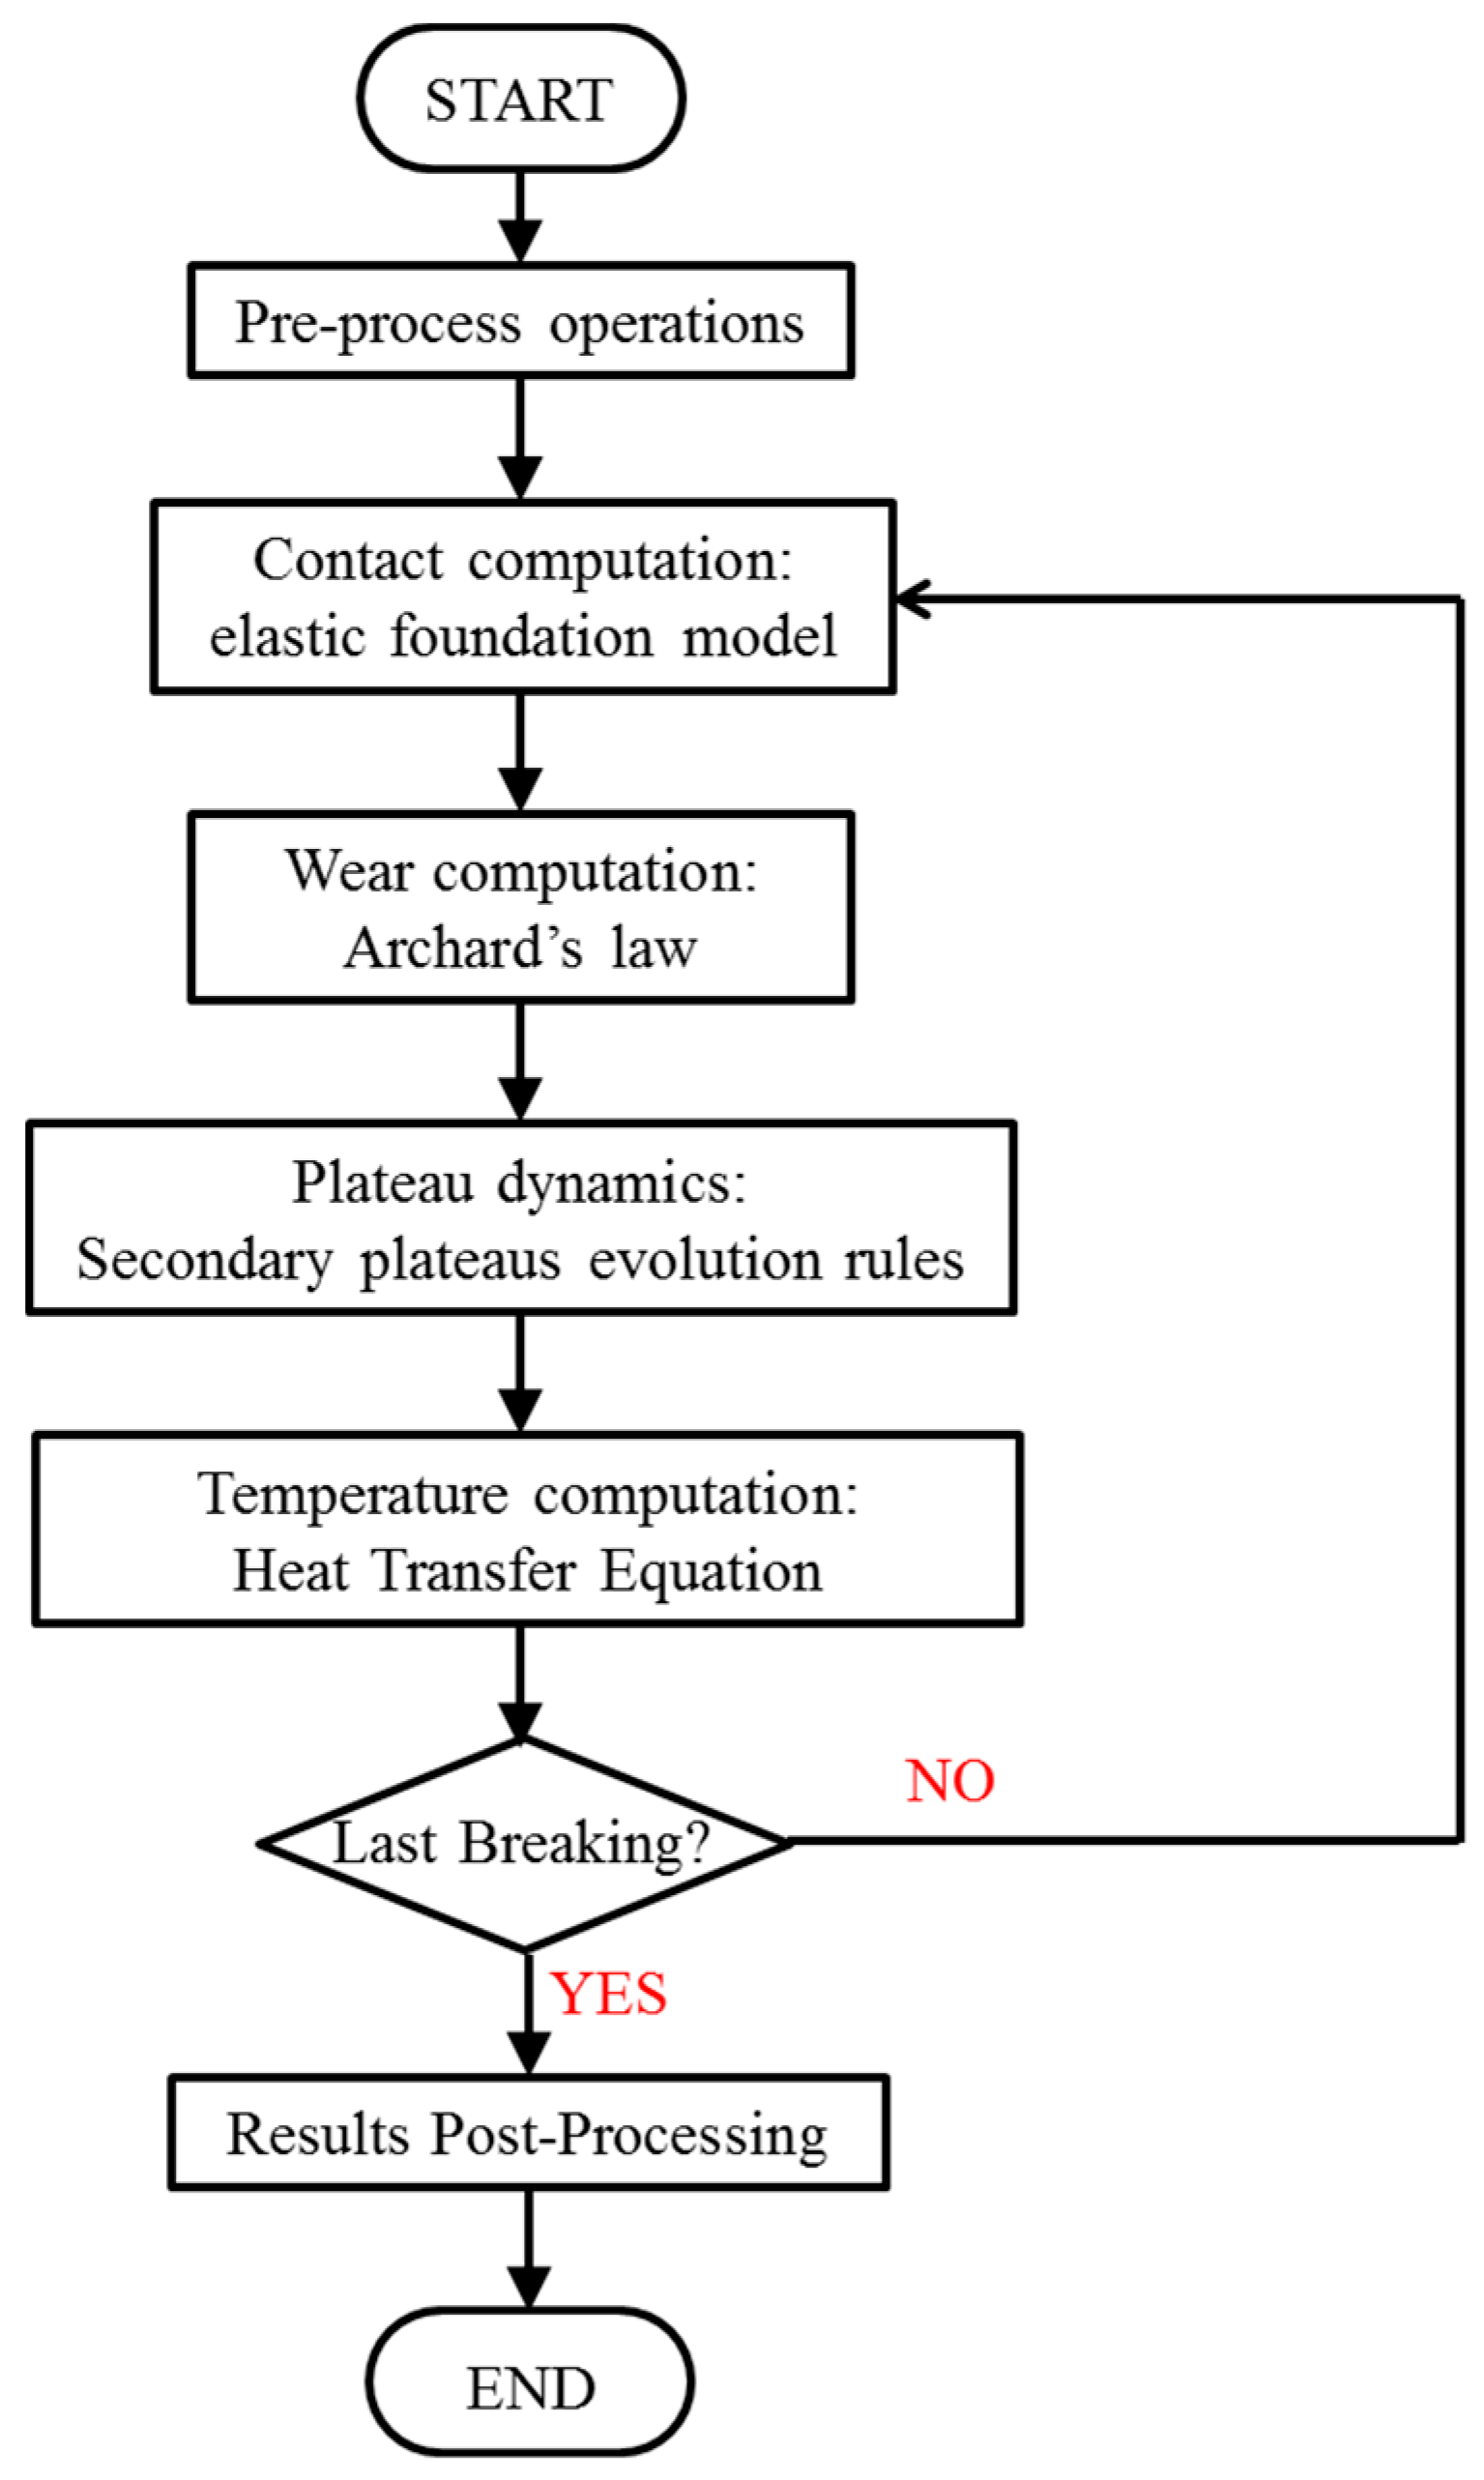
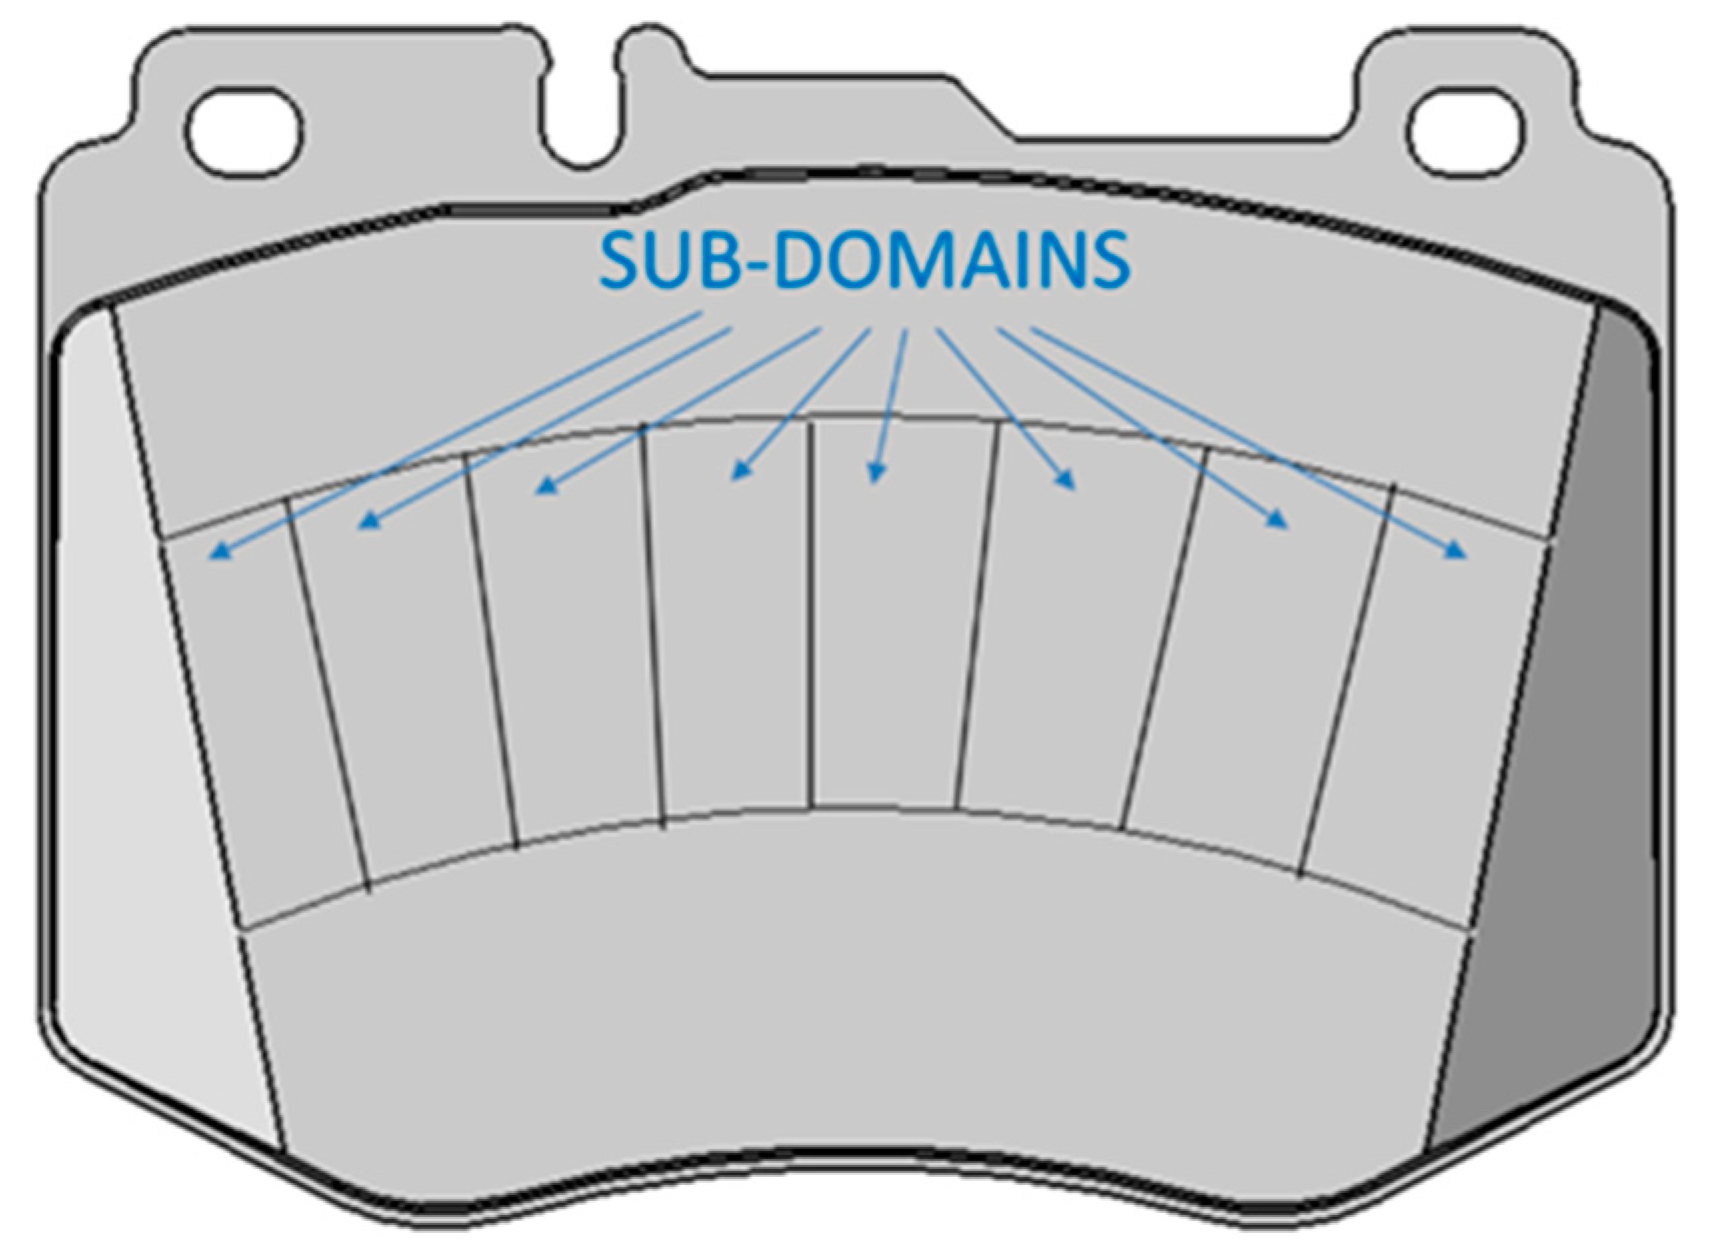
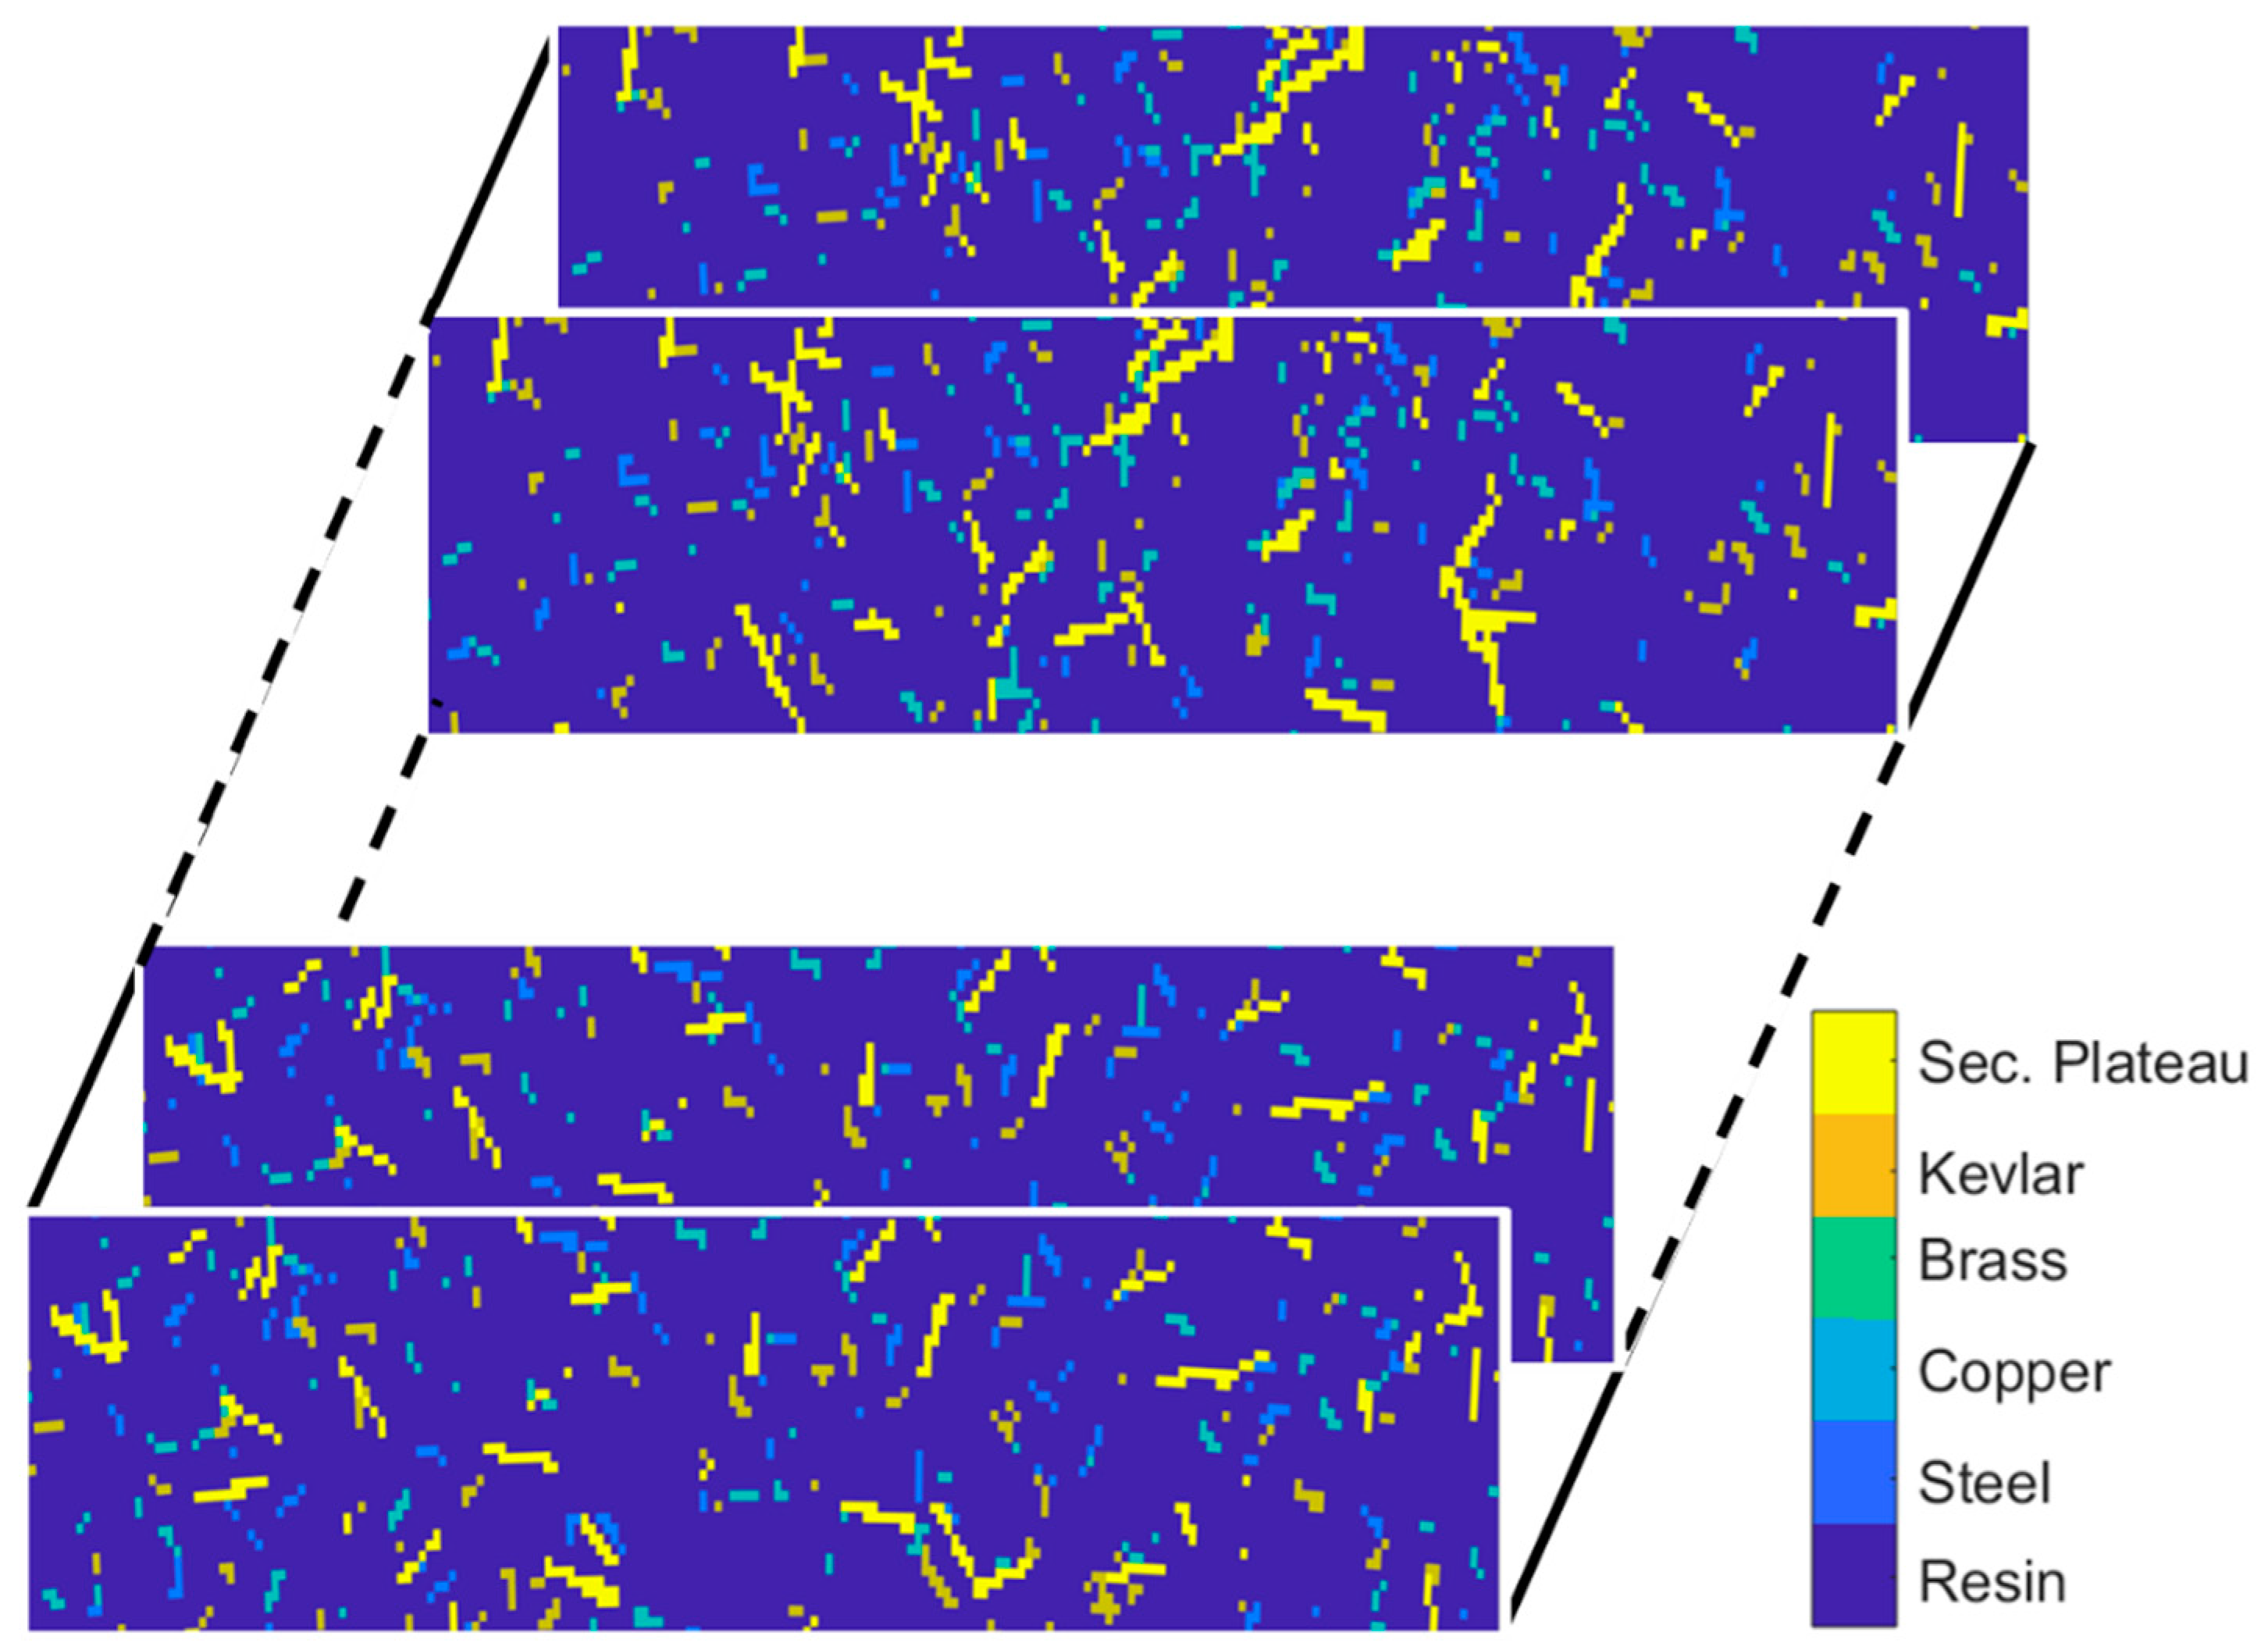
2.4. Cellular Automaton Approach
3. Simulation Inputs
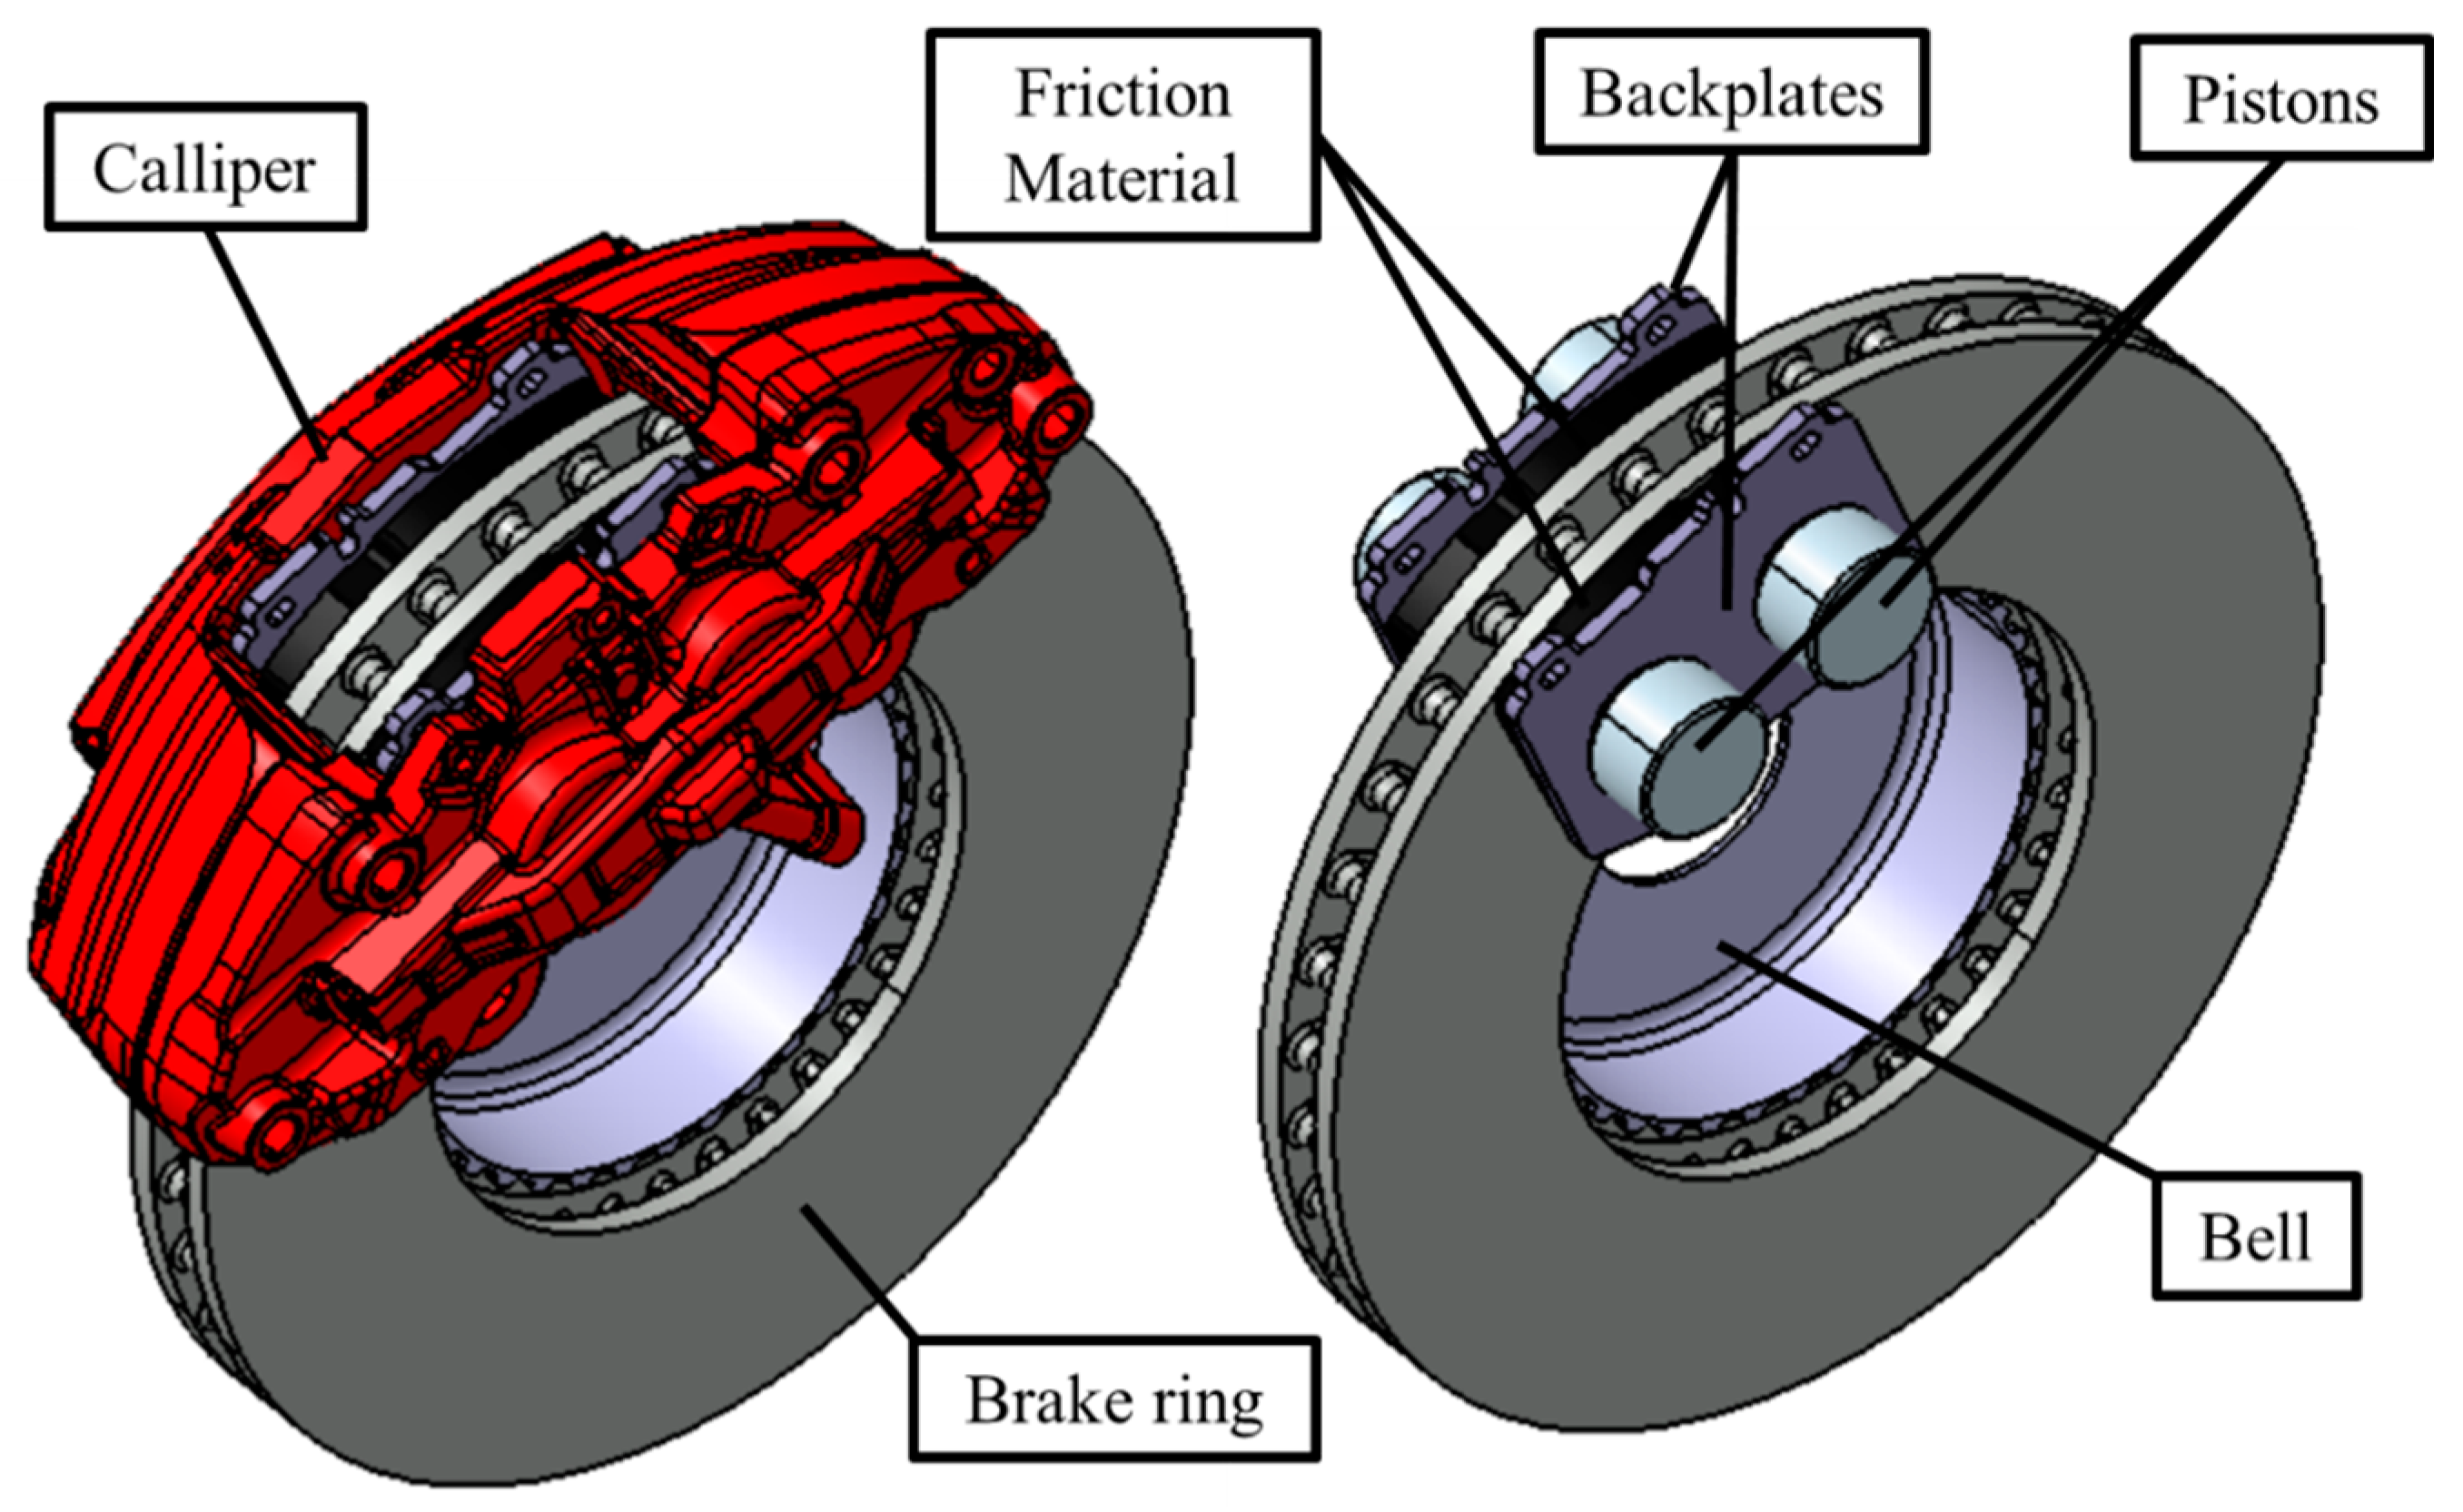
3.1. Disc Brake System
3.2. Test Cycle
3.3. CA Simulation Inputs
4. Results
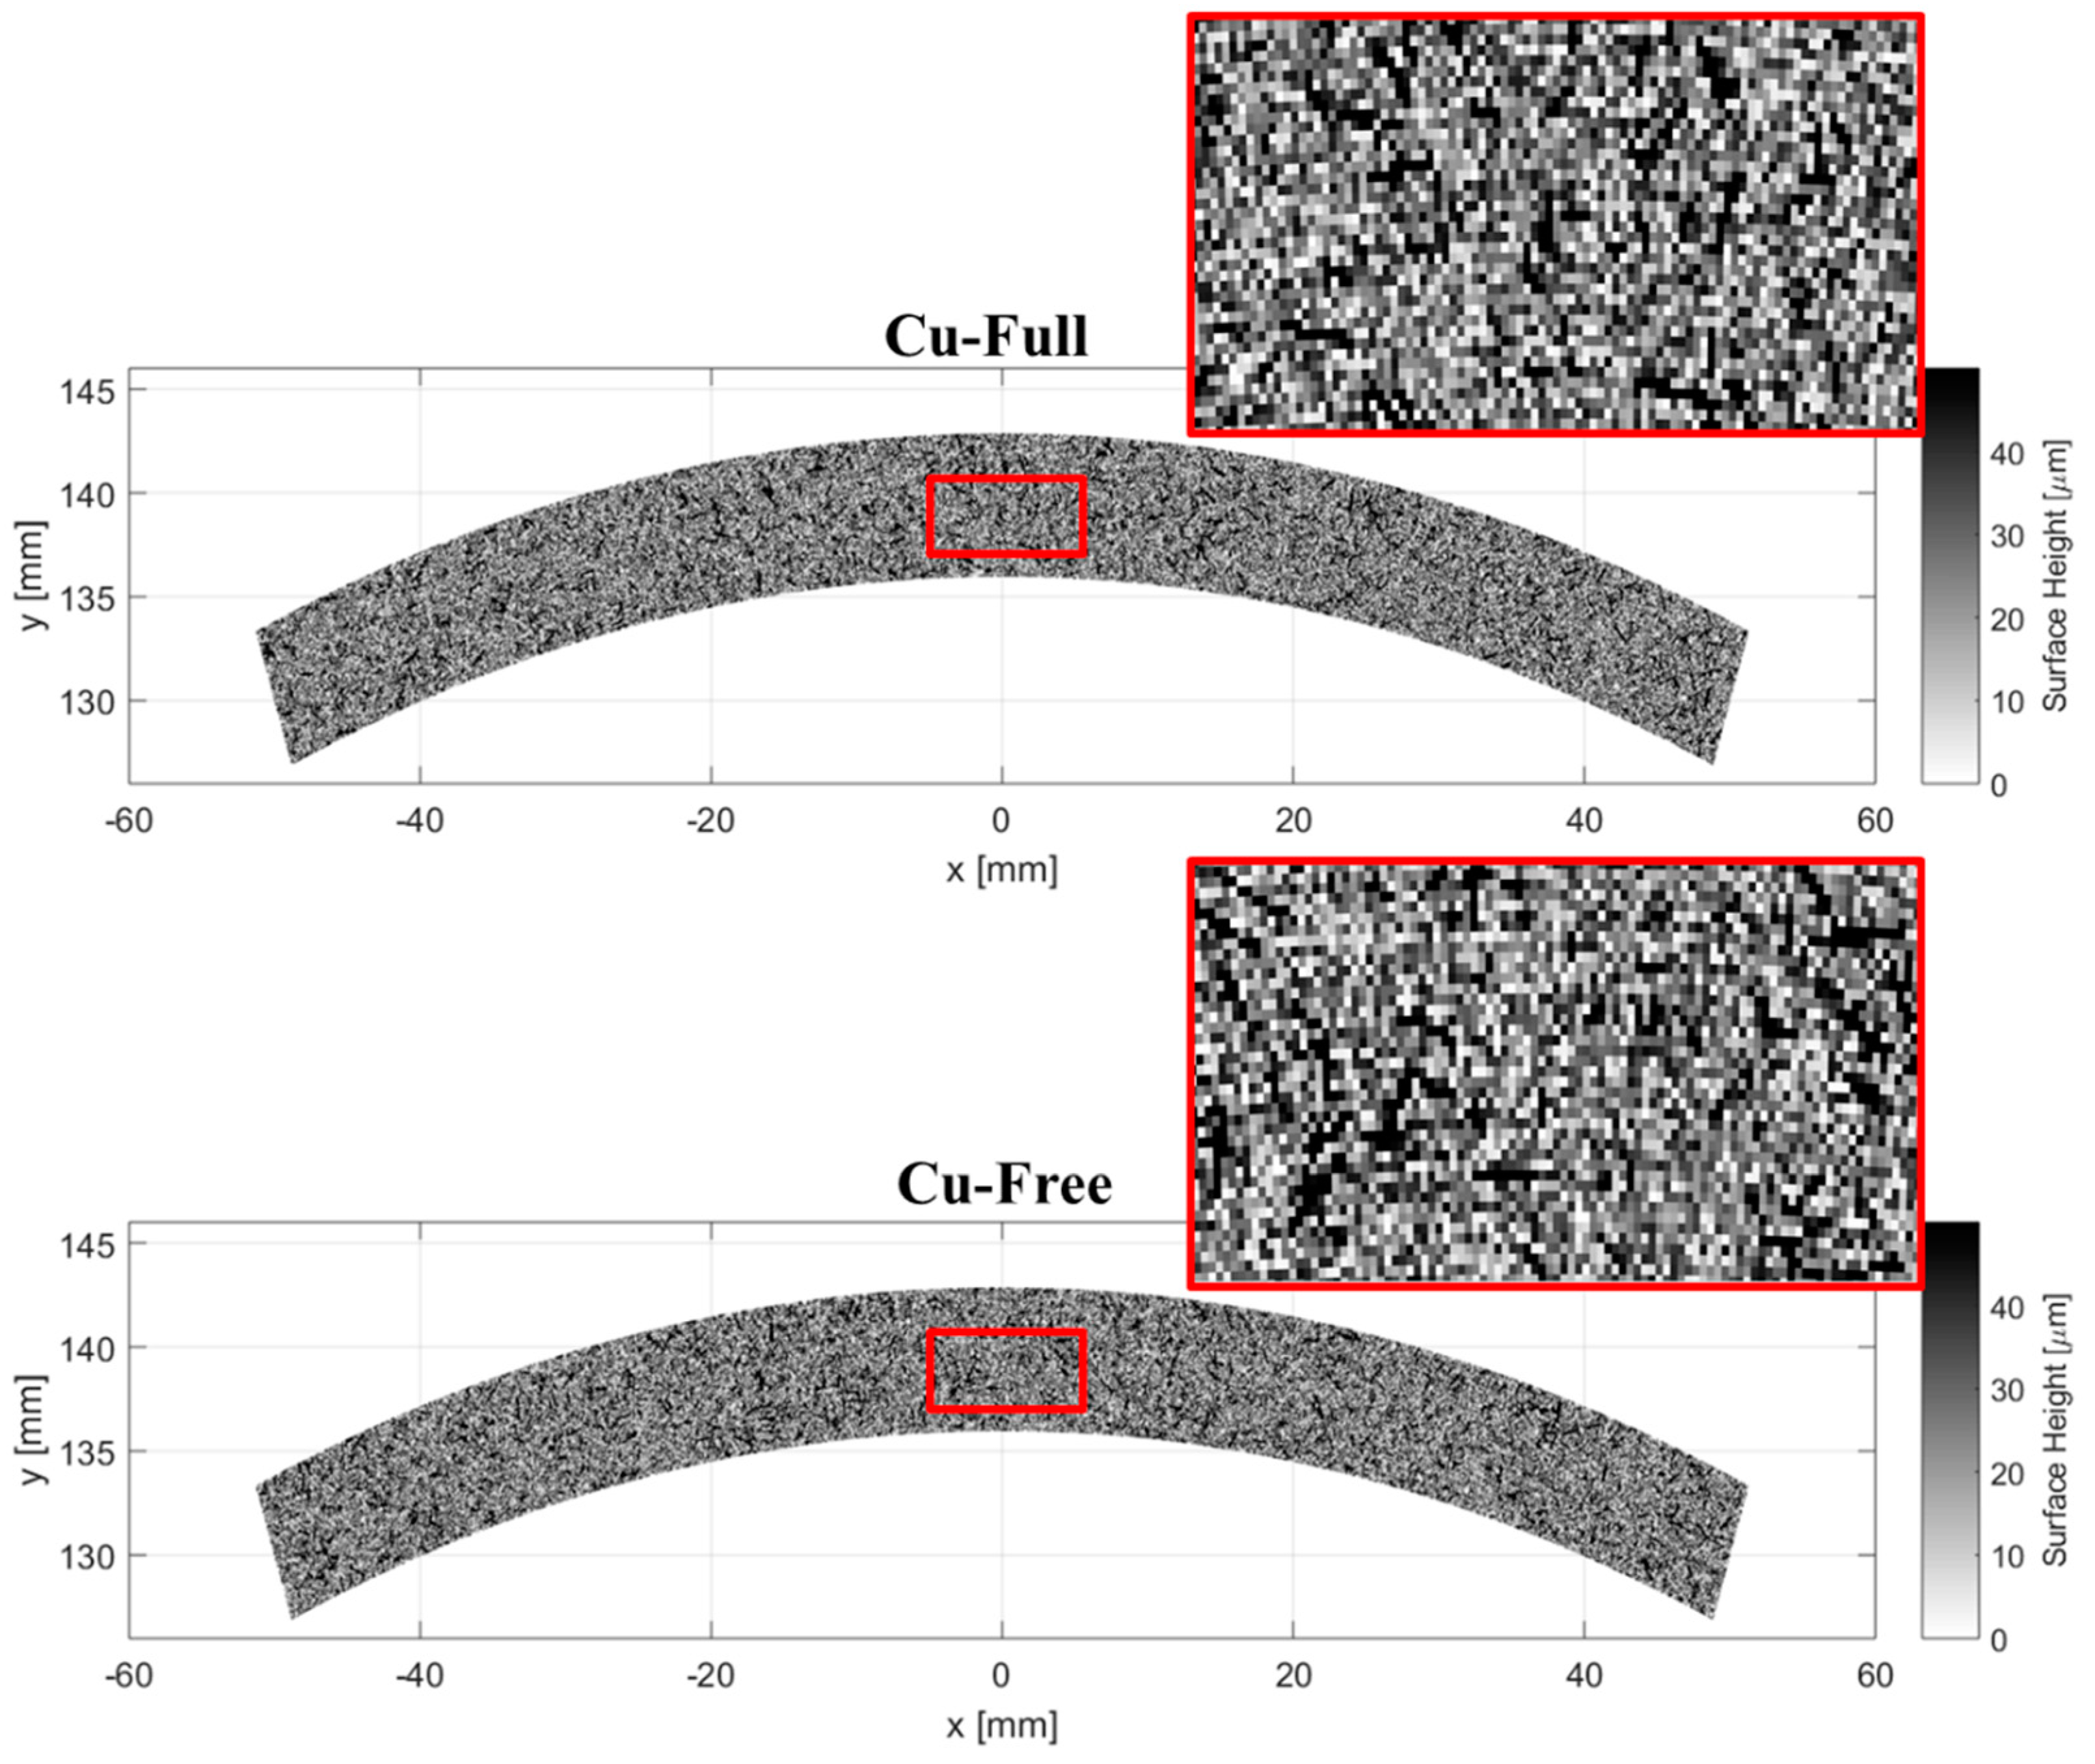
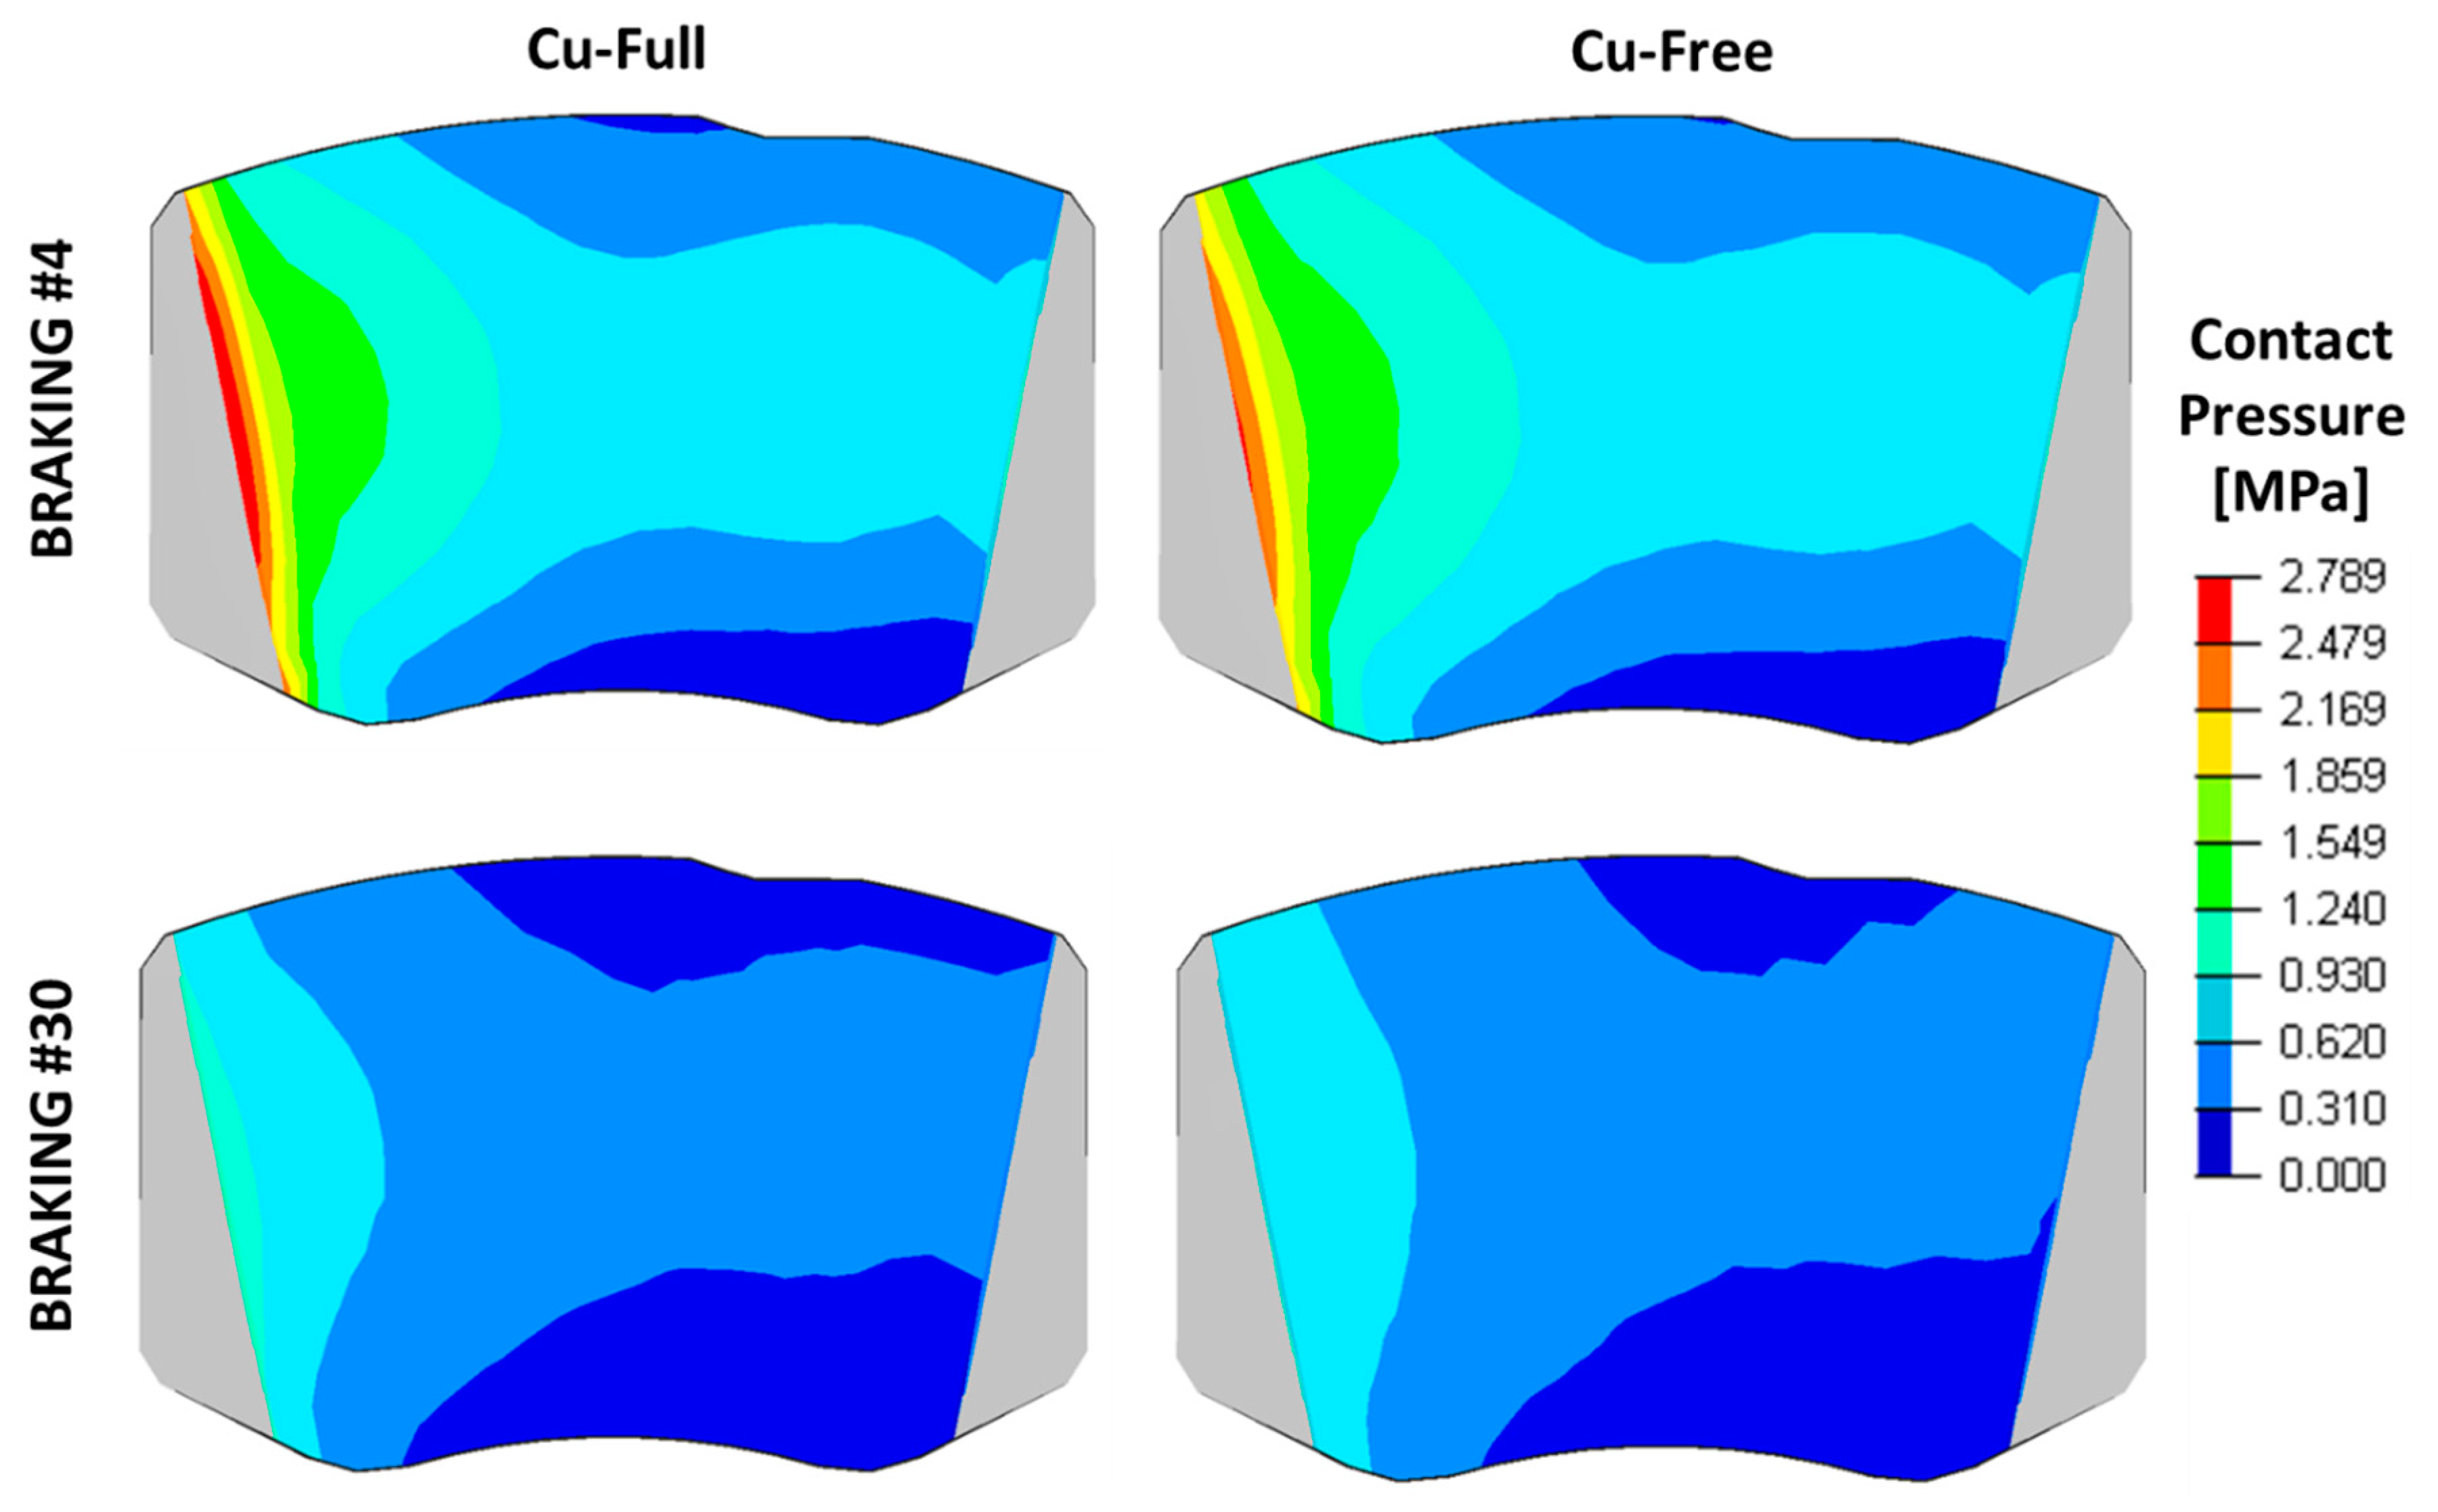
4.1. FEA Results
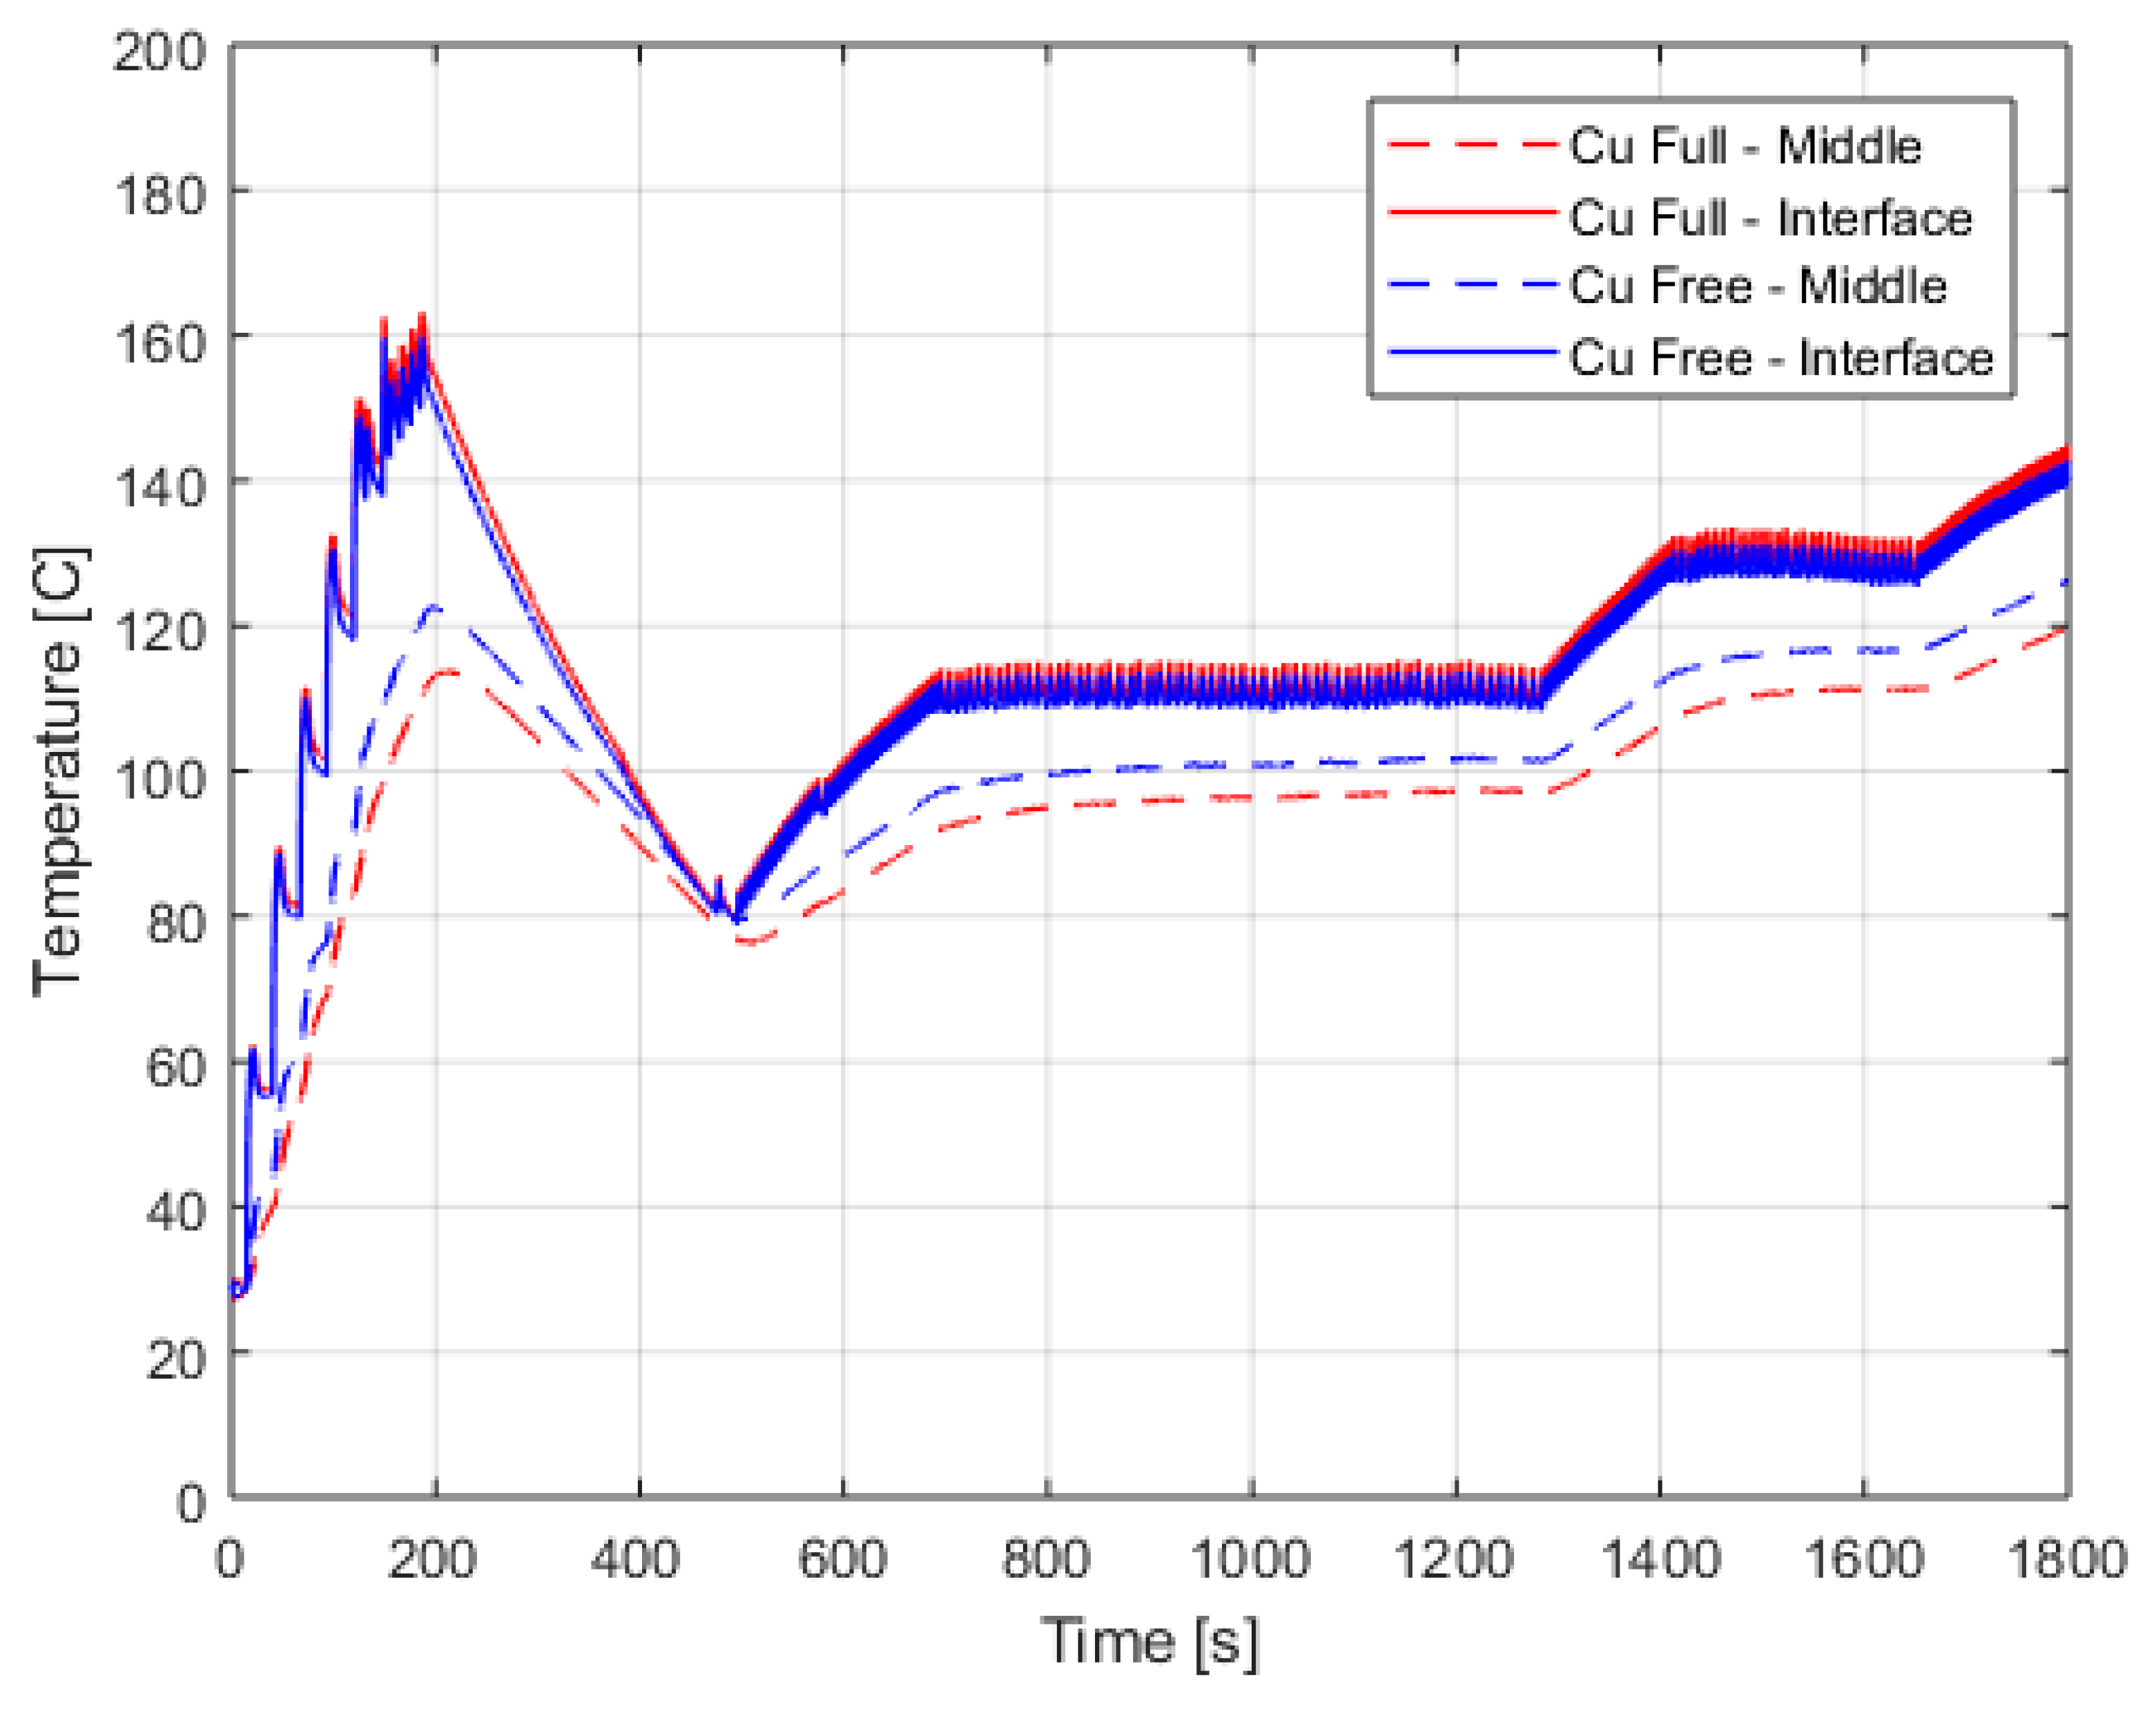
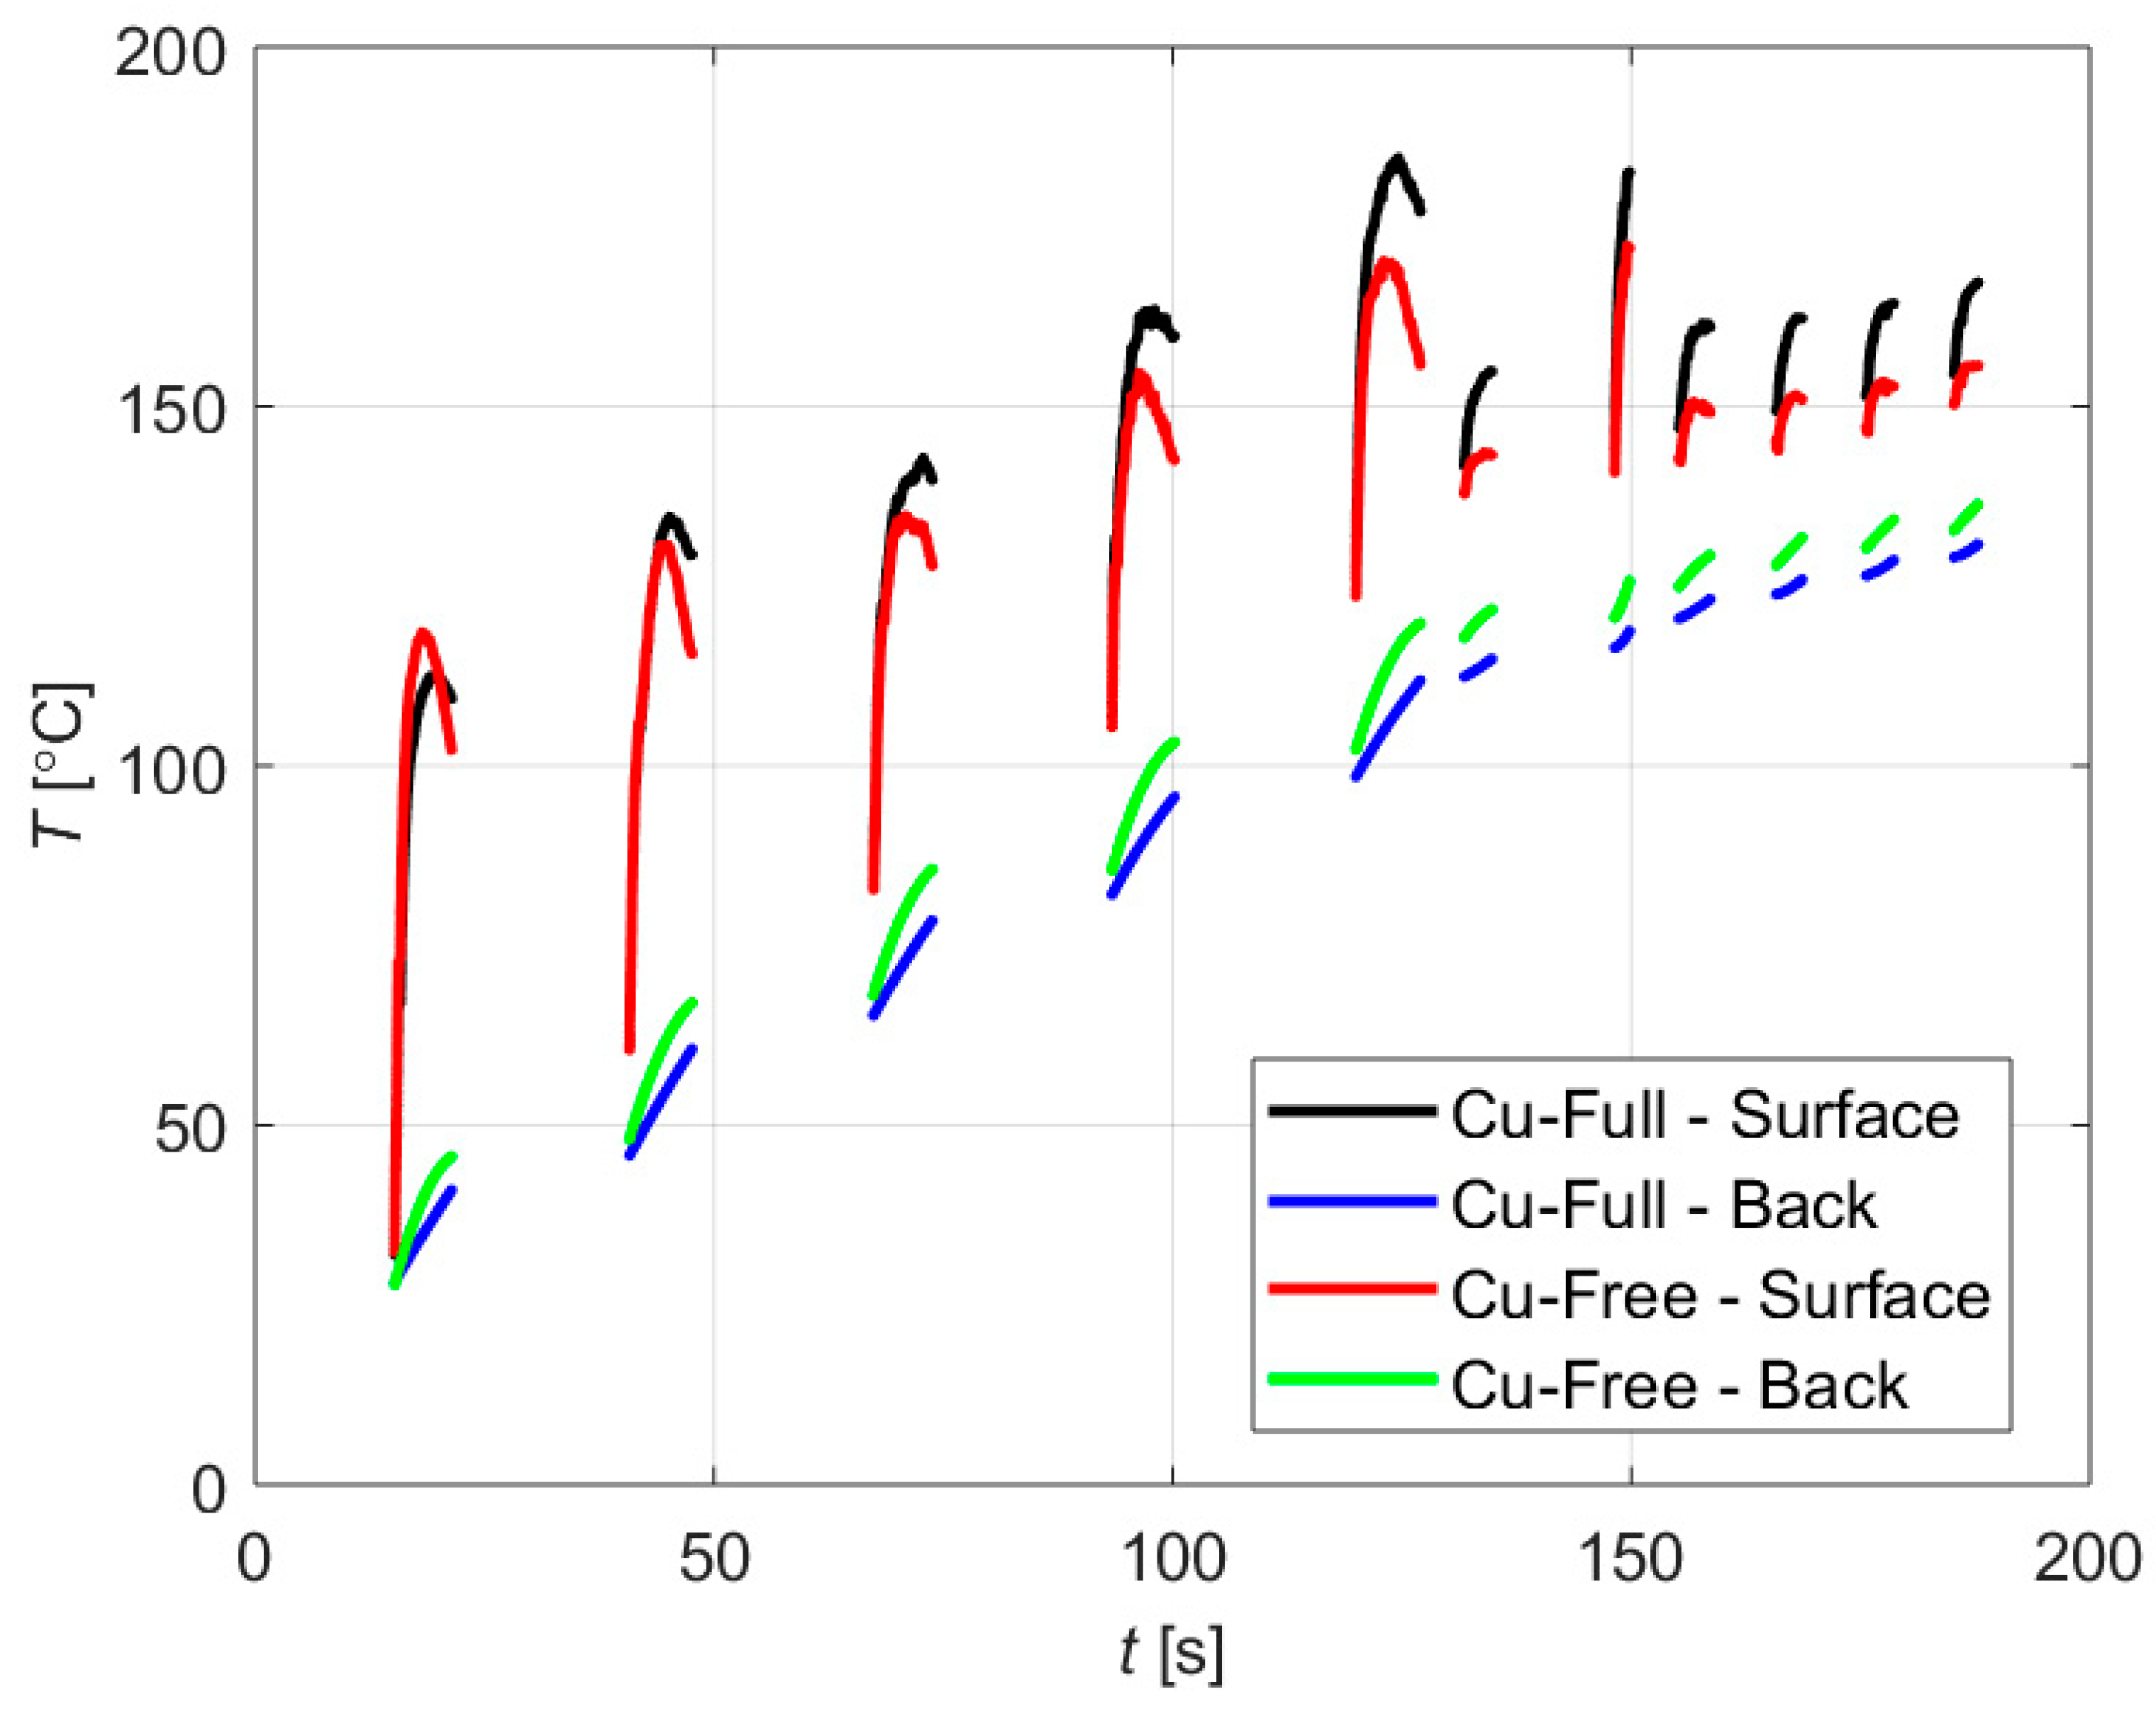
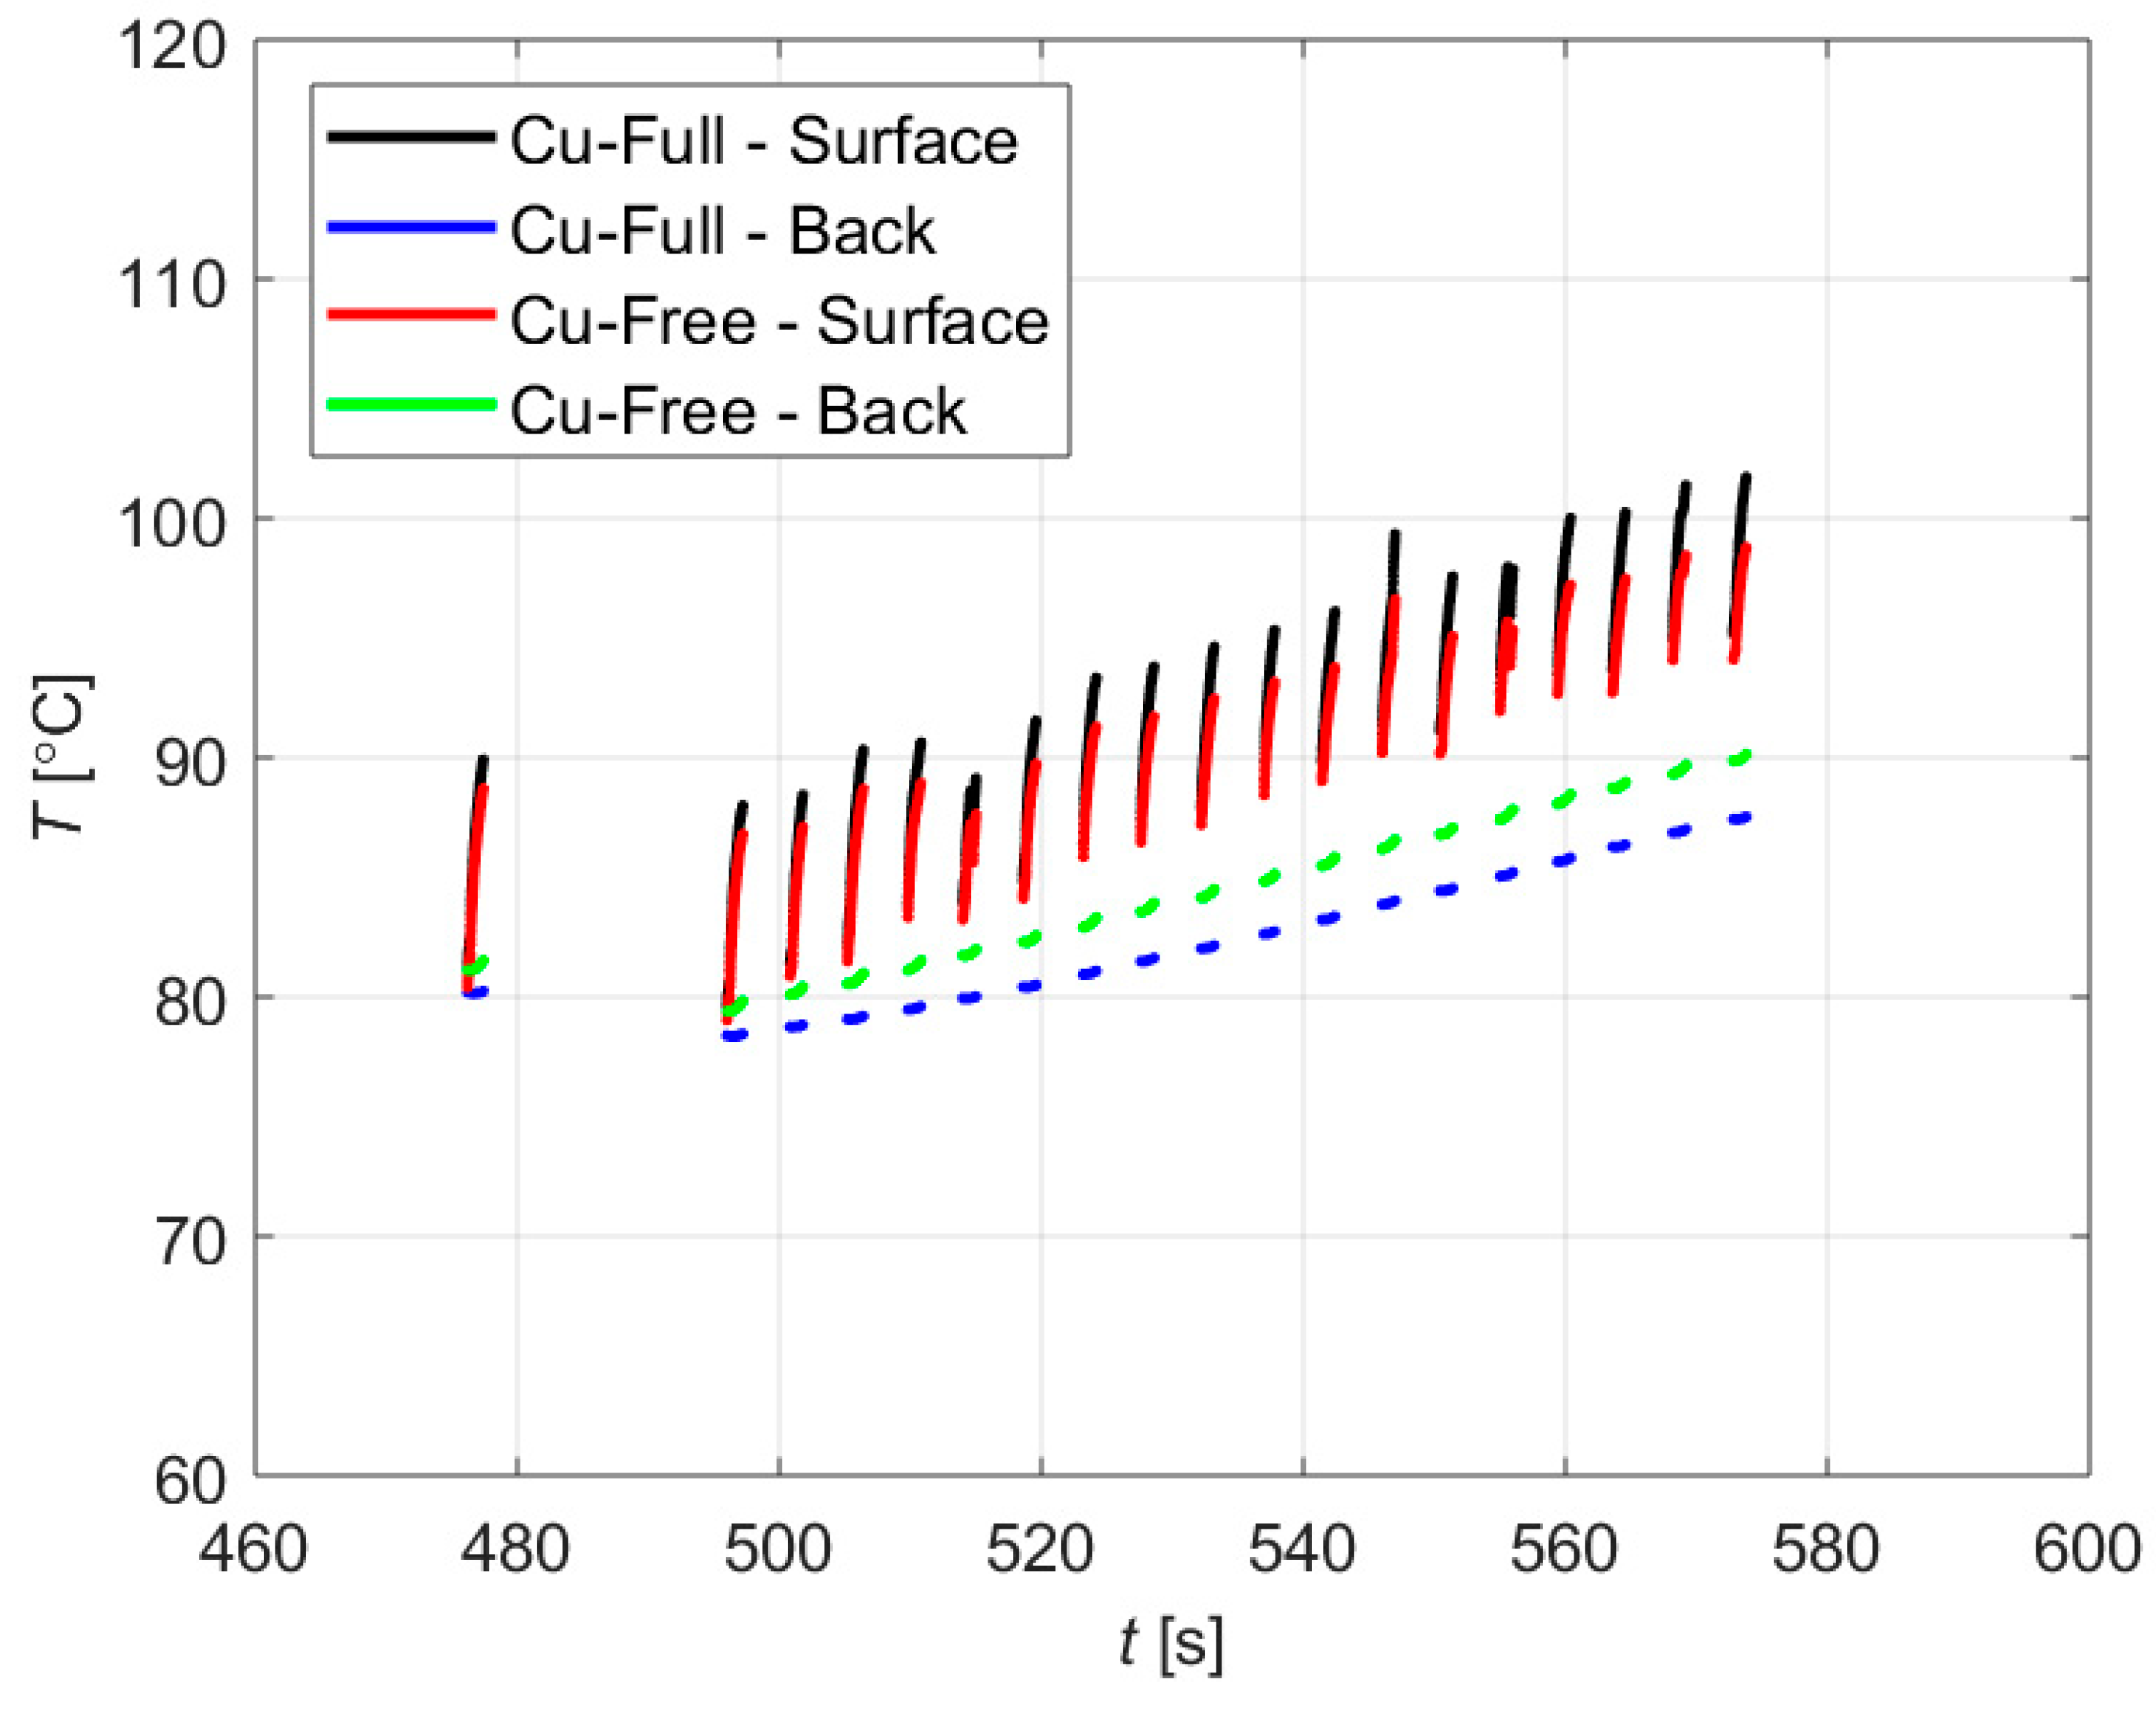
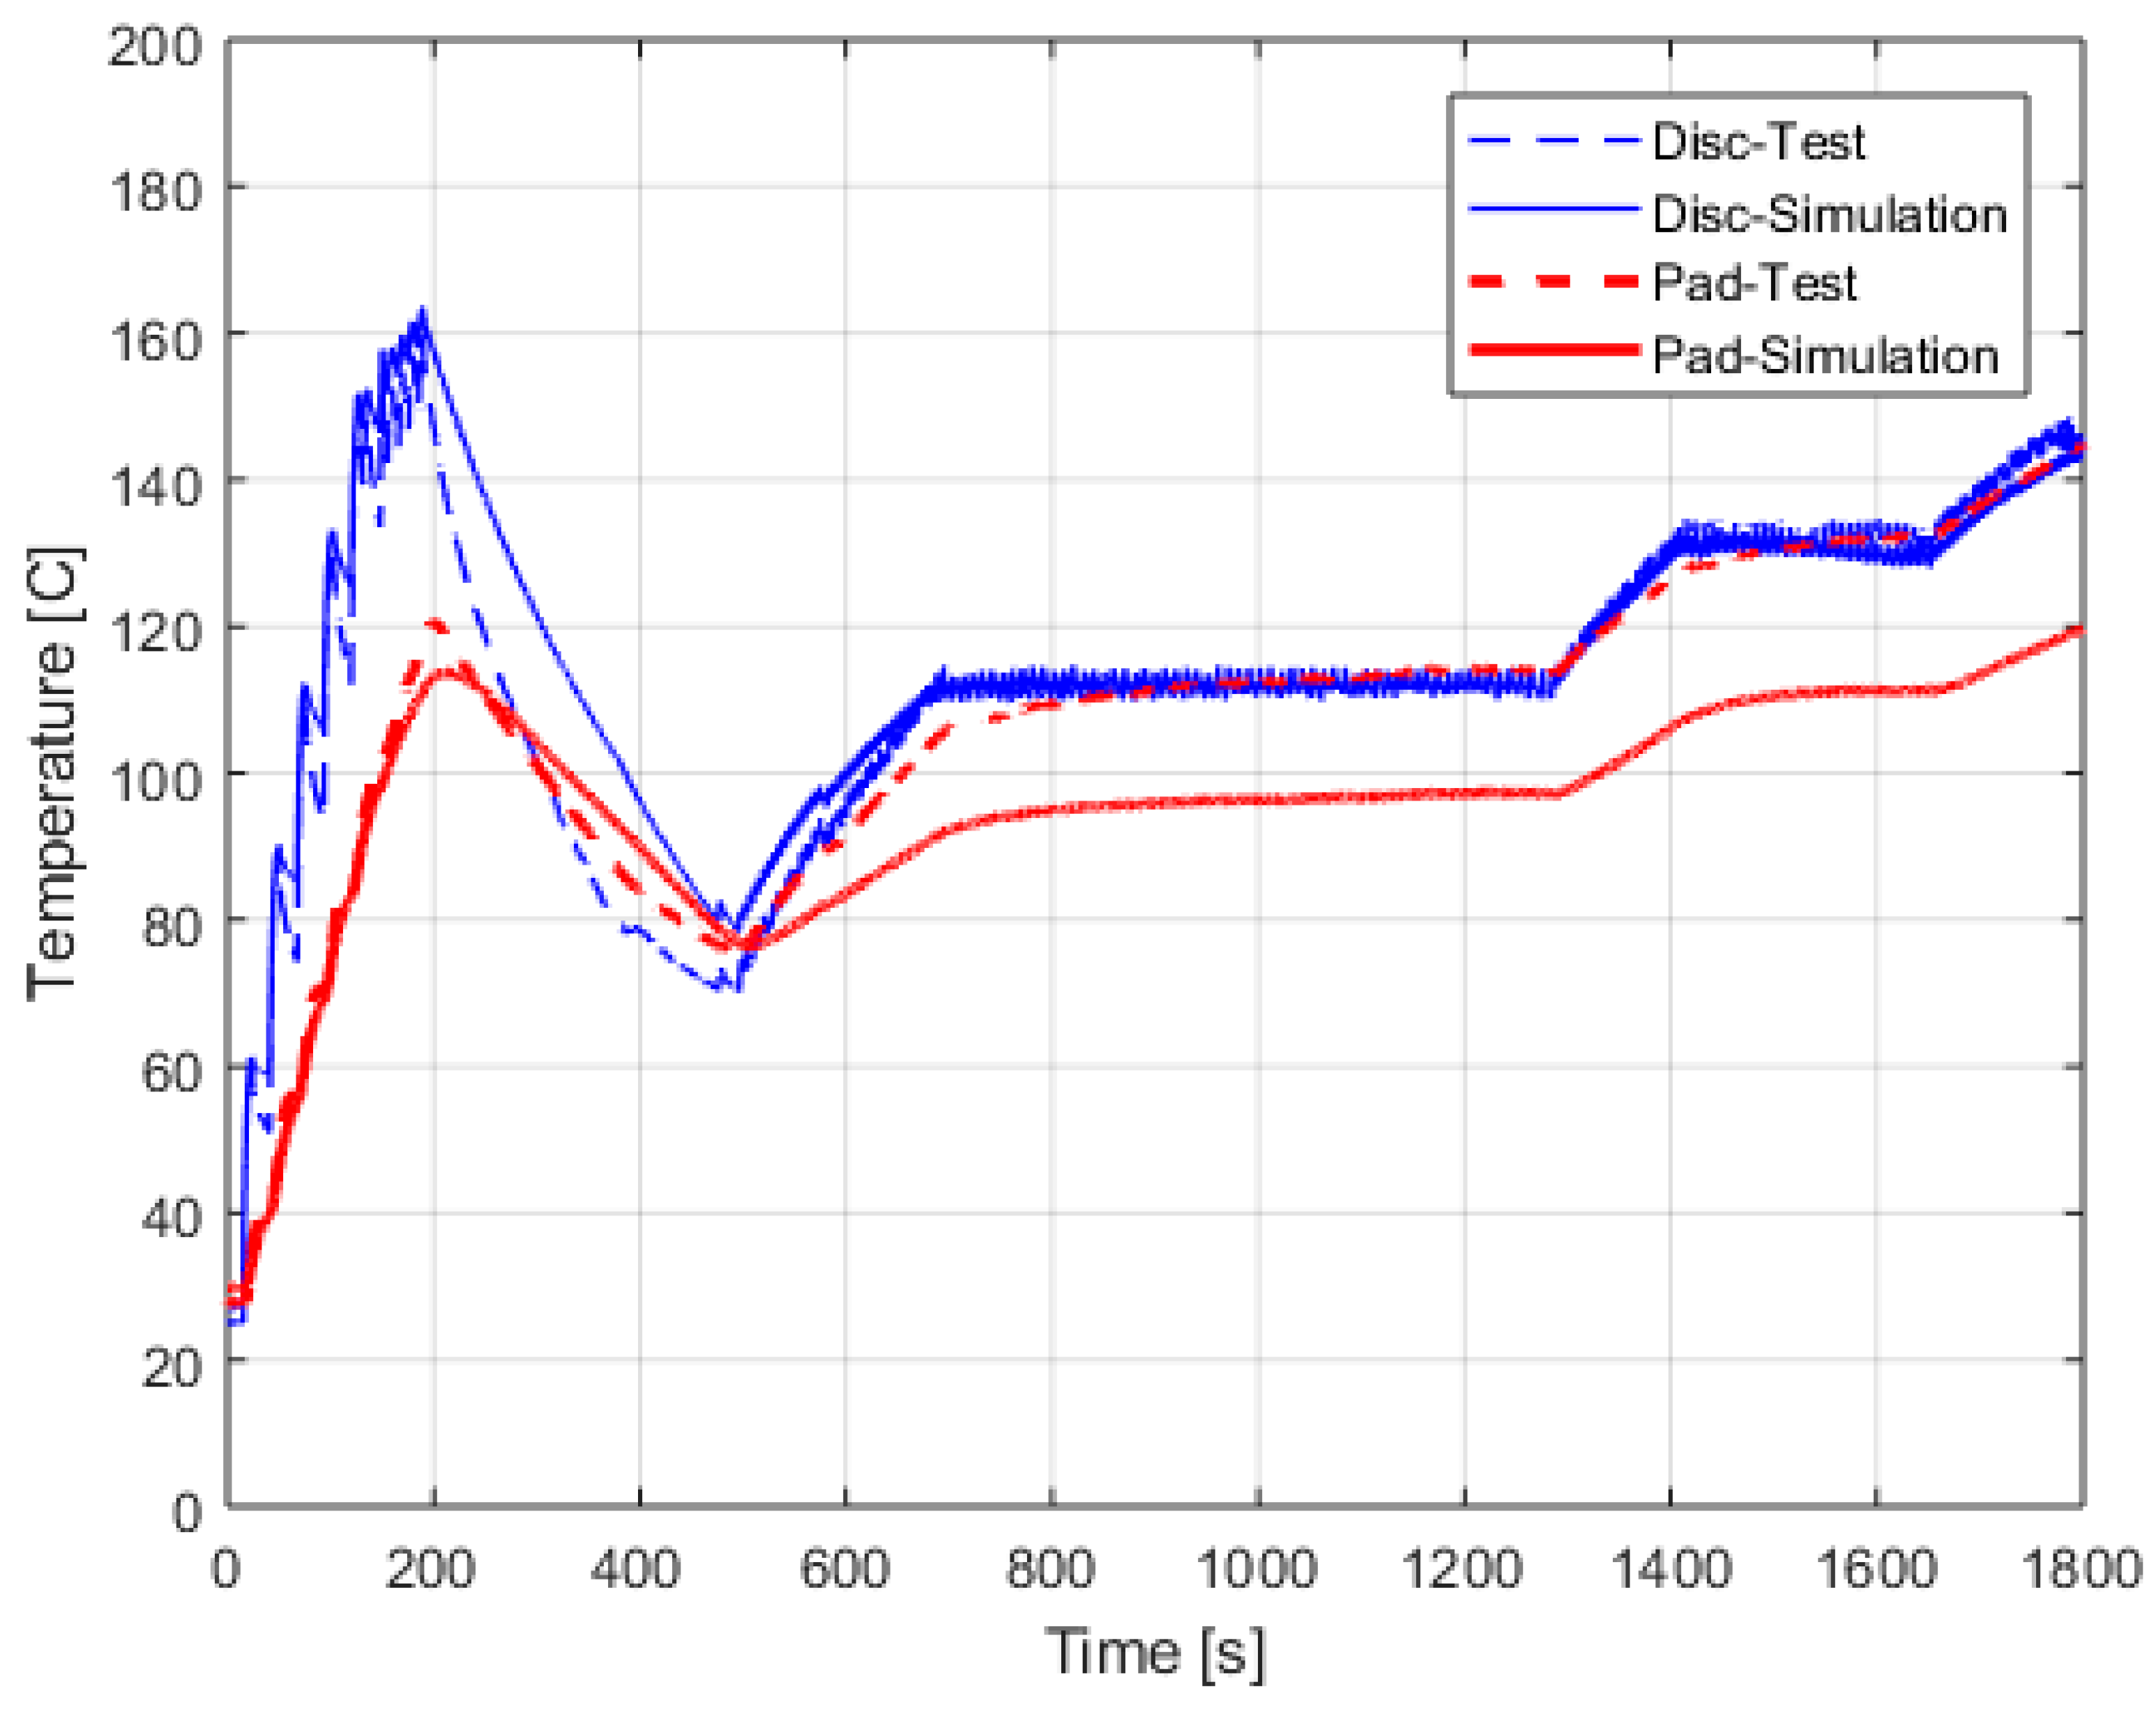
4.2. Thermal-CFD Results
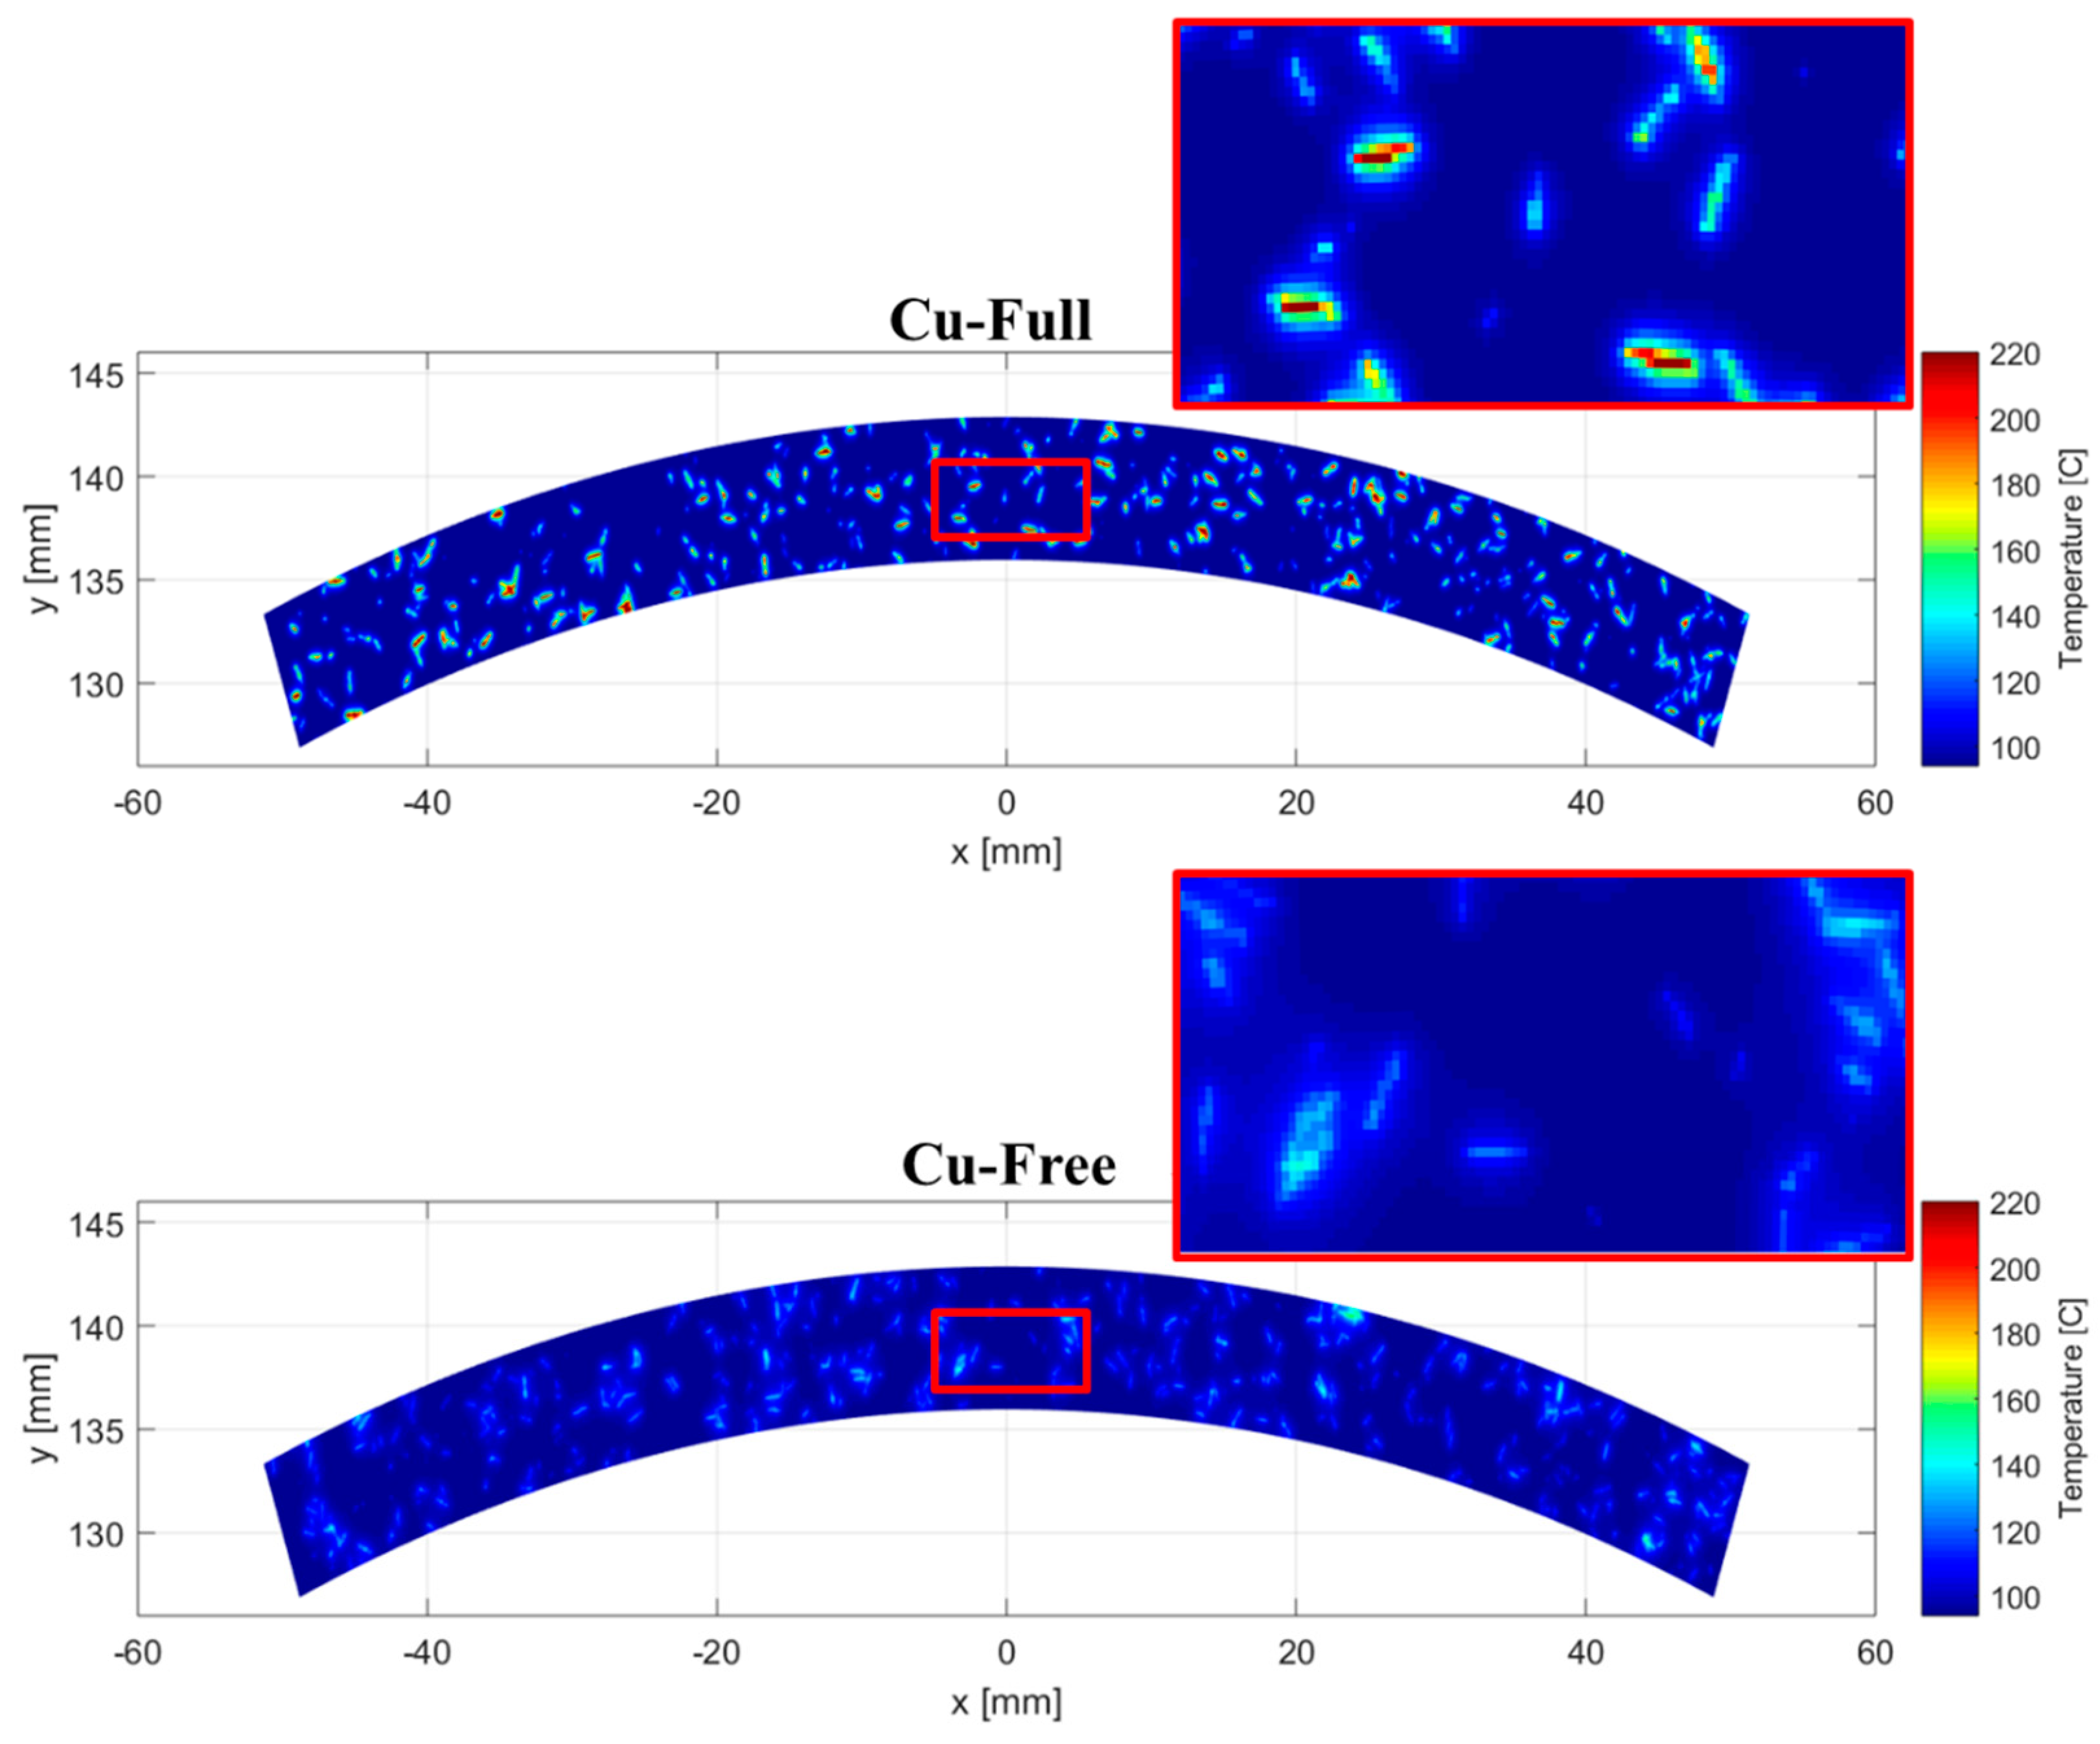
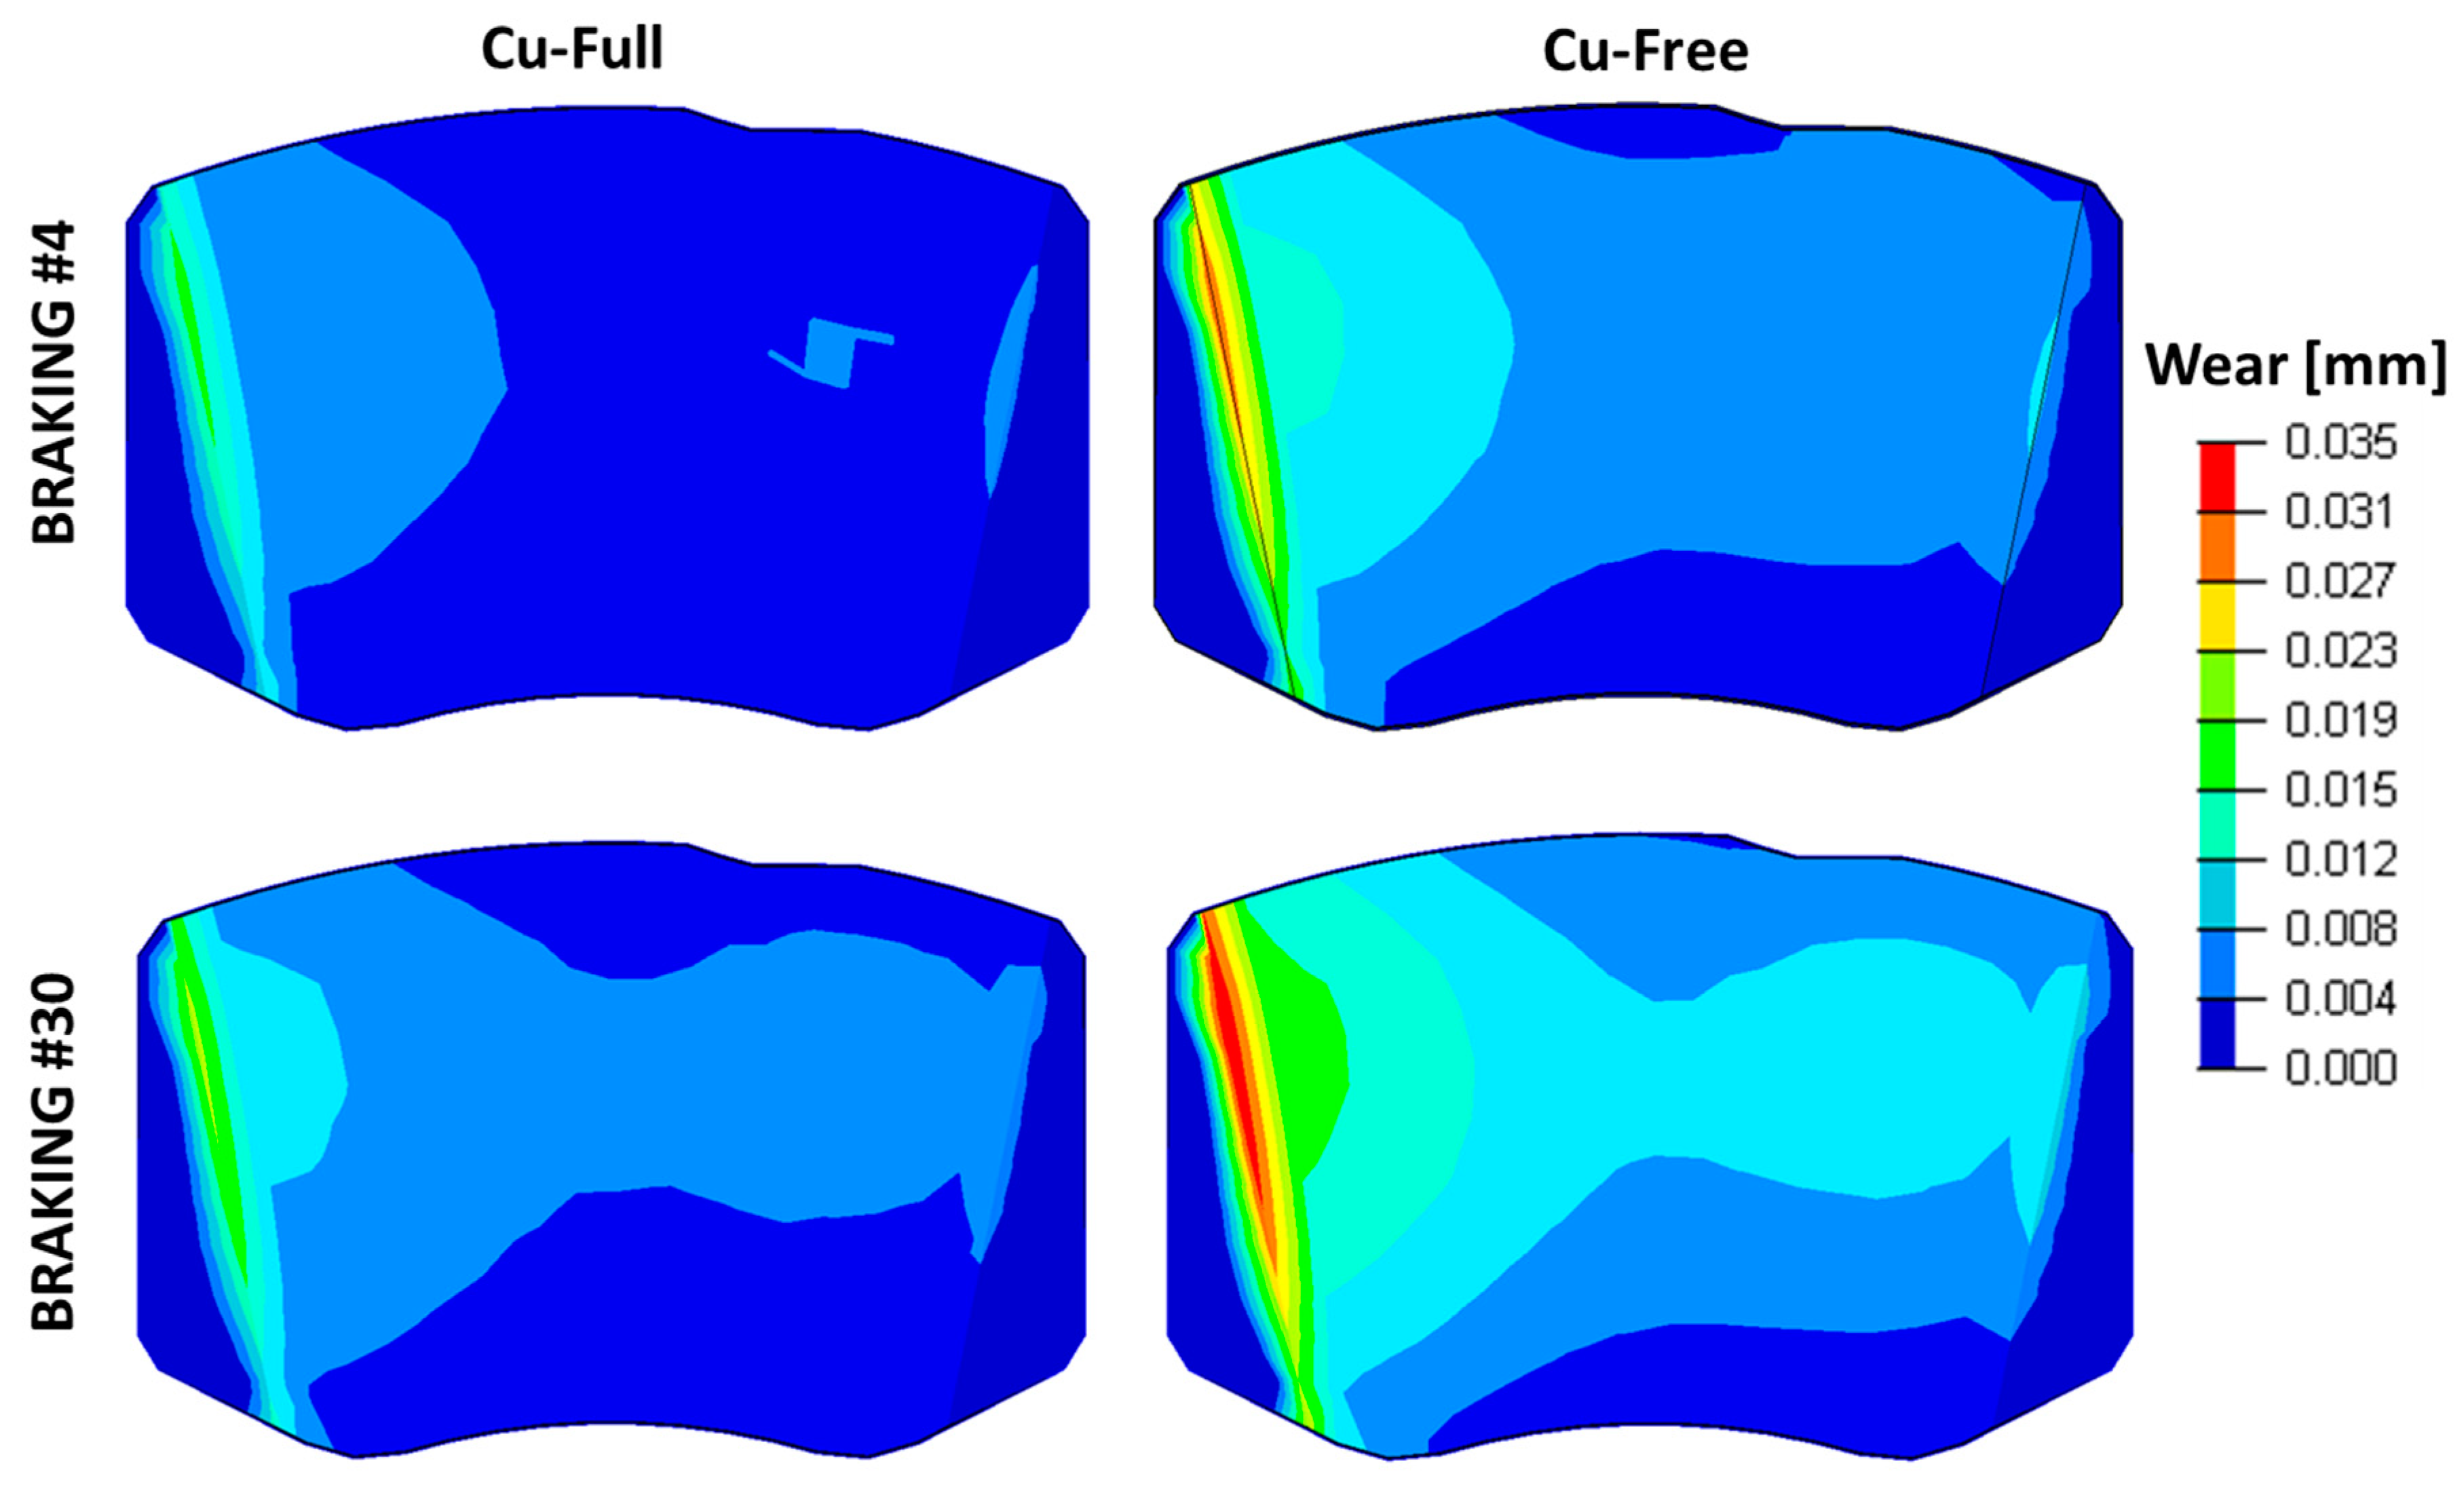
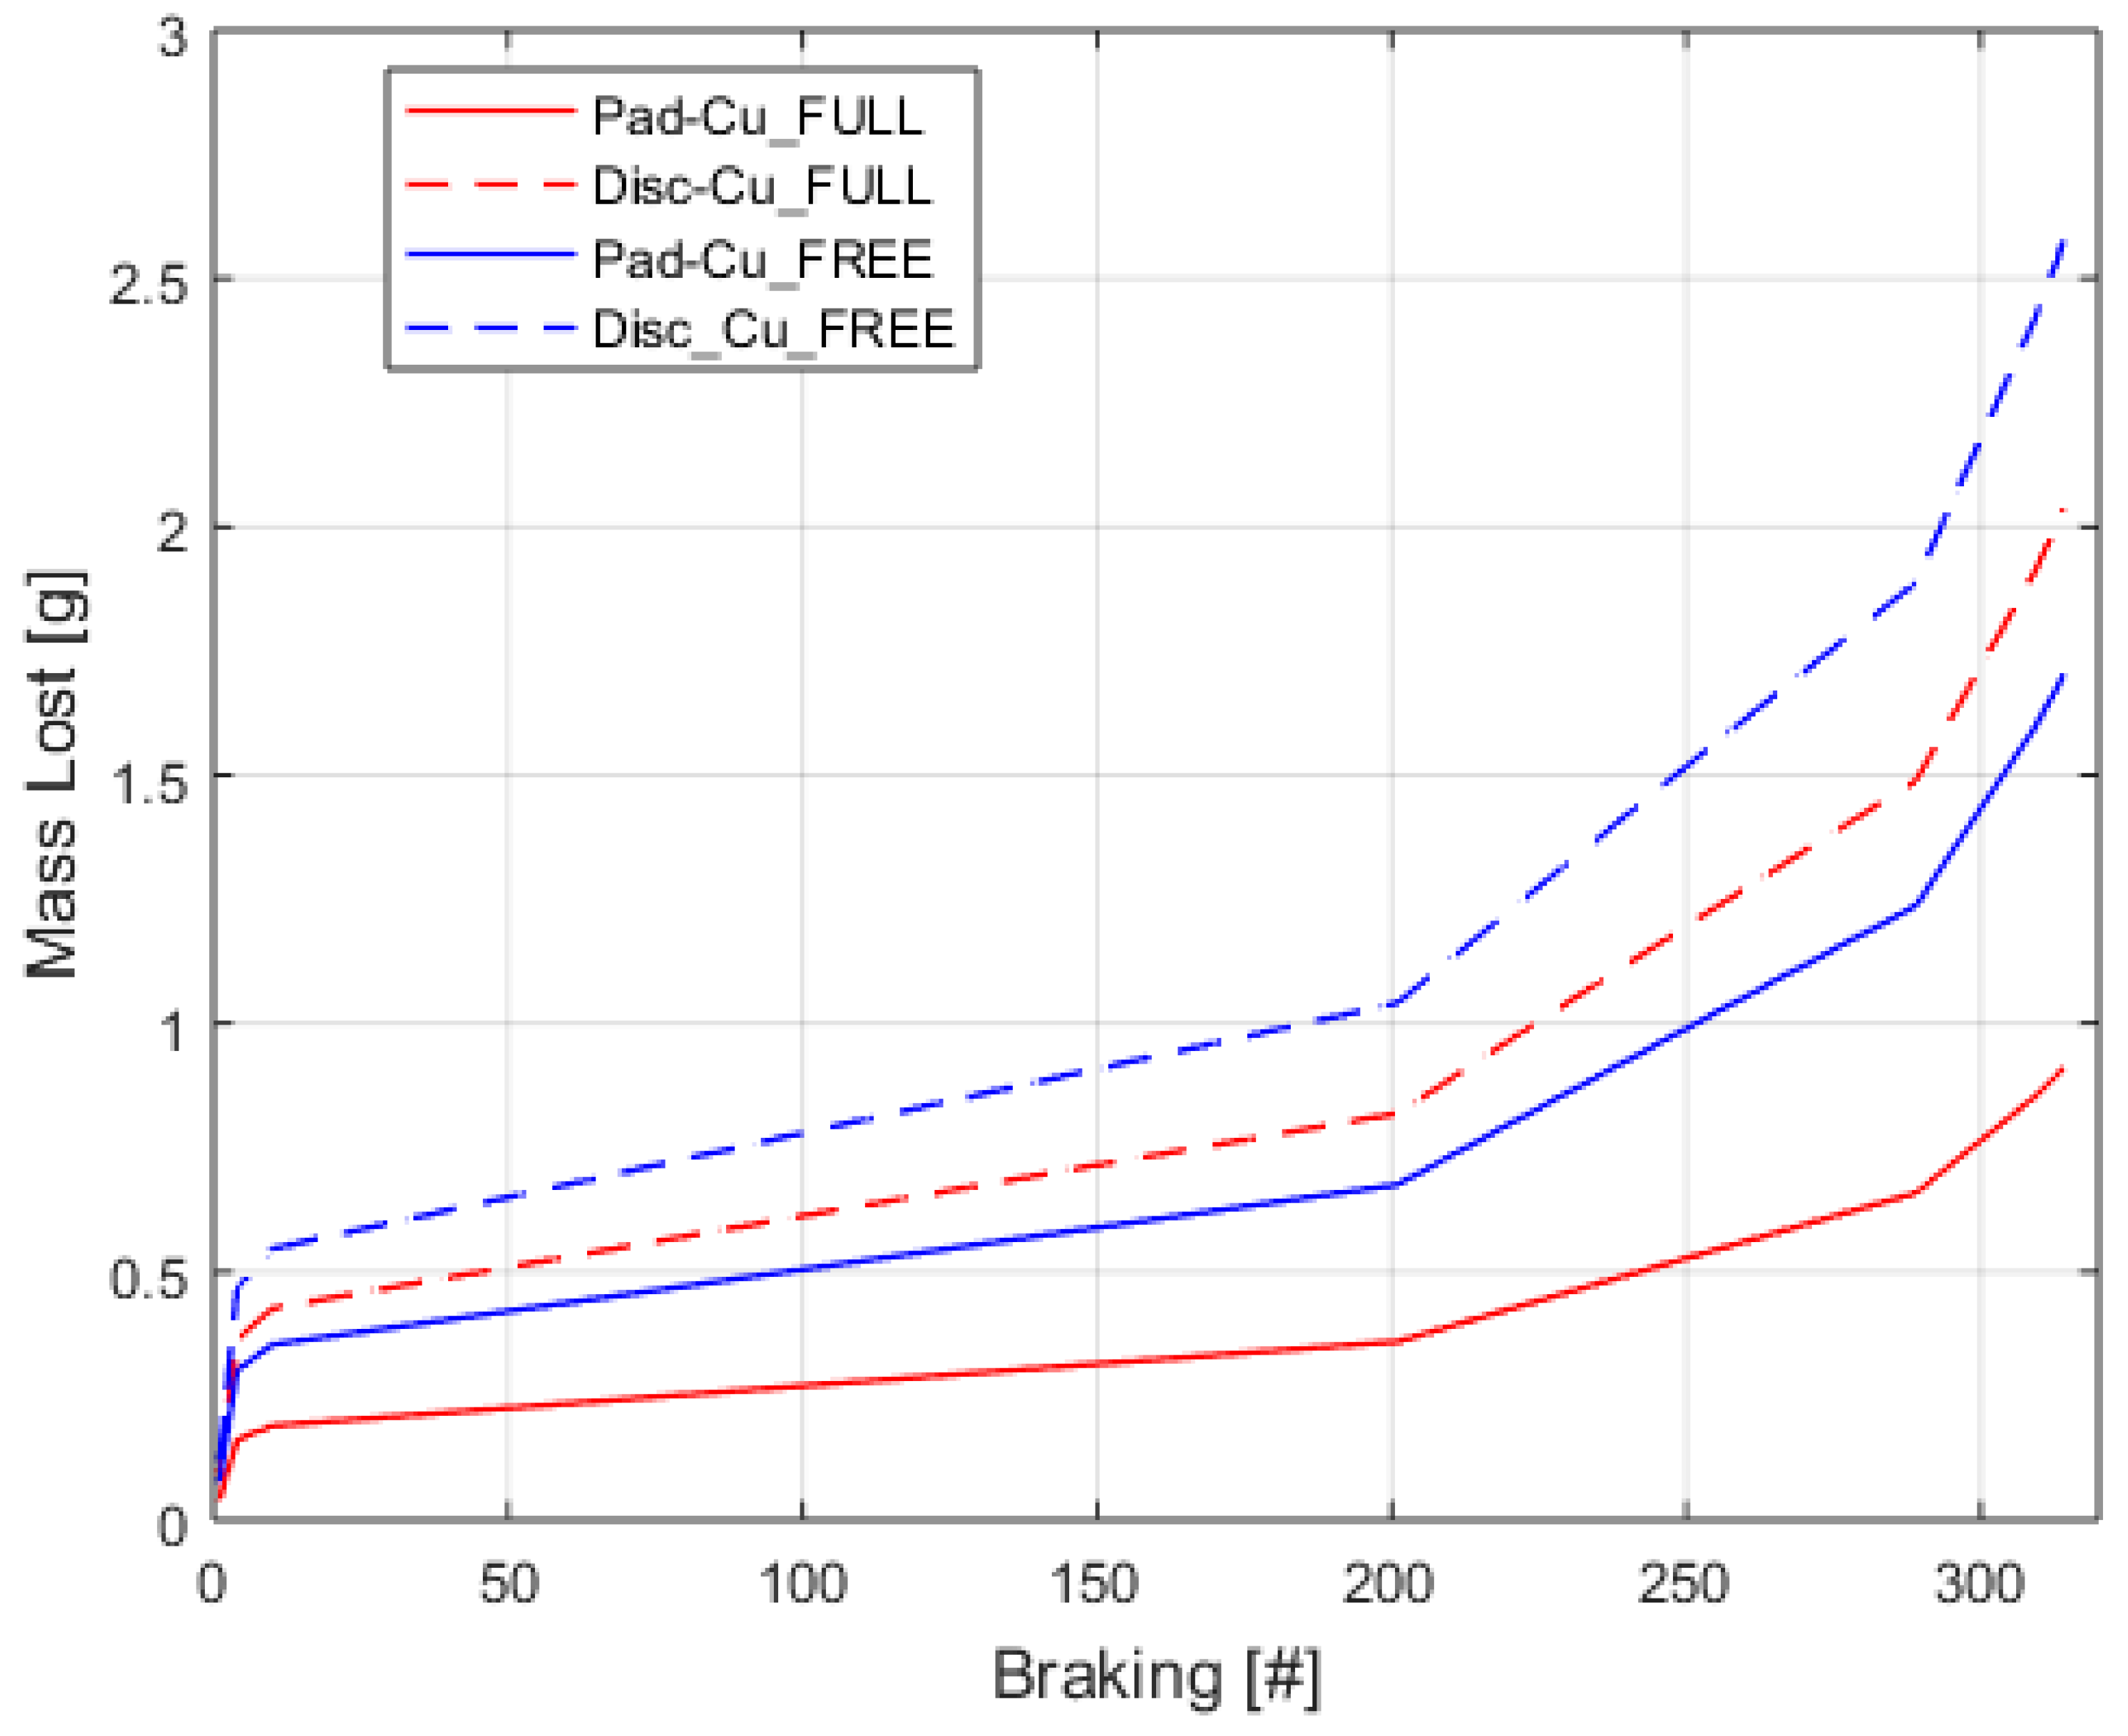
4.3. CA Results
5. Discussion
6. Conclusions
- (1)
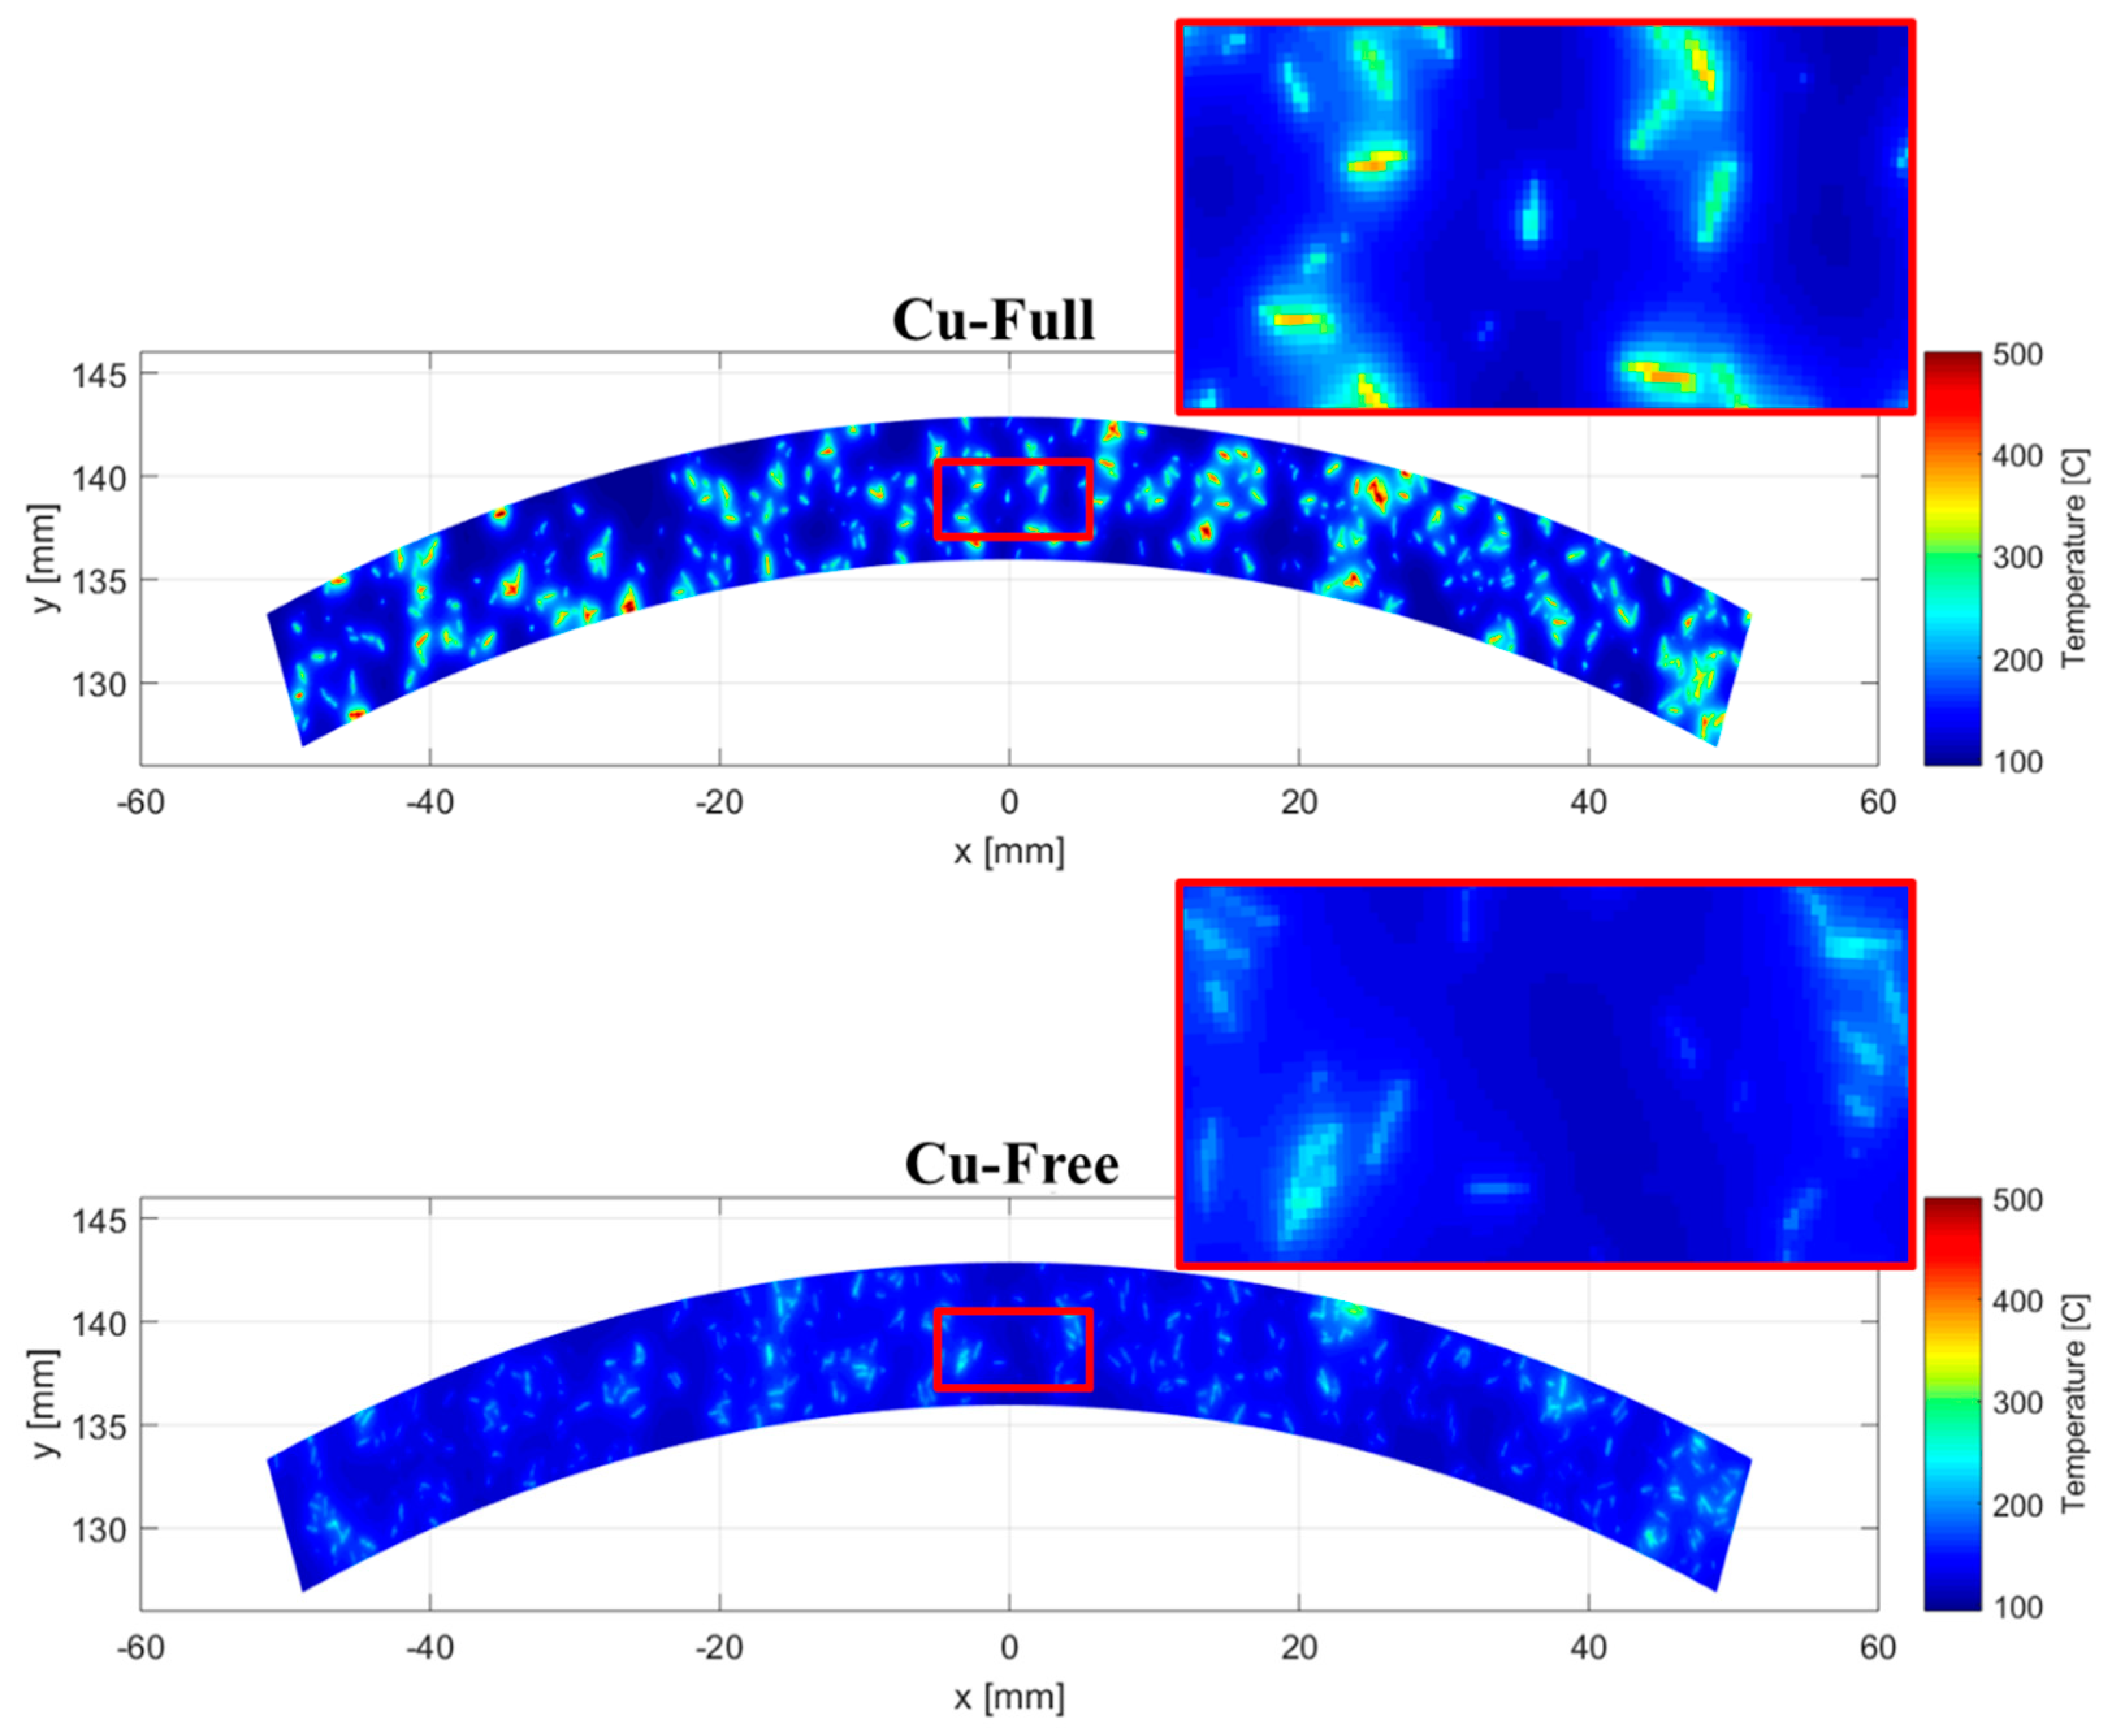
- The peaks in surface temperatures are considerably higher for the Cu-full pad friction material;
- (2)
- The surface temperature distribution is more uniform for the Cu-free pad friction material; and
- (3)
- The influence of copper-based fibres does not seem to have a significant impact on the local pad surface temperature.
Author Contributions
Funding
Acknowledgments
Conflicts of Interest
Abbreviations
| CA | Cellular automaton |
| CFD | Computational fluid dynamics |
| CFL | Courant–Friedrichs–Lewy condition |
| EPA | Environmental Protection Agency |
| FEA | Finite element analysis |
| HTC | Heat transfer coefficient |
| MRF | Moving reference frame |
| RANS | Reynold-Averaged Navier–Stokes equations |
References
- Amato, F. (Ed.) Non-Exhaust Emissions: An Urban Air Quality Problem for Public Health; Academic Press: Cambridge, MA, USA, 2018; p. 342. [Google Scholar]
- California State Senate Bill 346: Hazardous Materials: Motor Vehicle Brake Friction Materials. Available online: https://leginfo.legislature.ca.gov/faces/billNavClient.xhtml?bill_id=200920100SB346 (accessed on 27 September 2010).
- Washington State Senate Bill 6557: Brake Friction Material—Restriction on Use. Available online: http://lawfilesext.leg.wa.gov/biennium/2009-10/Pdf/Bills/Senate%20Bills/6557-S.pdf (accessed on 2 April 2010).
- EPA. Memorandum of Understanding on Copper Mitigation in Watershed and Waterways. Available online: https://www.epa.gov/npdes/copper-free-brake-initiative (accessed on 21 January 2015).
- Chen, H.; Paul, H.-G. Copper-Free Friction Material for Brake Pads. U.S. Patent 20130037360A1, 14 February 2013. [Google Scholar]
- Lu, X.; Shi, Y.; Chen, J.; Wang, C.; Mu, L. Copper-Free Ceramic Type Friction Material and Preparation Method. Thereof. Patent CN 101948673 B, 26 June 2013. [Google Scholar]
- Gilardi, R.; Alzati, L.; Thiam, M.; Brunel, J.F.; Desplanques, Y.; Dufrénoy, P.; Sharma, S.; Bijwe, J. Copper substitution and noise reduction in brake pads: Graphite type selection. Materials 2012, 5, 2258–2269. [Google Scholar] [CrossRef]
- Kumar, M.; Bijwe, J. Non-asbestos organic (NAO) friction composites: Role of copper; its shape and amount. Wear 2011, 270, 269–280. [Google Scholar] [CrossRef]
- Lee, P.W.; Filip, P. Friction and wear of Cu-free and Sb-free environmental friendly automotive brake materials. Wear 2013, 302, 1404–1413. [Google Scholar] [CrossRef]
- Schuler, L.J.; Hoang, T.C.; Rand, G.M. Aquatic risk assessment of copper in freshwater and saltwater ecosystems of South Florida. Ecotoxicology 2008, 17, 642–659. [Google Scholar] [CrossRef]
- Yun, R.; Filip, P.; Lu, Y. Performance and evaluation of eco-friendly brake friction materials. Tribol. Int. 2010, 43, 2010–2019. [Google Scholar] [CrossRef]
- Zhang, J.Z. Copper-Free Friction Material Composition for Brake. Pads. Patent WO 2012159286 A1, 21 May 2011. [Google Scholar]
- Chan, D.S.E.A.; Stachowiak, G.W. Review of automotive brake friction materials. Proc. Inst. Mech. Eng. Part D J. Automob. Eng. 2004, 218, 953–966. [Google Scholar] [CrossRef]
- Österle, W.; Prietzel, C.; Kloß, H.; Dmitriev, A.I. On the role of copper in brake friction materials. Tribol. Int. 2010, 43, 2317–2326. [Google Scholar] [CrossRef]
- Straffelini, G.; Ciudin, R.; Ciotti, A.; Gialanella, S. Present knowledge and perspectives on the role of copper in brake materials and related environmental issues: A critical assessment. Environ. Pollut. 2015, 207, 211–219. [Google Scholar] [CrossRef]
- Menapace, C.; Leonardi, M.; Matějka, V.; Gialanella, S.; Straffelini, G. Dry sliding behavior and friction layer formation in copper-free barite containing friction materials. Wear 2018, 398, 191–200. [Google Scholar] [CrossRef]
- Cristol-Bulthé, A.L.; Desplanques, Y.; Degallaix, G. Coupling between friction physical mechanism and transient thermal phenomena involved in pad-disc contact during railway braking. Wear 2007, 263, 1230–1242. [Google Scholar] [CrossRef]
- Eriksson, M.; Lord, J.; Jacobson, S. Wear and contact conditions of brake pads: Dynamical in situ studies of pad on glass. Wear 2001, 249, 272–278. [Google Scholar] [CrossRef]
- Gramstadt, S. Methoden der In-Situ Visualisierung der Reibzonendynamik Trockenlaufender Reibpaarungen Unter Ergänzung Physikalischer and Chemischer Charakterisierungen der Reibpartner. Ph.D. Thesis, Universitätsverlag Ilmenau, Ilmenau, Germany, 2015. [Google Scholar]
- Hacisalihoglu, Y.; Dalga, Y.B.; Akca, D.; Ergin, E.; Aydin, B. Brake cooling modelling & correlation. In Proceedings of the Eurobrake, Dresden, Germany, 21–23 May 2019. EB2019-SVM-031. [Google Scholar]
- Thuresson, A.D.R.I.A.N. CFD and Design Analysis of Brake Disc. Master’s Thesis, Chalmers University of Technology, Göteborg, Sweden, 2014. [Google Scholar]
- Belhocine, A.; Cho, C.D.; Nouby, M.; Yi, Y.B.; Bakar, A.; Rahim, A. Thermal analysis of both ventilated and full disc brake rotors with frictional heat generation. Appl. Comput. Mech. 2014, 8, 5–24. [Google Scholar]
- Afzal, A.; Mujeebu, M.A. Thermo-mechanical and structural performances of automobile disc brakes: A review of numerical and experimental studies. Arch. Comput. Methods Eng. 2018, 1–15. [Google Scholar] [CrossRef]
- Söderberg, A.; Sellgren, U.; Andersson, S. Using finite element analysis to predict the brake pressure needed for the effective rotor cleaning in disc brakes. SAE Int. 2008. [Google Scholar] [CrossRef]
- Valota, G.; De Luca, S.; Söderberg, A. Using a finite element analysis to simulate the wear in disc brakes during a dyno bench test cycle. In Proceedings of the Eurobrake, Dresden, Germany, 2–4 May 2017. EB2017-SVM-003. [Google Scholar]
- Wahlström, J.; Söderberg, A.; Olofsson, U. Simulation of airborne wear particles from disc brakes. SAE Tech. Pap. 2009. [Google Scholar] [CrossRef]
- Müller, M.; Ostermeyer, G.P. A cellular automaton model to describe the three-dimensional friction and wear mechanism of brake systems. Wear 2007, 263, 1175–1188. [Google Scholar] [CrossRef]
- Wahlström, J.; Söderberg, A.; Olofsson, U. A cellular automaton approach to numerically simulate the contact situation in disc brakes. Tribol. Lett. 2011, 42, 253–262. [Google Scholar] [CrossRef]
- Müller, M.; Ostermeyer, G.P. Cellular automata method for macroscopic surface and friction dynamics in brake systems. Tribol. Int. 2007, 40, 942–952. [Google Scholar] [CrossRef]
- Wahlström, J. A comparison of measured and simulated friction, wear, and particle emission of disc brakes. Tribol. Int. 2015, 92, 503–511. [Google Scholar] [CrossRef]
- Wahlström, J. A factorial design to numerically study the effects of brake pad properties on friction and wear emissions. Adv. Tribol. 2016, 2016, 8181260. [Google Scholar] [CrossRef]
- Dufrénoy, P.; Naıt-Abdelaziz, M. Third body influence on thermal friction contact problems: Application to braking. J. Tribol. 2005, 127, 89–95. [Google Scholar]
- Bode, K.; Ostermeyer, G.P. A comprehensive approach for the simulation of heat and heat-induced phenomena in friction materials. Wear 2014, 311, 47–56. [Google Scholar] [CrossRef]
- Goo, B.C. A study on the contact pressure and thermo-elastic behavior of a brake disc-pad by infrared images and finite element analysis. Appl. Sci. 2018, 8, 1639. [Google Scholar] [CrossRef]
- Riva, G.; Perricone, G.; Wahlström, J. Simulation of Contact Area and Pressure Dependence of Initial Surface Roughness for Cermet-Coated Discs Used in Disc. Brakes. Tribol. Ind. 2019, 41. [Google Scholar] [CrossRef]
- Perricone, G.; Wahlström, J.; Olofsson, U. Towards a test stand for standardized measurements of the brake emissions. Proc. Inst. Mech. Eng. Part D J. Automob. Eng. 2016, 230, 1521–1528. [Google Scholar] [CrossRef]
- Riva, G.; Valota, G.; Perricone, G.; Wahlström, J. An FEA approach to simulate disc brake wear and airborne particle emissions. Tribol. Int. 2019, 138, 90–98. [Google Scholar] [CrossRef]
- Information about Abaqus. Available online: https://www.3ds.com/products-services/simulia/products/abaqus/ (accessed on 4 September 2019).
- Archard, J. Contact and rubbing of flat surfaces. J. Appl. Phys. 1953, 24, 981–988. [Google Scholar] [CrossRef]
- Information about StarCCM+. Available online: https://www.plm.automation.siemens.com/global/it/products/simcenter/STAR-CCM.html (accessed on 4 September 2019).
- Pope, S.B. Turbolent Flows; 7th Printing 2010 (first edition 2000); Cambridge University Press: Cambridge, UK, 2010; pp. 369–385. [Google Scholar]
- Bernatz, R. Fourier Series and Numerical Methods for Partial Differential Equations, 1st ed.; Wiley: New York, NY, USA, 2010; Chapters 7–9. [Google Scholar]
- Lee, K. Numerical prediction of brake fluid temperature rise during braking and heat soaking. SAE Tech. Pap. 1999. [Google Scholar] [CrossRef]
- Söderberg, A.; Björklund, S. Validation of a simplified numerical contact model. Tribol. Int. 2008, 41, 926–933. [Google Scholar] [CrossRef]
- Hugnell, A.B.J.; Bjoerklund, S.; Andersson, S. Simulation of mild wear in a cam-follower contact with follower rotation. Wear 1996, 199, 202–210. [Google Scholar] [CrossRef]
- Flodin, A.; Andersson, S. Wear simulations of spur gears. TriboTest J. 1999, 5, 225–249. [Google Scholar] [CrossRef]
- Perricone, G.; Alemani, M.; Wahlström, J.; Olofsson, U. A proposed driving cycle for brake emissions investigation for test stand. Proc. Inst. Mech. Eng. Part D J. Automob. Eng. 2019. [Google Scholar] [CrossRef]


| Name | Value |
|---|---|
| Wheel radius | 361 mm |
| Rotor outer radius | 171 mm |
| Rotor inner radius | 92.2 mm |
| Rotor effective radius | 136 mm |
| Pad surface area | 7507 mm2 |
| Cylinder diameters | 4 × 22 mm |
| Components | Cu-Full | Cu-Free |
|---|---|---|
| Pads | 6.79 × 10⁻⁹ | 1.27 × 10⁻⁸ |
| Disc | 6.82 × 10⁻⁹ | 5.25 × 10⁻⁹ |
| Section | Initial Speed (km/h) | End Speed (km/h) | Initial Disc Temperature (°C) | Braking Deceleration (g) | Stops (#) |
|---|---|---|---|---|---|
| Cleaning | 100 | 10 | / | 1.53 | 4 |
| 100 | 20 | / | 1.53 | 2 | |
| 50 | 20 | / | 1.27 | 4 | |
| 1.1 | 36 | 26 | 70 | 0.16 | 2 |
| 1.2 | 36 | 26 | 90 | 0.16 | 18 |
| 1.3 | 36 | 26 | 110 | 0.16 | 83 |
| 1.4 | 36 | 26 | 130 | 0.16 | 56 |
| 1.5 | 36 | 26 | 150 | 0.16 | 24 |
| 1.6 | 36 | 26 | 170 | 0.16 | 8 |
| 2.1 | 52 | 28 | 70 | 0.23 | 5 |
| 2.2 | 52 | 28 | 90 | 0.23 | 16 |
| 2.3 | 52 | 28 | 110 | 0.23 | 22 |
| 2.4 | 52 | 28 | 130 | 0.23 | 25 |
| 2.5 | 52 | 28 | 150 | 0.23 | 12 |
| 2.6 | 52 | 28 | 170 | 0.23 | 8 |
| 3.1 | 57 | 5 | 70 | 0.25 | 2 |
| 3.2 | 57 | 5 | 90 | 0.25 | 3 |
| 3.3 | 57 | 5 | 110 | 0.25 | 6 |
| 3.4 | 57 | 5 | 130 | 0.25 | 8 |
| 3.5 | 57 | 5 | 150 | 0.25 | 1 |
| 4.1 | 70 | 17 | 110 | 0.31 | 1 |
| 4.2 | 70 | 17 | 130 | 0.31 | 2 |
| 4.3 | 70 | 17 | 170 | 0.31 | 1 |
| 5.1 | 79 | 20 | 110 | 0.24 | 1 |
| Fibre Material | Cu-Full | Cu-Free | ||
|---|---|---|---|---|
| wt % | Characteristic Length (µm) | wt % | Characteristic Length (µm) | |
| Steel | <10 | 0.3 | <25 | 0.3 |
| Copper | <10 | 0.3 | / | / |
| Brass | <10 | 0.3 | / | / |
| Kevlar | <5 | 1.0 | <5 | 1.0 |
| Name | Value |
|---|---|
| External radius simulated, re (mm) | 0.1395 |
| Internal radius simulated, ri (mm) | 0.1325 |
| No. of nodes in r direction | 70 |
| No. of nodes in θ direction | 1000 |
| No. of nodes in z direction | 20 |
| Radial distance between nodes, Δr (μm) | 100 |
| Radial distance between nodes, Δθ (μm) | 100 |
| Radial distance between nodes, Δz (μm) | 100 |
| Wear height of resin material, hm (μm) | 20 |
| Height of foundation, h (μm) | 500 |
| Fibre Material | Density (kg/m3) | Specific Heat (J/(kg·K)) | Thermal Conductivity (W/(m·K)) |
|---|---|---|---|
| Steel | 7800 | 460 | 49 |
| Copper | 8930 | 362 | 160 |
| Brass | 7900 | 372 | 100 |
| Kevlar | 1750 | 1000 | 0.4 |
| Non-fibre (Cu-full) | 2177 | 975 | 0.9 |
| Non-fibre (Cu-free) | 2357 | 838 | 2.3 |
© 2019 by the authors. Licensee MDPI, Basel, Switzerland. This article is an open access article distributed under the terms and conditions of the Creative Commons Attribution (CC BY) license (http://creativecommons.org/licenses/by/4.0/).
Share and Cite
Riva, G.; Perricone, G.; Wahlström, J. A Multi-Scale Simulation Approach to Investigate Local Contact Temperatures for Commercial Cu-Full and Cu-Free Brake Pads. Lubricants 2019, 7, 80. https://doi.org/10.3390/lubricants7090080
Riva G, Perricone G, Wahlström J. A Multi-Scale Simulation Approach to Investigate Local Contact Temperatures for Commercial Cu-Full and Cu-Free Brake Pads. Lubricants. 2019; 7(9):80. https://doi.org/10.3390/lubricants7090080
Chicago/Turabian StyleRiva, Gabriele, Guido Perricone, and Jens Wahlström. 2019. "A Multi-Scale Simulation Approach to Investigate Local Contact Temperatures for Commercial Cu-Full and Cu-Free Brake Pads" Lubricants 7, no. 9: 80. https://doi.org/10.3390/lubricants7090080
APA StyleRiva, G., Perricone, G., & Wahlström, J. (2019). A Multi-Scale Simulation Approach to Investigate Local Contact Temperatures for Commercial Cu-Full and Cu-Free Brake Pads. Lubricants, 7(9), 80. https://doi.org/10.3390/lubricants7090080