1. Introduction
Most practical applications of rubber materials involve large deformations, with strain in the range of 0.1–1. Rubber with filler particles is a highly nonlinear material, where the effective elastic modulus typically decreases by a factor of ≈10 with increasing strain from less
to 1. Most of the drop occurs already for a very small strain, typically below 0.1. The strong dependence on the strain amplitude is due to the breakup of the filler network [
1,
2,
3,
4,
5,
6,
7,
8,
9,
10,
11,
12,
13]. That is, in the undeformed state, if the filler particle (volume) fraction is larger than ≈0.3, they form a percolating network in the rubber matrix. During deformation with large enough strain, this network is broken up, resulting in a strong reduction in the effective elastic modulus. This break up of the filler network with an increasing strain amplitude is also associated with a large increase in the dissipative response of the rubber compound.
An interesting idea for the low-strain extensional reinforcement of elastomers was proposed by Smith et al. [
12]. They proposed that the reinforcement results from a nanoparticulate jamming-induced suppression in the composite Poisson ratio. This suppression forces an increase in rubber volume with extensional deformation, effectively converting a portion of the rubber’s bulk modulus into an extensional modulus.
There are different ways to probe the nonlinear viscoelastic properties of rubber materials, and here we compare the results of measurements using oscillatory strain in tension and shear modes. We also compare these results with the effective modulus obtained from strain relaxation (creep) measurements. We discuss what type of measurements are most suitable for obtaining the viscoelastic modulus for rubber friction calculations.
In
Section 2 we review the theory of nonlinear response. In
Section 3 we present the experimental methods used here, and in
Section 4, our experimental results.
Section 5 contains a discussion and
Section 6 the summary and conclusion.
2. Theory
The nonlinear response theory shows that the relation between stress
and strain
during elongation or shear can be written as [
14]
where causality requires that the response function
is nonzero only when
,
is nonzero only when
and
, and so on.
For elongation of a rectangular strip (elongation force
) with (undeformed) cross section
and length
, and if
is the engineering stress
then
in Equation (
1) is conveniently chosen as the linear strain
, while if
is the physical (or true) stress then
is conveniently chosen as the logarithmic strain
: consider elongating a rubber strip with the original cross section
and length
. If
denote the engineering stress then the elongation force
and the work to elongate is
where
is the linear strain and
the rubber volume. If
denote the physical stress then
so that
where
is the logarithmic strain. Here we have assumed that there is no change in the volume during the deformation i.e.,
. For small strain, as is well known, the logarithmic strain reduces to the linear strain.
There are various ways to study the nonlinear viscoelastic properties of rubber materials. One of the standard methods is to apply oscillatory strain, and gradual increasing of the strain amplitude. If the strain is given by
then the sum in Equation (
1) will have the form
where
(
) are complex valued functions of the frequency
and the strain amplitude
. For example,
Note that when
only the
term will be non-zero. If we write
,
, … we can also write
The dynamical mechanical analysis (DMA) instruments that we use give as the output the effective Young’s modulus
(or shear modulus) obtained from the stress component which oscillates with the same frequency as the (driving) strain, i.e.,
which depends on the strain amplitude
. For small strain amplitude, where the rubber responds linearly to the applied strain,
is independent of the strain amplitude and equal to the (viscoelastic) linear response function
.
We notice that the energy dissipation for one cycle of oscillating strain depends only on the response function
. This follows from the expression for the energy dissipation (per unit volume and for one period of oscillation) in response to the oscillating strain
:
Here we have used that
for
will give a vanishing contribution to the dissipated energy since the integrand in (2) will have the time dependency
which will vanish when integrated over one period of the oscillating strain.
The quantity
is very important since it reduces to the (linear response) viscoelastic modulus
as
, and it determines the dissipated energy (in response to the oscillatory strain
) even in the nonlinear region. We also notice that for filled rubber compounds, the response to the harmonic drive
is often a nearly perfectly sinusoidal stress response, i.e., it lacks higher-order harmonics [
15]. Still,
depends on the strain amplitude
and the viscoelastic modulus can be written approximately as
where
and
are two different function with
. Note that if
then
would obey the Kramers–Kronig relation (see below), but it was shown in [
16] that this is not the case. The fact that the harmonic drive results in a nearly perfectly sinusoidal response has been denoted as the “harmonic paradox”.
The presence of two different functions f and g in the expression for indicates that the deformation of filled rubber involves some new channel of energy dissipation, different from that involving the rubber matrix. This new dissipation channel may involve slip of polymer chains on the surface of filler particles, or some rearrangement of polymer chains when filler particle are separated from each other when the filler network breaks up during the deformation of the rubber. We noticed that f and g depend on temperature in a different way from that of the rubber matrix.
Another experimental approach to study the viscoelastic response of polymers is stress or strain relaxation. In these experiments, at time
a constant stress is applied (strain relaxation or creep), or a constant displacement (strain) is imposed (stress relaxation). This will result in a strain which increases with increasing time, or to stress, which decreases with time. For example, if
(stress relaxation), where
is a step function, we get from Equation (
1)
We can write this equation as
In the linear response region, the stress relaxation modulus
and the modulus
contain exactly the same information. At first this may seem surprising since
is a complex function, and, therefore, consists of two real functions, while
is a single real function. However, due to causality the real and imaginary part of
(as well for any other linear response function) satisfies the Kramers–Kronig relation, which in the present case takes the form
where
equals
as
, and where
P stands for principal value. Therefore, given
we can calculate
, i.e., there is only one independent function.
In the linear response limit, the relation between
and
is easy to derive: If the strain is abruptly increased (at time
) from zero to
then
where
is an infinitesimal small positive number. In this case, the stress at time
will be:
Comparing this to the definition
gives
Here we note that causality requires that
can be represented using the following spectral decomposition (Prony series)
where
is a real (and positive) function of relaxation time
. Substituting this into Equation (
5) gives
In the case where
is so large that the response is nonlinear, one cannot use Equation (
5) to relate
to
. However, it appears that it is still possible to write
in the form of Equation (
7), where
now depends on
and then use Equation (
6) to obtain an effective modulus which we denote as
.
In a strain relaxation (creep) experiment, at
a constant stress
is applied and the time dependent strain
is measured. To describe this one can introduce the strain relaxation modulus via
In the linear response limit
can be obtained from
by using that
Comparing this to the definition
gives
Here we note that causality requires that
can be represented using the following spectral decomposition (Prony series)
where
is a real and positive. Substituting this into Equation (
8) gives
In the case where
is so large that the response is nonlinear one cannot use Equation (
8) to relate
to
. However, it appears, that it is still possible to write
on the form Equation (
10), where
now depends on
and then use Equation (
9) to obtain an effective modulus which we denote as
.
3. Experimental Procedure
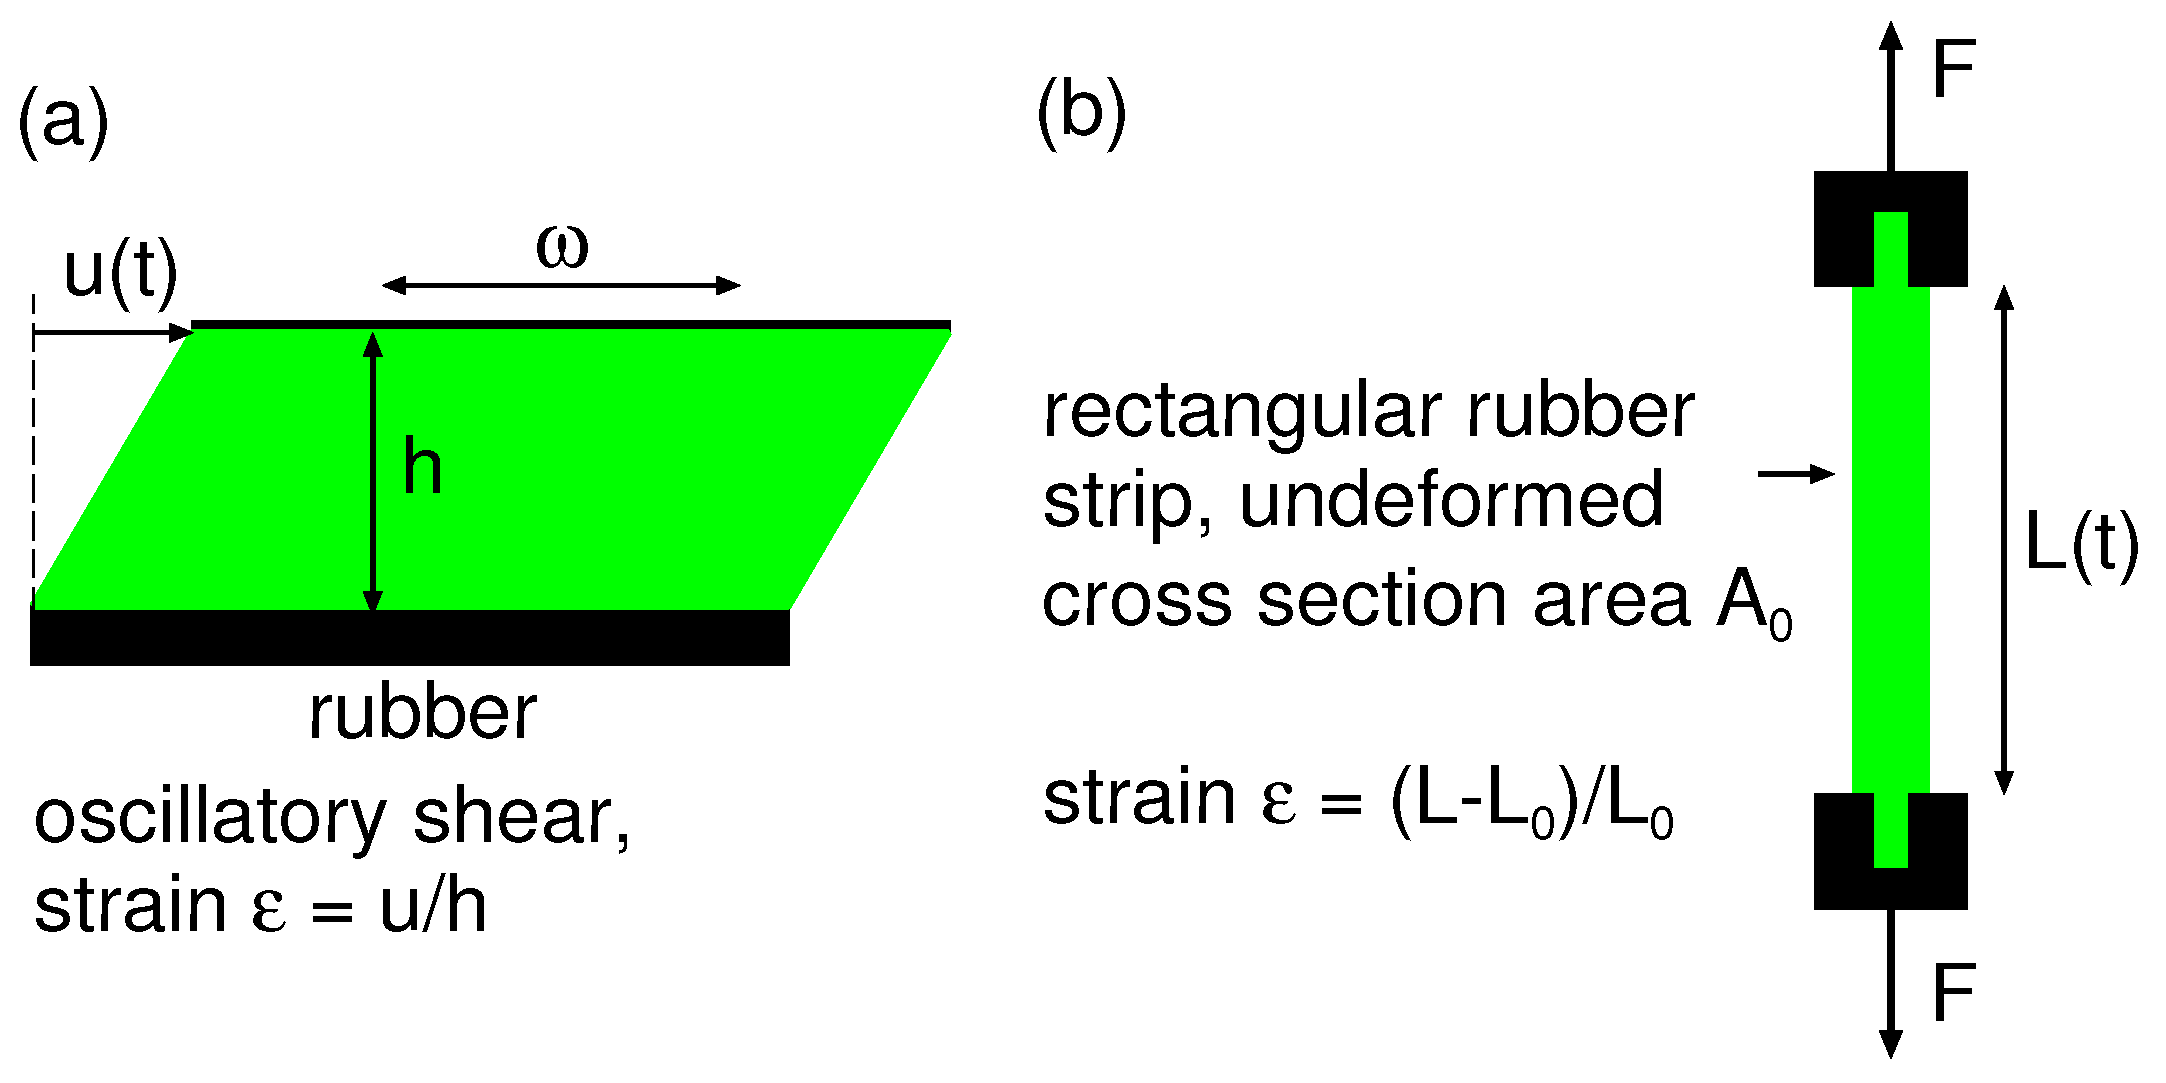
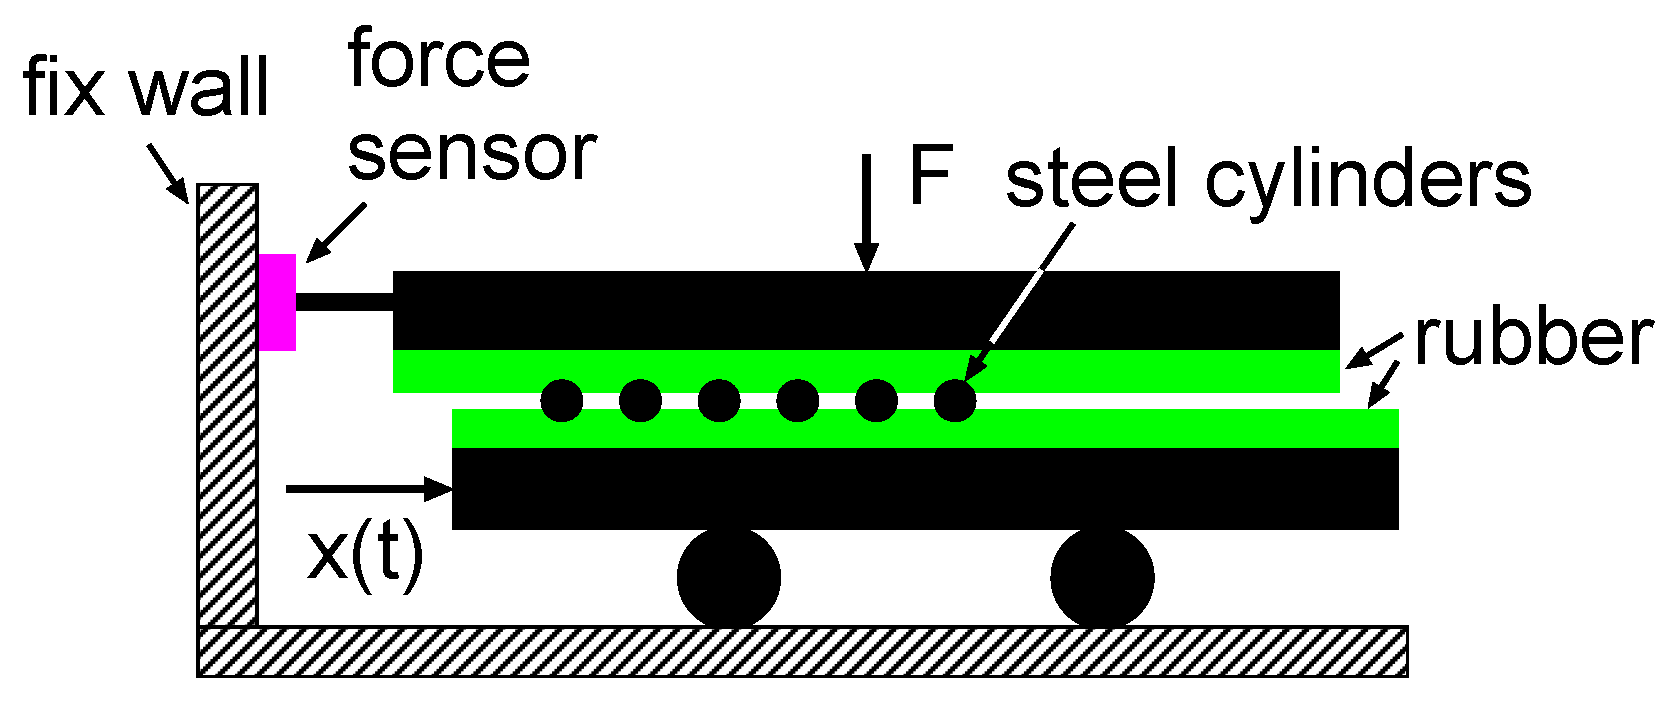
We performed measurements of the linear and nonlinear properties of two rubber compounds using the two experimental set-ups shown schematically in
Figure 1. The first method was performed in shear mode on the Metravib dynamical mechanical analysis (DMA) instrument. To obtain the shear modulus
the upper plate in
Figure 1a oscillates
in a plane with the frequency
and strain amplitude
.
The strain sweep was performed at different temperatures (, 0, 20, 60 and ), and was carried out from shear strain 0.0001 to 1 at the frequency . For each temperature, a new sample prepared from the same compound was used. Each sample was acclimatized in a DMA chamber for 10 min to achieve the desired temperature.
The second (home-built) set-up (
Figure 1b) was used for strain relaxation (creep) measurements. At
the rubber strip was elongated with the applied force
F. The length
of the rubber strip increased with time due to viscoelastic deformations (creep). Before applying the force
F, the rubber strip had a length
and a cross section area
, and at time
t the length and cross section area were
and
, respectively, where
. We defined the effective Young’s modulus
so that
where the strain
and the (physical) stress
. Note that the physical stress depends on time, therefore
defined in this way is slightly different from the strain relaxation modulus defined in
Section 2.
We also performed measurements of the viscoelastic master curve and strain sweeps in oscillatory tension mode using a Q800 DMA instrument produced by TA Instruments. In this case, we applied the oscillatory strain , where the pre-strain was chosen to be so that the rubber strip remained straight during the whole oscillation cycle. For the master curve, we used very small strain amplitude, , and in this case we are in the linear response region, where the modulus is independent on the strain amplitude (and the pre-strain). However, the strain sweep does depend on the pre-strain so we cannot expect exactly the same results as in the shear mode where no pre-strain applied. Since the pre-strain contributes to the break-up of the filler network, and since the pre-strain increases in proportion to the dynamic strain amplitude, we expect faster strain softening with increasing strain amplitude for the strain sweep in tension compared to in shear mode. In addition, the shear strain is not the same quantity as the strain in elongation ; usually the shear strain is denoted by rather than , but here we use the same notation for both quantities.
4. Experimental Results
Here we will present results for the linear and nonlinear response of two tire tread rubber compounds. Rubber compound A is a summer tire tread compound while the other compound C is a winter tread compound. Both compounds have a silica filler. The glass transition temperature, here defined as the temperature T where is maximal when studied at the frequency , are and for compound A and C, respectively.
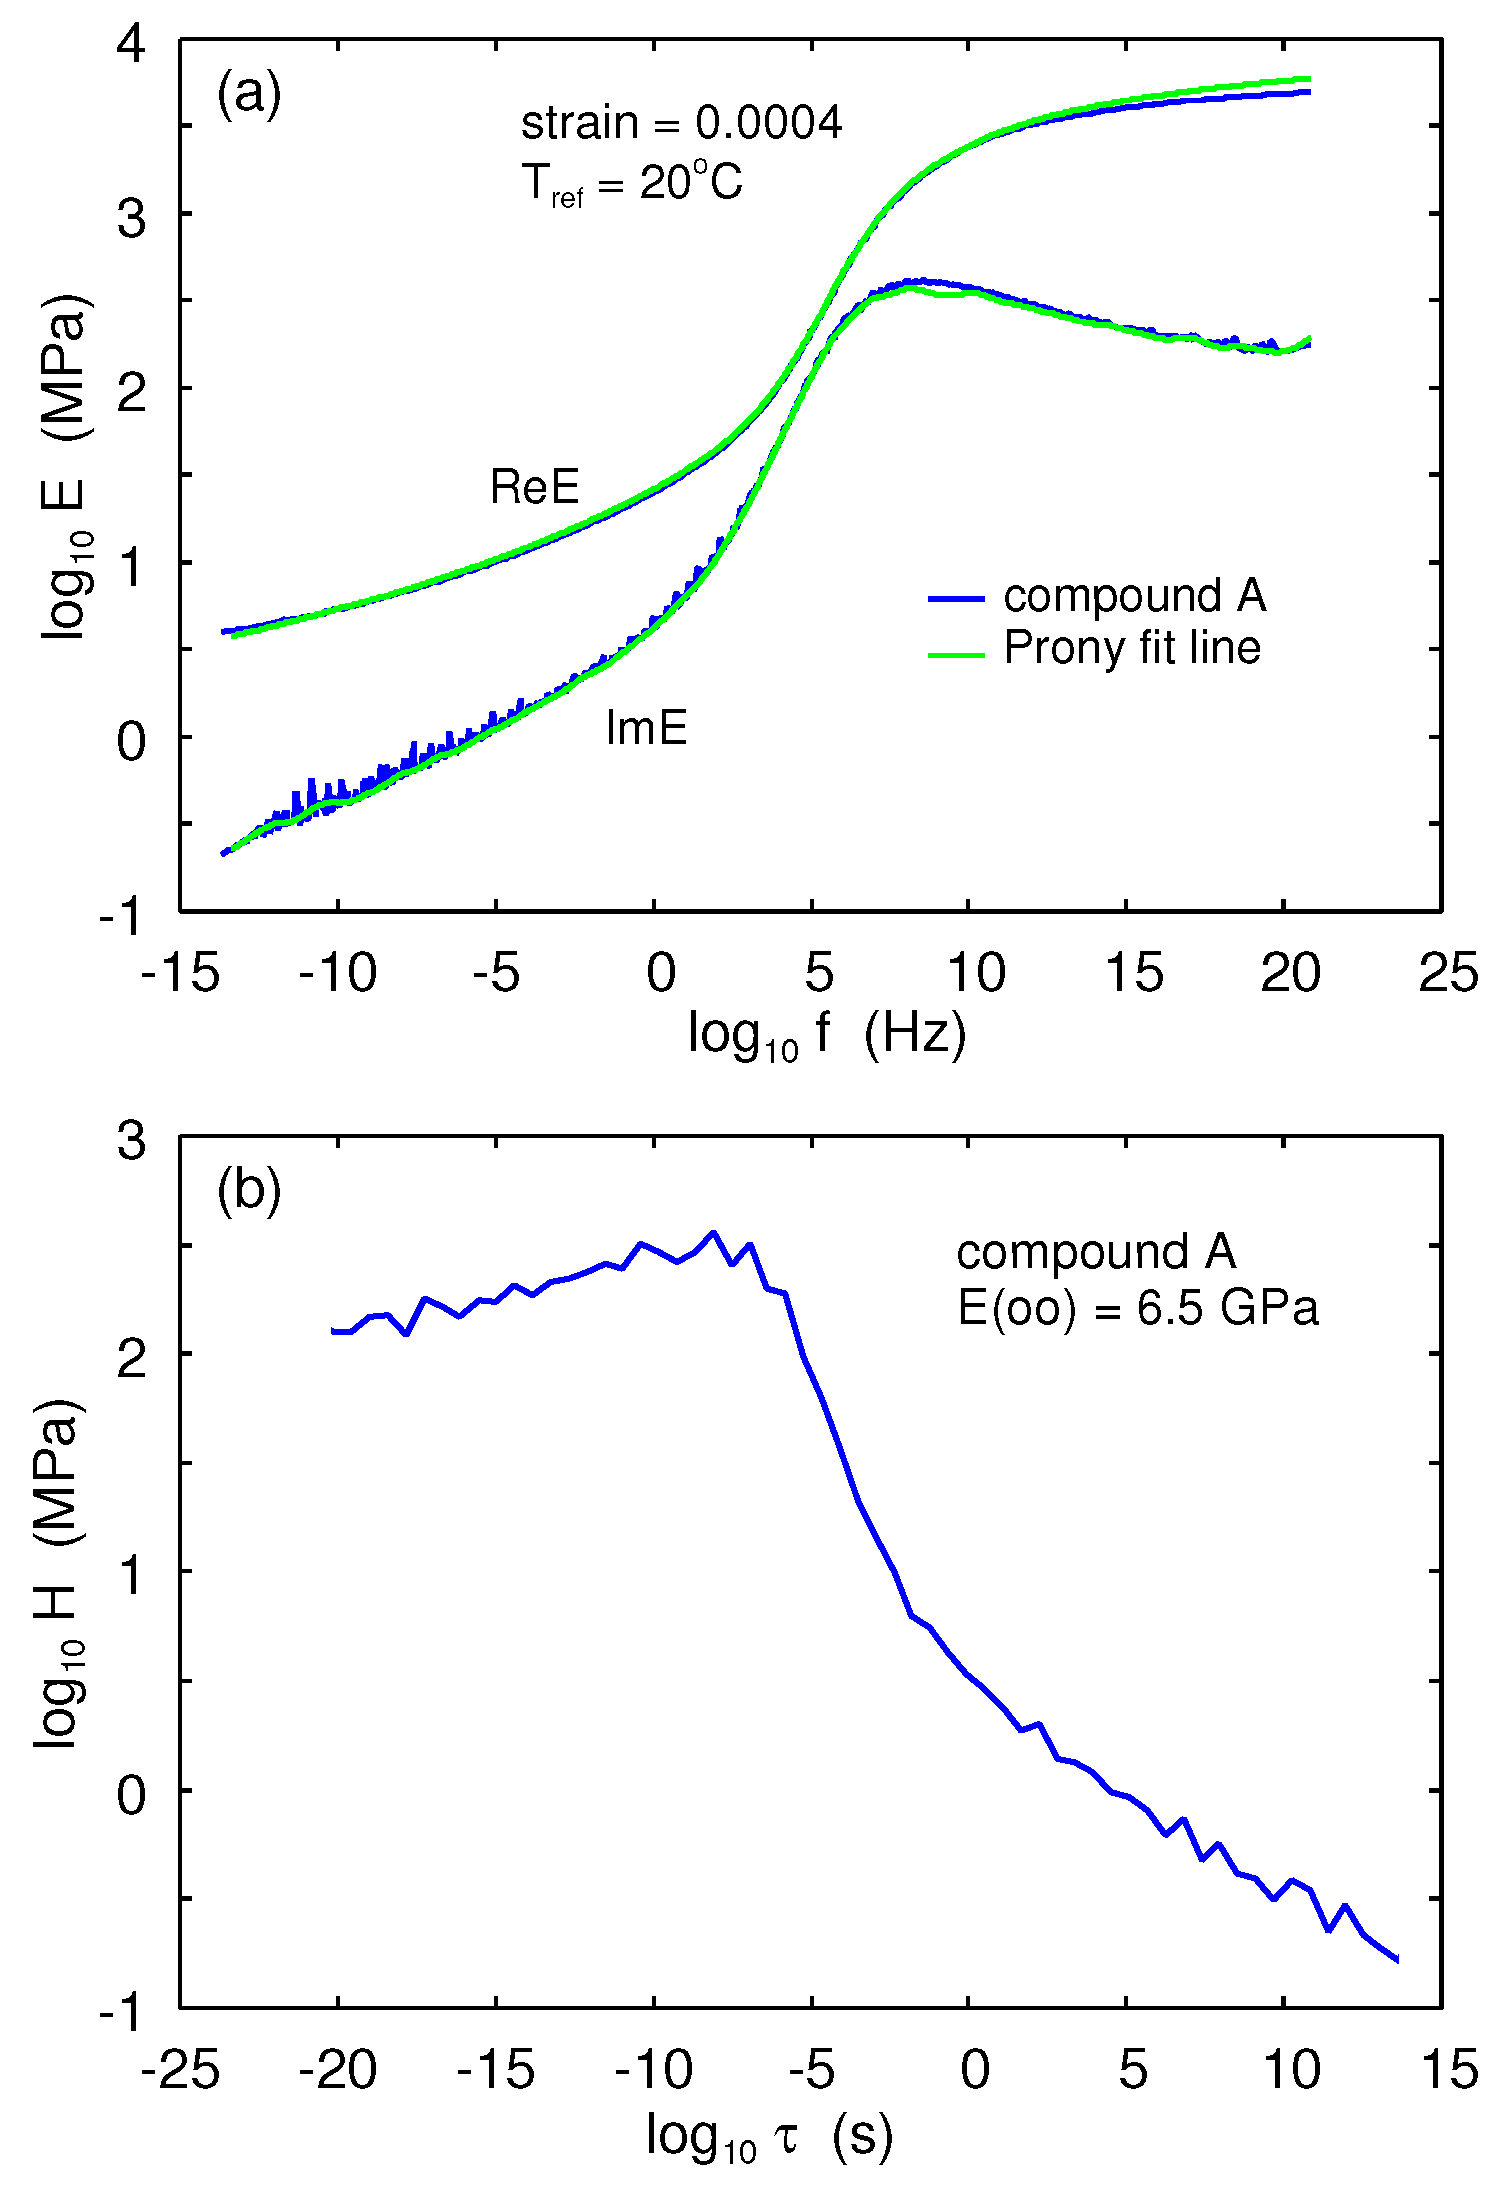
We measured the linear response of viscoelastic modulus in oscillatory strain (see
Figure 2a) with a very small strain amplitude,
and a pre-strain
. The measurements was done at several frequencies between
and
, and for many temperatures. The measured frequency segments were shifted to obtain a smooth master curve (see Ref. [
16] for more details). In
Figure 2a the blue line is the master curve for compound A. The results of fitting the Prony series (Equation (
6)) are also shown, where the spectral weight
is shown in
Figure 2b. Clearly, both the real and imaginary part of the viscoelastic modulus can be fitted very well with the Prony series. This shows that the real and imaginary parts of the viscoelastic modulus obey the Kramers Kronig relation, as indeed expected, because of the small strain used in the measurements of viscoelastic modulus (linear response). However, when the effective modulus is measured at a higher strain the Prony series can no longer fit the measured data (not shown), as already shown in Ref. [
16].
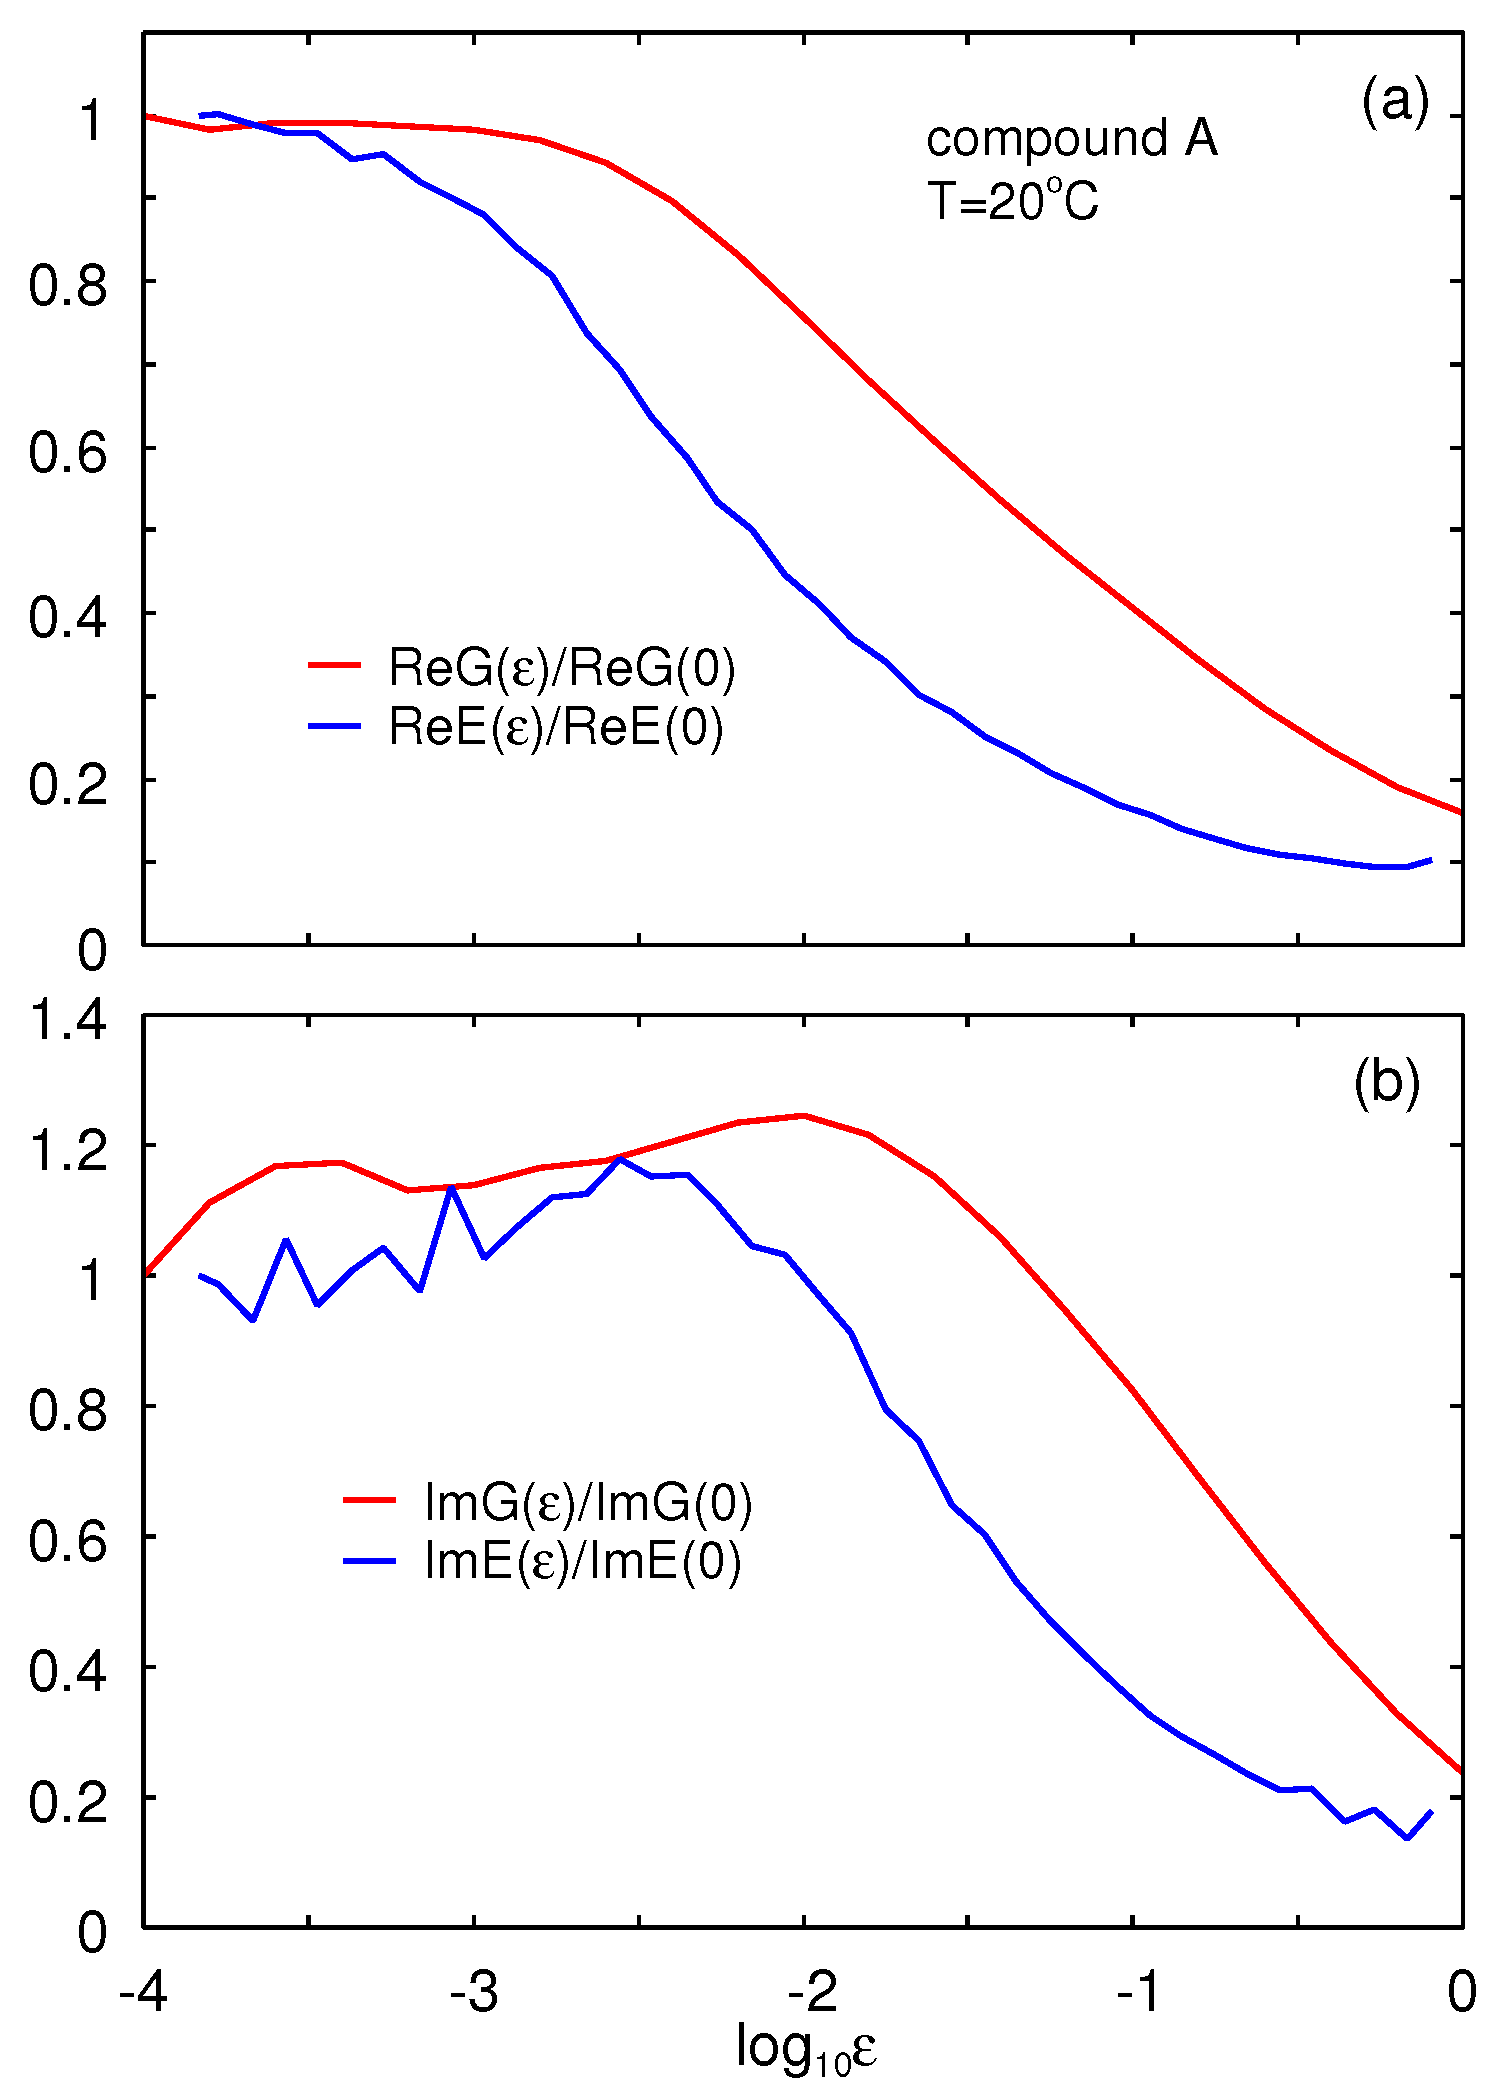
We measured the nonlinear viscoelastic response using strain sweeps in oscillatory tension and shear modes. In
Figure 3 we show (a) the ratio
(red line) and
(blue line) as a function of the logarithm of the strain, and in (b) the same for the imaginary part of
G and
E. To measure the effective Young’s modulus
E the rubber strip is pre-strained with an amplitude which is
larger than the dynamical strain amplitude, i.e., pre-strain
if the dynamical strain is
. This pre-strain increases with increasing amplitude of dynamical strain and may be the main reason why the strain softening occurs at smaller strain for the effective
E-modulus than for the
G-modulus. Note also that the strain in shear mode is defined differently than in tension.
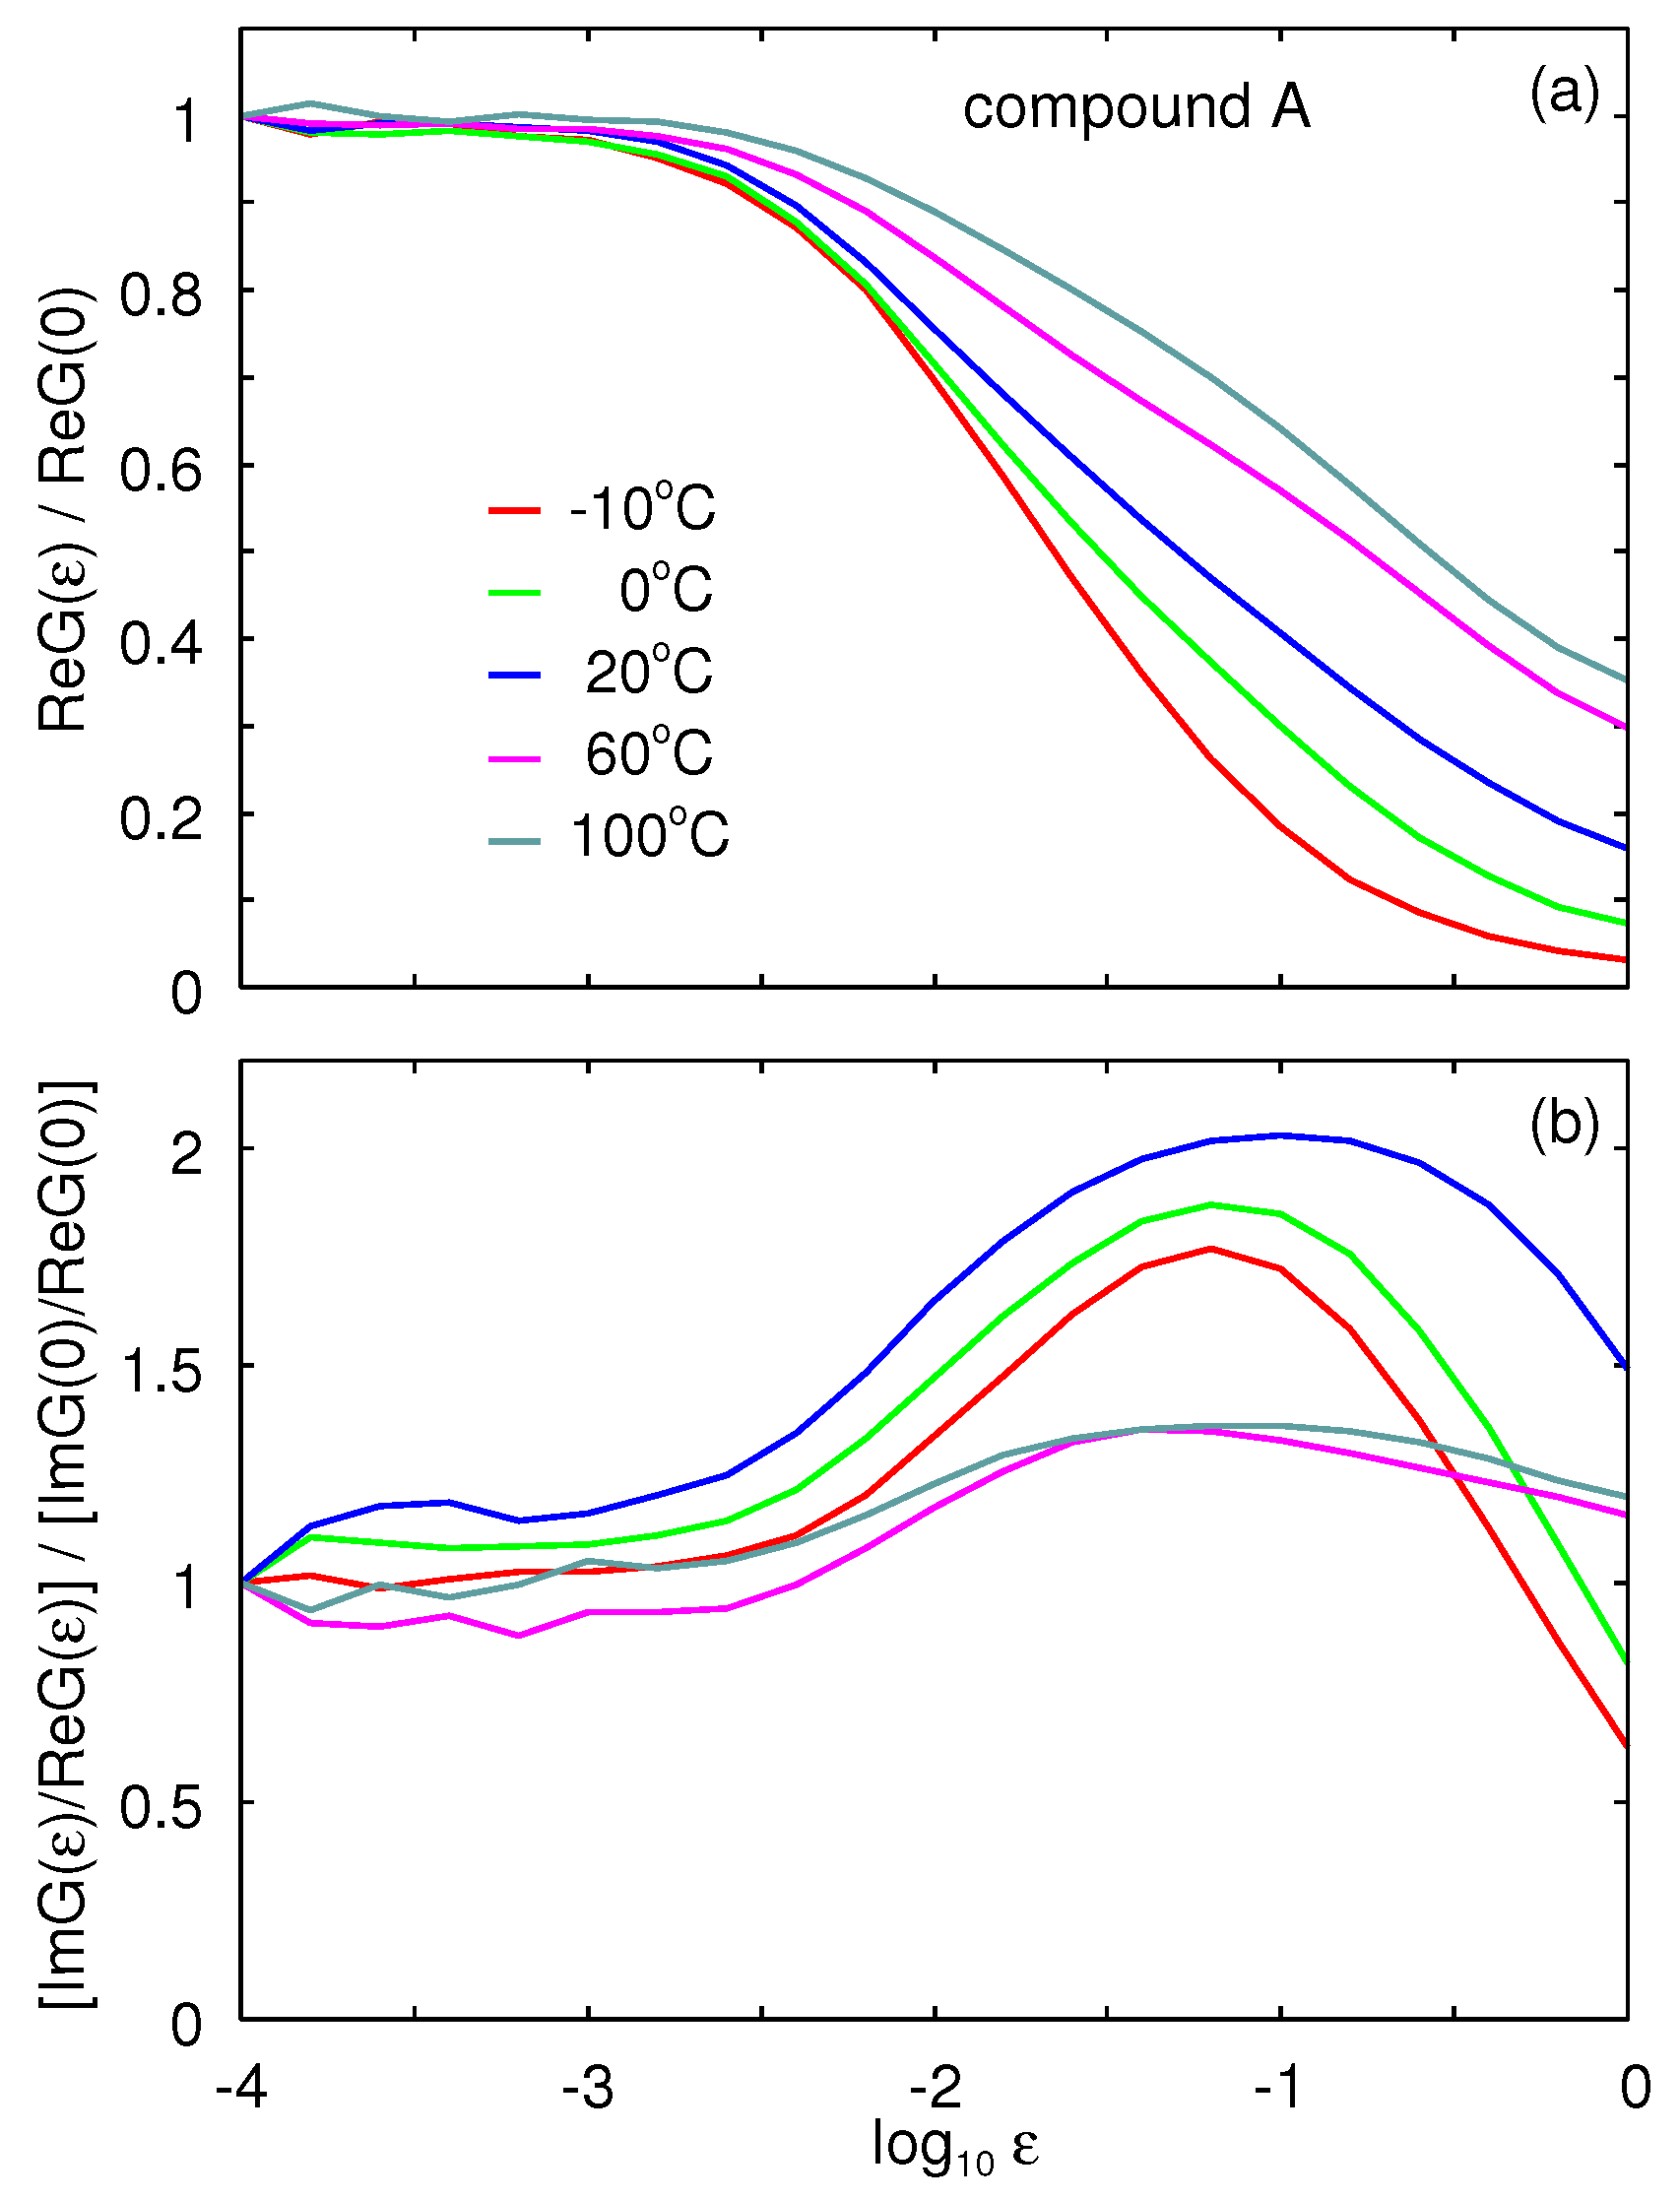
In
Figure 4 we show the results obtained in shear for the ratio (a)
and (b)
for the compound A. Note in (a) the strain softening which is strongest at the lowest temperature.
Figure 4b shows that the energy dissipation is enhanced when the filler network is broken. Note also that the peak in
is the highest for
.
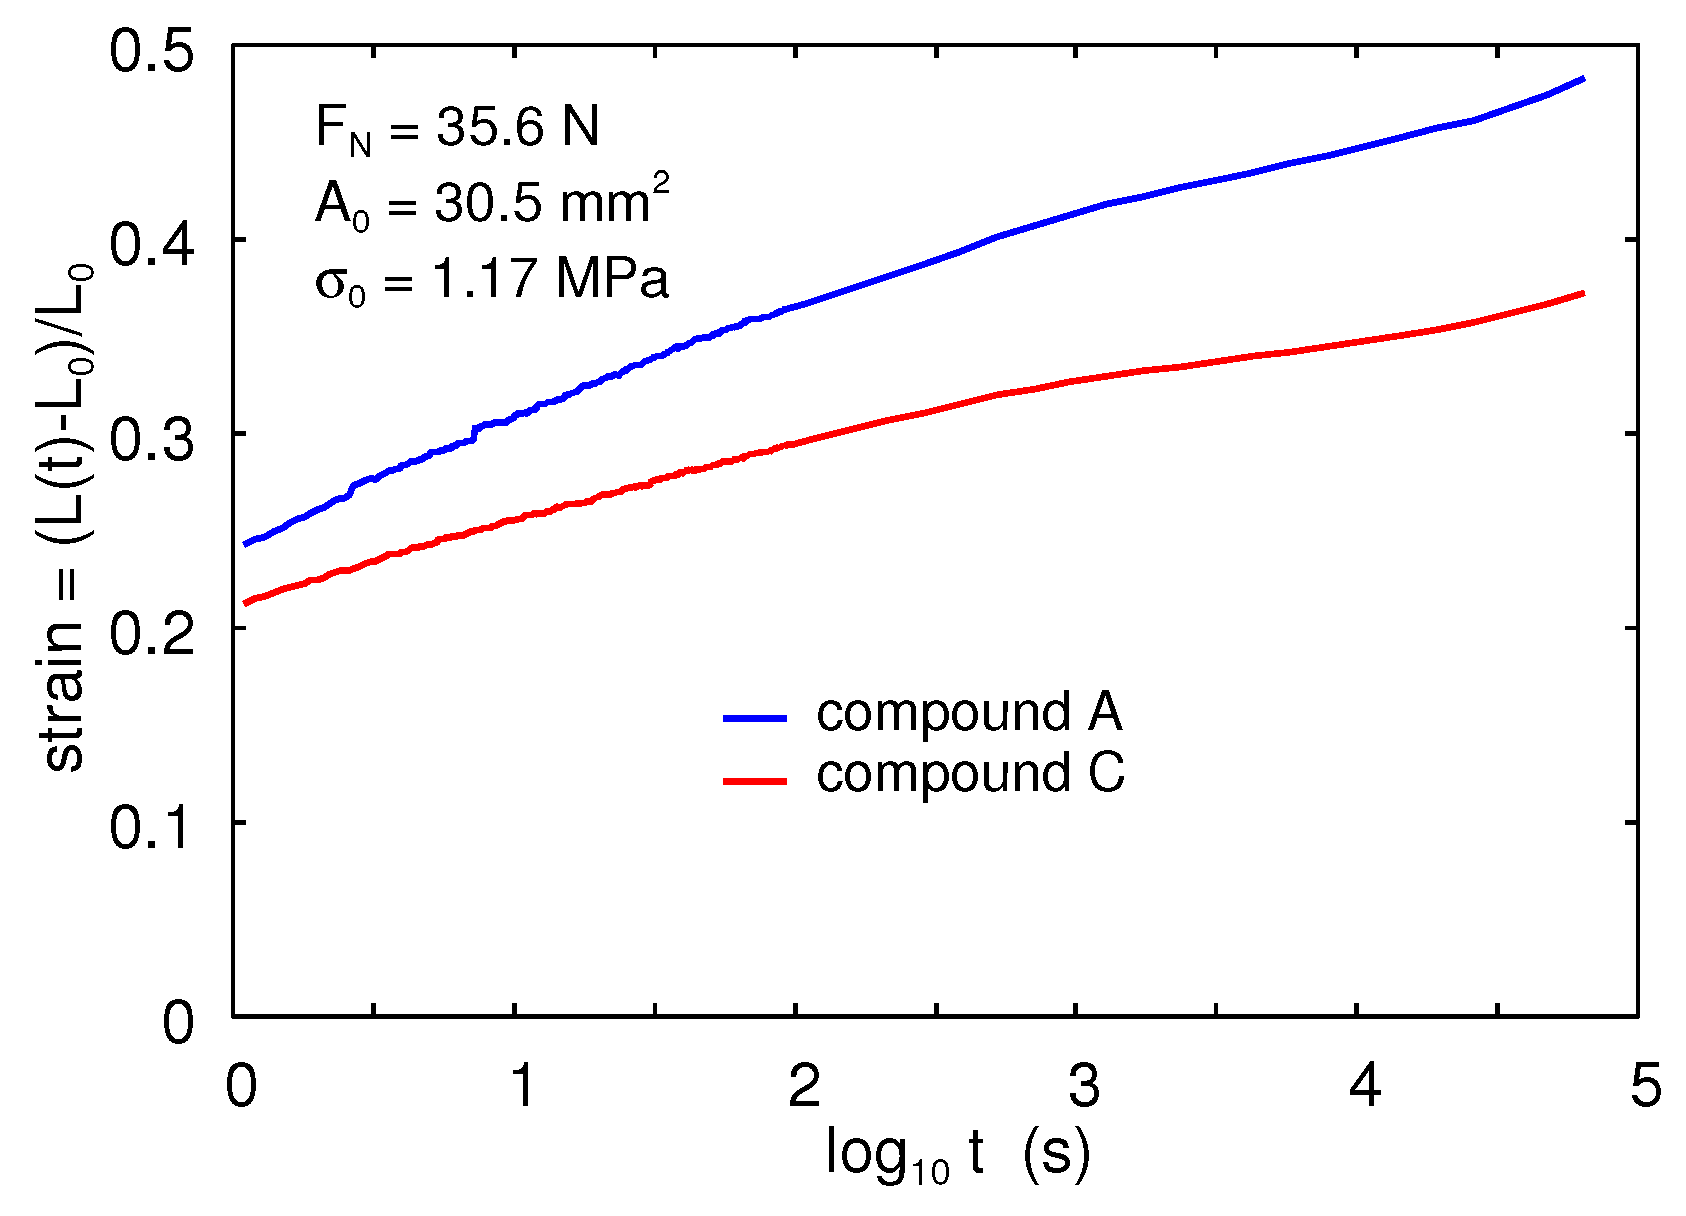
We also performed strain relaxation (creep) experiments. The red and blue lines in
Figure 5 show the measured results for compounds C and A, respectively. Note that for short times, the strain is
for compound A and
for compound C.
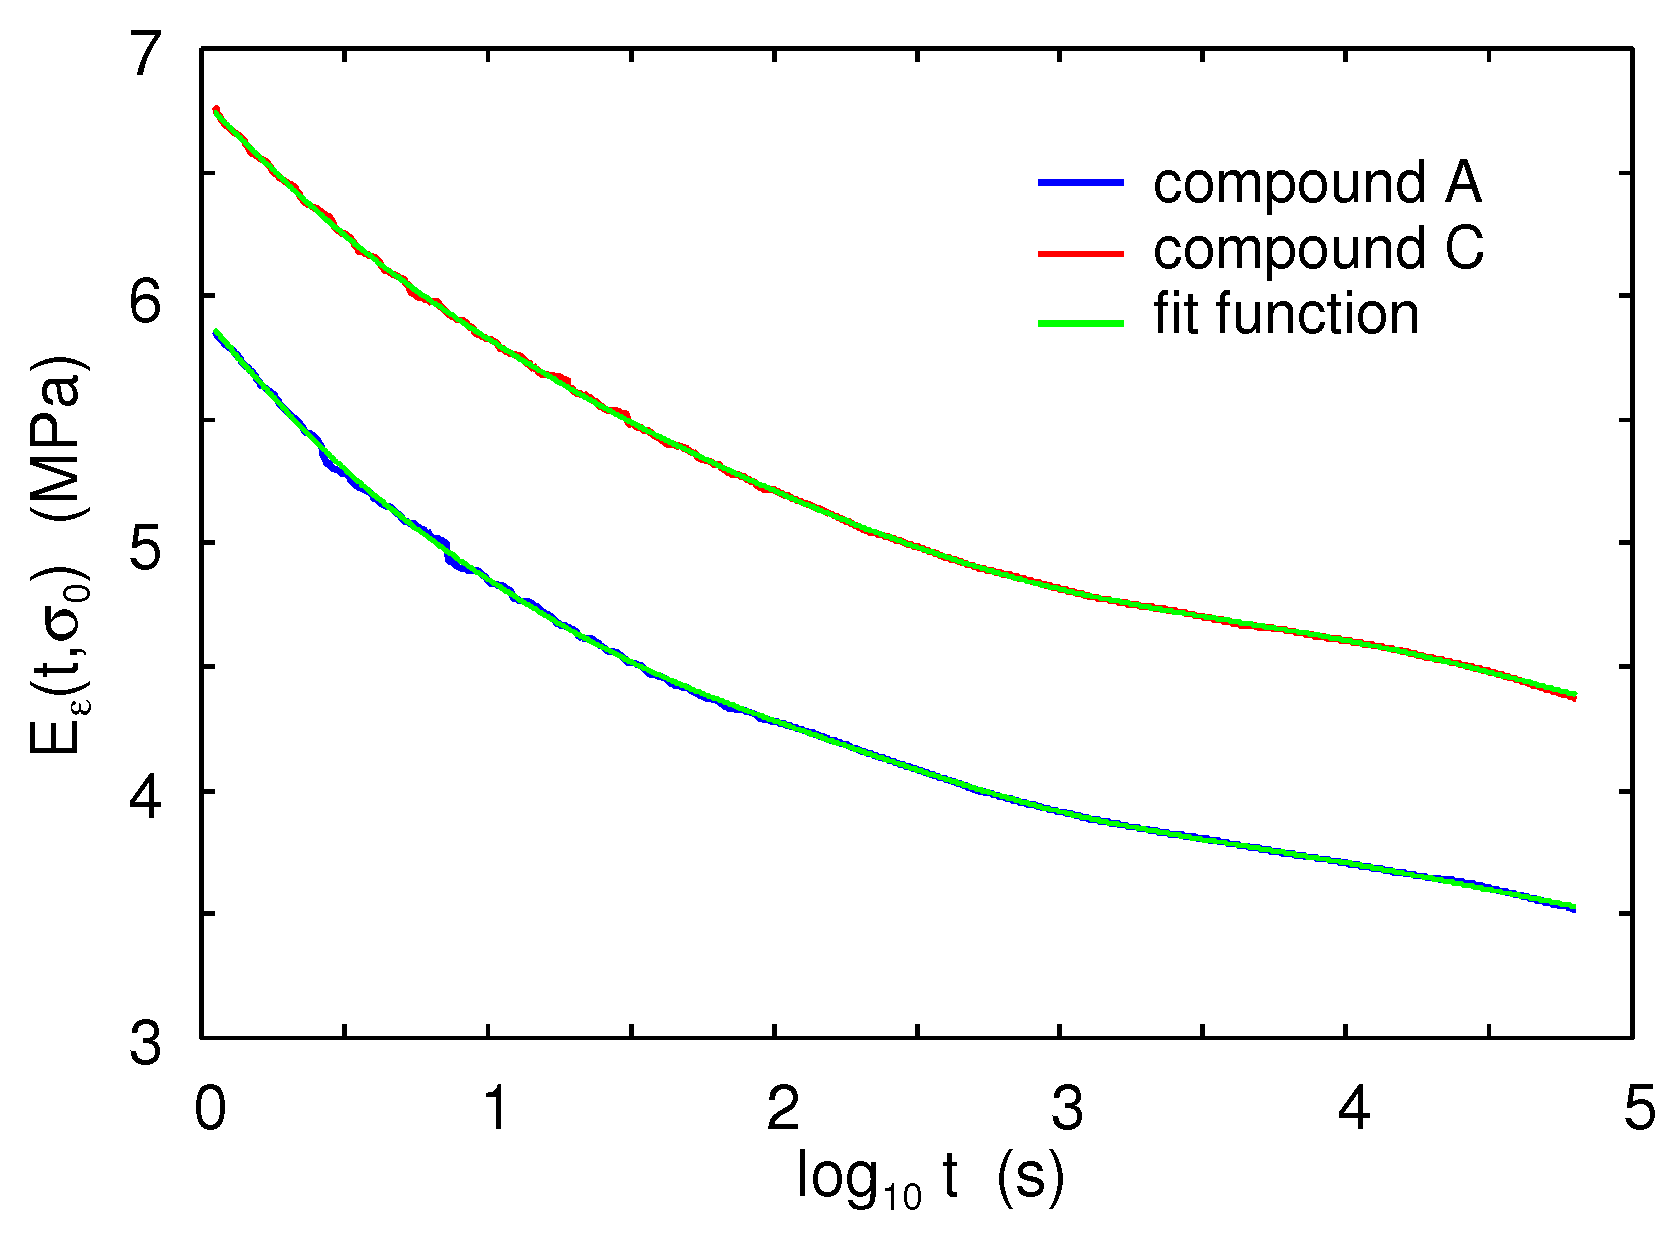
Figure 6 shows the time-dependence of the (nonlinear) strain relaxation modulus
, as obtained from the experimental data in
Figure 5 using
(or rather
where
is the physical stress). The green lines are the fitted curves using the fit function in the form (10).
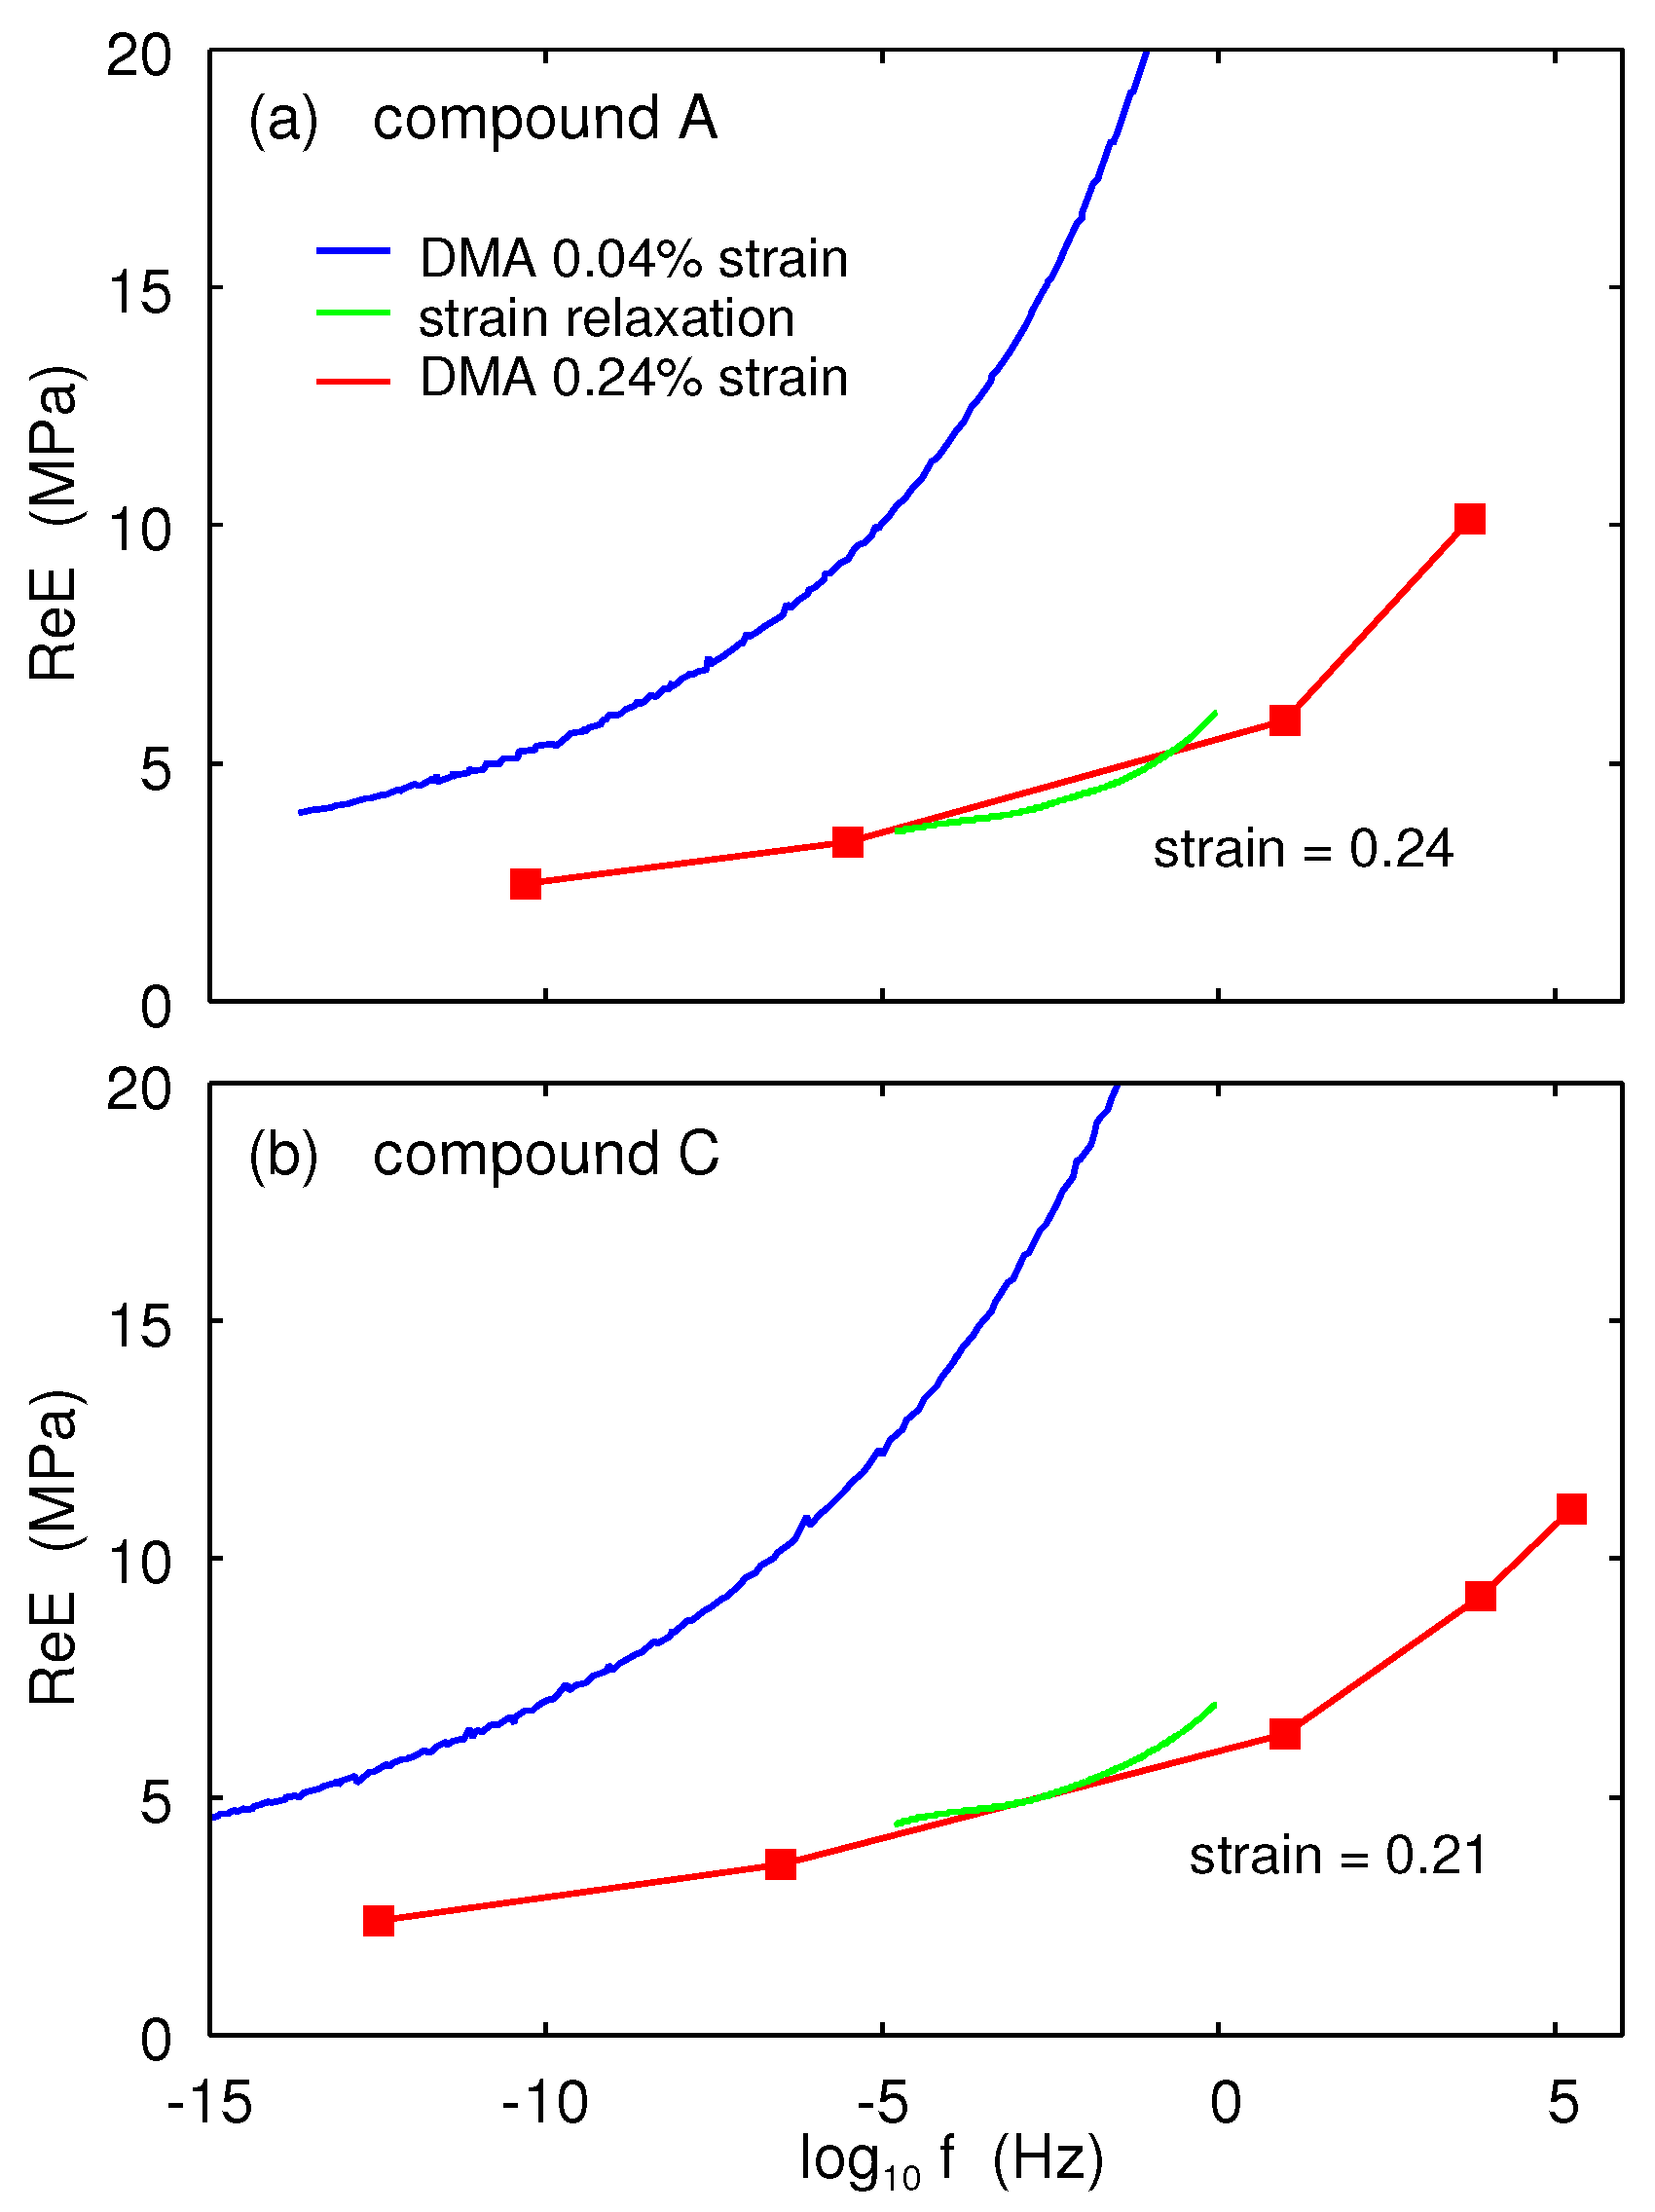
Now we will show that if we calculate the complex frequency-dependent modulus
from (9) using the
, obtained by fitting
to the form (10) (green lines in
Figure 6), then this does not agree with the result
, obtained from the direct DMA measurement using oscillatory shear strain.
The blue lines in
Figure 7 show the real part of the small-strain (0.0004) viscoelastic modulus
as a function of frequency for compound A (a) and C (b). The red lines were obtained from the measured (non-linear) shear modulus assuming
and the strain amplitude
in (a) and
in (b). (Note: we preferred to use the effective modulus obtained using
rather than the one measured directly in the oscillatory tension mode, since strain relaxation (creep) does not have a pre-strain so it is best to compare it with the effective modulus obtained from the shear modulus.) Also shown (green lines) are the real parts of the modulus for compounds A and C as obtained from the strain relaxation measurements using (9) with
, obtained as described above, from fitting the strain relaxation data to the fit function in the form (10). In this case, the agreement between the two different procedures for obtaining the nonlinear function
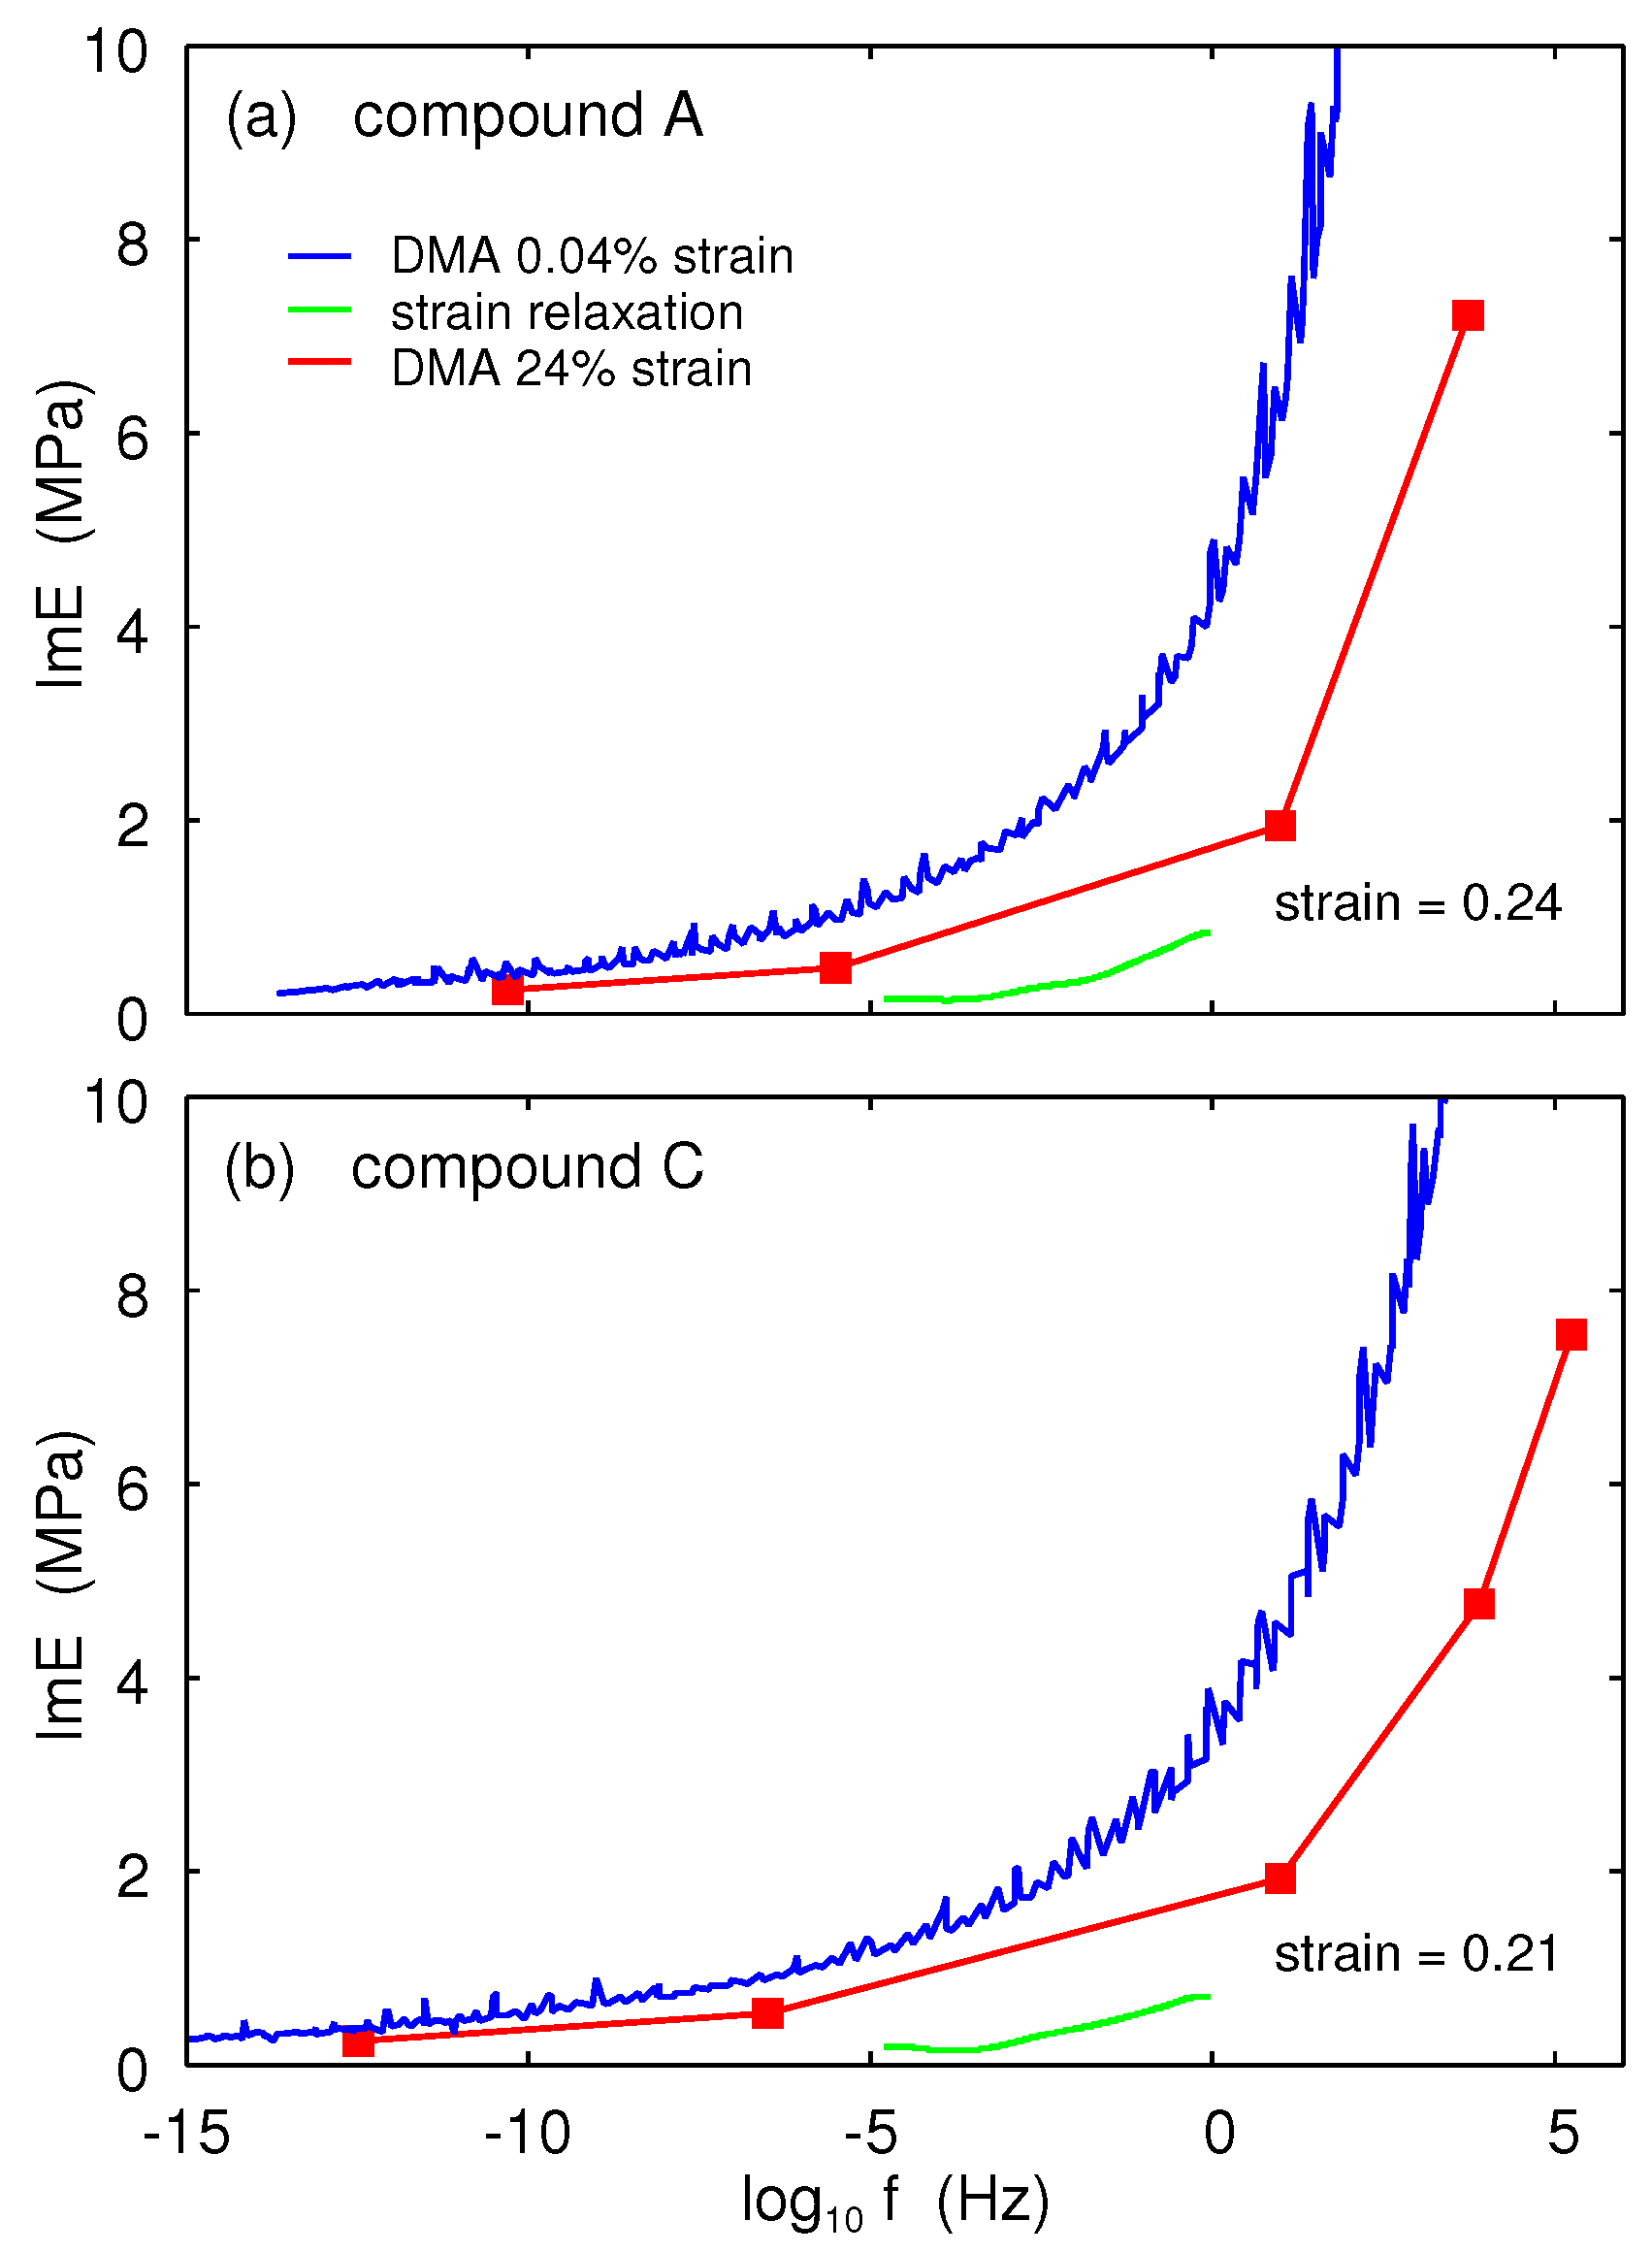
is quite good. However, for the imaginary part
, the two procedures give very different results. This is shown in
Figure 8. Clearly, the direct measurement of
using oscillatory strain gives much higher energy dissipation than that obtained from the strain relaxation data. Note that for small strains, in the linear response region, both procedures give the same result for
and
. This difference between the linear and non-linear case is due to the fact that in the non-linear region the Kramers–Kronig relation is not valid, and the non-linear
E-modulus, as defined above, cannot be represented in the form of Equations (6) or (9).
5. Discussion
For rubber friction studies, where the viscoelastic properties of the rubber enter as an important input, the strain can be very large and it is important to include non-linearity in the viscoelastic response. However, in the analytical treatment of sliding friction, it is nearly impossible to include non-linearity in a completely rigorous way. One approach is to assume a linear relation between stress and strain in the theoretical derivations, but instead of using the small strain modulus , use an effective modulus for a typical strain involved in the problem of interest. For sliding friction on the road surfaces , therefore, the information is needed on the non-linear response for very large strains.
Now, which is the best experimental way to obtain the large strain modulus? It depends on the application. In the linear response regime, all methods give the same result, so it does not matter whether the modulus is measured in shear (gives and ) or tension (gives ) mode or during strain or stress relaxation (gives or , of which can be obtained using Equations (6) + (7) or Equations (9) + (10)). However, as shown above for large strain, all these methods give different results.
For rubber friction on road surfaces, it is clear that a direct measurement of the viscoelastic modulus in response to oscillating applied strain is the best approach since the pulsating deformations acting on the rubber surface during sliding on the hard rough substrate surface (e.g., a road surface) are similar to the oscillatory deformations in the DMA experiment. In addition, in this case, the dissipated energy in response to strain oscillation is correctly described [see Equation (
2)]. However, tensile measurements require pre-strain which breaks-up the filler network, which will affect the effective modulus. In rubber friction experiments, road asperities slide along the rubber surface and there is only very little pre-strain. This suggests that the shear modulus (obtained without pre-strain) is probably better than the modulus obtained in tension with pre-strain. An even better method was proposed in Ref. [
17] (see Appendix B in Ref. [
17]). It involves rolling friction experiments (see
Figure 9), where the associated deformations are very similar to when the asperities slide over the rubber surface.
In some other applications the non-linear
E-modulus, measured during strain (or stress) relaxation, could be more suitable, e.g., to study the increase in contact area with time when a rubber block is loaded against a rough surface at time
with a constant external load force (strain relaxation) or constant applied compression (stress relaxation) [
18,
19].
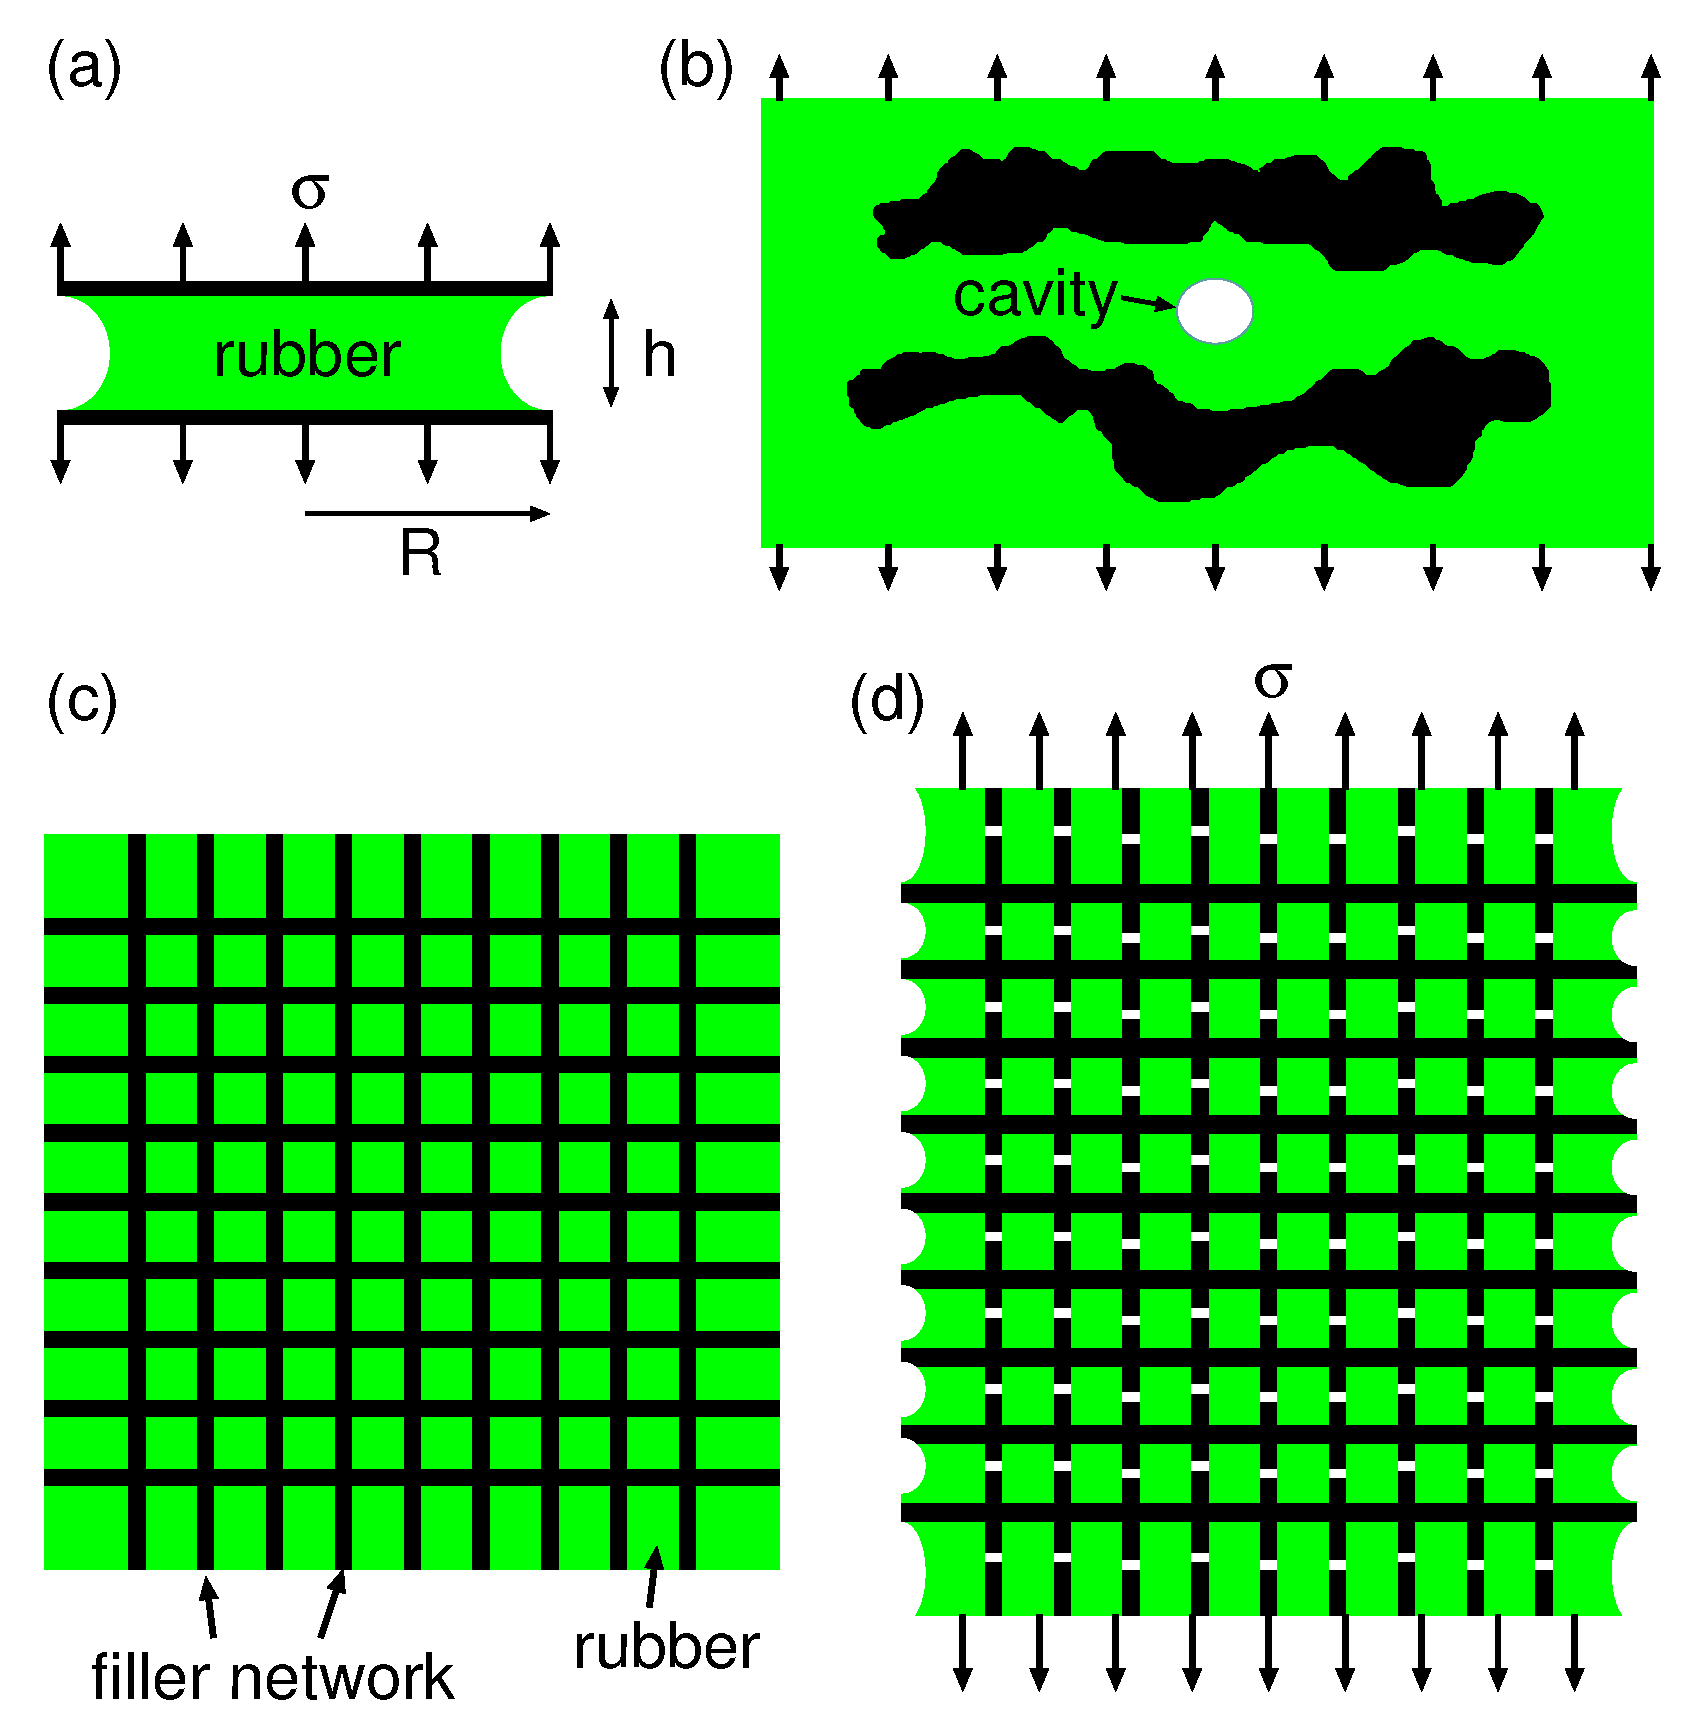
Many ideas have been presented for the increase in the low-strain rubber modulus when filler particles are added to rubber. Here we suggest that it may be due to a confinement effect as illustrated in
Figure 10. It is well known that if a rubber sheet is confined between two rigid surfaces, the effective Young’s modulus increases due to the confinement. Thus, if the rubber sheet has the thickness
h and is confined between circular rigid surfaces with radius
R, then the effective Young’s modulus (Gent–Lindley equation) [
20]
where
.
The confinement of rubber between filler cluster regions in rubber may have a similar effect on the low-strain modulus as the rigid sheets in
Figure 10a. This is illustrated with an extreme case in
Figure 10c,d where rigid sheets are embedded in the rubber matrix. We note that the sheets are under compression in the transverse direction while they are under tension in the direction of the applied stress. A filler particle cluster may be more stable under compression than under tension. Thus, as long as the applied stress is not too large the filler network may be stable in the transverse direction, giving a strong increase in the effective Young’s modulus due to the Gent–Lindley confinement effect. This picture of the enhancement in the low-strain modulus is similar to the suppression-in-the-composite-Poisson-ratio model proposed by Smith et al. [
12].
The origin of the the enhancement in the low-strain modulus presented above is supported by recent experimental results for the formation of cavities in filled rubbers when a rubber slab is exposed to elongation. In this case it is observed [
21,
22] that cavitation start in regions between filler clusters (see
Figure 10b), as expected because of the Gent-Lindley confinement effect since the negative pressure is highest in the central region between the cluster surfaces.
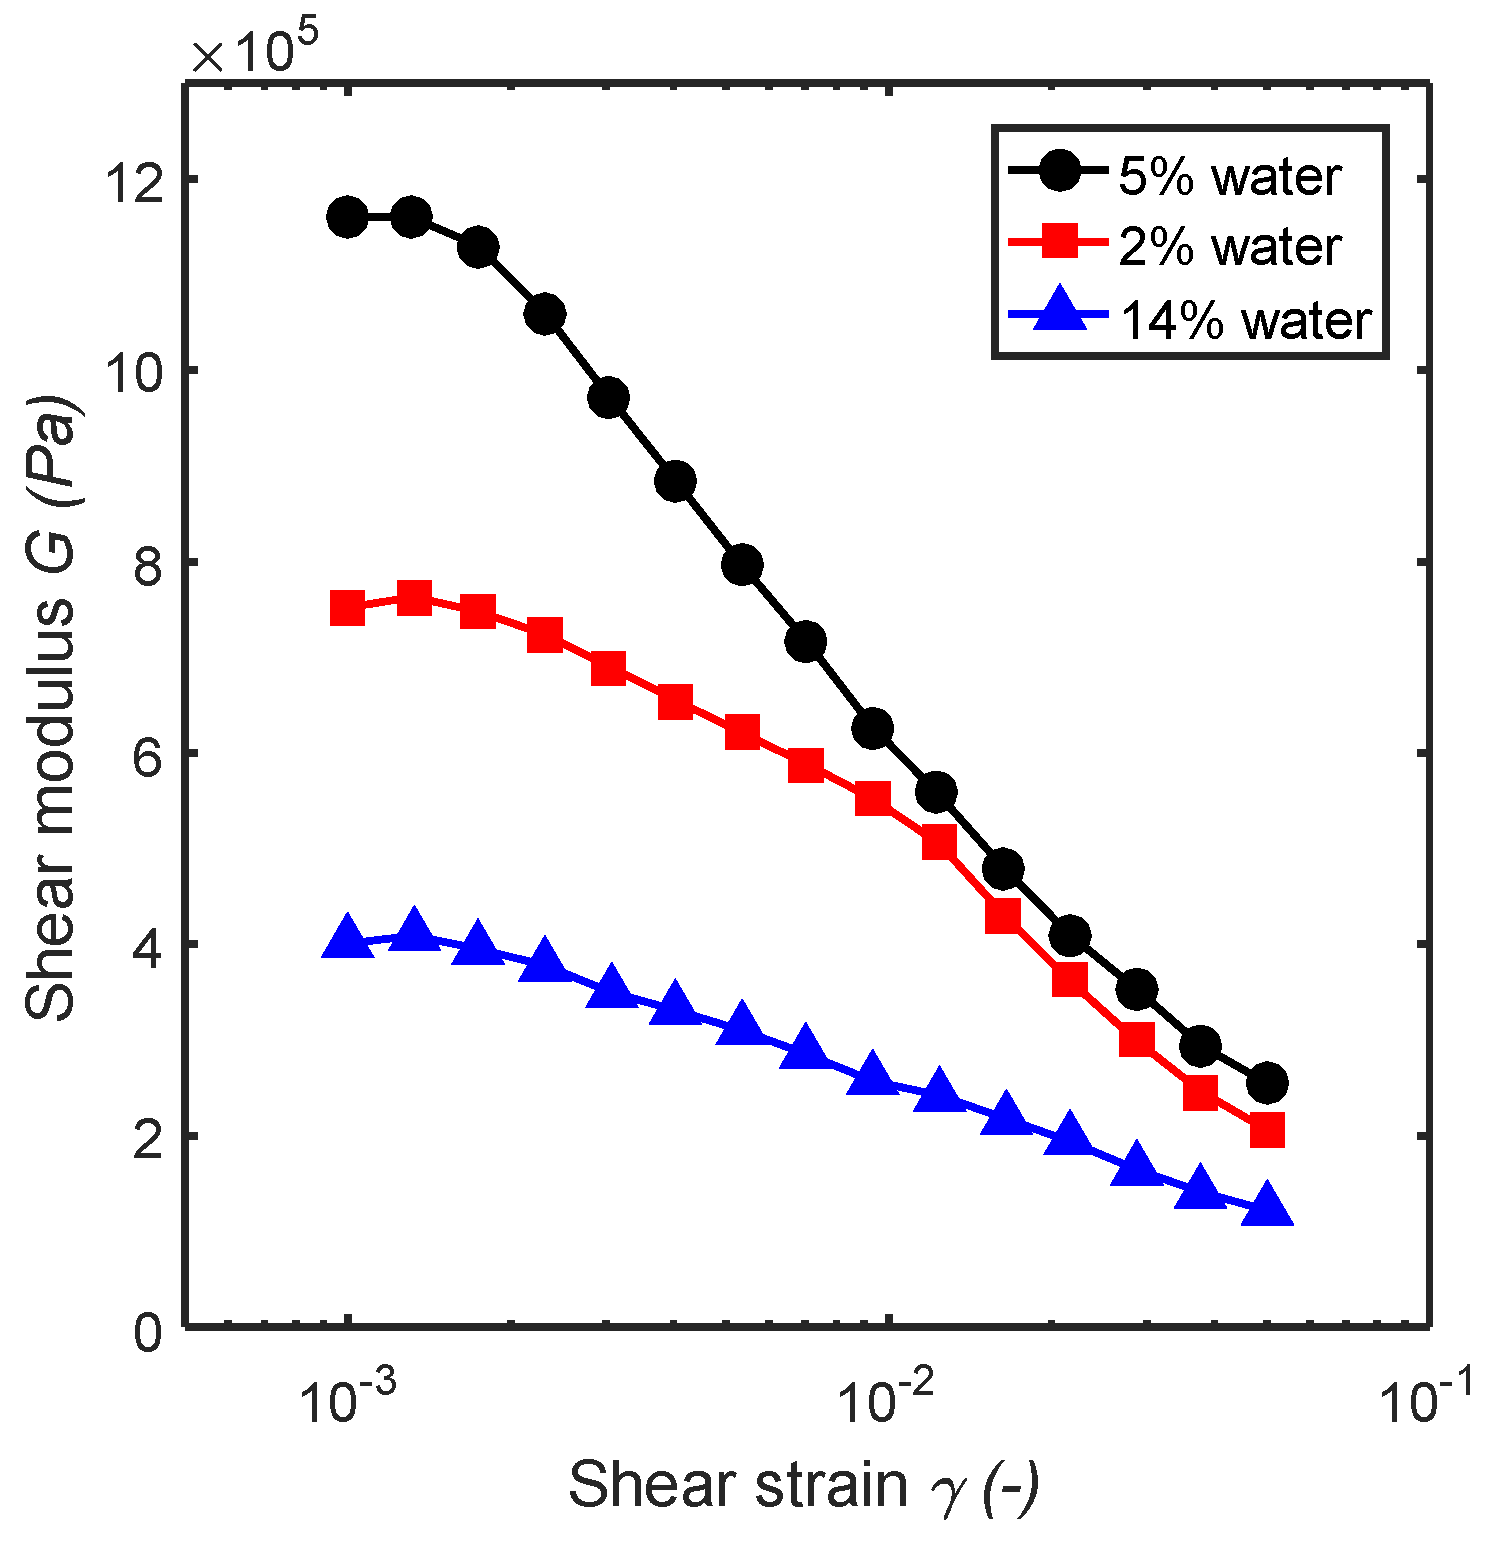
The strong drop in the effective modulus with increasing strain amplitude of filled rubber compounds is also observed for other particle systems. Thus, the effective shear modulus of (slightly) wet sand as a function of the strain amplitude is very similar to that of the filled rubber compounds [
23,
24]; see
Figure 11. For slightly wet sand, water capillary bridges bind the sand grains together. Similarly, the filler particles in rubber interact with a weak attraction, of different physical origin than for sand. Note that the drop in shear modulus for sand occurs over a similar range of strain as for filled rubber compounds, and that the magnitude of the drop is similar. This strongly indicates the same physical origin of both phenomena. Here we note that the formal theory has been developed for granular materials which may also have implications for filled rubber compounds. This theory is based on Edwards statistical mechanics for jammed granular matter, see Refs. [
25,
26]. One difference is that for a granular material, such as sand, the thermal motion of the particles can be neglected, while the filler particles in rubber can be very small (of nanometer size) and in this case thermal motion cannot be neglected. The exact theory of the viscoelastic properties of filled rubber compounds still does not exist.
