Article

Synthesis and Characterization of Novel Ti3SiC2 Reinforced Ni-Matrix Multilayered Composite-Based Solid Lubricants

Department of Mechanical Engineering, University of North Dakota, Grand Forks, ND 58201, USA
*
Author to whom correspondence should be addressed.
Lubricants 2019, 7(12), 110; https://doi.org/10.3390/lubricants7120110
Submission received: 13 August 2019 / Revised: 3 December 2019 / Accepted: 4 December 2019 / Published: 9 December 2019
(This article belongs to the Special Issue Wear and Corrosion Resistant Coatings)

Abstract

:
We report the synthesis and characterization of two different types of Ni-based laminated composites (Types I and II). In Type-I composites, layers of Ni and Ti3SiC2 (Ni–Ti3SiC2) were interleaved with Ni, whereas in Type-II composites, Ni–Ti3SiC2 layers were interleaved with Al and Ni. The laminate thickness and Ti3SiC2 content in the individual Ni–Ti3SiC2 layers were systematically varied in both the composites. Detailed SEM studies showed that Ti3SiC2 particulates are well distributed in the Ni-matrix with little or no interfacial reactions with interparticle porosity. However, there were interfacial reactions between Ni and Al in Type II composites. In general, Type I multilayered composites had higher ultimate compressive strength (UCS) in parallel orientation as compared to perpendicular orientation (layers are aligned parallel or perpendicular to the wear surface then it will be referred to as parallel or perpendicular orientation). Comparatively, in Type II composites, the UCS was greater in perpendicular orientation as compared to parallel due to the presence of Al layers as bonding layers. Both the composite designs showed triboactive behavior against alumina disks and sensitivity to laminate thickness and orientation. In Type-I composites, the decrease in µ and wear rate (WR) with laminate thickness was more pronounced in the perpendicular orientation as compared to the parallel orientation. Comparatively, Ni–Ti3SiC2/Al/Ni composites showed that the parallel orientation was more effective in enhancing the triboactive performance. SEM analysis of tribosurfaces showed signs of triboxidation and abrasion, which led to the formation of O-rich tribofilms.

1. Introduction

There is a critical need for designing lightweight, high-performance materials with high strength and toughness for automotive, aerospace, bioengineering, and construction applications. In general, it is often complicated to design microstructures with the required strength and toughness simultaneously. Nature, however, has long developed the ability to combine brittle minerals and organic molecules into hybrid composites with exceptional fracture resistance and structural capabilities by forming multilayered structures [1]. For example, nacre, bamboo, bone, mantis shrimp club, and elk antler possess exceptional mechanical properties [2]. Fundamental research on layered materials like metal and/or ceramic multilayers has shown great promise due to their unique mechanical, physical, and chemical properties [3,4]. Recently, naturally nanolaminate ceramics like MAX phases have shown promise for designing intricate workpieces subjected to adverse thermal, chemical, and mechanical conditions [5,6,7,8,9,10,11,12].
Thermodynamically stable Mn+1AXn (MAX) phases possess a Mn+1AXn chemistry, where n = 1, 2, or 3; M is an early transition metal element; A is an A-group element (mostly IIIA and IVA); and X is C and/or N. MAX phases are novel ternary carbides and nitrides that are bestowed with excellent properties like damage tolerance, thermal shock resistance, and machinability [6,7,8,9,10,11,12]. Further studies of composites of MAX phases with metals have shown many promising properties [10,11,12,13,14,15,16,17,18,19,20,21,22]. For example, Zhang et al. [10] showed that Cu/Ti3SiC2 is self-lubricating and can be a potential electro–friction material [10]. Anasori et al. [11] fabricated Ti2AlC–Mg composites by using a melt infiltration method. These composites were easy to process and were lighter than the comparable TiC based composites. Composites of MAX phases with Ag have shown excellent solid lubrication behavior over a wide range of temperatures [12,13]. Wang et al. [14] showed that composites of pure Al reinforced with 40 vol % Ti3AlC2 had twice yield strength than pure aluminum [14]. This group also proved that Ti3AlC2 particulates can efficiently reinforce the Al-matrix. Hu et al. [15] designed Ti2AlC/Al composites that had 10 times higher yield strength than peak-aged Al alloy at ambient temperature. These composites were also shown to be stable until 400 °C. Kothalkar et al. [16] also showed that it is viable to design NiTi/Ti3SiC2 composites by sintering at 1233 K, 300 MPa, and 8 min by spark plasma sintering (SPS). Agne at al. [17] showed that composites of Al–V2AlC can be synthesized by quenching from 1000 °C. Gupta et al. [18,19] showed that with the addition of Ti3SiC2 particulates in metal matrices, such as Al-, Bi-, and Ag-matrices, the mechanical and tribological of these matrices were improved. These composites were referred to as MAX reinforced metals (MRMs). Fuka et al. [20] and Dey et al. [21] fabricated Ni–MoAlB and Ni–Ti3SiC2 composites, respectively, by hot pressing at 240 MPa at 873 K. These compositions also showed improved tribological behavior. Hu et al. [22] designed TiCx-Ni3(Al,Ti)/Ni alloy composite by reaction between Ti3AlC2 (20 vol % and 40 vol %) and Ni during in-situ hot-pressing route at 1200 °C under 30 MPa. The composites showed higher hardness, toughness, and flexural strength as compared to the Ni-alloy.
Despite intense research and development in metal–MAX composite systems, there has been limited study on the development of multilayered metal–MAX composites, although some progress has been made in textured MAX-phase based multilayers [23,24,25,26]. Murugaiah et al. [23] demonstrated that fine Ti3SiC2 powder can be tape-cast. Hu et al. [24,25] also fabricated textured Nb4AlC3 and Ti3SiC2 by using a 12 T magnetic field during slip casting, followed by cold pressing and spark plasma sintering. Mishra et al. [26] also designed textured Ti3SiC2 by electrophoretic deposition. The objective of this paper is to design and characterize novel multilayered composites by interleaving MAX–Ni composites and Ni by using tape casting.

2. Experimental Details

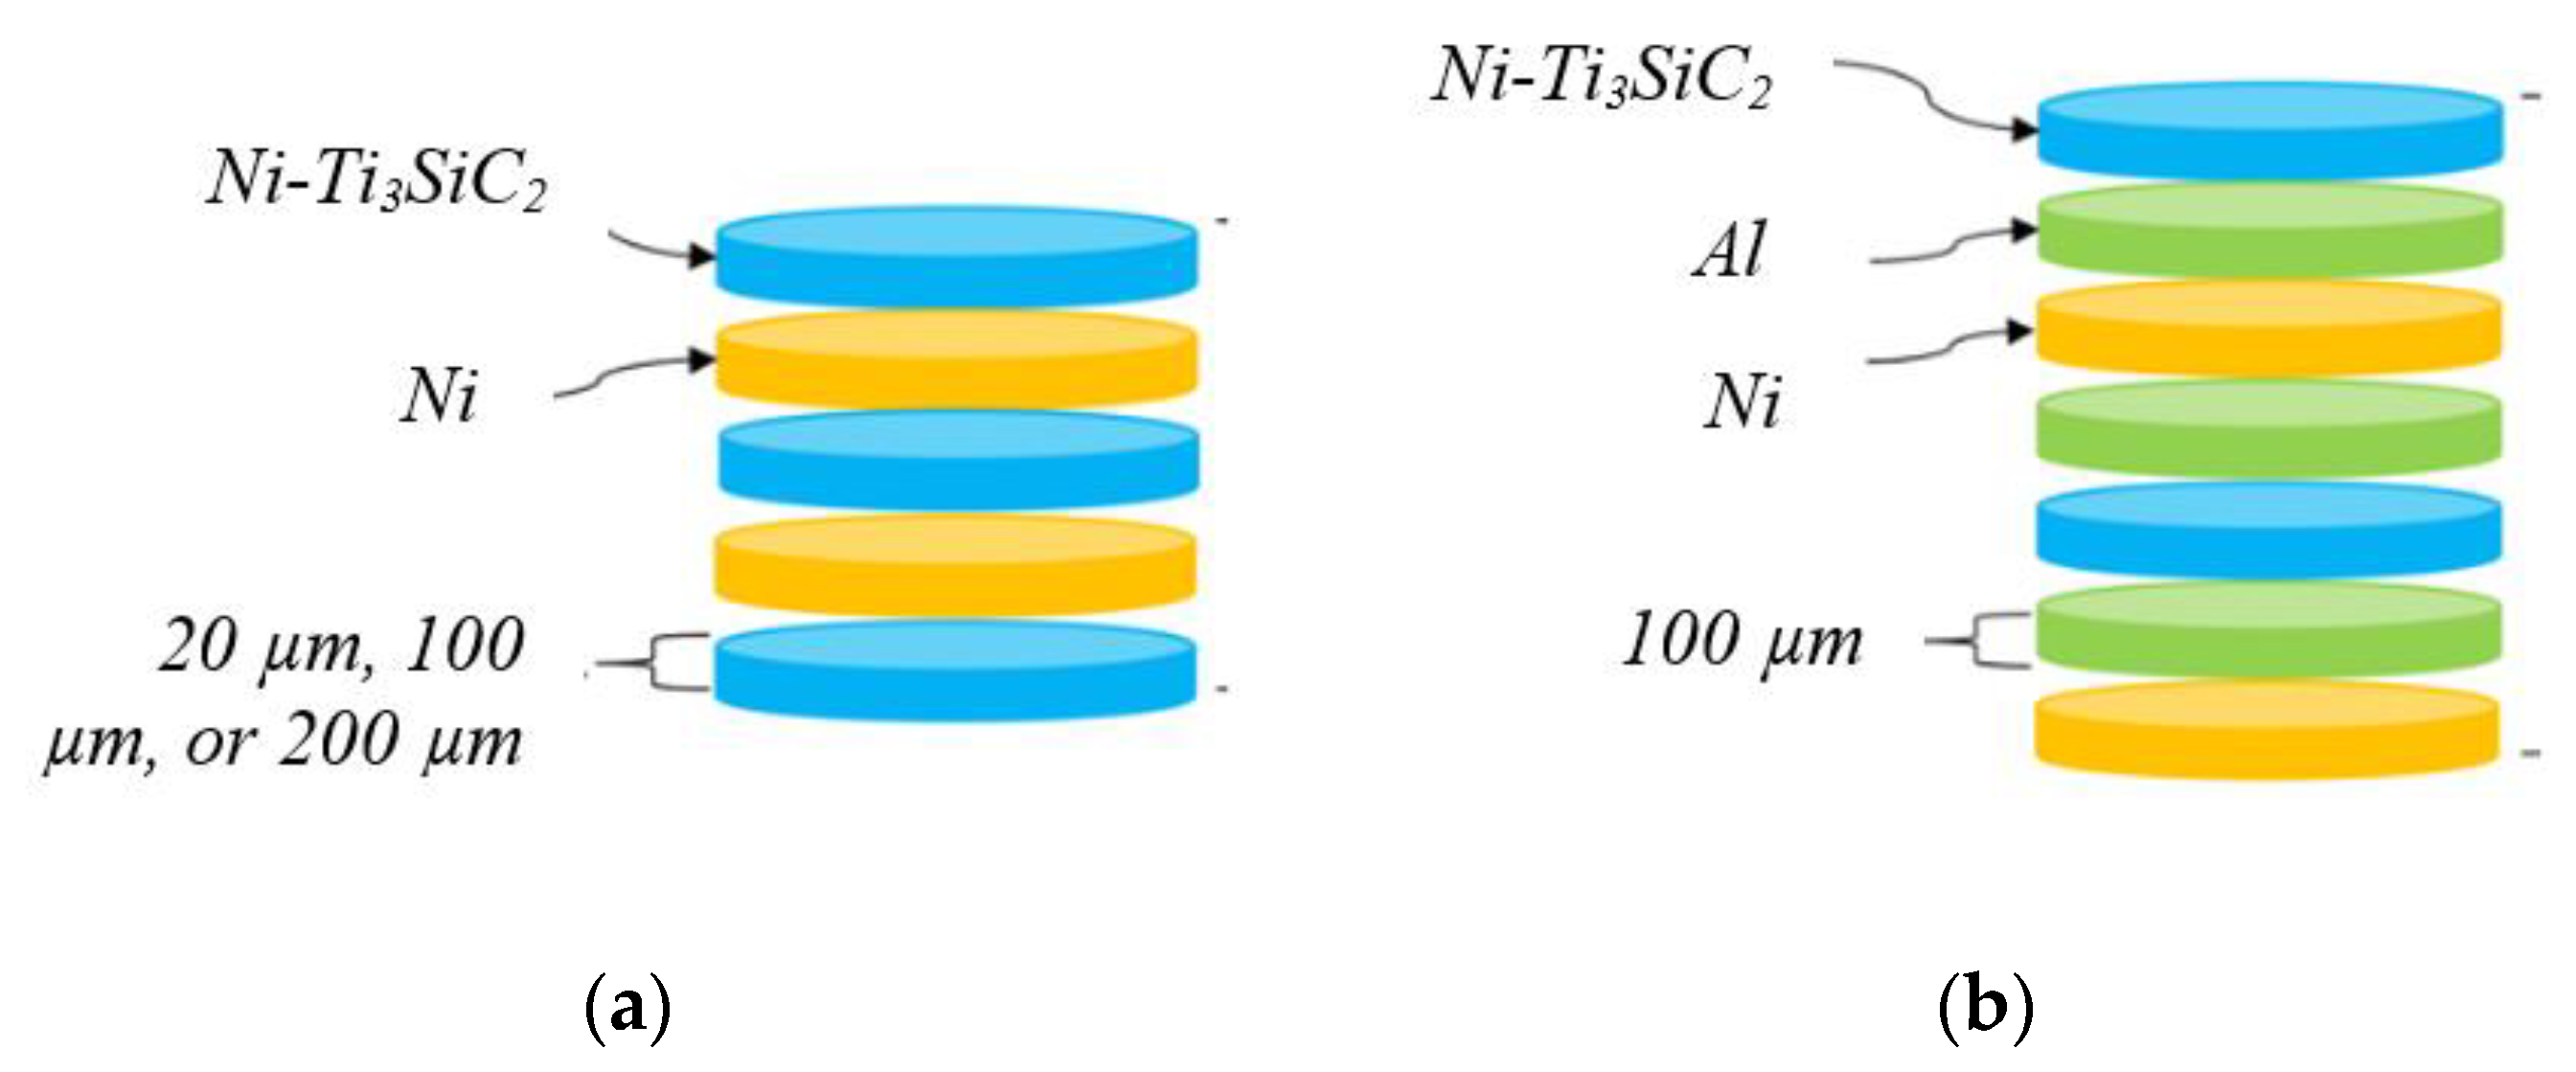
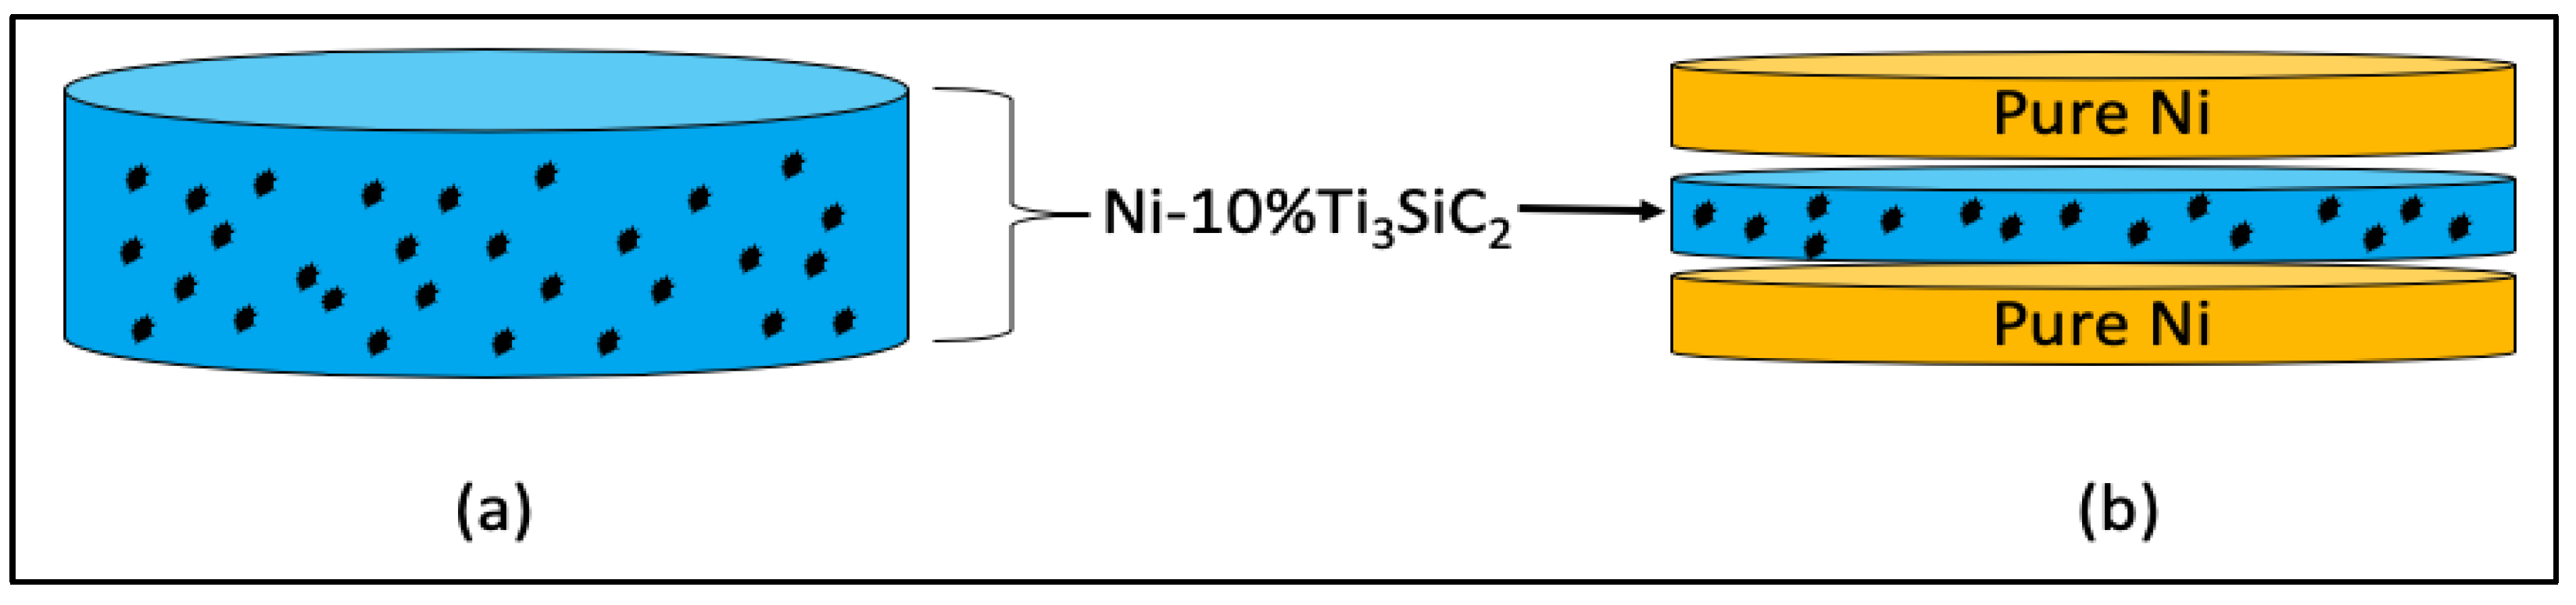
2.1. Laminate Design

In this paper, two different types of laminate design were studied: (a) composites layers of Ni and Ti3SiC2 (Ni–Ti3SiC2) interleaved with Ni (Figure 1a, Type-I composites), and (b) Ni–Ti3SiC2 layers interleaved with Al and Ni (Figure 1b, Type-II composites).
In Type-I composites, individual layer thickness was varied between 20 µm, 100 µm, or 200 µm when the Ti3SiC2 content in Ni–Ti3SiC2 was fixed at 20 vol %. In addition, the Ti3SiC2 concentration in the Ni–Ti3SiC2 layers was varied between 10 vol %, 20 vol %, or 40 vol % when the laminate thickness was fixed at 100 µm. These designed compositions are referred to by the following shorthand nomenclature: Ni-vol %Ti3SiC2/Ni (individual layer thickness).
In Type-II composites, Al layers were inserted between the Ni–Ti3SiC2 and Ni layers (Figure 1b). In these composites, the concentration of Ti3SiC2 was kept constant at ~20 vol % in the Ni–Ti3SiC2 layer, and the thicknesses of the individual laminate layers were either 20 µm or 100 µm, respectively. These designed compositions are referred to by the following shorthand nomenclature: Ni-vol %Ti3SiC2/Al/Ni (individual layer thickness).

2.2. Calculation of Ti3SiC2 Concentration in Composite

The rule of mixture was used to calculate the theoretical density ( ρ T) of all the composite samples by using the theoretical density of Ti3SiC2 and metal components. The experimental density ( ρ E) of the composites was then calculated from the mass and dimensions of each sample. Thereafter, the porosity (P (%)) of the sample was determined by Equation (1):
P   ( % ) =   ( 1 ρ E ρ T ) ×   100
From calculation perspective, it is important to note the concentrations of Ti3SiC2 in the Ni–Ti3SiC2 composites are based on individual layers but not on the vol % of the entire monolithic composites. In other words, the overall volume content of Ti3SiC2 in multilayered composites is different from that of the isotropic composites with similar chemistry of the individual layers. For example, an isotropic Ni-10%Ti3SiC2 with 4 mm thickness will have 10 vol % Ti3SiC2 dispersed throughout the ~4 mm composite (Figure 2a); however, in multilayered composites, 10% Ti3SiC2 refers to the concentration of individual layers of Ni–Ti3SiC2 (Figure 2b).
Table 1 shows the theoretical calculation of Ti3SiC2 in the multilayered Ni–Ti3SiC2 composites with the assumption that the top and bottom layers must be Ni–Ti3SiC2 layers. The Ti3SiC2 concentrations mentioned in this paper are 10%, 20%, and 40% of Ti3SiC2 in the individual layers, not the volume of the composites.

2.3. Slurry Design and Tape Casting

Initially, the binder solution for tape casting was synthesized by dissolving ~20 g poly vinyl alcohol (PVA) (98–99% hydrolyzed, Aldrich Chemistry, St. Louis, MO) in ~80 g distilled water (DI). Dry powders of Ti3SiC2 (−325 mesh, Kanthal, Hallstanhammar, Sweden) and the required concentrations of Ni powder (−325 mesh, Alfa Aesar, Haverhill, MA) were mixed by ball milling (8000 M mixer Mill, SPEX SamplePrep, Metuchen, NJ) for 5 min. The slurry for tape casting was fabricated by mixing dry powders with PVA solution in a 60:40 weight ratio in a ball mill for 5 min. The same protocol was also used for fabricating slurry composed of Ni, Al, and Ti3SiC2 (Type-II composites).
The mixed slurry was then poured onto a mylar polymer film. The poured slurry was then smeared into a single layer by using a tape casting machine (MSK-AFA-111-110, Automatic Thick Film Coater, MTI Corp, Richmond, CA) with a casting speed set at 20 cm/min. The green tapes were then dried at room temperature ~3 h, and then the green film was covered with plywood for ~9 h to prevent warping. The plywood for constraining green tapes was prepared by polishing the plywood with 1200 grit SiC paper and then washing it with acetone. The green tapes were then punched with a circular die of diameter ~25.4 mm. The green tapes were then packed into a dry pressing die (MTI Corp, Richmond, CA) by using the laminate design outlined in Figure 1.
The green body samples were pre-stressed at ~1.49 MPa in a hot press (TF 1200X, MTI Corp, Richmond, CA). The samples were heated at the rate of 10 °C/min to 150 °C, then isothermally held at 150 °C for 5 min. After 5 min, the samples were laminated by hot pressing at a uniaxial pressure of ~119.6 MPa at 150 °C for 5 min. The laminated samples were then allowed to cool to the room temperature; thereafter, the samples were heated to 650 °C at 10 °C/min under a constant pressure of ~1.49 MPa. The samples were isothermally held at 650 °C for 5 min; thereafter, they were hot pressed at ~142 MPa for ~5 min. The composites were then machined into ~3 mm cubes for characterizing mechanical behavior.

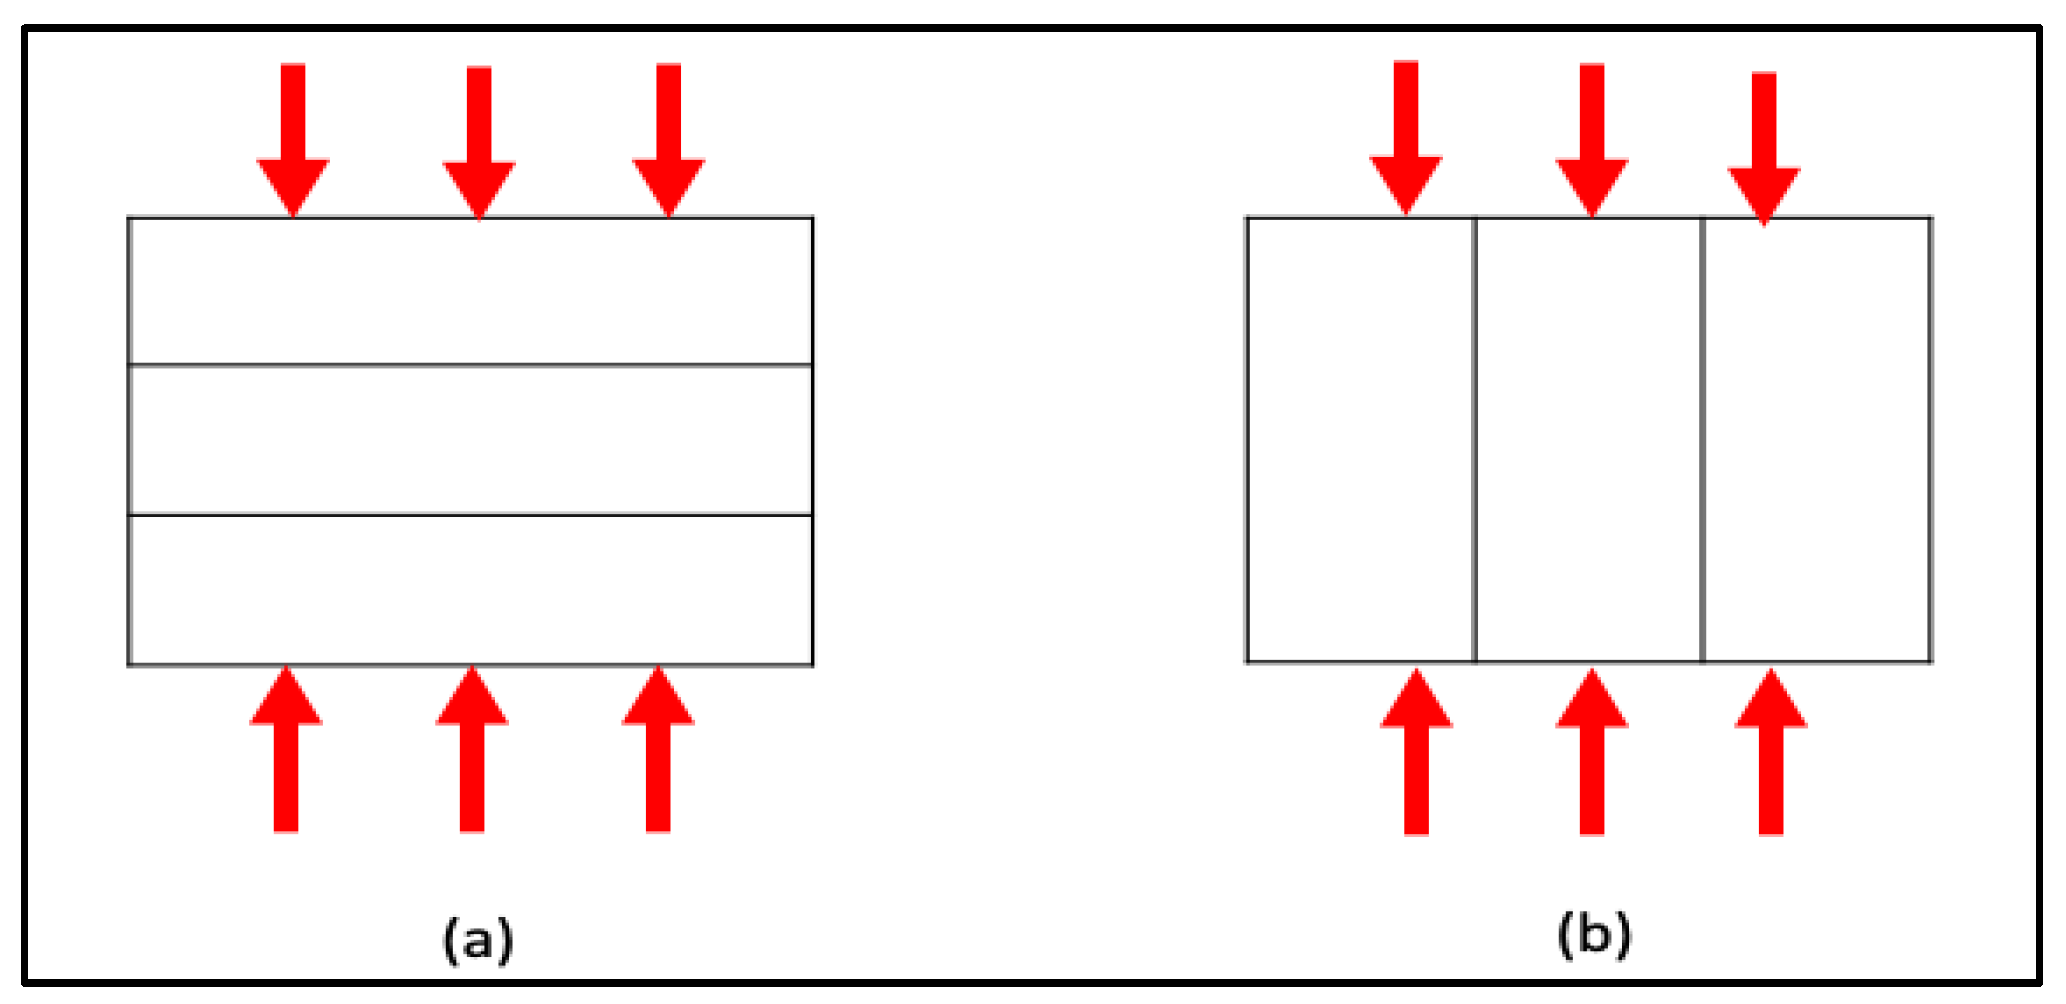
2.4. Mechanical and Tribological Testing

Compression testing was done by a mechanical testing system (Shimadzu AG-IS UTM, Shimazdu Scientific Instruments Inc., Columbia, MD). For each composition, a set of 6 samples (3 samples each in parallel and perpendicular direction (Figure 3)) were tested at a deflection rate of 1 mm/min. The actual strain of each sample could not be determined due to experimental limitations; hence stress versus displacement plots were reported. For qualitative comparison, ultimate compressive strength (UCS) was defined as the maximum compressive stress after which the sample failed. An average of 3 UCS measurements for each composition at a designed direction was reported in the text.
For the tribology measurements, all the samples were cut into blocks of ~4 mm × ~4 mm × ~3 mm. Figure 3 shows the orientation of the composite samples at which they were tested; for example, if the layer was aligned parallel or perpendicular to the wear surface then it was referred to as parallel or perpendicular in orientation, respectively. The samples were then polished along those orientations until ~1 µm finishing. All the tribology studies were then performed by a block-on-disk tribometer (CSM Instruments SA, Peseux, Switzerland) at a load 5 N (~0.31 MPa), and track radius of ~10 mm on alumina substrates at room temperature under ambient conditions, respectively. Alumina substrates (AL-D-42-2, AdValue Technology, Tucson, AZ) were also polished at least ~3 µm for finishing. A surface profilometer (Surfcom 480A, Tokyo Seimitsu Co. Ltd., Tokyo, Japan) was used to confirm the surface roughness. For each composition, an average of mean of friction coefficient from three measurements was used to calculate averaged friction coefficient (µ). The mass of the samples and substrates were measured before and after the testing by a weighing scale (XA 83/220/2X, Radwag, Radom, Poland). The specific wear rate (WR) was calculated by using Equation (2), where mi and mf are the mass of the samples before and after testing, respectively, N is the applied load, and d is the total distance traversed during the testing [18,19]:
W R   =   ( m i     m f ) / (   ρ T · N · d )
An average of 3 WR readings was reported in the text. For all samples, secondary electron (SE) and backscattered electron (BSE) images were obtained using a JEOL JSM-6490LV scanning electron microscope (JEOL USA, Inc., Peabody, MA, USA). X-ray information was obtained via a thermo nanotrace energy dispersive X-ray detector (EDS) with an NSS-300e acquisition engine. Due to the difficulty in quantifying C by EDS, the C-content of microstructural features was identified by adding {Cx} in the tribochemistry analysis. In addition, the chemically uniform area of tribofilms from BSE images was designated as *microconstituent*. The “microconstituent” regions are not necessarily single phase but they are deemed chemically uniform at the micron level by EDS analysis of BSE images [18,19].

3. Results and Discussion

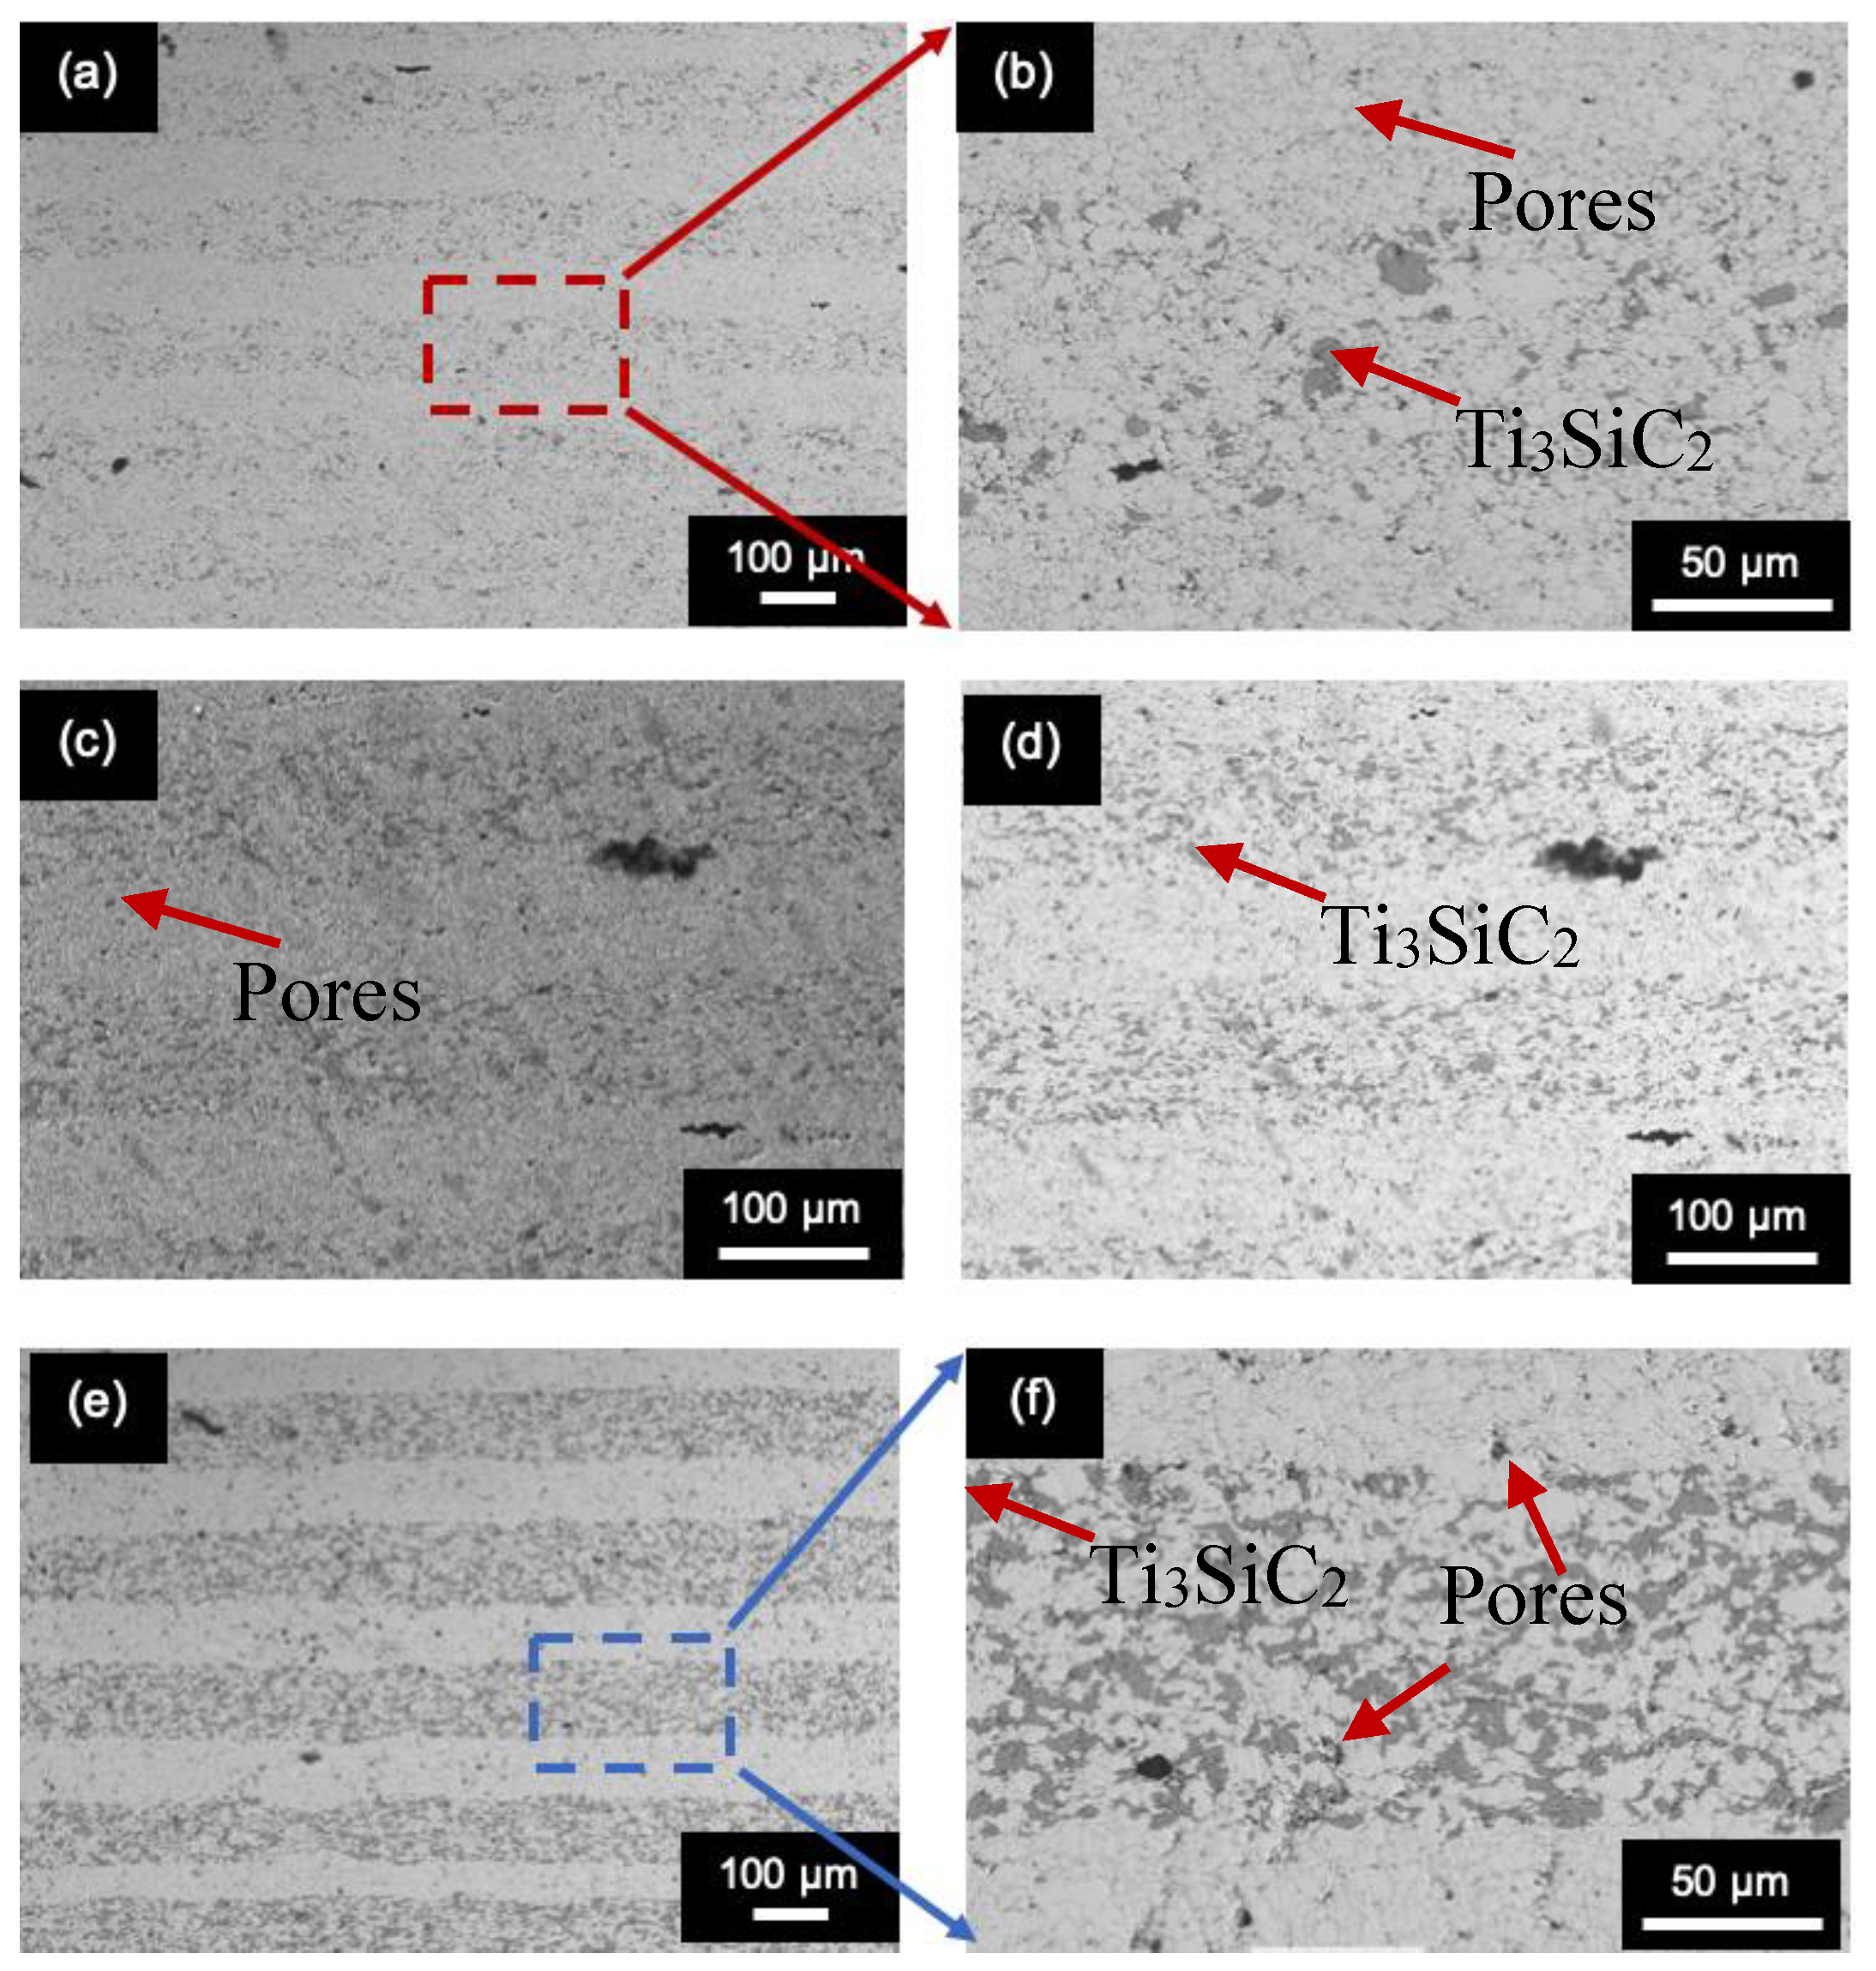
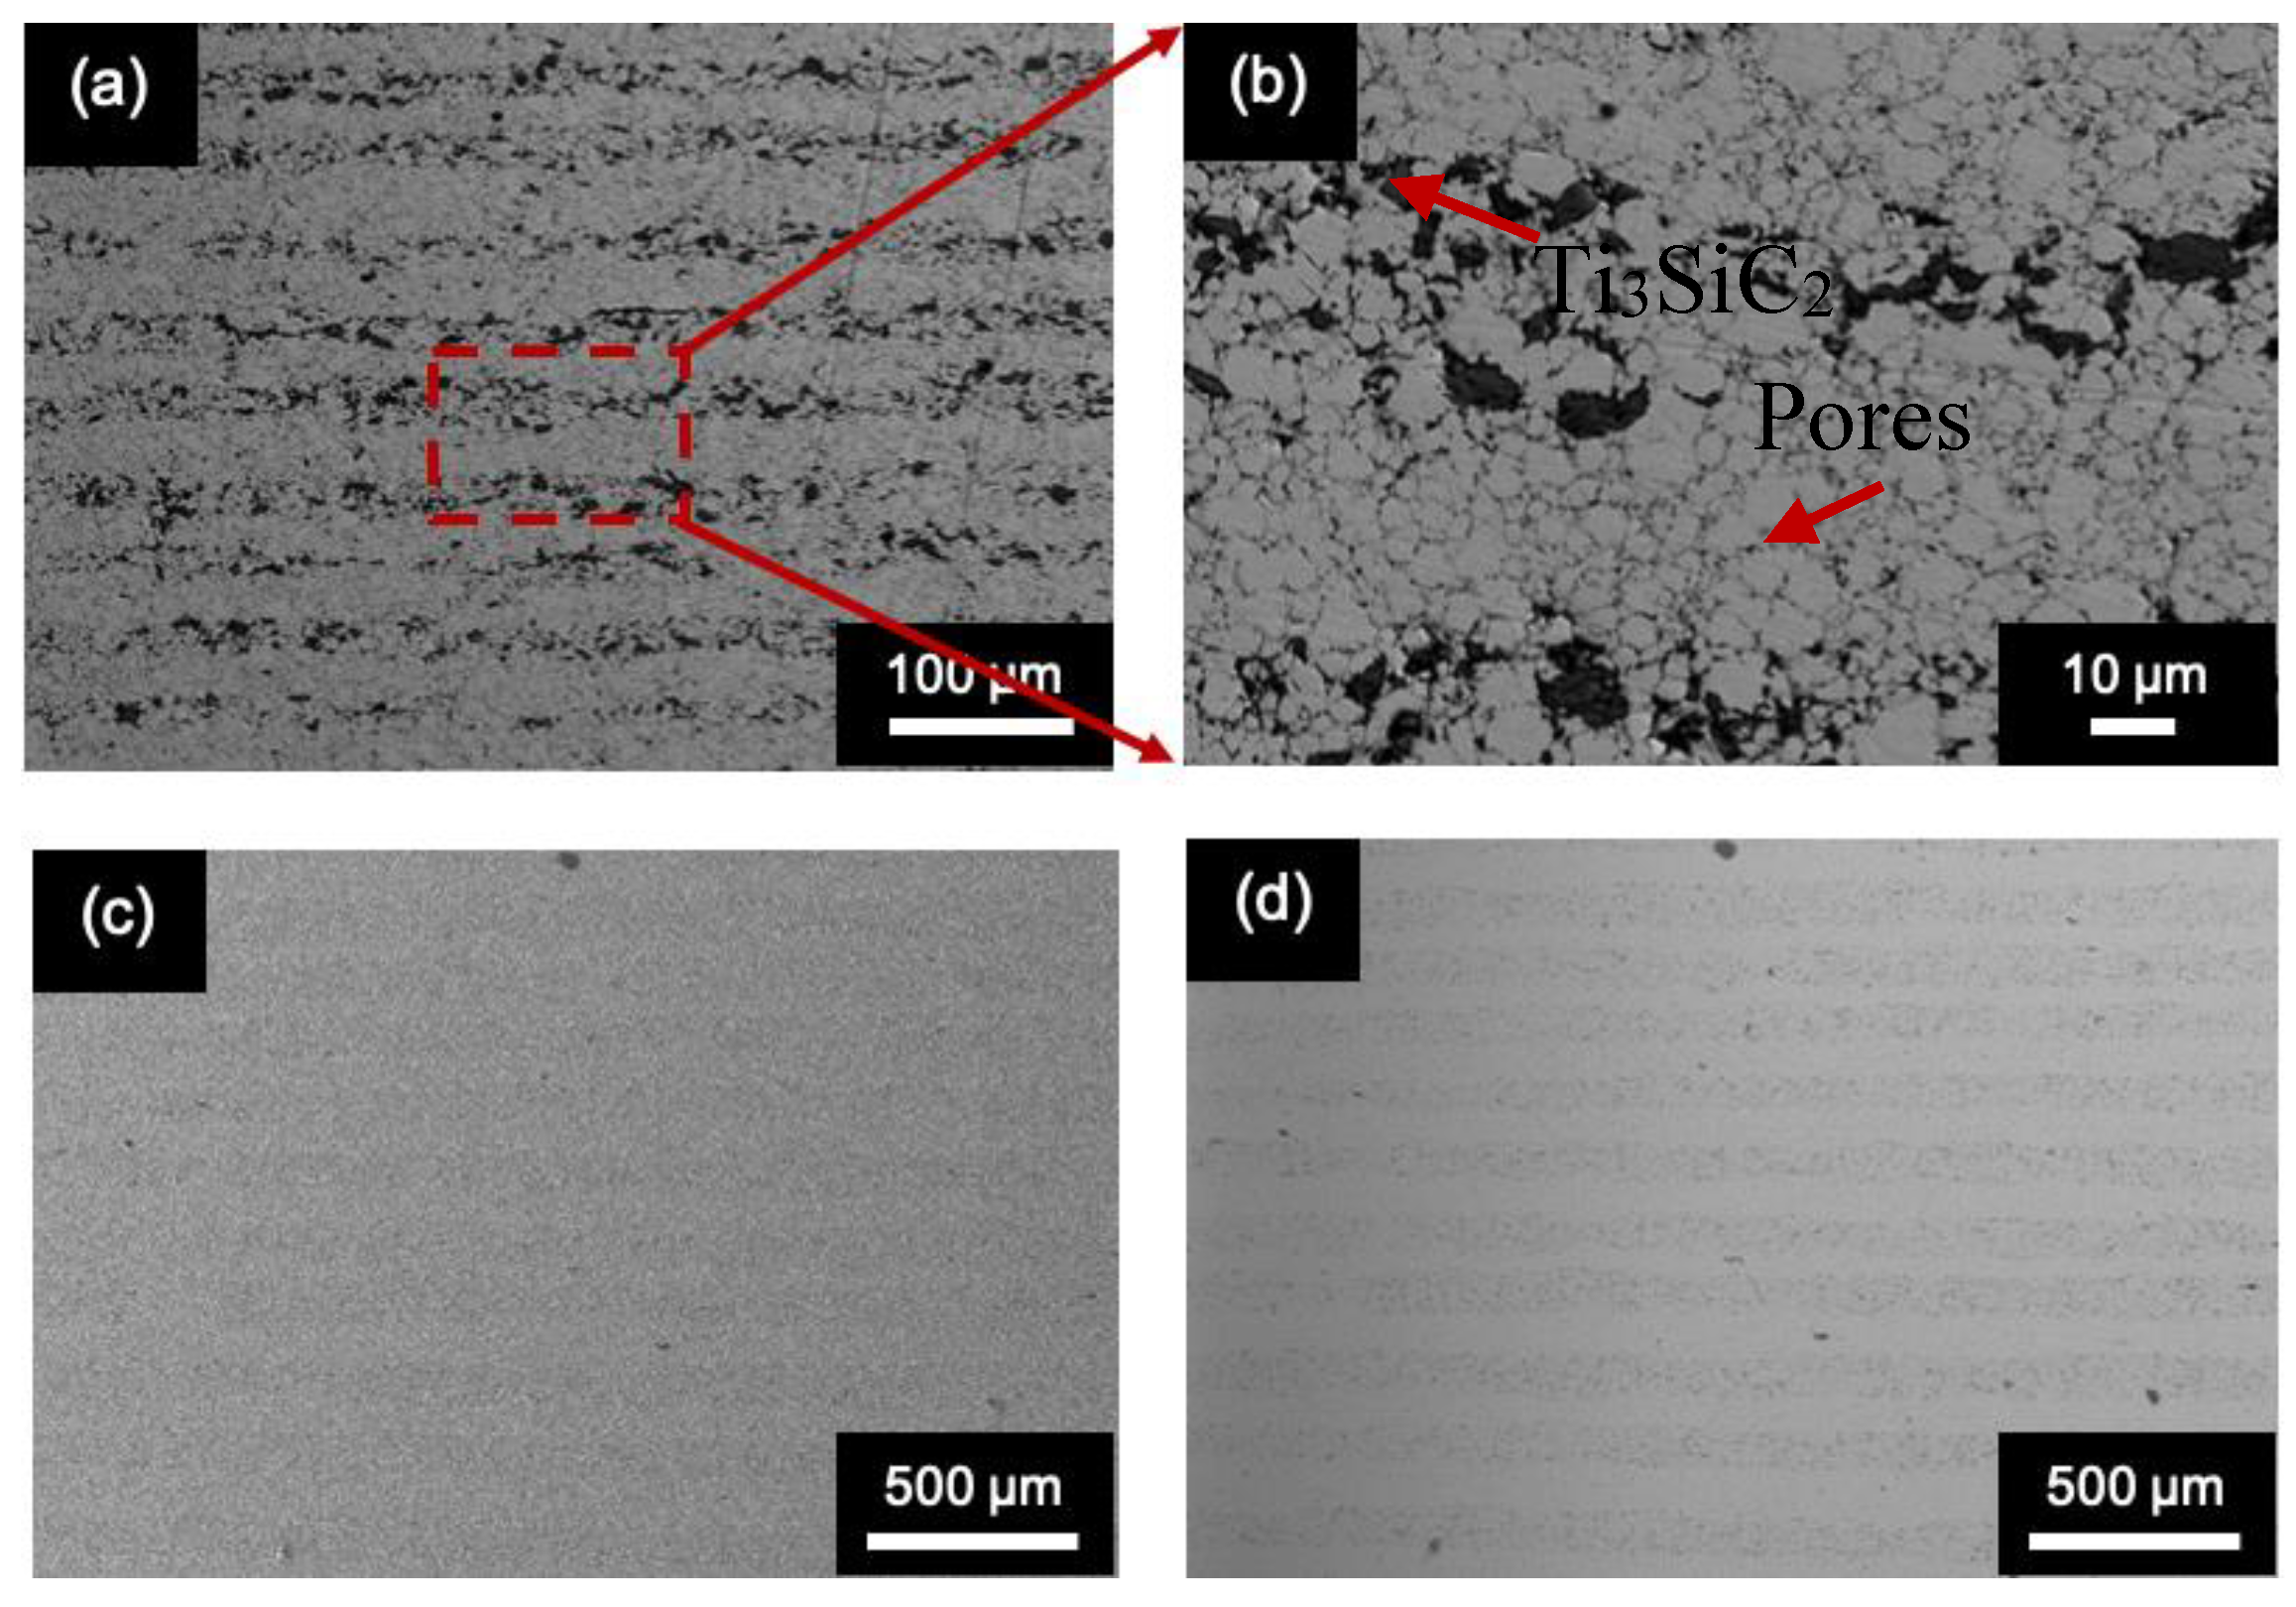
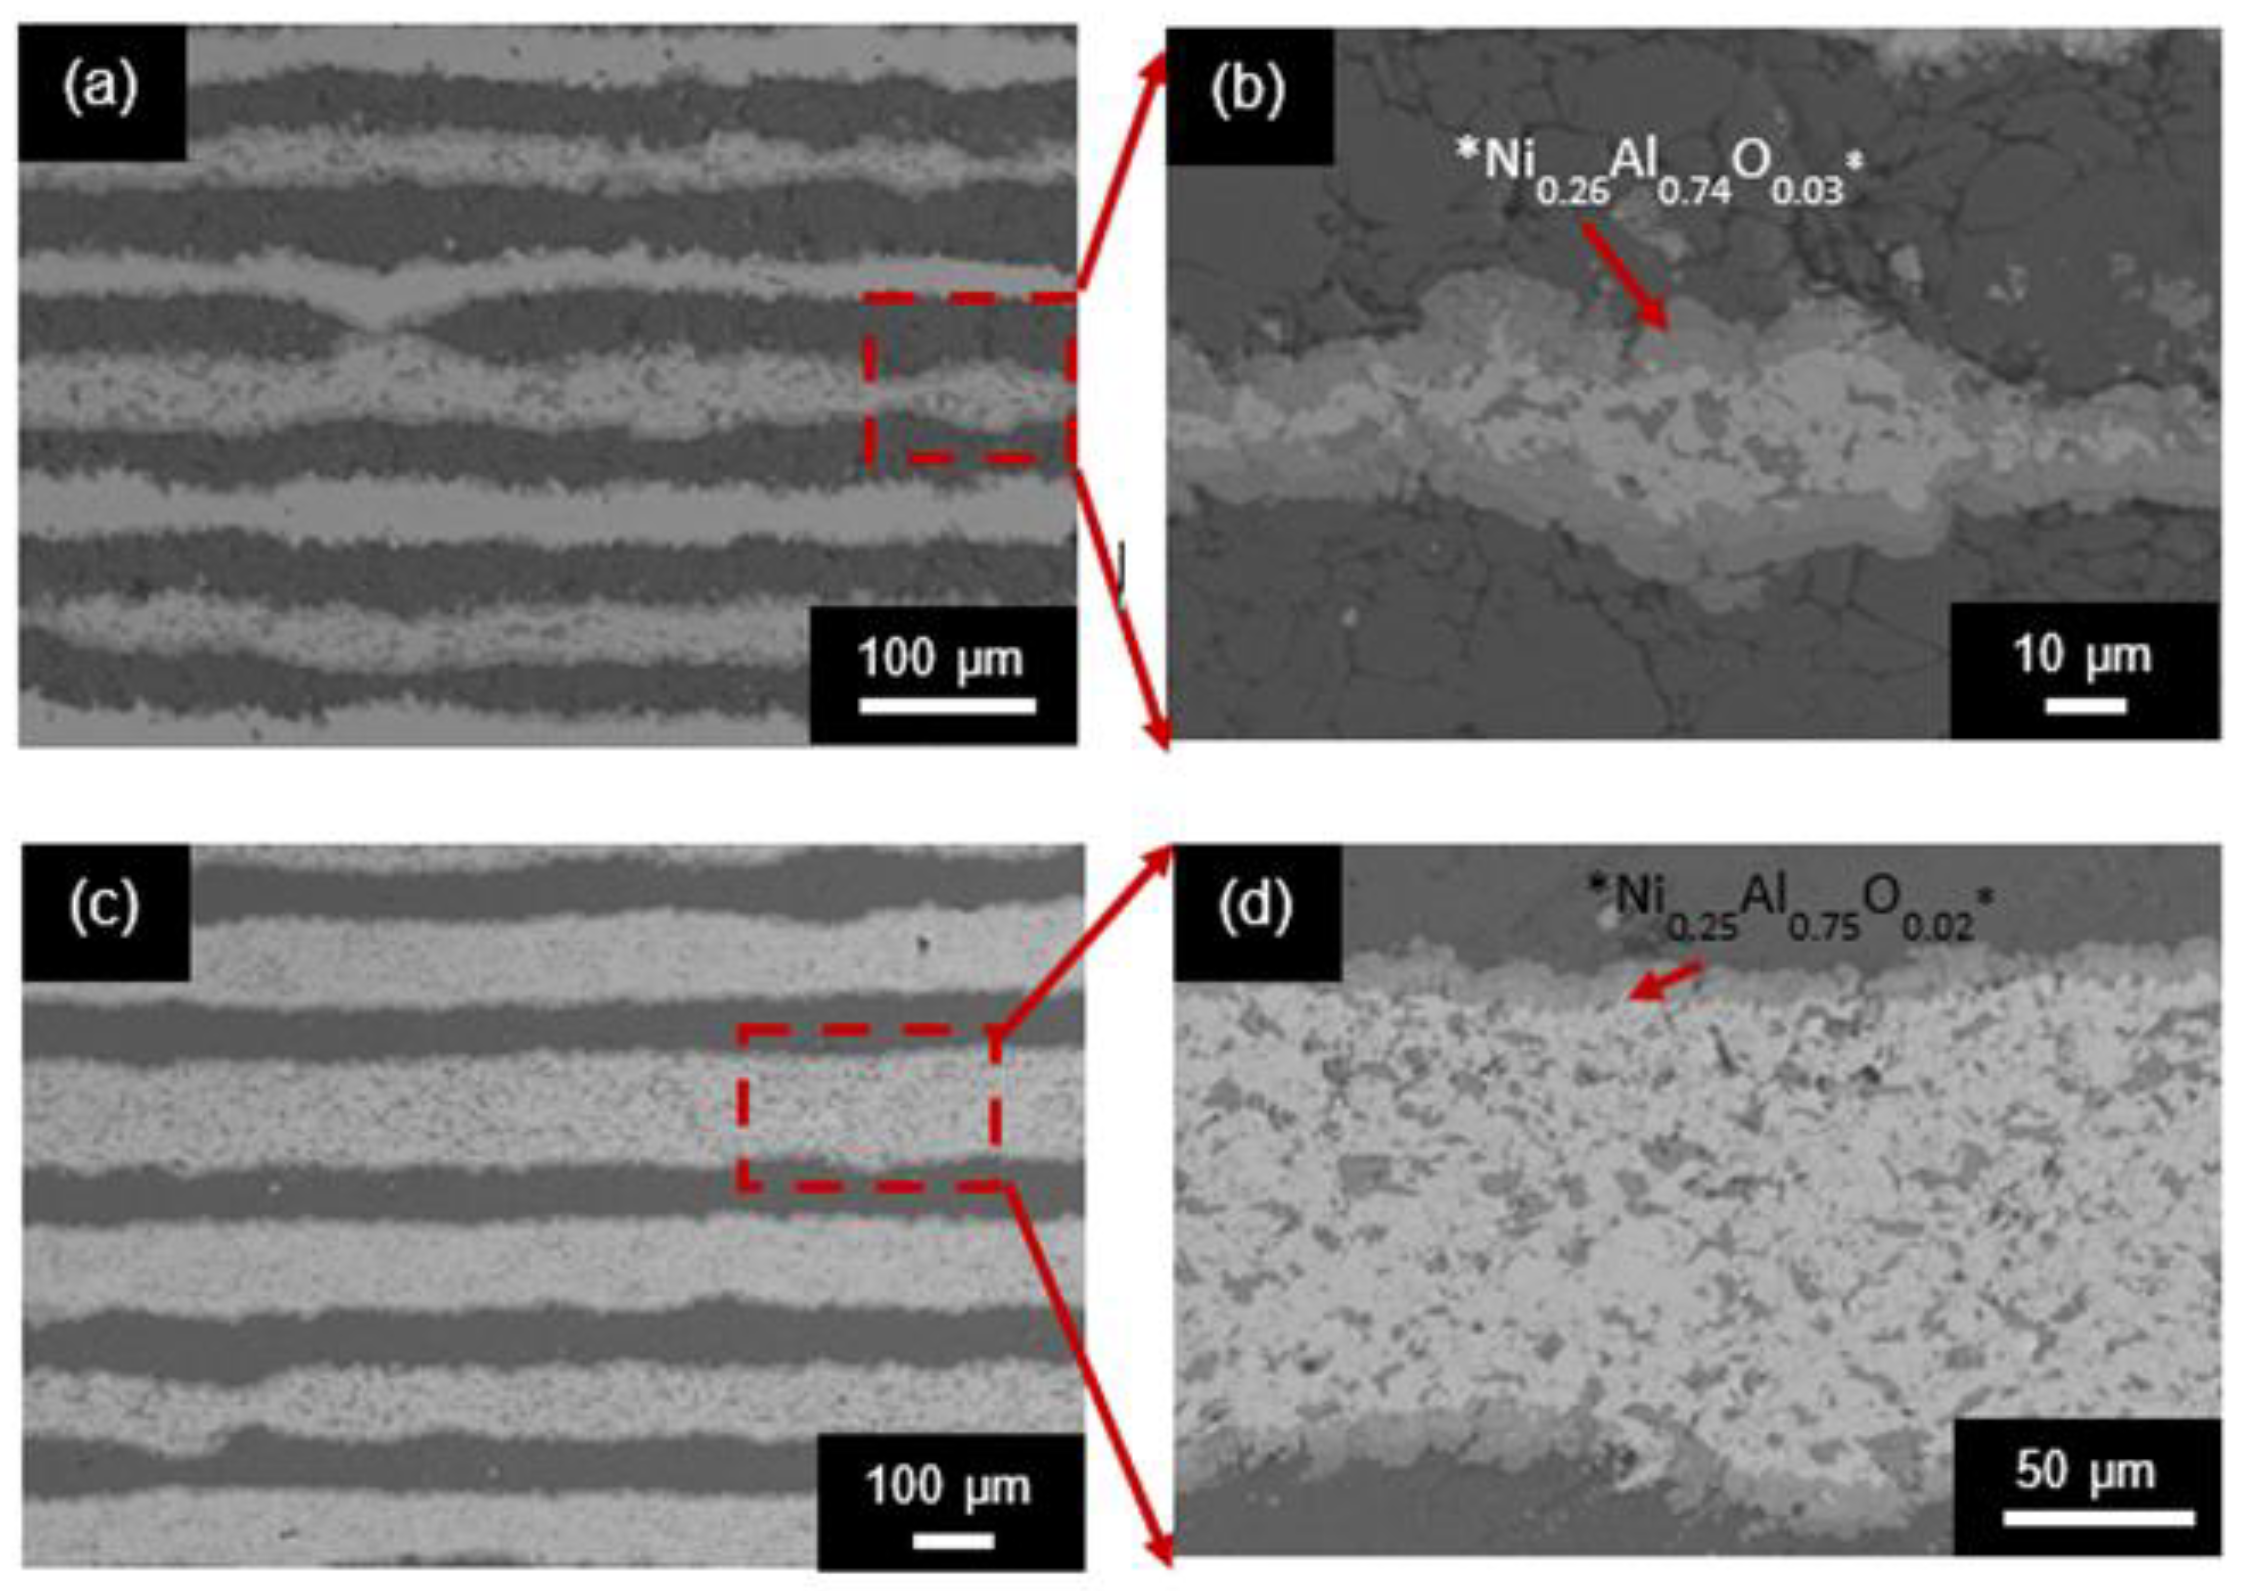
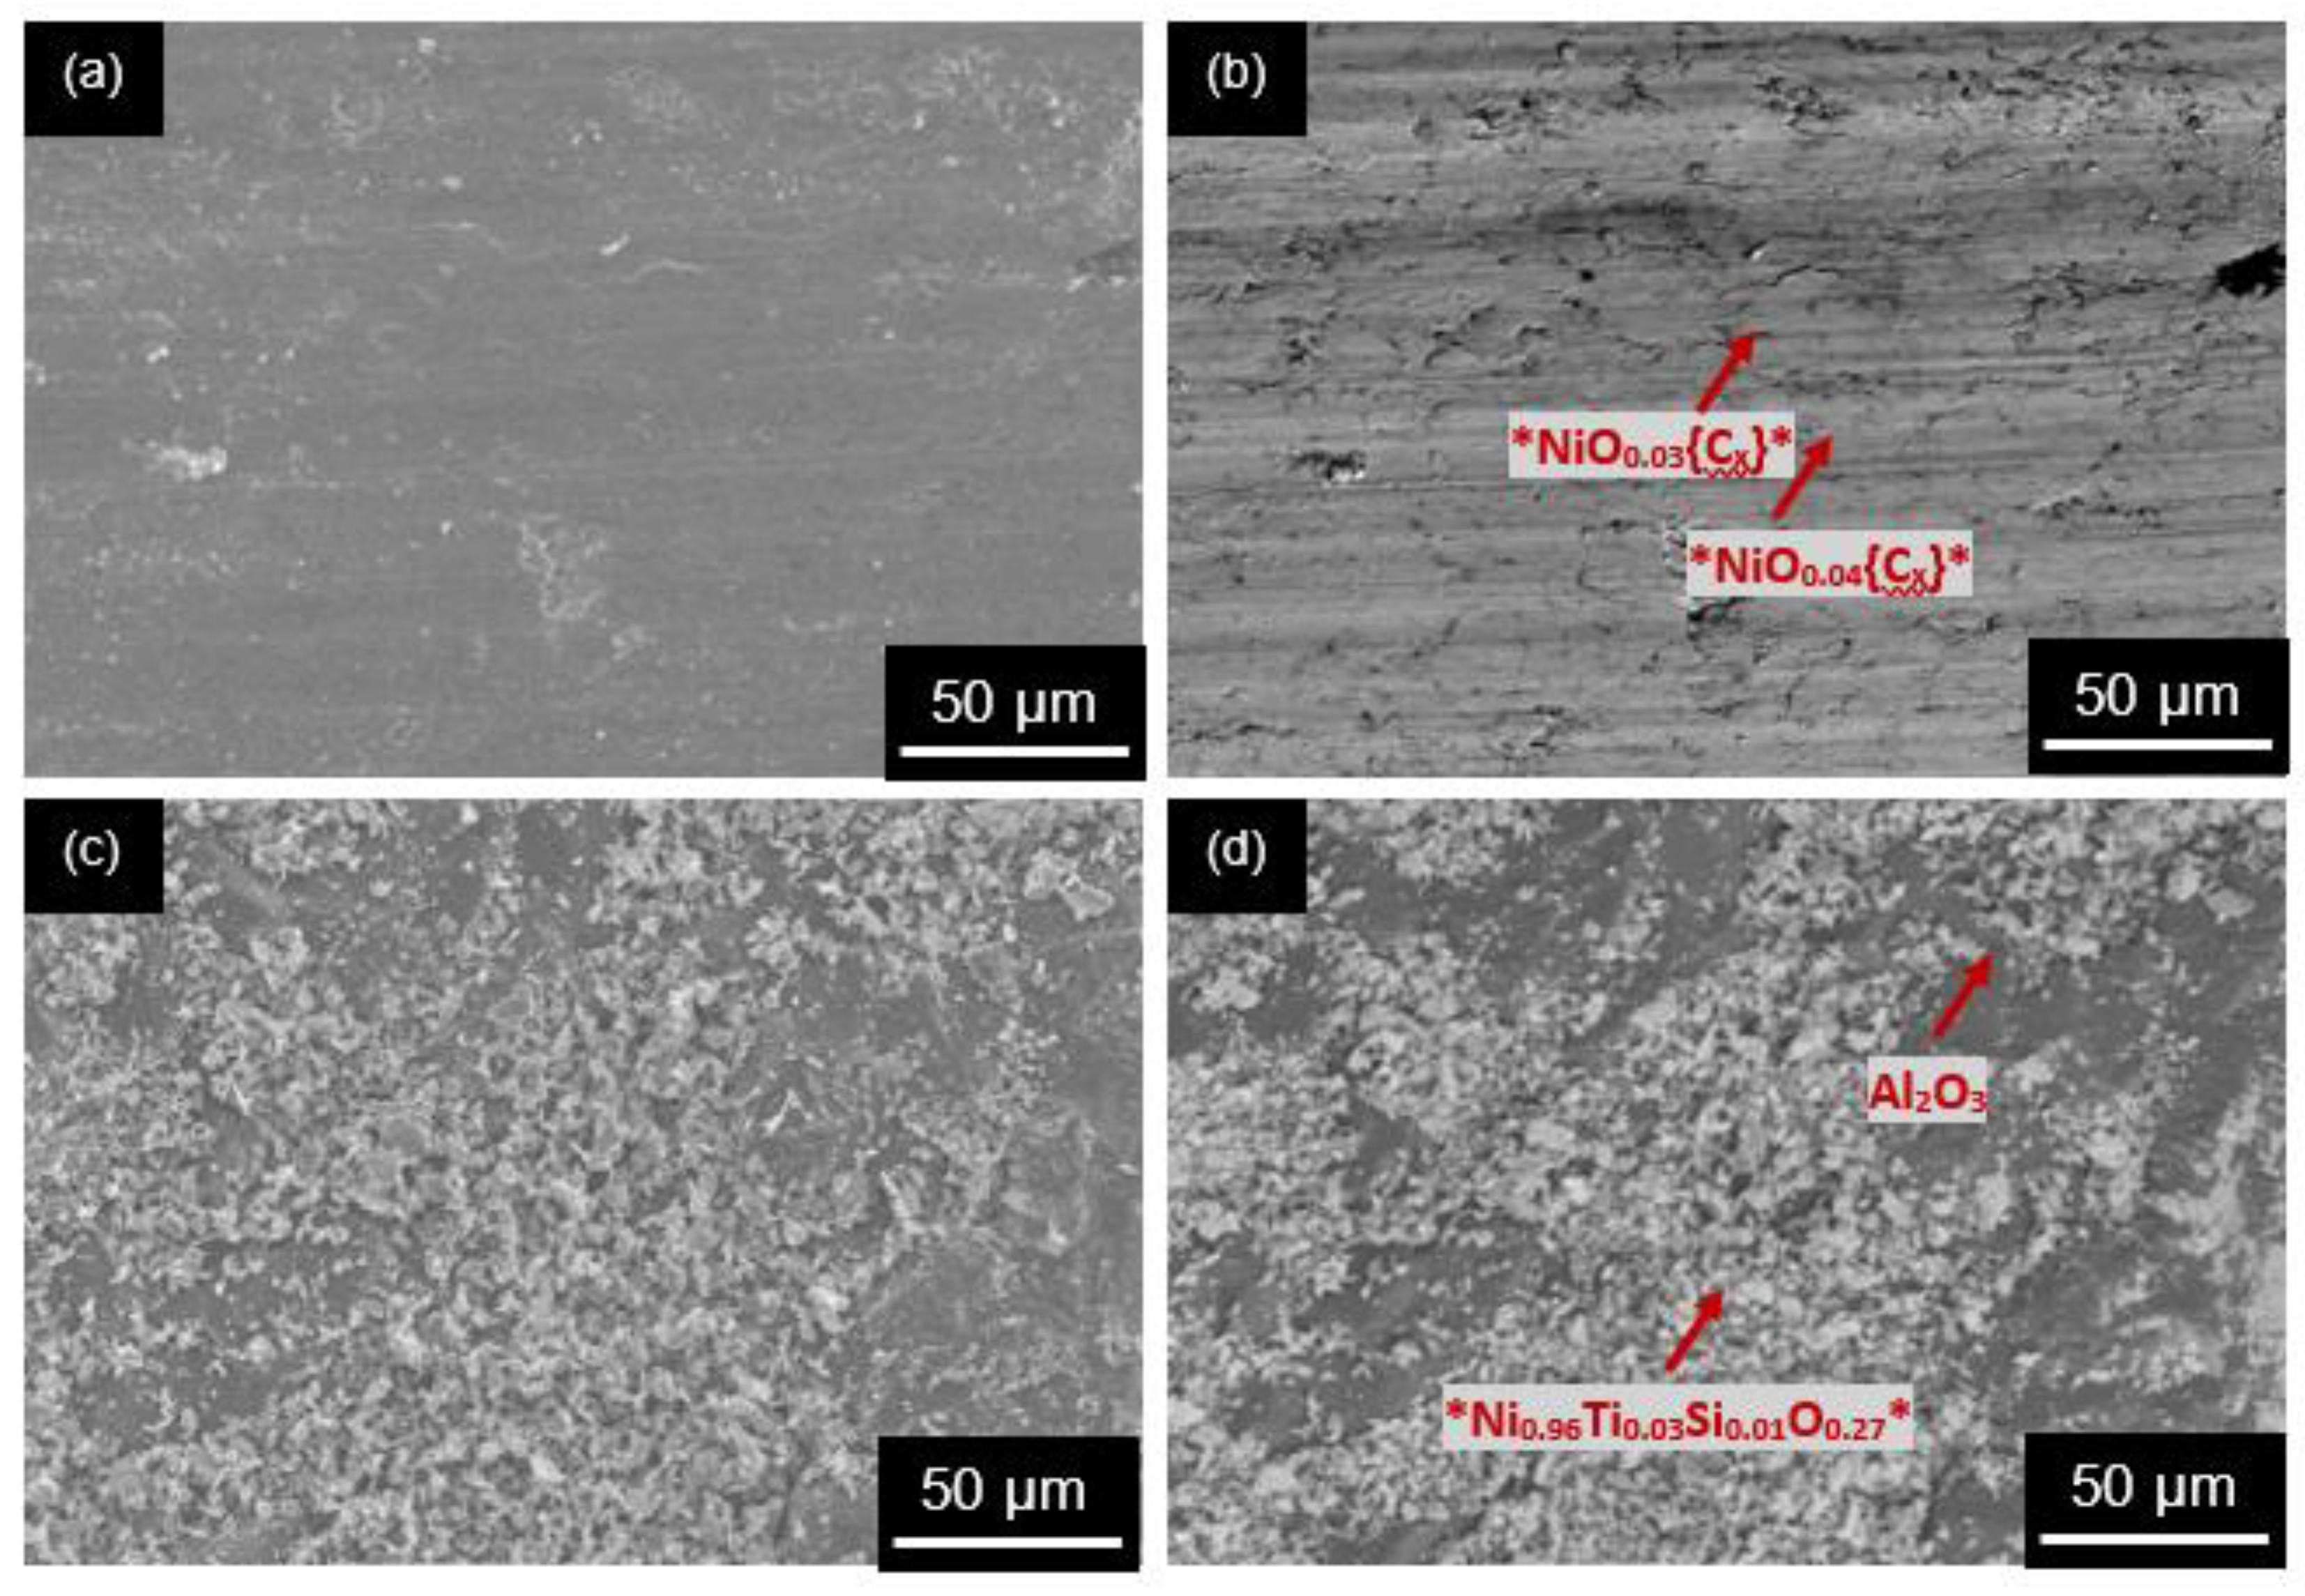
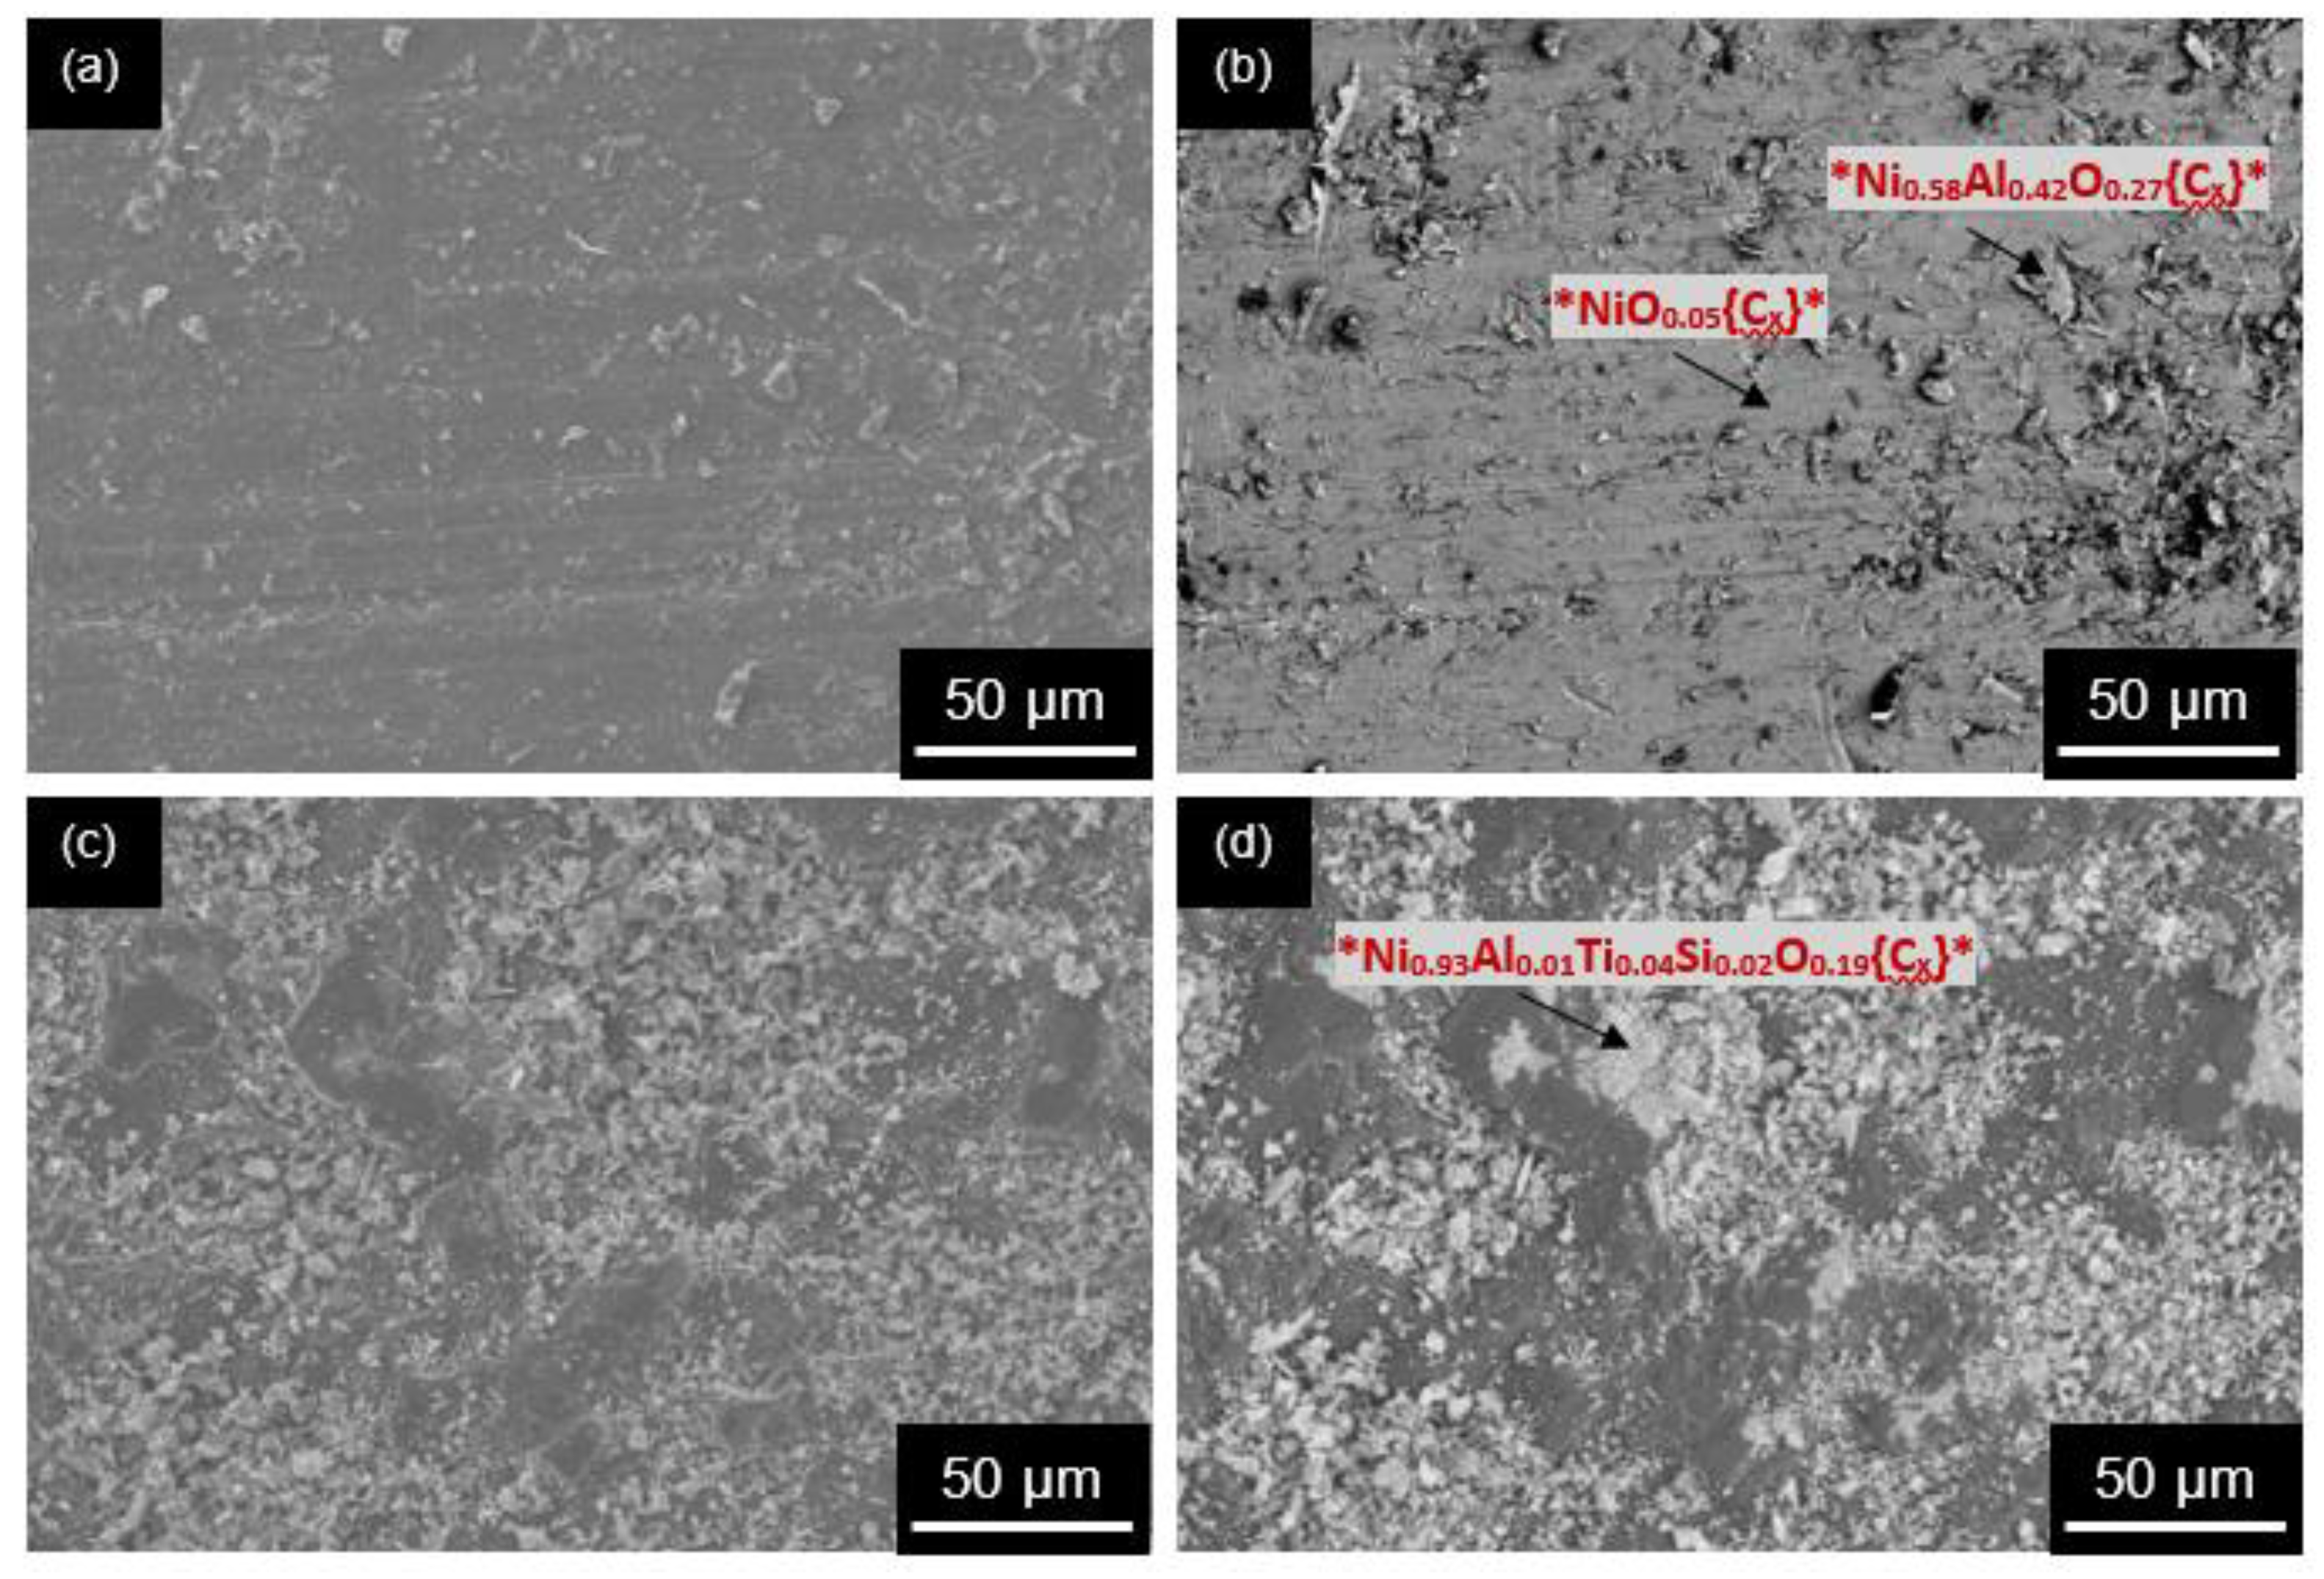
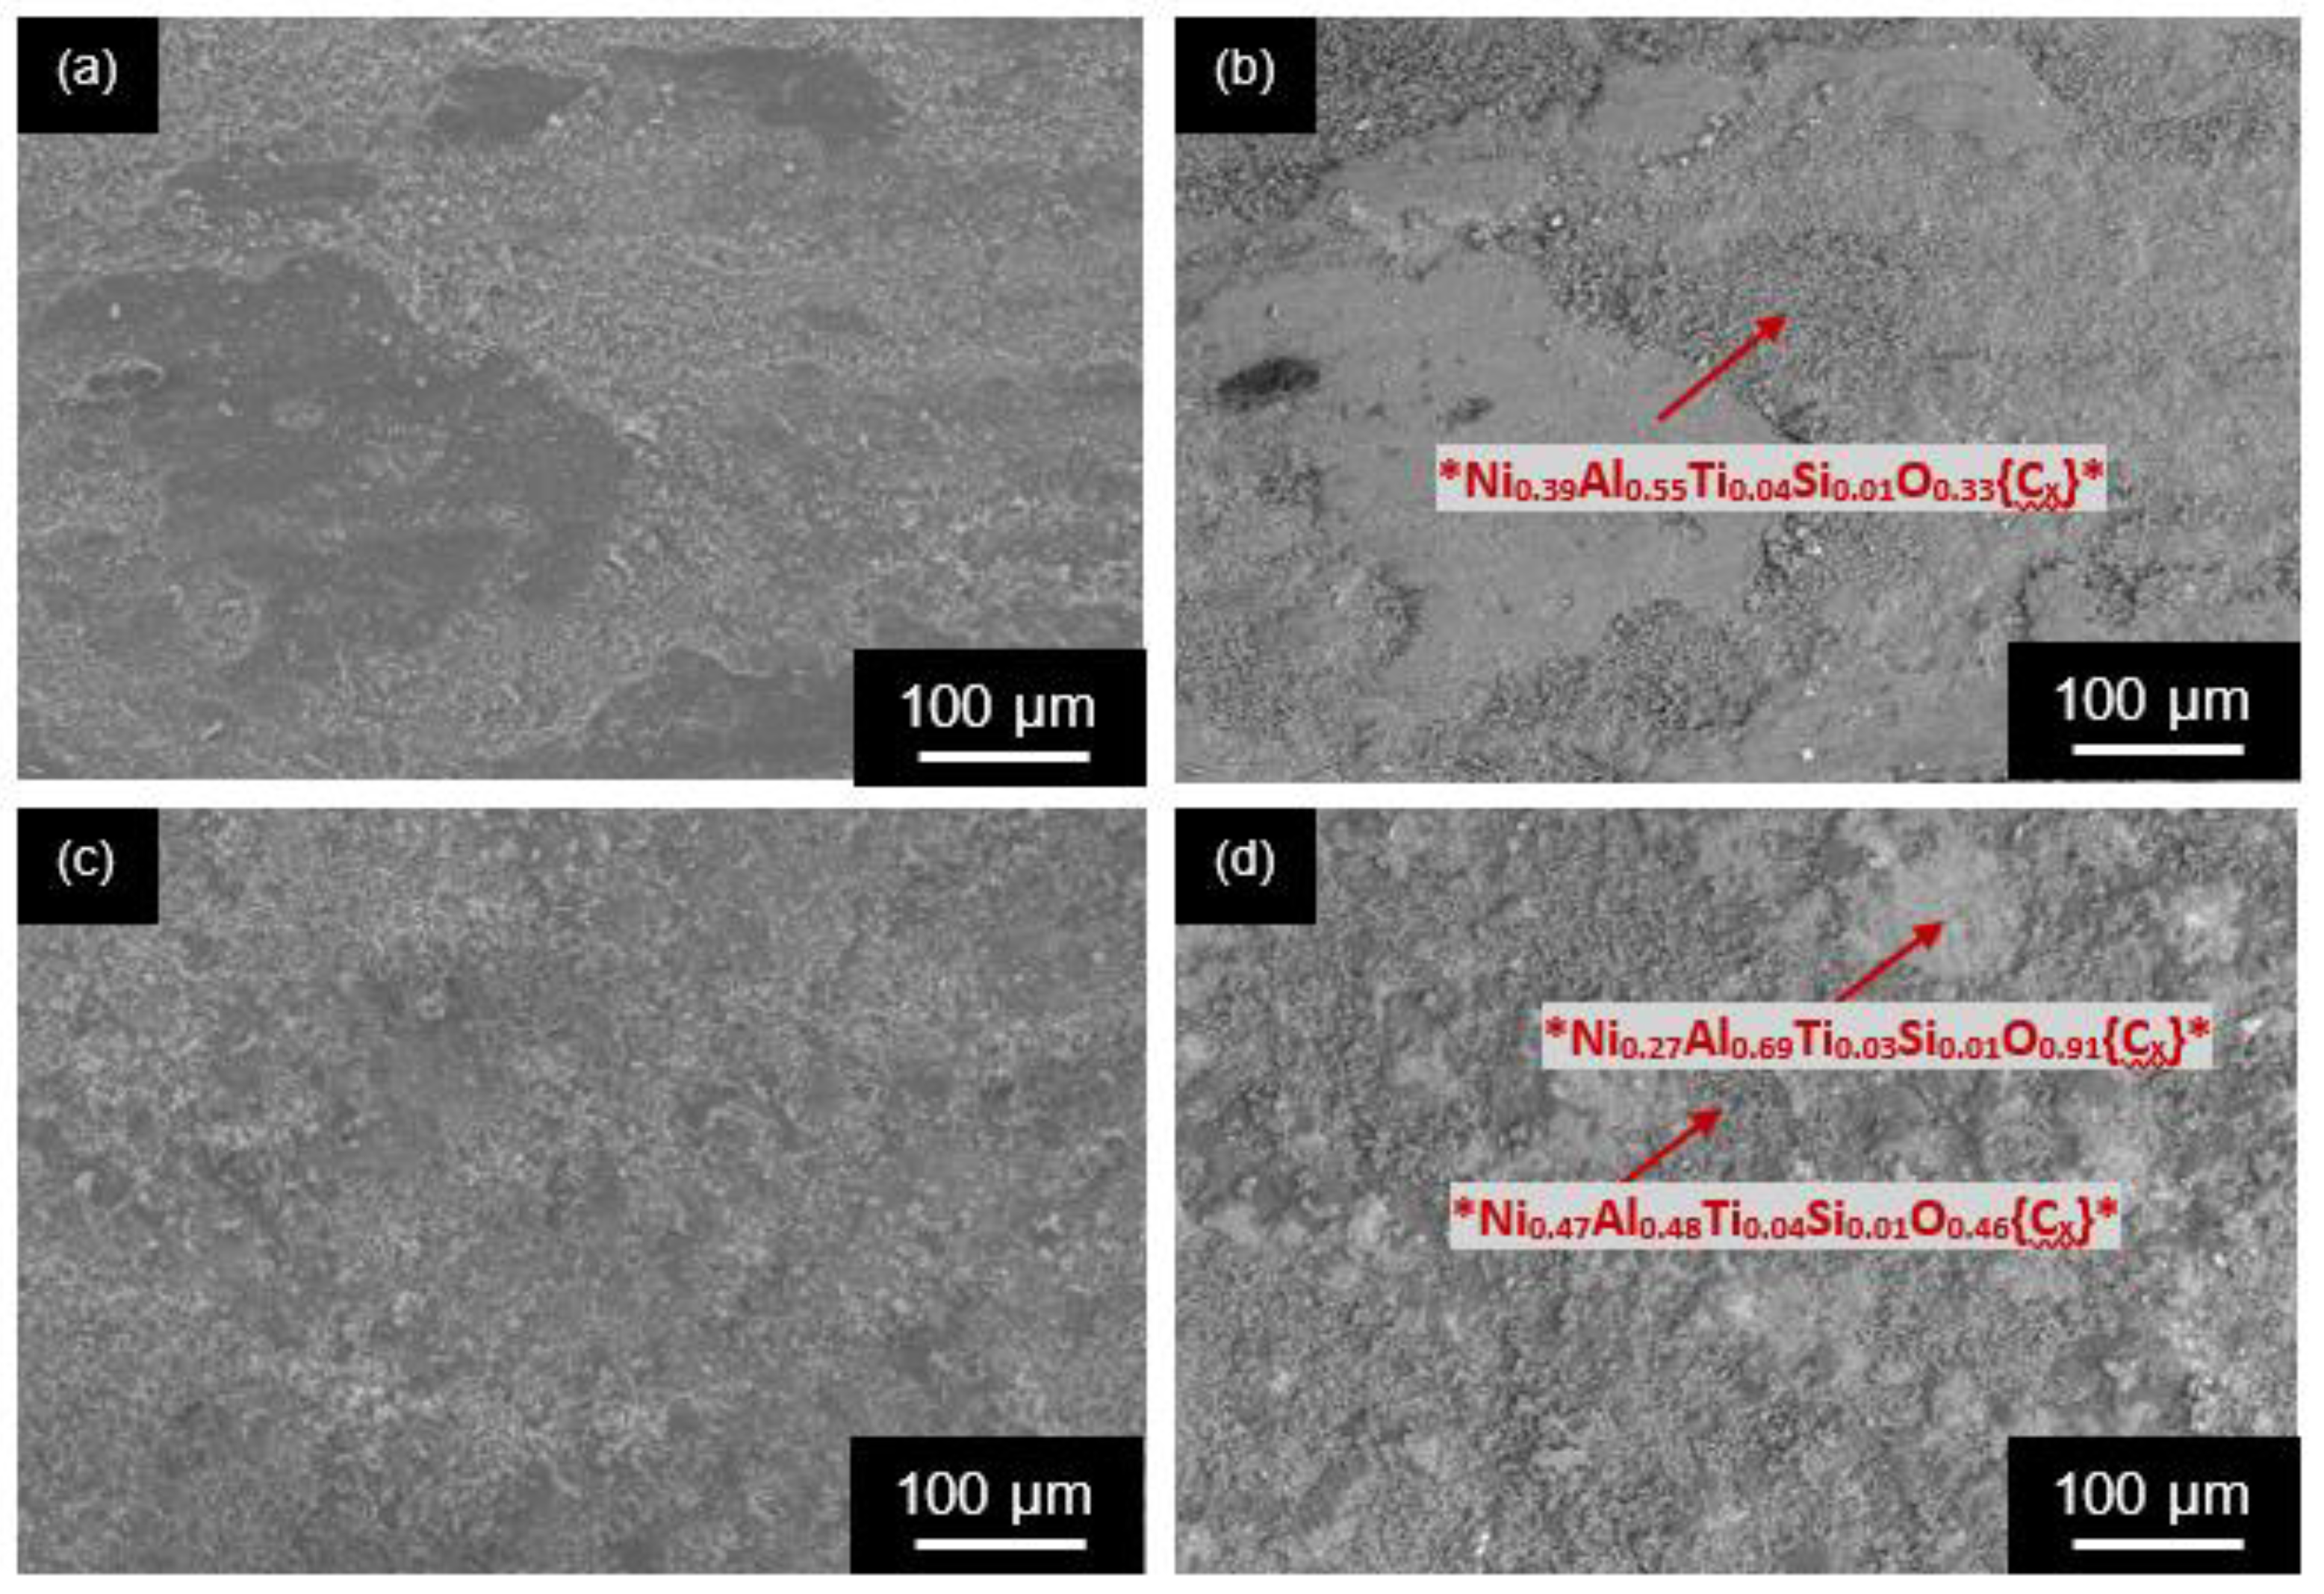
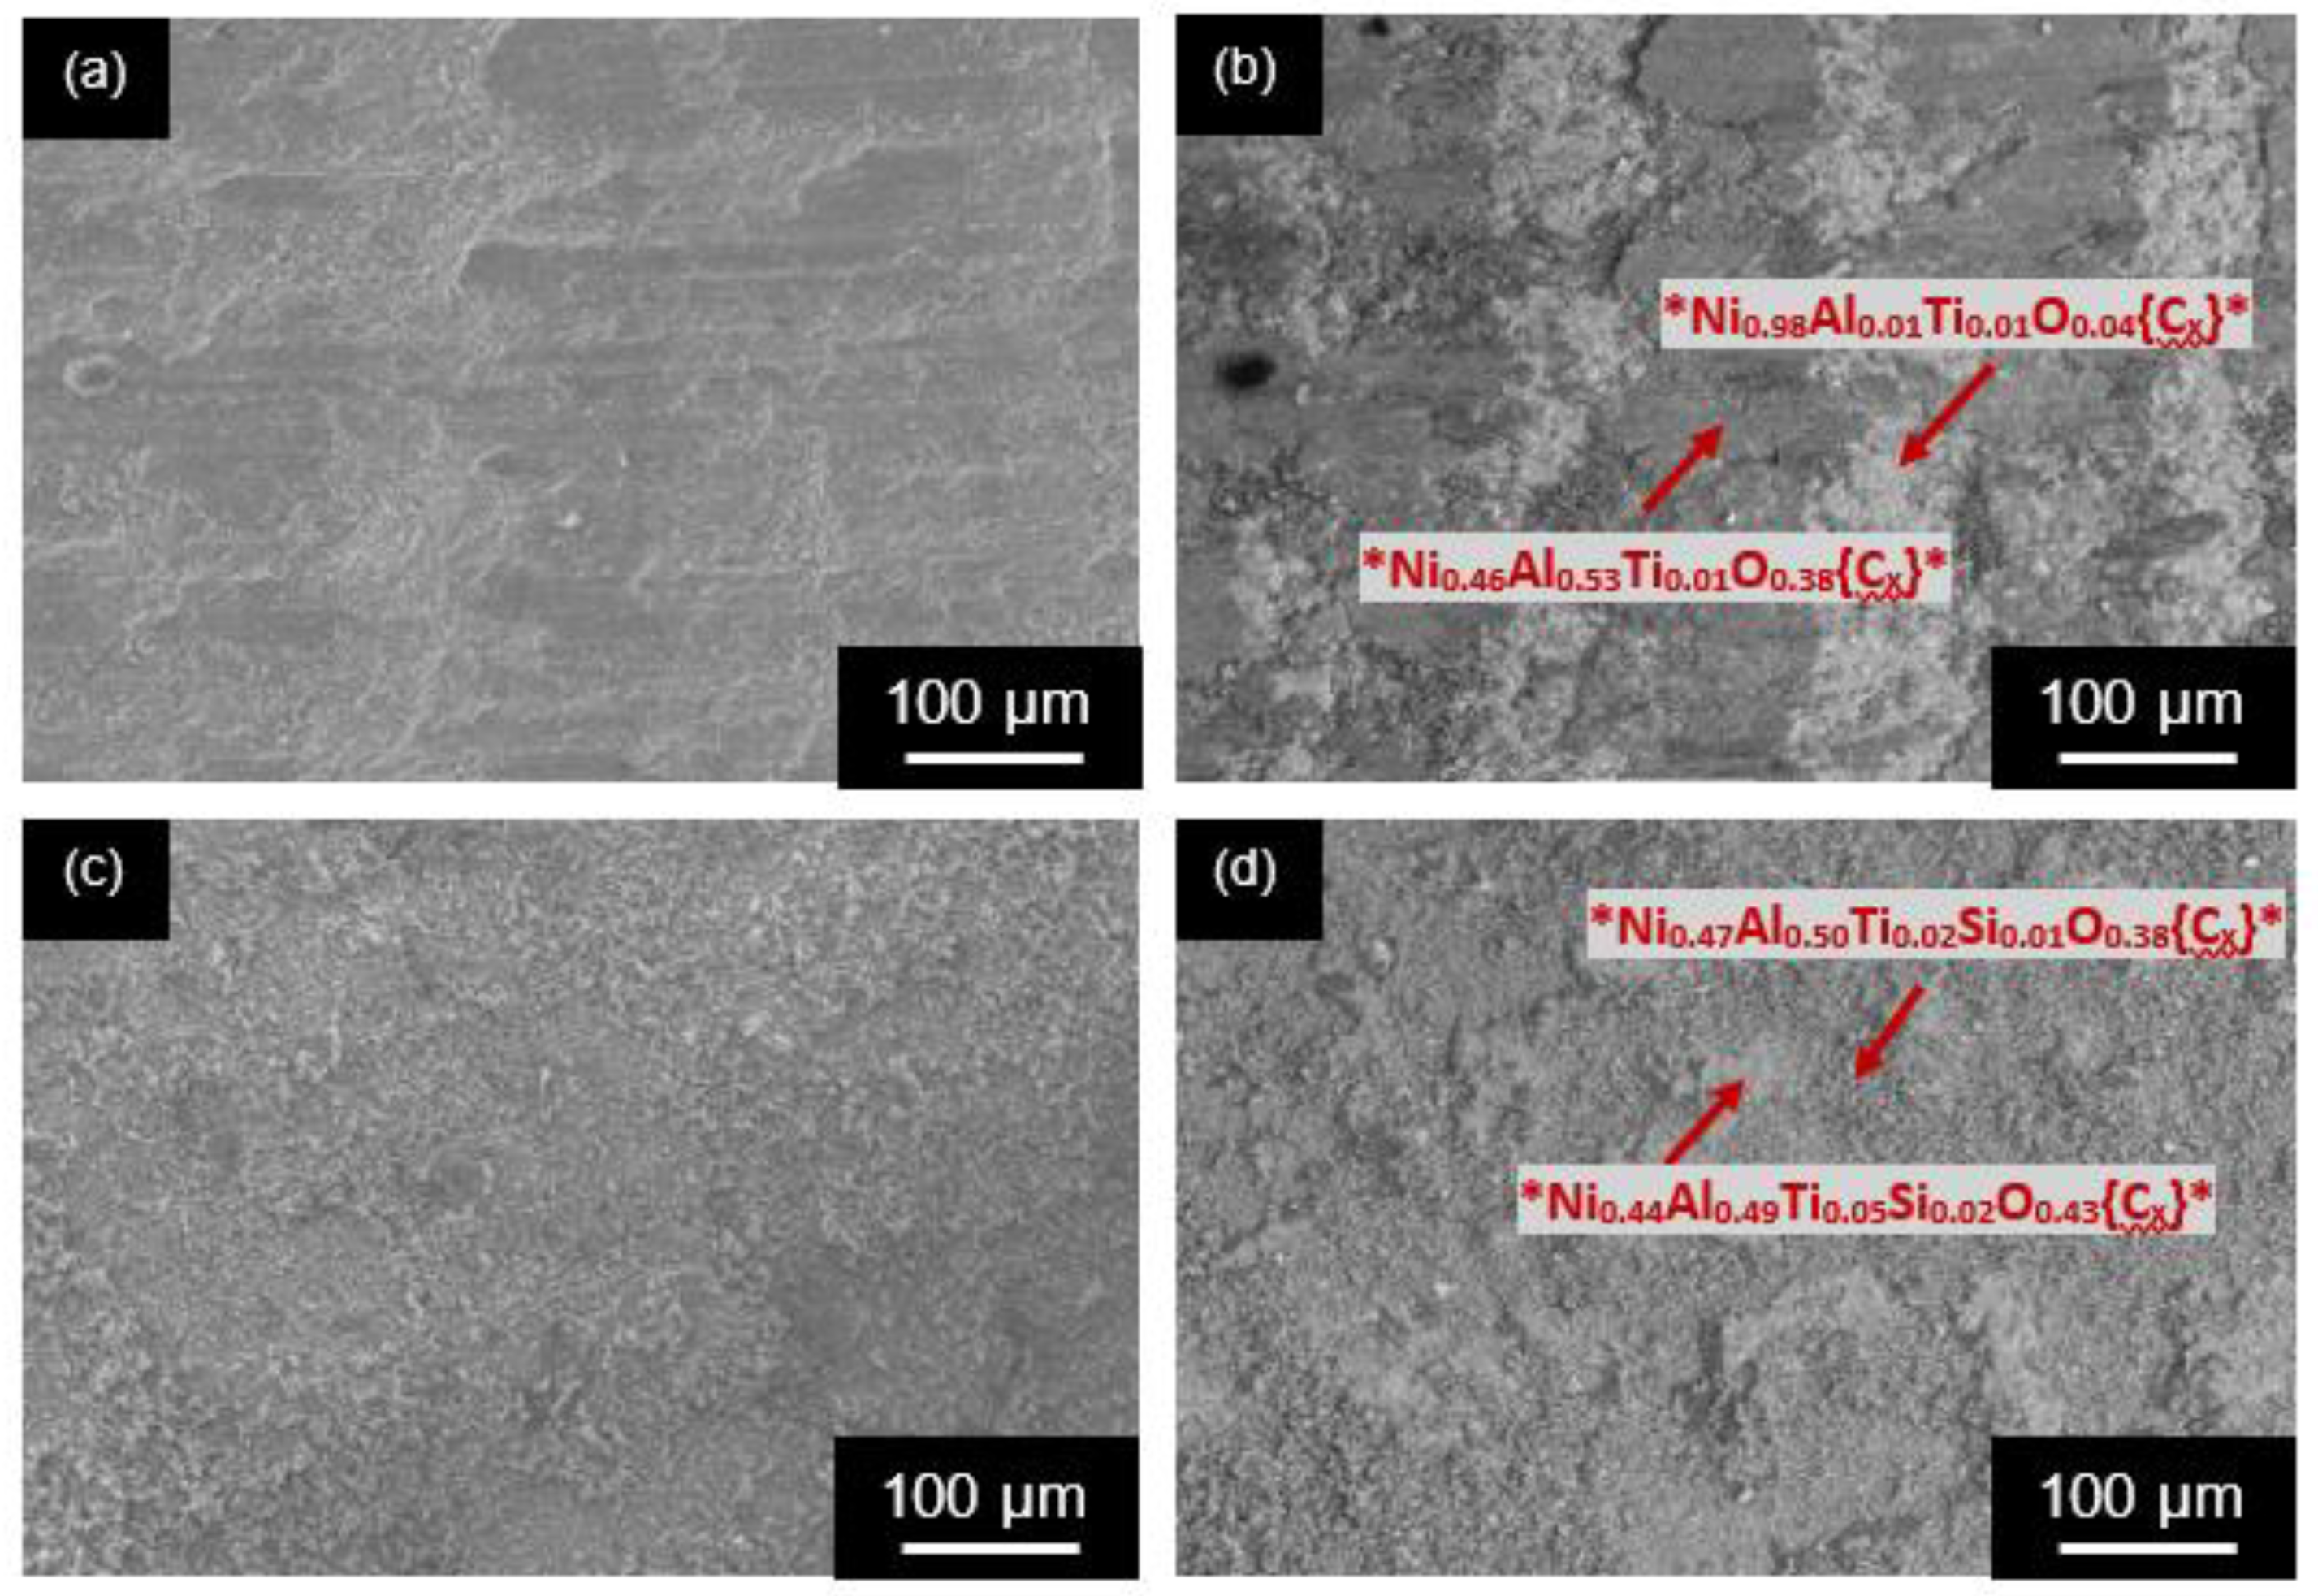
3.1. Microstructure Analysis

Figure 4 shows the microstructures of Ni-10%Ti3SiC2/Ni (100 µm) (Figure 4a,b), Ni-20%Ti3SiC2/Ni (100 µm) (Figure 4c,d), and Ni-40%Ti3SiC2/Ni (100 µm) (Figure 4e,f) composites. In all cases, Ti3SiC2 particulates were well dispersed in the Ni-layers and the layers were uniform in thickness, although interparticle porosity was observed. In addition, there was no reaction between Ni and Ti3SiC2 phases. Ni-20%Ti3SiC2/Ni (20 µm) (Figure 5a,b) and Ni-20%Ti3SiC2/Ni (200 µm) (Figure 5c,d) also showed similar microstructures. However, the introduction of Al (Type II) as an interleaving layer between Ni–Ti3SiC2 and Ni in the composite matrix caused interfacial reaction at the interfacial boundary between Ni and Al (Figure 6). Like Ni–Ti3SiC2/Ni multilayered composites, Ti3SiC2 particulates were uniformly dispersed in the Ni-matrix and pores were observed in the multilayers.

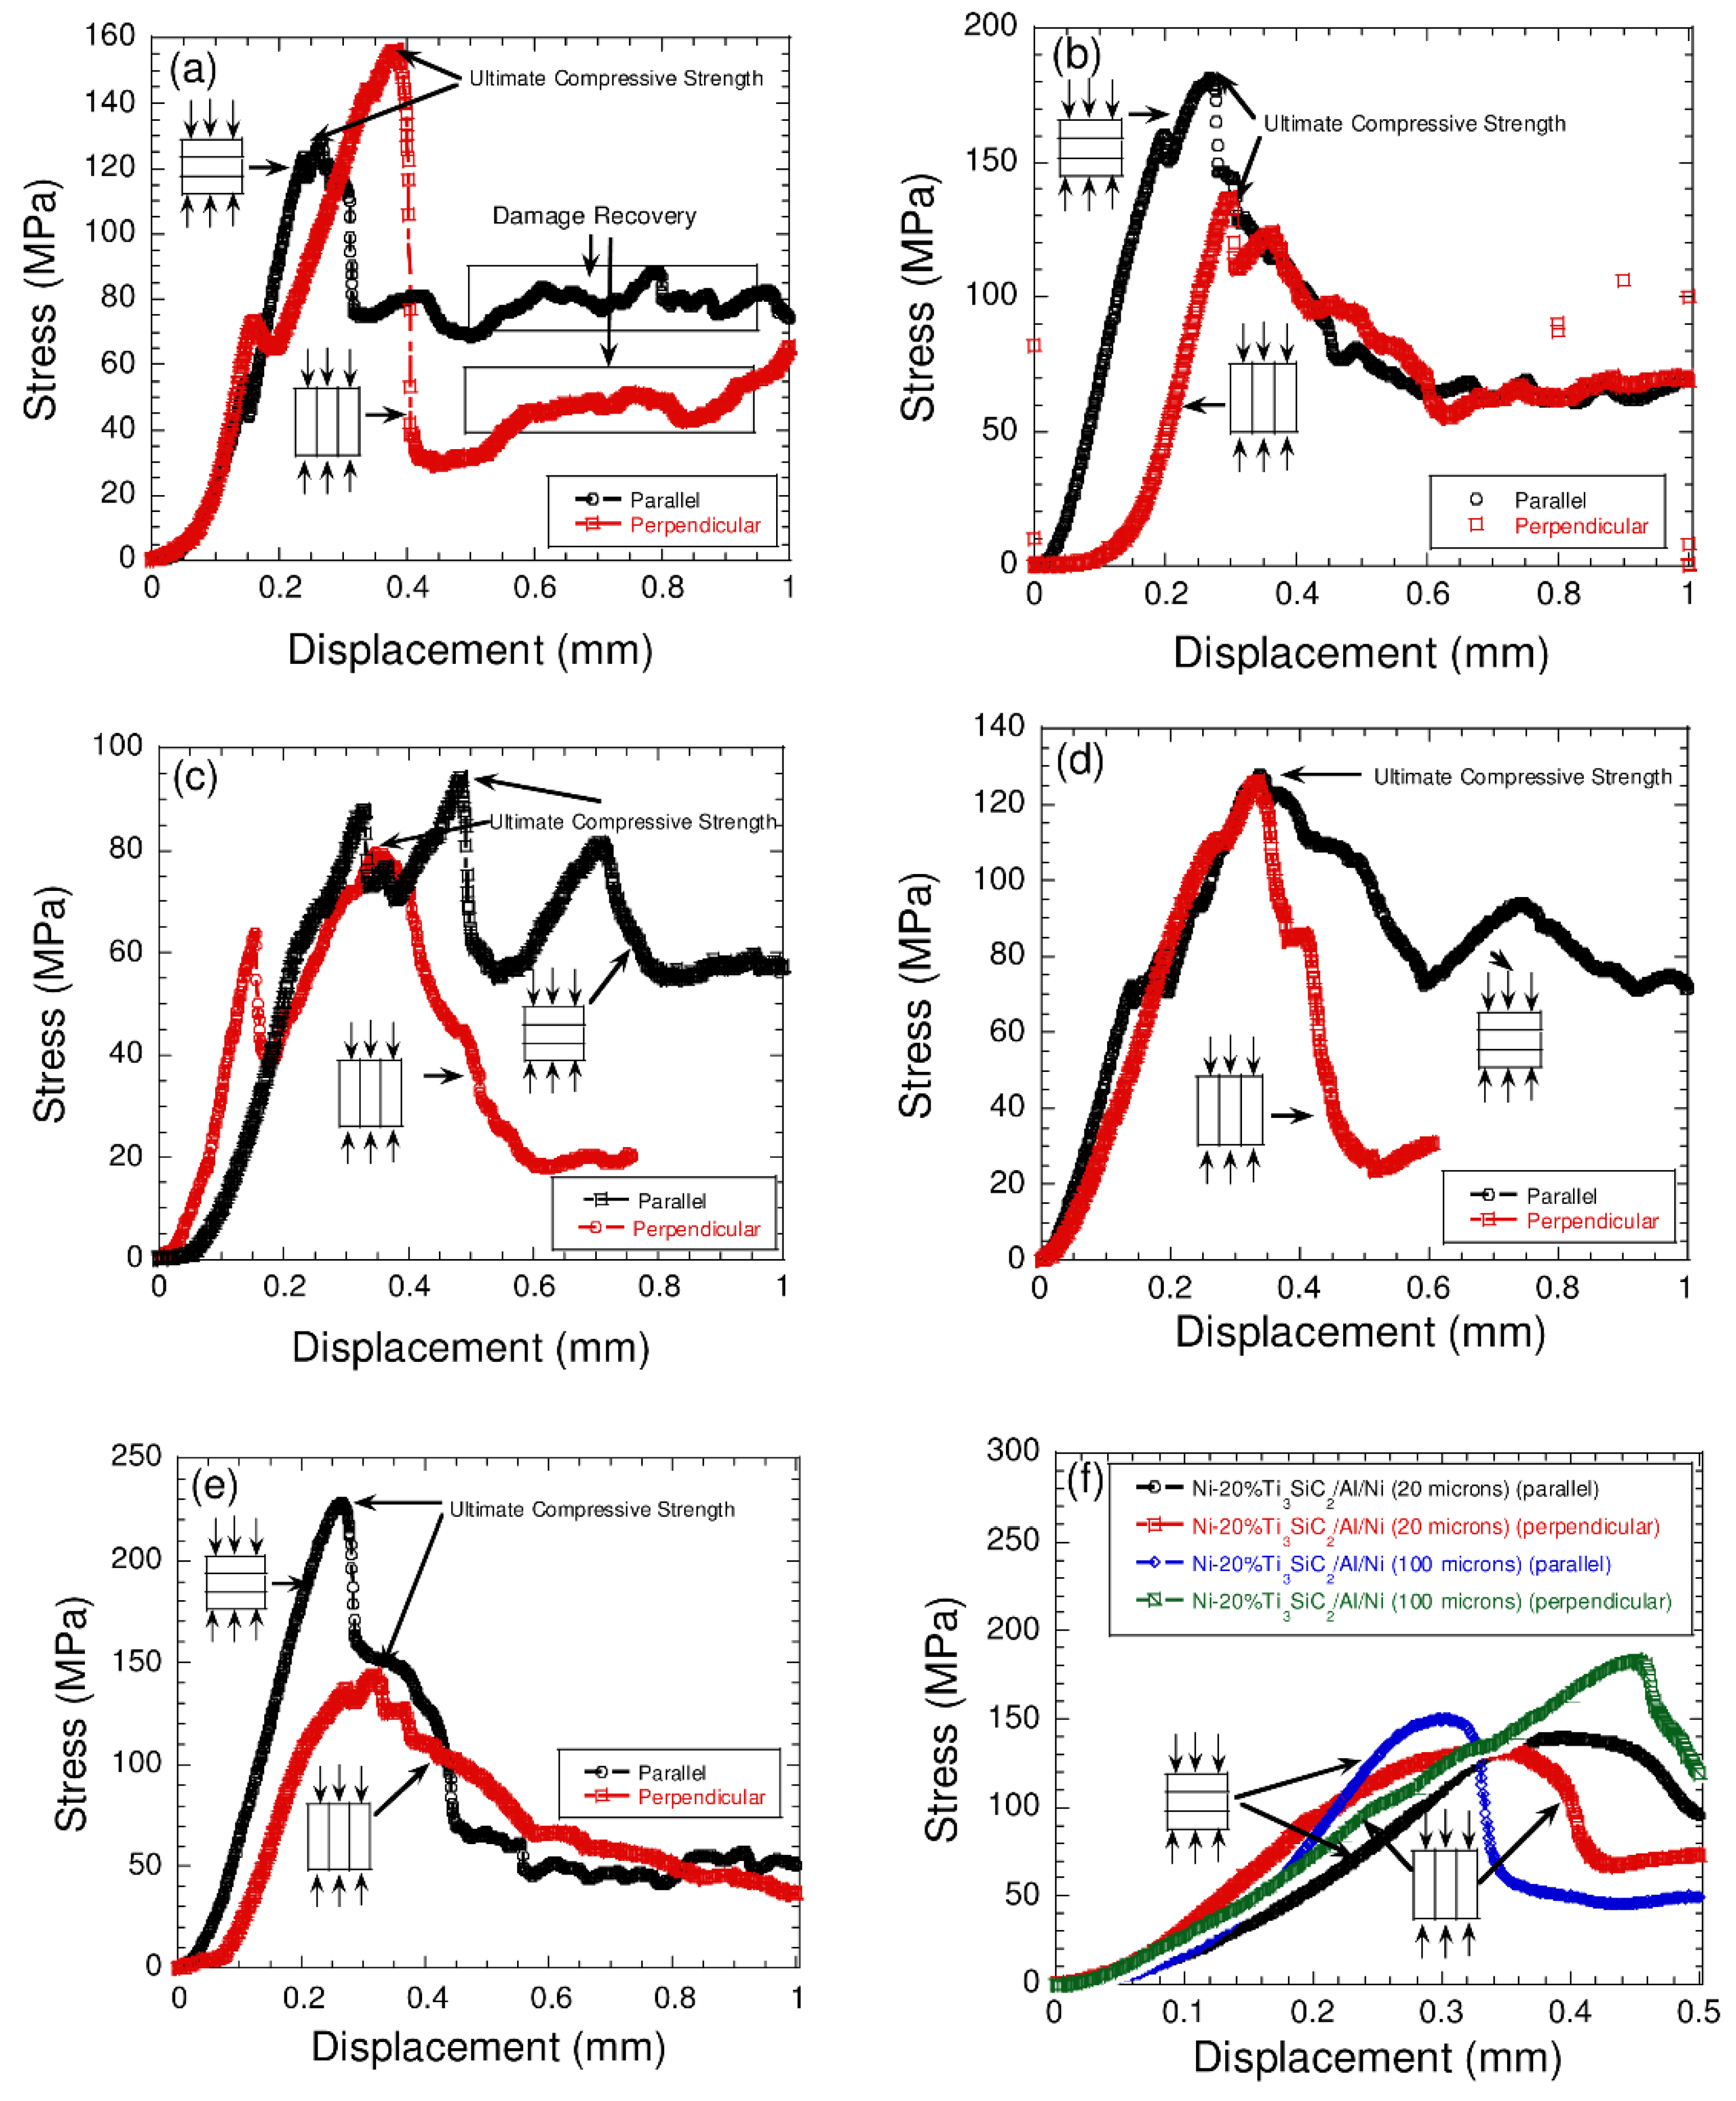
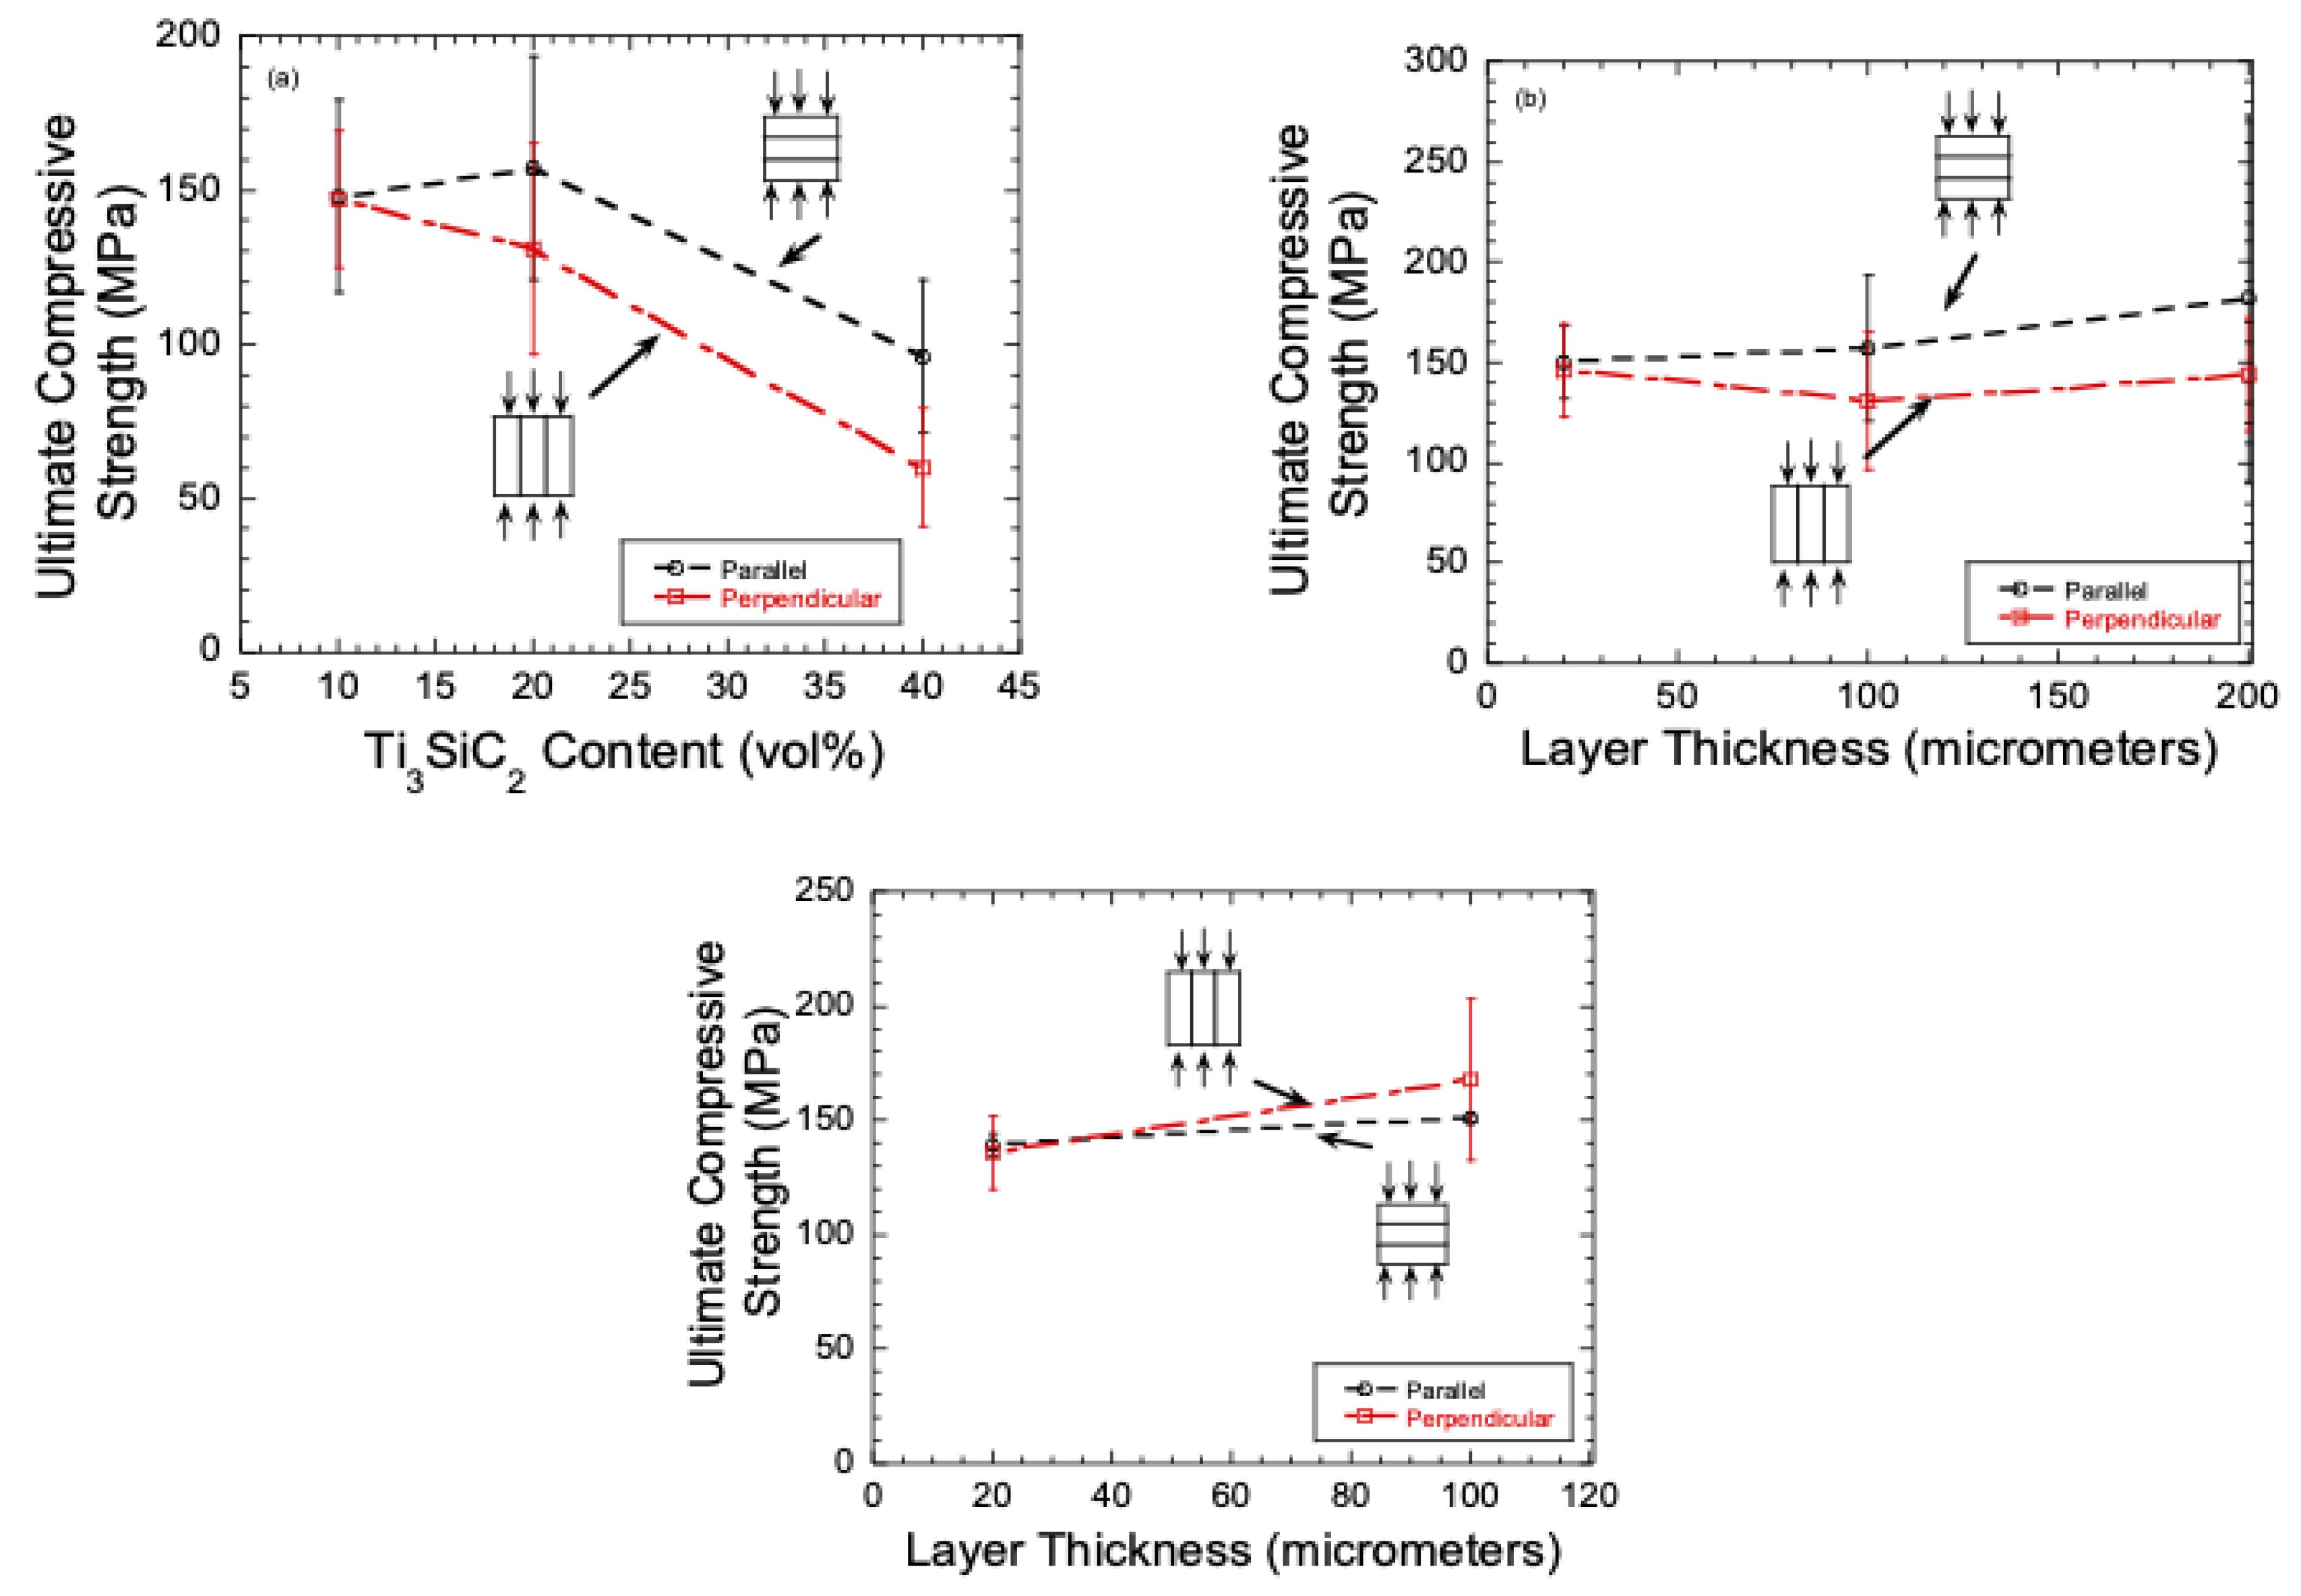
3.2. Mechanical Performance of Ni-Matrix Composites

Table 2 summarizes the porosity of multilayered samples. For example, Ni-10%Ti3SiC2/Ni (100 µm) samples were ~37.6% porous compared to ~32.4% porosity in Ni-40%Ti3SiC2/Ni (100 µm) compositions. In general, (Ni-20%Ti3SiC2/Ni) (Al) (Ni) based compositions showed lower porosity due the presence of Al, which helped in densification. The usage of a high binder during tape casting and low processing temperatures can explain the porous nature of these samples.
Figure 7 shows the representative plots of stress versus displacement experiments for all the composites. The Ni–Ti3SiC2/Ni composites showed, in both directions, ductile and gradual failure with some signs of damage recovery. In general, the failure was gradual, although in some cases samples failed rapidly in the perpendicular direction as compared to the parallel direction (Figure 7c,d). This may be attributed to the presence of lamellar defects and/or porosity during the manufacturing process. In the type II composites (Figure 7f), the addition of Al into the composite matrix caused the composites to become ductile, and the failure was gradual in both orientations.
Figure 8 shows the ultimate compressive strength (UCS) of all the tested composites. In Type-I composites (Figure 8a), the UCS marginally increased in Ni-20%Ti3SiC2/Ni (100 µm) to ~157 MPa as compared to ~148 MPa in Ni-10%Ti3SiC2/Ni (100 µm) in parallel orientation; thereafter, the UCS decreased in Ni-40%Ti3SiC2/Ni (100 µm) to ~96 MPa, whereas in the perpendicular orientation, the UCS decreased gradually from ~147 MPa in Ni-10%Ti3SiC2/Ni (100 µm) to ~60 MPa in Ni-40%Ti3SiC2/Ni (100 µm). The UCS of these composites was sensitive to Ti3SiC2 content, and it decreased as the concentration of Ti3SiC2 was increased in the composites. Comparatively, the decrease in strength with the increase in Ti3SiC2 content was more prominent in perpendicular orientation as compared to the parallel direction, which may be due to the weak interlaminar bonding and/or defects between the multilayers.
In another study, the concentration of Ti3SiC2 in Type-I composites was fixed at 20 vol %, and the layer thickness was varied from 20 µm to 200 µm in Ni–Ti3SiC2/Ni composites. The UCS increased from ~150 MPa to ~182 MPa in the parallel direction, whereas in the perpendicular direction, the UCS was slightly lower but the samples had similar strength, for example ~146 MPa and ~144 MPa in Ni-20%Ti3SiC2/Ni (20 µm) and Ni-20%Ti3SiC2/Ni (200 µm), respectively (Figure 8b). This study shows that the UCS increased in the parallel orientation but retained lower and similar strength values in the perpendicular orientation as the laminate thickness was increased from 20 µm to 200 µm, which further supports the hypothesis that the laminates are weekly bonded and/or defects are present between the multilayers.
In Type-II composites (Figure 8c), where the concentration of Ti3SiC2 was fixed at 20 vol % in the laminates (Table 1), the UCS increased from ~139 MPa to ~151 MPa, and from ~136 MPa to ~168 MPa in parallel and perpendicular orientations, respectively, as the layer thickness was increased from 20 µm to 100 µm. Unlike Type-I composites, this study shows that the UCS was greater in perpendicular orientation as compared to parallel due to the presence of Al as bonding layers. In addition, UCS also increased for both orientations as the laminate thickness was increased from 20 µm to 100 µm. Like Type I composites, this observation also supports the hypothesis that the laminates are weakly bonded and/or defects are present between the multilayers as UCS was lower in samples with finer laminate thickness.

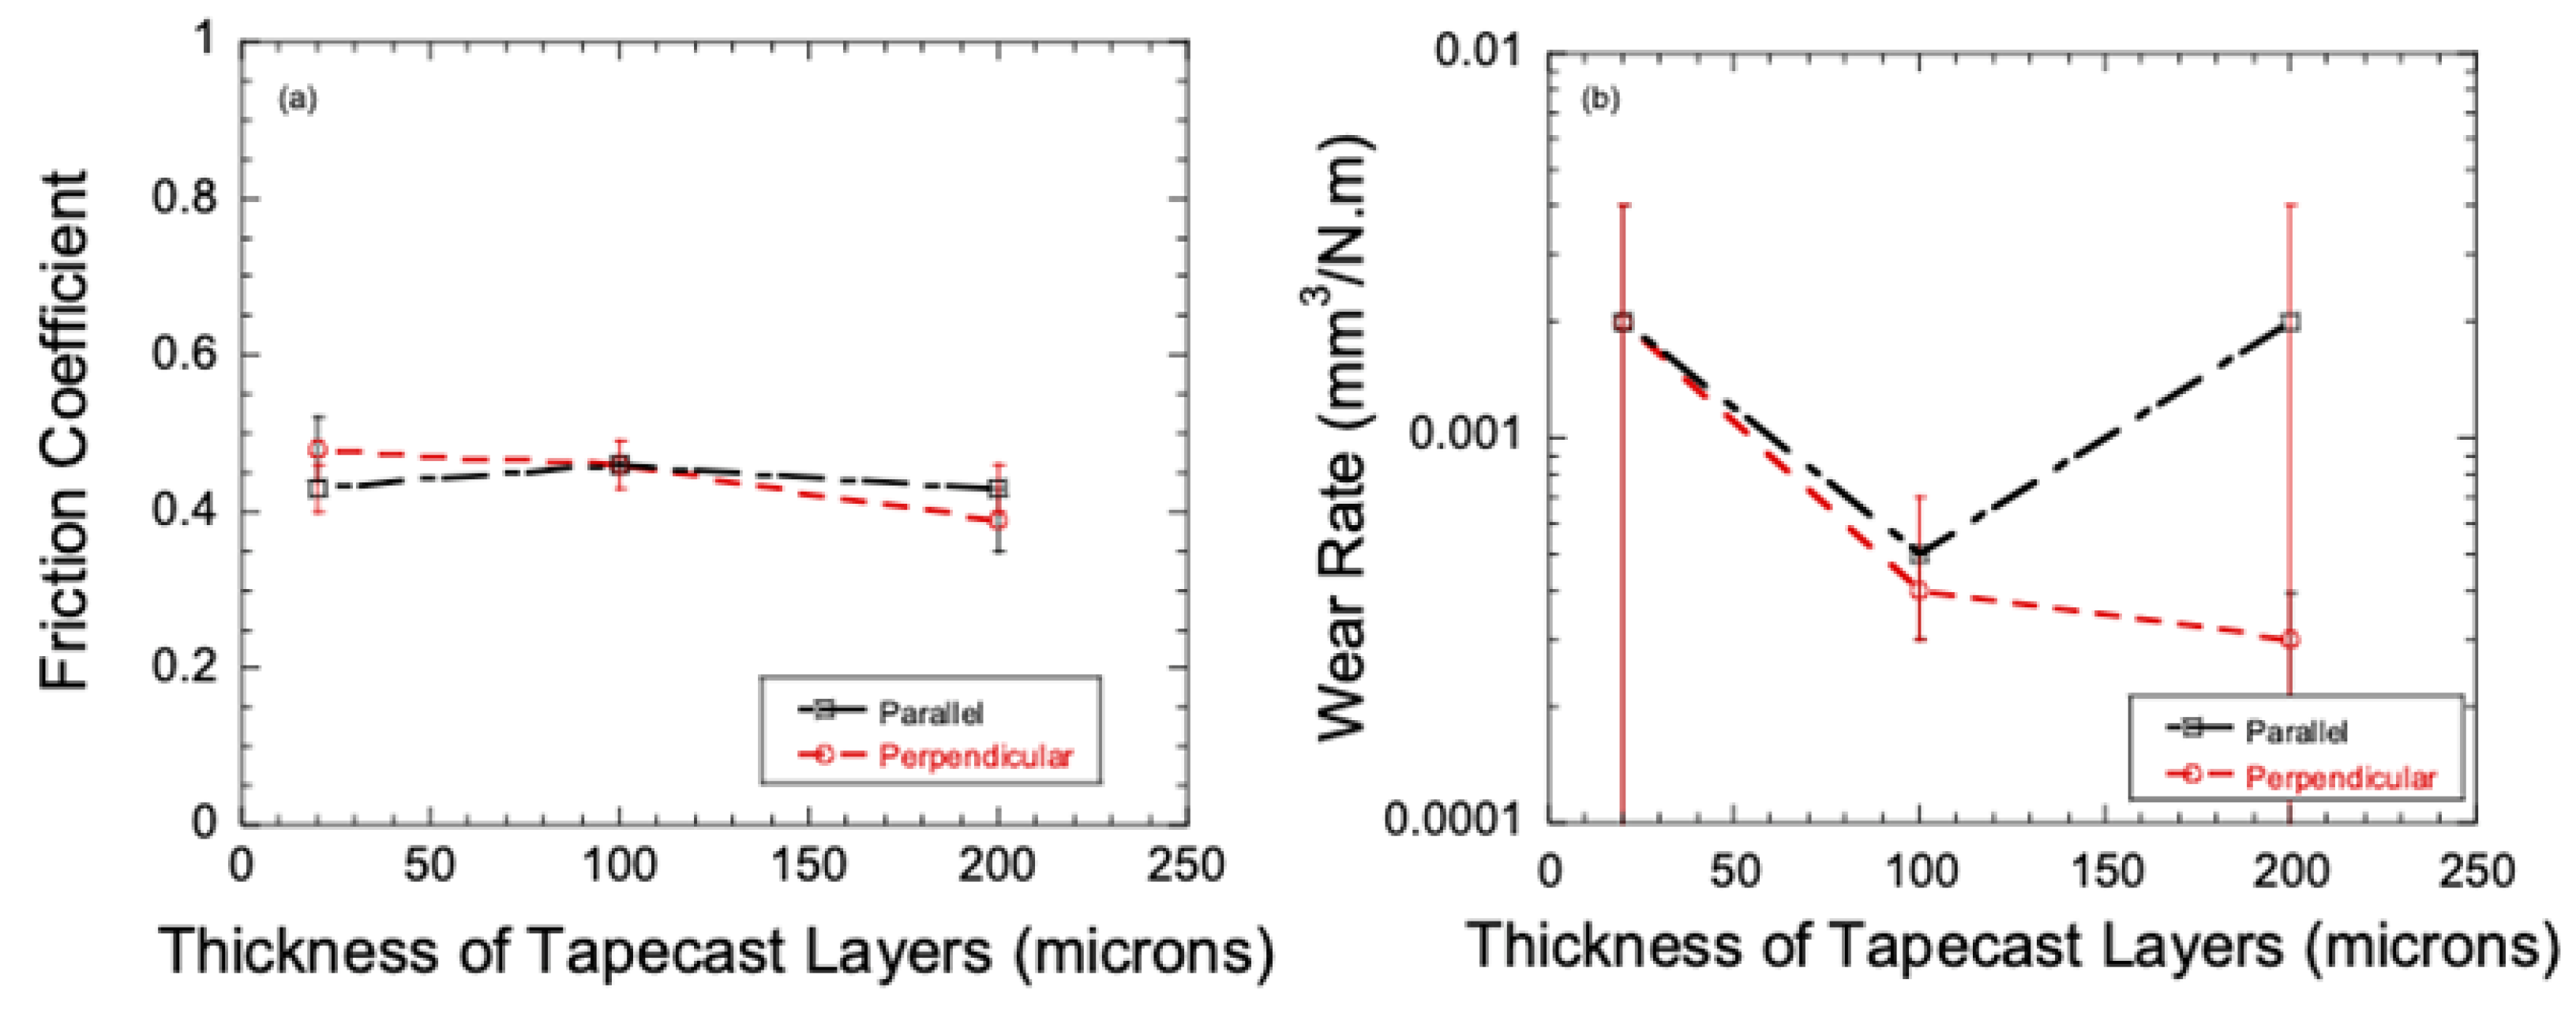
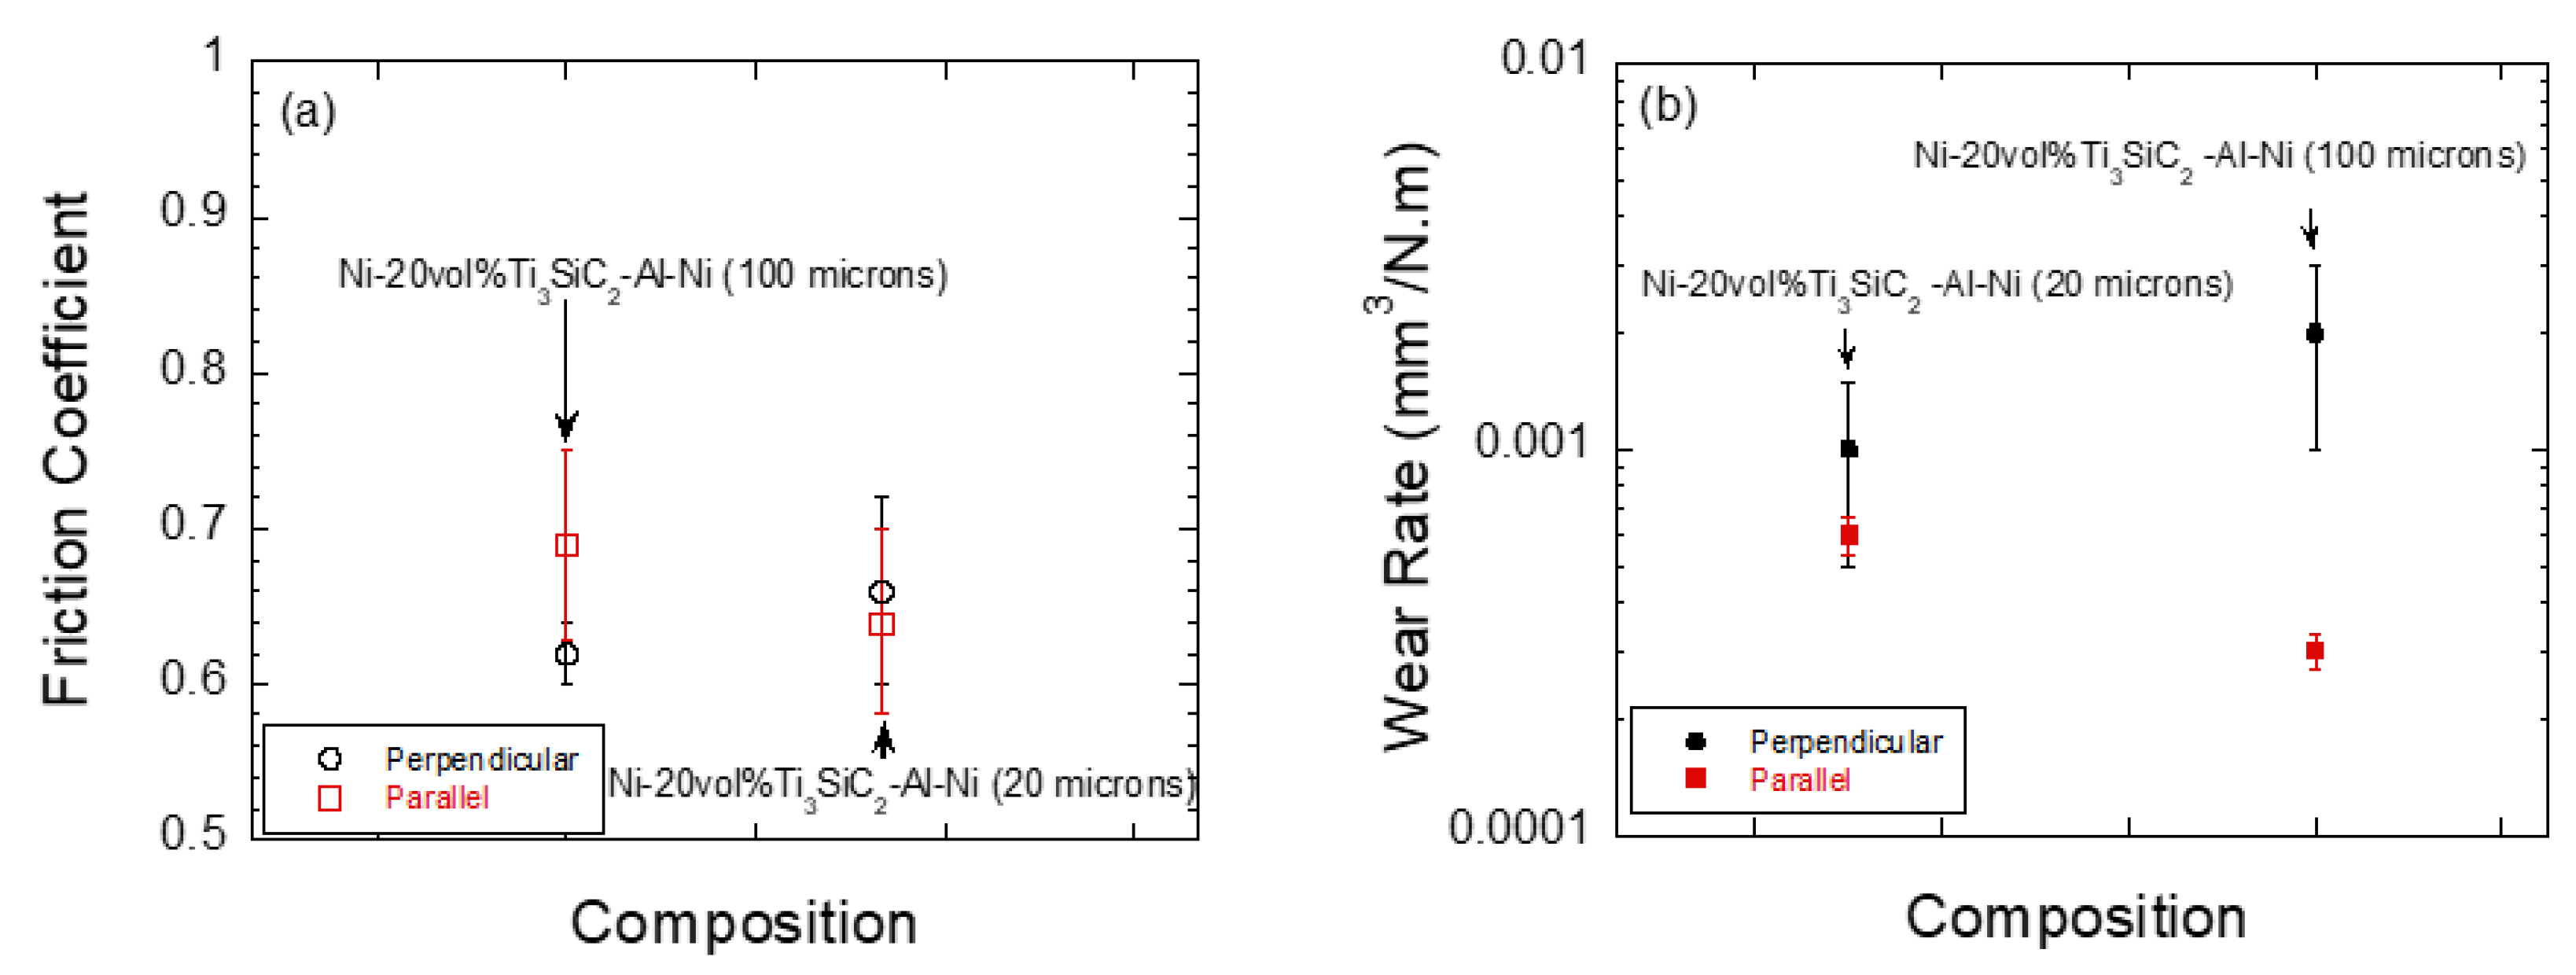
3.3. Tribological Behavior of Ni–Ti3SiC2 Composites

Figure 9 shows the plot of µ and WR in Ni-20%Ti3SiC2/Ni (Type I) composites. As the laminate thickness was increased from 20 to 100 µm, the μ slightly increased in the parallel direction from ~0.43 to ~0.46; thereafter, it decreased to ~0.43 when the layer thickness was further increased to 200 µm. However, in the perpendicular direction, the same composites showed a steady decline in μ from ~0.46 to ~0.39 when the layer thickness was varied from ~20 µm to ~200 µm, respectively.
In the parallel orientation, the WR decreased from ~2 × 10⁻³ mm3/Nm in Ni-20%Ti3SiC2/Ni (20 µm) to ~5 × 10⁻⁴ mm3/Nm in Ni-20%Ti3SiC2/Ni (100 µm), but then sharply increased to ~2 × 10⁻³ mm3/Nm in Ni-20%Ti3SiC2/Ni (200 µm). The WR decreased by one order of magnitude from ~2 × 10⁻³ mm3/Nm in Ni-20%Ti3SiC2/Ni (20 µm) to ~4 × 10⁻⁴ mm3/Nm in Ni-20%Ti3SiC2/Ni (100 µm) and ~3 × 10⁻⁴ mm3/Nm in Ni-20%Ti3SiC2/Ni (200 µm), respectively, in the perpendicular orientation. By analyzing the µ and WR, the following points can be summarized: (a) the decrease in µ and WR was more pronounced in the perpendicular orientation, as it was easier to supply solid lubricants from individual layers as compared to parallel orientations where the interleaving layers were Ni; and (b) tribological behavior showed sensitivity to laminate thickness; for example, Ni-20%Ti3SiC2/Ni (100 µm) showed optimum WR in both orientations.
Figure 10 summarizes the µ and WR of Ni–Ti3SiC2/Ni (100 µm) composites against alumina disks as compared to the monolithic Ni–Ti3SiC2, and Ni–MoAlB disks against stainless steel and alumina balls [20,21] (please note, tribological results are dependent on testing parameters; hence the results are for qualitative comparison). During both orientations, the multilayered composites had lower µ than the monolithic Ni–Ti3SiC2 and Ni–MoAlB. To summarize, in the perpendicular orientation, the µ increased from ~0.43 to ~0.50 as the Ti3SiC2 content was increased from 10 to 40 vol % (Figure 10a), and the WR decreased marginally from ~0.0006 mm3/Nm to ~0.0003 mm3/Nm (Figure 10b). In the parallel orientation, the µ increased from ~0.39 to ~0.41, and the WR decreased from ~0.0006 mm3/Nm to ~0.0003 mm3/Nm as the Ti3SiC2 content was increased from 10 to 40 vol %, respectively. In both orientations, Ti3SiC2 content was effective in decreasing the WR marginally, but µ was marginally increased. Follow up studies are needed to understand the effect of texture and porosity on the tribological behavior of these composites.
Figure 11 shows the plot of µ and WR of Ni–Ti3SiC2/Al/Ni multilayered composites. The plot shows that there was an increase in µ due to the addition of interleaving Al-layers as compared to Type-I composites. The WR also increased from ~0.001 mm3/Nm to ~0.002 mm3/Nm in the perpendicular direction as the layer thickness was increased from 20 µm to 100 µm, respectively. However, in the parallel orientation, the WR decreased from ~0.0006 mm3/Nm to ~0.0003 mm3/Nm as the layer thickness was increased from 20 µm to 100 µm, respectively. This behavior was different from Type-I (Ni–Ti3SiC2/Ni) composites where the perpendicular orientation was more effective in enhancing the triboactive performance as the laminate thickness was changed systematically.
The possible reason is that the Al-layers were more effective in shearing during parallel orientation as compared to the perpendicular orientation, which could cause a lower WR. In addition, the overall concentration of Ti3SiC2 in the Ni-20%Ti3SiC2/Al/Ni (20 or 100 µm) was lower than the effective Ti3SiC2 concentration in Ni-20%Ti3SiC2/Ni composites; thus, less amount of solid lubricant was available during sliding in the perpendicular orientation (Table 1).
Figure 12a–d show the Ni-20%Ti3SiC2/Ni (100 µm) composite and alumina surfaces after tribological testing in the parallel orientation. On both surfaces, there were signs of abrasive and oxidative wear. For example, the tribosurface of Ni-20%Ti3SiC2/Ni (100 µm) was partially oxidized (*NiO0.03{Cx}*), Figure 12b) and powdered wear debris (*Ni0.96Ti0.03Si0.01O0.027{Cx}*, Figure 12d) was observed on the alumina surface, respectively. Similarly, Figure 13a–d show the Ni-20%Ti3SiC2/Ni (100 µm) composite in the perpendicular direction. Similar oxidative tribochemical reactions and powdered/smeared wear debris were observed on these surfaces too. Figure 14 and Figure 15 show Ni-20%Ti3SiC2/Al/Ni (100 µm) (Type II) composite in both parallel and perpendicular orientations after testing, respectively. All the surfaces showed signs of heavy abrasive and oxidative wear. Clearly, the formation of oxidized tribofilms played an important role in the tribological behavior of these composites. More studies are needed to understand the correlation between tribofilm formation and tribological behavior in these composites.

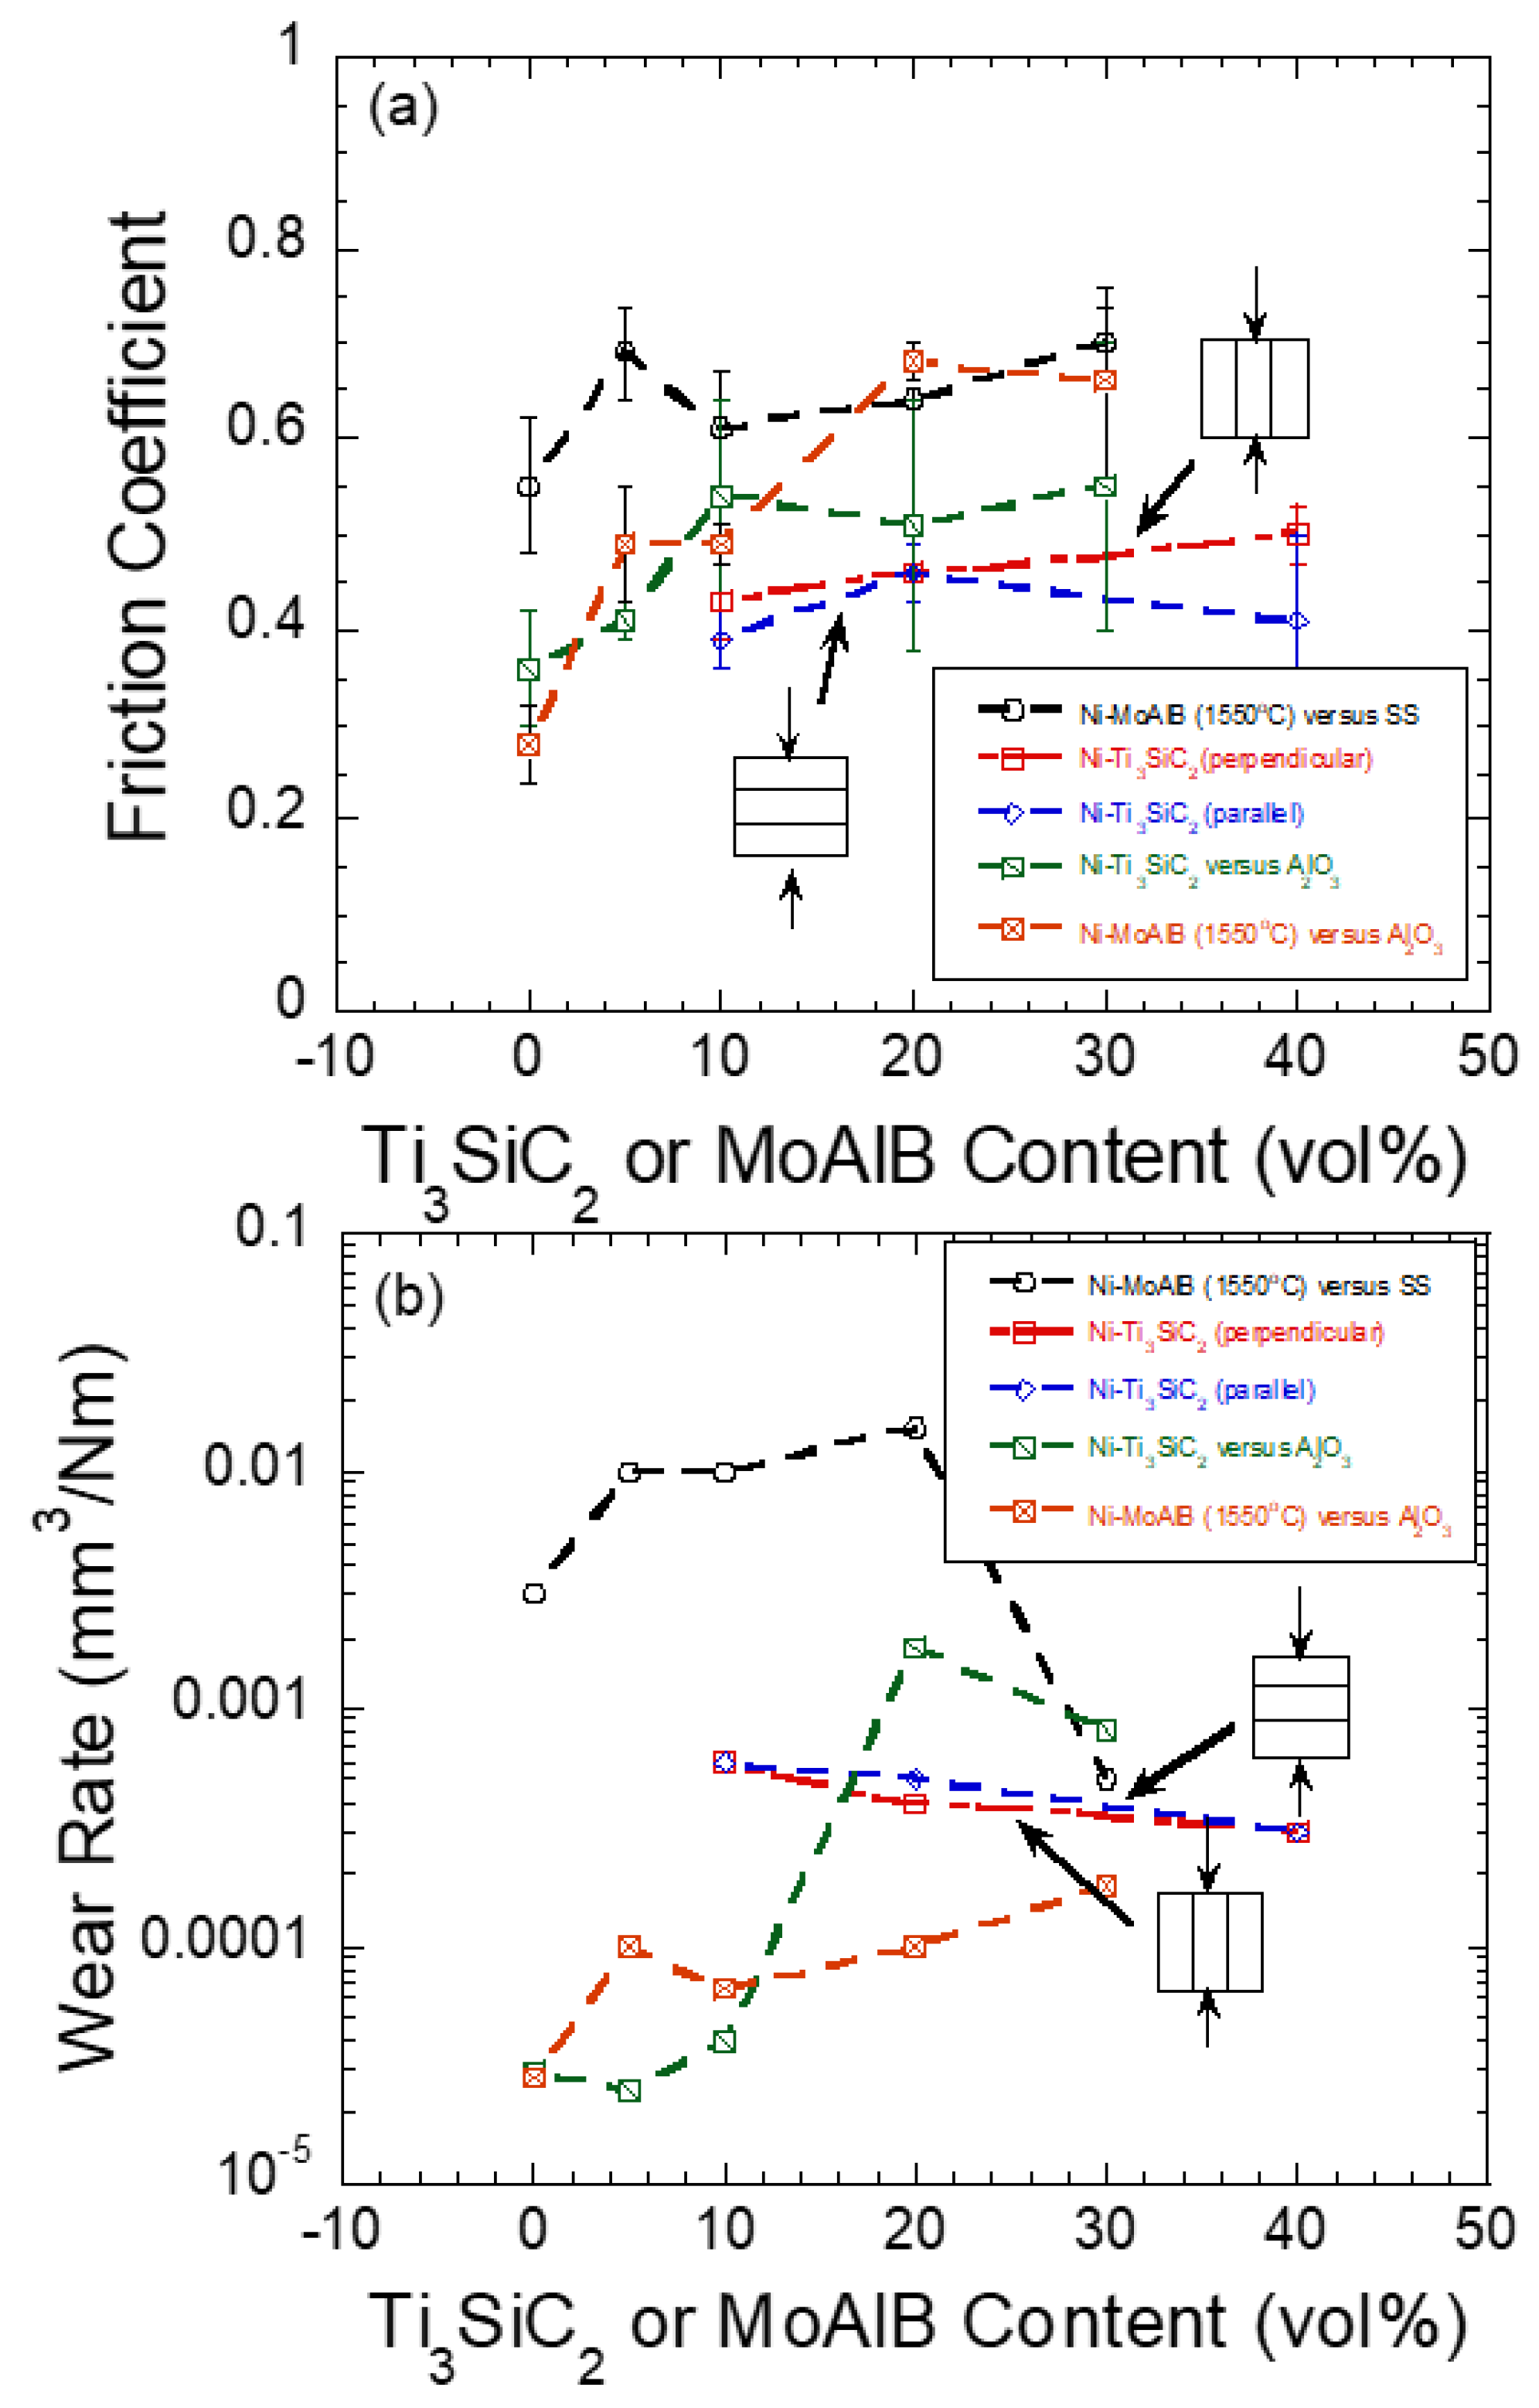
3.4. Comparison with Other Solid Lubricants

Single component solid lubricants like MnS and graphite are very promising for different wear resistant applications [27,28]. However, they cannot be used in high temperature applications due to issues like oxidation, matrix evaporation, etc. For high performance applications, Ni-based binary compositions have been studied; for example, the WR of NiCr–Al2O3 composites varied in the range of (1–2) × 10−4 mm3/Nm at RT as the Al2O3 content in NiCr was varied from 20 to 60 wt %, but the friction coefficient was relatively high (0.7–0.8) in all the compositions during testing by ball-on-disk method [29]. In order to further enhance the tribological behavior of Ni-based compositions, multicomponent Ni-based solid lubricants have been studied. For example, Dellacorte et al. [30,31] developed PS-300 (NiCr–Cr2O3 (80.3 vol %), Ag (5.5 vol %), CaF2/BaF2 (14.2 vol %)) and PS-400 ((NiMoAl (70 wt %)–Cr2O3 (20 wt %)Ag (5 wt %)–BaF2/CaF2(5 wt %))) coating. These materials have shown promise, and the WR was in the range of 10−3–10−4 mm3/Nm during testing at room temperature [30,31]. Similarly, other multicomponent solid lubricant systems like ZrO2 (Y2O3)–Mo–BaF2/CaF2 composites have also been studied with WR in the range of 10−4 mm3/Nm [32]. From the perspective of reproducibility, large scale commercialization, and rapid deployment, it is vital to design simpler compositions that can be manufactured easily. By fabricating composites from multilayers, it is possible to tailor the microstructure while keeping the composition simpler. The present research shows that the multilayered Ni-based composites offer us a new design paradigm for fabricating effective solid lubricants by using only binary constituents.

4. Conclusions

In this paper, two different types of laminate design were successfully synthesized: (a) Composite layers of Ni and Ti3SiC2 (Ni–Ti3SiC2) were interleaved with Ni (Figure 1a, Type-I composites), and (b) Ni–Ti3SiC2 layers were interleaved with Al and Ni (Figure 1b, Type-II composites). Detailed SEM studies showed that Ti3SiC2 particulates were well distributed in the Ni-matrix with little or no interfacial reactions along with the presence of interparticle porosity. However, there were interfacial reactions between Ni and Al in Type II composites.
Type I (Ni–Ti3SiC2/Ni) multilayered composites had higher UCS in parallel orientation as compared to perpendicular orientation. Most likely the presence of interlaminar defects and/or weak interlaminar bonding can account for this observation. Comparatively, in Type II (Ni–Ti3SiC2/Al/Ni) composites, the UCS was greater in the perpendicular orientation as compared to the parallel due to the presence of interleaving Al as bonding layers, which are effective in increasing the UCS of these materials.
In Type I (Ni–Ti3SiC2/Ni) composites, (a) the decrease in µ and WR was more pronounced in perpendicular orientation as it much easier to supply solid lubricants from individual layers compared to parallel orientations where the interleaving layers are Ni, and (b) tribological behavior showed sensitivity to laminate thickness; for example, Ni-20%Ti3SiC2/Ni (100 µm) showed optimum WR in both orientations. Comparatively, Type II (Ni–Ti3SiC2/Al/Ni) composites showed that the parallel orientation was more effective in enhancing the triboactive performance. Most probably, Al-layers are more effective in shearing during parallel orientation as compared to the perpendicular orientation, which can cause a lower WR in these composites. In addition, the overall concentration of Ti3SiC2 in Type-II is lower than the effective Ti3SiC2 concentration in Type-I composites; thus, a lesser amount of solid lubricant is available during the perpendicular orientation.

Author Contributions

Conceptualization, Q.T. and S.G.; methodology, Q.T. and S.G.; validation, Q.T., M.F., M.D. and S.G.; formal analysis, Q.T., M.F., M.D. and S.G.; investigation, Q.T., M.F., M.D. and S.G.; resources, Q.T., M.F., M.D. and S.G.; data curation, Q.T., M.F., M.D. and S.G.; writing—original draft preparation, Q.T., M.F., M.D. and S.G.; writing—review and editing, Q.T., M.F., M.D. and S.G.; supervision, S.G.; project administration, S.G.; funding acquisition, S.G.

Funding

CRADA with Army Research Labs (ARL) and University of North Dakota is acknowledged for support.

Acknowledgments

Caleb Matzke is acknowledged for performing mechanical testing.

Conflicts of Interest

The authors declare no conflict of interest.

References

  1. Munch, E.; Launey, M.E.; Alsem, D.H.; Saiz, E.; Tomsia, A.P.; Ritchie, R.O. Tough, bio-Inspired Hybrid Materials. Science 2008, 322, 1516–1520. [Google Scholar] [CrossRef] [PubMed] [Green Version]
  2. Askarinejad, S.; Rahbar, N. Mechanics of Bioinspired Lamellar structured ceramic/polymer Composites: Experiments and Models. Int. J. Plast. 2018, 107, 122–149. [Google Scholar] [CrossRef]
  3. Salehinia, I.; Shao, S.; Wang, J.; Zbib, H.M. Plastic Deformation of Metal/Ceramic Nanolayered Composites. JOM 2014, 66, 2078–2085. [Google Scholar] [CrossRef]
  4. Clegg, W.J.; Kendall, K.; Alford, N.M.; Button, T.W.; Birchall, J.D. A simple way to make tough ceramics. Nature 1990, 347, 455–457. [Google Scholar] [CrossRef]
  5. Prikhna, T.A.; Dub, S.N.; Starostina, A.V.; Karpets, M.V.; Cabiosh, T.; Chartier, P. Mechanical Properties of Material Based on MAX Phases of the TI-Al-C System. J. Superhard Mater. 2012, 34, 102–109. [Google Scholar] [CrossRef]
  6. Barsoum, M.W.; Radovic, M. Elastic and Mechanical Properties of the MAX Phases. Annu. Rev. Mater. Res. 2011, 41, 195–197. [Google Scholar] [CrossRef]
  7. Barsoum, M.W. The Mn+1AXn Phases: A New Class of Solids; Thermodynamically Stable Nanolaminates. Prog. Solid State Chem. 2000, 28, 201–281. [Google Scholar] [CrossRef]
  8. Barsoum, M.W.; El-Raghy, T. Synthesis and Characterization of Remarkable Ceramic, Ti3SiC2. J. Am. Ceram. Soc. 1996, 79, 1953–1956. [Google Scholar] [CrossRef]
  9. Amini, S.; Barsoum, M.W.; El-Raghy, T. Synthesis and Mechanical Properties of Fully Dense Ti2SC. J. Am. Ceram. Soc. 2007, 90, 3953–3958. [Google Scholar] [CrossRef]
  10. Zhang, Y.; Sun, Z.M.; Zhou, Y.C. Cu/Ti3SiC2 Composites: A New Electrofriction Material. Mater. Res. Innov. 1999, 3, 80–84. [Google Scholar] [CrossRef]
  11. Anasori, B.; El’ad, N.C.; Barsoum, M.W. Fabrication and mechanical properties of pressureless melt infiltrated magnesium alloy composites reinforced with TiC and Ti2AlC particles. Mater. Sci. Eng. A 2014, 618, 511–522. [Google Scholar] [CrossRef]
  12. Gupta, S.; Barsoum, M.W. On the Tribology of the MAX Phases and Their Composites During Dry Sliding: A Review. Wear 2011, 271, 1878–1894. [Google Scholar] [CrossRef]
  13. Gupta, S.; Filimonov, D.; Palanisamy, T.; El-Raghy, T.; Barsoum, M.W. Ta2AlC and Cr2AlC Ag-based Composites: New Solid Lubricant Materials for use Over a Wide Temperature Range Against Ni-Based Superalloys and Alumina. Wear 2007, 262, 1479–1489. [Google Scholar] [CrossRef]
  14. Wang, W.J.; Gauthier-Brunet, V.; Bei, G.P.; Laplanche, G.; Bonneville, J.; Joulain, A.; Dubois, S. Powder Metallurgy Processing and Compressive Properties of Ti3AlC2/Al Composites. Mater. Sci. Eng. A 2011, 530, 168–173. [Google Scholar] [CrossRef]
  15. Hu, L.; O’Neil, M.; Erturun, V.; Benitez, R.; Proust, G.; Karaman, I.; Radovic, M. High-Performance Metal/Carbide Composites with Far-From Equilibrium Compositions and Controlled Microstructures. Sci. Rep. 2016, 6, 35523. [Google Scholar] [CrossRef]
  16. Kothalkar, A.; Karaman, I.; Radovic, M. Fabrication and characterization of NiTi/Ti3SiC2 and NiTi/Ti2AlC composites. J. Alloys Compd. 2014, 610, 635–644. [Google Scholar]
  17. Agne, M.T.; Radovic, M.; Bentzel, G.W.; Barsoum, M.W. Stability of V2AlC with Al in 800-1000 oC temperature range and in situ synthesis of V2AlC/Al composites. J. Alloys Compd. 2016, 666, 279–286. [Google Scholar] [CrossRef] [Green Version]
  18. Gupta, S.; Hammann, T.; Johnson, R.; Riyad, M.F. Synthesis and Characterization of Novel Al-Matrix Composites Reinforced with Ti3SiC2 Particulates. J. Mater. Eng. Perform. 2014, 24, 1011–1017. [Google Scholar] [CrossRef]
  19. Gupta, S.; AlAnazi, F.; Ghosh, S.; Dunnigan, R. Synthesis and Tribological Behavior of Novel Ag- and Bi- Based Composites Reinforced with Ti3SiC2. Wear 2017, 376, 1074–1083. [Google Scholar]
  20. Fuka, M.; Dey, M.; Gupta, S. Novel Ternary Boride (MoAlB) Particulates as Solid Lubricant Additives in Ni-matrix Composites. In Proceedings of the 2018 Joint Propulsion Conference, Session: Additive Manufacturing for Propulsion Systems II, AIAA 2018-4893, Cincinnati, OH, USA, 9–11 July 2018. [Google Scholar] [CrossRef]
  21. Dey, M.; Fuka, M.; AlAnazi, F.; Gupta, S. Synthesis and Characterization of Novel Ni-Ti3SiC2 Composites. In Proceeding of the 42nd International Conference on Advanced Ceramics and Composites, Daytona Beach, FL, USA, 21–26 January 2018; pp. 105–116. [Google Scholar]
  22. Hu, W.; Huang, Z.; Cai, L.; Lei, C.; Zhai, H.; Hao, S.; Yu, W.; Zhou, Y. “Preparation and mechanical properties of TiCx-Ni3(Al,Ti)/Ni composites synthesized from Ni alloy and Ti3AlC2 powders”. Mater. Sci. Eng. A 2017, 697, 48–54. [Google Scholar] [CrossRef]
  23. Murugaiah, A.; Souchet, A.; El-Raghy, T.; Radovic, M.; Sundberg, M.; Barsoum, M.W. Tape Casting, Pressureless Sintering, and Grain Growth in Ti3SiC2 Compacts. J. Am. Ceram. Soc. 2014, 87, 550–556. [Google Scholar] [CrossRef]
  24. Hu, C.; Sakka, Y.; Tanaka, H.; Nishimura, T.; Grasso, S. Fabrication of Textured Nb4AlC3 Ceramic by Slip Casting in a Strong Magnetic Field and Spark Plasma Sintering. J. Am. Ceram. Soc. 2011, 94, 410–415. [Google Scholar] [CrossRef]
  25. Hu, C.; Sakka, Y.; Grasso, S.; Suzuki, T.; Tanaka, H. Tailoring Ti3SiC2 Ceramic via a Strong Magnetic Field Alignment Method Followed by Spark Plasma Sintering. J. Am. Ceram. Soc. 2011, 94, 742–748. [Google Scholar] [CrossRef]
  26. Mishra, M.; Sakka, Y.; Hu, C.; Suzuki, T.S.; Uchikoshi, T.; Besra, L. Electrophoretic Deposition of Ti3SiC2 and Texture Development in a Strong Magnetic Field. J. Am. Ceram. Soc. 2012, 95, 2857–2862. [Google Scholar] [CrossRef]
  27. Krahmer, D.M.; Hameed, S.; Sánchez Egea, A.J.; Pérez, D.; Canales, J.; López de Lacalle, L.N. Wear and MnS Layer Adhesion in Uncoated Cutting Tools When Dry and Wet Turning Free-Cutting Steels. Metals 2019, 9, 556. [Google Scholar] [CrossRef] [Green Version]
  28. Sánchez Egea, A.J.; Martynenko, V.; Abate, G.; Deferrari, N.; Martinez Krahmer, D.; López de Lacalle, L.N. Friction capabilities of graphite-based lubricants at room and over 1400 K temperatures. Int. J. Adv. Manuf. Technol. 2019, 102, 1623–1633. [Google Scholar] [CrossRef]
  29. Liu, F.; Jia, J.; Yi, G.; Wang, W.; Shan, Y. Mechanical and tribological properties of NiCr–Al2O3 composites at elevated temperatures. Tribol. Int. 2015, 84, 1–8. [Google Scholar] [CrossRef]
  30. Dellacorte, C.; Laskowski, J.A. Tribological Evaluation of PS300: A New Chrome Oxide-Based Solid Lubricant Coating Sliding Against Al2O3 from 25 °C to 650 °C. Tribol. Trans. 1997, 40, 163–167. [Google Scholar] [CrossRef]
  31. DellaCorte, C.; Edmonds, B.J. NASA PS400: A New High Temperature Solid Lubricant Coating for High Temperature Wear Applications. U.S. Patent 8,753,417, 17 June 2014. [Google Scholar]
  32. Kong, L.; Bi, Q.; Zhu, S.; Yang, J.; Liu, W. Tribological properties of ZrO2 (Y2O3)–Mo–BaF2/CaF2 composites at high temperatures. Tribol. Int. 2012, 45, 43–49. [Google Scholar] [CrossRef]
Figure 1. Schematics of, (a) Ni–Ti3SiC2/Ni, and (b) Ni–Ti3SiC2/Al/Ni multilayered composites.
Lubricants 07 00110 g001
Figure 2. Concentration of Ti3SiC2 in: (a) isotropic Ni–Ti3SiC2 composites, (b) multilayered Ni–Ti3SiC2 composites.
Lubricants 07 00110 g002
Figure 3. Schematics of (a) parallel and (b) perpendicular orientation during mechanical and tribological testing.
Lubricants 07 00110 g003
Figure 4. SEM microstructure of (a) Ni-10%Ti3SiC2/Ni (100 µm) in backscattered electron (BSE) image, (b) BSE image at higher magnifications, (c) Ni-20%Ti3SiC2/Ni (100 µm) in secondary electron (SE) image, (d) BSE of the same region, (e) Ni-40%Ti3SiC2/Ni (100 µm) in BSE, and (f) Ni-40%Ti3SiC2/Ni (100 µm) in BSE at higher magnifications.
Lubricants 07 00110 g004
Figure 5. SEM microstructures of (a) Ni-20%Ti3SiC2/Ni (20 µm) in BSE, (b) Ni-20%Ti3SiC2/Ni (20 µm) in BSE at higher magnifications, (c) Ni-20%Ti3SiC2/Ni (200 µm) in SE, and (d) BSE of the same region.
Lubricants 07 00110 g005
Figure 6. SEM microstructure of (a) Ni-20%Ti3SiC2/Al/Ni (20 µm) in BSE, (b) higher magnification in BSE, (c) Ni-20%Ti3SiC2/Al/Ni (100 µm) in BSE, and (d) higher magnification in BSE.
Lubricants 07 00110 g006
Figure 7. Plot of compressive stress versus displacement of (a) Ni-10%Ti3SiC2/Ni (thickness of laminate is 100 µm), (b) Ni-20%Ti3SiC2/Ni (thickness of laminate is 100 µm), (c) Ni-40%Ti3SiC2/Ni (thickness of laminate is 100 µm), (d) Ni-20%Ti3SiC2/Ni (thickness of laminate is 20 µm), (e) Ni-20%Ti3SiC2/Ni (thickness of laminate is 200 µm), and (f) Ni-10%Ti3SiC2/Al/Ni composites with different thicknesses.
Lubricants 07 00110 g007
Figure 8. Plot of ultimate compressive strength (UCS) versus Ti3SiC2 content in (a)Ni–Ti3SiC2 (100 µm), (b) Ni-20%Ti3SiC2/Ni, and (c) Ni–Ti3SiC2/Al/Ni multilayered composites.
Lubricants 07 00110 g008
Figure 9. Plot of (a) friction coefficient, and (b) wear rate (WR) of Ni-20%Ti3SiC2/Ni multilayered composites as a function of laminate thickness.
Lubricants 07 00110 g009
Figure 10. Plot of (a) friction coefficient, and (b) wear rate as a function of Ti3SiC2 content in Ni–Ti3SiC2/Ni composites (laminate thickness in all composites was 100 µm) [20,21].
Lubricants 07 00110 g010
Figure 11. Comparative plot of (a) friction coefficient, and (b) WR of Ni–Ti3SiC2/Al/Ni multilayered composites.
Lubricants 07 00110 g011
Figure 12. SEM micrographs of (a) Ni-20%Ti3SiC2/Ni (100 µm) surface in SE, (b) BSE of the same region, (c) alumina surface in SE, and (d) BSE of the same region after tribological testing in parallel orientation.
Lubricants 07 00110 g012
Figure 13. SEM micrographs of (a) Ni-20%Ti3SiC2/Ni (100 µm) surface (perpendicular to the casting direction) in SE, (b) BSE of the same region, (c) alumina surface in SE, and (d) BSE of the same region after tribological testing in perpendicular orientation.
Lubricants 07 00110 g013
Figure 14. SEM micrographs of (a) Ni-20%Ti3SiC2/Al/Ni (100 µm) surface (parallel orientation) in SE, (b) BSE of the same region, (c) alumina surface in SE, and (d) BSE of the same region after tribological testing.
Lubricants 07 00110 g014
Figure 15. SEM micrographs of (a) Ni-20%Ti3SiC2/Al/Ni (100 µm) surface (perpendicular to the casting direction) in SE, (b) BSE of the same region, (c) alumina surface in SE, and (d) BSE of the same region after tribological testing.
Lubricants 07 00110 g015
Table 1. Concentration of Ni–Ti3SiC2 in multilayered Ni–Ti3SiC2 composites .
CompositionThicknessTi3SiC2 Concentration (%)
Ni–Ti3SiC2 LayersMultilayered Ni–Ti3SiC2
Ni-10%Ti3SiC2/Ni100 µm10%5.10%
Ni-20%Ti3SiC2/Ni20%10.2%
Ni-40%Ti3SiC2/Ni40%20.5%
Ni-20%Ti3SiC2/Ni20 µm20%10.05%
Ni-20%Ti3SiC2/Ni200 µm20%10.5%
Ni-20%Ti3SiC2/Al/Ni20 µm20%6.80%
Ni-20%Ti3SiC2/Al/Ni100 µm20%7.00%
This calculation is for qualitative comparison. It is based on the uniform thickness and density of each individual layer.
Table 2. Porosity of multilayered samples.
ArchitectureLayer ThicknessPorosity
Ni-10%Ti3SiC2/Ni100 µm37.6 ± 1.28
Ni-20% Ti3SiC2/Ni27.9 ± 1.34
Ni-40% Ti3SiC2/Ni32.4 ± 4.30
Ni-20% Ti3SiC2/Ni 20 µm33.4 ± 3.85
Ni-20% Ti3SiC2/Ni200 µm36.8 ± 3.12
(Ni-20% Ti3SiC2/Ni) (Al) (Ni)20 µm29.1 ± 1.00
(Ni-20% Ti3SiC2/Ni) (Al) (Ni)100 µm28.1 ± 1.42

