Abstract
In internal combustion engines, a significant portion of the total fuel energy is consumed to overcome the mechanical friction between the cylinder liner and the piston rings. The engine work loss through friction gradually reduces during the engine break-in period, as the result of liner surface topography changes caused by wear. This work is the first step toward the development of a physics-based liner wear model to predict the evolution of liner roughness and ring pack lubrication during the break-in period. Two major mechanisms are involved in the wear model: plastic deformation and asperity fatigue. The two mechanisms are simulated through a set of submodels, including elastoplastic asperity contact, crack initiation, and crack propagation within the contact stress field. Compared to experimental measurements, the calculated friction evolution of different liner surface finishes during break-in exhibits the same trend and a comparable magnitude. Moreover, the simulation results indicate that the liner wear rate or duration of break-in depends greatly on the roughness, which may provide guidance for surface roughness design and manufacturing processes.
1. Introduction
With the goal of pollution control and reduction of greenhouse gas emissions, it is always important to improve the efficiency of internal combustion engines. A major source of engine friction is the contact system of piston rings and cylinder liners. On average, for an internal combustion engine, around 10% of the total fuel energy is dissipated to heat because of mechanical friction. About 20% of the friction loss is caused by the contact between piston rings and liners [1].
Friction loss and other performance factors, such as engine oil consumption and certain emission parameters, usually experience rapid changes (mostly reduction) before they are stabilized for the rest of the engine life. This initial running period is called the break-in period. There are a number of practical reasons to study the break-in mechanisms. First, shortening the length of the break-in period can reduce the harmful emissions. Particularly for some heavy-duty engines, the manufacturers are required to finish engine break-in before delivering the engines. Thus, the break-in is directly related to the cost of the engines. Second, the ability to predict the changes during the break-in period allows one to predict engine friction over most of its lifetime.
For the ring–liner system, it is considered that the biggest change during the break-in period is the roughness of the plateau part. A critical manufacturing step in the manufacturing process of liners is called the plateau honing process. The process includes two stages: rough honing, creating the valley part with grooves; and fine honing, leading to much less plateau roughness compared with the valleys [2,3]. As the plateau part created by the honing process is gradually worn during the break-in period, engine lubrication conditions evolve accordingly. Therefore, it is crucial to study and simulate the break-in wear of the liner surface with the goal of understanding engine lubrication change and generating better liner roughness design.
The two-body asperity fatigue wear model presented here is physics-based and is comprised of different submodels. First, surface plastic flattening was considered as the mechanism responsible for changes of the surface during the initial contact, which was modeled with an asperity contact model and a simple flattening process. Then, the asperity fatigue wear was considered as the dominant process for change of the surface during the rest of the break-in period. As the successive mechanism, asperity fatigue wear is studied, starting with the theory of delamination, which was first proposed by Suh [4]. Two submodels are discussed to complete the simulation of fatigue wear: crack initiation and crack propagation. Because fatigue wear happens at the asperity level and near the surface, surface and subsurface cracks are modeled separately because of their different initiation positions and growth driving forces.
Many previous physics-based models were developed to simulate the fatigue wear process. The Lundberg–Palmgren model is a representative work of early fatigue wear [5]. Lundberg and Palmgren proposed the first mathematical model for predicting contact fatigue life. The later studies by Tallian added more physics-based understandings. The proposed models were based on crack propagation and elastic–plastic properties of materials [6,7]. Kudish and Burris improved the previous models by considering the effects of normal stress, the size of the contact, and the friction coefficient [8]. There are a number of published works for modeling of engine break-in wear [9,10,11]. However, without engaging detailed mechanisms of break-in wear, these models mainly focus on how to model the wear process in a mathematical way.
In this work, the fatigue wear theory was for the first time applied tothe liner roughness during break-in. The rest of the content is organized as follows. First, submodels of asperity wear mechanisms and the simulation procedure are introduced in the methodology part. Second, simulation results for break-in wear and engine friction are presented in the results section. Comparison between simulation results and experimental measurements is also made in the results section to evaluate the effectiveness of the wear model.
2. Methodology
2.1. Asperity Contact
Owing to the design convention, the ring surface is significantly smoother than the liner surface. The deformation of asperities on the liner surface can be approximated as a flattening process, with a fast change for the plateau roughness. This plastic flattening process is significant, especially during the first several engine cycles. Although this process is short in duration, the change of surface topology significantly affects the behavior of the asperity contact. Therefore, it is essential to consider this mechanism, and to integrate it into the entire two-body break-in wear simulation.
This asperity contact model is computationally efficient under several assumptions. First, the contact occurs between a smooth surface and a rough surface, with the smooth surface considered as a rigid body. In the ring liner contact system, the ring is smoother and harder than the liner. Second, the interactions among asperities are neglected, so the deformation of each asperity only depends on the contact situation between the ring and the asperity. This assumption is sufficient for a sparse contact pattern, where the real contact area only consists of a small portion of the nominal contact area. The final assumption is that all asperities have spherical summits that have contact with the ring. The surface topography is measured by confocal microscopy, which is one kind of surface measurement method based on an optical technique [12]. Based on the work of Zhao et al. [13], the contact model for each single spherical asperity can be mathematically expressed as:
In Equations (1)–(3), is the real contact area, is the mean contact pressure. R is the radius curvature of the asperity tips, H is the hardness of the material, and k is the mean contact pressure factor, such that the initial yielding occurs if the mean nominal pressure exceeds kH. For a liner made of cast iron, k is usually taken around 0.4. The determining parameter in the model is the interference depth h, which is the asperity tip height reduction after contact. Figure 1 shows the geometric properties and asperity deformation of the contact model.
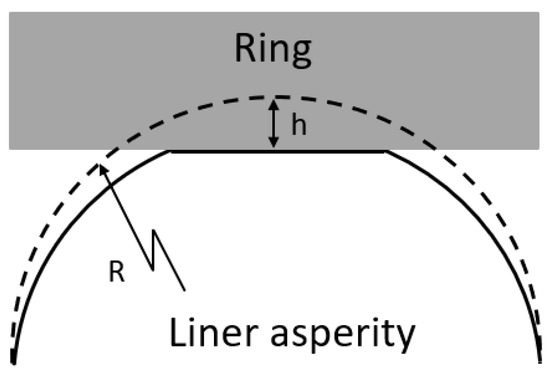
Figure 1.
Asperity contact model.
The contact pattern for each asperity always falls into one of the three contact categories: elastic, elastoplastic contact, and fully plastic. These three categories are identified by two critical interference depths: and . When, the contact is purely elastic, as the maximum normal pressure within the contact area is smaller than the material hardness. Further penetration to the contact leads to the elastoplastic condition as a transition from the elastic contact to fully plastic contact, with only the center part of the contact region reaching plasticity. As the interference depth further exceeds , the contact becomes fully plastic. Equations (1)–(3) correspond to the analytical expressions of the real contact area and mean contact pressure for the three conditions, respectively.
Based on the asperity contact model discussed above, average clearance between the ring and the rough liner surface under a given pressure can be solved iteratively. The summation of contact forces over all individual asperities equals the total load of solid-to-solid contact.
2.2. Asperity Plastic Flattening
The asperities that have elastic contact with the ring will recover their original shape right after the ring leaves. However, part of the contact becomes plastic and a permanent flattening effect occurs.
The detailed asperity plastic deformation is not trivial. The fractal nature of the asperities in contact leads to various plastic deformation patterns at finer scales. Here the peaks of the asperities are simplified as spherical. We adopted the model proposed by Sören and Söderberg [14]. The geometry of the asperity after experiencing a plastic contact has an elastic spring on the top of the flattened peak. The amount of elastic spring at the center of the contact asperity is modeled by Johnson [15]:
where v is the Poisson ratio, is the material hardness, is the elastic modulus, and is the real contact area.
2.3. Asperity Fatigue
Among all the mechanical wear mechanisms, surface plastic deformation, fatigue wear, and abrasive wear are the most essential ones leading to the surface topology change. Delamination theory considers fatigue as the core mechanism in the wear process and it is widely supported by evidence for wear of metals and some other solid materials [16].
In the delamination theory, propagation of the subsurface cracks under cyclic loading leads to surface material fracture in the shape of flat sheets. In this work, the asperity fatigue model also considers the propagation of surface cracks.
As illustrated in Figure 2, according to the principal normal stress, the subsurface under each contact can be divided into the tensile region and compressive region. Both surface cracks and subsurface cracks are initiated from the material defects. However, the types of stresses leading to crack initiation are different. Surface crack initiation is caused by the surface tensile stress, as the bond at the surface defect is weaker than the tensile stress.
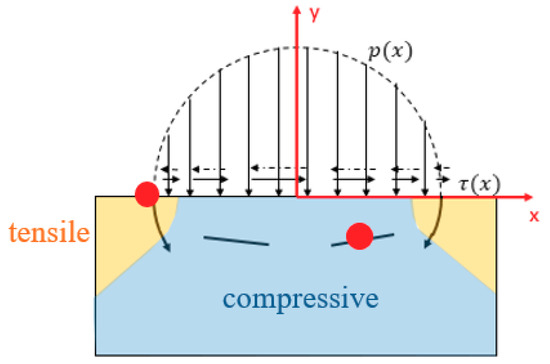
Figure 2.
Crack initiation. Surface cracks initiate from the edge of the contact region where the surface tensile stress reaches maximum. Subsurface cracks initiate from the maximum shear stress region.
Therefore, surface cracks always initiate at the edge of the contact region at which the surface tensile stress is maximum. The stress responsible for the subsurface crack initiation is shear stress. This is because subsurface cracks initiate in the compressive region, where the maximum principal stress is negative. The only source for crack initiation is the shear component. As a result, the initiation position for subsurface cracks is the maximum shear stress position.
After the initiation of surface and subsurface cracks, propagation of cracks ultimately leads to fracture of contact asperities. Similar to initiation of cracks, cracks in the tensile region and compressive region have different propagation modes and driving forces. For a surface crack, both fracture mode 1 and fracture mode 2 contribute to propagation, as tensile stress and shear stress exist simultaneously in the tensile region. The driving force for surface crack propagation is the tensile circumferential stress near the crack tip, with the corresponding propagation direction being perpendicular to the maximum direction. For a subsurface crack located in the compressive region, the driving force is the shear stress at the crack tip, while the crack propagates to the direction of maximum shear stress . The crack initiation and propagation mechanisms are summarized in Table 1.

Table 1.
Crack initiation and propagation mechanisms. As surface cracks and subsurface cracks are located in different regions under contact asperities, the mechanisms for initiation and propagation are different
The crack propagation is calculated by the Paris-Erdogan law [18] under the assumption of small yield around cracks. Kudish and Burris presented an efficient method to calculate the stress intensity factors and under each contact asperity [8]. An asymptotic solution is presented to solve and in an explicit way.
2.4. Systematic Modeling Procedures
Based on submodels introduced in the previous sections, a final asperity fatigue wear model for the liner surface in the break-in period is developed. This wear model includes the following essential steps: asperity contact, surface plastic deformation, crack initiation, crack propagation, and asperity fracture. These steps are applied for every sliding cycle iteratively. The flowchart in Figure 3 shows the algorithm of this fatigue wear model, which integrates all these critical mechanisms in the fatigue wear process.
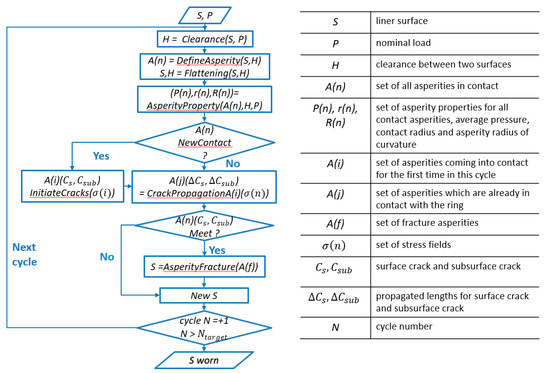
Figure 3.
Algorithm of the asperity fatigue wear model.
In Figure 3, the asperity fatigue wear algorithm needs two inputs: rough liner surface S, represented by a matrix; and an external nominal pressure P. First, the algorithm finds the clearance H between the liner base altitude and the flat ring surface, according to the asperity contact model with the given liner roughness measurement and pressure. All asperities in contact A(n) are numerically defined once the clearance is determined, including each asperity’s radius of curvature R(n), average normal pressure P(n), and real contact radius r(n). Using the information for each asperity, the algorithm performs the surface plastic flattening calculation, obtaining updated surface S and a new clearance H. As the first step into the fatigue part, each asperity is identified based on whether it is an asperity coming into contact for the first time. If it is a new contact asperity, surface cracks and subsurface cracks are assigned to the corresponding initiation positions. Otherwise, if an asperity is already in contact, the lengths of the cracks are updated based on the Paris-Erdogan law. In the following step, the algorithm checks for each asperity based on whether the surface cracks meet with the subsurface cracks. If these cracks meet with each other, the asperity is fractured, resulting in a new surface topography. This new surface is then used as the input surface of the next cycle. After a specific number of sliding cycles, this fatigue wear algorithm provides a simulated surfaces roughness after wear.
2.5. Tested Surfaces
To investigate the effect of liner surface roughness on break-in wear, simulations are conducted based on the five different liner surface finishes. As shown in Figure 4, GG21, 09, and 07 are aligned along the horizonal line with one-step honing from smooth to rough. G21, 28, and 30 are plateau-honed with the same tooling sets but different plateau ratios, meaning the fine honing cuts to different depths compared with the rough honing [19,20].
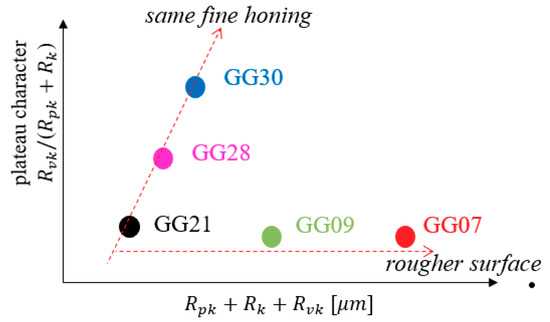
Figure 4.
Different liner surface finishes.
2.6. Hydrodynami, Contact and Friction Correlations
In order to investigate the effect of break-in fatigue wear on engine lubrication, liner surface finishes before and after wear simulation are utilized to calculate friction. As the piston ring slides to different positions on the liner, the mean clearance also changes, leading to the change of hydrodynamic pressure. To obtain the correlations between the ring liner clearance and hydrodynamic pressure, a deterministic model is applied. According to this model, the dependency of the average hydrodynamic pressure on the ring-liner clearance can be expressed by the following equation [21]:
In Equation (5), and are the reference viscosity and reference sliding speed, while and V are the corresponding real parameters. and are constants. They depend on the liner finish and ring profile. These two constants can be obtained through least squares fit using simulation results. Here, is the ratio of average clearance and the standard deviation of plateau roughness.
Similarly, the hydrodynamic shear stress can be correlated with the ratio through the following analytical expression, with (i = 1, 2, 3) as constants [21]:
The total pressure is the sum of the contact pressure and hydrodynamic pressure. The contact pressure also depends on clearance, which can be determined by the contact model introduced in Section 2.1. So as to integrate the contact correlation into the friction model of the entire engine cycle, an analytical expression is also developed [22]:
Here, , , , and are constants for a specific surface, obtained by running the asperity model described earlier. is the equivalent elastic modulus of the two contact surfaces, which is computed as [22]:
where , , and are the Poisson ratio and elastic modulus of the two contact materials.
3. Results
Both wear coefficient and friction change from the simulation are evaluated. For the tested surfaces, wear rate has relatively large magnitude at the beginning but gradually decreases to a constant. In addition, the simulation results also indicate that the constant wear rate for the steady state is proportional to external load if the external load is solely supported by the asperity contact. Therefore, the wear rate predicted with the fatigue mechanism employed here fits the Archard law [23]. Friction for the entire engine cycle is calculated based on existing friction correlations [21]. Different liner surface finishes are tested and compared with engine experimental results. Different cast iron liner finishes are utilized for both simulation and floating liner engine testing. The effectiveness of the asperity fatigue model is verified by the comparison between simulation results and experimental results, which show similar trends for engine friction change after break-in wear. The experimental friction measurements are obtained from floating liner engines (FLE). The detailed experimental setup was adequately described by Westerfield [19]. The design of the FLE was originally provided by Takiguchi [24,25]. The FLE is a specialized internal combustion engine that allows measurement of friction contributions from the piston assembly while the engine is in operation.
3.1. Results of Liner Wear during Break-In Period
In this section, liner wear break-in simulation results are presented based on the asperity fatigue wear model. Liner surfaces with different finishes are tested to investigate the impact of roughness, denoted as GG07, GG09, GG21, GG28, and GG30, shown in Figure 4 with the Daimler liner finish classification [20]. The surfaces used here as the inputs of the wear model are generated numerically based on the real optical measurements [26]. For each surface, the external nominal pressure varies from 1 MPa to 4 MPa in order to also study the effect of pressure on fatigue wear.
Figure 5 shows break-in wear as a function of time (number of sliding cycles) for all 5 liner finishes. Wear is evaluated by the average height reduction over the entire surface. According to the results of liner wear simulation, the wear rate of the liner is relatively large at the beginning, but gradually reduces to a steady value for all different nominal stresses. Moreover, the steady-state wear rate is proportional to normal pressure, as indicated in Figure 6. The vertical axis is the steady-state wear rate, which is evaluated by the average surface height reduction over each thousand running cycles. For the wear of metallic materials, Archard’s law is a widely used correlation that quantitatively describes sliding wear and external parameters; the volume of wear debris for metal sliding is proportional to the product of normal load and sliding distance, but inversely proportional to the material hardness [23,27]:
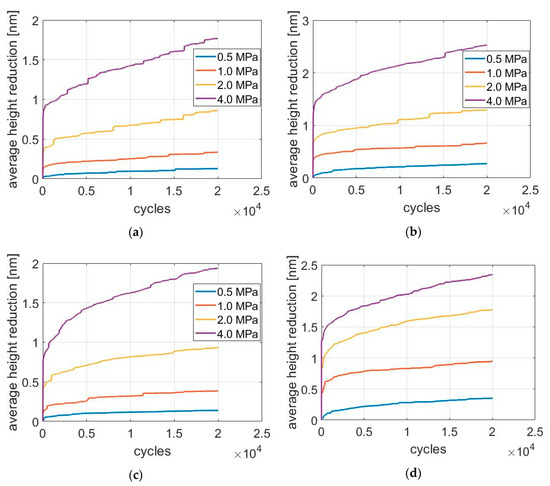
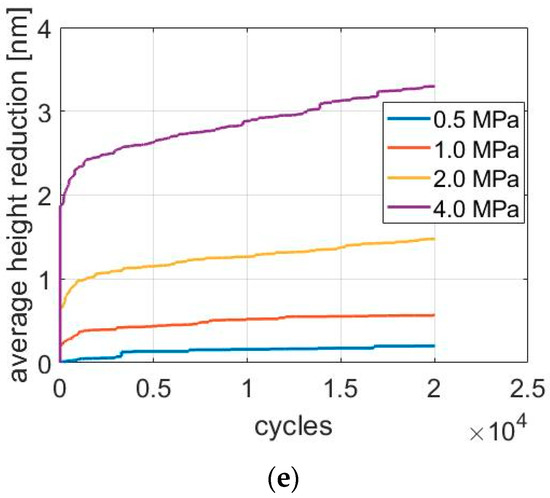
Figure 5.
Simulation results of break-in wear as a function of sliding cycles. Wear loss is evaluated by the average surface height reduction. (a)–(e) are the calculation results for GG07, GG09, GG21, GG28 and GG30, respectively.
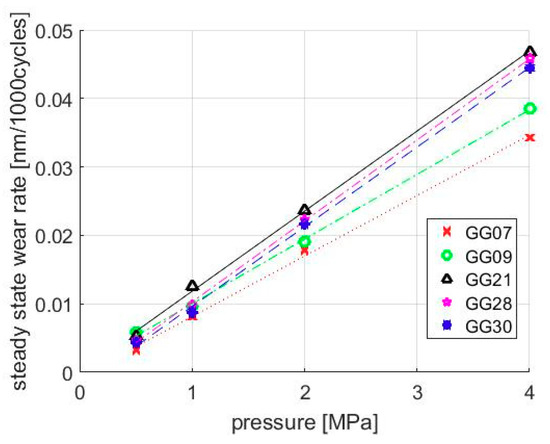
Figure 6.
The steady-state wear rate is proportional.
In Equation (9), V is the volume of wear debris, and P, L, and H are external normal pressure, sliding distance, and material hardness, respectively. Here, k is the wear coefficient, which is a constant for a certain material with a specific surface finish. As one important mechanism in metal wear, asperity fatigue wear obeys Archard’s law. Therefore, it is reasonable and essential to calculate the wear coefficient of surfaces with different finishes, which is conventionally used as a parameter to evaluate wear resistance of a surface.
Corresponding to the constant slope in Figure 6, the wear coefficient based on Equation (6) is presented in Table 2. It is essential to point out that the wear coefficients of GG21, GG28, and GG30 liner finishes have approximately the same value, indicating the steady-state wear rates of these surfaces are very close. The reason may be found from their manufacturing procedures. As illustrated in Section 2.5, the only difference among GG21, GG28, and GG30 finishes is the height of the fine finish. Although the plateau ratios are different for these three surfaces because of the fine finish, plateau regions have the same roughness level. Additionally, the size and shape of contact asperities are statistically the same for the three finishes. Therefore, it is reasonable that their wear coefficients are so close. Furthermore, the results here imply that the steady-state asperity fatigue wear rate largely depends on the roughness level of the plateau region resulting from fine honing.

Table 2.
Steady-state wear coefficients of different liners.
3.2. Further Investigations on the Effect of Surface Roughness
In the previous section, simulation results show that the wear rate of a surface depends greatly on its roughness level, especially the size and shape of contact asperities. In order to seek more detailed underlying correlations, additional simulations are conducted for break-in fatigue wear. In the following, the sizes of the asperities are varied artificially to examine the effect on the break-in behavior.
As inputs of the wear model, the roughness matrix representing a rough liner surface has specific resolutions in the sliding direction and circumferential direction, dx and dy. In this section, dx and dy are stretched by a factor of 0.5, 2, 4, and 8 to modify the size and slope of liner surface asperities. A larger stretched scale indicates flatter asperities. Other simulation parameters remain the same as previous simulations.
The steady-state wear rate under different stretched scales and normal pressures is summarized in Figure 7. With a constant normal pressure, the steady-state wear rate first increases, then decreases as the size of the asperities increases. The maximum steady state wear rate for all normal pressures occurs with the stretched scale factor of 2. This interesting result indicates that an optimal asperity flatness can be achieved if the designer of the liner surfaces wants to minimize the break-in period. Figure 8 qualitatively explains why the optimal asperity flatness and size exist.
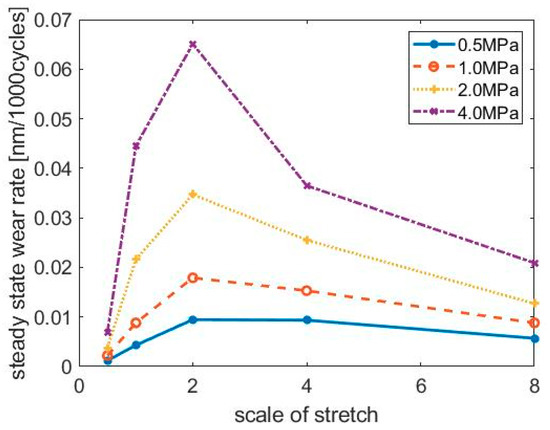
Figure 7.
Steady-state wear rate for surfaces with different stretched scales.

Figure 8.
Asperities with different flatness under the same nominal pressure.
As shown in Figure 8, the original surface is modified with a stretch factor of 0.5 and 2, keeping the height of the asperities constant. In this simple analysis, it is assumed that all asperities have the same shape. Because asperities with a stretch factor of 0.5 have the smallest radius of curvature, according to Equations (1)–(3), the overlapping volume of this liner surface and the ring are the smallest, resulting in a low steady-state wear rate. As the asperities are continuously stretched, the overlapping volume also increases since the average contact pressure is reduced. However, because of the reduction of contact pressure on each asperity, the speed of crack propagation for both surface and subsurface cracks decreases. The two influencing factors, overlapping volume and crack propagation speed, are indeed competitive, as asperities are artificially enlarged with increasing stretch scale factor. If the effect of the crack propagation rate reduction takes the dominant position, the steady-state wear rate decreases. This is the reason why the maximum wear rate occurs at a certain asperity flatness level. One extreme case can help to understand this trend—when the liner surface is ideally smooth with only a single flat asperity, the contact pressure on this asperity is equal to the external nominal pressure. The external nominal pressure on the liner is usually far below the normal range of pressure leading to fatigue wear, resulting in the wear rate being almost zero.
3.3. Calculated Friction Change and Comparison with Experimental Results
The evolution of engine lubrication is studied and compared with experimental results through the friction under one complete cycle and the Stribeck curve. Plots of engine cycle friction can reflect friction variation within each engine cycle. The correlation between piston position and friction level is evaluated through various crank angles. The Stribeck curve is presented to illustrate how the friction coefficient evolves as the sliding speed changes. The theoretical calculation of friction is performed by both the model of hydrodynamic pressure and the model of dry contact. The wear process of different liner finishes is simulated by the asperity fatigue wear model, with friction curves plotted for surfaces before wear and after wear. The break-in FLE experiments were conducted at 80 °C with an engine speed of 400 rpm. The lubricant is a special high-temperature, high-shear (HTHS) oil with a viscosity of 1.4 mPa·s
The correlations of hydrodynamic pressure, hydrodynamic shear stress, and contact pressure introduced in Section 2.6 are utilized to obtain the friction curves for the entire engine cycle. The cycle model is a modified version of the published one [28] and the major modification is the replacement of the hydrodynamic lubrication submodel with the correlation based on the results of the deterministic model, as described earlier [21]. As the ring liner clearance depends on the ring sliding speed, the friction also varies for each engine cycle, with the minimum friction value occurring during mid-stroke at low engine speed. Since the sliding speed is close to zero at the top dead center (TDC) and the bottom dead center (BDC), different engine speeds have similar friction magnitudes at the two positions. When the clearance reaches this smallest value, neither contact pressure nor hydrodynamic pressure show obvious change after wear. The simulated contact pressure and hydrodynamic pressure of the GG30 surface finish are plotted in Figure 9 as functions of the ring liner clearance. The wear simulation of GG30 is performed using the asperity fatigue wear model, with a simulated duration of five hours, engine speed of 400 rpm, and external nominal pressure of 2 MPa. For simplicity, this nominal pressure is solely supported by the asperity contact in the wear model. Therefore, the wear rate should be considered as the upper bound estimation from the model because part of the ring load is supported by the hydrodynamic pressure in reality.
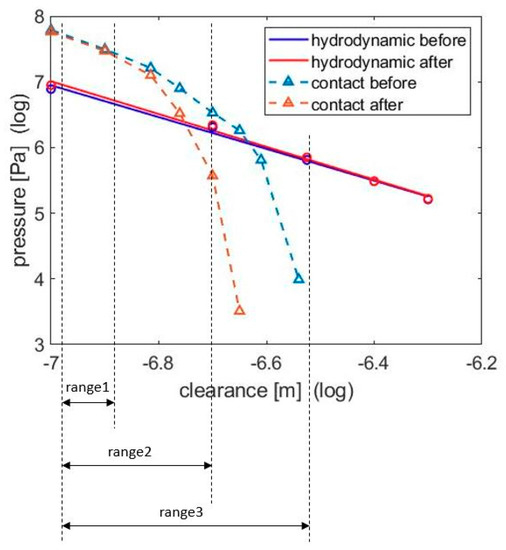
Figure 9.
Hydrodynamic pressures and contact pressures of GG30, before wear and after 5 h running under an external load of 2 MPa.
As shown in Figure 9, compared with the original surface, the surface after wear simulation has approximately the same hydrodynamic pressure, but the contact pressure is reduced because the asperities are flattened and gradually fractured. This can be further revealed in Figure 10, which contains the height distribution curves for the liner surface before and after wear simulation. The clearance here in Figure 9 is defined as the distance between the ring surface and the peak of the plateau. With a worn plateau, the contact pressure reduces after wear. When the ring liner clearance is small, the contact pressure changes little because only high asperities are fractured after 5 h break-in wear. A small clearance exists for low sliding conditions, especially when the piston moves to the top dead center or the bottom dead center. Range 1, range 2, and range 3 correspond to the ring liner clearance range when the engine speed is 100 rpm, 500 rpm, and 1000 rpm, respectively.
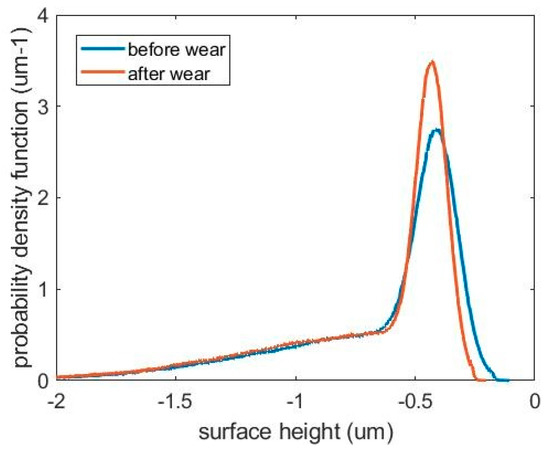
Figure 10.
Liner surface height distributions before and after wear simulation.
The pressure change shown in Figure 9 is consistent with the friction curves in Figure 11, in which the friction does not change much after wear near TDC and BDC. On the other hand, in the mid-stroke region, the ring may have different sliding velocities with different engine speeds. When the engine speed is 100 rpm, the contact pressure has a slight drop. This leads to the friction reduction after wear at mid-stroke in Figure 11b; here, contact pressure is always the dominant factor, much more so than the hydrodynamic pressure. When the engine speed reaches 1000 rpm, the contact pressure is much lower than hydrodynamic pressure at the mid-stroke, for both conditions before and after wear. Therefore, as shown in Figure 11f, the friction curves become almost overlapped in the middle. Compared with the friction measurements obtained experimentally, the relatively important trend between hydrodynamic pressure and contact pressure agrees well, as shown in Figure 11. The engine cycle friction curves of GG07 are also obtained in Figure 12. Unlike GG30, for GG07, the boundary lubrication dominates throughout the whole cycle across all engine speeds. This domination did not change much after 5 h of operation. Two factors may contribute to this difference with GG30. First, the combination of the range of engine speed and the lubricant viscosity does not allow the ring to escape the boundary-lubrication-dominated regime. Second, the average asperity size of GG07 is larger than for GG30, resulting in a lower asperity fatigue wear rate, as mentioned in the previous section. Therefore, the surface topology change for GG07 is also slower, resulting in a less remarkable friction drop for GG07 after wear than for GG30. The experimental measurements also support this difference between GG07 and GG30.
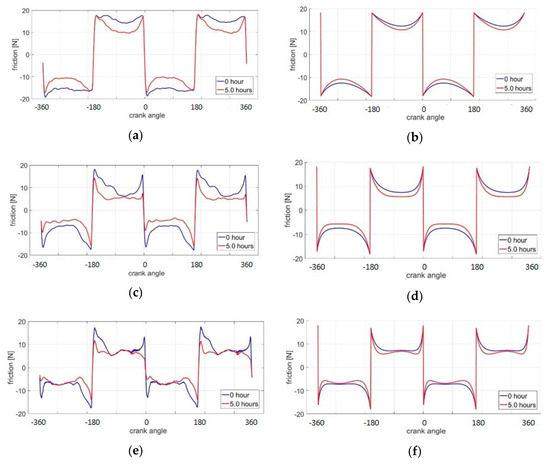
Figure 11.
Experimental measurements and simulation results of friction change for the surface of GG30: (a) experimental measurements, 100 rpm; (b) simulation results, 100 rpm; (c) experimental measurements, 500 rpm; (d) simulation results, 500 rpm; (e) experimental measurements, 1000 rpm; and (f) simulation results, 1000 rpm.
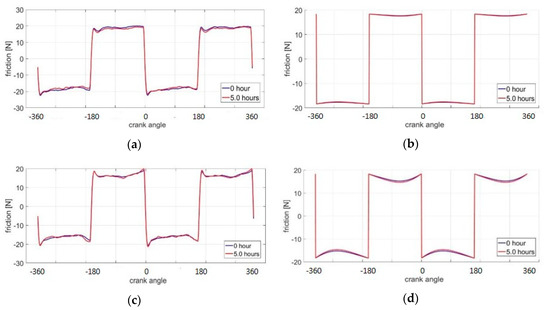

Figure 12.
Experimental measurements and simulation results of friction change for surface GG07: (a) experimental measurements, 100 rpm; (b) simulation results, 100 rpm; (c) experimental measurements, 500 rpm; (d) simulation results, 500 rpm; (e) experimental measurements, 1000 rpm; and (f) simulation results, 1000 rpm.
One important mismatch between simulation and experiment is the magnitude of friction drop in GG30. Especially for the engine speed of 100 rpm, the friction drop in the mid-stroke region is larger than the predicted result. As hydrodynamic friction is not dominant at low engine speeds, this indicates that the predicted contact pressure drop is smaller than in experimental measurements. Therefore, the break-in wear rate is also underestimated. One reason for the underestimation of fatigue wear rate comes from the assumption of low yield when calculating crack propagation. However, the plastic regions around cracks are not always small compared with crack lengths. With the extended plastic regions, cracks can propagate faster than predicted in this fatigue model, leading to higher wear rate and more dramatic friction drop. The other possible error source is the assumption that asperity fatigue wear is uniform over the entire liner surface, while in reality asperity contact is different along the stroke during break-in.
Besides the engine cycle friction plots, the Stribeck curve reflecting the friction coefficient as a function of sliding speed is also plotted in Figure 13. When the sliding speed is low (boundary lubrication), friction is mainly caused by solid contact. As the sliding speed increases, hydrodynamic friction gradually makes a more significant contribution, so that it changes into mixed friction. If the speed keeps increasing, the two surfaces are separated further and hydrodynamic force becomes the only friction source. Because of the increase of the shear rate, the friction increases again. For GG07, because the surface is rougher, it needs a larger sliding velocity to enter the hydrodynamic lubrication condition, which is beyond the range of engine speed.
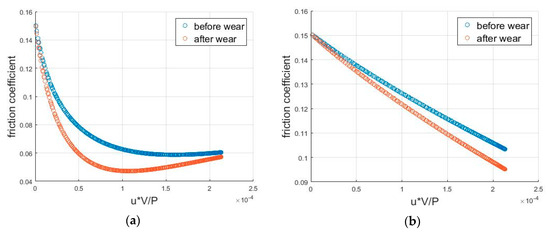
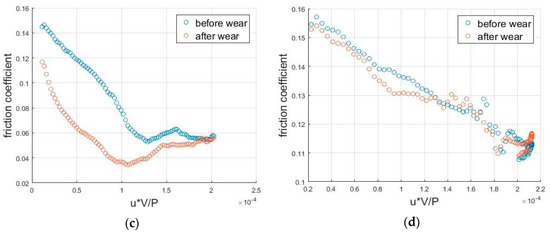
Figure 13.
Stribeck curves for experimental measurements and simulation results: (a) simulation results, GG30; (b) simulation results, GG07; (c) experimental measurements, GG30; and (d) experimental measurements, GG07.
4. Conclusions
In this paper, an asperity fatigue liner wear model during the break-in period in internal combustion engines is established. Two mechanisms leading to liner topography change are studied: asperity plastic deformation and fatigue. Simulation results agree with Archard’s wear law, showing that for a specific liner surface finish, the steady-state wear rate is proportional to the external nominal load that is solely supported by the asperity contact. Simulations also indicate that the maximum steady-state wear rate can be obtained for a specific surface roughness level. This could be applied in the future for liner surface roughness design to minimize the break-in time.
The engine friction change due to the break-in liner wear calculated by the presented wear model shows the same trend as—and comparable magnitude with—the experimental measurements. Such agreements show the adequacy and potential of the present model for break-in wear. On the other hand, the model involving current considerations and parameters underestimates the magnitude of the friction change in the mixed lubrication regime. Additionally, the contribution of the asperity contact decreases during the break-in, which is neglected in the current calculation. Improving part of the fatigue model and adapting the changes of the asperity contact during break-in will allow more accurate prediction of the liner break-in duration and asymptotic friction of the ring pack.
Author Contributions
Conceptualization, C.G. and T.T.; methodology, C.G.; data processing, C.G and R.W.; writing—original draft preparation, C.G.; writing—review and editing, C.G., T.T. and R.W.; supervision, T.T.; project administration, C.G. and T.T.; funding acquisition, T.T.
Funding
This work was sponsored by the Consortium on Lubrication in Internal Combustion Engines in the Sloan Automotive Laboratory, Massachusetts Institute of Technology, with additional support by Argonne National Laboratory and the US Department of Energy. The consortium members were Daimler, Mahle, MTU, PSA, Renault, Shell, Toyota, Volkswagen, Volvo Truck, and Weichai Power.
Conflicts of Interest
The authors declare no conflict of interest.
References
- Schmidt, T.T.; Gaertner, F.F.; Kreye, H. New developments in cold spray based on higher gas and particle temperatures. J. Therm. Spray Technol. 2006, 15, 488–494. [Google Scholar] [CrossRef]
- Sabri, L.; Mezghani, S.; El Mansori, M.; Zahouani, H. Multiscale Study of Finish-Honing Process in Mass Production of Cylinder Liner. Wear 2010, 271, 509–513. [Google Scholar] [CrossRef]
- Lawrence, D. An Accurate and Robust Method for the Honing Angle Evaluation of Cylinder Liner Surface Using Machine Vision. Int. J. Adv. Manuf. Technol. 2011. [Google Scholar] [CrossRef]
- Suh, N.P. The delamination theory of wear. Wear 1973, 25, 111–124. [Google Scholar] [CrossRef]
- Chiu, Y.P.; Tallian, T.E.; McCool, J.I.; Martin, J.A. A mathematical model of spalling fatigue failure in rolling contact. ASLE Trans. 1969, 12, 106–116. [Google Scholar] [CrossRef]
- Chiu, Y.P.; Tallian, T.E.; McCool, J.I. An engineering model of spalling fatigue failure in rolling contact: I. The subsurface model. Wear 1979, 17, 433–446. [Google Scholar] [CrossRef]
- Tallian, T.E.; McCool, J.I. An engineering model of spalling fatigue failure in rolling contact: II. The surface model. Wear 1971, 17, 447–461. [Google Scholar] [CrossRef]
- Kudish, I.I.; Burris, K.W. Modern State of Experimentation and Modeling in Contact Fatigue Phenomenon: Part II—Analysis of the Existing Statistical Mathematical Models of Bearing and Gear Fatigue Life. New Statistical Model of Contact Fatigue. Tribol. Trans. 2000, 43, 293–301. [Google Scholar] [CrossRef]
- Ma, Z.; Henein, N.A.; Bryzik, W. A model for wear and friction in cylinder liners and piston rings. Tribol. Trans. 2006, 49, 315–327. [Google Scholar] [CrossRef]
- Giorgio, M.; Guida, M.; Pulcini, G. A state-dependent wear model with an application to marine engine cylinder liners. Technometrics 2010, 52, 172–187. [Google Scholar] [CrossRef]
- Mezghani, S.; Demirci, I.; Yousfi, M.; El Mansori, M. Running-in wear modeling of honed surface for combustion engine cylinderliners. Wear 2013, 302, 1360–1369. [Google Scholar] [CrossRef]
- Vorburger, T.V.; Rhee, H.G.; Renegar, T.B.; Song, J.F.; Zheng, A. Comparison of optical and stylus methods for measurement of surface texture. Int. J. Adv. Manuf. Technol. 2007, 33, 110–118. [Google Scholar] [CrossRef]
- Zhao, Y.; Maietta, D.M.; Chang, L. An asperity microcontact model incorporating the transition from elastic deformation to fully plastic flow. J. Tribol. 2000, 122, 86–93. [Google Scholar] [CrossRef]
- Andersson, S.; Söderberg, A.; Olofsson, U. A random wear model for the interaction between a rough and a smooth surface. Wear 2008, 264, 763–769. [Google Scholar] [CrossRef]
- Johnson, K.L.; Johnson, K.L. Contact Mechanics; Cambridge University Press: Cambridge, UK, 1987. [Google Scholar]
- Suh, N.P. An overview of the delamination theory of wear. Wear 1977, 44, 1–16. [Google Scholar] [CrossRef]
- Sih, G.C. Strain-energy-density factor applied to mixed mode crack problems. Int. J. Fract. 1974, 10, 305–321. [Google Scholar] [CrossRef]
- Paris, P.; Erdogan, F. A critical analysis of crack propagation laws. J. Basic Eng. 1963, 85, 528–533. [Google Scholar] [CrossRef]
- Zach, W. A Study of the Friction of the Power Cylinder System in Internal Combustion Engines Using a Floating Liner Engine. Master’s Thesis, Massachusetts Institute of Technology, Cambridge, MA, USA, 2015. [Google Scholar]
- Mercedez-Benz. Honen von Zylinder-Laufflachen. Germany 2008.
- Haijie, C. Modeling the lubrication of the piston ring pack in internal combustion engines using the deterministic method. Ph.D. Thesis, Massachusetts Institute of Technology, Cambridge, MA, USA, 2011. [Google Scholar]
- Hu, Y.; Cheng, H.S.; Arai, T.; Kobayashi, Y.; Aoyama, S. Numerical simulation of piston ring in mixed lubrication—A nonaxisymmetrical analysis. J. Tribol. 1994, 116, 470–478. [Google Scholar] [CrossRef]
- Archard, J. Contact and rubbing of flat surfaces. J. Appl. Phys. 1953, 24, 981–988. [Google Scholar] [CrossRef]
- Sherrington, I.; Smith, E.H. The Measurement of Piston-Ring Friction by the ‘FloatingLiner’ Method; Paper No. 884707; SAE: Warrendale, PA, USA, 1988. [Google Scholar]
- Takiguchi, M.; Aoki, S. Friction Analysis of a Piston for Gasoline Engines; Paper No. 20075101; JSAE: Tokyo, Japan, 2007. [Google Scholar]
- Wang, R.; Gu, C.; Tian, T. Reliable Processes of Simulating Liner Roughness and Its Lubrication Properties; No. 2019-01-0178; SAE: Warrendale, PA, USA, 2019. [Google Scholar]
- Archard, J.F.; Hirst, W. The Wear of Metals under Unlubricated Conditions; Proceedings of the Royal Society of London. Series A; Mathematical and Physical Sciences: London, UK, 1956; pp. 397–410. [Google Scholar]
- Tian, T.; Wong, V.W. Modeling the lubrication, dynamics, and effects of piston dynamic tilt of twin-land oil control rings in internal combustion engines. J. Eng. Gas Turbines Power 2000, 122, 119–129. [Google Scholar] [CrossRef]
© 2019 by the authors. Licensee MDPI, Basel, Switzerland. This article is an open access article distributed under the terms and conditions of the Creative Commons Attribution (CC BY) license (http://creativecommons.org/licenses/by/4.0/).