Article

Effect of Viscosity and Speed on Oil Cavitation Development in a Single Piston-Ring Lubricant Assembly

by
Jamshid M. Nouri
*,
Ioannis Vasilakos
,
Youyou Yan
and
Constantino-Carlos Reyes-Aldasoro
Department of Mechanical Engineering and Aeronautics, City, University of London, London EC1V 0HB, UK
*
Author to whom correspondence should be addressed.
Lubricants 2019, 7(10), 88; https://doi.org/10.3390/lubricants7100088
Submission received: 23 August 2019 / Revised: 27 September 2019 / Accepted: 27 September 2019 / Published: 9 October 2019
(This article belongs to the Special Issue Tribology of Powertrain Systems)

Abstract

:
A high-speed camera has been used to produce unique time-resolved images of high quality to describe the dynamics of the lubricant flow and cavitation characteristics in a sliding optical liner over a fixed single piston-ring lubricant assembly for three lubricants with different viscosities to establish their impact on cavitation formation and development. The images were obtained at two cranking speeds (or liner sliding velocity) of 300 rpm (0–0.36 m/s) and 600 rpm (0–0.72 m/s), at a lubricant temperature of 70 °C and a supply lubricant rate of 0.05 L/min. A special MATLAB programme has been developed to analyse the cavitation characteristics quantitatively. The dynamic process of cavities initiation was demonstrated by time-resolved images from fern cavity formation to fissure cavities and then their development to the sheet and strings cavities at a liner sliding velocity of around 0.17 m/s. The results for both up- and down-stroke motions showed that the cavities reach their fully developed state downstream of the contact point when the liner velocity reaches its highest velocity and that they start to collapse around TDC and BDC when the liner comes to rest. Within the measured range, viscosity had a great influence on length of cavities so that a decrease in viscosity (from Lubricant A to C) caused a reduction in length of cavities of up to 35% for Lubricant C. On the other hand, an increase in speed, from 300 rpm to 600 rpm, have increased the number of string cavities and also increased the length of cavities due to thicker oil film thickness with the higher speed. Overall, the agreement between the processed data by MATLAB and visualisation measurements were good, but further thresholds refinement is required to improve the accuracy.

Graphical Abstract

1. Introduction

In the modern world, one of the major issues with internal combustion (IC) is pollution into our environment. The stringent emissions control regulations introduced by governments, for example, the Euro 6 fuel emission targets, provide set targets for nitrogen oxide (NOx), carbon monoxide (CO), hydrocarbons (HC) and particulate matter (PM). On the top of fuel emissions, the properties of lubricant oils can affect engine emissions in several ways, as the heavy hydrocarbons from the engine oil are a significant contributor to the soluble organic fraction (SOF) or organic carbon [1] which lead to particle number emissions [2]; these can be improved by modifying oil properties (composition) and better seal compatibility which, in term, lead to lower oil consumption. The interface between the piston-ring and cylinder-liner is also a major source of frictional losses (equivalent to up to 10–20% of the fuel used [3,4,5,6]) and wear that can lead to increased emissions, lubricant consumption and noise, and also to reduce the engine efficiency and its durability; these issues can be different for different lubricant properties, in particular, its viscosity, temperature and surface tension. To reduce the losses and improve emission, it is essential to have a full understanding of the oil film transportation mechanisms and how the phenomenon of cavitation development is affecting engine performance and how cavitation behaviour depends on lubricant formulations and properties; the latter requires many investigations to establish the impact of the individual properties of lubricant on the cavitation formation and development under appropriate running conditions. Therefore, the main focus of this work is to visualise the cavitation development using a high-speed video camera in a single piston-ring lubricant assembly similar to [7,8,9,10]. Images were processed to provide quantitative analysis of cavitation characteristics, using a specially written MATLAB programme, in order to quantify the effect of lubricant viscosity on cavitation development.
Cavitation is closely related to the variation of pressure and temperature within the engine and occurs when the lubricant local pressure drops below its saturated vapor pressure. It has been recognised that cavitation can impair performances in engineering applications and, in particular, in engines lubrication around the converging-diverging ring where it can change the lubricant oil film thickness, flow, pressure profile, and thus load capacity [11]. Lubricant properties, with different additives/blend formulations, like viscosity, lubricity, thermal stability, solvency, biodegradability and the use of anti-foaming agent can also affect cavitation and that they can be used to optimise lubricant to meet required engine performance, oil consumption and reduced emissions [12]. A thorough review of literatures on oil film transportation has been provided by [7,8,9,10] both in IC engine and also in model piston-ring lubricant assemblies. There are a good number of previous works [7,8,9,10] on cavitation development in optical single piston-ring lubricant rigs in which the researchers used different techniques like high-speed visualisation, Laser-Induced Fluorescence (LIF), capacitance and pressure transducers to visualise the oil film flow and cavitation formation, to measure the oil film thickness, the friction and the pressure distribution within the contact point between the rings and the liner.
The current model optical single piston-ring lubricant rig is similar to the one that was first designed, developed and manufactured by [7,13] which was capable of simulating the oil flow between the piston-ring for different operating conditions, and to allow simultaneous measurements of cavitation visualisation, pressure, temperature, oil film thickness and friction. The cavity formation and its development has been demonstrated by [9,14,15] and showed different stages from initial fern cavities and then their growth to the formation of fissure cavities and finally their development to string type cavitation structures. They also showed that the oil film thickness, obtained from capacitance probe, increases with speed while it decreases with load; the results were confirmed by other researchers. Most recently, [16] reported the measurement of the oil film thickness for different lubricant using LIF and showed that the formulation and chemistry of the lubricant play a major role in the oil film thickness curves and that the cavitation structure is affected by speed and load. Another useful technique to visualise and measure cavitation bubble formation and its thickness is the digital holography method, which was described by [17] and used for the first time in an optical sliding bearing system. They showed that it is possible to produce high-resolution images to measure the bubble thickness and position. They also showed that the bubble thickness profile follows the curvature of the cylindrical bearing surface.
There are also several previous works that made use of optical engine to visualise the oil film flow in their optical engines and a summary is given by [9,10,18]. Initially, optical and electrical methods were used [18] and later on [19] acoustic techniques were employed to characterise the lubricant flow. With advances in technology, more development in optical engine took place by different researchers [20,21,22,23,24,25] and led to limited useful measurements in engine under non-firing condition using high-speed imaging and LIF to characterise the lubricant oil films flow in their IC engines. However, the research on optical engine in the literature was limited with the exception of the recent work of [10], in which a new optical engine is designed with full liner optical access which allowed qualitative and quantitative information of lubricant flow characteristics and cavitation between the piston-ring and cylinder-liner interaction area under real operating conditions with the same specification as that of unmodified engine under motorise and firing conditions.
The importance of the lubricants’ formulation and properties on cavitation formation, developments and its structure, has been explained above, which has been recognised by all researchers. Apart from that, there are other factors that can play significant influence on cavitation like heat (lubricant and liner-ring temperature, and the heat generated due to flow viscous shearing), liner-ring surface roughness and contact point flow geometry. For example, [26] carried out in-depth research in prediction of lubricant flow using Rayleigh-Plesset equation, control-volume thermal mixed and Elrod’s cavitation model in the compression ring-cylinder liner conjunction and showed at lighter loads and sliding velocity a more complex fluid flow with strong pressure and temperature gradient within the lubricant film that led to cavitation region at contact with varying volume fractions. On the surface roughness, [27] has investigated the effects of surface roughness on cavitating waterjet flow in turbulent flow and showed the intensity of cavitation can change significantly with surface roughness. Finally, on the contact point geometry, in particular the offset of the ring due to relative motion of liner/ring and ring face profile, which can change the diverging sections of the rings and therefore the generated hydrodynamics pressure at ring/liner interaction [28].
Considering the above, the current experimental work is designed to visualised the cavitation formation, development and collapse in a well-controlled sliding liner over a single ring lubricant assembly for three lubricants with difference viscosities at two cranking speeds (or liner sliding velocity, Vs) of 300 rpm (0–0.36 m/s) and 600 rpm (0–0.72 m/s). A special MATLAB programme was written to process images to provide quantitative analysis of cavitation characteristics. The following section provides details of the optical experimental set up, instrumentation and operating conditions. The results will be presented and discussed in the subsequent section and the report ends with a summary of the main findings.

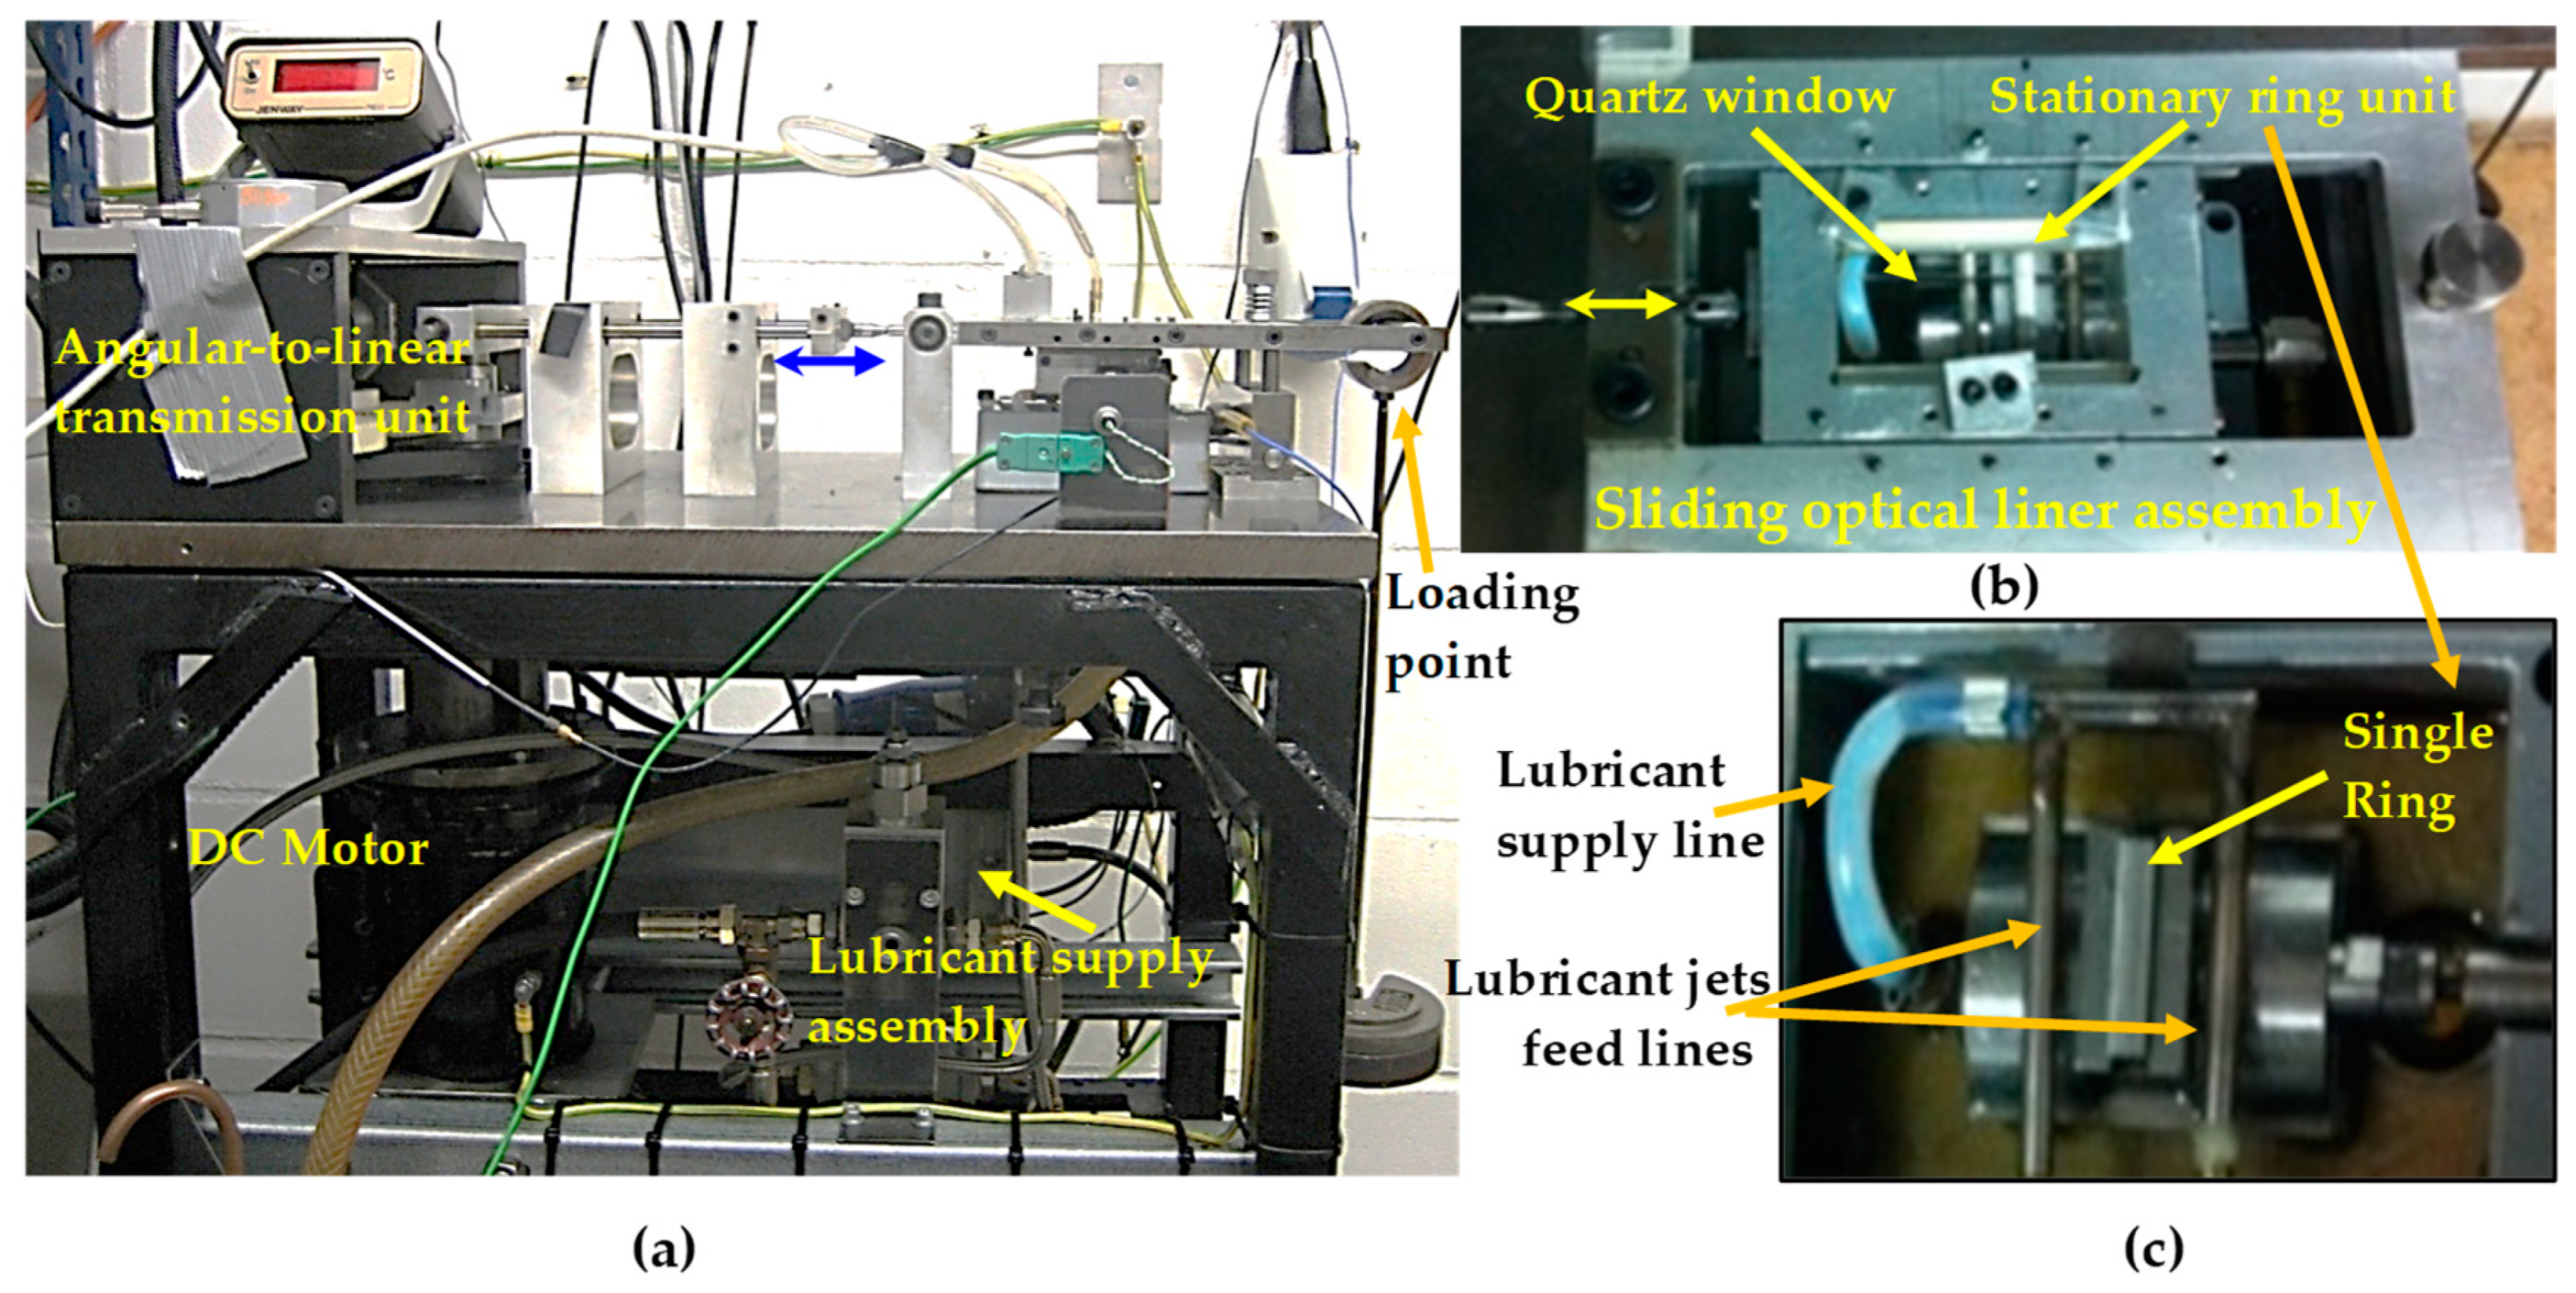
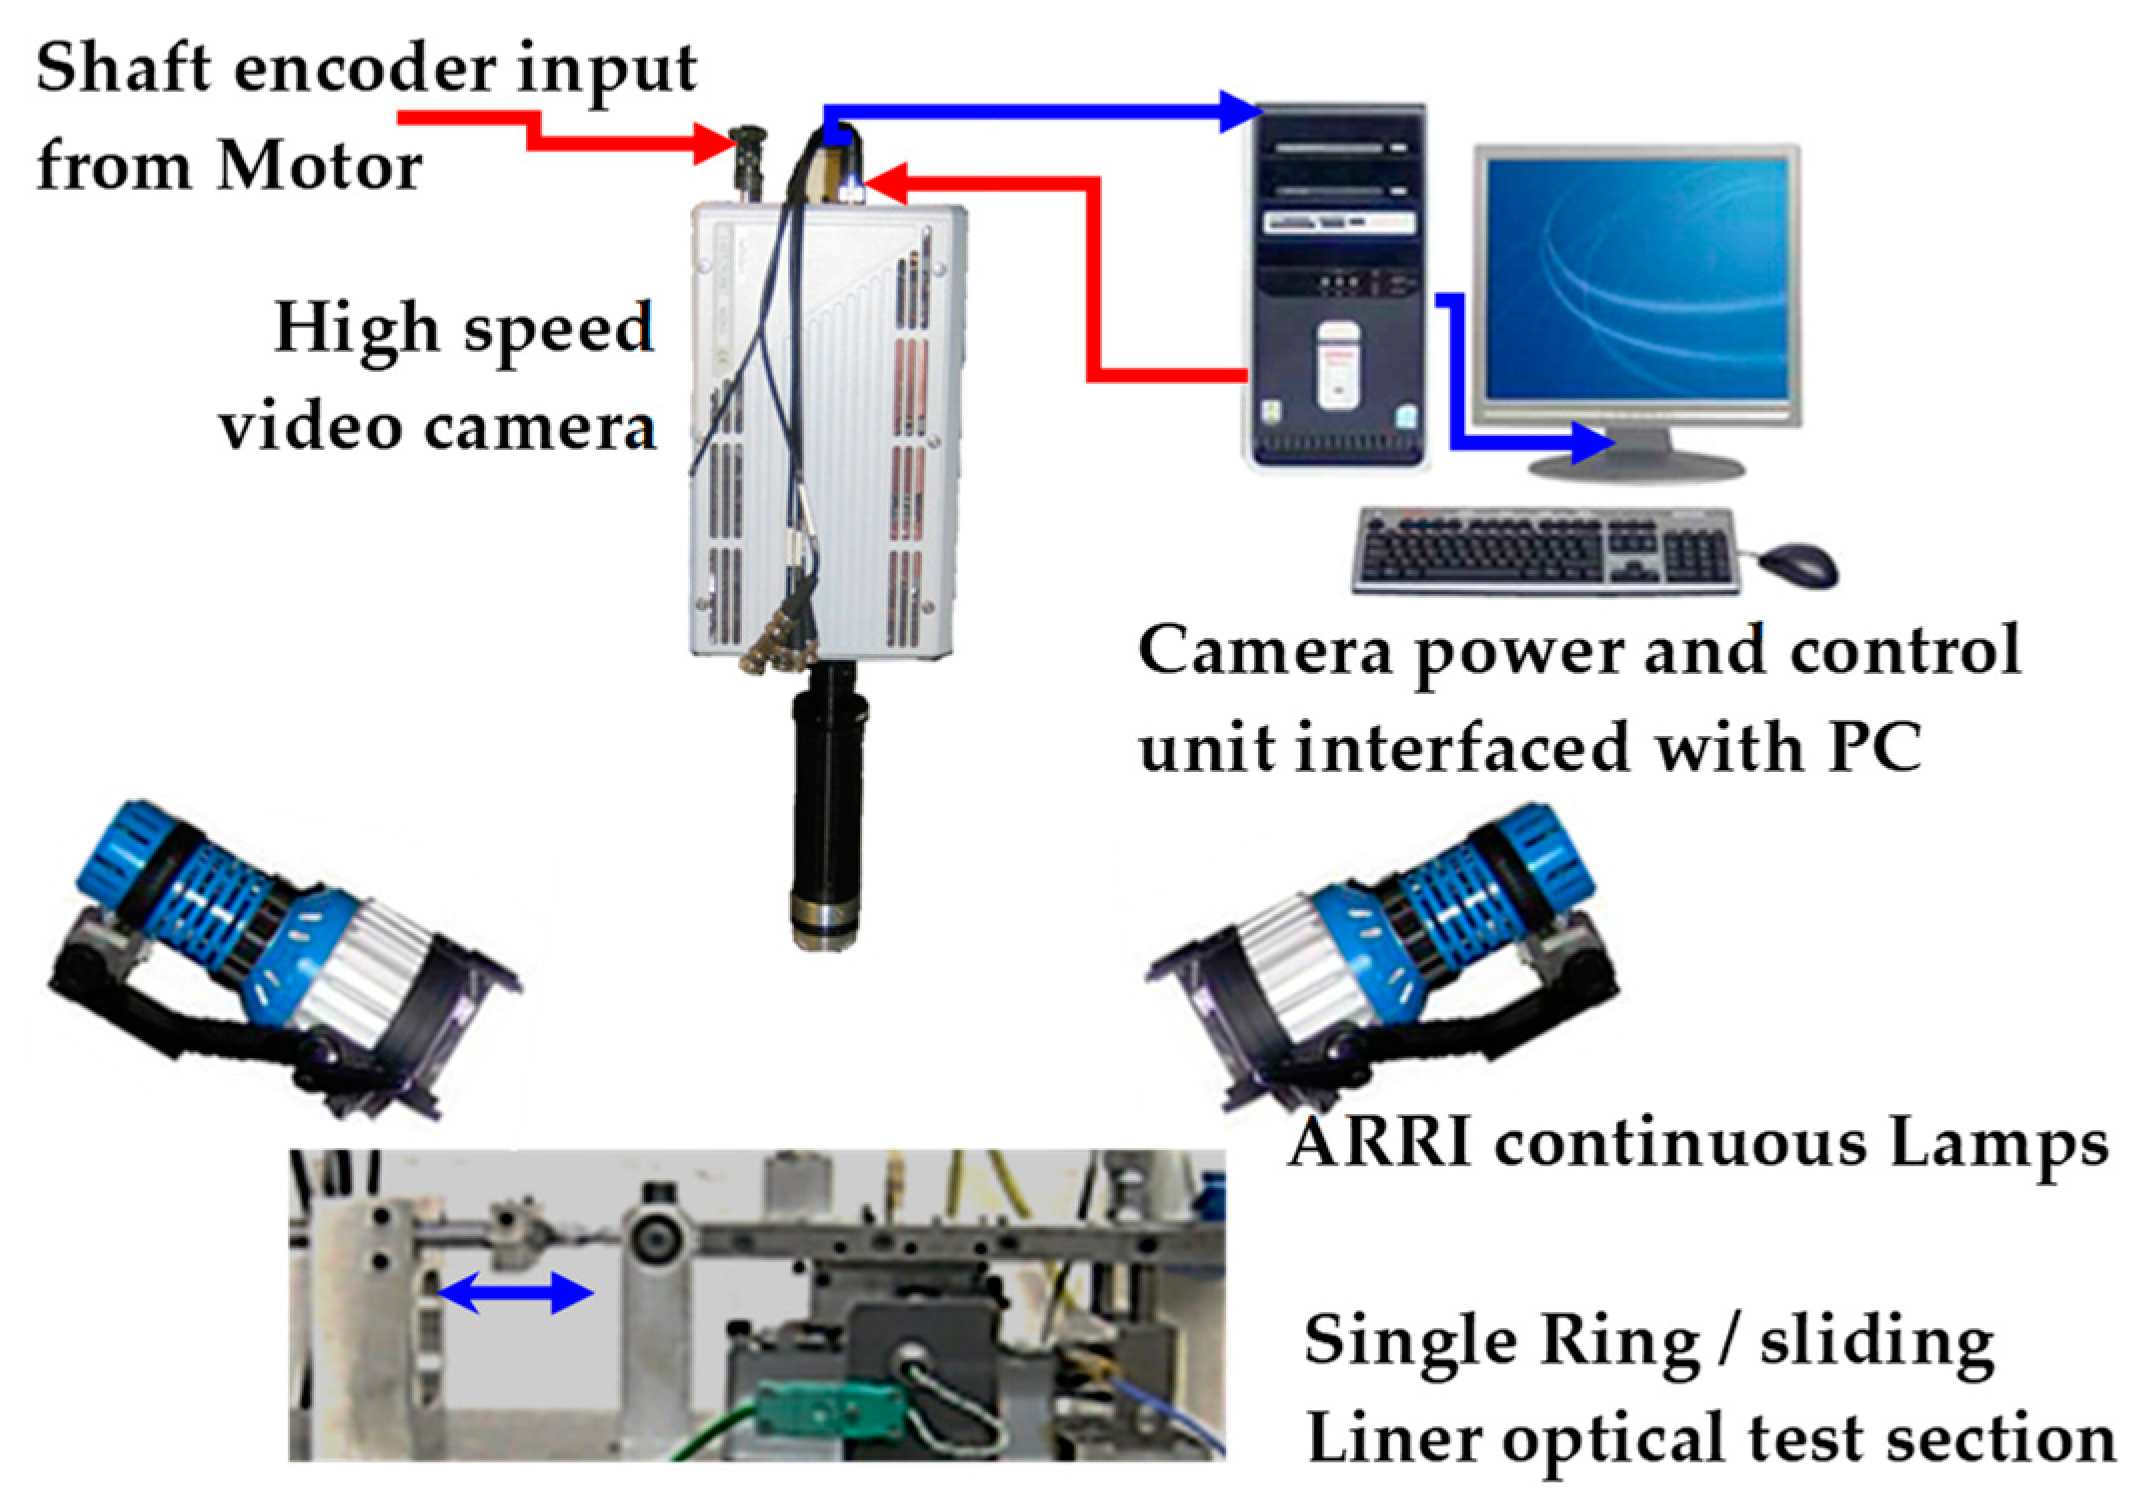
2. Experimental Set up and Instrumentation

The optical single piston-ring lubricant assembly is the same as that used by [9] and the full details of the setup, lubricants details, measuring sensors and measurement procedures are provided by [10] and will not be repeated here. Here a summary of most important aspects of the experimental setup, details of the different lubricants, image analysis using MATLAB, and the running conditions would be presented and discussed. Figure 1 shows the arrangement of the optical test-rig together with the liner and the ring units. The overall test-rig is shown in Figure 1a which consists of a sliding optical liner made of flat quartz window imbedded in an aluminum plate simulating the principle operation of a reciprocating motion over a single stationary ring unit. The sliding liner unit is connected to the crank guide linear bearing and transmission unit by an arm through several bearings where the angular motion of a DC electric motor is converted to linear motion; the DC motor was fully isolated from the rig to avoid any vibrations transmission. The sliding liner holder assembly, Figure 1b, was designed to allow access to the fixed ring unit, Figure 1c. The ring specimen is fixed in the ring holder which sits on a knife edge to allow it to tilt in the transverse direction ensuring good conformity between the ring and the liner. Controlled load is applied at contact point by a loading arm connected to the end of liner block assembly (shown in Figure 1a) through a set of high precision low friction roller bearing. The lubricant supply assembly consists of an electric pump that circulates the lubricant from supply tank to a filter and then to a heat exchanger before feeding into the ring/liner interface continuously through eight jets located on both sides (four on each side) of the ring to ensure a fully flooded condition at liner-ring interaction. The lubricant temperature was controlled via an adaptive system through the heat exchanger capable of varying and maintaining the oil temperature up to 80 °C with maximum variation of ±0.5 °C. The discharged lubricant is collected in a bath which is then directed back to the supply tank. This set up is used to visualise the oil film flow and cavitation using a high-speed video camera. There is also a non-optical arrangement that is capable of measuring oil film pressure, friction and thickness using pressure transducers, LIF optical fiber and capacitance.
The visualisation of the lubricant flow between the piston-ring and the cylinder-liner was performed using a high-speed video camera and appropriate lighting as shown schematically in Figure 2. The camera has been fixed and aligned normal to the sliding quartz window on an optical rail so that the lubricant flow and cavitation can be imaged. The images were captured by a Photron Fastcam SA1.1 high-speed camera equipped with Nikon 125 and 50 mm lenses, which has a 12-bit dynamic range and shutter speed down to 1 μs; it provides 5400 frame per second (fps) for the full resolution of 1024 × 1024 pixels, but the faster frame rate can be achieved for smaller resolution, e.g., a frame rate of 67,500 fps for a resolution of 256 × 256 pixels. High-intensity light sources were required to be able to capture the changes in the fluid flow within very short period of time. Two high-power ARRI lamps, each with 250 W power output, have been used to provide sufficient lighting. The light sources were also fixed on the same adjustable rail as the camera, which allowed for the consistent imaging throughout the experiment. The current optical setup using the high-speed camera and appropriate lighting allowed to obtain well clear images with high resolutions not only to observe and understand the dynamics of cavitation from initiation to collapse but also the images to be processed by the MATLAB for further quantitative analysis. It should be noted that the surface roughness of the quartz liner is different to that of real engine liner that can affect the cavitation behaviour which needs to be accurately quantified in a separate investigation.
Nineteen different lubricants with different formulations were tested; see [10]. The formulations were specified and supplied by BP and they were kept confidential. Each lubricant was tested at three different speeds; 100 rpm, 300 rpm and 600 rpm. These speeds were chosen according to the testing capabilities of the test-rig and they are proportional to the speeds of an automotive engine; 100 rpm was chosen to simulate engine speeds close to idle, while 300 rpm represents an intermediate operating state like cruising running, and 600 rpm, represents the engine state during rapid acceleration or when a vehicle is reaching its top speed; for 300 and 600 rpm tested here, the corresponding liner maximum sliding velocities, Vs, are 0.36 m/s and 0.72 m/s at mid-strokes at 90° and 270° cranked angles (CA). All tests reported here were made under a constant load of 977 N/m applied on the ring-liner contact point the same as that used by [9] who used the same liner-ring assembly to measure the oil film thickness (OFT), friction and pressure distribution at contact point and showed that at 300 rpm the OFT varied from a minimum of 0.5 μm min to a maximum of 1.6 μm; the corresponding values at 600 rpm were 1.0 μm and 2.6 μm. The friction at this load was found to be similar for both speeds at around zero with maximum values of around −0.25 N and 0.23 N at 30° CA and 210° CA, respectively. The testing was also made at different lubricant flowrates supplied into the area between the ring and liner interaction to account for engine’s plethora of different operating conditions under different loads. The control of the lubricant flow rate was achieved using a control valve located at the oil feed line. The flowrates used were 0.05 L/min and 0.02 L/min representing the fully flooded and starvation states of engine, respectively. The testing of all the different lubricants under all the operating conditions generated many interesting observations that offered a great insight to the better understanding of their behaviour inside an IC engine environment as presented and discussed in [10]. In this report, the focus is on testing some lubricants with different viscosities at different speeds; information on their formulation are confidential and not available; the tests operating conditions of those lubricants considered here are summarised in Table 1. The lubricant temperature was set to 70 °C during this investigation similar to that of engine, but the liner and the ring were at room temperature which can have consequences on cavitation behaviour.
In general, piston-rings come at a range of shapes and profiles. The current optical test-rig ring is equipped with a curved profile and the high contact point is at an offset from its centerline. The ring used on the lubrication test-rig has a thickness of 5 mm as shown in Figure 3a,b which shows the images of oil film cavitation for a typical case at both the up-stroke and the down-stroke running conditions; the length of the stroke was set at 22 mm with a surface roughness of two order of magnitude (Ra < 3 nm) less than the typical metal liner. The full details of the fixed ring profile are given in [9], Figure 3c. The ring is 5 mm wide with a surface roughness of 0.35 μm and in the current arrangement, due to the sliding liner motion and the tilting mechanism beneath the ring, the minimum gap point between the liner and ring is at an offset location away from the centerline towards the lower edge of the ring as shown in Figure 3a,b by a white dashed line. As a result, the ring profile is not symmetrical around the minimum gap point with different radius of curvature on each side and therefore different diverging wedges and flow passages for the up-stroke (above the white dashed line) are much larger than that for the down-stroke (below the white dashed line) motions which, in turn, influences the generated hydrodynamics pressure profile within the diverging flow passage [28]; this may have a direct effect on the timing of the lubricants’ cavitation and on their characteristics. It should be noted that the solid black sheet area and strings are the cavities where air in contact with liner, and that the gray area is the lubricant film; it is an image of the ring surface as seen by the camera through the lubricant film.
Full details of the processing software are given by [10]. In brief, the processing of the data has been performed with algorithms developed in MATLAB, which allowed the translation of the images into quantified data. For this analysis, certain set of thresholds, based on reflected light intensity, required that would specify the parameters which would be extracted out, like the length, width, covered area by and the number of cavities (string). Some of the extracted values like the length of the cavity are shown on the enlarged image of Figure 3 for both up- and down-stroke motions. The length of the cavity is defined as the total length of the string plus the cavity sheet, shown as dark black region in the images which is more evident in the up-stroke motion, and that the cavity width is the distance between two adjacent strings. The software first removes the background non-cavitating noise, then extracts all the information by treating each picture as a separate digital matrix and while it reads each matrix, it compares the data to the set thresholds to filter out unwanted information; the cavitating areas are recognised by detection of the high reflected light intensity areas, as evident in Figure 4, and a sophisticated filters and machine learning techniques was used to separate the cavitating area from those generated from scattered lights of the surrounding metal surfaces despite removing the initial background noise.
To ensure the collected data on area, length, width and number of string cavities are correct and free from any misread information, the software would provide a visual feedback of collected processed data to the user on screen at real time. Figure 5 shows a snapshot of such feedback where the red cross markers in the middle indicate the individual string cavities and the green markers indicate the cavitating areas. From Figure 5, it is evident that the software has detected two wrong cavitating areas on the bottom of the image and two small spots on the top due to scattered noise as mentioned above. Although the software has detected these wrong areas, they have been deleted during the post processing using the sophisticated filters as mentioned above, and only the area around the cavitation region in the middle of the image will be logged for further processing. Nevertheless, it has been recommended [10] that further refinement on the thresholds requires for the area and width analysis to achieve better accuracy. In this paper, the extracted data on the length and the number of string cavities is post processed for three different lubricants and their variations with crank angle, CA, are presented in the results section.

3. Results and Discussions

Due to reasons of space in this report, only a typical sample of consecutive raw images in up- and down-stroke cycles are presented and discussed to provide qualitative understanding of cavitation development during the full cycle, while the quantitative results are presented and discussed in the form of graphs extracted from the images for different viscosities and speeds.

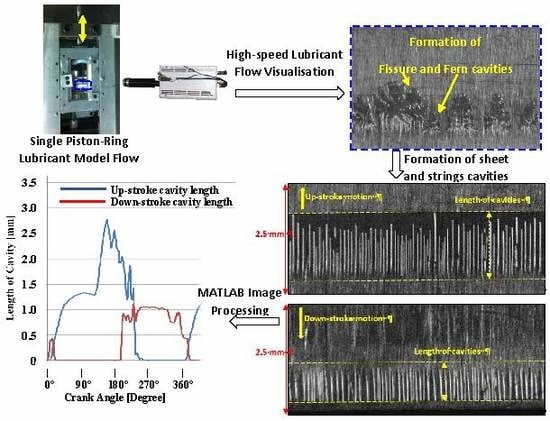
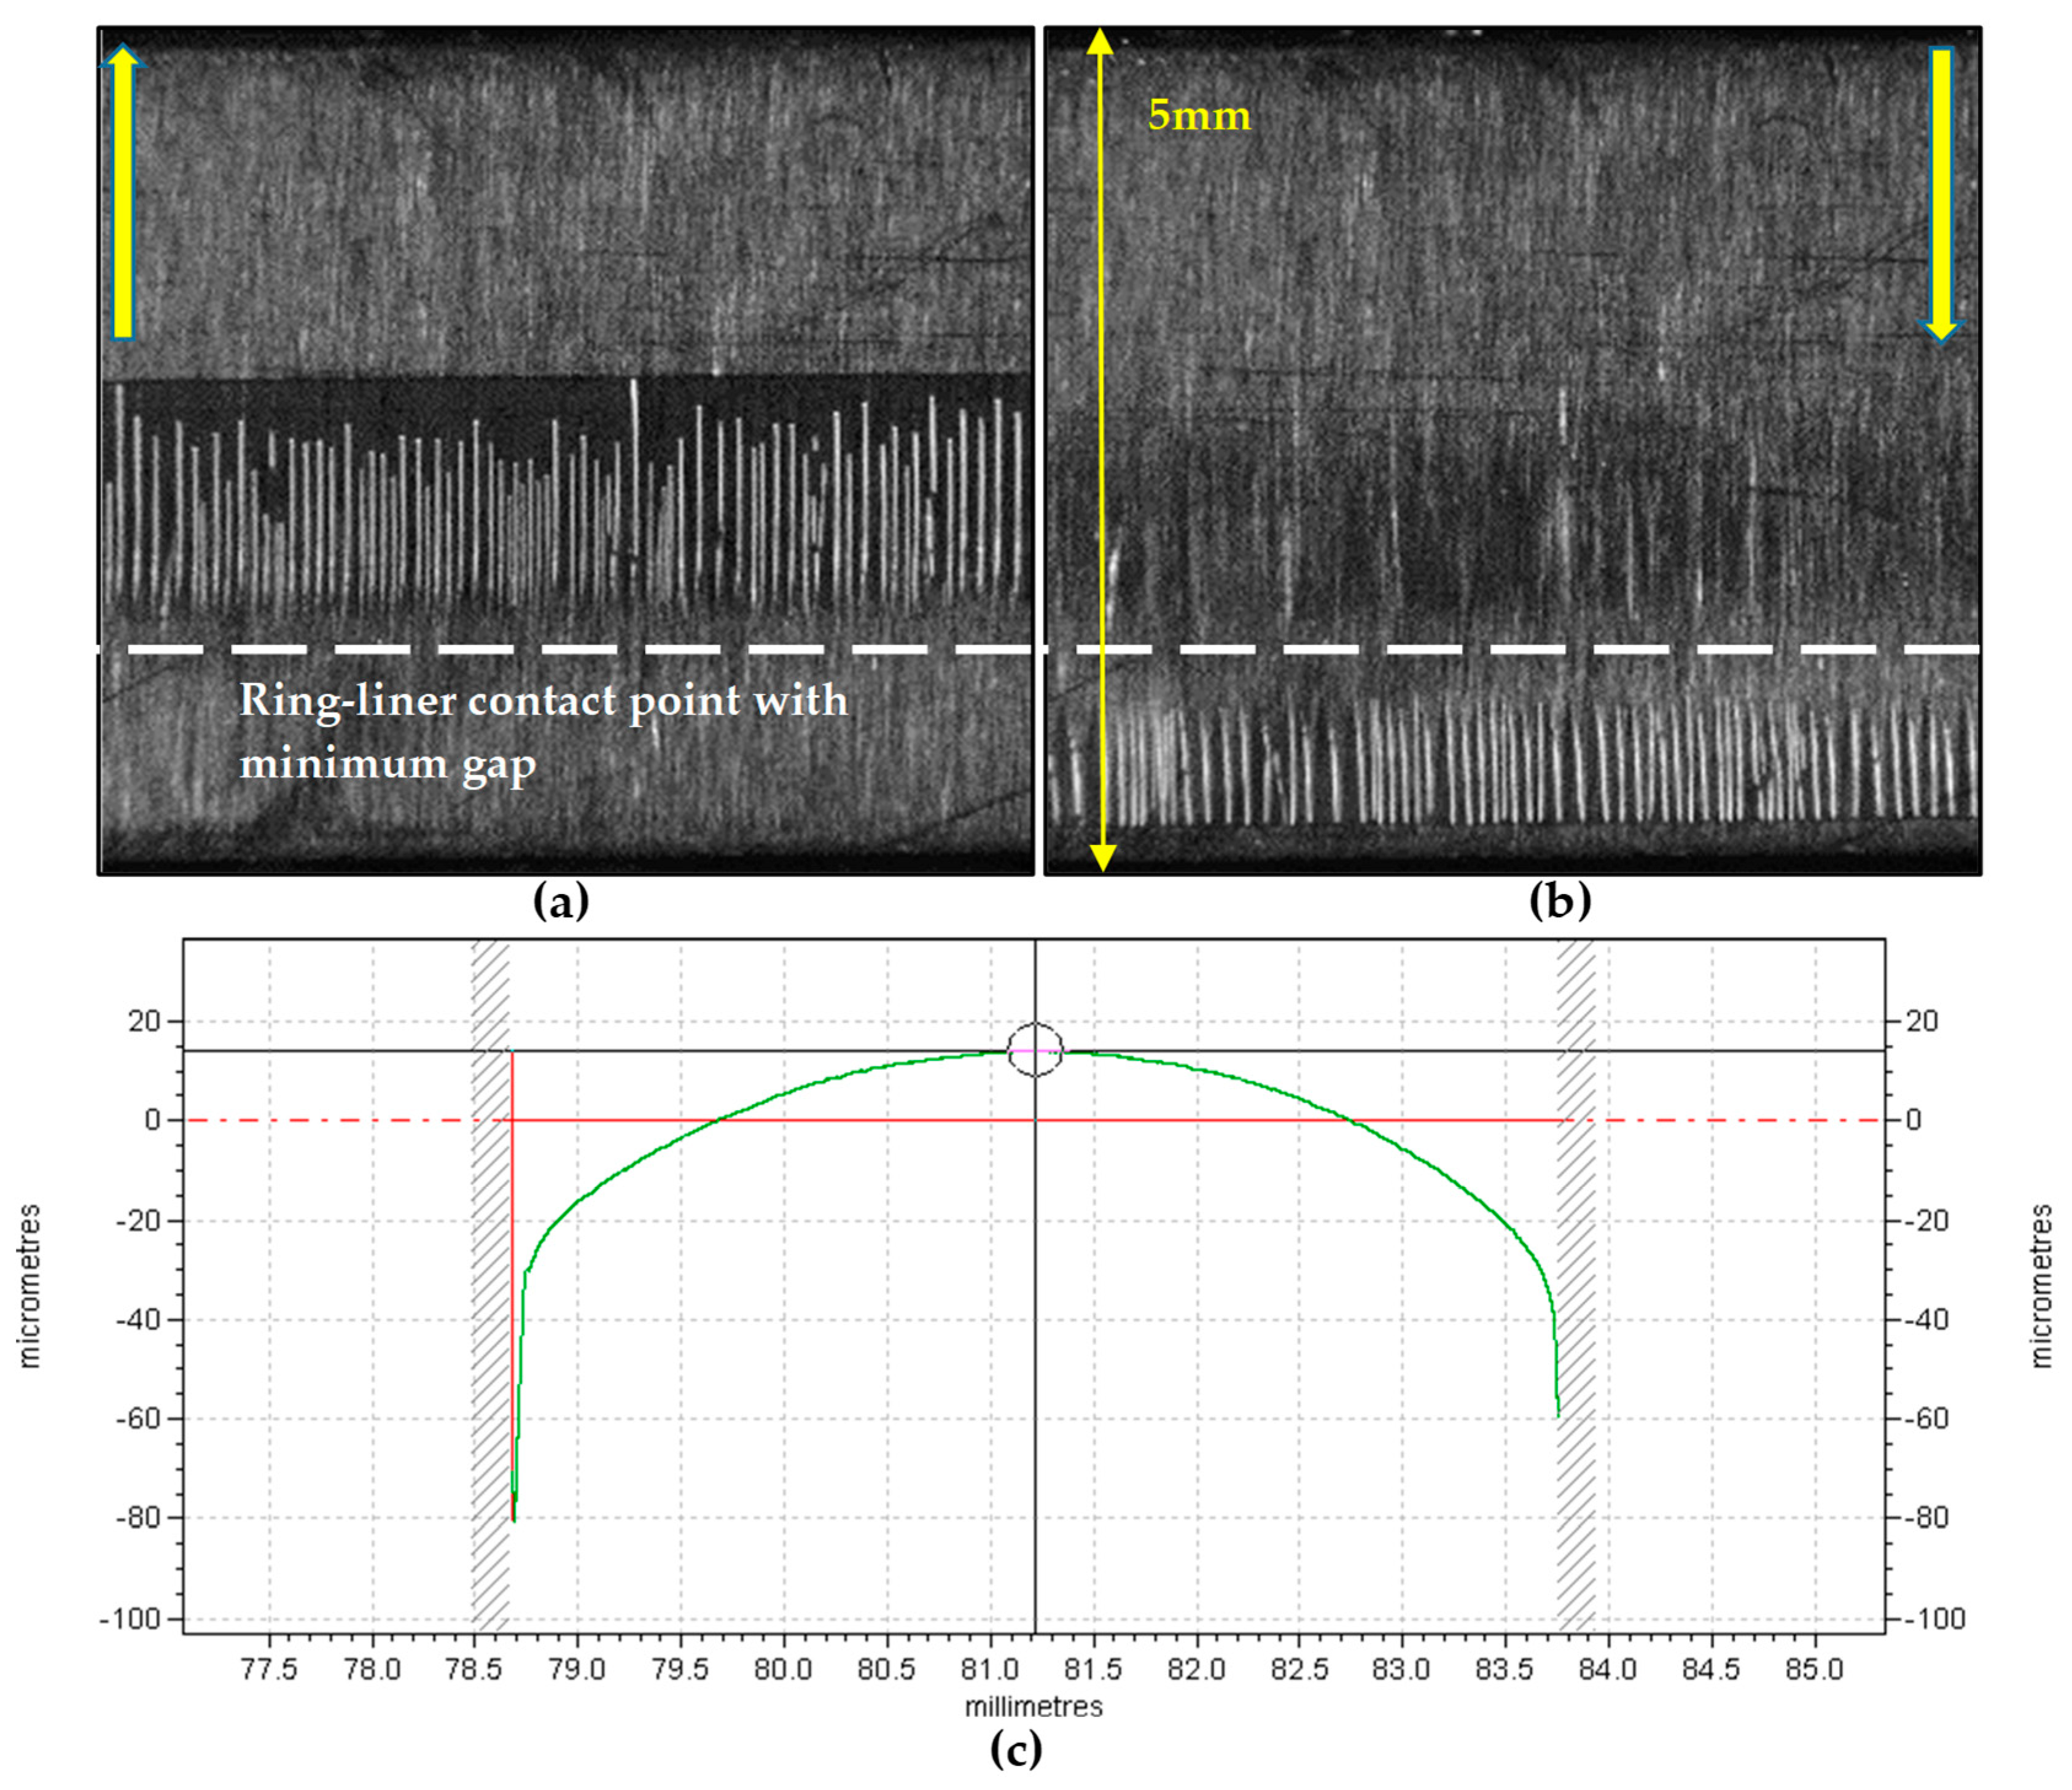
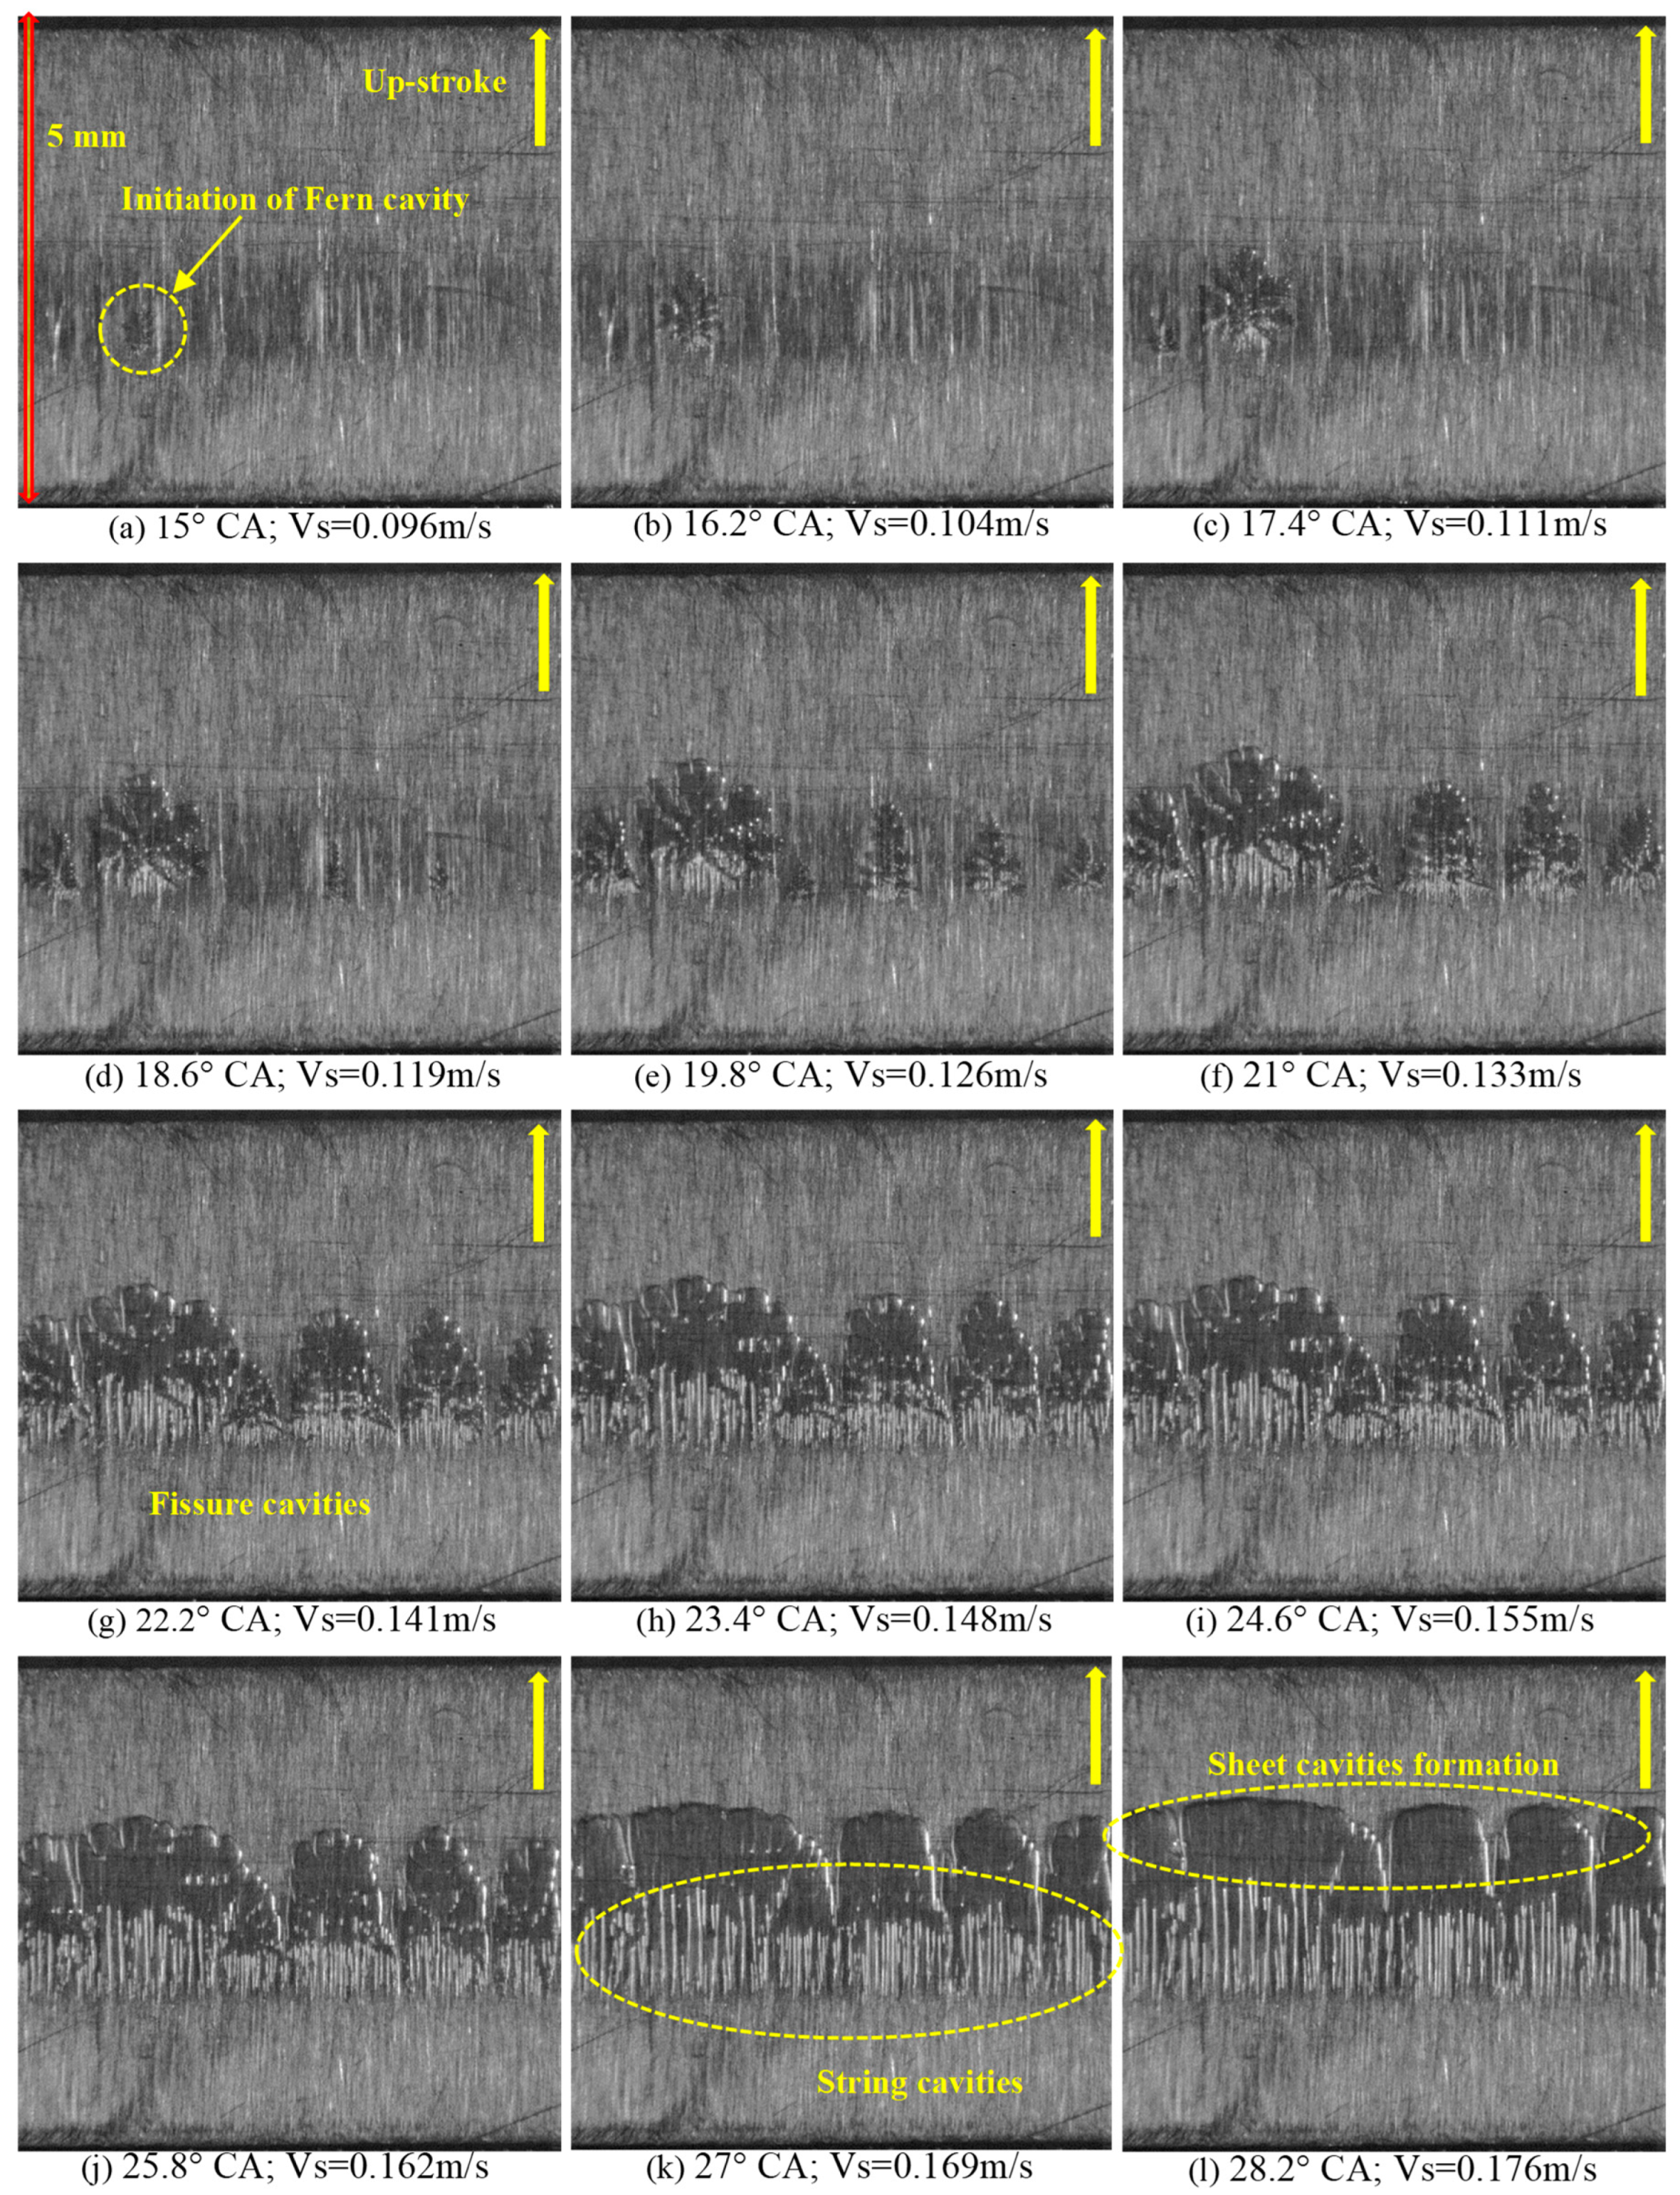
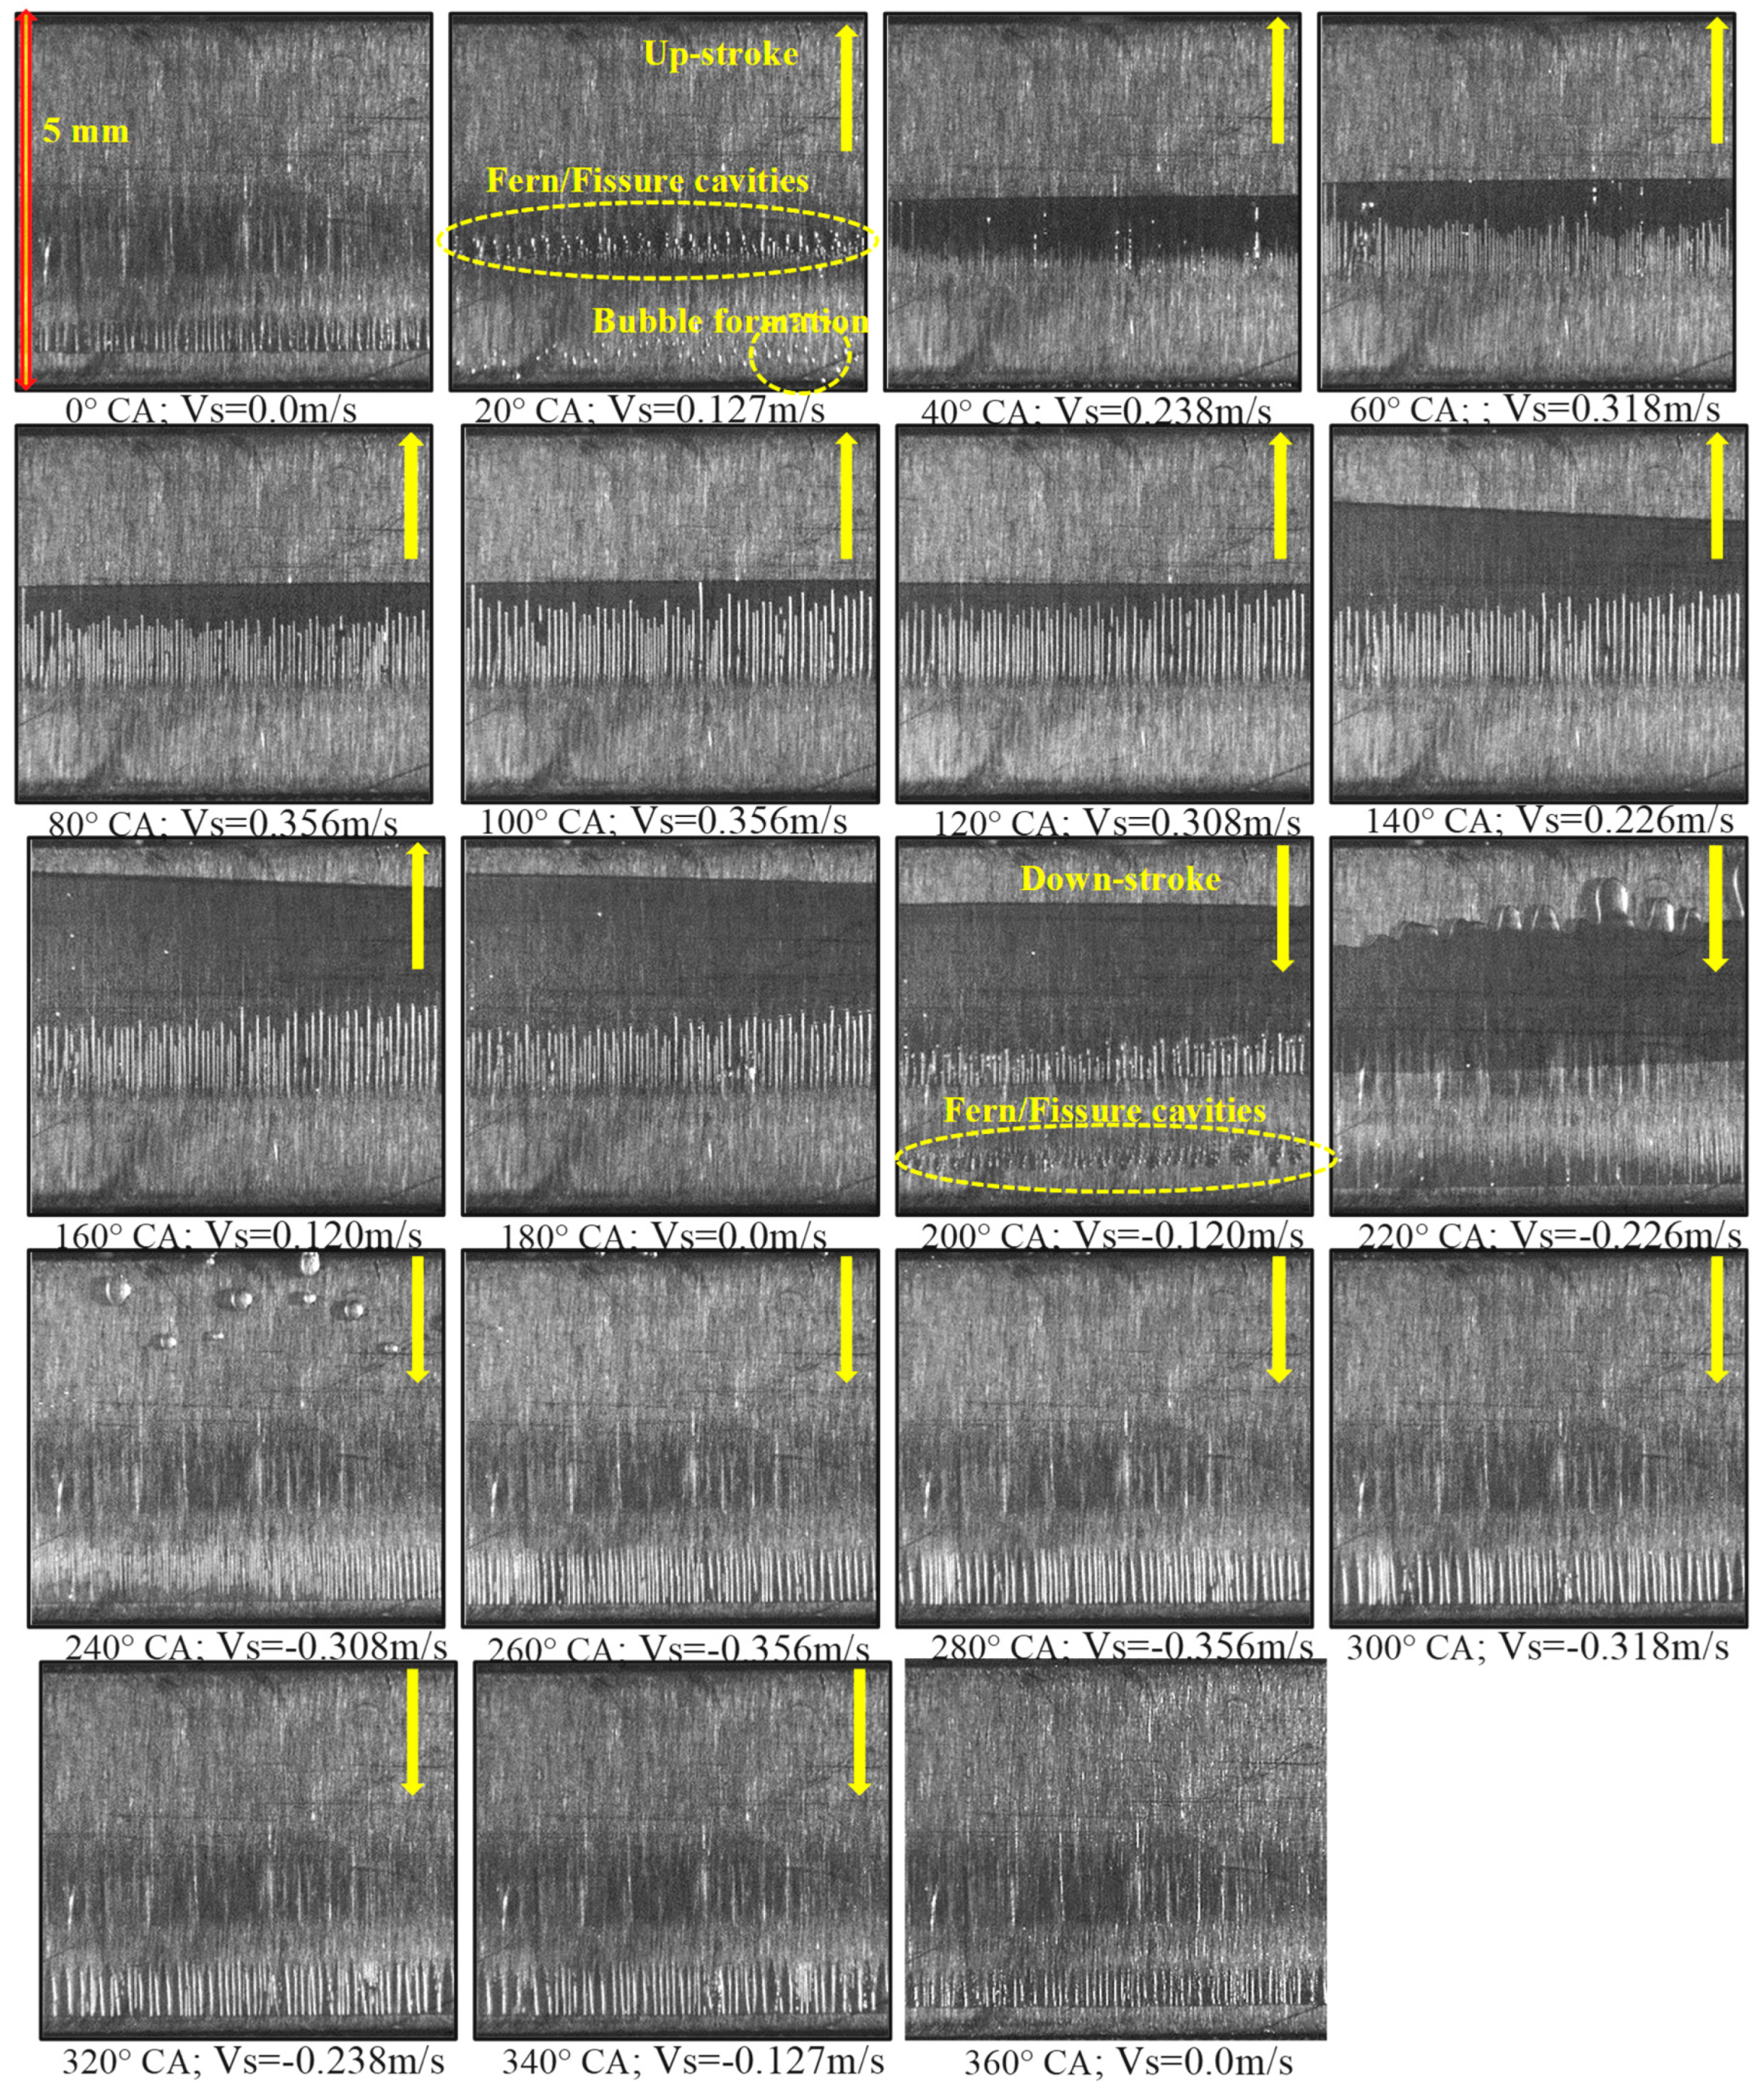
3.1. Visualisation Results

Figure 6 and Figure 7 present consecutive images of Lubricant A for real time cavity formation and the full cycle (0°–360°) with 1.2° CA (or 0.33 ms with 6000 fps recording rate) and 20° CA (or 11 ms with 3000 fps recording rate) intervals, respectively, at a speed of 300 rpm, a temperature of 70 °C, a lubricant supply rate of 0.05 L/min. As mentioned above, these set of unprocessed data provide a better understanding of cavitation development, which also offer clear information that help to explain better the characteristics and trends of the following quantitative results obtained through the MATLAB algorithms.
The images of Figure 6 illustrate the real time formation of fern cavitation and its development to sheet and strings cavitation during the up-stroke motion for Lubricant A with highest viscosity. The reference zero time (Figure 6a) is fixed at the initiation of the fern cavity which is around 15° crank angle (CA), and that the time interval between images is 1.2° CA; the liner sliding velocities, Vs, at each crank angle are also given in the caption of each image. The first small fern cavity noted is shown in Figure 6a, which is initiated in the diverging part of the ring at a given nucleation site within the yellow circled zone. With time, the fern grows and other ferns start to appear so that at 18.6° CA it grows almost three times and another three small ferns are initiated at different nucleation sites; at 21° CA the ferns almost spread across the ring within the frame. As the ferns grow, they coalesce to form fissure type cavities (22.2°–24.6° CA) and spread rapidly in a fractal-like structure. The fissure cavities are unstable and changes rapidly with time so that their forefronts merge together to form a stable sheet cavitation across the ring while at their tails they breakup into stable string type cavitation, which are also spread across the ring as it is clearly evident at 27° CA and onwards, Figure 6k,l. The breakup of the cavities at the tail of the fissures may well be due to strong pressure variation in the beginning of the diverging part of the ring. The sheet/string cavities will be developed further with time and this will be explained below when presenting Figure 7. Similar development phases have been observed in down-stroke motion. The cavities development and their patterns were found to be very repeatable from cycle to cycle both in up- and down-stroke motions. The observed patterns were in good agreement with those reported previously [9]. Intestinally, it was observed from all recorded images that the onset of cavitation starts at around 15° CA during up-stroke motion for all lubricants and at both speeds; the differences were small to give any particular trend. Similar conclusion observed for down-stroke motion which suggests that within the measured rang there was little or no influence of either viscosity or speed on the onset of cavities.
Figure 7 presents the cavitation development and their collapse during a full cycle covering both up- and down-strokes as are indicated by the yellow arrows on the images. The formation and development of fern cavities to sheet/string cavitation were presented in Figure 6 and here the focus would be on the development of sheet/string cavitation as a function of crank angle (CA) with 20° CA interval with the 0° CA represents the beginning of a cycle at BDC; there are no arrows at 0°, 180° and 360° CAs as the liner relative velocity to the ring at those time is zero; i.e., it is either at the BDC or TDC.
At the BDC, 0° CA, although the liner is stationary, the results show the presence of some sheet and string cavities near the bottom of the image that remain from the previous cycle. It has been observed that this phenomenon happens also at the beginning of the down-stroke motion when the liner comes to rest as will be seen later. This may be due to slow recovery of the sub atmospheric pressure and delaying the full collapse of cavities when the liner comes to rest. At 20° CA, when the liner accelerates in up-stroke direction, the remaining cavities from previous cycle have collapsed and the string cavities disintegrate and break down into bubbles towards the trailing edge. At the same CA on the leading side of the ring (indicated by a yellow elliptical enclosure) new cavities have started to generate. These cavities are still at the early stage and show the presence of both fern and fissure cavities that were discussed above. These newly generated cavities will continue to develop with time so that in the next frame at 40° CA the cavities have developed into string cavities and a continuous sheet cavity in front of the strings identified as solid black area. These sheet/string cavities developed further at 60° CA with well-defined sheet cavity and string structure so that the strings’ number and heights can be visually estimated. At 80° CA, when the liner approaching its maximum velocity, the cavities reach their full development state with an increase in the length and width of strings and a small reduction in the number of strings compare to those at 60° CA. This suggests that as the strings grow the tightly packed adjacent strings will merge together to form bigger strings. Further increase in strings’ length and reduction in their number has been observed at 100° CA of strings and then their structures remained the same up to 140° CA with no significant change in their behaviour or physical properties; note that the sheet cavity structure from 60° CA to 120° CA remain unchanged with the same overall cavity length of 1.36 mm as measured from the images.
As the liner slows down towards the TDC at 140° CA, significant changes can be seen in cavities, in particular, the sheet cavity which has been stretched (and perhaps become thinner) outwards towards the leading edge (top) of the ring. The strings’ number and length seem to be unchanged and similar to those observed at 120° CA. The sheet cavity has stretched further towards the leading edge when the liner comes to rest at TDC (180° CA) covering almost half of the ring surface, and at the same time the string cavities start to be weakened and reduced in length, which suggests they are collapsing and joining the sheet cavity. It is difficult to explain these changes, particularly, the stretching of the sheet cavity, and this requires further investigation to establish links between oil film pressure, thickness, motion and the liner movement. It is interesting to note that no such stretching in sheet cavity was observed with other two lubricants as will be seen later.
The collapse of the sheet/string cavities are more evident when the liner changes its direction into down-stroke motion at 200° and 220° CA similar to those observed at the beginning of the up-stroke motion. The strings seem to be collapsing aggressively with considerable reduction in length and number, and the same for the sheet cavity so that at 220° CA all remaining string cavities from up-stroke motion fully collapsed and disappeared and that the sheet cavity starts to disintegrate and broken down into vapor bubbles. On the other hand, at the 200° CA, when the liner is accelerating in down-stroke direction, new cavities (indicated by a yellow elliptical enclosure) are formed in the lower part of the ring where the presence of both fern and fissure cavities are clearly evident. The new generated cavities continue to develop with time so that new strings cavities can be seen clearly at 240° CA and, like in up-stroke motion, they have developed further at 260° CA with formation of a small sheet cavity in front of the strings. The strings grow with an increase in the length and width and a reduction in their number, similar to that observed during the up-stroke motion, and they appear to reach their full development state between 280°–320° CA with no significant change in the string and sheet cavities’ behaviour; the average measured length of cavity from images during this period was 0.91 mm. At 340° CA, the strings start to break down with a reduction in their length and this process is accelerated with time so that at the BDC (360° CA) the cavities are disintegrated considerably when the liner comes to rest.
The most important differences observed in cavities during the up-stroke (0°–180° CA, on the middle and upper part of the ring) and down-stroke (180°–360° CA, on the lower part of the ring near the edge) motions are the length of the cavities which appear to be longer during the up-stroke motion, and that the overall area of the sheet cavities are much larger on the upper part of the ring during the up-stroke motion. These differences in cavities are directly related to the ring profile which is not symmetrical and the contact point with the liner at an offset from the centerline (much closer to the lower edge of the ring) and different radius of curvature on each side causing different pressure profiles during each stroke, and also, much larger diverging area during the up-stroke motion, as explained and shown in Figure 3; the latter is important as the limited space during down-stroke would only allow the cavity (sheet and string) length to grow to the lower edge of the ring.

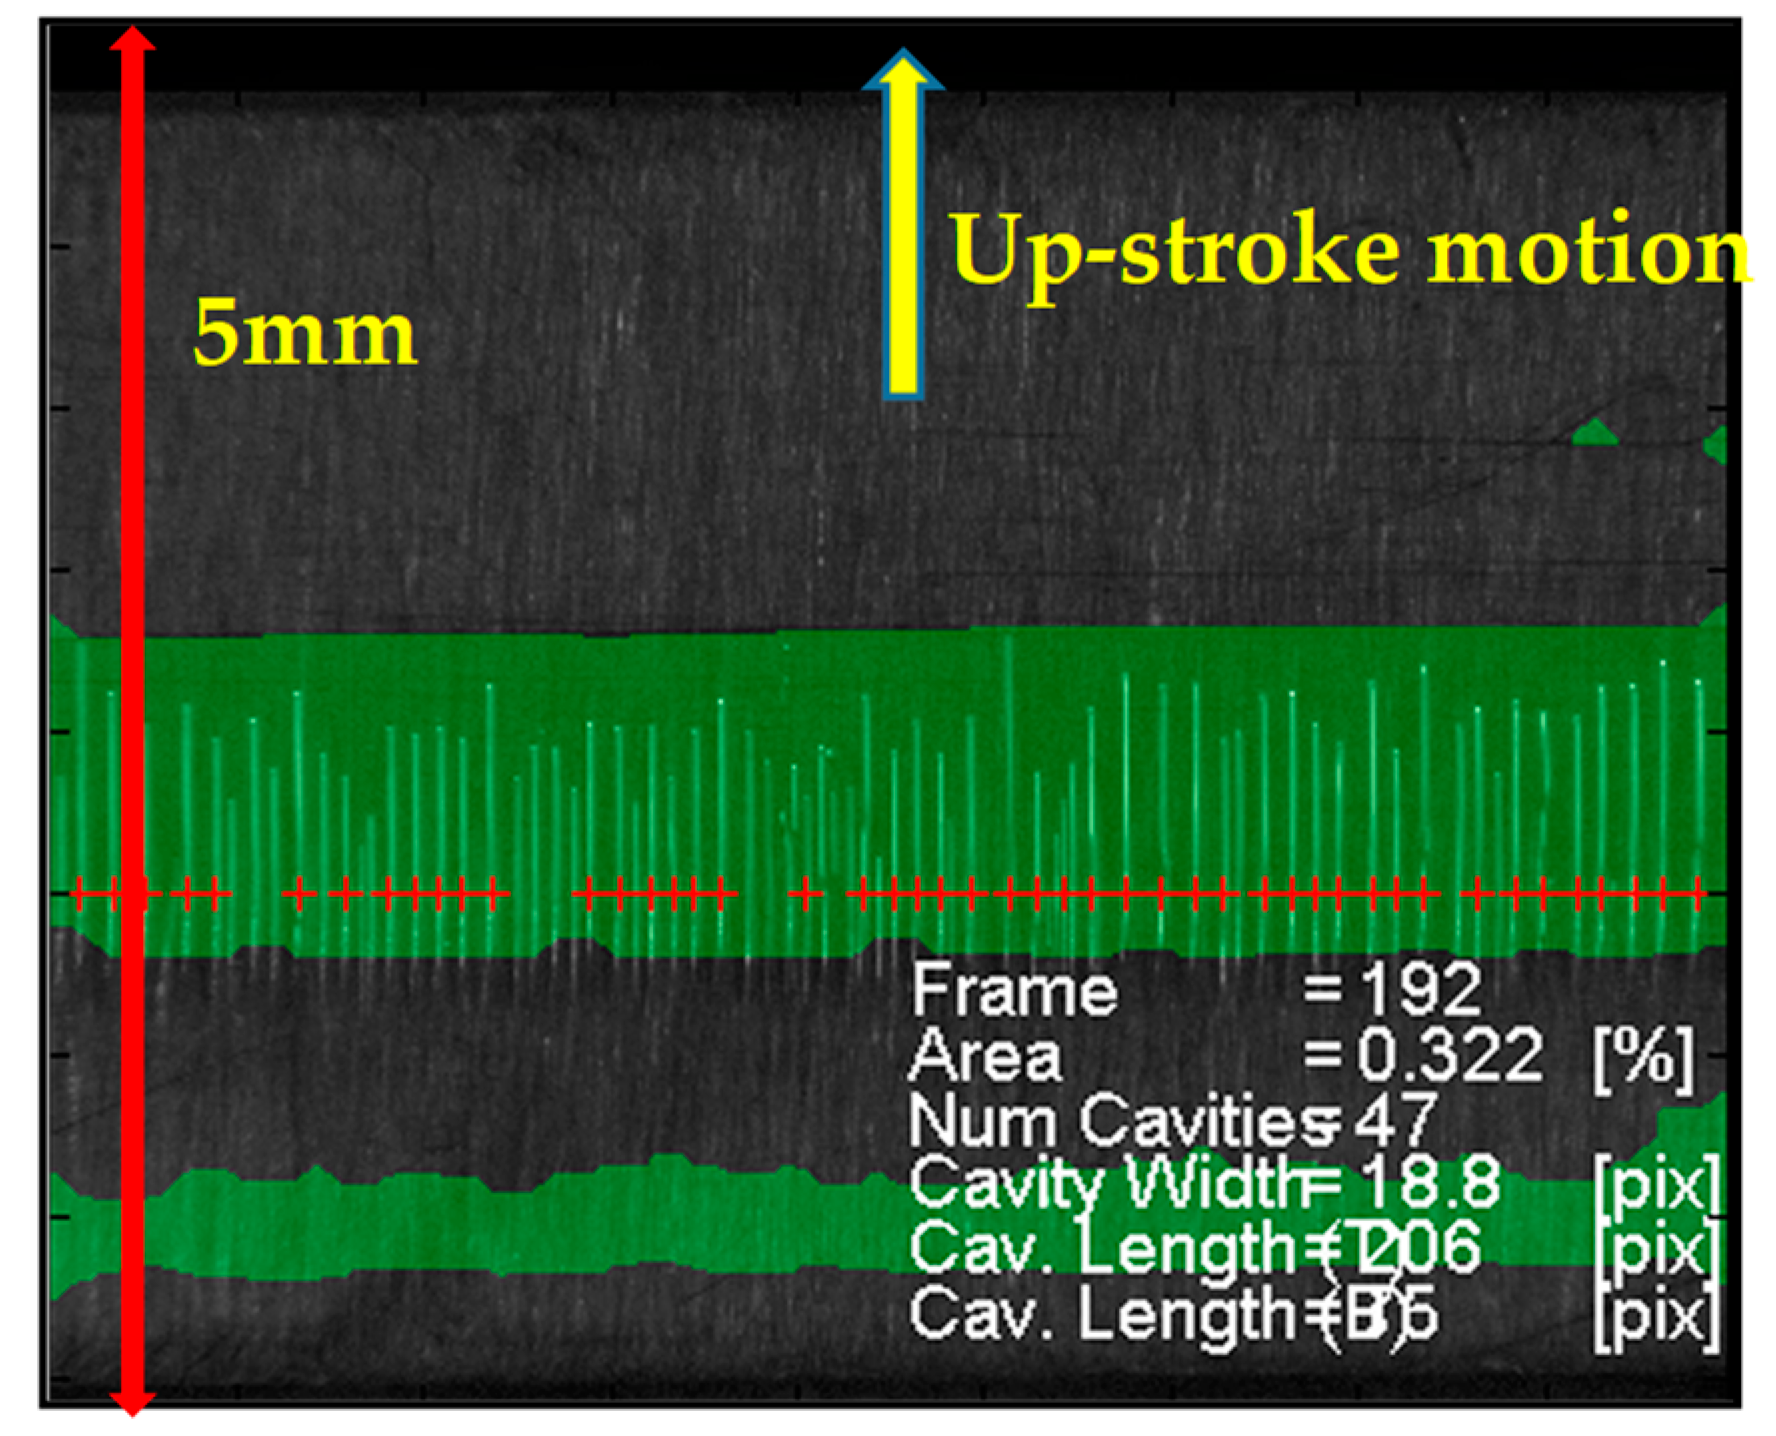
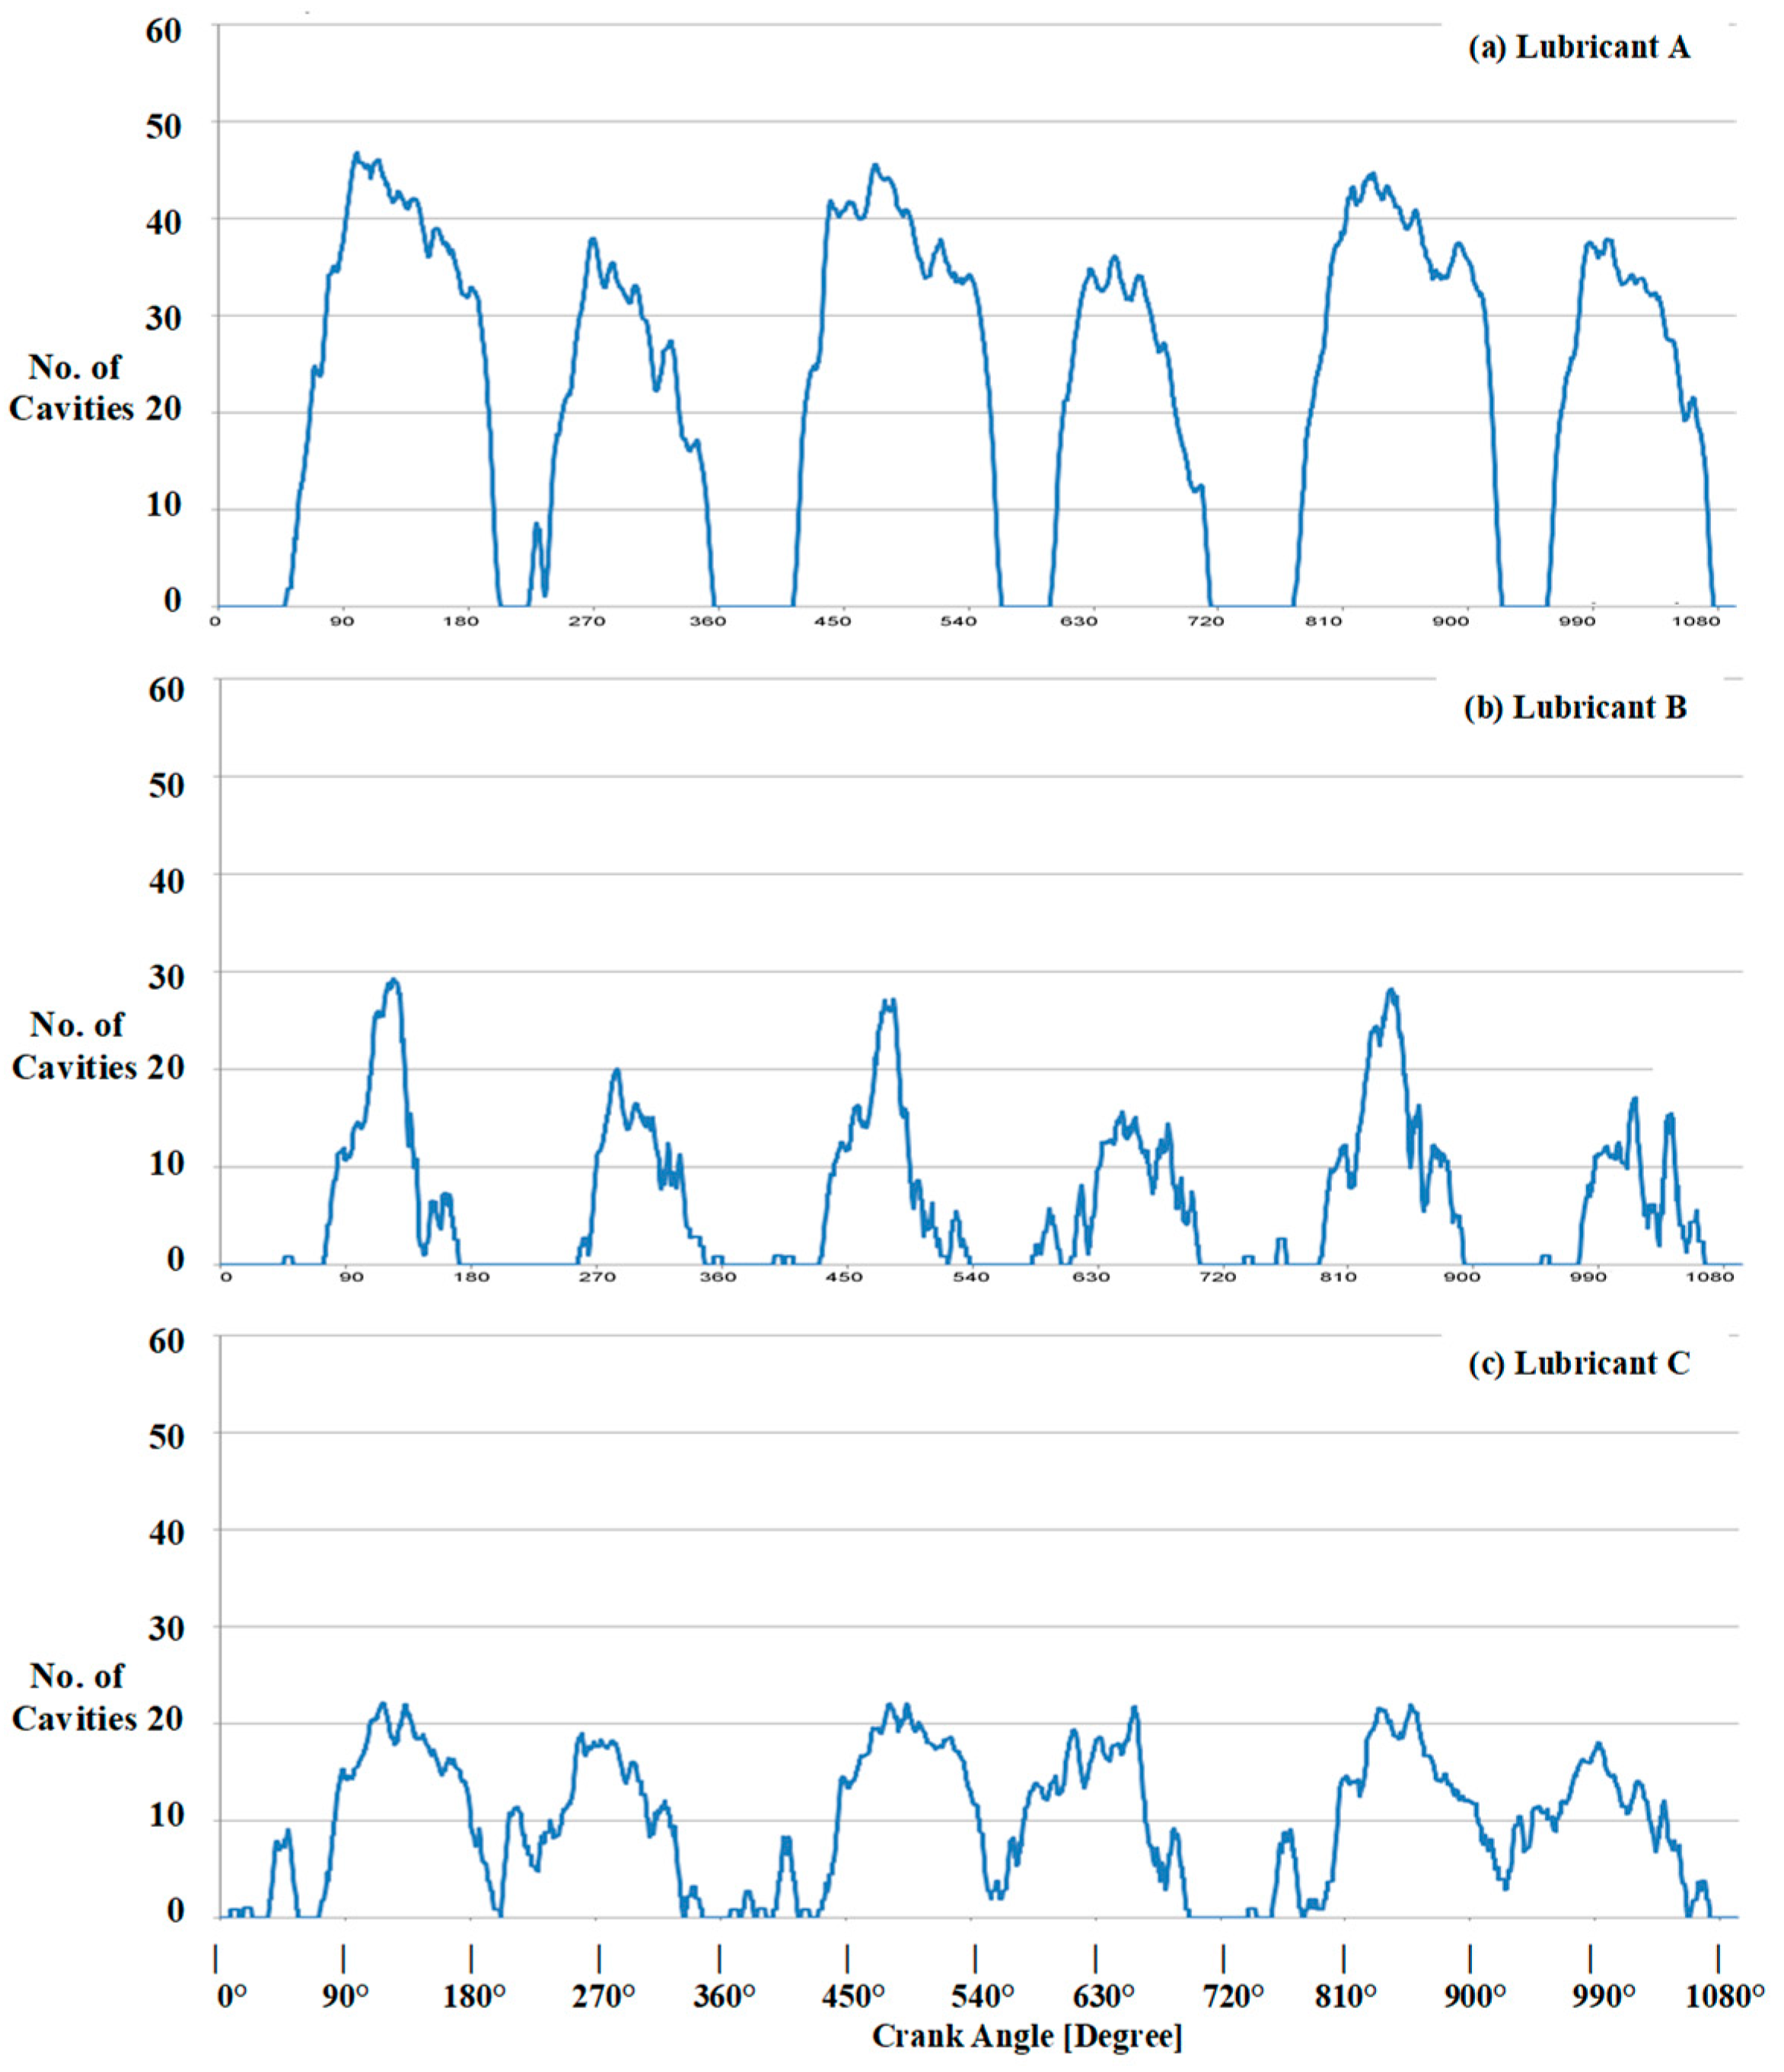
3.2. Processed Results

The extracted data using MATLAB will be presented and discussed in this section for three lubricants A, B and C with kinematic viscosities of 45.6, 30.9 and 20.2 cSt, respectively, at two speeds of 300 and 600 rpm, oil temperature of 70 °C and a supply oil flow rate of 0.05 L/min. The full cycle is 360° CA covering both up-stroke (0°–180° CA) and down-stroke (180°–360° CA) motions and the results will be presented for three consecutive full cycles to give a measure of repeatability. The results for the number of the cavities are presented first and followed by the length of cavities.
Figure 8 and Figure 9 show the number of string cavities as they develop with crank angle, CA, over three consecutive cycles at 300 and 600 rpm, respectively, for three lubricants. Figure 8A gives the variation of the number of string cavities for Lubricant A, with highest viscosity, and show a good degree of repeatability in all three cycles both during the up-stroke and down-stroke motions. The results during both strokes show the number of string cavities increases rapidly with liner speed to a maximum number at around crank angles when the liner speed is maximum with values up to 47 and 38 for up-stroke and down-stroke motions, respectively. Then the number of string cavities start to decrease gradually with decrease in the liner speed as was observed in images of Figure 7 when the string cavities merged together and reducing their numbers, and that there is a rapid decrease in number around the end of up-stroke and down-stroke motions when the cavities collapse and form bubble, again as observed in the images above. Similar patterns can be seen with Lubricant B with lower viscosity, Figure 8B, but with reduced number of string cavities by almost a factor two and that the initiation of cavities is delayed to higher CA causing a similar shift of the maximum number of string cavities to higher CA. These features are also present with Lubricant C (the lowest viscosity) of Figure 8C, in addition, the lack of cavitation in between the up-stroke and down-stroke motions is clearly evident. Although the expectation was to have more cavities with less viscous lubricant, the current results at this speed show otherwise. This may well be due to different formulations/compositions of the lubricants and viscous modifier that define their internal molecular forces, in particular, the surface tension that can change the cavitation development process. Unfortunately, due to confidentiality, the composition of the viscous modifier has not been made available, which would have helped to explain the observed changes.
Figure 9 presents similar results to those of Figure 8 but at higher speed of 600 rpm and the results show significant increase in number of string cavities, in particular at the two lower viscosity lubricants so that the number of string cavities become much more similar for all lubricants. This is mainly due to increase in the oil film thickness at higher speeds as discussed by [9]; their measurements showed that an increase in speed enhanced the hydrodynamic effect and increased the oil film thickness considerably. The trends are the same as those of Figure 8 for all lubricants with good degree of repeatability and that the gradual reduction of the number of string cavities noted in Figure 8 after the maximum values has now become less at this speed. The maximum numbers of cavities at this speed are now up to 52, 47 and 49 for Lubricants A, B and C, respectively, during the up-stroke motion; the corresponding numbers for down-stroke motion are 38, 35 and 26. It is interesting to note that the number of string cavities with Lubricant A did not change that much which may suggest that there is a limit that cavities can be developed for a given lubricant with specific composition and more importantly due to physical geometry of the ring with limited space available on its surface and its non-symmetrical profile with its contact point at an offset from the centerline. In addition, the results for both speeds clearly show that the number of string cavities in up-stroke motion are greater than those in down-stroke motion suggesting a thinner and shorter diverging section during down-stroke motion; again, this is mainly due to the way the test-rig has been designed as mentioned earlier. The shorter diverging section during down-stroke would also results in shorter length of cavities which will be discussed next.
The total length of cavities (sheet plus strings) for Lubricant A are presented in Figure 10 at 300 and 600 rpm over three consecutive full cycles. It should be noted that since the background noise for Lubricants B and C caused unrealistic data when compared with visualisation images, it was decided not to present them and instead to show their visualisation of the cavity development in Figure 11 and Figure 12 as a function of crank angle like that presented for Lubricant A in Figure 7 with some numerical measurements of the cavity lengths from the images for comparison purposes. In Figure 10, the length of cavities (sheet plus strings) during the up-stroke motion have been marked in “Blue” and those generated during the down-stroke motion in “Red”. The cavity lengths have been recorded separately for the up-stroke and down-stroke side to avoid misreading the data by the software during the overlap between the strokes as observed to be the case from the visualisation images; the overlap means that at some time in the cycle there are cavities present both on the top and bottom sides of the ring simultaneously.
The repeatability between cycles were assess first and the results given in Figure 10 shows a good degree of repeatability in all three cycles for both speeds during the up-stroke and down-stroke motions with the latter case being more pronounced. Figure 10a presents the variation of the length of cavities for Lubricant A, with highest viscosity of 45.6 cSt, at 300 rpm, and shows an increase in length of cavity during the up-stroke motion up to 80° CA and remains the same till 150° CA with an average length of around 1.3 mm the same as that observed in Figure 7 when cavities reached their fully developed status. Then the length starts to increase suddenly to a maximum of 2.7 mm at 180° CA due to stretching of the sheet cavity as observed in Figure 7. After that the length starts to drop rapidly to zero at around 250° CA due to the rapid collapse of the cavities (both sheet and strings) during this period. A similar pattern can be seen during the down-stroke motion with an increase during the developing phase and then it remains almost the same until the cavities start to collapse towards the end of stroke, where it drops rapidly. The major differences with the up-stroke is that there is no stretching of the sheet cavity and smaller lengths with down-stroke motion due to limited space there as mentioned above. The average length of cavities is around 1 mm which again agrees closely with the measured value (0.91 mm) from images. Overall, the extracted results are in good agreement with visualisation of cavities.
At higher speed of 600 rpm, Figure 10b, the patterns are quite similar to those at 300 rpm but the length of fully developed cavities (80° CA to 120° CA) during the up-stroke has been increased from 1.3 mm to 1.7 mm, an increase of 30% at higher speed, while the increase of the sheet cavity in the next phase remained almost the same. The measured length of the cavities from the visualisation during the fully developed phase was 1.73 mm which agrees well with the extracted value of 1.7 mm. During down-stroke motion, the same trends as those at lower speed can be seen here and the only major difference is that at higher speed the length of the cavities during the fully developed phase (260° CA to 320° CA) reducing gradually from 1 mm to 0.5 mm, while at lower speed it remained almost the same. This is in good agreement with cavities visualisation where it shows considerable merging of the neighbouring string cavities during this phase and formation of new shorter strings at 600 rpm; it should be mentioned that similar process was observed with Lubricants B and C at 600 rpm.
As mentioned before for Lubricant B (viscosity of 30.9 cSt) and C (viscosity of 21.2 cSt) we found some error in the extracted data and therefore their visualisation of their cavity development is presented in Figure 11 and Figure 12, respectively, for 300 rpm. In general, the cavities development in both Lubricants B and C are the same as that of Lubricant A, both for up- and down-strokes including the fern and fissure cavities formation and their development into strings and sheet cavitation and the way they collapse at the end of each stroke. There is one exception related to stretching of the sheet cavities seen during the up-stroke motion for Lubricant A (see Figure 7), which is absent in case of Lubricants B and C with lower viscosities; the same thing was also observed at higher speed of 600 rpm. This is expected as the magnitude of negative pressure decreases with decreasing viscosity.
In terms of the length of cavities, measurements have been made from images of Figure 7, Figure 11 and Figure 12 at 120° CA during up-stroke motion and at 280° CA in down-stroke motion for all three lubricants and are compared together. At 120° CA, the length measured to be 1.36 mm, 1.2 mm and 0.95 mm for Lubricant A, B and C, respectively, which clearly show a reduction of length of cavities with reduction of lubricants’ viscosity. The results show a reduction of length of cavities of about 12% for Lubricant B (30.9 cSt) and 30% for Lubricant C (21.2 cSt) when compared to lubricant A (45.6 cSt). In down-stroke motion at 280° CA, the corresponding length of cavities are 0.91 mm, 0.74 mm and 0.59 mm for Lubricant A, B and C, respectively, giving a reduction of 18.7% for Lubricant B and 35% for Lubricant C when compared to Lubricant A.
Overall the results show that viscosity plays a major role in breakup process of the cavities so that lubricants with higher viscosity resist more the disintegration of cavities. It should be emphasised that the composition of lubricants will also play a major role in cavities formation, development and collapse, and also related information on lubricants’ properties, in particular, their surface tension, which plays a major role in breakup of cavities. Lack of this information would make it very difficult to explain the observed changes and draw proper conclusions; unfortunately, this is the case with the tested lubricants, apart from their viscosity, due to confidentiality.

4. Conclusions

The lubricant flow and cavitation development in a single piston-ring lubricant assembly have been visualised using a high-speed camera for three lubricants with different viscosities and at two liner speeds of 300 rpm and 600 rpm. The measurements were performed at 70 °C with a supply lubricant rate of 0.05 L/min, and produced high quality images that characterise the initiation of cavities and their developments and collapses. Images were processed to provide quantitative analyse of cavitation characteristics, using a specially written MATLAB programme. Comparison of the images and the processed data, within the measured ranges and the used lubricants, provided useful information on cavities behaviours. There follows a summary of the main findings:
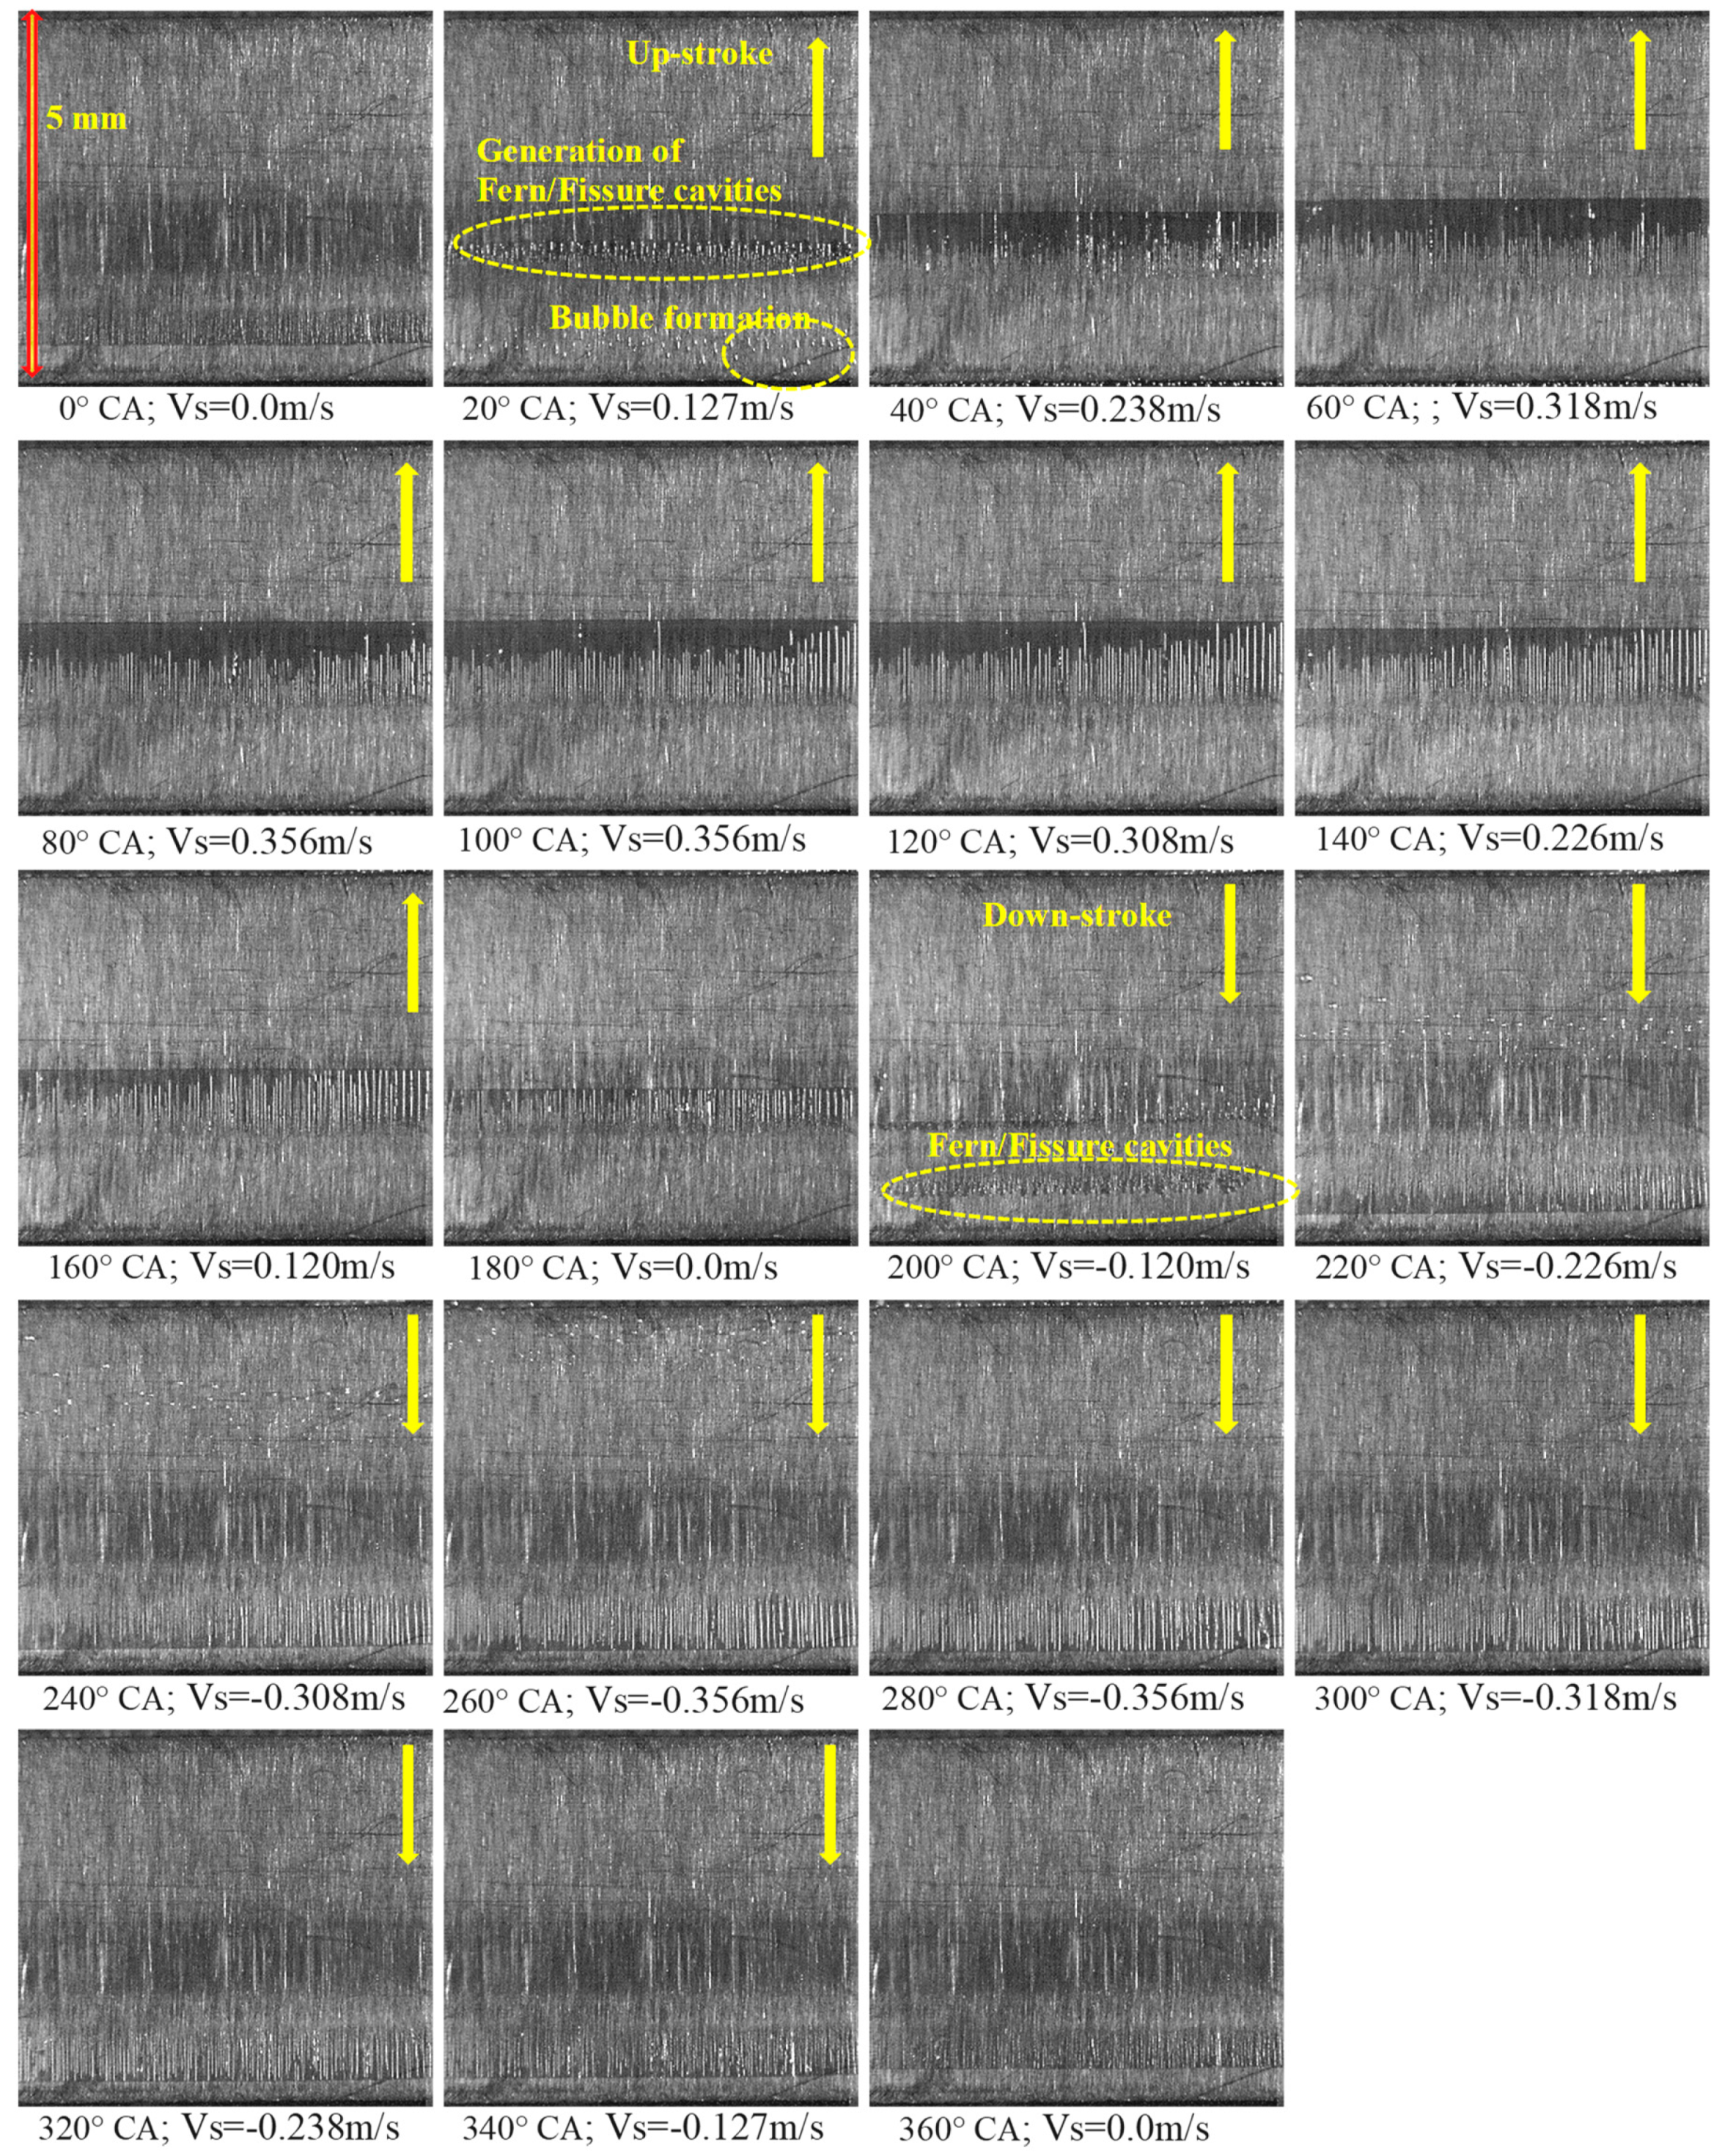
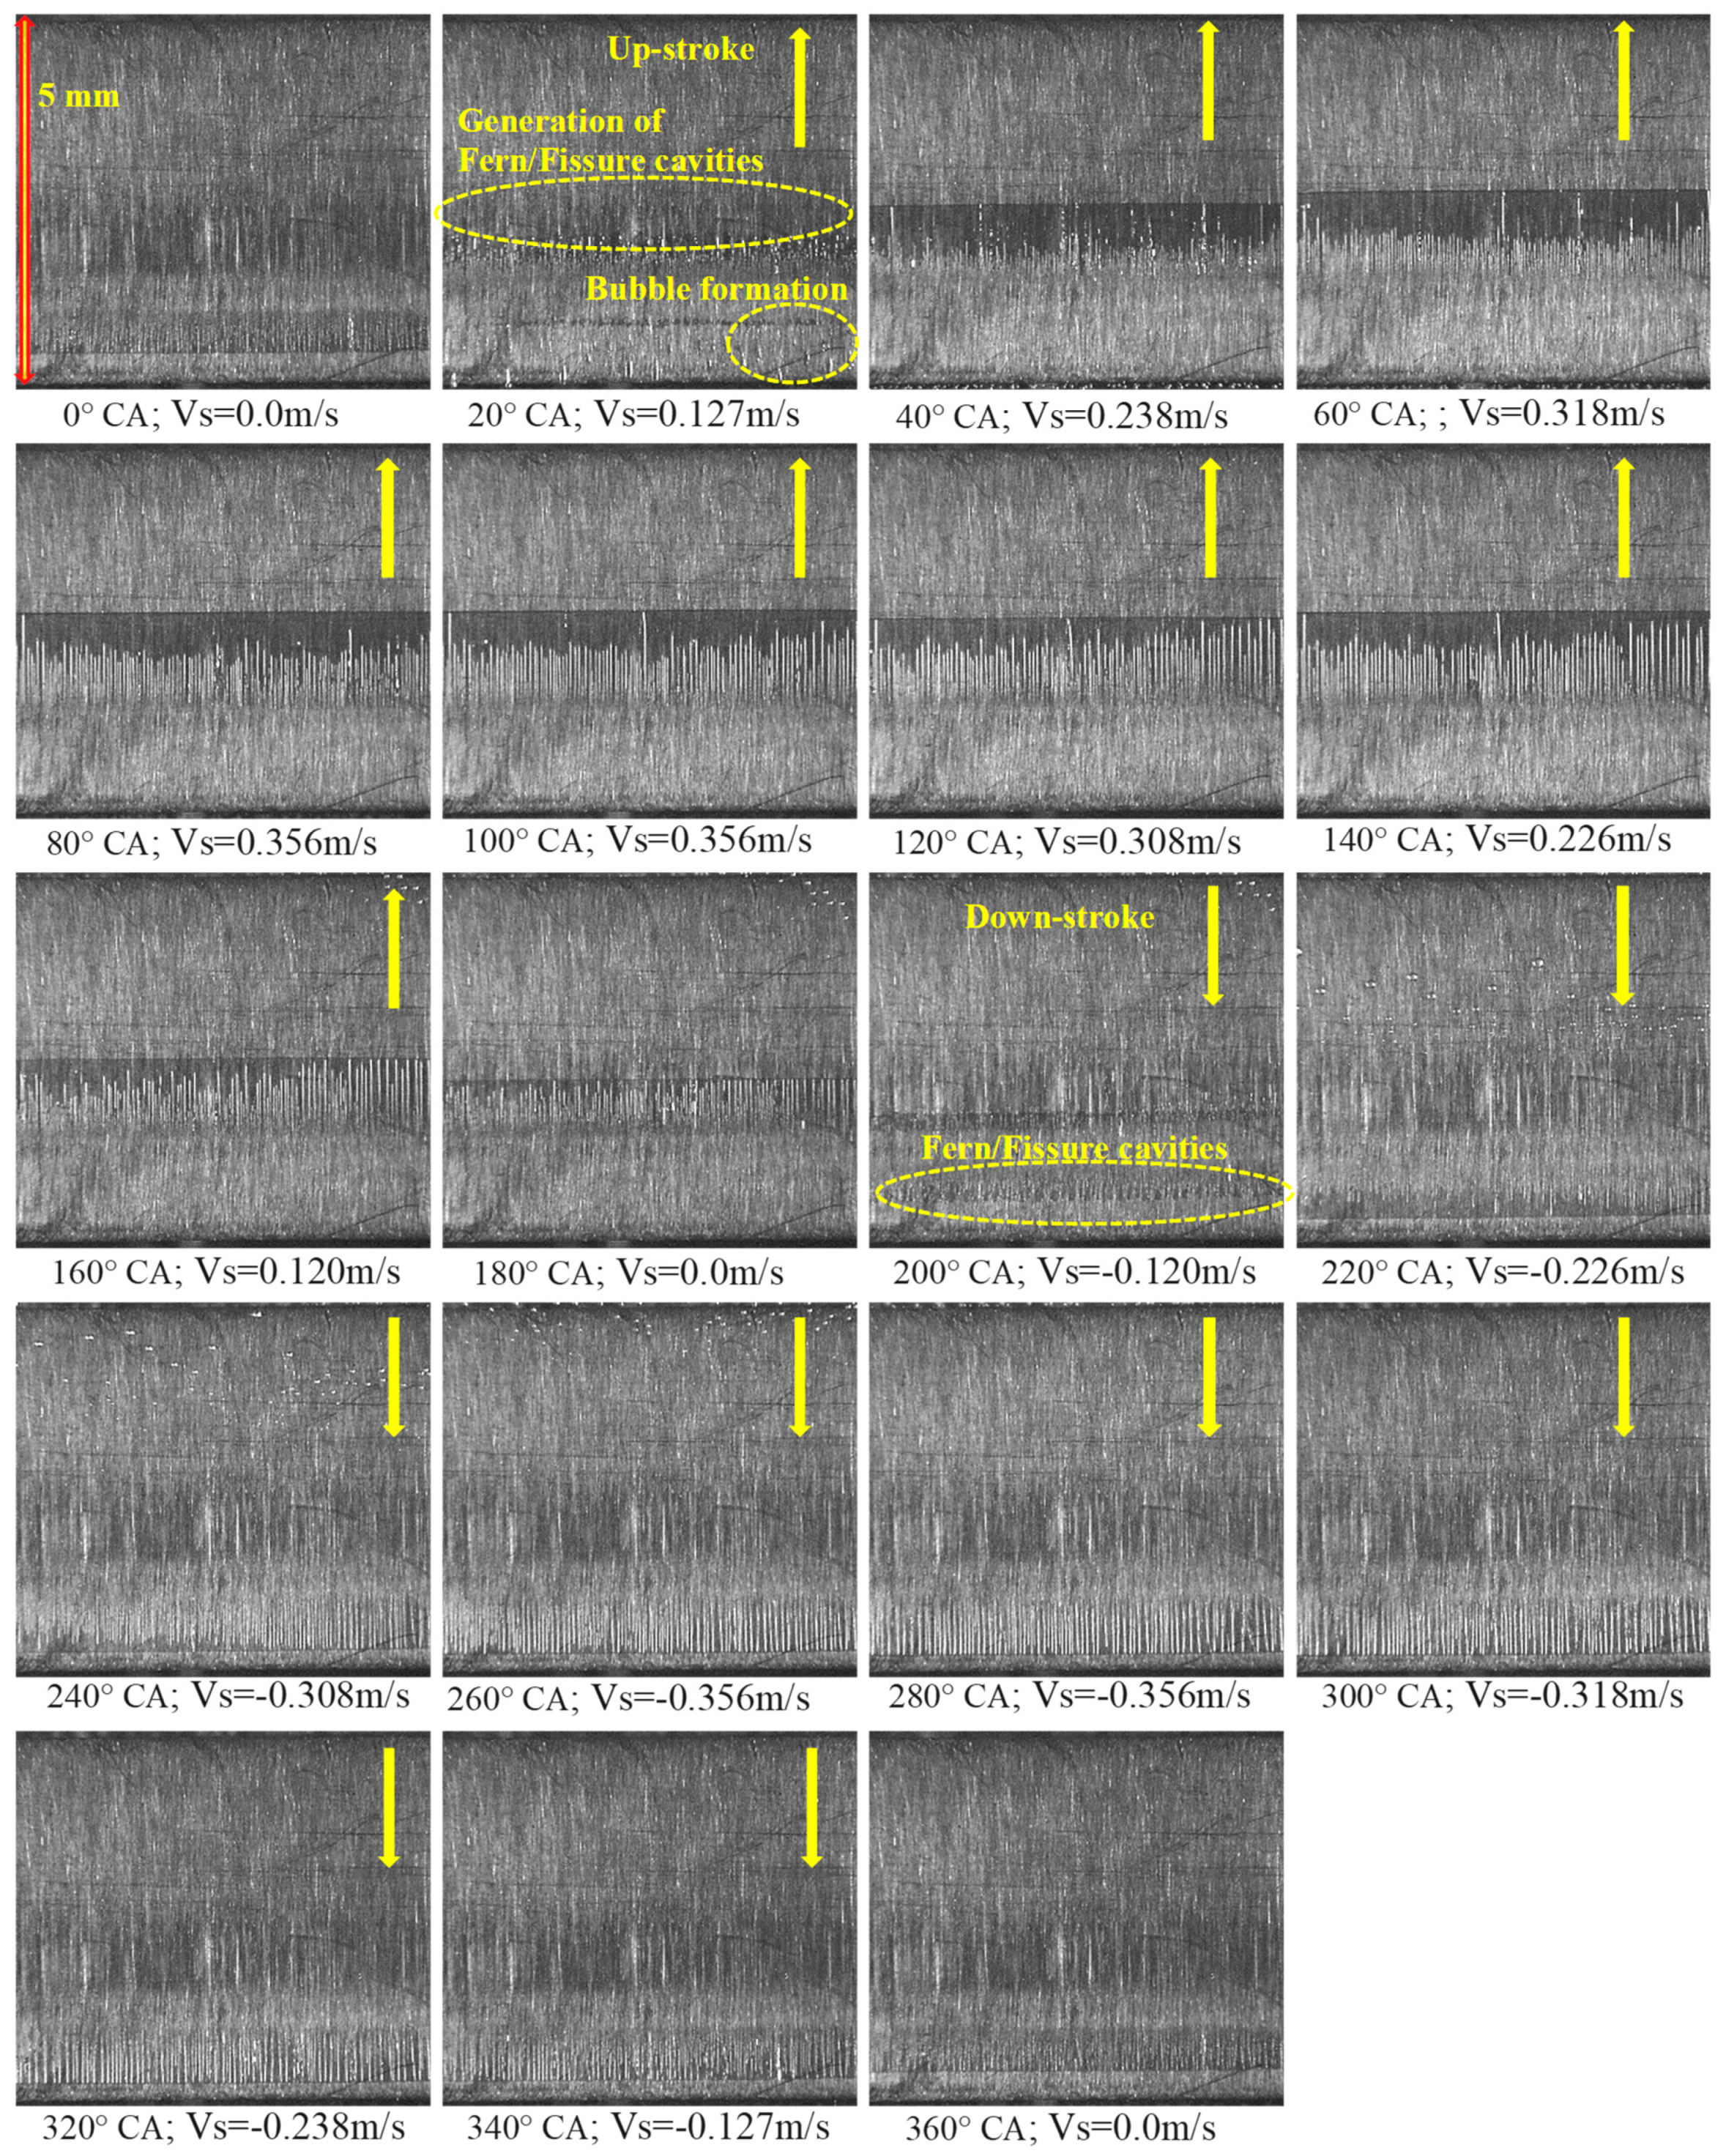
  • The visualisation images, during the up-stroke motion, showed that a small fern cavity is initiated at a nucleation site at around 15° CA, which grows and spread quickly with time during which other ferns start to appear. As they grow, they start to coalesce and form the fissure type cavities, which are unstable and spread rapidly in all direction and after joining the neighbouring fissures they form a stable sheet cavitation at their forefront while at their tails they breakup into stable strings type cavitation. Similar patterns have been observed during down-stroke motion.
  • It was observed that the onset of cavitation happens almost at the same time for all lubricants and at both speeds with little dependency on either viscosity or speed.
  • Visualisation results over the whole cycle showed the step by step changes in the sheet/strings cavities with CA and, in general, they grow and develop into their full status when the liner reaches its maximum velocity and then the start to collapse during the liner deceleration.
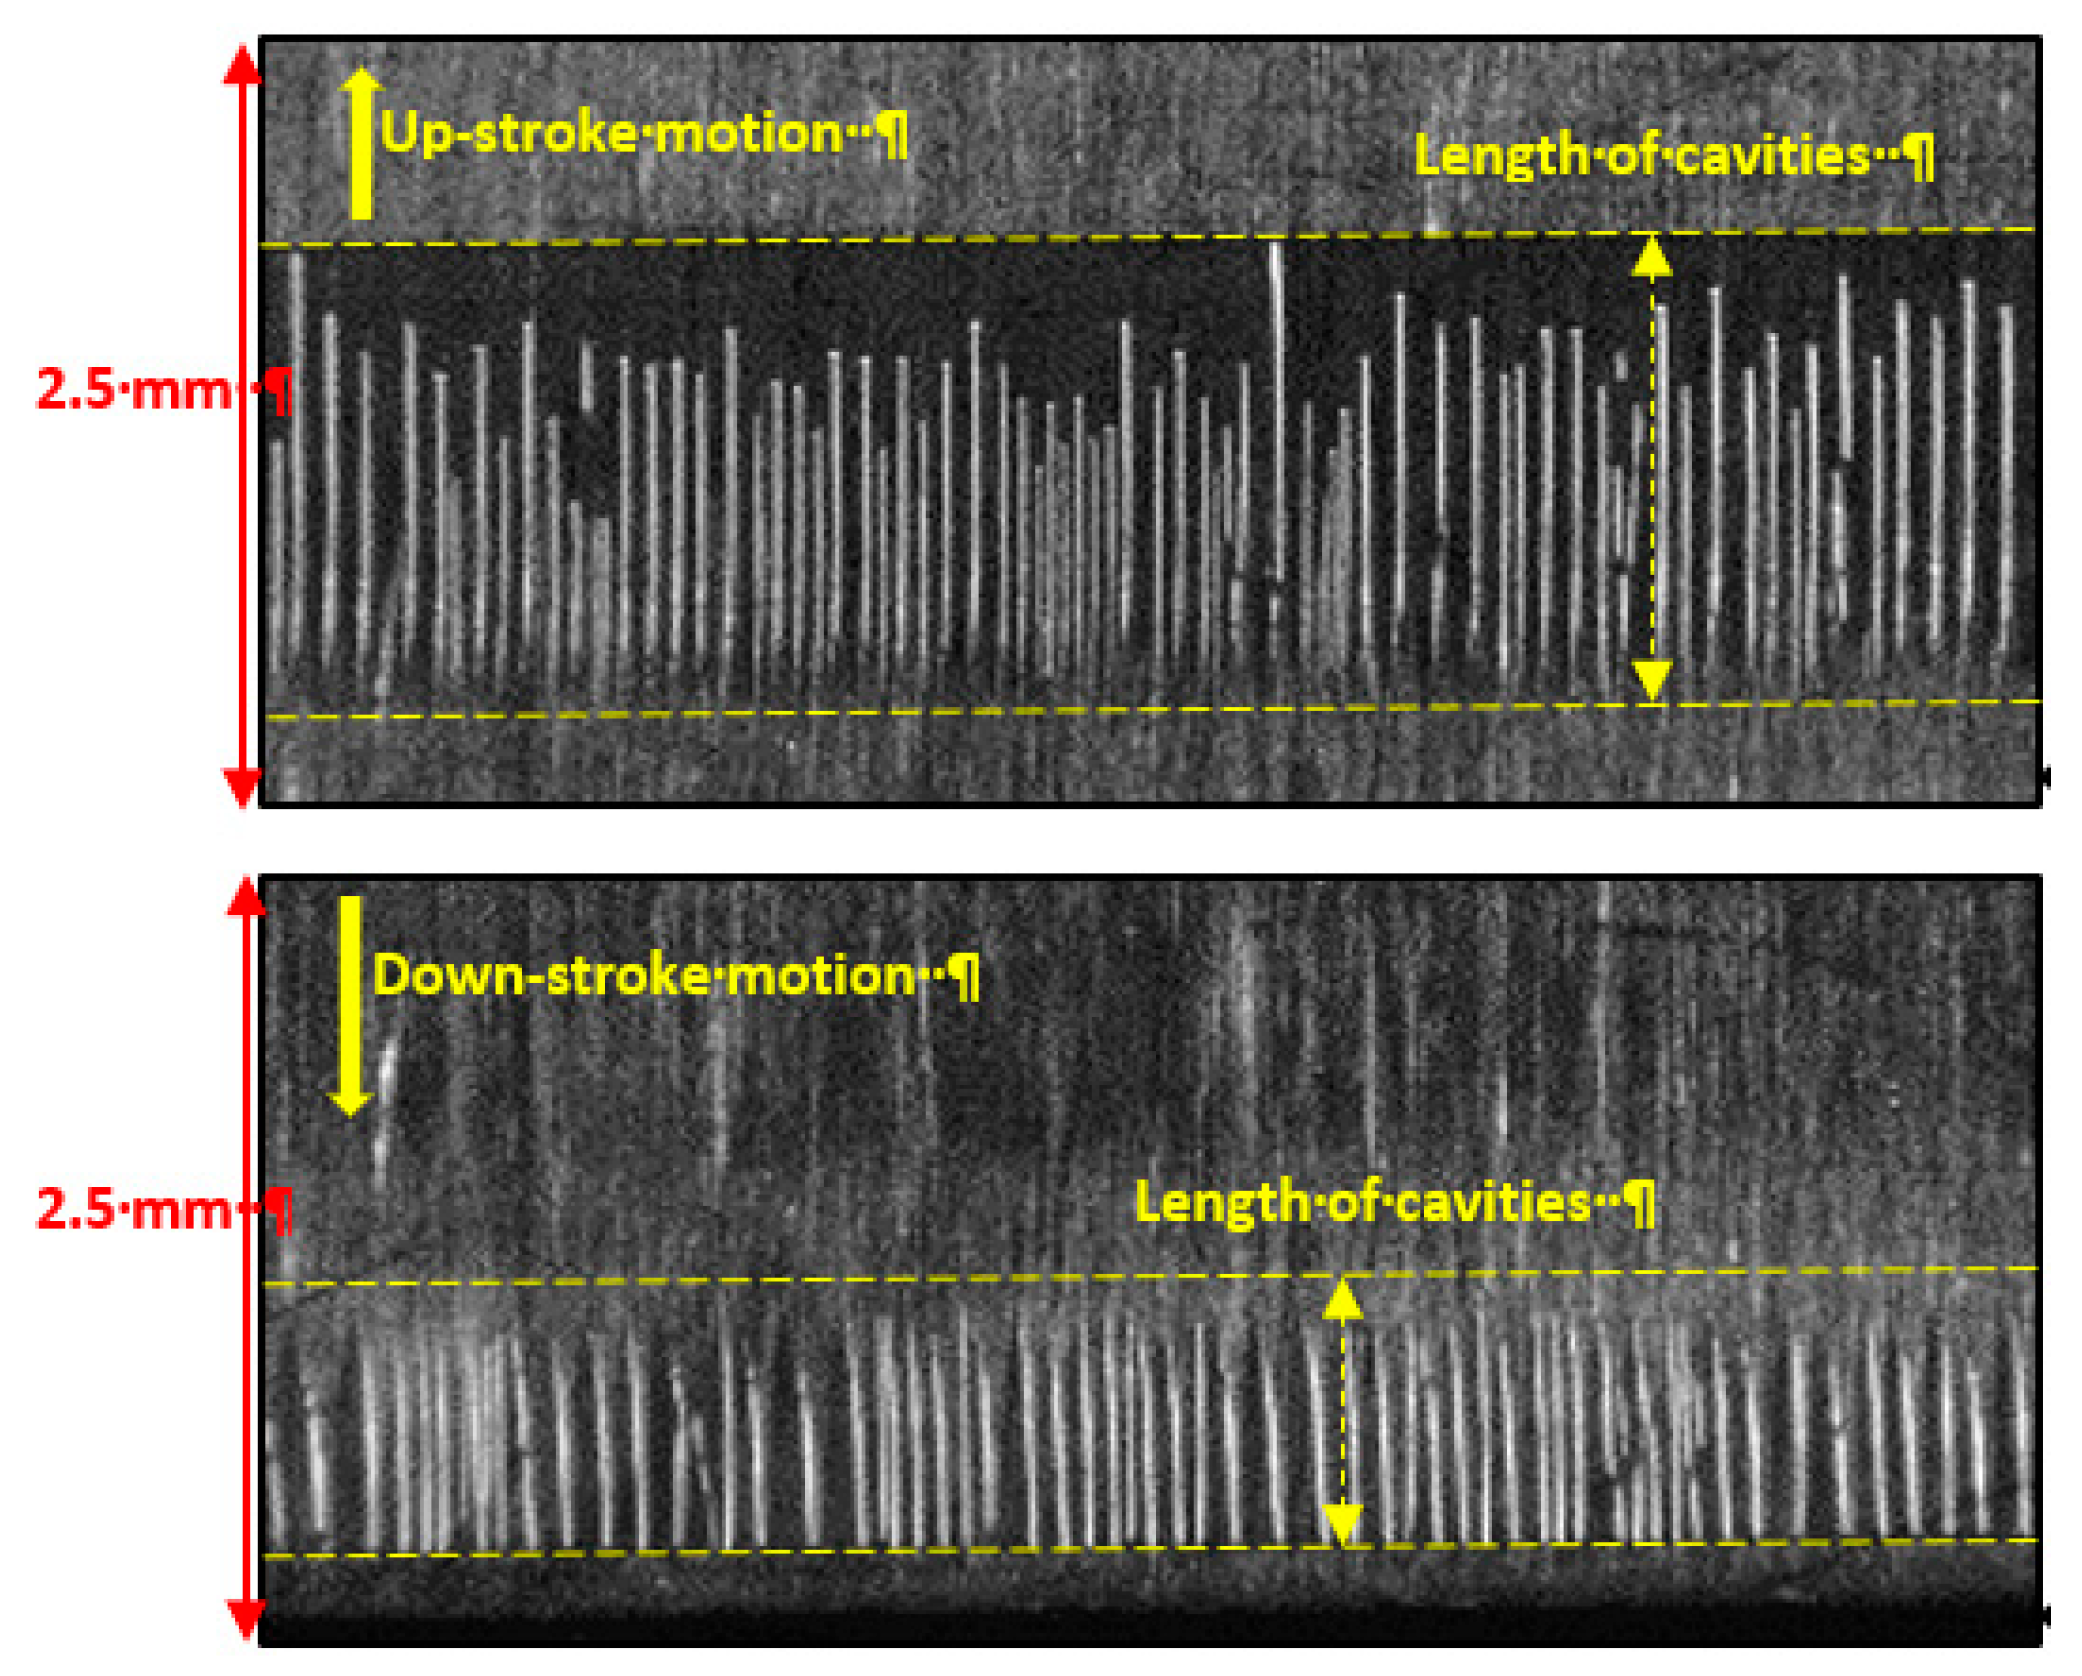
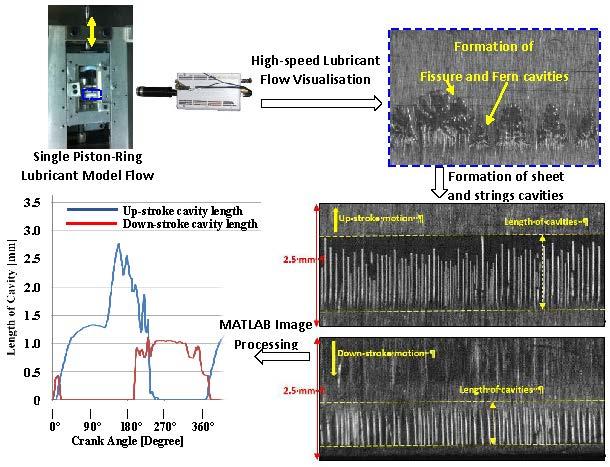
  • In up-stroke motion, at fully developed state, the length of cavities measurements from images were 1.36 mm, 1.2 mm and 0.95 mm for Lubricant A, B and C, respectively, giving a reduction of about 12% and 30% for Lubricants B and C when compared to Lubricant A. the corresponding values for down-stroke were 0.91 mm, 0.74 mm and 0.59 mm giving a reduction of 18.7% and 35% for Lubricants B and C when compared to Lubricant A. This is expected as lowering the lubricant viscosity results in a reduction of negative pressure and therefore less cavities.
  • The shorter length of the cavities in down-stroke, around 35% for all lubricants, compare to those in the up-stroke motion is related to the ring profile which is not symmetrical with a contact point at an offset from the centerline towards the lower edge of the ring with much smaller diverging area during the down-stroke motion.
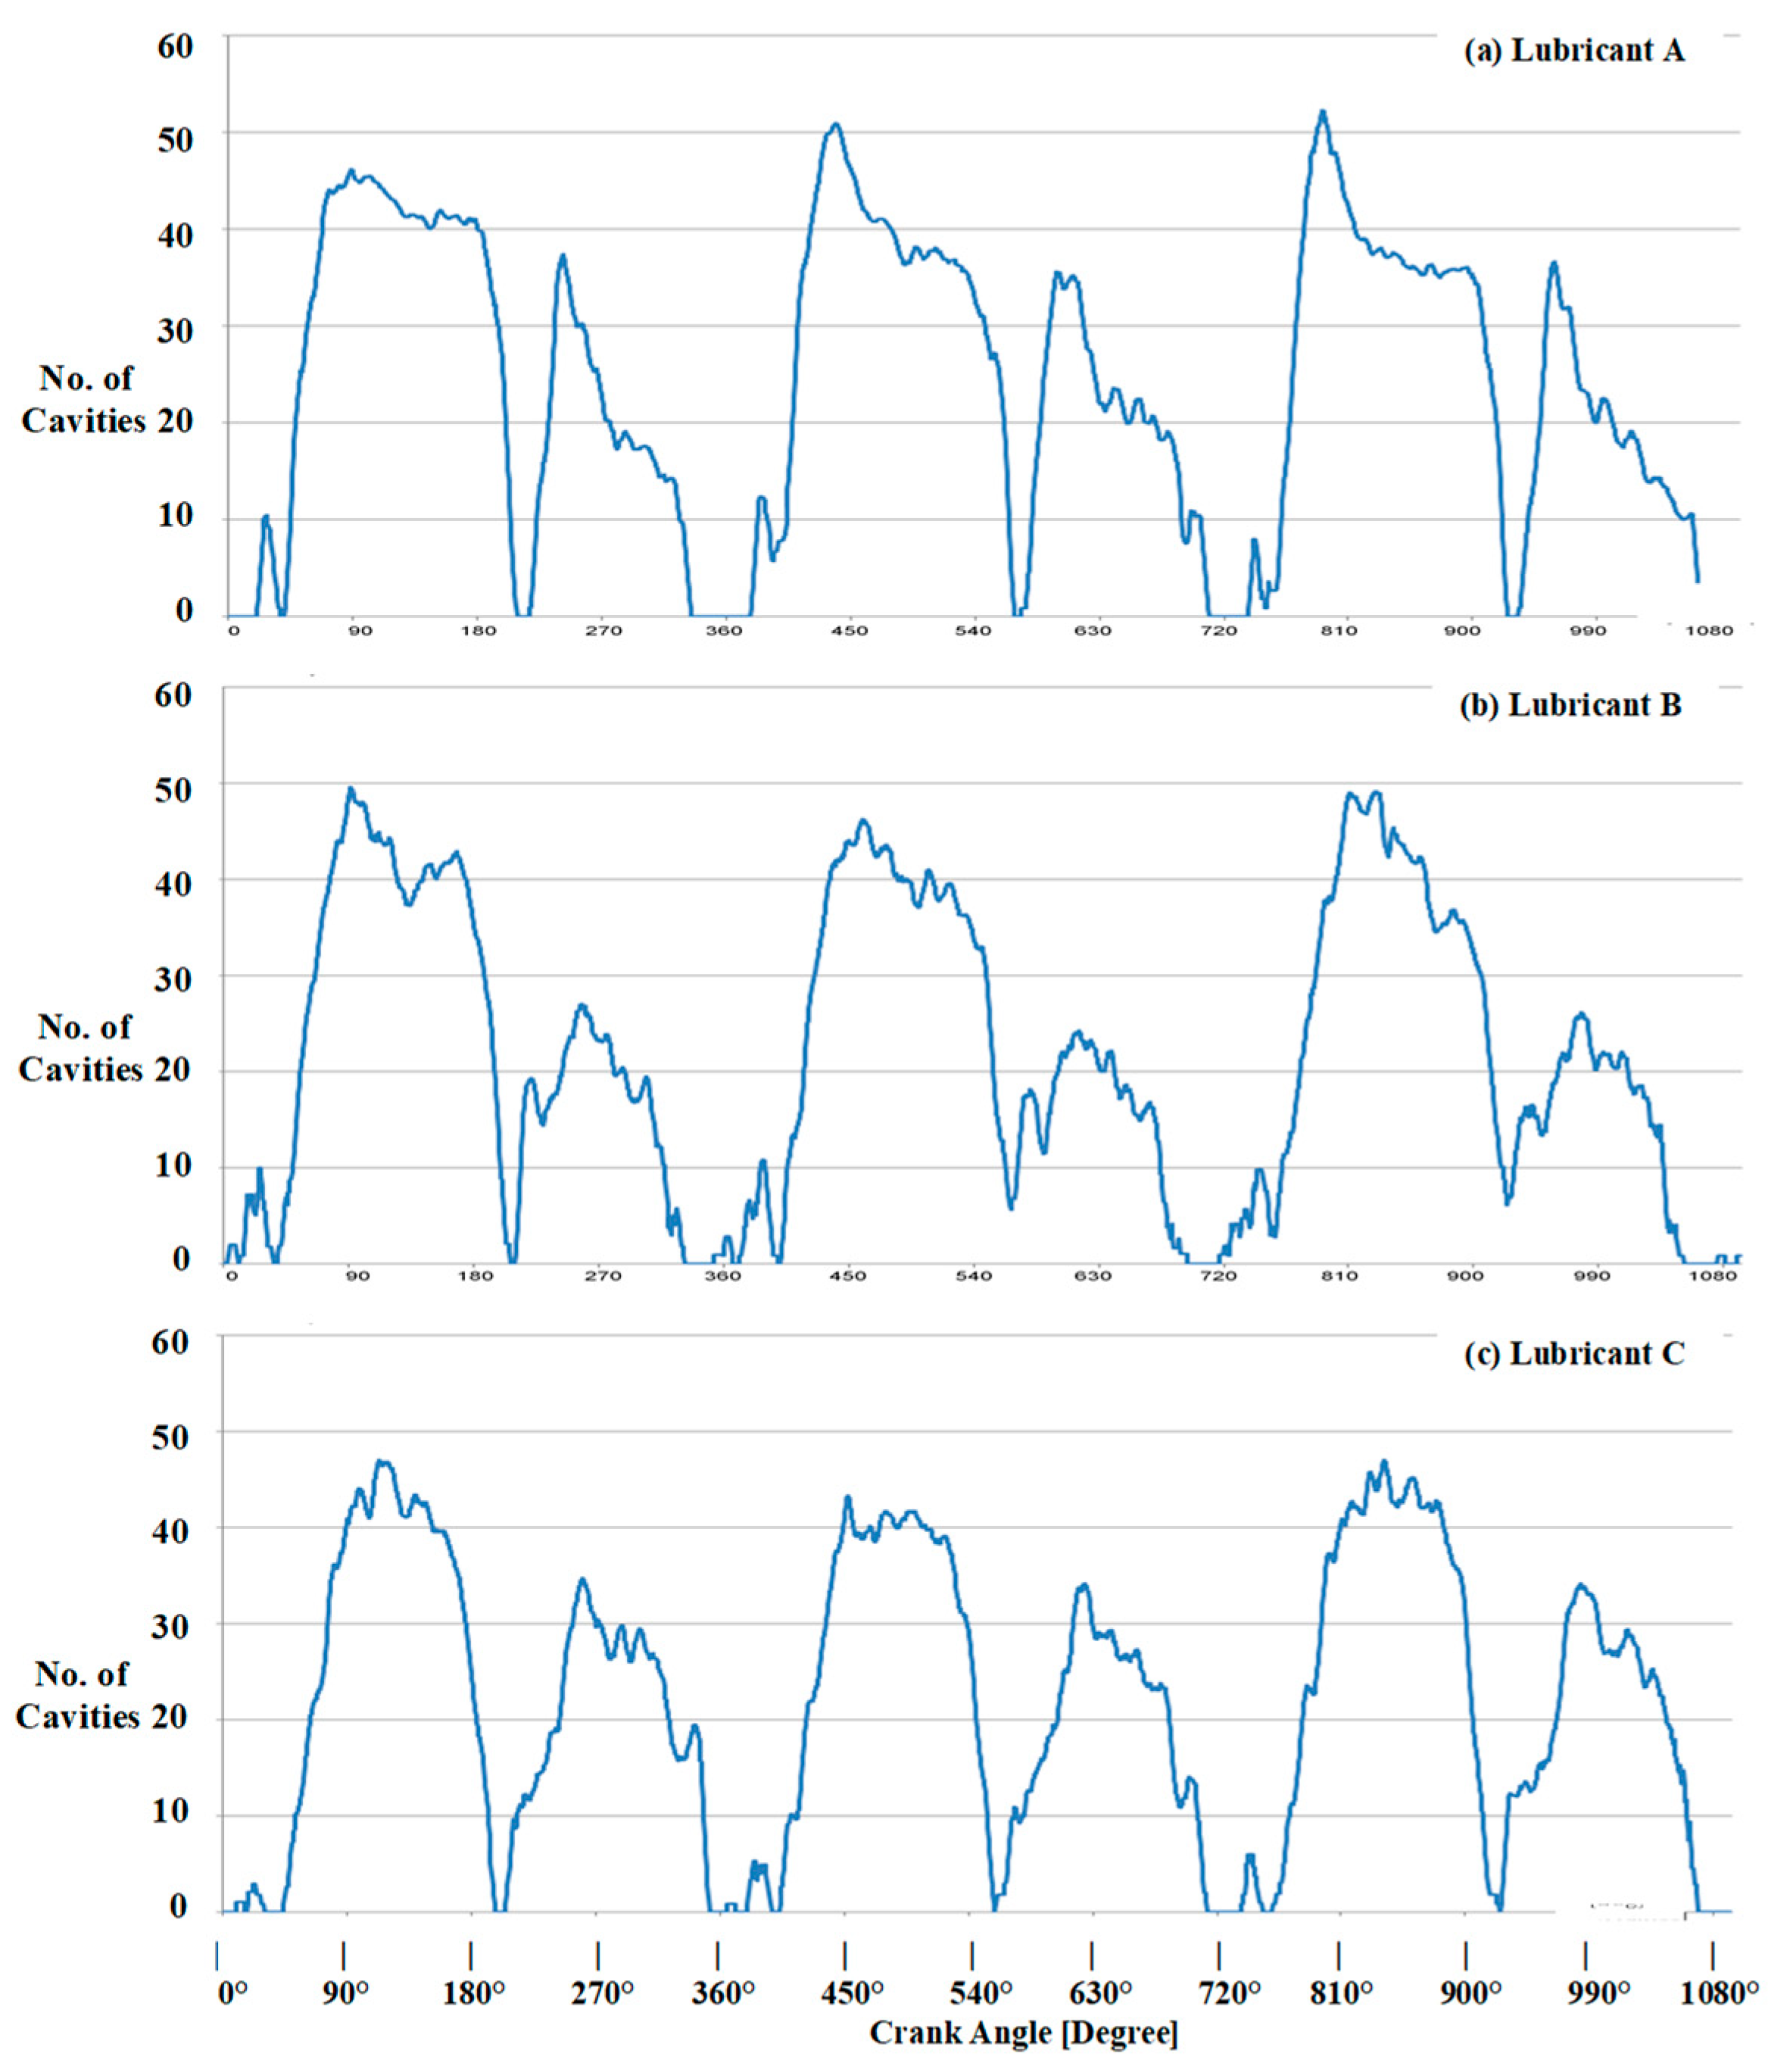
  • The processed data by MATLAB for number and length of cavities presented a good degree of repeatability over different cycles for all lubricants and that they showed much higher number of string cavities with Lubricant A (of highest viscosity) than Lubricants B and C at 300 rpm. However, at higher speed of 600 rpm the number of string cavities of all lubricants become similar, which may well be due to increase in oil film thickness at higher speed.
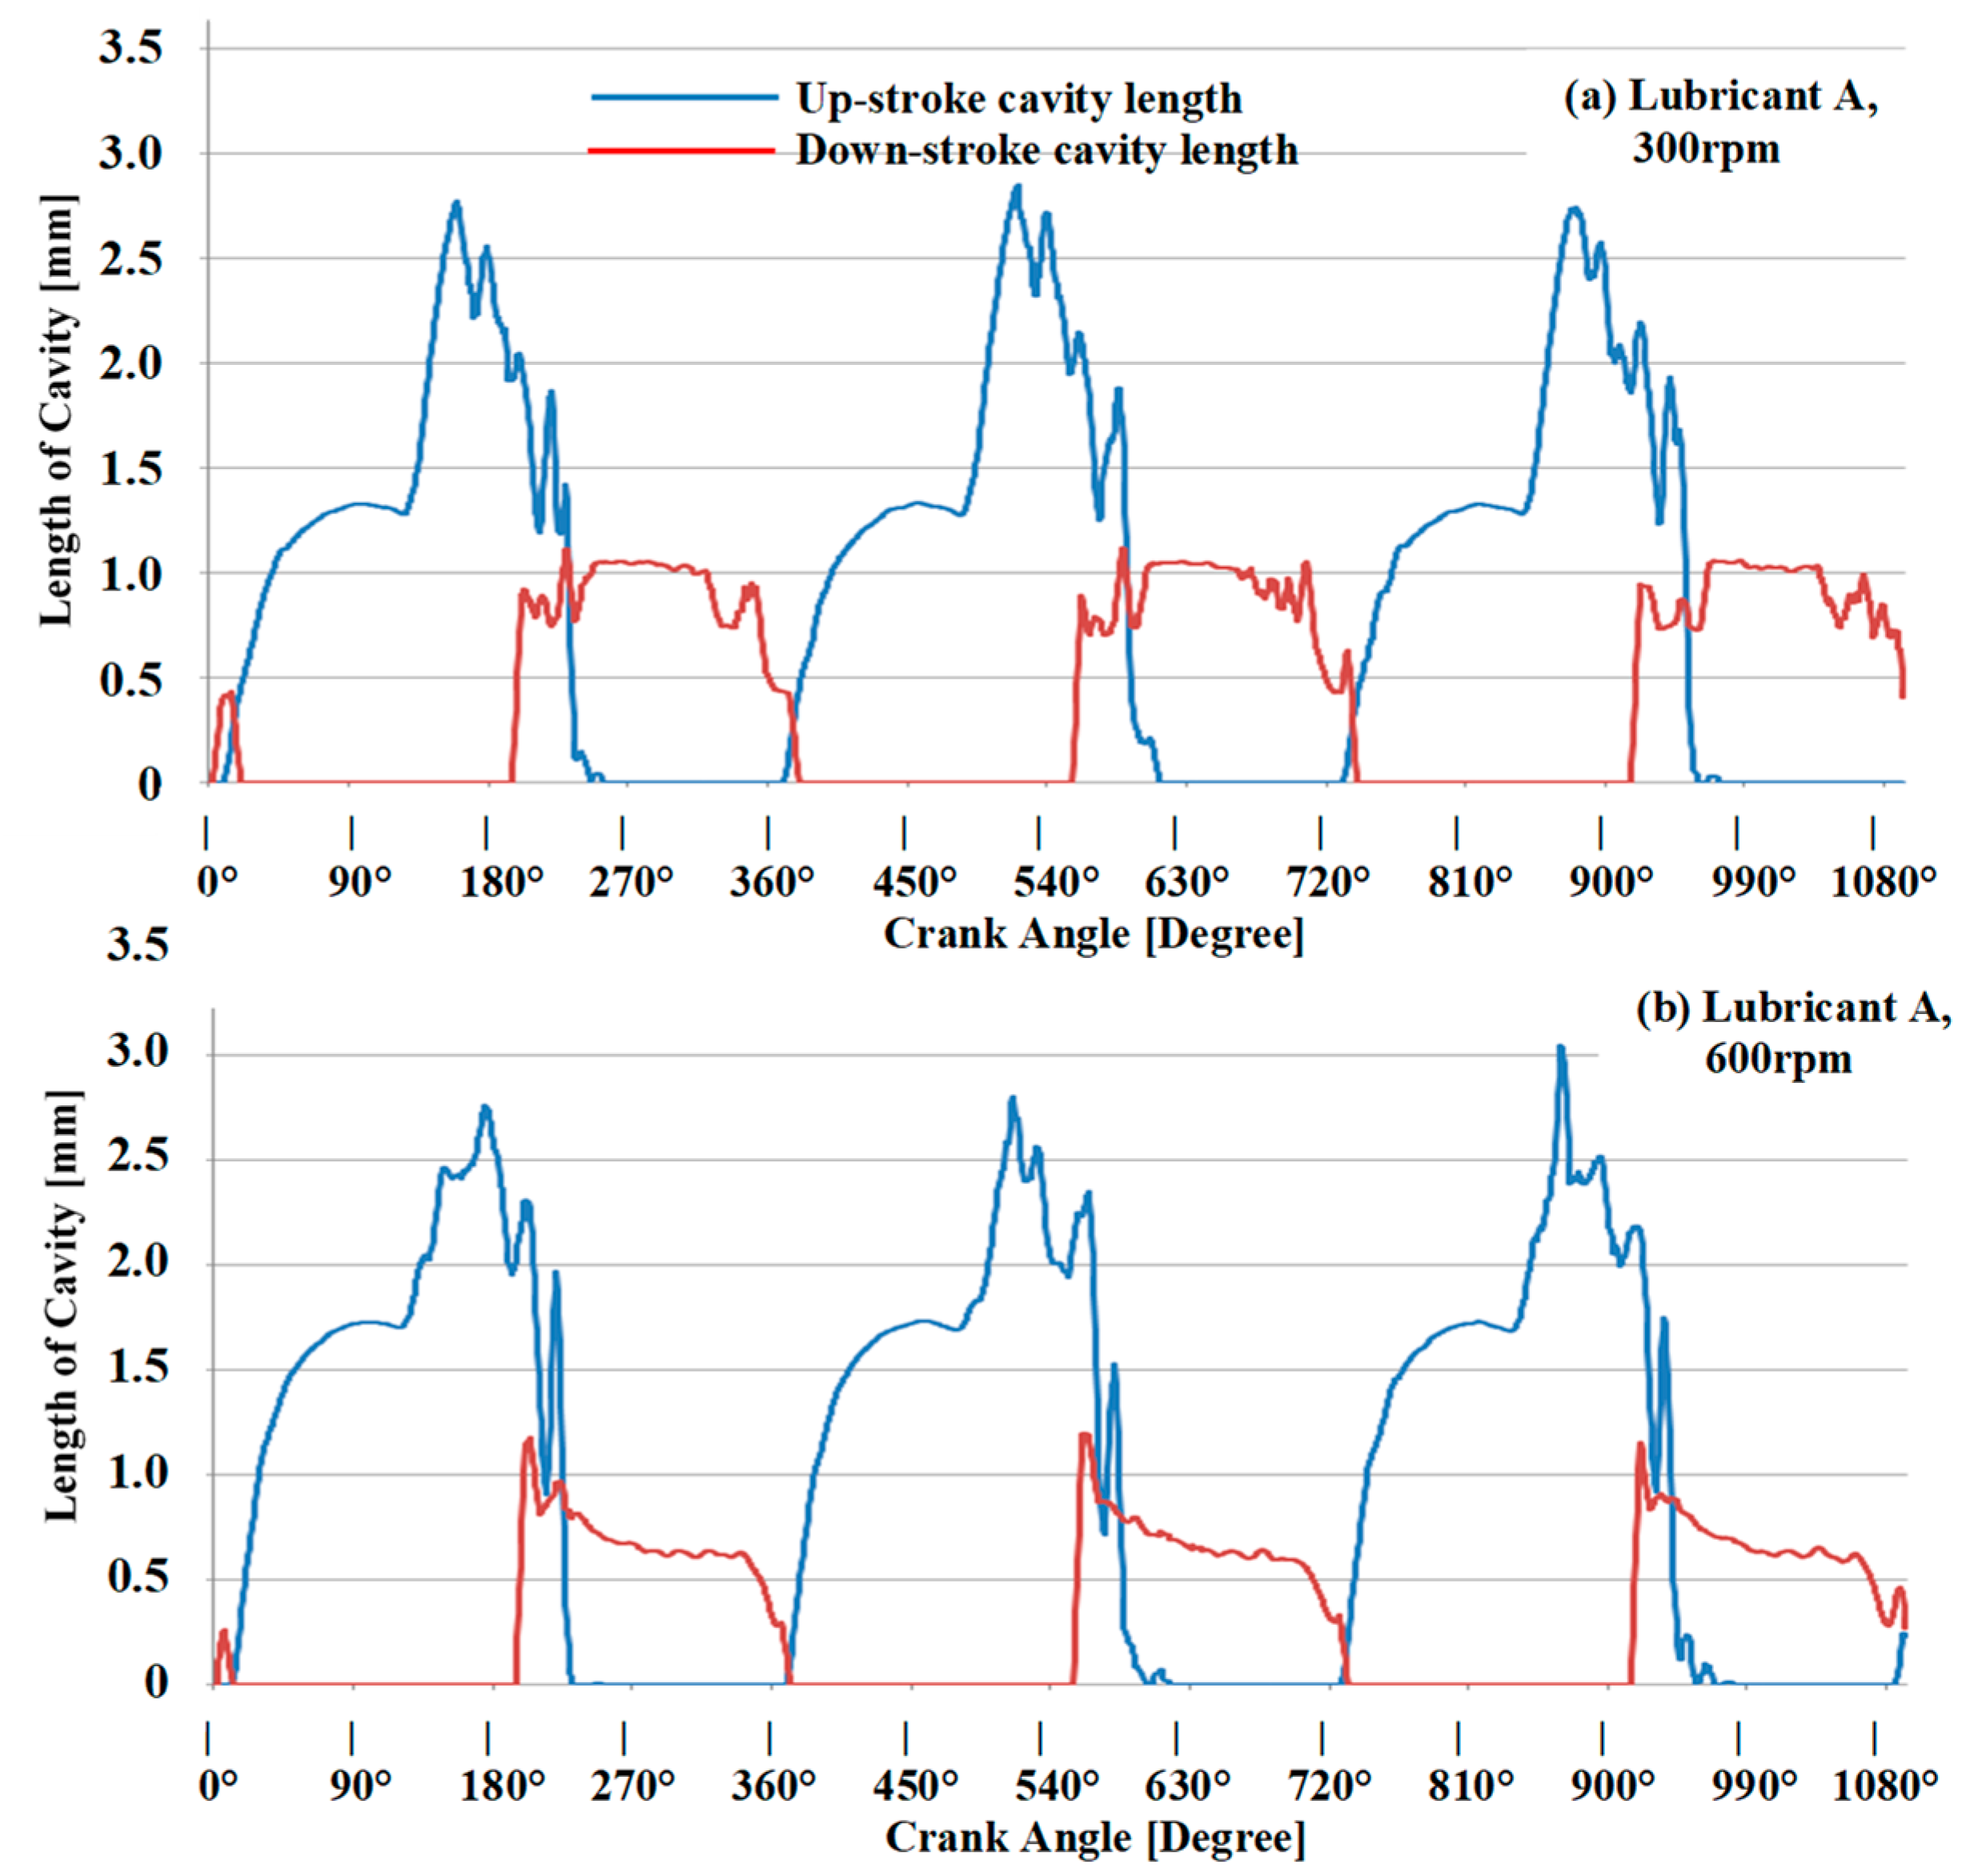
  • The extracted processed data of length of cavities for Lubricant A at both speeds showed a very good agreement with those obtained from images directly and it confirmed as the speed increased from 300 rpm to 600 rpm the length of cavities, at fully developed state, also increased from 1.3 mm to 1.7 mm; an increase of 30% at 600 rpm and again it can be attributed to the increase in oil film thickness as mentioned above.
  • Although the overall agreement between the processed data by MATLAB and visualisation measurements, it failed to calculate accurately the length of cavities for Lubricants B and C due to background noise. This suggests that more refinement is required in setting the thresholds and more importantly that the extracted data should always be checked with images to be sure of the data accuracy.

Author Contributions

For this research article, the following are the authors contributions: Conceptualization, J.M.N., Y.Y. and I.V.; methodology, J.M.N., Y.Y. and I.V.; software, C.-C.R.-A., I.V. and Y.Y.; validation, I.V., Y.Y. and J.M.N.; formal analysis, I.V., Y.Y. and J.M.N.; investigation, I.V., Y.Y. and J.M.N.; resources, J.M.N. and Y.Y.; data curation, I.V., Y.Y. and J.M.N.; writing—original draft preparation, J.M.N., I.V. and Y.Y.; writing—review and editing, J.M.N.; visualization, I.V., Y.Y. and J.M.N.; supervision, J.M.N. and Y.Y.; project administration, J.M.N. and Y.Y.; funding acquisition, J.M.N.

Funding

This research was funded by BP-EPSRC Industrial CASE Studentship, 10000326.

Acknowledgments

We would like to thank BP and EPSRC for supporting this research work. We would also like to thank M Gold and R Pearson from BP for their continuous support, motivation and encouragement.

Conflicts of Interest

The authors declare no conflicts of interest.

References

  1. Voss, K.E.; Lampert, J.K.; Farrauto, R.J.; Rice, G.W.; Punke, A.; Krohn, R. Catalytic Oxidation of Diesel Particulates with Base Metal Oxides. In Catalysis and Automotive Pollution Control III; Frennet, A., Bastin, J.M., Eds.; Elsevier: Amsterdam, The Netherlands, 1995; Volume 96, pp. 499–515. [Google Scholar]
  2. Kittelson, D.B.; Watts, W.F.; Johnson, J. Diesel Aerosol Sampling Methodology - CRC E-43, Final Report 2002. University of Minnesota, Report for the Coordinating Research Council. Available online: http://www.crcao.com/reports/recentstudies00-02/E-43%20Final%20Report.pdf (accessed on 9 October 2019).
  3. Straton, J.T.; Willermet, P.A. An Analysis of Valve Train Friction in Terms of Lubrication Principles; SAE Technical Paper Series; SAE International: Warrendale, PA, USA, 1983; p. 830165. [Google Scholar]
  4. Uras, H.; Patterson, D. Measurement of Piston Ring Assembly Friction in Reciprocating Machines. ASME 1987, 87-ICE-55. [Google Scholar]
  5. Rezeka, S.; Henein, N. A New Approach to Evaluate Instantaneous Friction and Its Components in Internal Combustion Engines; No. 840179. SAE Technical Paper; SAE International: Warrendale, PA, USA, 1984; p. 840719. [Google Scholar]
  6. Taraza, D.; Henein, N.; Bryzik, W. Friction Losses in Multi-Cylinder Diesel Engines. In SAE Transactions; SAE International: Warrendale, PA, USA, 2000; pp. 874–884. [Google Scholar]
  7. Ostovar, P. Fluid Aspects of Piston-Ring Lubrication. Ph.D. Thesis, Department of Mechanical Engineering, Imperial College London, London, UK, 1996. [Google Scholar]
  8. Dellis, P. Aspects of Lubrication in Piston Cylinder Assemblies. Ph.D. Thesis, Department of Mechanical Engineering, Imperial College London, London, UK, 2005. [Google Scholar]
  9. Dhunput, A. Oil Transport in Piston Ring Assemblies. Ph.D. Thesis, Department of Mechanical Engineering and Aeronautics, University of London, London, UK, 2009. [Google Scholar]
  10. Vasilakos, I. Cavitation in the Cylinder-Liner and Piston-Ring in a New Designed Optical IC Engine. Ph.D. Thesis, Department of Mechanical Engineering and Aeronautics, University of London, London, UK, 2017. [Google Scholar]
  11. Priest, M.; Dowson, D.; Taylor, C.M. Theoretical modelling of cavitation in piston-ring lubrication. Proc. IMechE Part C J. Mech. Eng. Sci. 2000, 214, 435–447. [Google Scholar] [CrossRef]
  12. Mortier, R.M.; Orszulik, S.T. Chemistry and technology of lubricants. In Chapman & Hall, 2nd ed.; Springer: Dordrecht, The Netherlands, 1997. [Google Scholar]
  13. Arcoumanis, C.; Duszynski, M.; Flora, H.; Ostovar, P. Development of a piston-ring lubrication test-rig and investigation of boundary condition for modelling lubricant film properties. SAE Trans. 1995, 104, 1433–1451. [Google Scholar]
  14. Dhunput, A.; Teodorescu, M.; Arcoumanis, C. Investigation of cavitation development in the lubricant film of piston-ring assemblies. J. Phys. Conf. Ser. 2007, 85, 012005. [Google Scholar] [CrossRef]
  15. Dells, P. An attempt to calibrate the laser induced fluorescence (LIF) signal used for oil film thickness (OFT) measurements in simulating test rigs. Tribol. Ind. 2015, 38, 525–538. [Google Scholar]
  16. Dellis, P. Laser-induced fluorescence measurements in a single-ring test rig: Evidence of cavitation and the effect of different operating conditions and lubricants in cavitation patterns and initiation. Int. J. Engine Res. 2019. Article first published online on January 14th, 1–15. [Google Scholar] [CrossRef]
  17. Tian, T.; Morris, N.J.; Coupland, J.M.; Arevalo, L. Cavitation bubble measurement in tribology contacts using digital holographic microscopy. Tribol. Lett. 2015, 58, 1–10. [Google Scholar]
  18. Sherrington, I.; Smith, E.H. Experimental methods for measuring the oil-film thickness between the piston-rings and cylinder-wall of internal combustion engines. Tribol. Int. 1985, 18, 315–320. [Google Scholar] [CrossRef]
  19. Sherrington, I.; Söchting, S. An experimental study of variability in the thickness of the hydrodynamic lubricant film between the piston-rings and cylinder bore of an internal combustion engine under steady operating conditions. In Tribology 2006-Surface Engineering and Tribology for Future Engines and Drivelines; IMechE: London, UK, 2006. [Google Scholar]
  20. Greene, A.B. Initial visual studies of piston-cylinder dynamic oil film behaviour. Wear 1969, 13, 345–360. [Google Scholar] [CrossRef]
  21. Sanda, S.; Saito, A.; Konomi, T.; Nohira, H. Development of Scanning Laser-Induced-Fluorescence Method for Analyzing Piston Oil Film Behaviour; IMechE Paper C; IMechE: London, UK, 1993; Volume 465, pp. 155–164. [Google Scholar]
  22. Nakashima, K.; Ishihara, S.; Urano, K. Influence of Piston Ring-Gaps on Lubricating Oil Flow into the Combustion Chamber; Paper 952546; SAE International: Warrendale, PA, USA, 1995. [Google Scholar]
  23. Kim, S.; Azetsu, A.; Yamauchi, M.; Someya, T. Dynamic Behaviour of Oil Film between Piston-ring and Cylinder Liner: Visualization of Oil Film Rupture and Measurement of Oil Film Pressure Using Simulating Rig. JSME 1995, 38, 783–789. [Google Scholar]
  24. Thirouard, B.P.; Tian, T.; Hart, D.P. Investigation of Oil Transport Mechanisms in the Piston-ring-pack of a Single-Cylinder Diesel Engine, Using Two-Dimensional, Laser-Induced Fluorescence. In SAE Transactions; Paper 982658; SAE International: Warrendale, PA, USA, 1998. [Google Scholar]
  25. Thirouard, B.P. Characterization and Modelling of the Fundamental Aspects of oil Transport in the Piston-Ring-Pack of Internal Combustion Engines. Ph.D. Thesis, Department of Mechanical Engineering, Massachusetts Institute of Technology, Cambridge, MA, USA, 2001. [Google Scholar]
  26. Shahmohamadi, H.; Rahmani, R.; Rahnejat, H.; Gamer, C.P.; King, P.D. Thermo-mixed hydrodynamics of piston compression ring conjunction. Tribol. Lett. 2013, 51, 323–340. [Google Scholar] [CrossRef]
  27. Li, D.; Kang, Y.; Ding, X.; Wang, X.; Fang, Z. Effects of nozzle inner surface roughness on the performance of self-resonating cavitating waterjets under different ambient pressures. J. Mech. Eng. 2017, 63, 92–102. [Google Scholar] [CrossRef]
  28. Delprete, C.; Razavykia, A.; Baldissera, P. Detailed analysis of piston secondary motion and tribological performance. Int. J. Engine Res. 2019. Article first published online on February 28th, 1–15. [Google Scholar] [CrossRef]
Figure 1. Optical Test-rig: (a) Lubricant single-ring/liner test-rig assembly; (b) top view of the moving optical liner and stationary ring; (c) Enlarged photo of single ring unit.
Lubricants 07 00088 g001
Figure 2. Schematic representation of the high-speed video camera and lighting with the test-rig and control system.
Lubricants 07 00088 g002
Figure 3. Offset of ring contact point in (a) Up-Stroke; (b) Down-Stroke motions; (c) Ring profile from Reference [9].
Lubricants 07 00088 g003
Figure 4. Definition of the length of cavities (sheet and strings) in up- and down-stroke motions.
Lubricants 07 00088 g004
Figure 5. MATLAB visual feedback image processing software.
Lubricants 07 00088 g005
Figure 6. Real time development of cavitation from onset to string cavitation during up-stroke motion for Lubricant A at 300 rpm, 70 °C, lubricant rate of 0.05 L/min with a time interval of 1.2° CA (or 0.33 ms) between the consecutive images of (al).
Lubricants 07 00088 g006
Figure 7. Consecutive images of cavitation development of Lubricant A at 300 rpm, 70 °C, lubricant rate of 0.05 L/min and capturing frame rate of 3600 fps; images covered the full cycle (0°–360° CA) with 20° CA interval.
Lubricants 07 00088 g007
Figure 8. Variation of number of string cavities as a function of crank angle for three consecutive cycles and the three Lubricants (AC) with different kinematic viscosities at 300 rpm, 70 °C and lubricant rate of 0.05 L/min.
Lubricants 07 00088 g008
Figure 9. Variation of number of string cavities as a function of crank angle for three consecutive cycles and the three Lubricants (AC) with different kinematic viscosities at 600 rpm, 70 °C and lubricant rate of 0.05 L/min.
Lubricants 07 00088 g009
Figure 10. Variation of the total length of cavities (sheet plus the strings) for Lubricant A as a function of crank angle for three consecutive cycles at 70 °C and lubricant rate of 0.05 L/min: (a) 300 rpm; (b) 600 rpm.
Lubricants 07 00088 g010
Figure 11. Consecutive images of cavitation development of lubricant B at 300 rpm, 70 °C, lubricant rate of 0.05 L/min; images covered the full cycle (0°–360° CA) with 20° CA interval.
Lubricants 07 00088 g011
Figure 12. Consecutive images of cavitation development of lubricant C at 300 rpm, 70 °C, lubricant rate of 0.05 L/min; images covered the full cycle (0°–360° CA) with 20° CA interval.
Lubricants 07 00088 g012
Table 1. Full Lubricant Matrix and testing conditions carried out on the Lubrication test-rig.
LubricantsFlow Rate [L/min]Temperature [°C]Kinematic Viscosity [cSt]Speed [rpm]
A0.057045.6300 and 600
B0.057030.9300 and 600
C0.057020.2300 and 600

