Article

Experimental Evaluation of Brake Pad Material Propensity to Stick-Slip and Groan Noise Emission

1
DIMA, Department of Mechanical and Aerospace Engineering, “La Sapienza” University of Rome, 00185 Roma, Italy
2
BREMBO S.p.A., Advanced R&D Department, Viale Europa 2, 24040 Stezzano, Italy
*
Author to whom correspondence should be addressed.
Lubricants 2018, 6(4), 107; https://doi.org/10.3390/lubricants6040107
Submission received: 5 October 2018 / Revised: 13 November 2018 / Accepted: 6 December 2018 / Published: 11 December 2018

Abstract

:
Frictional and dynamic responses of brake pad materials, when sliding on brake disc counterfaces, are at the origin of noise, vibration and harshness (NVH) issues such as brake noise emissions. In more detail, groan is a low frequency noise emission often associated to the stick-slip frictional response of the brake system. The instability of such contact is the result of the coupling between the system dynamics and the frictional response of the materials in contact. In this work, an experimental approach is proposed for measuring the frictional response and the propensity to generate stick-slip of different lining materials, coming from commercial brake pads, when sliding on a worn surface of a brake disc, under the same controlled boundary conditions. The proposed methodology allowed for comparing the propensity of the tested pad materials to stick-slip vibrations, which is in agreement with feedback from automotive industry on groan emission.

1. Introduction

In brake industries, one of the main concerns is the warranty cost due to NVH issues, originating from the brake frictional interface and involving the dynamic response of the whole brake system. Friction-induced vibrations are an ever-present effect of frictional contact between two solids in relative motion [1,2,3,4,5,6]. As a function of the interface materials, the boundary conditions and the system dynamics, the system response can result in either stable or unstable vibrations [7,8,9]. This leads to different contact scenarios [10,11], such as stable sliding with “friction noise” [12,13,14,15], macroscopic stick-slip instability [16,17,18,19], or mode coupling instability [3,20,21,22,23]. In the brake industry, the different noise emissions, resulting from the contact between the lining material and the disc surface during the braking phase, are associated to these different frictional scenarios. In fact, while high frequency squeal noise is more likely to be associated to mode coupling instabilities [24,25,26,27,28], groan noise is more likely to be associated to stick-slip instabilities [29,30].
Such phenomena are related to an unstable vibrational response of the frictional system, due to the coupling between the system dynamics and the transient behavior at the frictional interface [16,17,19]. A difference between static and dynamic friction coefficient [31] or a negative friction-velocity slope have been commonly associated with the occurrence of macroscopic stick-slip in a dynamic system; however, recent studies showed that macroscopic stick-slip can occur even with a local constant friction coefficient, when accounting for fast dynamics (wave generation and propagation) at the interface [16,17].
In automotive, and more generally, in brake literature, several papers attributed groan noise emission to the stick-slip events occurring at the pad/disc interface for low braking velocities [29,30,32,33].
Jang et al. [30] investigated the creep groan propensity of different frictional materials. The results allowed for the assertion that creep groan can be reduced by materials showing a slight difference between the static and dynamic friction coefficients. By analytical and theoretical approaches, several reduced order models have been developed in literature for reproducing the creep groan vibrations of a full brake system [29,34], also accounting for the nonlinear nature of such phenomena [32].
Nevertheless, because the stick-slip instability is a result of the coupling between system dynamics and contact response, and because the dynamics of a commercial brake system is extremely complex and sensitive to several uncontrollable parameters, it is not possible to reliably evaluate how prone the material is to destabilize the system dynamics through tests performed on a full brake system.
With this purpose, in this work, the brake materials are tested on a simplified set-up, which allows for the imposition that the relative motion between samples of pad and disc materials, under well controlled boundary conditions. The vibrational response is monitored in parallel to the macroscopic contact forces, in order to provide information about the material response as a function of the main investigated parameters. Finally, a discussion on the obtained results is presented, with respect to feedbacks by the automotive brake industry on the material propensity to groan noise emission.

2. Materials and Methods

When measuring vibrations due to the frictional contact between solids, the resulting vibrations are due to the system dynamic response to the contact broadband excitation [13]. In order to focus on the material contribution to the stick-slip occurrence, it is then necessary to decouple the contribution related to the contact excitation from the one due to the dynamic of the system, which will modify the frequency distribution and amplitude of the vibrational response. To decouple the two contributions, one can either extract the spectrum of the contact excitation from the response, by inverse methods [15], or compare the vibrational response under identical dynamic conditions. In fact, ensuring the testing of different materials under the same system dynamics and under the same boundary conditions allows for a direct comparison of the material propensity to promote stick-slip instabilities, by directly comparing the vibrational response. The results are then discussed with respect to the frictional response (macroscopic friction coefficient) of the tested materials.

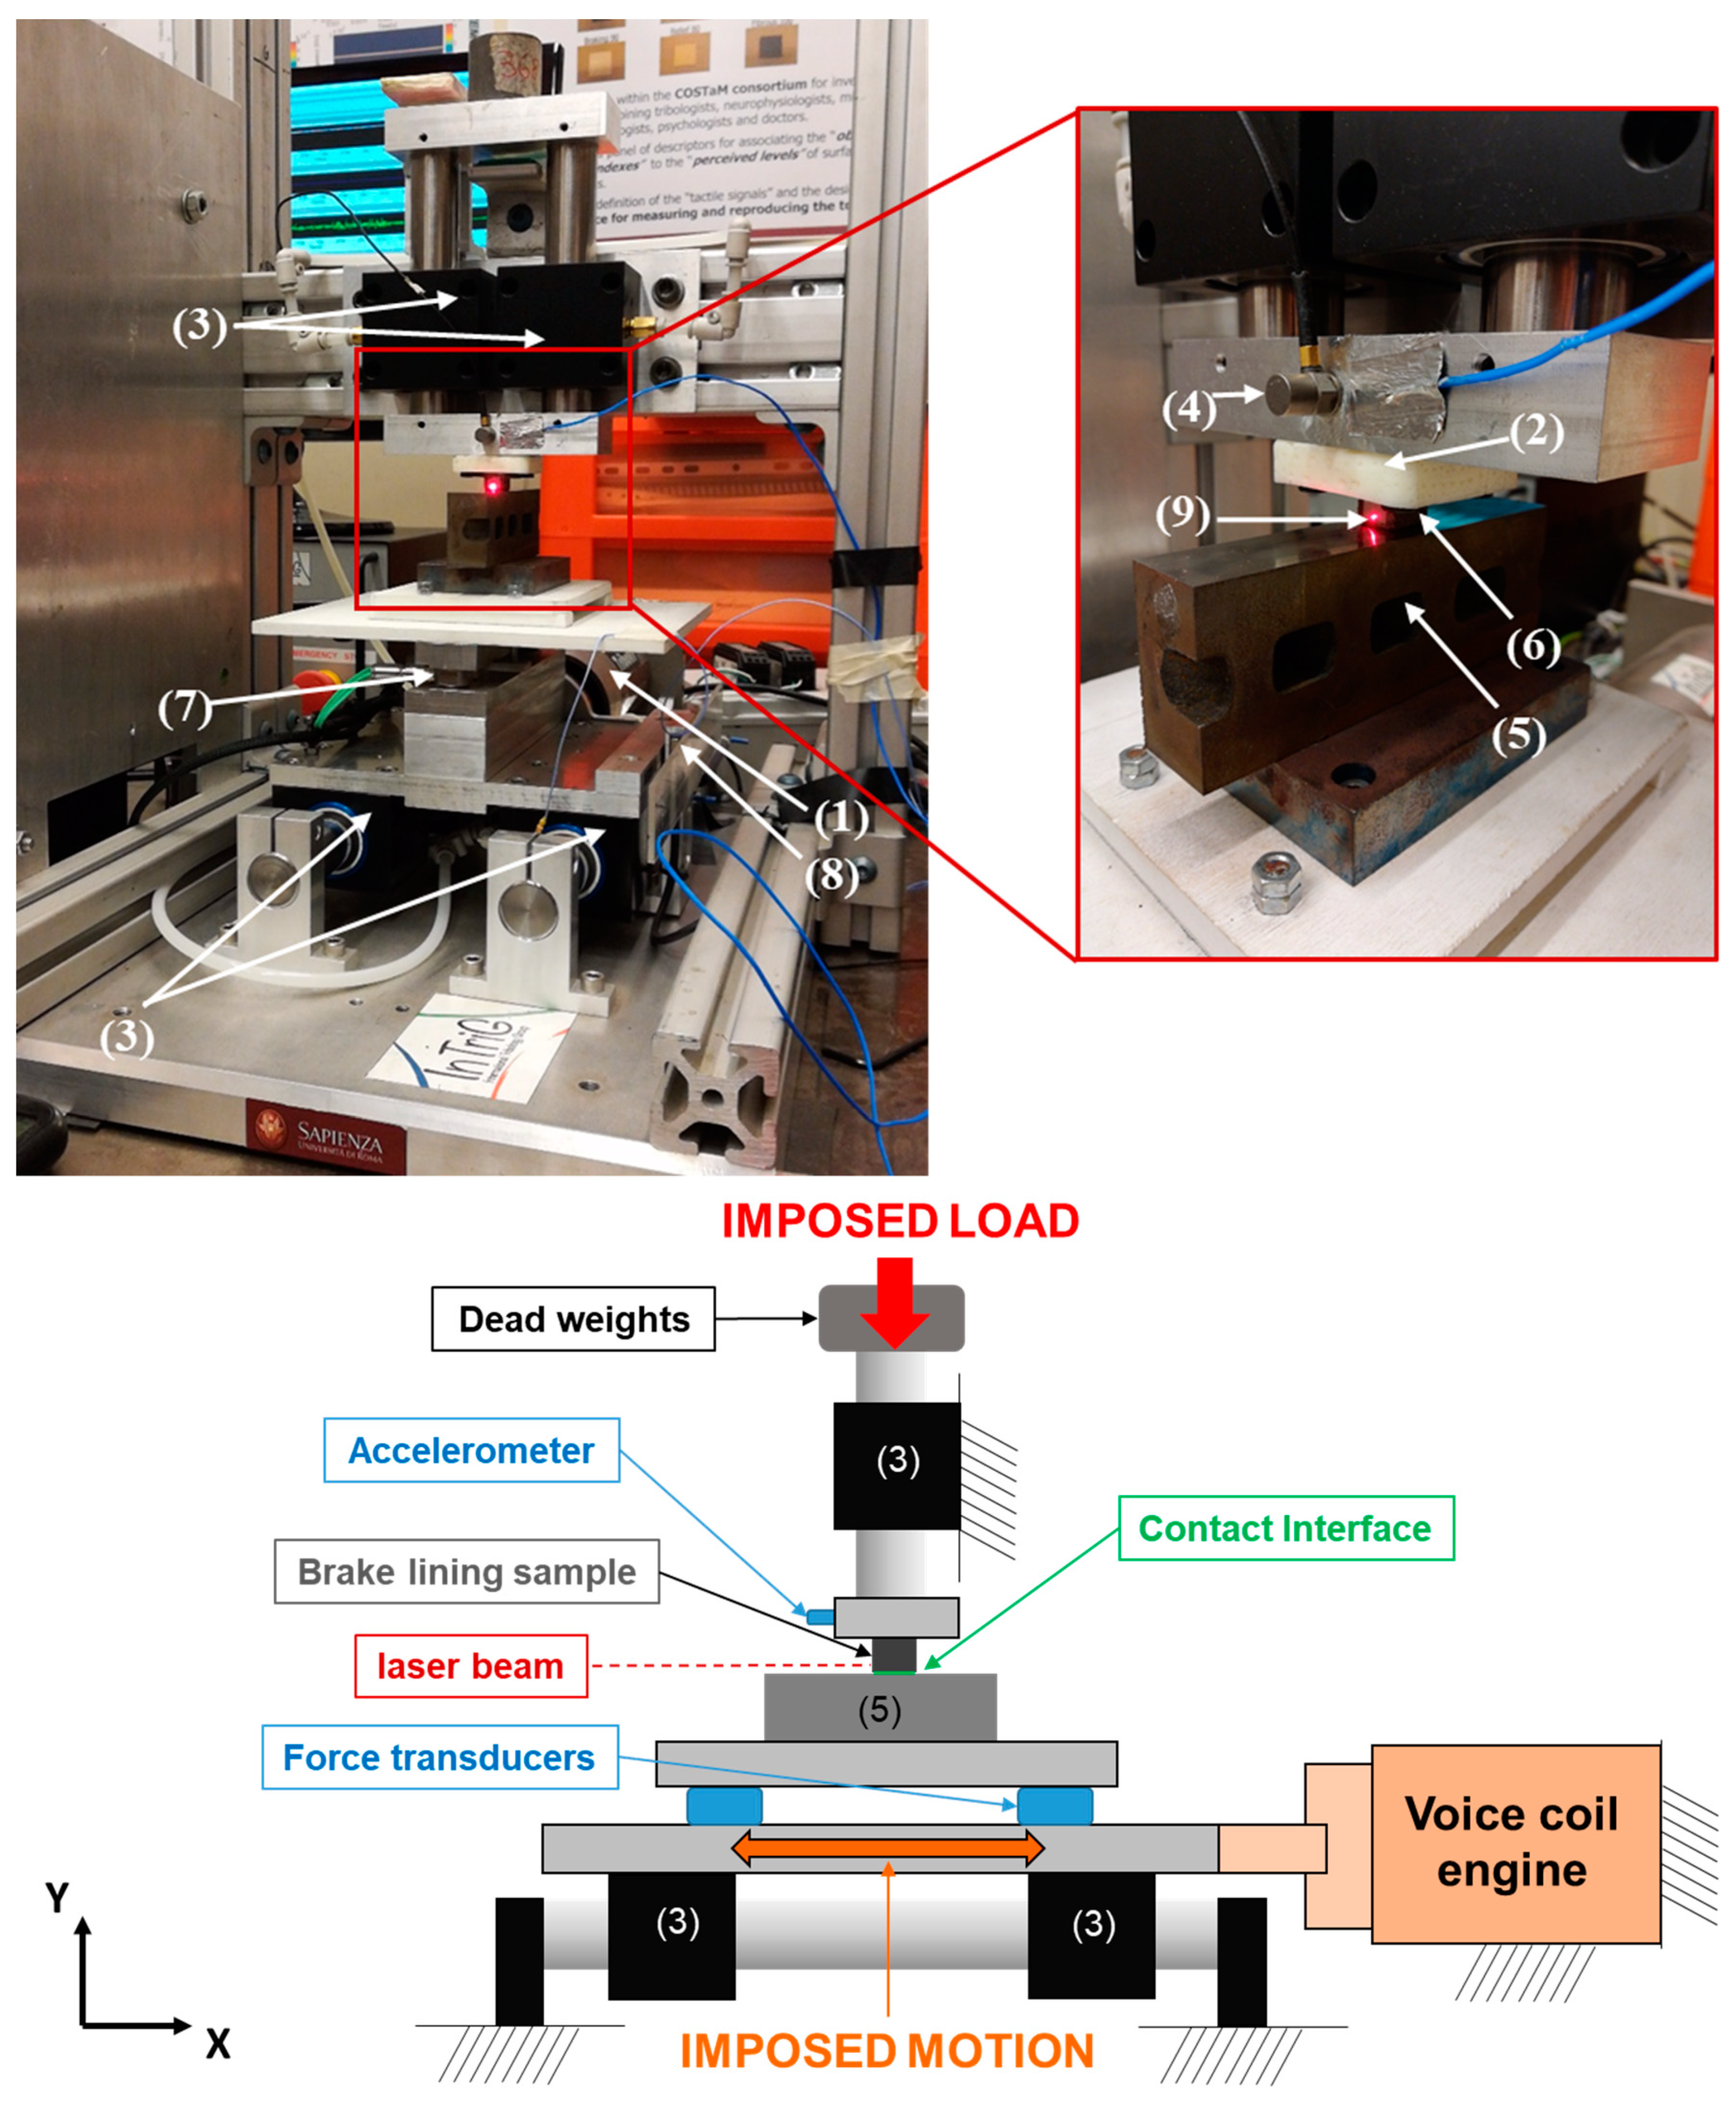
2.1. Experimental Set-Up

The experimental set-up, named TriboAir, used for the experimental campaign is presented in Figure 1. This system is especially designed for reproducing and measuring contact-induced vibrations without introducing parasite noise from other contact interfaces. During the tests, the only contact interface, in sliding or rolling, is the tested one. With this purpose, the test bench is composed by: (i) A base on four air bushings, allowing for the relative motion of the lower contact sample along the tangential direction; (ii) other two air bushings holding the upper sample and allowing the application of the load, by dead weights, along the normal direction with respect to the contact; and (iii) a voice-coil linear motor for imposing the desired motion law at the lower sample, commanded by a servo drive and a linear optical encoder.
During the imposed sliding between the two samples, the normal and tangential forces are measured by a measurement table, composed of two tri-axial force transducers, while the relative motion is recovered by the encoder. An accelerometer is used for measuring the vibrational response of the system during the movement, while a laser vibrometer is pointed on the brake lining upper sample, at about 1.5 mm from the surface, in order to detect the contact-induced vibrations as close as possible to the frictional interface. The accelerometer and the laser vibrometer measure the vibrational acceleration and vibrational velocity along the sliding direction between the pad and the disc (along X axis, with respect to the scheme in Figure 1). The signals are acquired by an 8-channels-acquisition-card (NI 4472) with a sampling frequency of 100 kHz and then post-processed by Matlab ©.
In order to perform tests at different temperatures, two infrared (IR) emitters are placed on the side of the samples in contact, and two thermocouples are placed for monitoring the temperature of the samples.

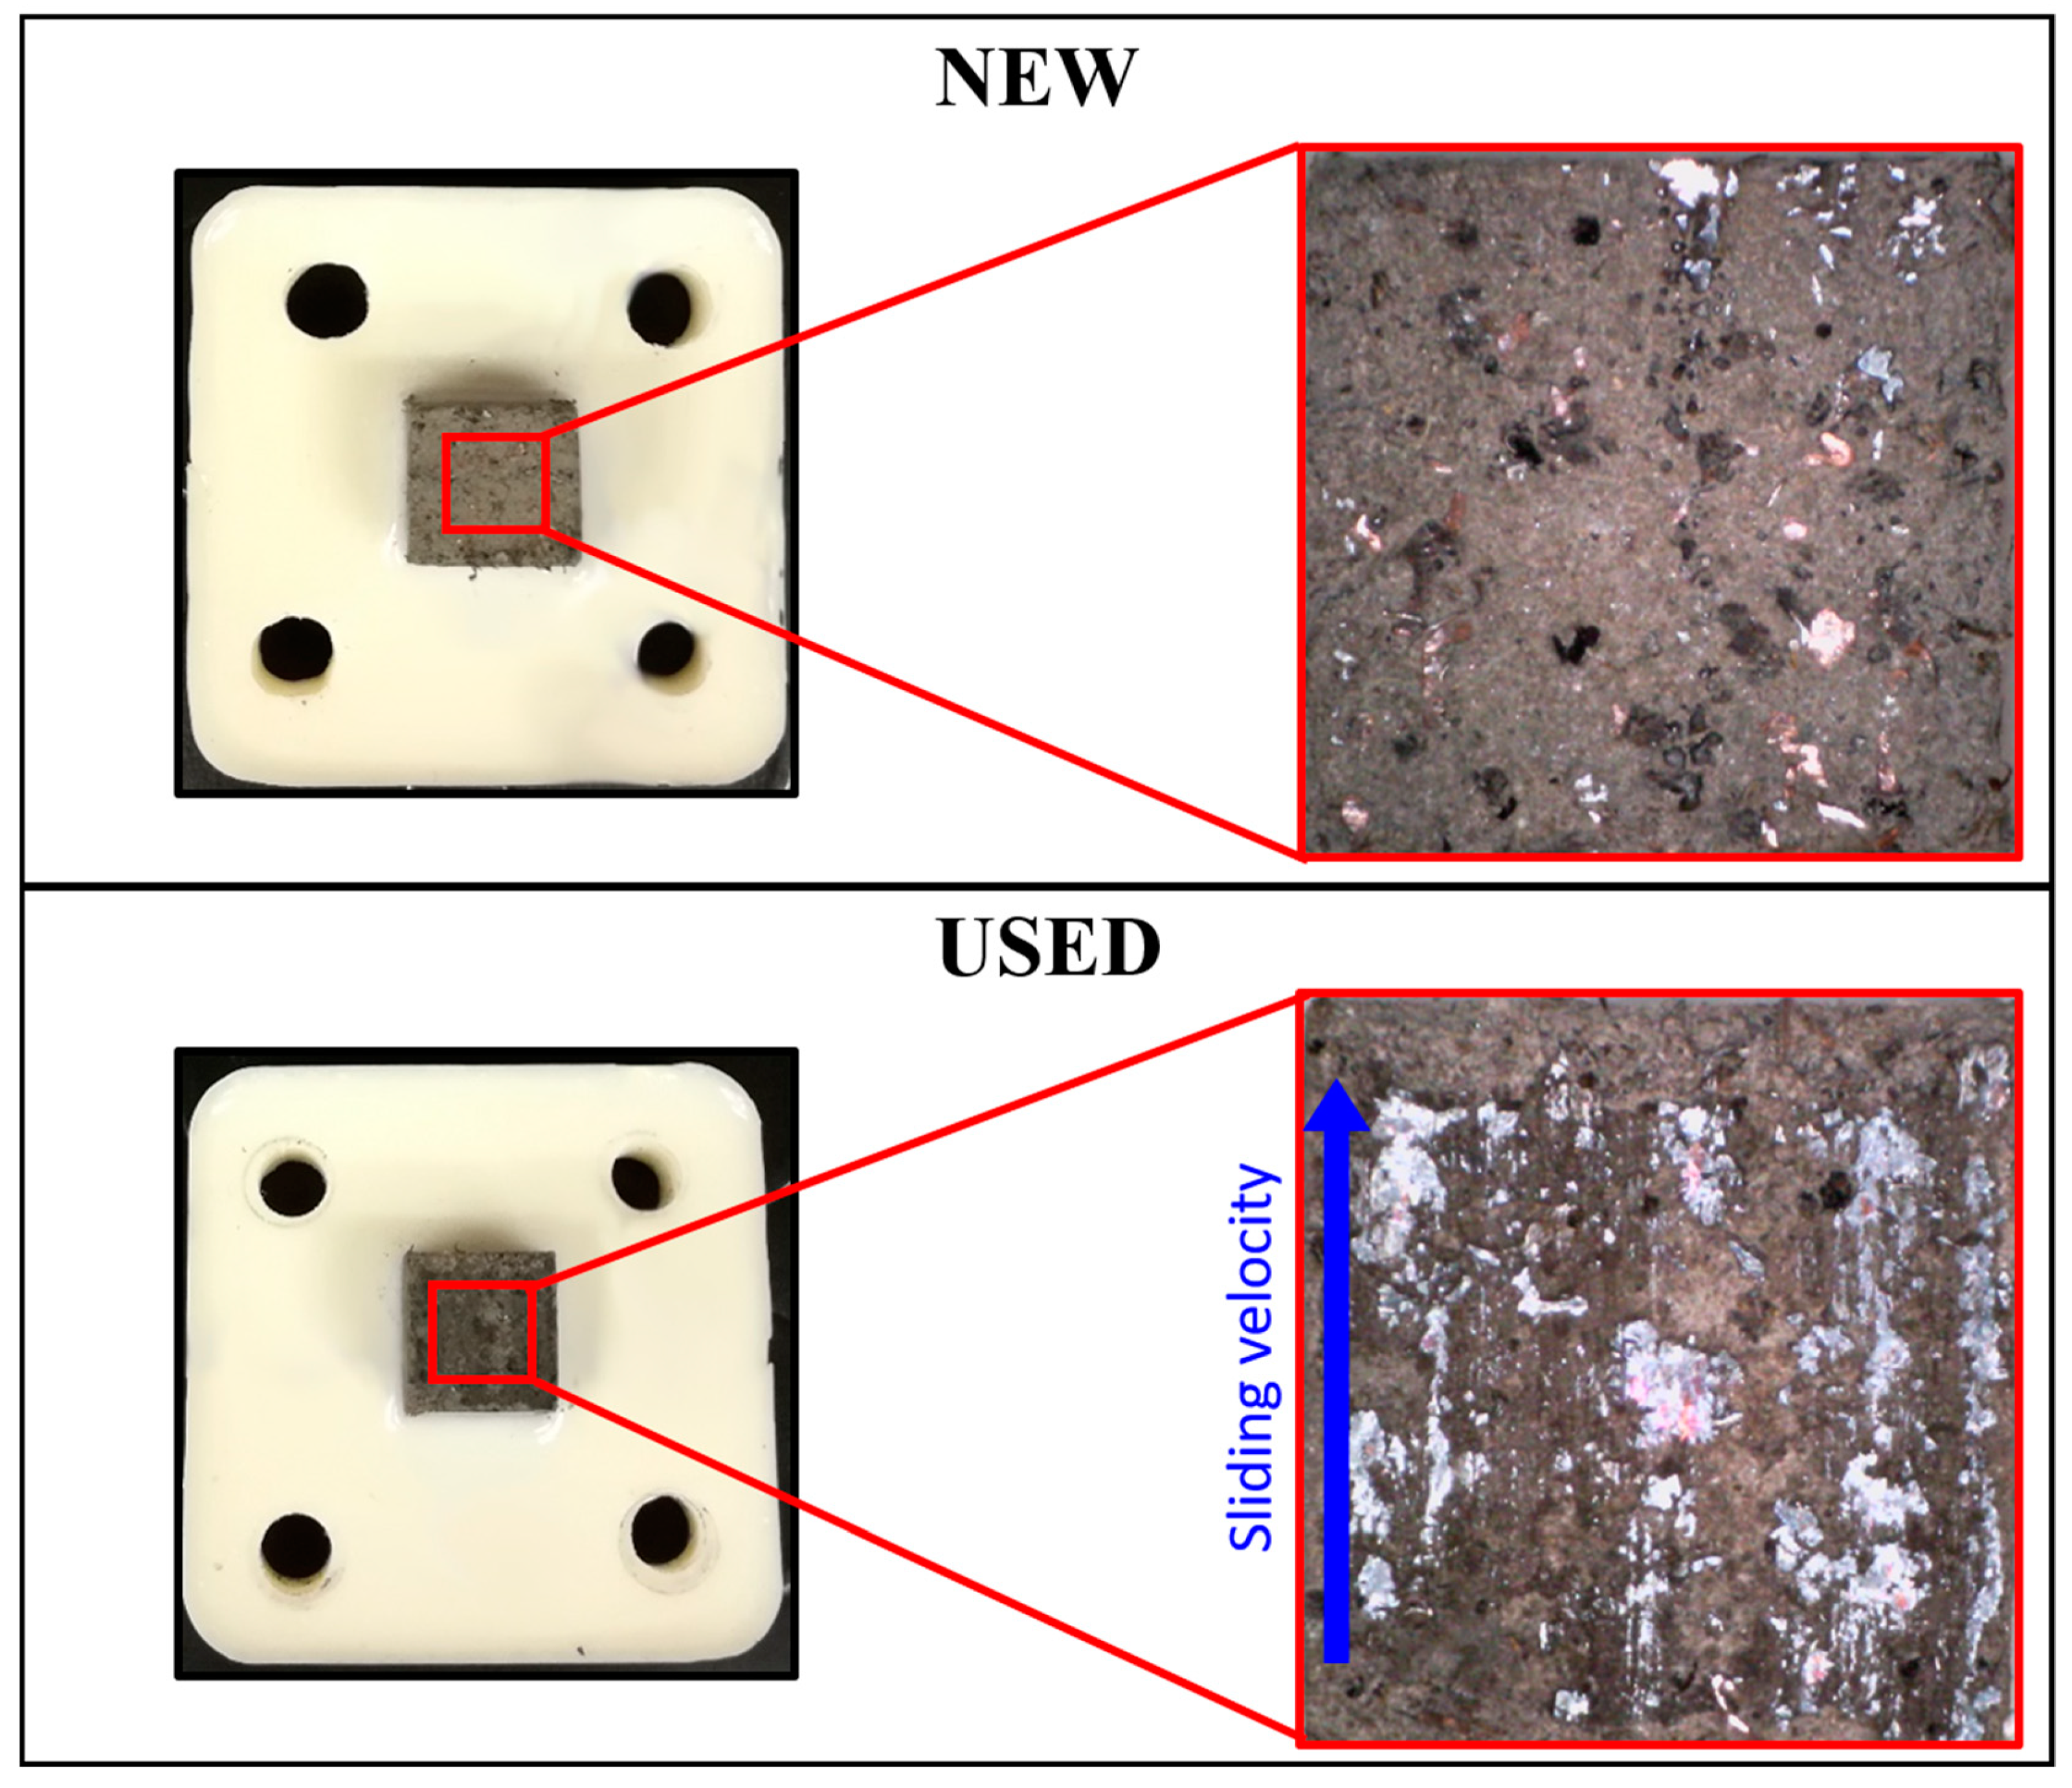
2.2. Friction Material Samples and Test Protocol

For the analysis presented in this work, 4 different automotive friction pad materials have been tested. The materials have been tested both in new and used conditions. The used pad have been obtained by machining brake pads subjected to a SAE J2521 protocol [35], on a full brake disc dynamometer, for a total number of 2500 brake events for each pad. When analyzing the used pad sample, attention was placed to run the experiments along the friction direction, given by the sliding grooves visible at the pad surface (Figure 2). The brake pad has been then machined to obtain small samples of pad material with a contact surface of 10 × 10 mm. On the other side, a sample of 100 × 20 × 36 mm of the disc has been machined directly from a commercial brake disc (Figure 1). Hereafter, the tested materials will be named as MAT-x, with x referring to the material number. All the material samples have been obtained by machining commercial friction pads. MAT-1, MAT-2, and MAT-4 are low steel materials. While MAT-1 and MAT-4 are medium braking performance materials, MAT-2 is an advanced braking performance material. On the contrary, MAT-3 is an NAO (Non-Asbestos Organic) friction material.
In the nominal conditions, each test is conducted with an imposed normal load of 20 N (0.2 MPa) and at ambient temperature (23 °C). The test protocol consists in a series of tests at constant and variable velocity profiles, according to the sequence reported in Table 1.
Tests performed with an imposed constant velocity are used to identify the occurrence of stick-slip and to measure the stick-slip instabilities. On the other hand, variable velocity tests are used to detect the potential friction coefficient dependence on sliding velocity, as well as the critical velocity range at which stick-slip may occur.
As shown in Table 1, the first test is always conducted at a constant velocity of 10 mm/s for 10 cycles. This choice has been made in order to obtain a stabilized behavior of the sample, which could be affected by slight defects or deposits on the surfaces. The following tests are performed at constant velocity ranging from 0.1 to 5 mm/s.
Afterwards, the variable velocity test is carried out. The acceleration is selected in order to obtain the wanted maximum velocity within the single stroke, with a linear increase and decrease of the velocity.
Lastly, a test is conducted at a constant velocity of 1 mm/s and compared with the one performed before. This final verification test is performed with the aim of identifying potential differences of the sample behavior after the performed set of tests. If this last response is the same as the previously obtained one, the robustness of the whole set of tests, with respect to the sample wear, is validated.
Even if, when testing the same material, the different topography of each sample results in a slightly different response for each tested sample, the general trends and mean values are well reproducible. Moreover, different tests carried out on the same sample, after being disassembled and reassembled, showed a negligible difference of the measured frictional response, assessing the robustness and repeatability of the test protocol. Even considering the slight variability among the single tested samples, due to its local topography, the general trends obtained after the measurement campaign can still be considered robust and representative of the frictional response of the tested material.

3. Frictional and Dynamic Response of the Tested Materials

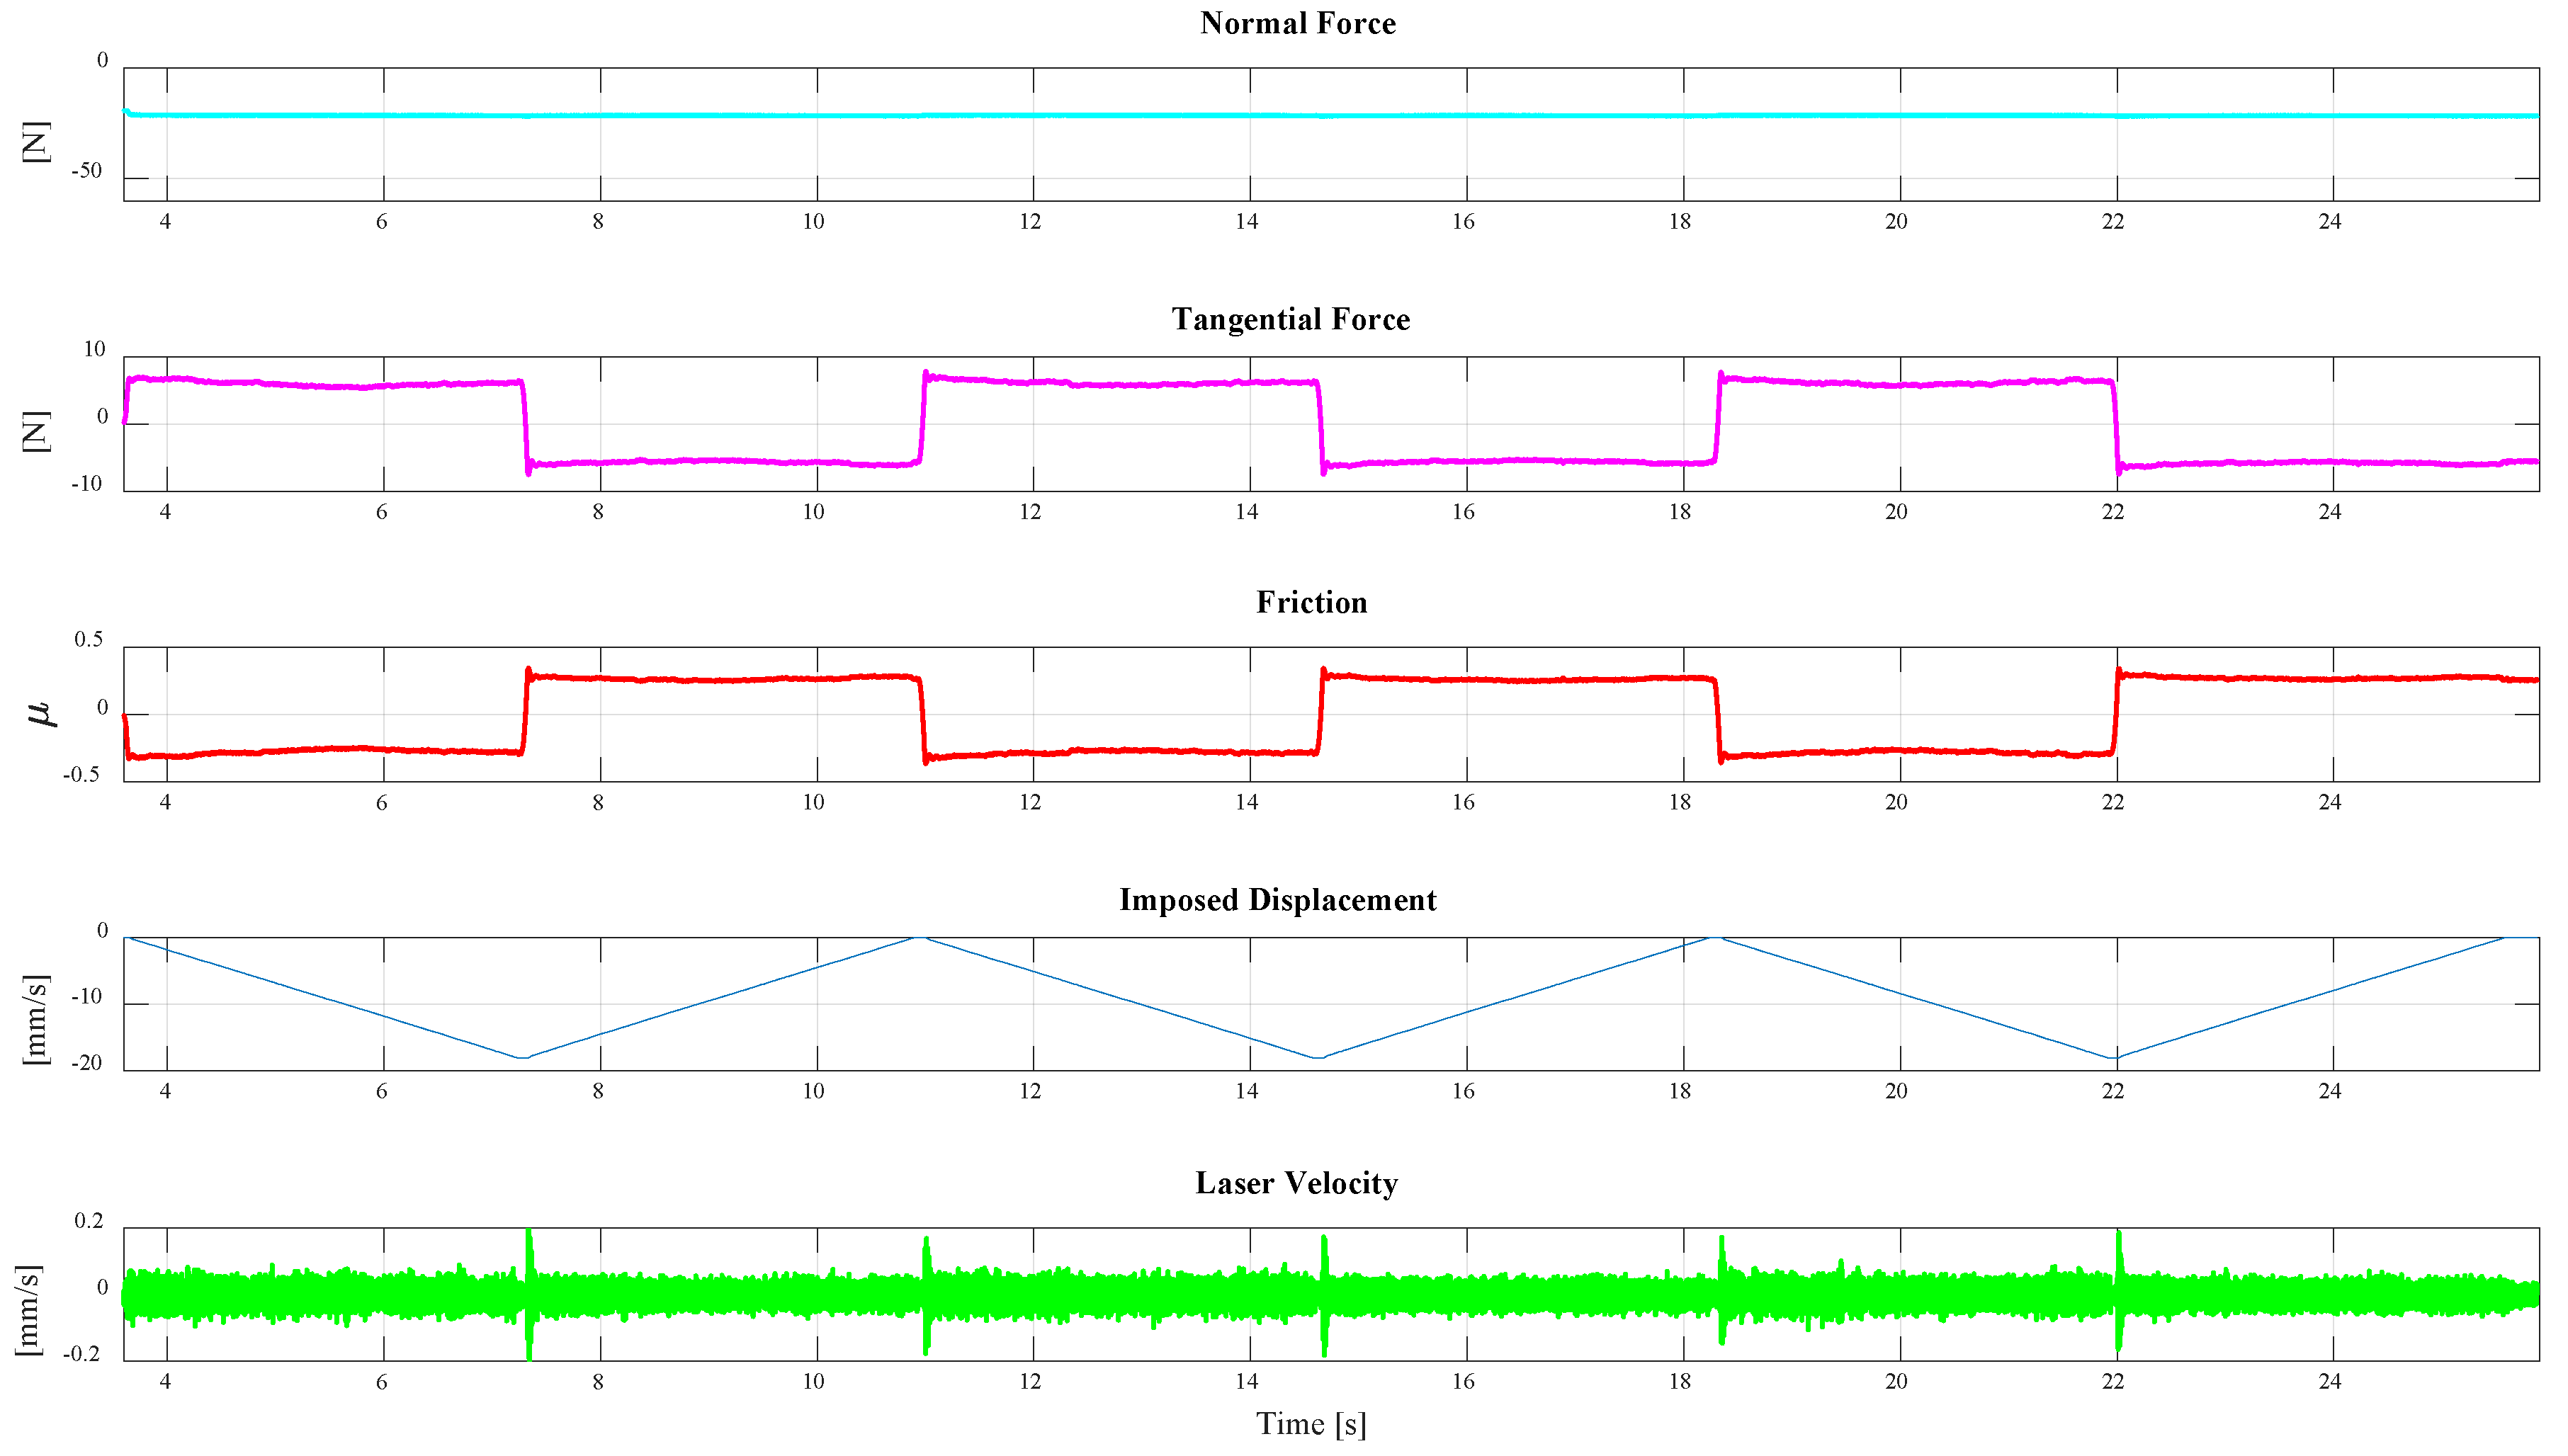
3.1. Frictional Material Response

Figure 3 shows an example of signals recorded during a test at a constant velocity of 0.1 mm/s. The friction coefficient, computed as the ratio between the recovered tangential force and the normal one, is also shown as a function of time (red curve in Figure 3: Example of acquired signals. From the top: Normal force, tangential force, friction coefficient, imposed displacement, and laser velocity measured at 1.5 mm from the contact interface (MAT-3 (USED)). The measured laser velocity (last curve in Figure 3) provides information on the local vibrations close to the frictional interface.
In order to account for the frictional response of the tested materials as a function of the relative velocity, tests are carried out at variable velocity. As an example, Figure 4 illustrates the measured friction coefficient as a function of the imposed velocity, when ranging from zero to 5 mm/s.
The curve in Figure 4 is composed by two branches, for both negative and positive velocities. The branches marked with the black arrows correspond to the acceleration phase, with the imposed velocity ranging from zero to 5 mm/s. The branches marked with the green arrows correspond to the deceleration phases, with the imposed velocity ranging from five to 0 mm/s. The intermediate branches with high slope, marked by the dashed blue arrows, are representative of the system, sample, and interface tangential deformation during the tangential loading, before the occurring of the macroscopic sliding at the contact interface (tangential stiffness of the frictional system). This curve would be vertical in the ideal case of infinite tangential stiffness of the system.
When looking at the friction-velocity curves, the presence of a potential negative friction-velocity slope can be found in the green branches of the curve, where the system is already in relative sliding condition at the interface and the imposed velocity decreases to zero.
In fact, in the black branches the system shifts from sticking to sliding condition, and the slope in the branches can be affected by the inertial contributions due to the initial transition from the static contact force to the dynamic one. For this reason, this transition is not representative of the friction coefficient variation with the sliding velocity. In the proposed example, since only the green branches have to be considered, there is not a significant negative friction velocity slope. On the contrary, the black curves can be exploited to estimate the difference between static and dynamic friction coefficient.

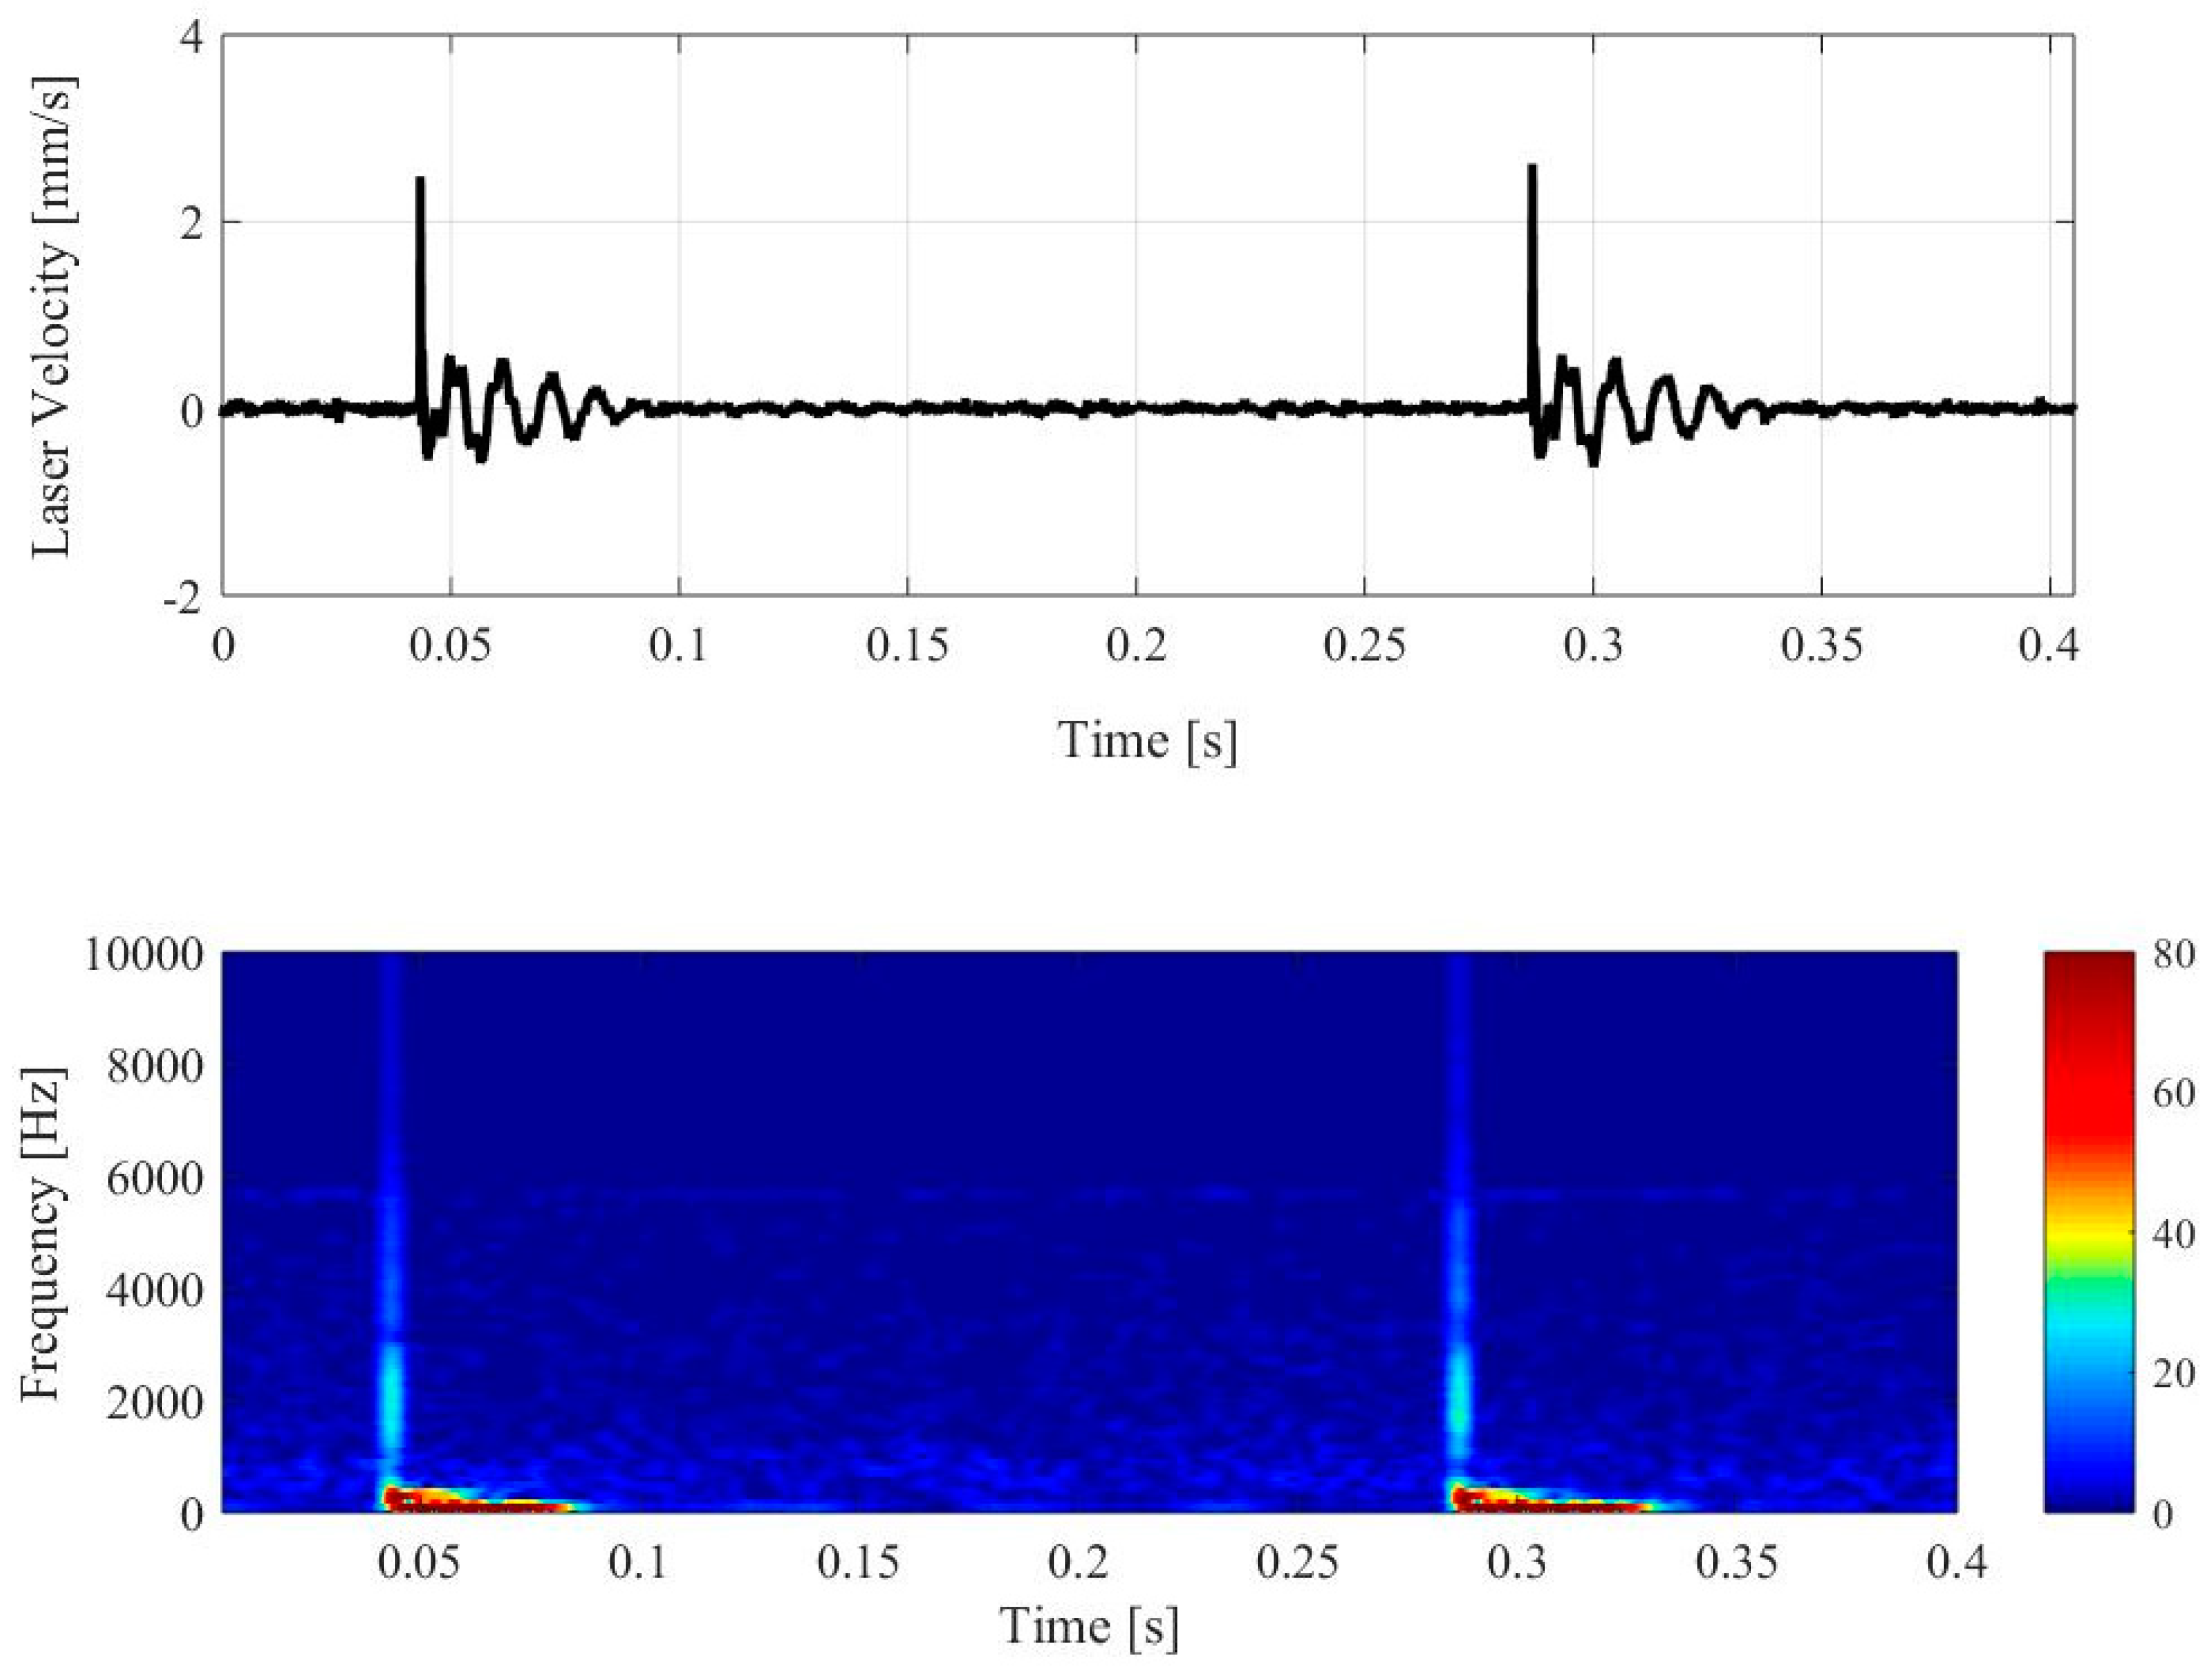
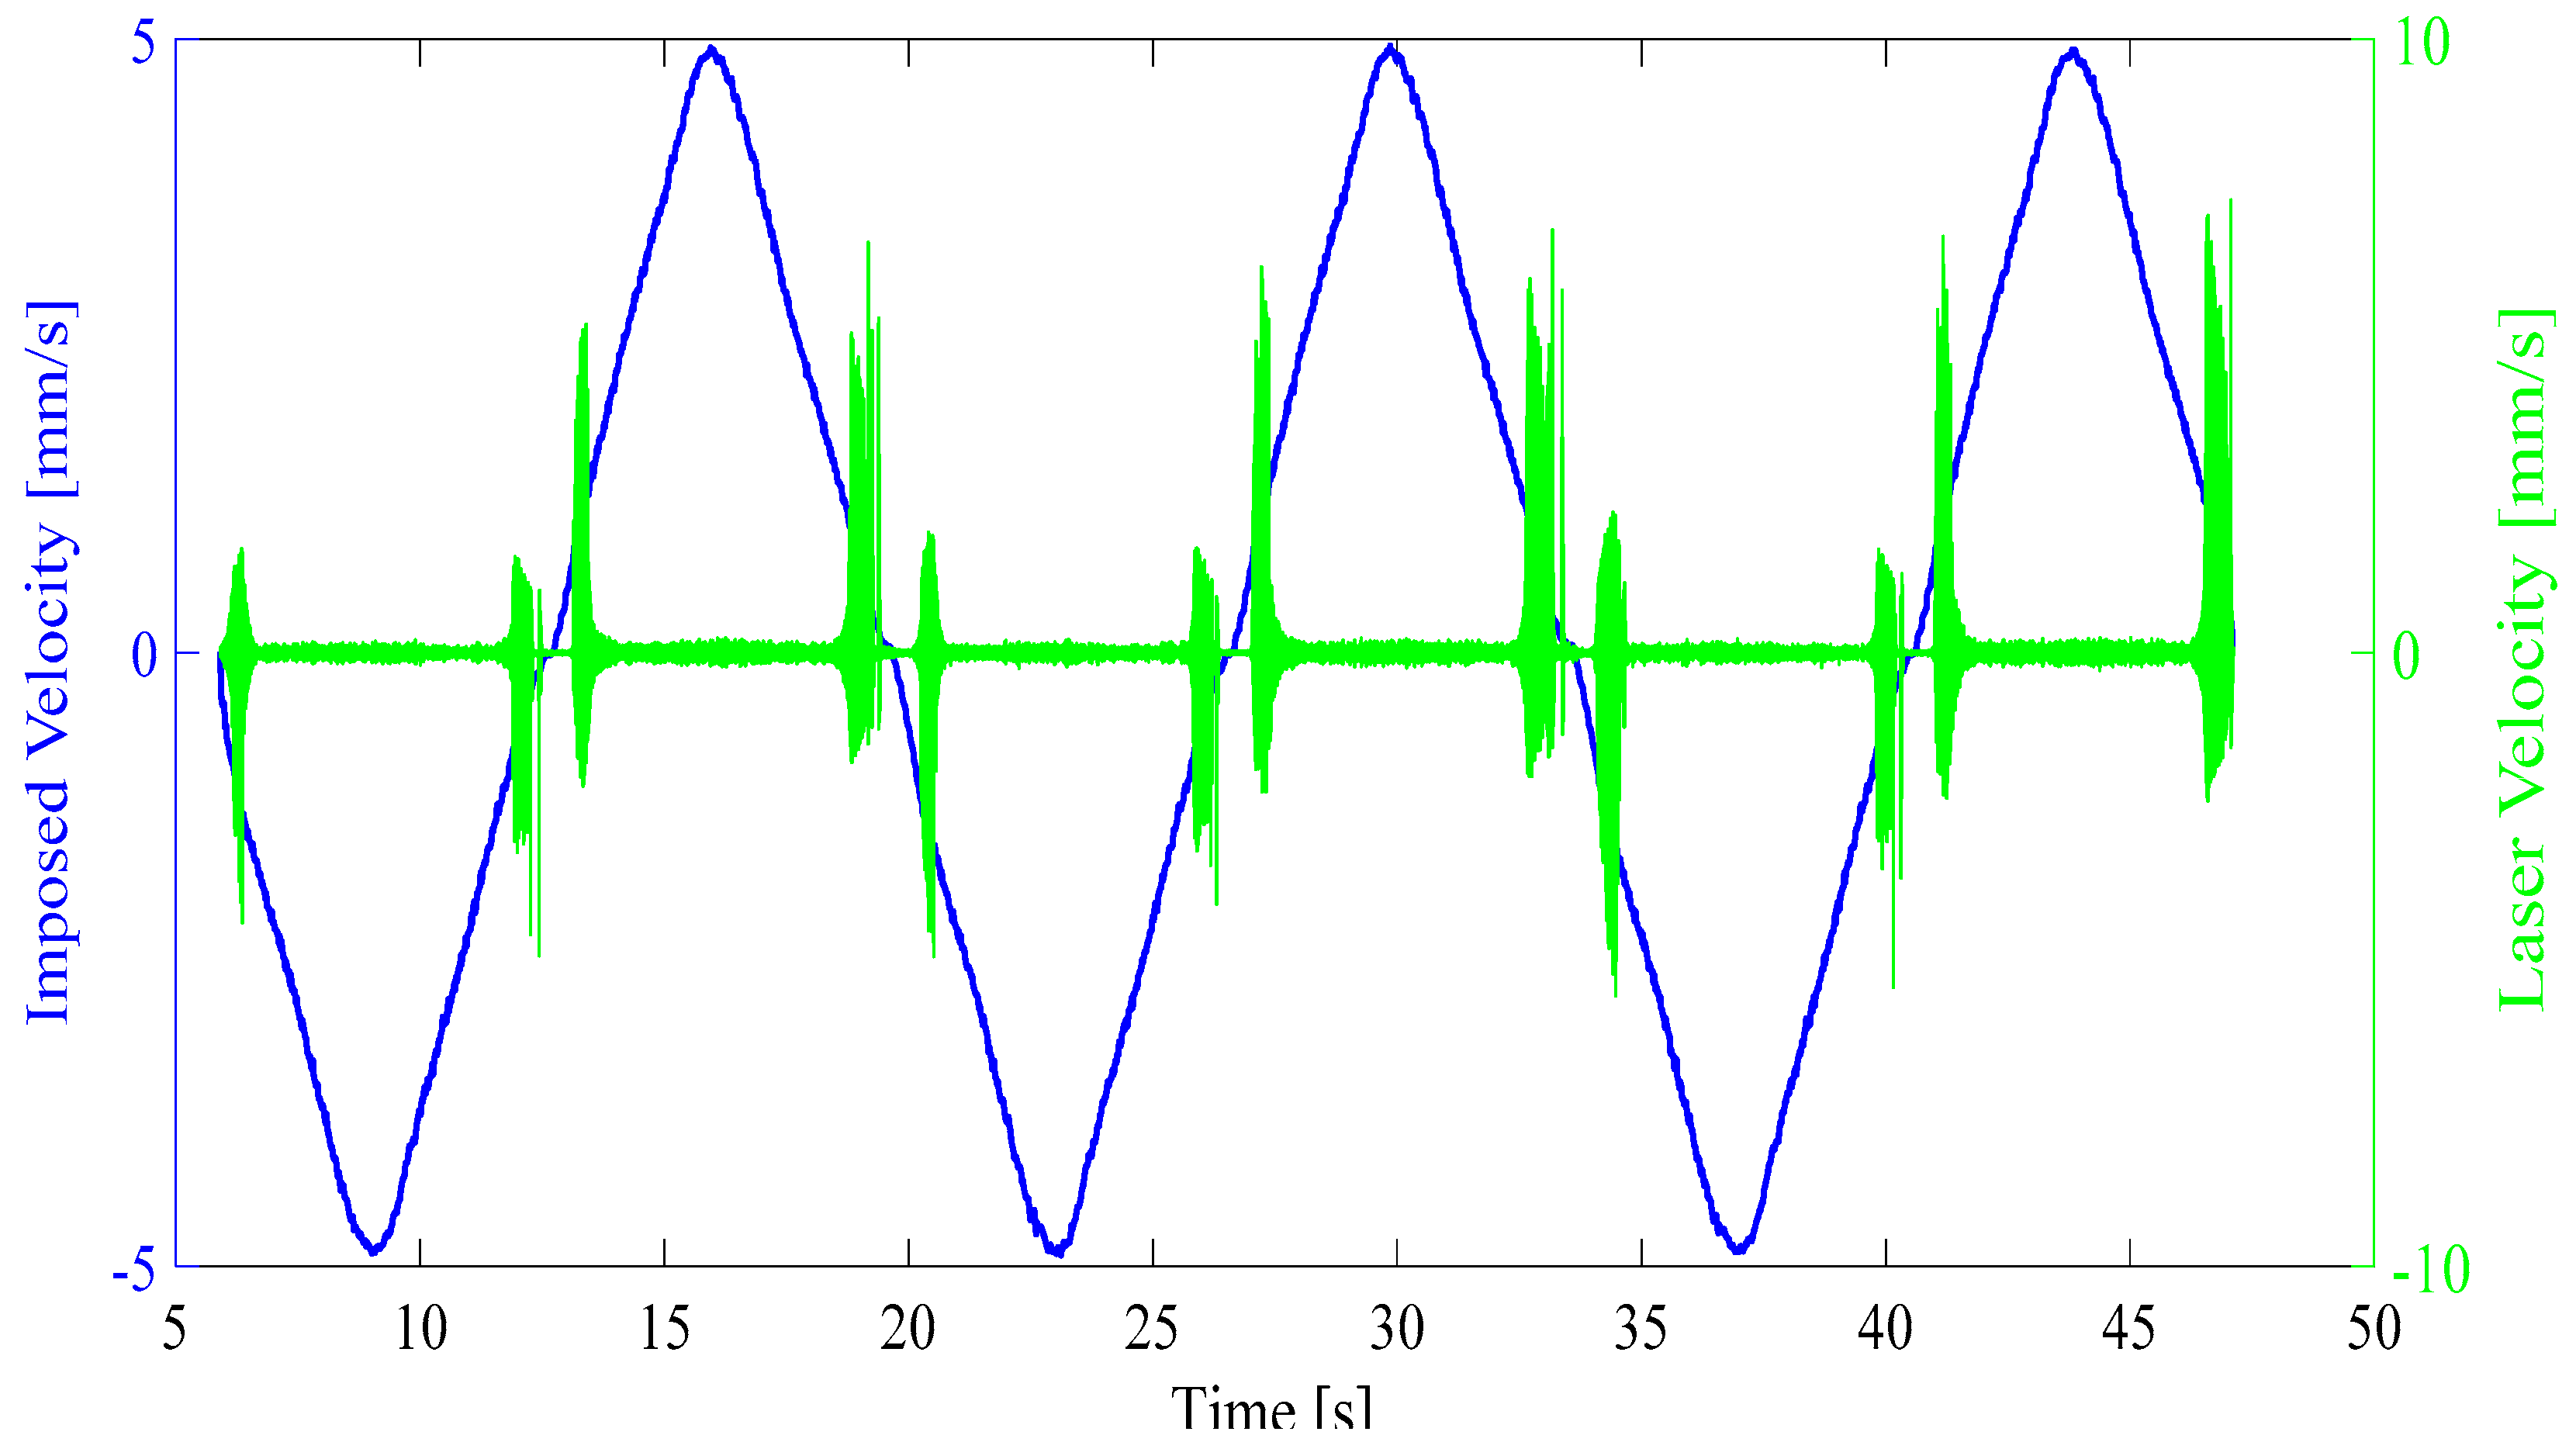
3.2. Stick-Slip Analysis

The last plot in Figure 5 shows the detail of the velocity signal recorded during a test with imposed velocity of 0.1 mm/s where the presence of stick-slip instability is evident. In fact, the trend of the velocity shows successive periodical responses to impulsive excitations, due to the sudden switches between sticking and sliding conditions [10,16].
When the stick-slip excitation occurs, the spectrum of the vibrational response is a function of the system dynamics, which is excited by the impulsive excitation, and responds with its natural frequencies (spectrogram in Figure 6). The spectrogram shows the frequency content related to the analyzed stick-slip. The characteristic pulse of the single stick-slip, associated to the drop of the tangential force, results in a broadband frequency excitation (vertical lines on the spectrogram). After the spike, the lower frequency modes still vibrate, while the higher frequency modes are quickly attenuated by the system and material damping.
Moreover, because the stick-slip dynamic instability is more likely to occur at lower relative velocities, the critical velocity, i.e., the maximum imposed relative speed at which stick-slip takes place, is taken into consideration. Figure 7 shows the vibrational velocity, measured by the laser vibrometer, for a test performed at a variable imposed velocity, from 0 up to 5 mm/s (0→5 mm/s). The critical velocity range, in which stick-slip occurs, is thus identified. For the tested material in Figure 7, stick-slip occurs between -0.88 and +1.41 mm/s, which brings to a critical velocity range Δ = Positive critical velocity − Negative critical velocity = 2.29 mm/s.

4. Material Comparison

In this section, the frictional and dynamical measurements on the different material samples will be presented and compared in order to discuss the different propensity of the investigated materials to promote stick-slip instability (groan noise).

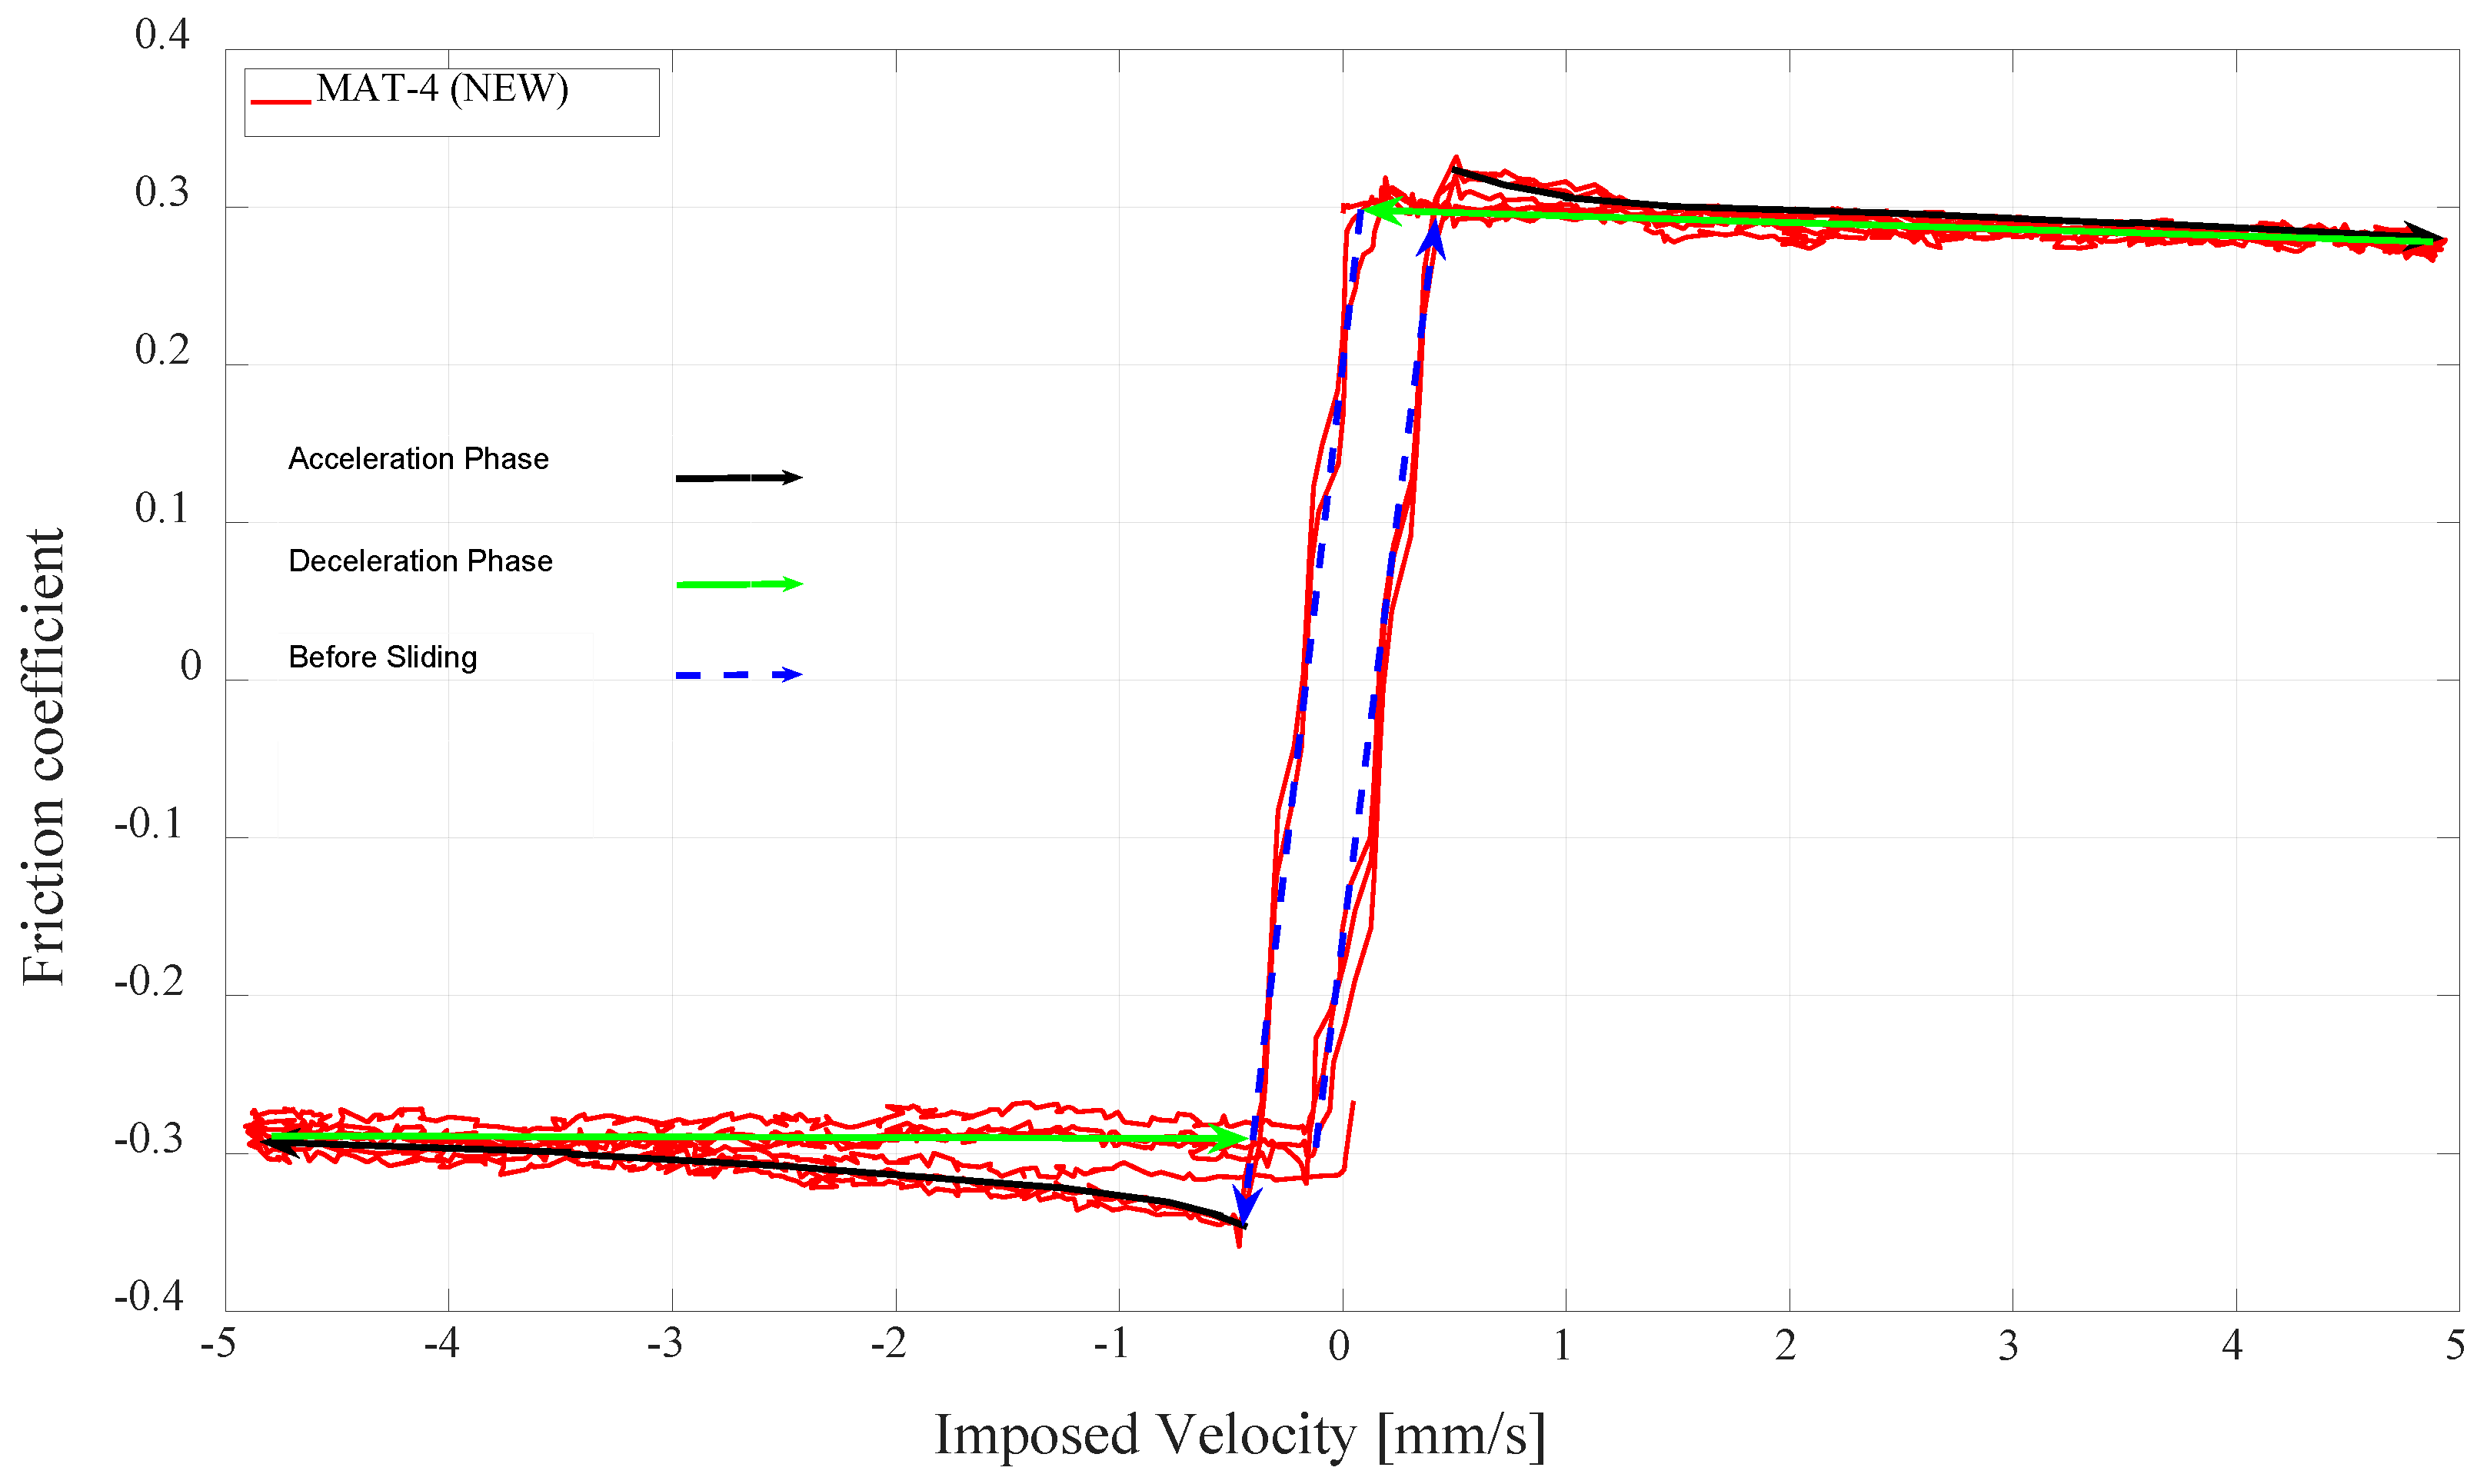
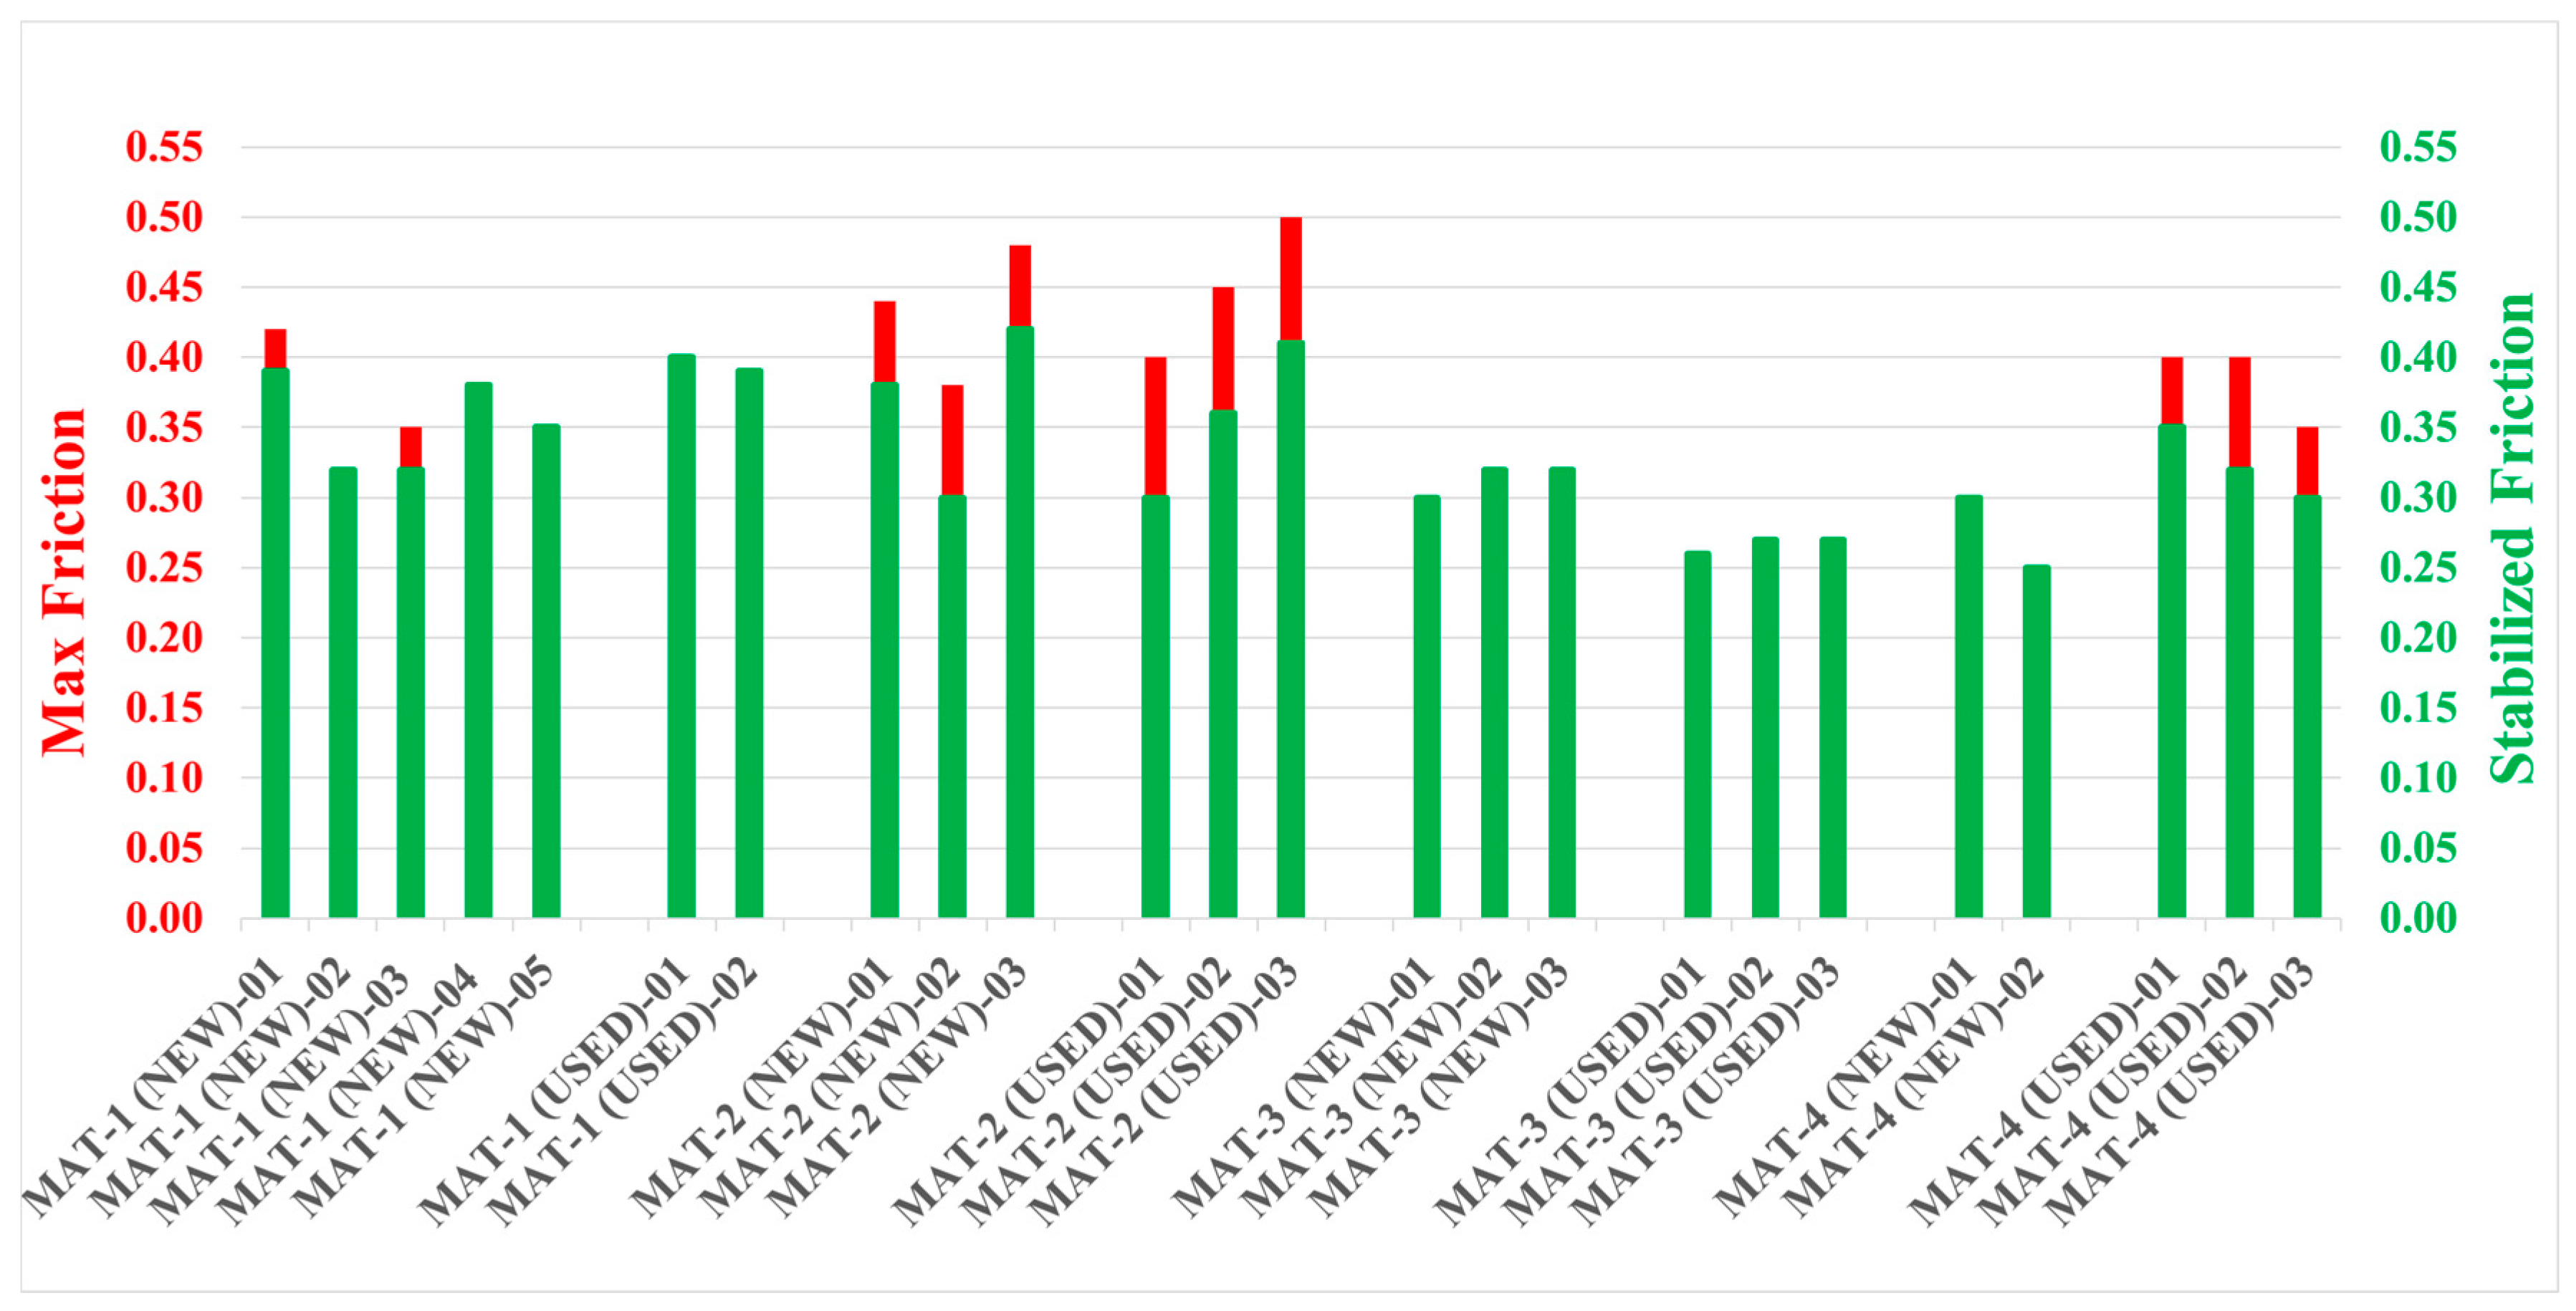
4.1. Material Frictional Response

First, a comparison between the same material in new and used conditions is performed. As can be noticed in Figure 8, the comparison between new and used samples does not show relevant differences among the tested samples. All the materials exhibit very little difference between NEW and USED state, which can be attributed to the difference in the sample topography. In fact, it should be kept in mind that brake linings are made of composite materials, with a structural matrix and several additive and fillers. Each sample, machined from the whole pad, will have a different topography and surface composition. For this reason, only macroscopic and repeatable differences in the values and trends of the friction coefficients have to be accounted for, when comparing the materials.
The comparison between different pad materials is then showed in Figure 9. The comparison between MAT-1 and MAT-2 highlights the presence of a clear negative friction-velocity slope in MAT-2, which is not recorded in MAT-1. On the other hand, the comparison between MAT-3 and MAT-2 shows an important difference in the value of the mean friction coefficient. Moreover, it can be noted that MAT-3 is not affected by any variation of the friction coefficient with the imposed velocity. MAT-4 presents an intermediate behavior.
In order to obtain an evaluation of the frictional response of the tested materials, at least two samples, both in NEW and USED conditions, have been tested for each material. The bar chart in Figure 10 exhibits the maximum (at 0 mm/s) friction coefficient (in red) and the stabilized (at 5 mm/s) friction coefficient (in green), detected for each sample. When there is no difference between the maximum and stabilized friction coefficient, only the stabilized friction coefficient is shown. The bar chart is related to variable velocity tests conducted at V = 0→5 mm/s and a normal load equal to 20 N. This chart points out some important characteristics of the tested materials:
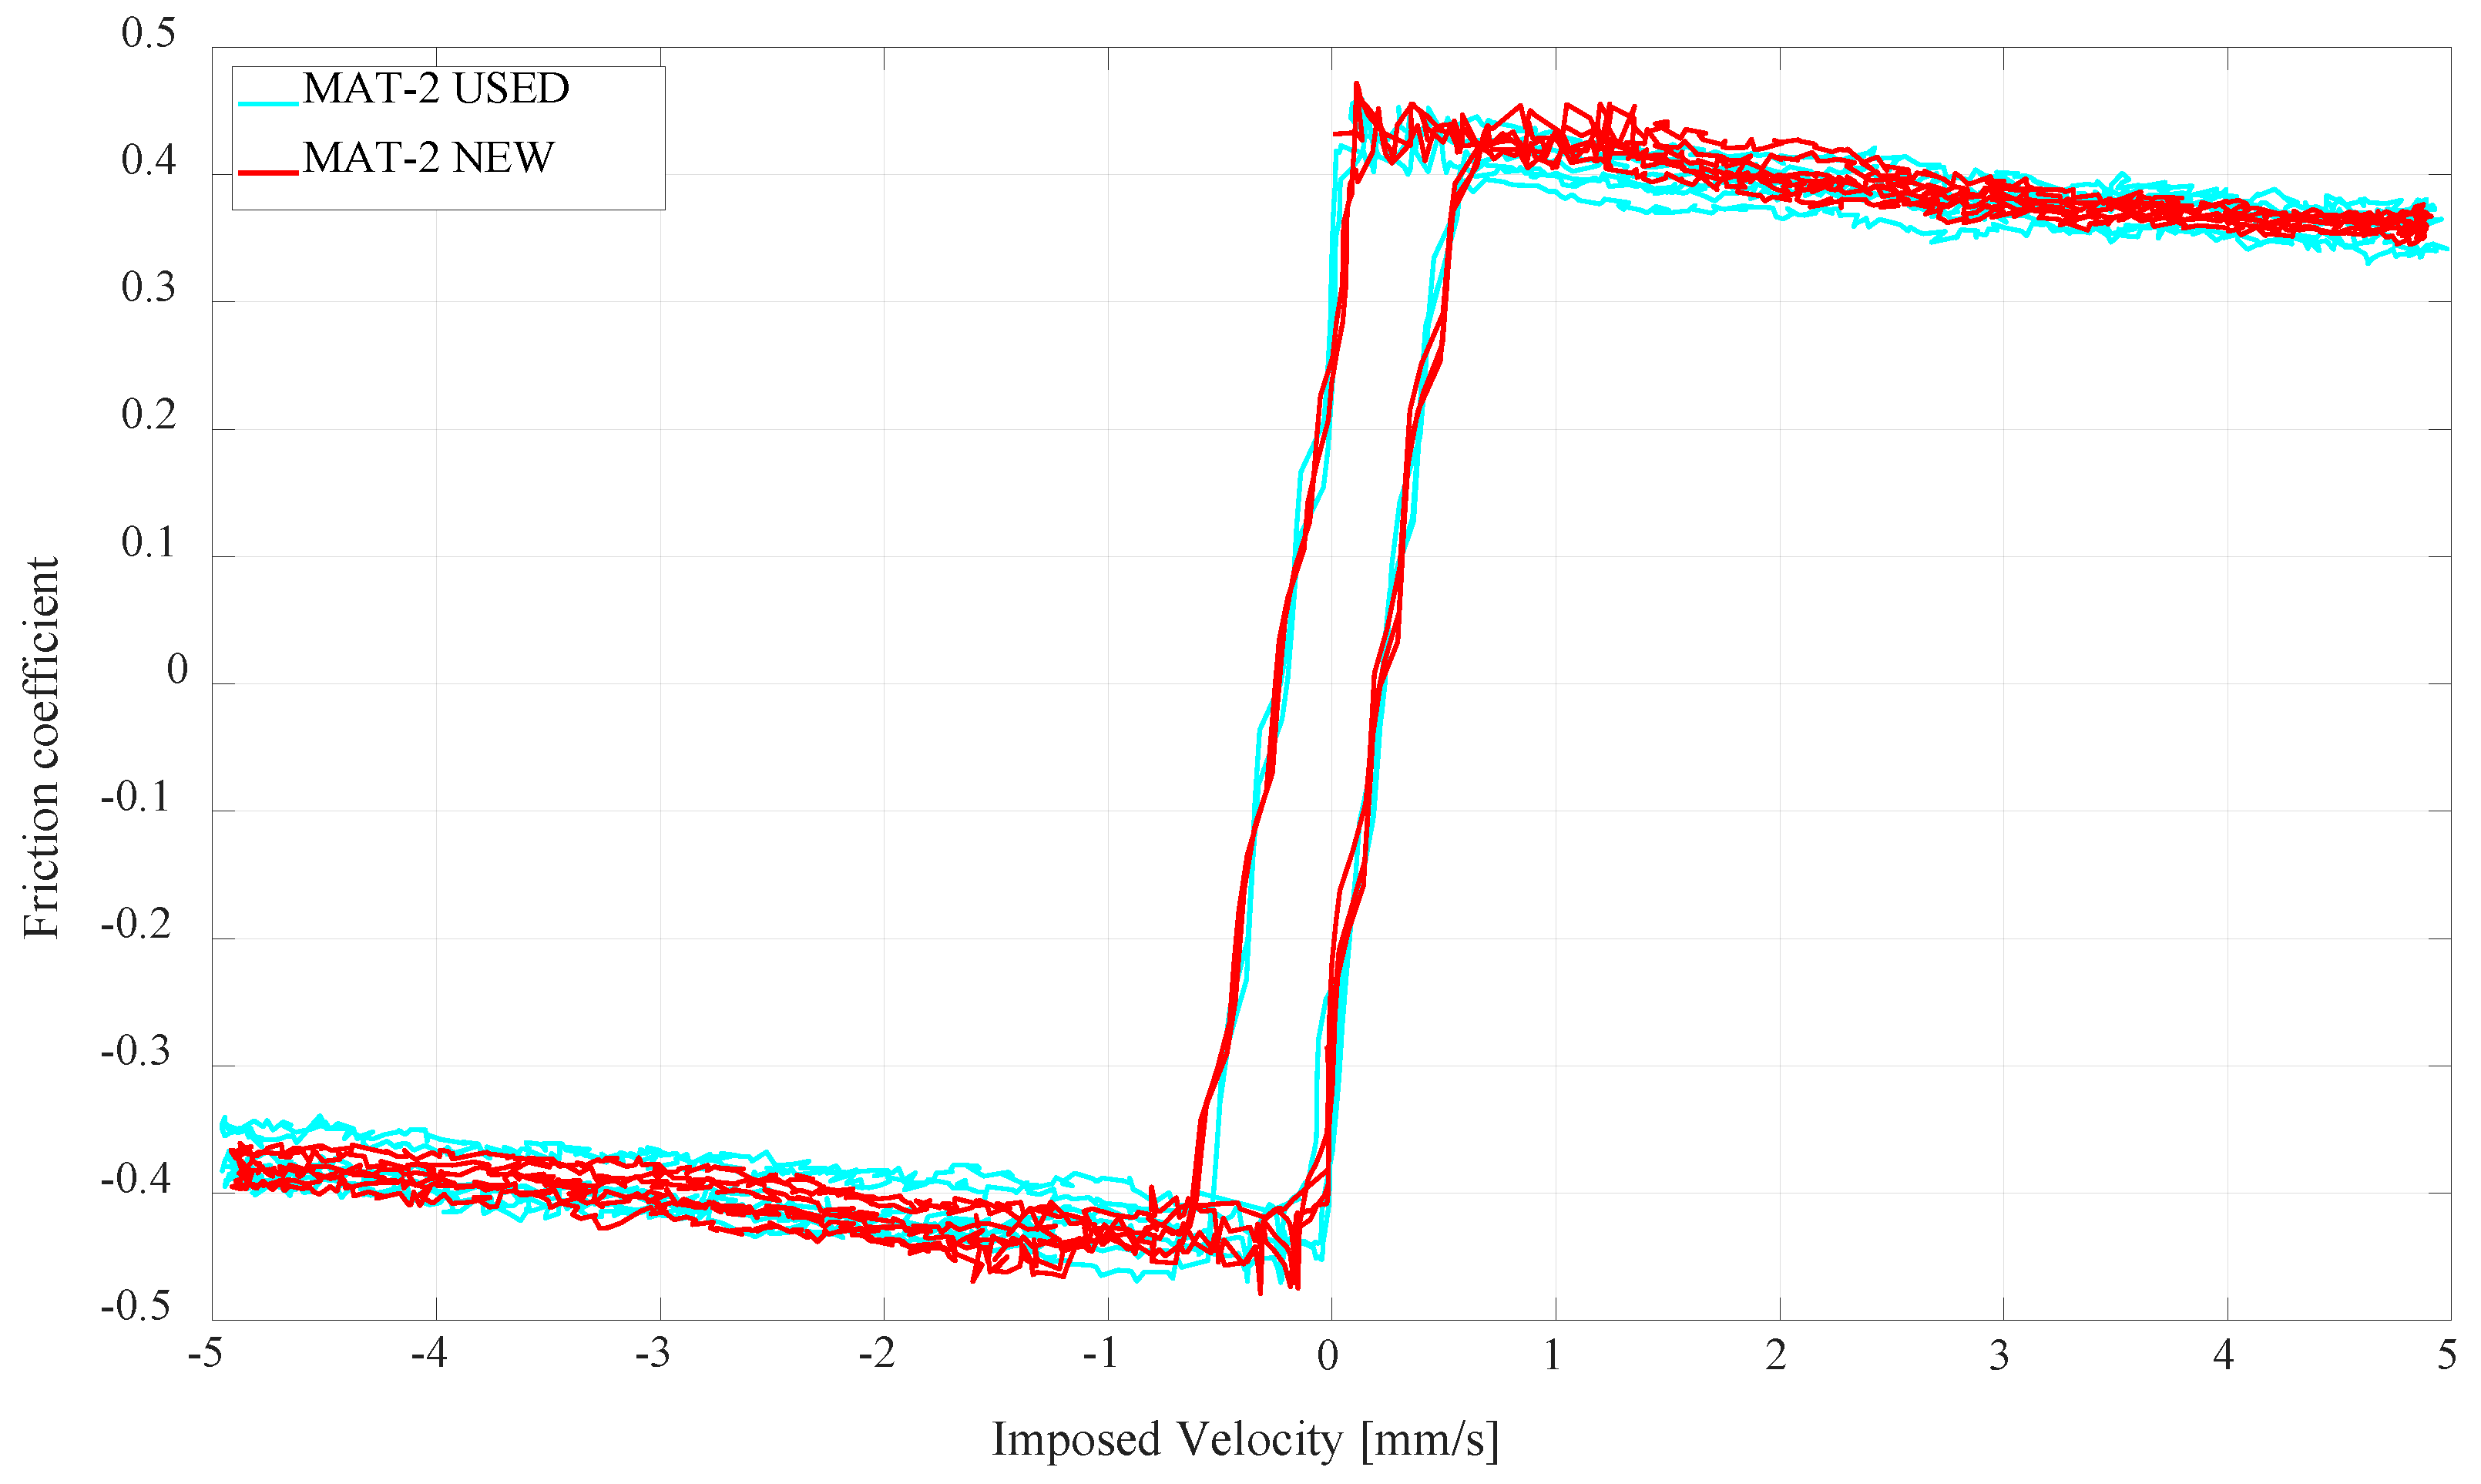
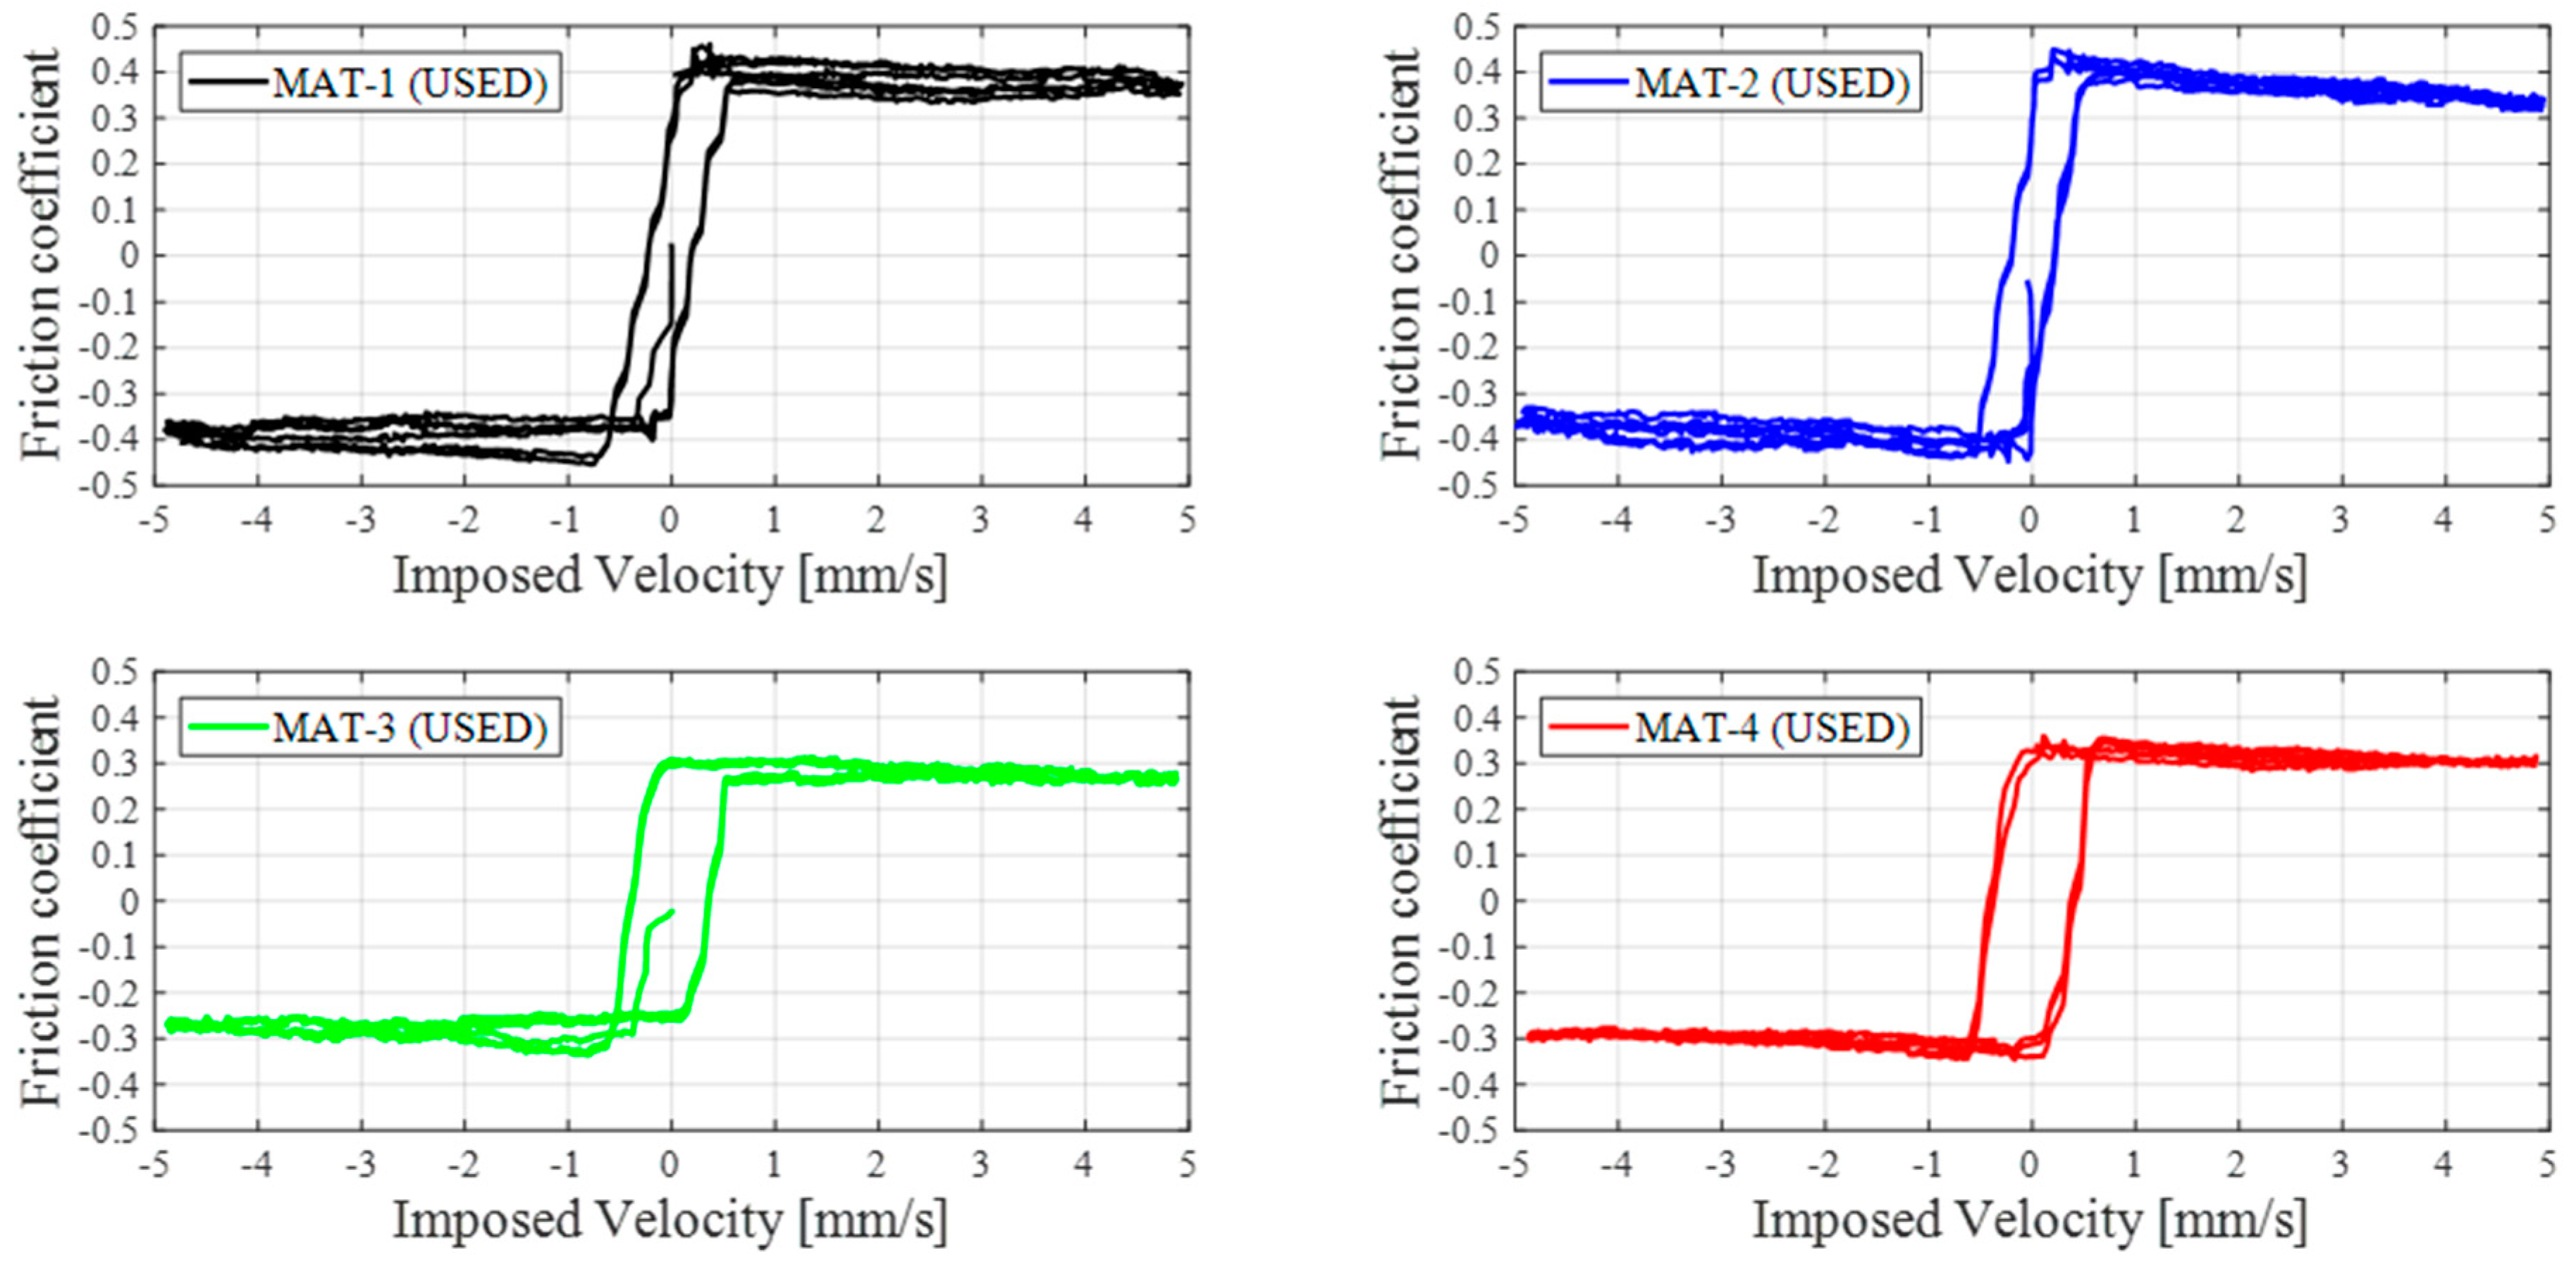
  • MAT-2 has evident negative friction-velocity slope in all NEW and USED tested samples;
  • MAT-3 does not show negative friction-velocity slope in any NEW or USED tested samples;
  • MAT-2 has the highest maximum friction coefficient, on average; on the contrary, MAT-3 has the lowest friction coefficient, on average;
  • MAT-1 shows a slight friction-velocity slope for only some of the tested samples; MAT-4 has an intermediate behavior between MAT-1 and MAT-2.

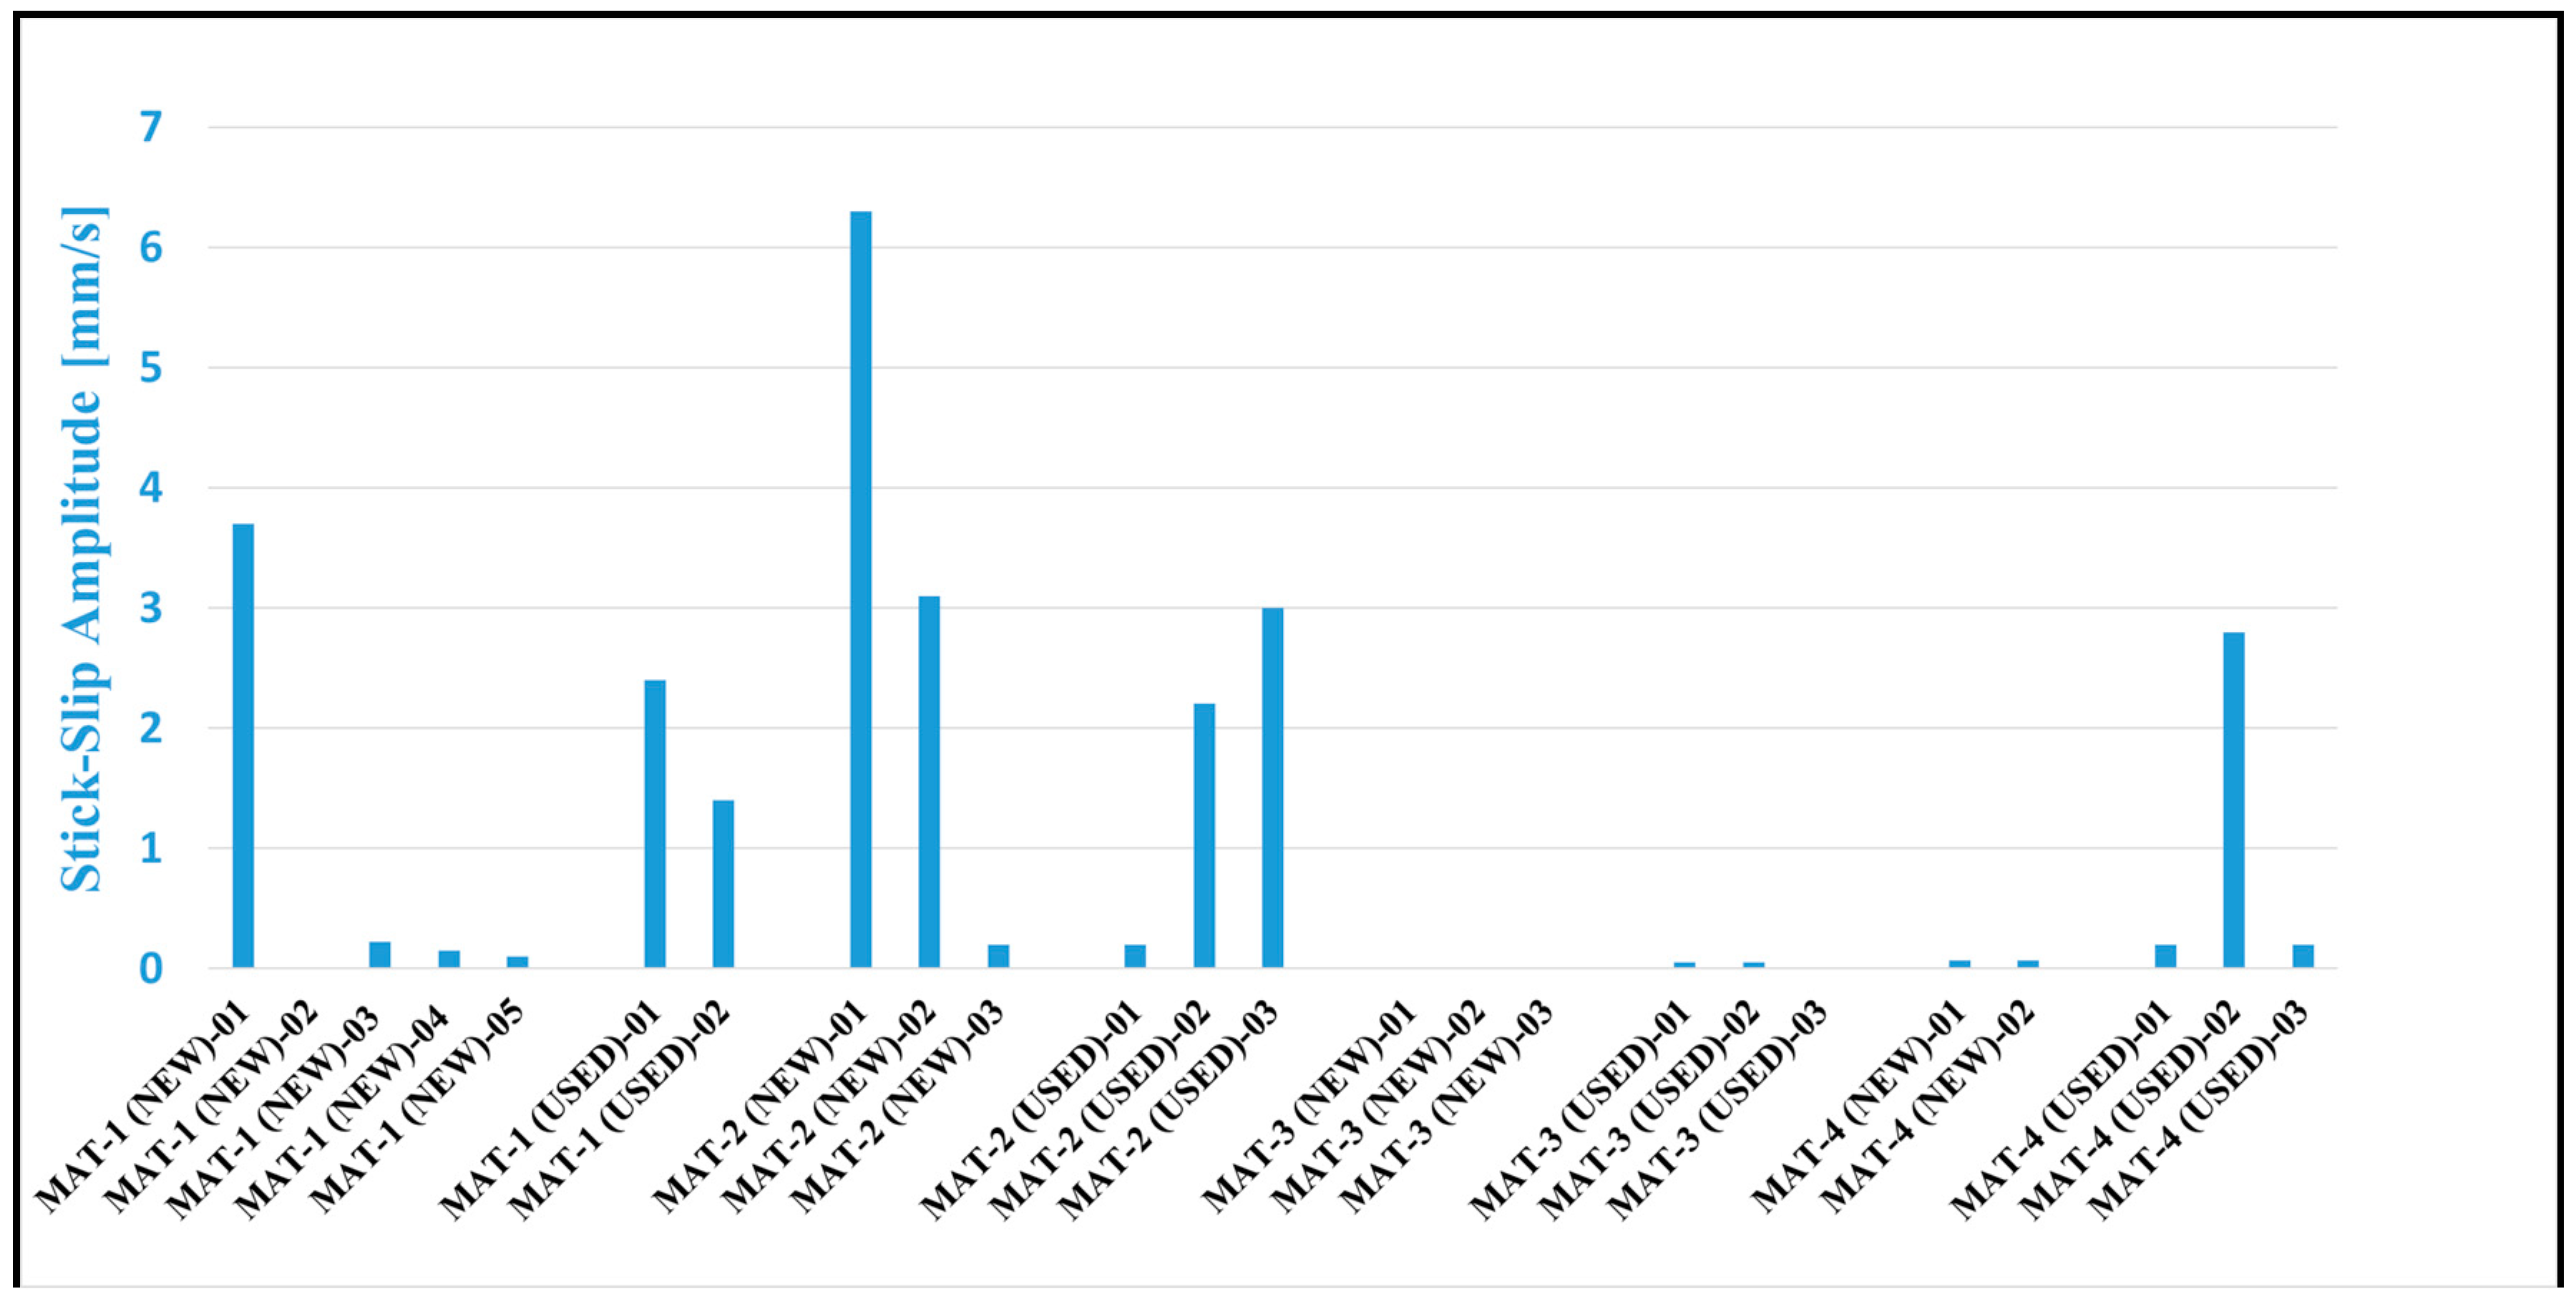
4.2. Material Stick-Slip Propensity

In order to quantify the propensity of the materials in contact to generate stick-slip, a comparison on the amplitude of the stick-slip response has been performed in the same boundary conditions. Moreover, the width of the velocity range in which stick-slip occurs among the different materials has also been compared.
Tests at a constant velocity of 0.1 mm/s are used to compare the stick-slip amplitude, meanwhile tests conducted at a variable velocity, 0→5 mm/s, are used for assessing the critical range for stick-slip occurrence.
Figure 11 exhibits the detected stick-slip amplitudes at V = 0.1 mm/s. It can be noted that stick-slip is always present at a constant velocity V = 0.1 mm/s for all the tested samples, except for MAT-3. MAT-3 is completely unaffected by stick-slip for the NEW pad samples, and shows only some low amplitude events for the USED ones. On the contrary, MAT-2 shows the highest stick-slip amplitude.
A comparison between the average stick-slip amplitudes and the friction coefficient behavior (Figure 10) leads to the following considerations:
  • The highest stick-slip amplitude is detected for MAT-2, whereas for MAT-3 there is almost a total absence of stick-slip. MAT-2 is characterized by the presence of a significant negative friction-velocity slope, for all tested samples. MAT-3 does not show any slope in any of its samples, instead. As a result, a relationship between stick-slip amplitude (and occurrence) and negative friction velocity slope can be identified.
  • Even if MAT-1 and MAT-4 show only slight friction-velocity slopes, they present a higher mean friction coefficient with respect to MAT-3. As a consequence, they show an intermediate stick-slip amplitude between MAT-2 and MAT-3.
The following bar chart (Figure 12) illustrates the stick-slip critical velocity range found for each sample, tested at a variable velocity V = 0→5 mm/s and for a normal load of 20 N.
A very first insight into the obtained results shows the absence of any critical range for MAT-3 NEW samples and only a narrow critical range identified among the USED ones, confirming the “stability” of such material with respect to stick-slip. Moreover, it is confirmed that the wider range of critical velocity interests the MAT-2 material.
Therefore, a comparison between the frictional response (Figure 10) and the critical velocity range (Figure 12) leads to the same considerations drawn from the comparison with the stick-slip amplitude.
The results obtained on the stick-slip propensity of the tested frictional materials are in agreement with the groan propensity of the same materials on commercial brake systems: MAT-2 is a low-steel friction material for high braking performances and strongly affected by groan noise; on the other hand, MAT-3 is a NAO material with lower braking performances, but best performances in reducing groan noise appearance; MAT-1 and MAT-4 are medium performance low-steel materials, withMAT-4 also having a low copper content, with intermediate behavior regarding the propensity to creep groan.
Considering all the results, it can be stated that:
  • When negative friction-velocity slope exists, stick-slip always occurs in all tested samples, and both the amplitude of the stick-slip vibrations and the critical velocity range increase with the increase of the difference between static and dynamic friction coefficient.
  • A higher friction coefficient leads to stick-slip, even if no negative friction velocity slope is detected. Anyway, the stick-slip amplitude and critical ranges are lower with respect to the samples for which negative slope is observed.
  • Both stick-slip amplitude and critical velocity ranges are in agreement with the frictional response of the material and with the feedback on the groan occurrence on commercial brakes.
All these remarks are related to an average behavior. In fact, each sample is characterized by a unique surface and superficial topography, which results in a slightly different response downstream of each performed test, even if testing the same material. However, the general trends obtained after the measurement campaign are robust and thus representative of the material response.

5. Effect of Boundary Conditions

Hereafter, the effect of a variation in load and temperature is presented and discussed. In fact, while the contact pressure varies continuously during the braking, the temperature of a commercial brake can range from ambient temperature up to some hundred degrees Celsius (°C).

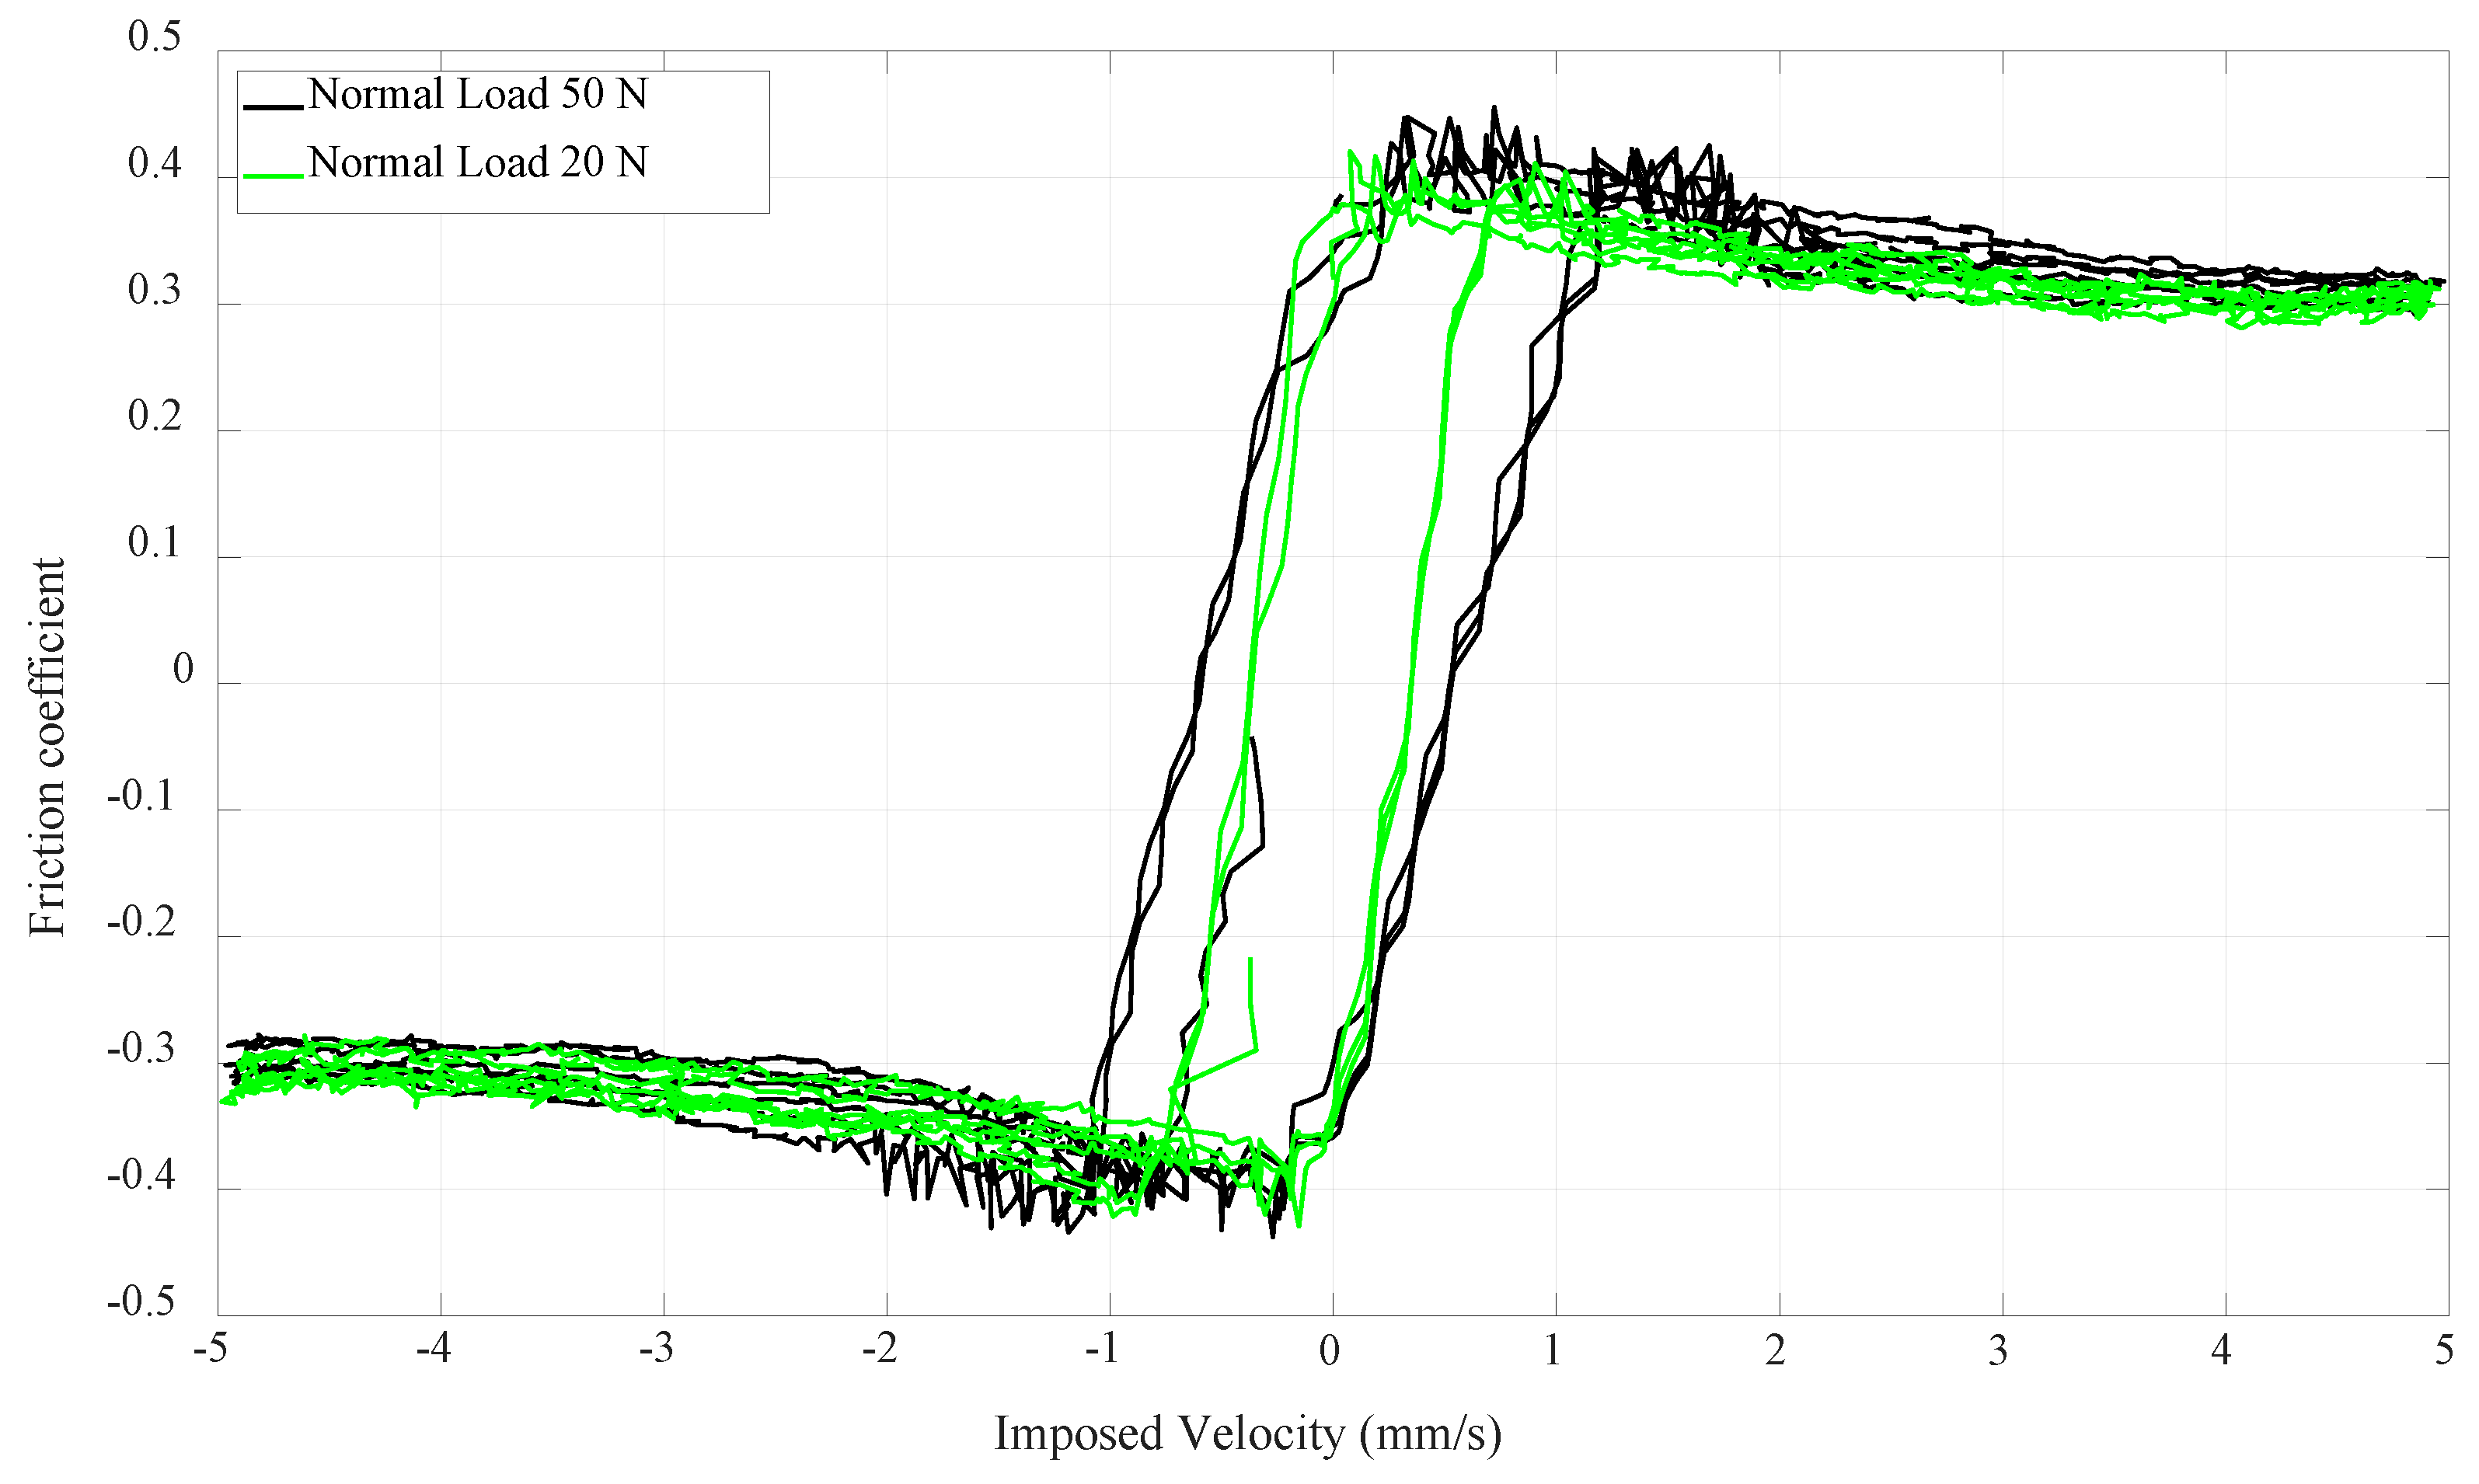
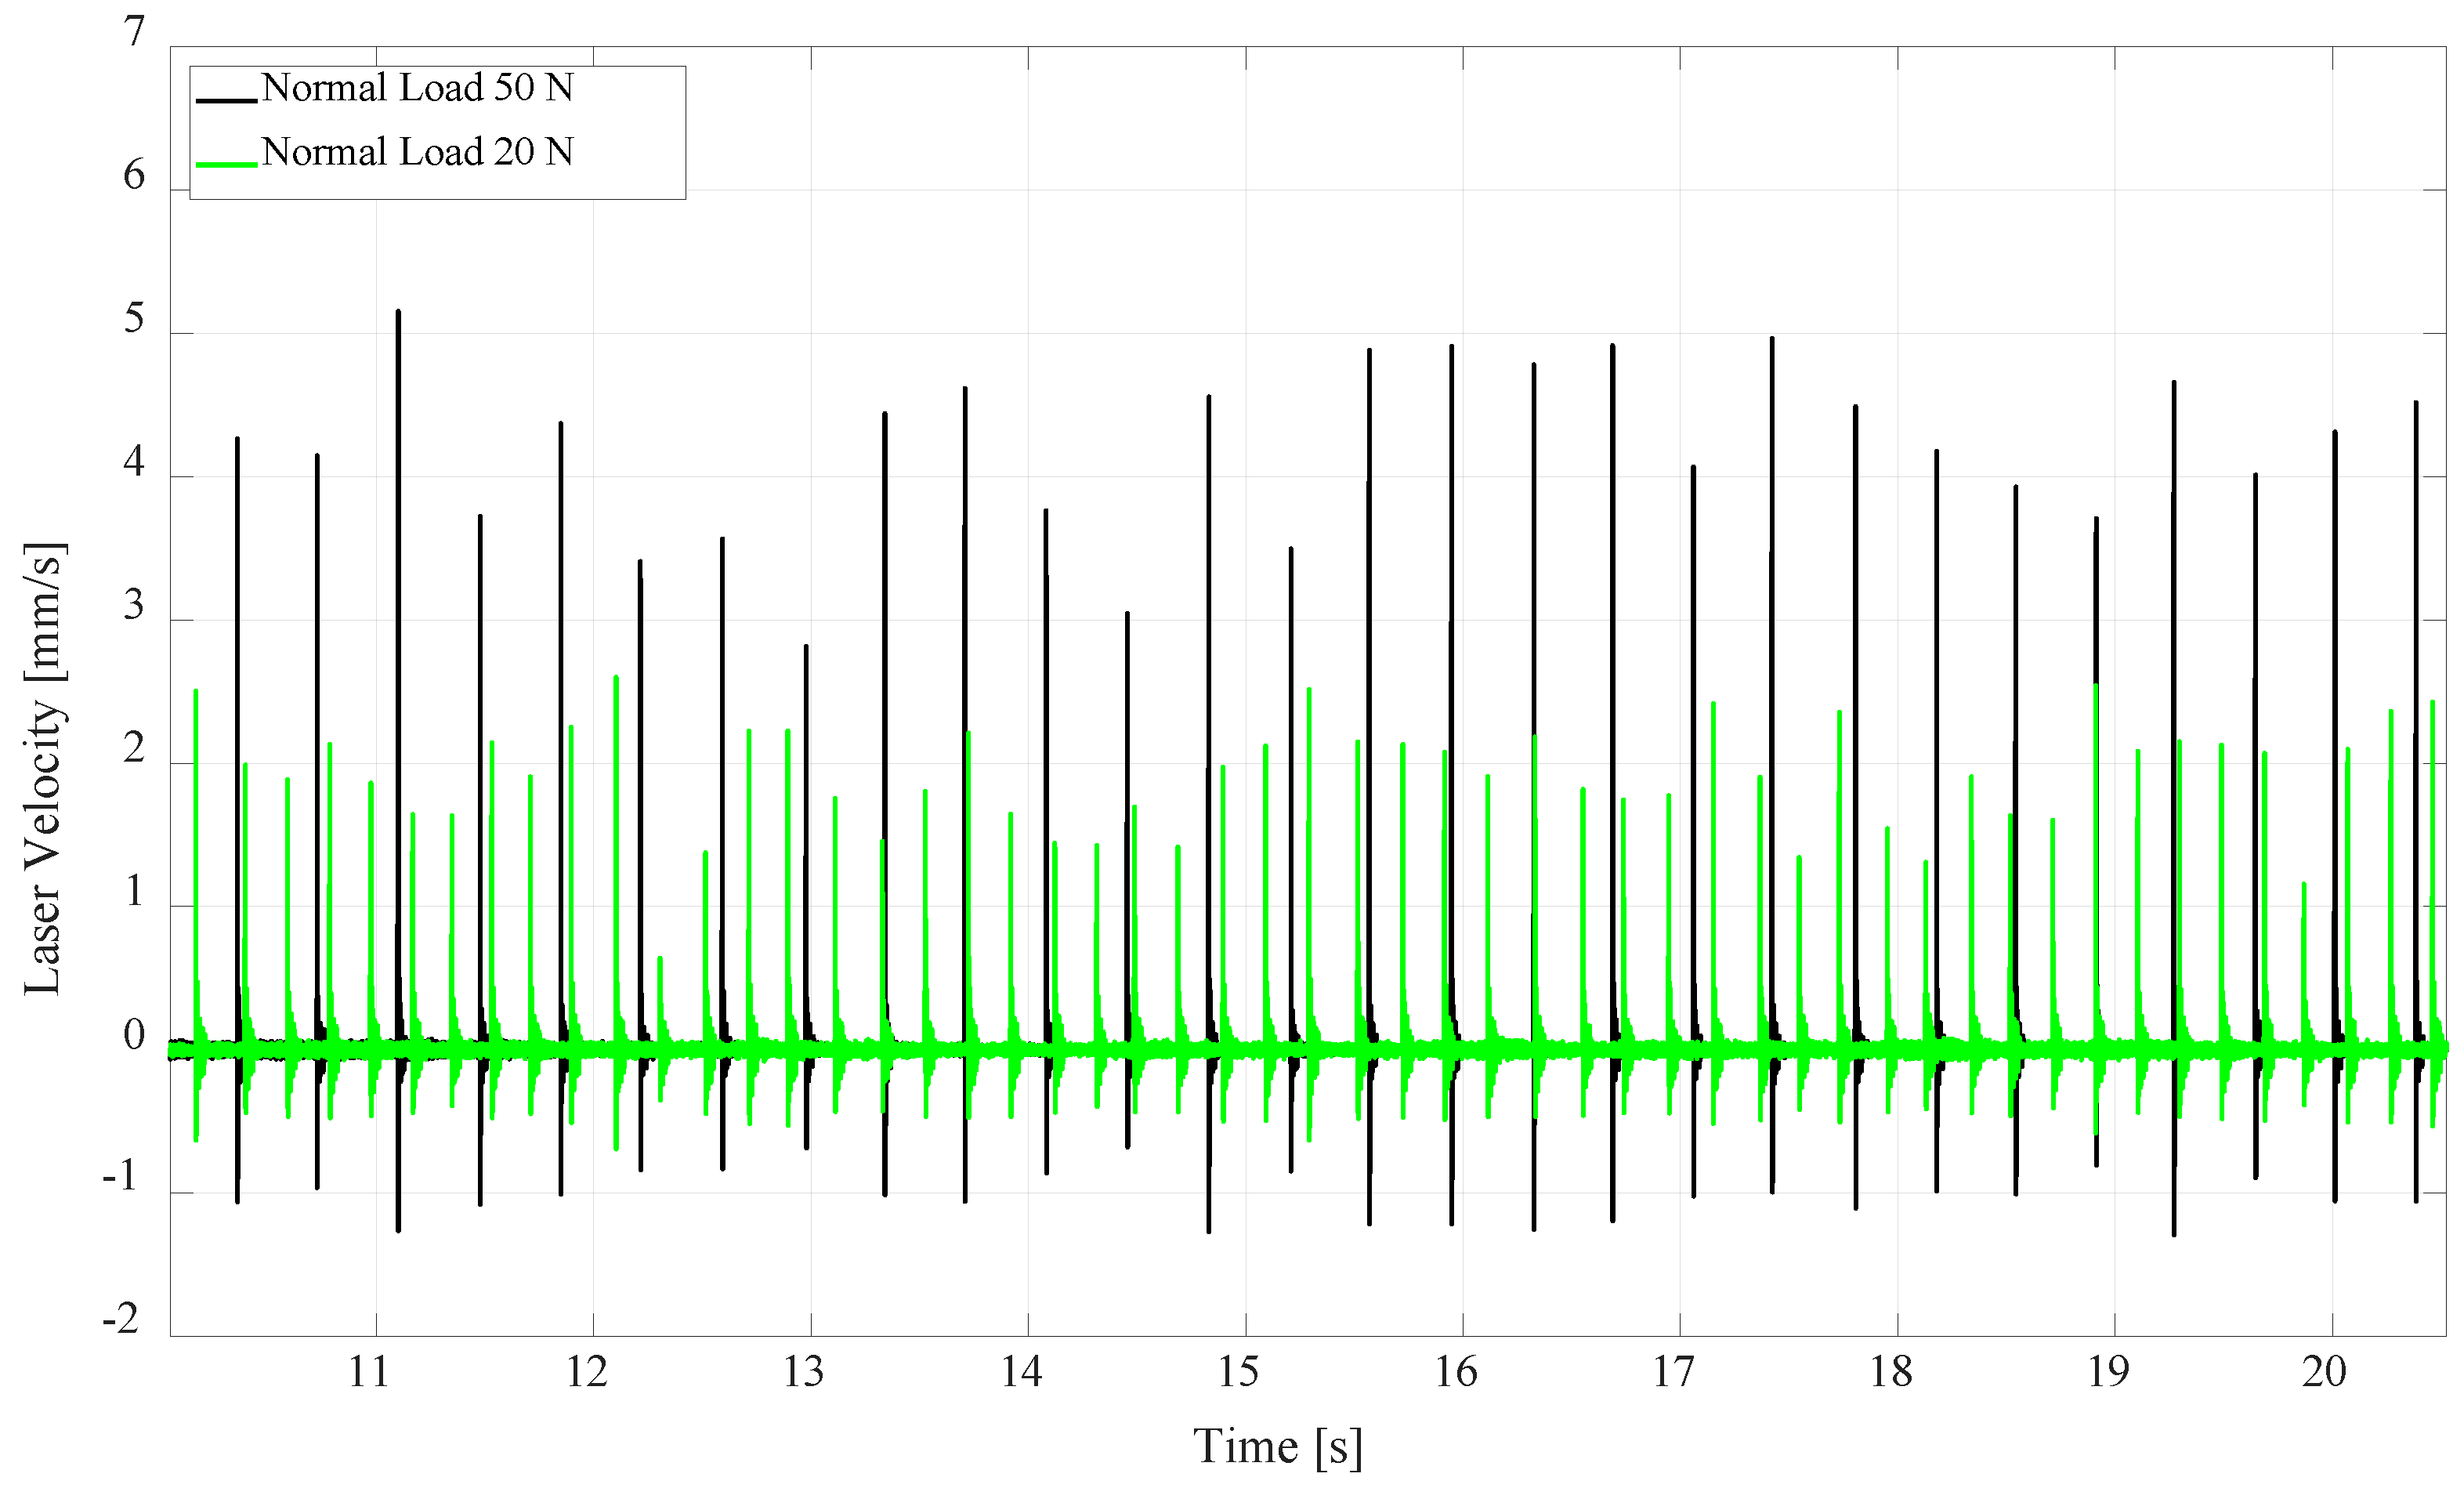
5.1. Material Response VS Load

In order to evaluate potential differences when increasing the normal load, the test protocol has been repeated with 50 N (0.5 MPa) as normal load. A first remark concerns the friction coefficient. As can be observed from Figure 13, no significant differences arise from the comparison between the friction curves obtained at 20 and 50 N. The same result is obtained for all the other tested material samples.
On the contrary, when comparing the stick-slip velocity profiles measured at the two different normal loads (Figure 14), an increase of the stick–slip amplitude is evident. In fact, because the friction coefficient remains the same, an increase of normal force means a proportional increase in the value of the tangential force at which slip occurs. Consequently, the energy release during the slip phase is higher, which, in turn, causes a more energetic vibrational response of the system.
As can be observed from Figure 14, the response amplitude for the test conducted at 50 N is almost double that of the test conducted at 20 N. The period between two successive stick-slip events is almost double, as well. Again, this is due to the higher normal force, which allows for a larger tangential deformation of the system before reaching the limit static friction (tangential) force.

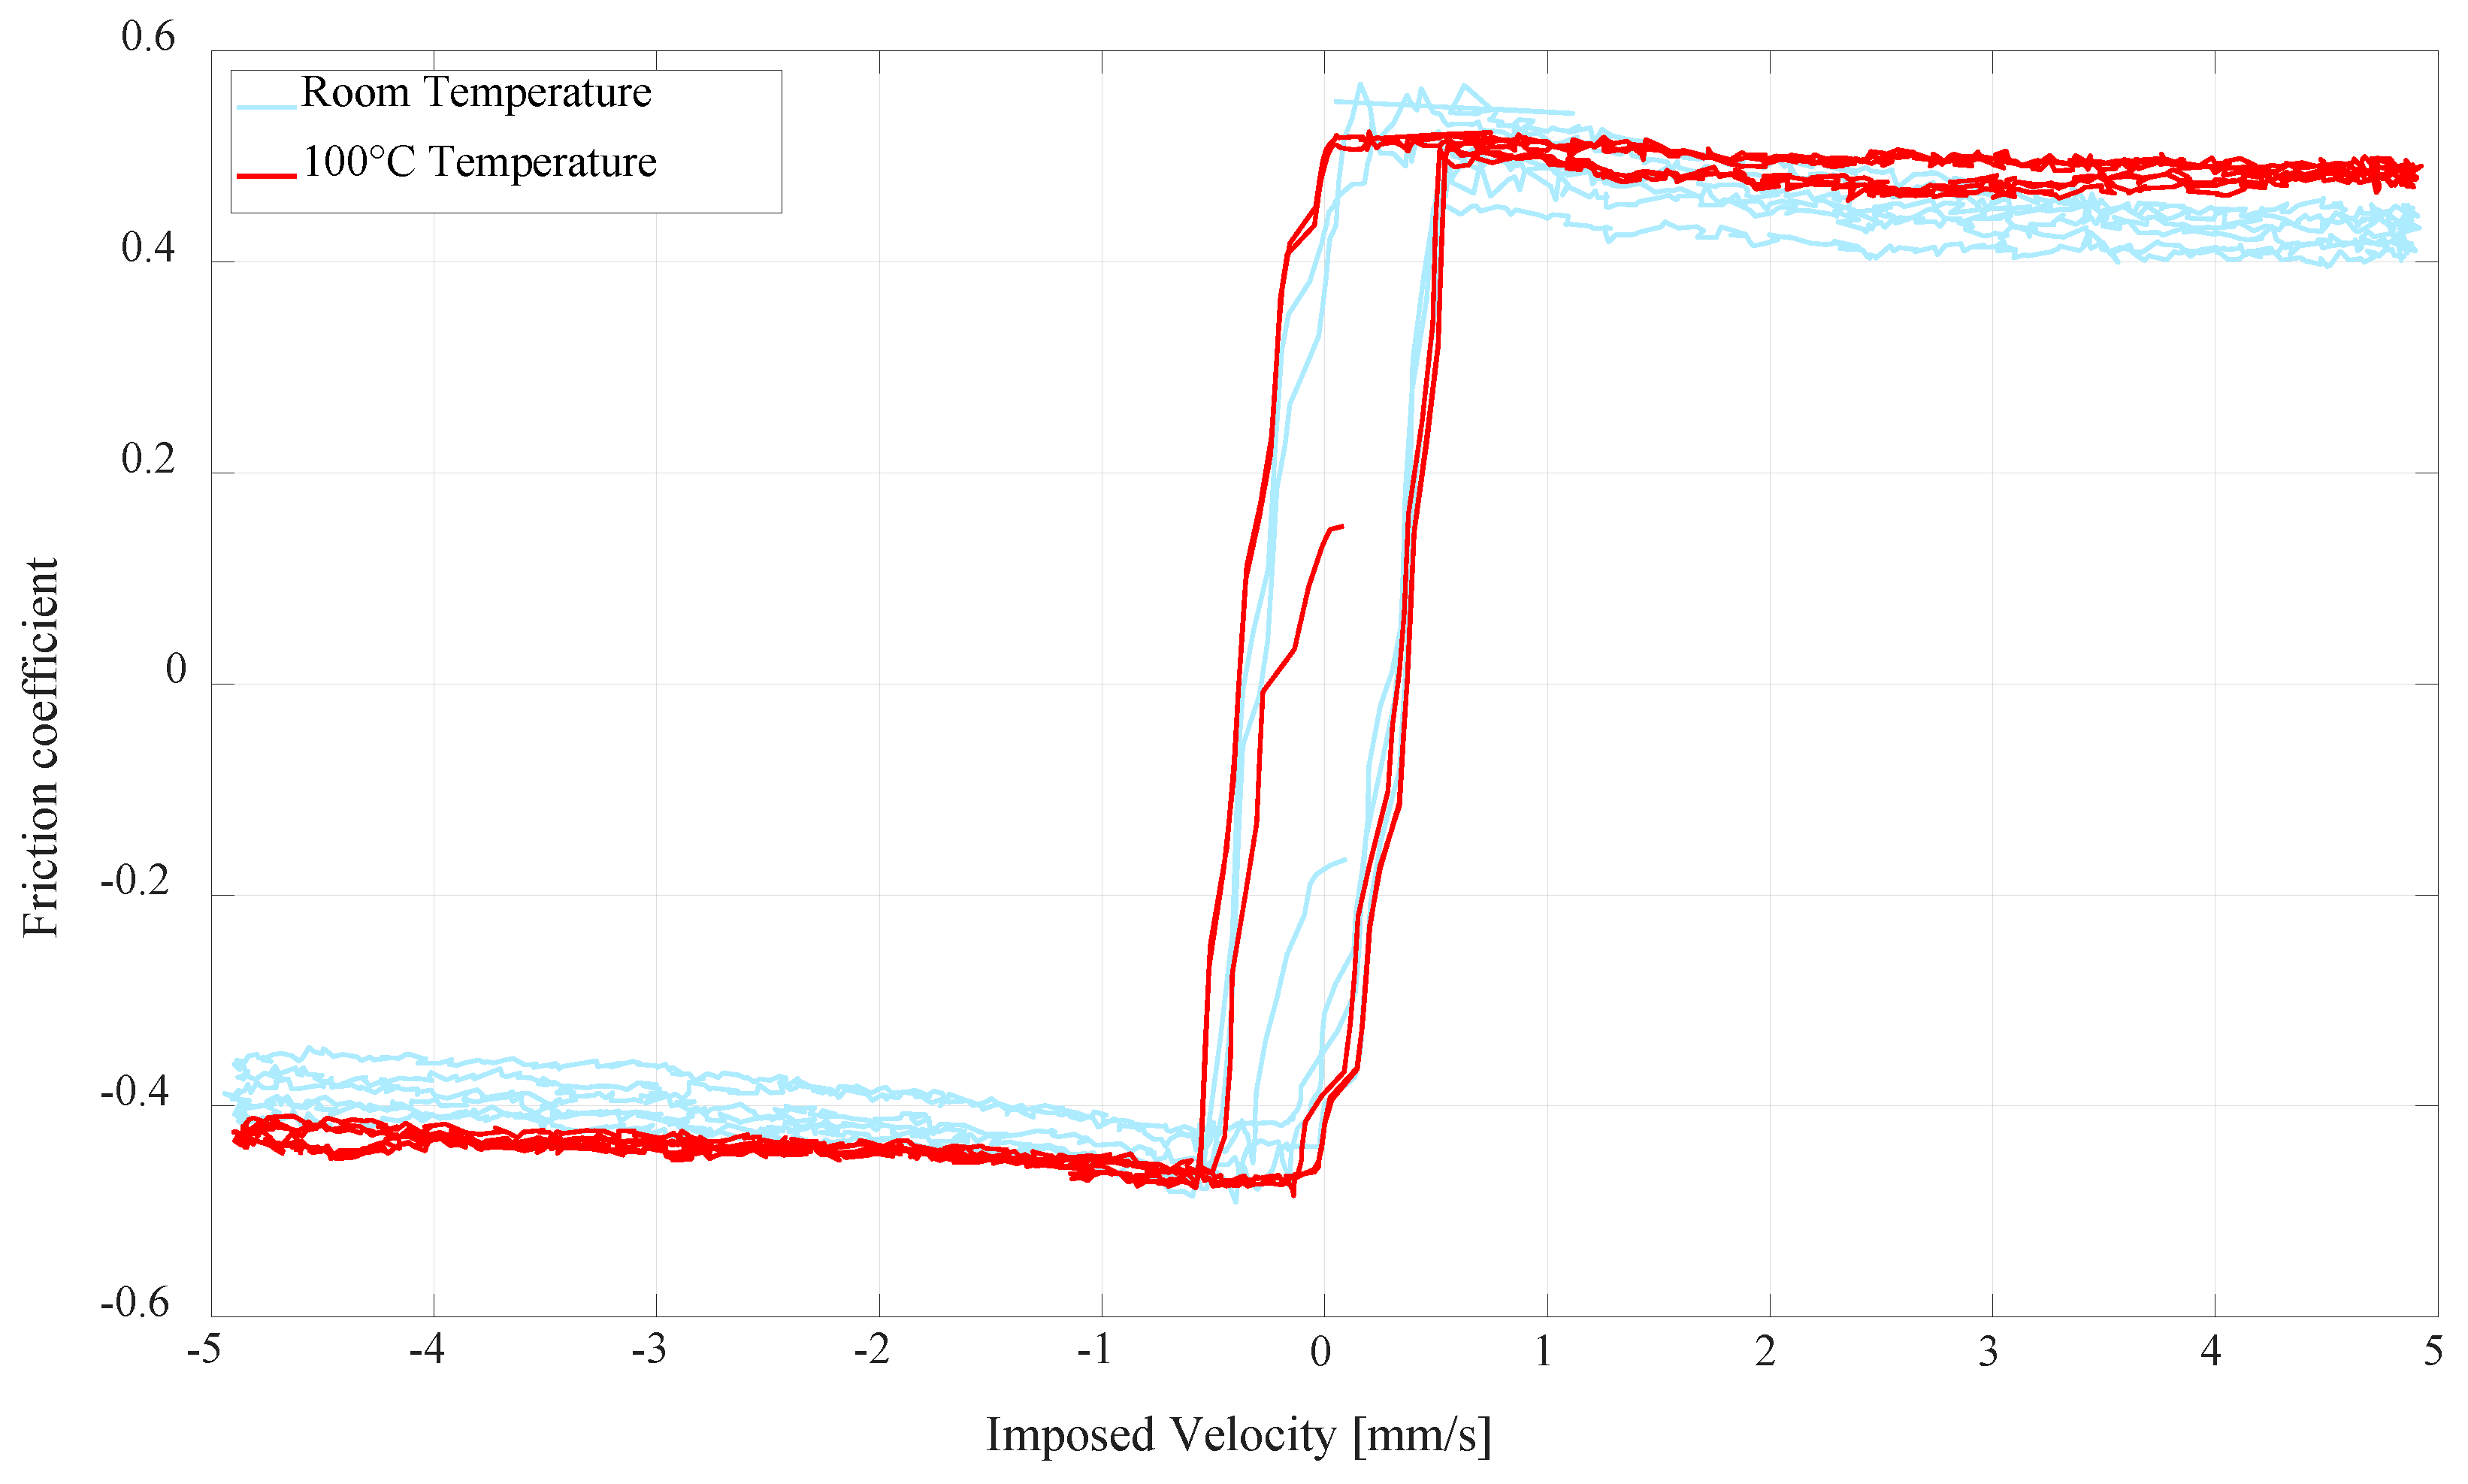
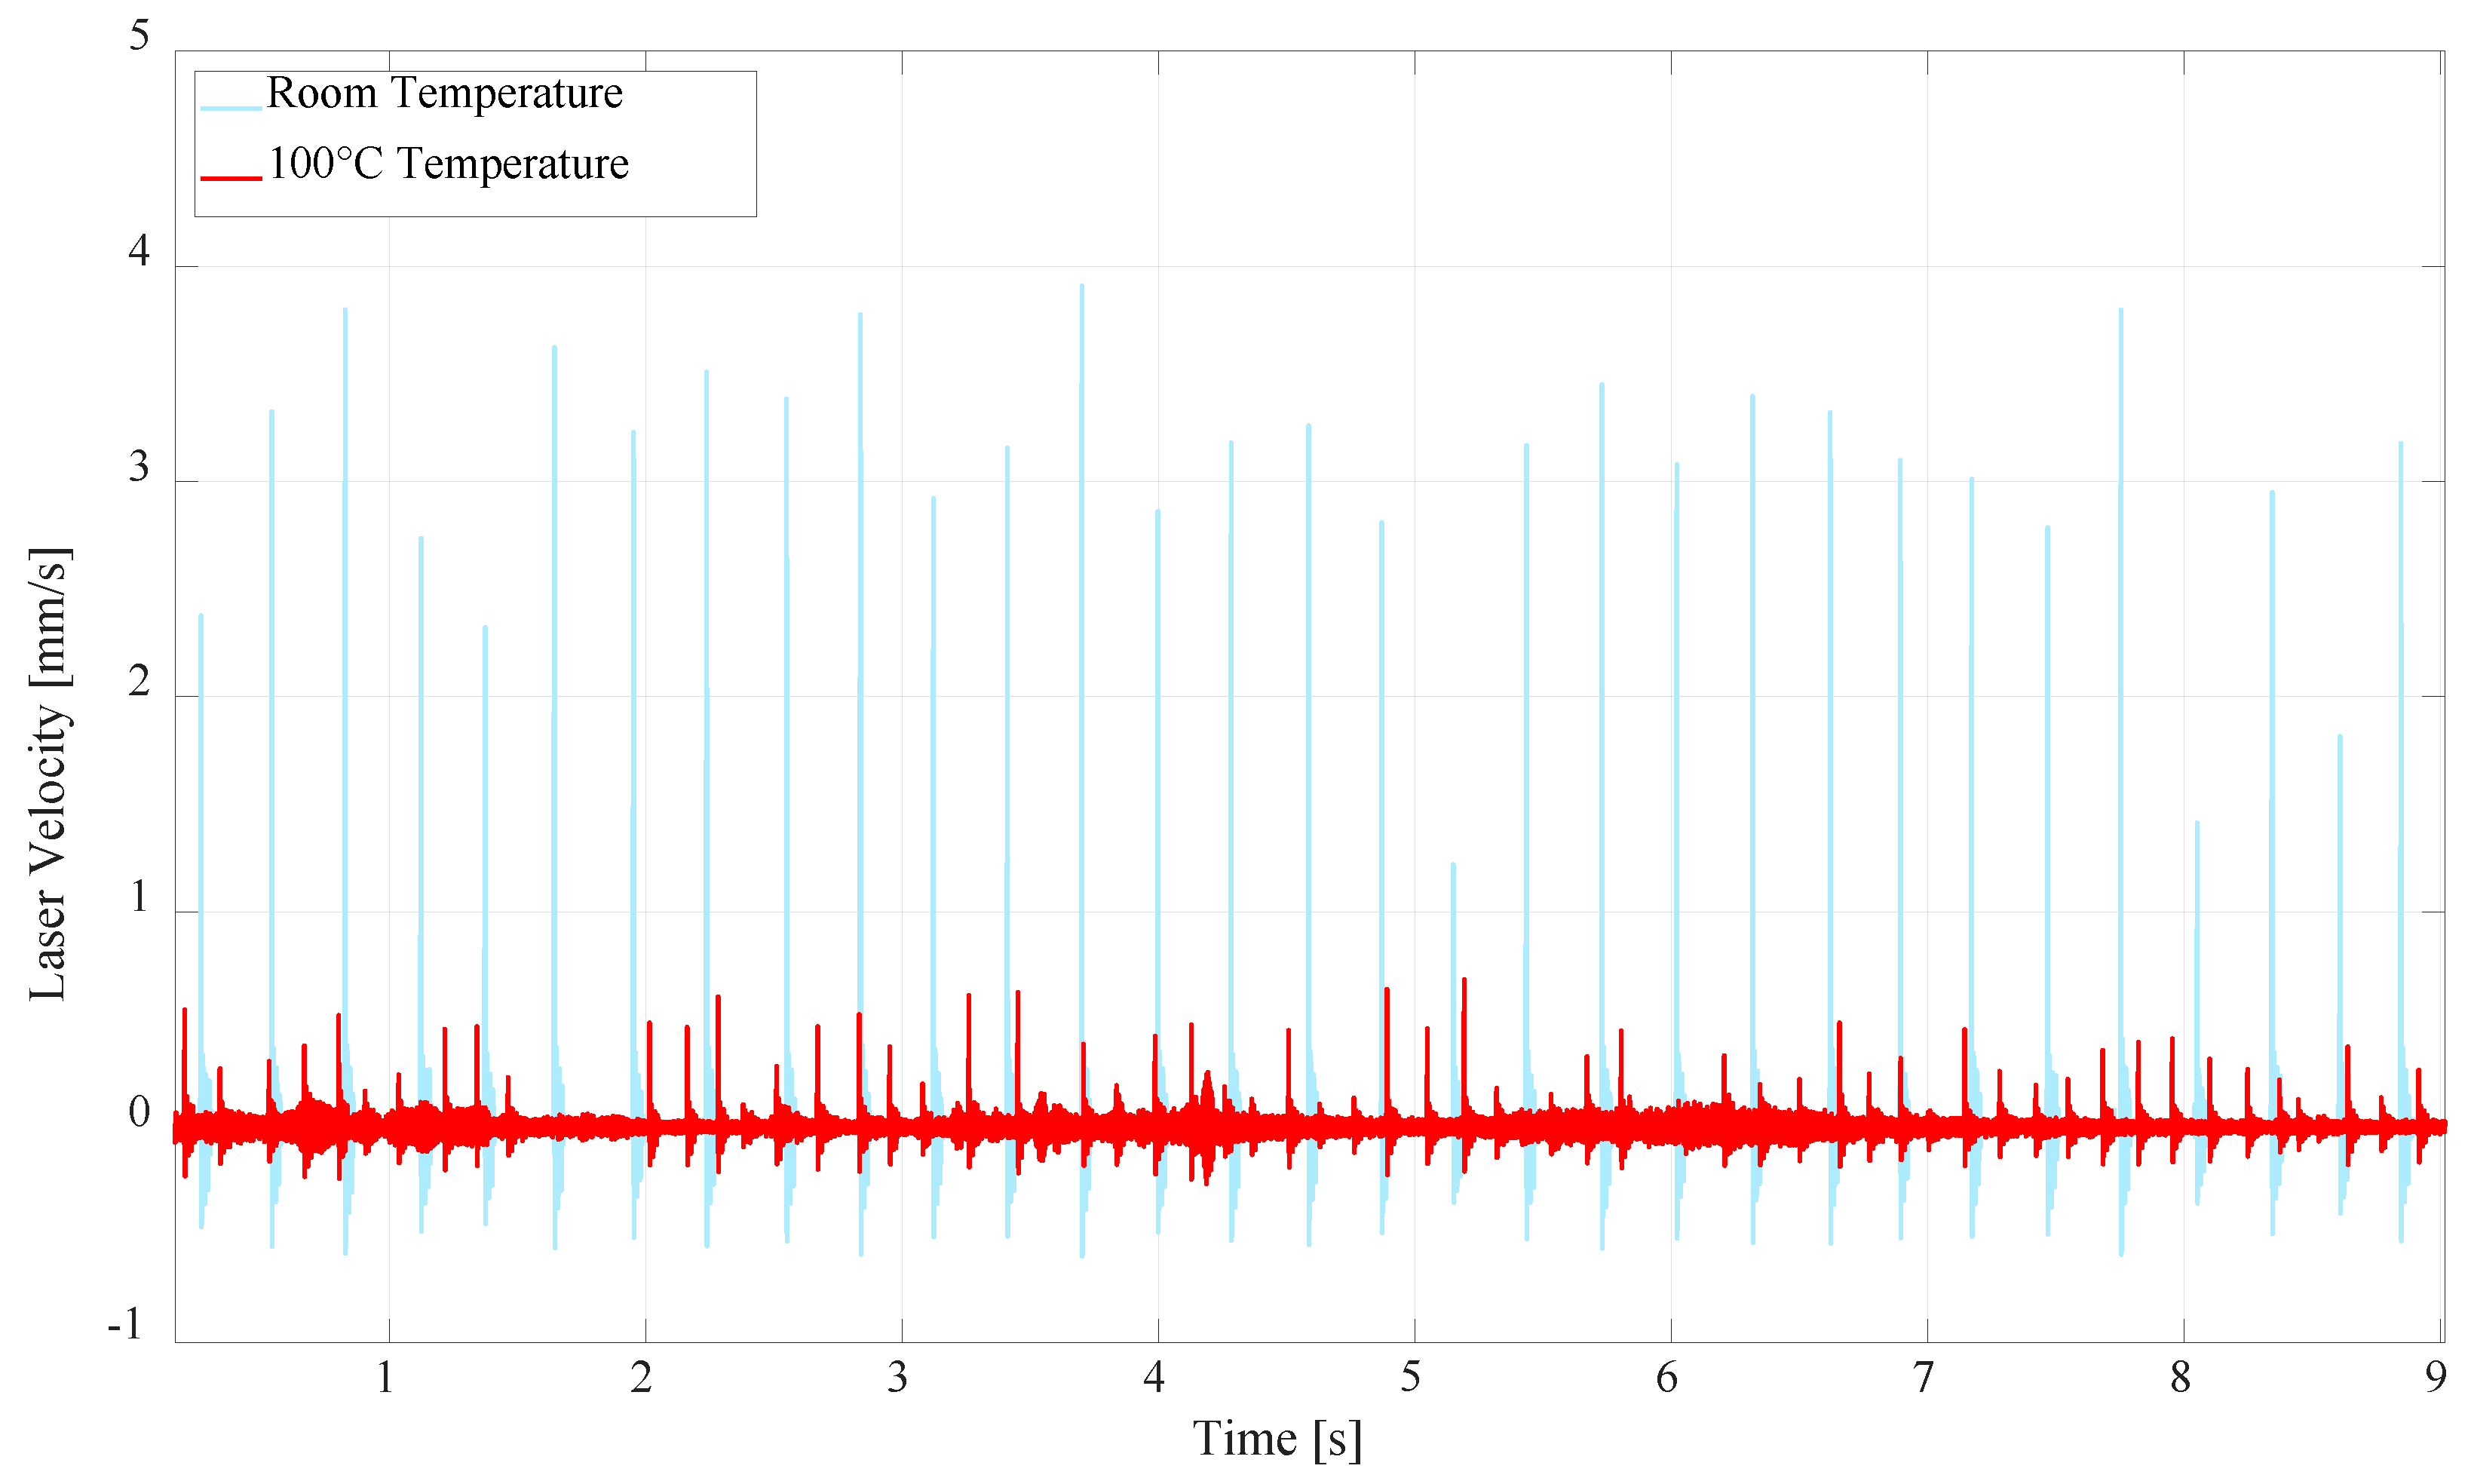
5.2. Material Response VS Temperature

Another relevant parameter to be considered is the temperature. In fact, brake material can reach high temperatures during braking. In order to investigate the effect of such parameter, considering that the investigated brake noise emissions occur at low brake pressure and low velocity (i.e., low temperature), tests at 100 °C are considered.
To perform tests at high temperature, some modification in the test protocol are necessary. Each test on each sample is conducted with an imposed normal load of 20 N and a temperature of 100 °C. To reach the wished temperature, the two IR emitters are heated gradually, in order to have a homogeneous heating of the pad and disc samples. When the temperature detected by the thermocouple reaches 100 °C, the test is carried out.
The first considerations are related to the variations of the friction coefficient. A comparison between tests carried out at room temperature and at 100 °C is presented in Figure 15.
The figure shows a slightly higher friction coefficient, at higher velocities, on the test performed at high temperature. Conversely, not significant differences are observed at low velocity. This phenomenon can be explained by accounting for the surface reactivity of the sample. Indeed, the increase in temperature favors physiochemical interactions between the two surfaces, which can thus react in shorter time (higher velocity) and which, in turn, are responsible for a higher macroscopic friction coefficient. This results in a decrease of the negative friction-velocity slope (always detected and well pronounced in MAT-2 samples).
Then, the stick-slip material response is investigated. Figure 16 shows that the material MAT-2 results to be affected by stick-slip, both at room temperature and at high temperature. However, a significant difference in the stick-slip amplitude is detected. As it is depicted in the figure, the stick-slip amplitude decreases when the temperature increases. This difference can be attributed to the increase of friction coefficient at higher velocities, i.e., to the smaller friction-velocity slope, which brings to a reduction of the instability. This difference is as well coherent with groan occurrence at lower velocities and temperatures.

6. Conclusions

This paper presents an approach for comparing different friction pad materials, by measuring their respective frictional response and their propensity to generate stick-slip instabilities (groan noise emissions), under the same dynamics, and boundary conditions. The tested samples are machined from commercial brake pads and are tested by sliding on a sample of a commercial brake disc.
A test protocol for comparing the material response has been first established. The main outcomes from the experimental campaign can be summarized as follows:
  • The friction analysis allowed for recovering and clearly identifying different frictional responses for the different materials, with different mean friction coefficient and different friction-velocity trends;
  • The analysis of the stick-slip amplitude and the critical velocity range, in which stick-slip occurs, allowed to clearly distinguish the propensity of materials to generate stick-slip instability. The material classification is robust and the results are coherent with returns on groan noise propensity from the automotive tests;
  • The comparison between all samples has shown a significant relationship between the frictional response and the stick-slip phenomenon, demonstrating how either a high friction coefficient or the presence of negative friction velocity slope favor the onset of stick-slip.
After defining the test protocol and the indexes representative of the material propensity to stick-slip, and after comparing the set of tested materials, an investigation on the influence of main contact parameters is provided. The main conclusions are:
  • Load does not affect significantly the friction coefficient. Instead, an increase in this parameter leads to an increase of the elastic energy cumulated during the sticking phases and released during the sliding phases. This results in a higher amplitude stick-slip response.
  • Temperature entails relevant influences both in the dynamical and tribological response of the materials. The friction coefficient increases slightly at highest velocities. Stick-slip phenomena seem to be discouraged by the increase in temperature, due to the decrease of the friction-velocity slope, resulting in lower stick-slip amplitude.
The next step of this work will be aimed to a quantitative comparison between the propensity of pad materials to promote stick-slip and the groan occurrence obtained on full scale tests on a commercial brake system. Moreover, other parameters such as humidity and wear rate should be addressed with respect to both the frictional and dynamic response.

Author Contributions

All authors conceived and planned the experiments. All authors contributed to the interpretation of the results and provided critical feedback and helped shape the research, analysis and manuscript.

Conflicts of Interest

The authors declare no conflicts of interest.

References

  1. Akay, A. Acoustics of friction. J. Acoust. Soc. Am. 2002, 111, 1525–1548. [Google Scholar] [CrossRef] [PubMed]
  2. Bush, A.; Gibson, R.; Thomas, T. The elastic contact of a rough surface. Wear 1975, 35, 87–111. [Google Scholar] [CrossRef]
  3. Ibrahim, R.A. Friction-Induced Vibration, Chatter, Squeal, and Chaos—Part I: Mechanics of Contact and Friction. Appl. Mech. Rev. 1994, 47, 209–226. [Google Scholar] [CrossRef]
  4. Ouenzerfi, G.; Massi, F.; Renault, E.; Berthier, Y. Squeaking friction phenomena in ceramic hip endoprosthesis: Modeling and experimental validation. Mech. Syst. Signal Process. 2015, 58–59, 87–100. [Google Scholar] [CrossRef]
  5. Sheng, G. Friction-Induced Vibrations and Soud: Principles and Applications; CRC Press Inc.: Boca Raton, FL, USA, 2008. [Google Scholar]
  6. Koç, I.M.; Eray, T. Modeling frictional dynamics of a visco-elastic pillar rubbed on a smooth surface. Tribol. Int. 2018, 127, 187–199. [Google Scholar]
  7. Tonazzi, D.; Massi, F.; Culla, A.; Fregolent, A.; Berthier, Y. Role of damping on contact instability scenarios. In Proceedings of the 5° World Tribology Congress, Turin, Italy, 8–13 September 2013; Available online: https://hal.archives-ouvertes.fr/hal-00867046 (accessed on 8 September 2013).
  8. Tonazzi, D.; Massi, F.; Baillet, L.; Brunetti, J.; Berthier, Y. Interaction between contact behaviour and vibrational response for dry contact system. Mech. Syst. Signal Process. 2018, 110, 110–121. [Google Scholar] [CrossRef]
  9. Tonazzi, D.; Massi, F.; Baillet, L.; Culla, A.; Fregolent, A.; Regis, E.; Lambert, M. Experimental and numerical characterization of system response under dry frictional contact. In Proceedings of the ISMA—International Conference on Noise and Vibration Engineering, Leuven, France, 15–17 September 2014. [Google Scholar]
  10. Tonazzi, D.; Massi, F.; Culla, A.; Baillet, L.; Fregolent, A.; Berthier, Y. Instability scenarios between elastic media under frictional contact. Mech. Syst. Signals Process. 2013, 40, 754–766. [Google Scholar] [CrossRef]
  11. Tonazzi, D.; Massi, F.; Baillet, L.; Culla, A.; Di Bartolomeo, M.; Berthier, Y. Experimental and numerical analysis of frictional contact scenarios: From macro stick–slip to continuous sliding. Meccanica 2015, 50, 649–664. [Google Scholar] [CrossRef]
  12. Abdelounis, M.B.; Zahouani, H.; Bot, A.L.; Perret-Liaudet, J.; Tkaya, M.B. Numerical simulation of friction noise. Wear 2011, 271, 621–624. [Google Scholar] [CrossRef]
  13. Bartolomeo, M.D.; Lacerra, G.; Baillet, L.; Chatelet, E.; Massi, F. Parametrical experimental and numerical analysis on friction-induced vibrations by a simple frictional system. Tribol. Int. 2017, 112, 47–57. [Google Scholar] [CrossRef]
  14. Abdelounis, H.B.; Le Bot, A.; Perret-Liaudet, J.; Zahouani, H. An experimental study on roughness noise of dry rough flat surfaces. Wear 2010, 268, 335–345. [Google Scholar] [CrossRef]
  15. Lacerra, G.; Di Bartolomeo, M.; Milana, S.; Baillet, L.; Chatelet, E.; Massi, F. Validation of a new frictional law for simulating friction-induced vibrations of rough surfaces. Tribol. Int. 2018, 121, 468–480. [Google Scholar] [CrossRef]
  16. Bartolomeo, M.D.; Massi, F.; Baillet, L.; Culla, A.; Fregolent, A.; Berthier, Y. Wave and rupture propagation at frictional bimaterial sliding interfaces: From local to global dynamics, from stick-slip to continuos sliding. Tribol. Int. 2012, 52, 117–131. [Google Scholar] [CrossRef]
  17. Adams, G.G. Steady Sliding of Two Elastic hald spaces with friction reduction due to interface stick-slip. J. Appl. Mech. 1998, 65, 470–475. [Google Scholar] [CrossRef]
  18. Dieterich, J.H. Time-Dependent Friction and the Mechanics of Stick-Slip. Pure Appl. Geophys. 1978, 116, 790–806. [Google Scholar] [CrossRef]
  19. Bengisu, M.T.; Akay, A. Stick–slip oscillations: Dynamics of friction and surface roughness. Acoust. Soc. Am. 1999, 105, 194–205. [Google Scholar] [CrossRef]
  20. Massi, F.; Berthier, Y.; Baillet, L. Contact surface topography and system dynamics of brake squeal. Wear 2008, 256, 1784–1792. [Google Scholar] [CrossRef]
  21. Kinkaid, N.M.; O’Reilly, O.M.; Papadopoulos, P. Automotive disk brake squeal. J. Sound Vib. 2003, 267, 105–166. [Google Scholar] [CrossRef]
  22. Meziane, A.; Baillet, L.; Laulagnet, B.; Godeau, C.; Berthier, Y. Friction-induced instabilities: Modal, transient analysis and experimental validation. Méc. Ind. 2007, 8, 597–607. [Google Scholar] [CrossRef]
  23. Meziane, A.; Baillet, L.; Laulagnet, B. Experimental and numerical investigation of friction-induced vibration of a beam-on-beam in contact with friction. Appl. Acoust. 2010, 71, 843–853. [Google Scholar] [CrossRef] [Green Version]
  24. Ouyang, H.; Nack, W.; Yuan, Y.; Chen, F. Numerical analysis of automotive disc brake squeal: A review. Int. J. Veh. Noise Vib. 2005, 1, 2017–2231. [Google Scholar] [CrossRef]
  25. Hervé, B.; Sinou, J.-J.; Mahé, H.; Jezequel, L. Analysis of squeal noise and mode coupling instabilities including damping and gyroscopic effects. Eur. J. Mech. A/Solids 2008, 27, 141–160. [Google Scholar] [CrossRef] [Green Version]
  26. Kruse, S.; Tiedemann, M.; Zeumer, B.; Reuss, P.; Hetzler, H.; Hoffmann, N. The influence of joints on friction induced vibration in brake squeal. J. Sound Vib. 2015, 340, 239–252. [Google Scholar] [CrossRef] [Green Version]
  27. Hoffmann, N.; Fischer, M.; Allgaier, R.; Gaul, L. A minimal model for studying properties of the mode coupling type instability in friction induced oscillations. Mech. Res. Commun. 2002, 29, 197–205. [Google Scholar] [CrossRef]
  28. Magnier, V.; Naidoo Ramasami, D.; Brunel, J.F.; Dufrénoy, P.; Chancelier, T. History effect on squeal with a mesoscopic approach to friction materials. Tribol. Int. 2017, 115, 600–607. [Google Scholar] [CrossRef] [Green Version]
  29. Crowther, A.R.; Singh, R. Identification and quantification of stick-slip induced brake groan events using experimental and analytical investigations. Noise Control Eng. J. 2008, 56, 235–255. [Google Scholar] [CrossRef]
  30. Jang, H.; Lee, J.S.; Fash, J.W. Compositional effects of the brake friction material on creep groan phenomena. Wear 2001, 251, 1477–1483. [Google Scholar] [CrossRef]
  31. Martens, J.A.C.; Oden, J.T.; Simoes, F.M.F. A study of static and kinetic friction. Int. J. Eng. Sci. 1990, 28, 29–92. [Google Scholar] [CrossRef]
  32. Zhao, X.; Gräbner, N.; von Wagner, U. Theoretical and experimental investigations of the bifurcation behavior of creep groan of automotive disk brakes. J. Theor. Appl. Mech. 2018, 56, 351–364. [Google Scholar] [CrossRef]
  33. Kruse, S.; Stingl, B.; Hieke, J.; Papangelo, A.; Tiedemann, M.; Hoffmann, N.; Ciavarella, M. The influence of loading conditions on the static coefficient of friction: A study on brake creep groan. In Topics in Modal Analysis I, Volume 7. Conference Proceedings of the Society for Experimental Mechanics Series; De Clerck, J., Ed.; Springer: Cham, Switzerland, 2014; pp. 149–160. [Google Scholar]
  34. Brecht, J.; Schiffner, K. Influence of Friction Law on Brake Creep-Groan; SAE Technical Paper 2001-01-3138; SAE: Warrendale, PA, USA, 2001. [Google Scholar] [CrossRef]
  35. SAE. International Surface Vehicle Recommended Practice, Disc and Drum Brake Dynamometer Squeal Noise Matrix, SAE Standard J2521; SAE: Warrendale, PA, USA, 2006. [Google Scholar]
Figure 1. Experimental set-up picture (top) and scheme (bottom). (1) Voice coil engine, (2) lining sample support, (3) air bushings, (4) accelerometer, (5) disc sample, (6) brake lining sample, (7) force transducers, (8) linear optical encoder, and (9) laser vibrometer focus point.
Lubricants 06 00107 g001
Figure 2. Samples from a new (upper) and used (lower) pad with its support in bi-component resin.
Lubricants 06 00107 g002
Figure 3. Example of acquired signals. From the top: normal force, tangential force, friction coefficient, imposed displacement and laser velocity measured at 1.5 mm from the contact interface (MAT-3 (USED)).
Lubricants 06 00107 g003
Figure 4. Example of friction coefficient measured with respect to the imposed velocity. In green is the deceleration phases, in black is the acceleration phases (MAT-4 (NEW)-Sample04).
Lubricants 06 00107 g004
Figure 5. From the top: normal load force, friction coefficient, imposed displacement, and laser velocity for MAT 1-USED material at 0.1 mm/s.
Lubricants 06 00107 g005
Figure 6. Laser velocity signal and spectrogram (MAT-1 USED).
Lubricants 06 00107 g006
Figure 7. Imposed velocity (blue curve) and vibrational velocity, recovered by the laser vibrometer (green curve), during a test with variable imposed velocity 0→5mm/s, for MAT-2 NEW material.
Lubricants 06 00107 g007
Figure 8. Comparison of the friction-velocity curves for new and used sample conditions for the friction material MAT-2.
Lubricants 06 00107 g008
Figure 9. Friction-velocity curves obtained for the different friction materials (used conditions).
Lubricants 06 00107 g009
Figure 10. Maximum (at 0 mm/s) and stabilized (at 5 mm/s) friction coefficients for the tested material samples, calculated at 20 N of normal load and 0→5 mm/s variable velocity tests.
Lubricants 06 00107 g010
Figure 11. Comparison of the average stick-slip amplitudes (peak amplitude of the impulsive responses), at constant imposed velocity V = 0.1 mm/s, between the tested pad materials.
Lubricants 06 00107 g011
Figure 12. Stick-slip critical velocity range of all tested samples, at 20 N of normal load and when varying the velocity linearly from 0 to 5 mm/s.
Lubricants 06 00107 g012
Figure 13. Comparison of the friction coefficient/velocity curves obtained for different normal loads (MAT-2 (USED), V = 0→5 mm/s).
Lubricants 06 00107 g013
Figure 14. Stick-slip comparison at different normal load (MAT-2 (USED), V = 0.1 mm/s).
Lubricants 06 00107 g014
Figure 15. Comparison between the friction coefficient, as a function of the sliding velocity, at room temperature and 100 °C (MAT-2 (USED), V = 0→5 mm/s, 20 N).
Lubricants 06 00107 g015
Figure 16. Stick-slip comparison between a tests carried out at room temperature and at 100 °C (MAT-2 (USED), V = 0.1 mm/s, 20 N).
Lubricants 06 00107 g016
Table 1. Protocol for test sequences.
Time SequenceVelocity (mm/s)Displacement (mm)Number of CyclesAcceleration (mm/s2)
Constant velocity tests
101810
0.133
0.5103
1183
5183
Variable velocity tests
From 0 to 5 mm/s linear velocity ramp1831.5
Validation test
1183

