Article

Theoretical and Experimental Investigations on Transient Run-Up Procedures of Journal Bearings Including Mixed Friction Conditions

Institute of Tribology and Energy Conversion Machinery, Technische Universität Clausthal, Leibnizstr. 32, 38678 Clausthal-Zellerfeld, Germany
*
Author to whom correspondence should be addressed.
Lubricants 2018, 6(4), 105; https://doi.org/10.3390/lubricants6040105
Submission received: 31 October 2018 / Revised: 22 November 2018 / Accepted: 27 November 2018 / Published: 1 December 2018

Abstract

:
This paper focuses on the operating behavior of journal bearings for industrial machinery application during run-ups. For this purpose, a numerical simulation code that is based on a two-dimensional extended and generalized Reynolds equation and a full three-dimensional energy equation, was advanced by a theoretical model considering the effects of mixed friction and warming of journal components during start-up. The mixed friction routine contained the elastic half-spaces model proposed by Boussinesq, which considers the influence of rough surfaces by implementing flow factors and calculates additional stiffness and dissipation in areas with solid interactions. Furthermore, a transient term was added in the energy equation to consider the thermal inertia of journal, and bearing to ensure a realistic heating during run-ups. Results of the prediction were compared to experimental data taken from a special test rig built up for validation procedures. Besides the conventional sensors for temperature, oil flow, and relative motion between shaft and stator, a contact voltage measurement was installed to determine the intensity of mixed friction. The evaluation of experimental data by Stribeck curves, based on a shaft torsion measurement, indicated a significant influence of run-up time on frictional moment. The friction coefficient of the rotor bearing system was strongly influenced by the run-up time. A short run-up time reduced the frictional coefficient in the mixed lubrication regime while the opposite behavior was observed in the hydrodynamic lubrication regime. The numerical code predicted these tendencies in good agreement with experimental data, however, only if the transient energy model was applied.

Graphical Abstract

1. Introduction

The Stribeck curve shows the development of the bearing friction coefficient μ, dependent on rotational speed n and can be used to design a journal bearing as efficient as possible. It is still uncertain to what extent a fast or slow run-up influences the Stribeck curve, and consequently, the operating behavior. There are several publications containing transient thermoelastohydrodynamic studies for journal bearings. Khonsari and Wang [1] proposed a simplified model with an uncoupled analysis of the Reynolds and energy equations using adiabatic thermal boundary conditions. Paranjpe and Han [2] used a full three-dimensional (3D) energy equation with hot oil mixing in the groove, and defined a continuous heat flux at fluid-solid interfaces for a crankshaft bearing. A similar model was modified by Kucinschi et al. [3] to describe the thermal expansion of journal and bearing. The authors calculated the temperature field in a journal bearing related to both rapid and slow start-ups using a two-dimensional (2D) temperature distribution in the bearing. They validated their results with experimental data, and identified significantly higher time periods until steady state conditions were reached than reported in [1,2]. However, these papers do not include a theoretical mixed lubrication model that is necessary to describe the whole Stribeck curve shown in Figure 1.
Especially during the start-up processes oil film thickness is very small. If it falls below a critical value hcr, surface roughness phenomena have to be considered. At first the surface asperities hinder oil flow and thus affect the hydrodynamic pressure phyd build up. Since deterministic models of rough surfaces require a very fine mesh resulting in high computational times, a flow factor extended-average Reynolds equation was used to consider surface topography on macroscopic scale. There are numerous investigations on the impact of surface pattern or textured surfaces that confirm a relevance of surface roughness on the hydrodynamic behavior. For example, Akbarzadeh and Khonsari [4] compared the influence of longitudinal, transversal, and isotropic surfaces of a pin-bushing assembly and determined specific frictional characteristics of each surface. Adatepe et al. [5], measured Stribeck curves of statically loaded micro-grooved journal bearings and identified a significant impact of the groove orientation on their results. As a further important effect in a mixed lubrication regime, solid contact pressure pc is built up between single micro contacts and exists simultaneously with the hydrodynamic pressure phyd of the thin film. Precomputation of contact pressure as a function of relative distance between the two surfaces can be performed in a separate calculation module based on the theory of the elastic half-spaces according to Boussinesq [6], in cooperation with a linear-elastic ideal-plastic material law. Most numerical models are based on the theory of Greenwood, Williamson, and Tripp [7,8] that is limited to surfaces with a Gaussian height distribution of the asperities. However, most engineering surfaces; like a turned surface after running-in or a microtextured surface, are non-Gaussian and finally not covered. Furthermore, the model of Greenwood and Williamson [7] requires a numerical integration of the Gaussian distribution that is commonly approximated by power laws as shown by Hu [9] and Panayi and Schock [10], or polynomial functions as proposed by Teodorescu [11] to reduce computational time. Additionally, standard deviation of asperity heights, radius of an asperity peak, as well as density of asperities are required for contact pressure calculation and summarized in a so-called elastic factor. By now no generally accepted method exists to determine these asperity peak properties [12]. Consequently, the elastic factor varies in different publications between 1 × 10 4 and 5 × 10 2 , e.g., [9,13,14,15]. Additionally, Lu et al. [16], and Sander et al. [17] conducted investigations on Stribeck curves for journal bearings and used the model from [7] in their predictions.
This paper focuses on transient temperature effects in the hydrodynamic and mixed lubrication regimes. Therefore, the transient energy equation was evaluated to consider the thermal inertia of the journal, bearing, and film. Additionally, the dissipation expression included boundary friction in regions with solid interaction. In contrast to the contact model proposed by Greenwood and Williamson [7], the model for load carried by asperities presented in this paper enabled pressure predictions for arbitrary technical surfaces. Moreover, it considered elastic deformations of asperities that were not in contact.

2. Theoretical Analysis

The physical basics of the theoretical bearing model include a two-dimensional (2D) extended and generalized Reynolds equation, and a full (3D) energy equation for bearing, oil film, and journal. The temperature in the journal was assumed to be uniform in circumferential direction due to sufficiently high rotor speeds. For the solution of Reynolds and energy equations, a conservative finite difference scheme (Finite Volume Method (FVM)) was used. The combined convection and diffusion problem of the energy equation was stabilized by the hybrid scheme, which is in detail explained in [18]. For the oil supply process an advanced mixing model was implemented that needs no mixing factors and is completely energy conserving [19].
The basis of the entire bearing model used for the upcoming analyses was comprehensively described in [19,20,21]. Therefore, the consecutive explanations were mainly reduced to the implemented mixed lubrication model and its impact on the mechanical equilibrium as well as the modified energy equation.

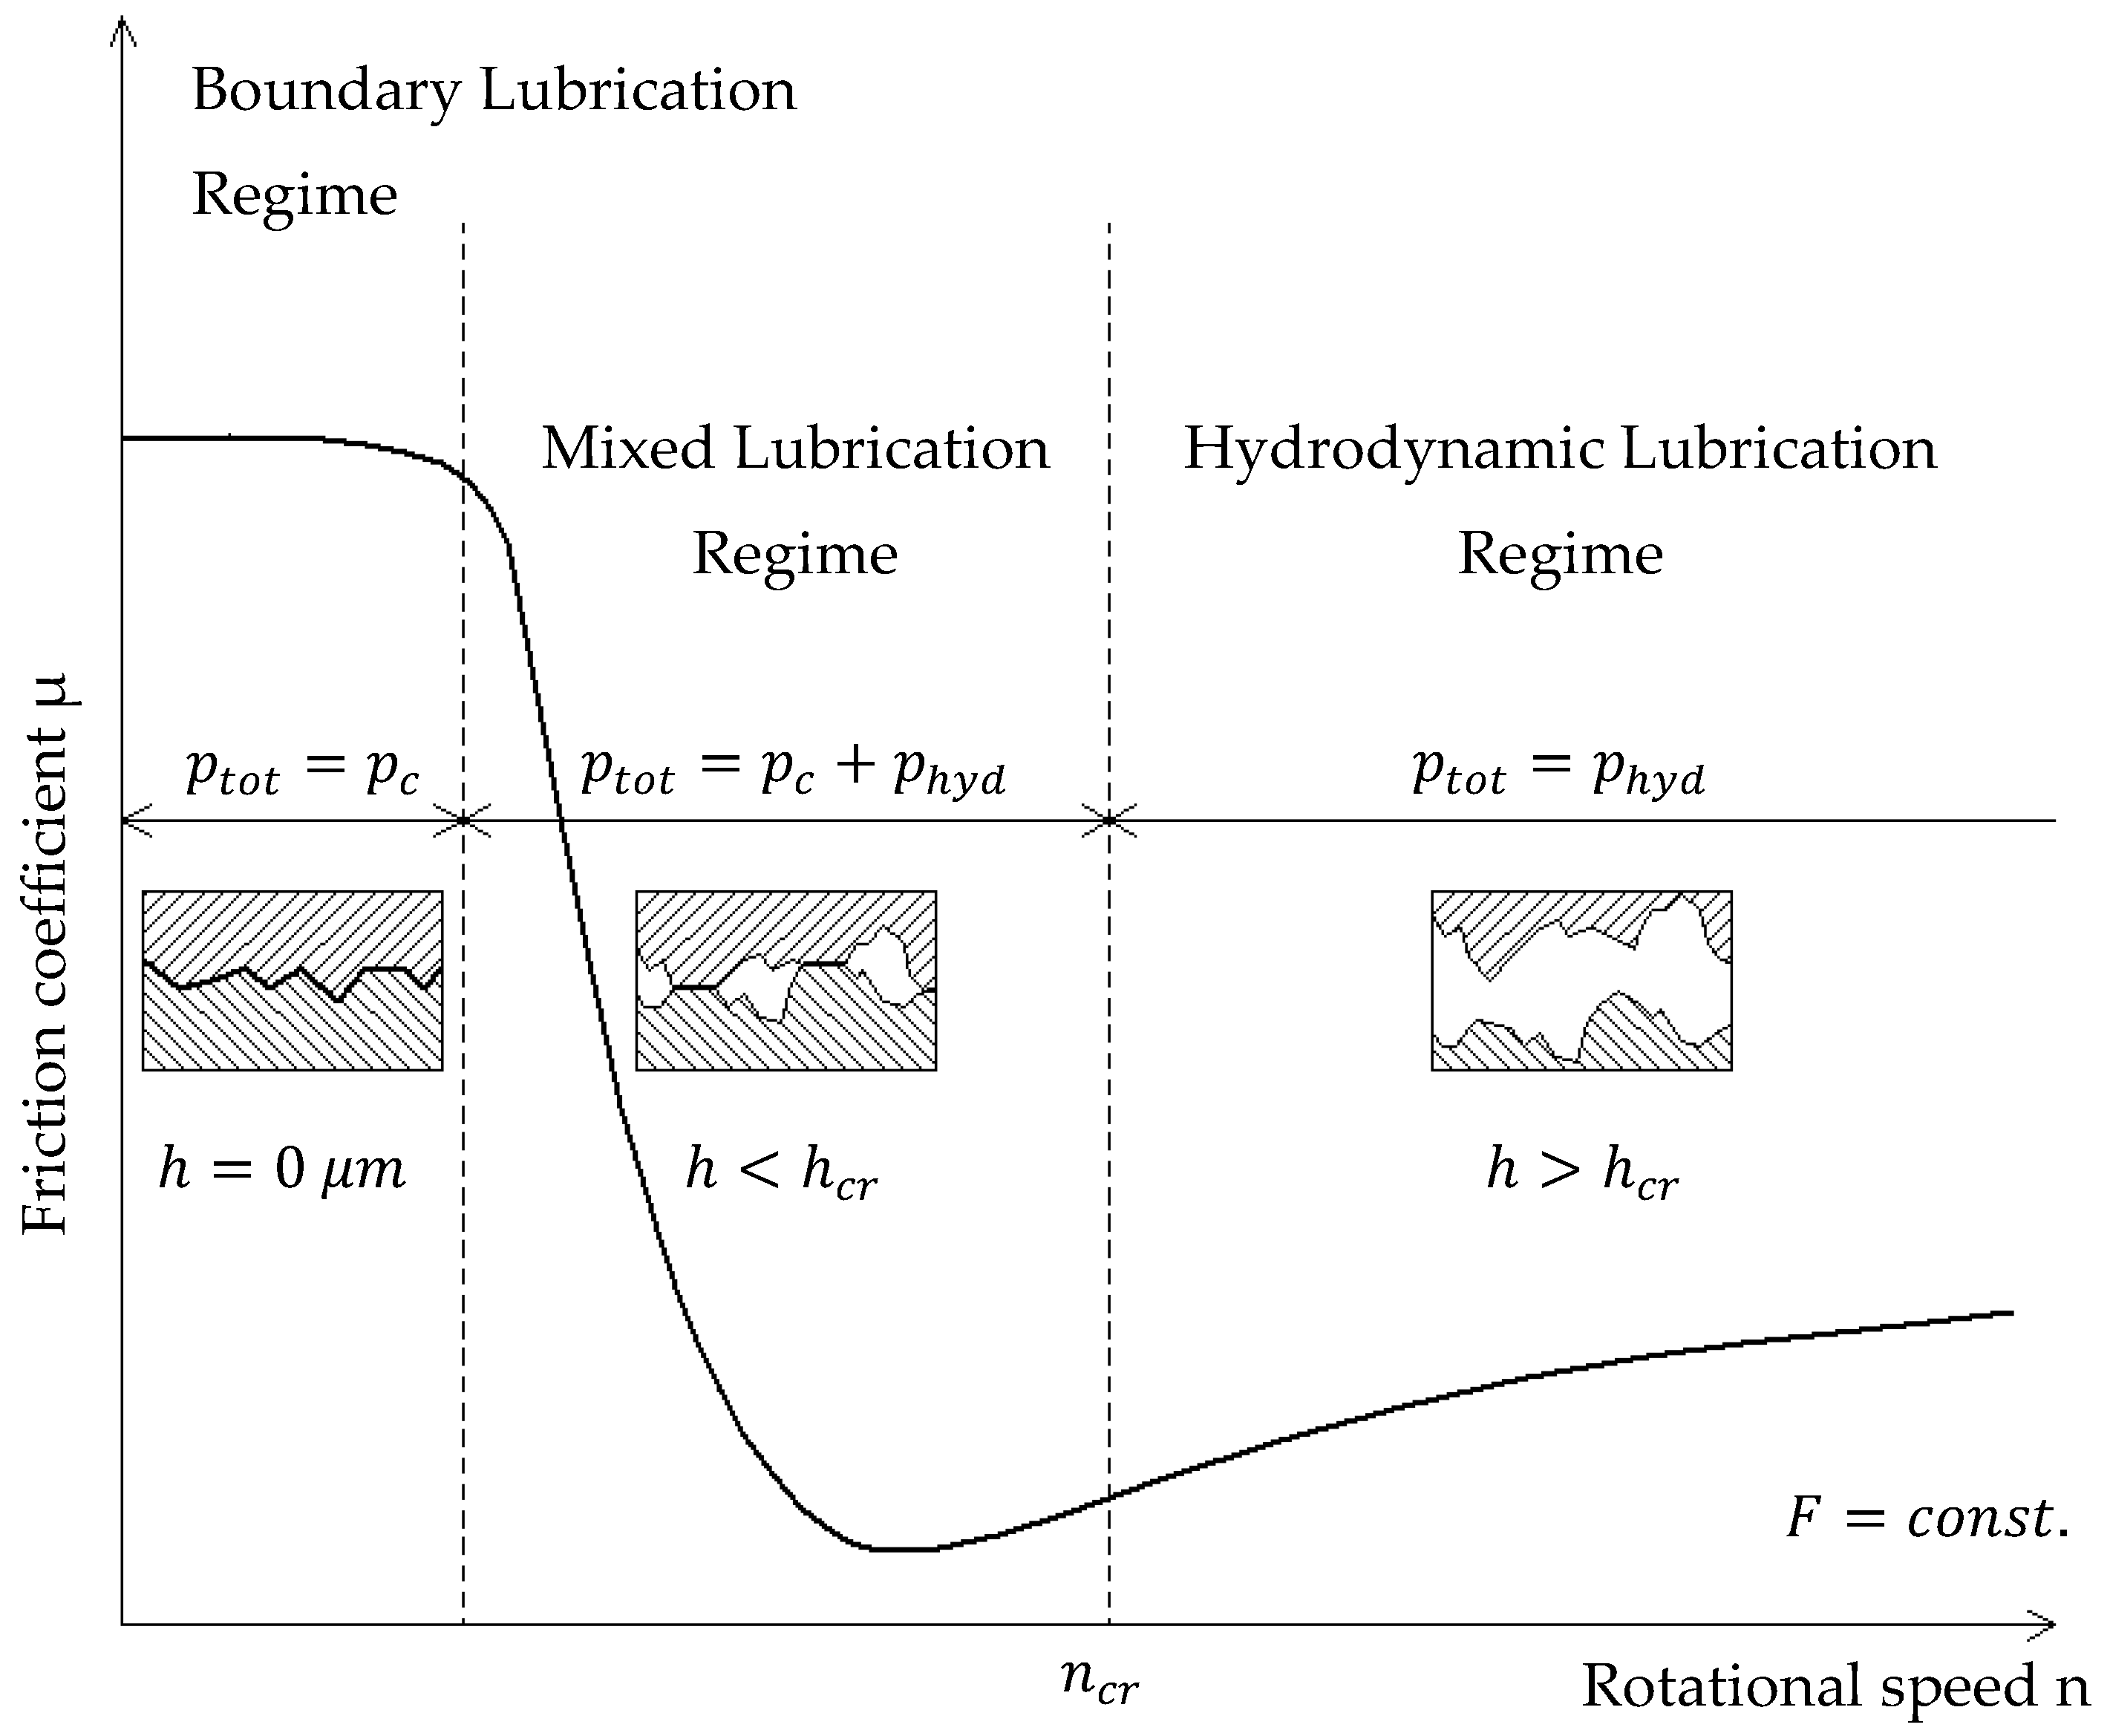
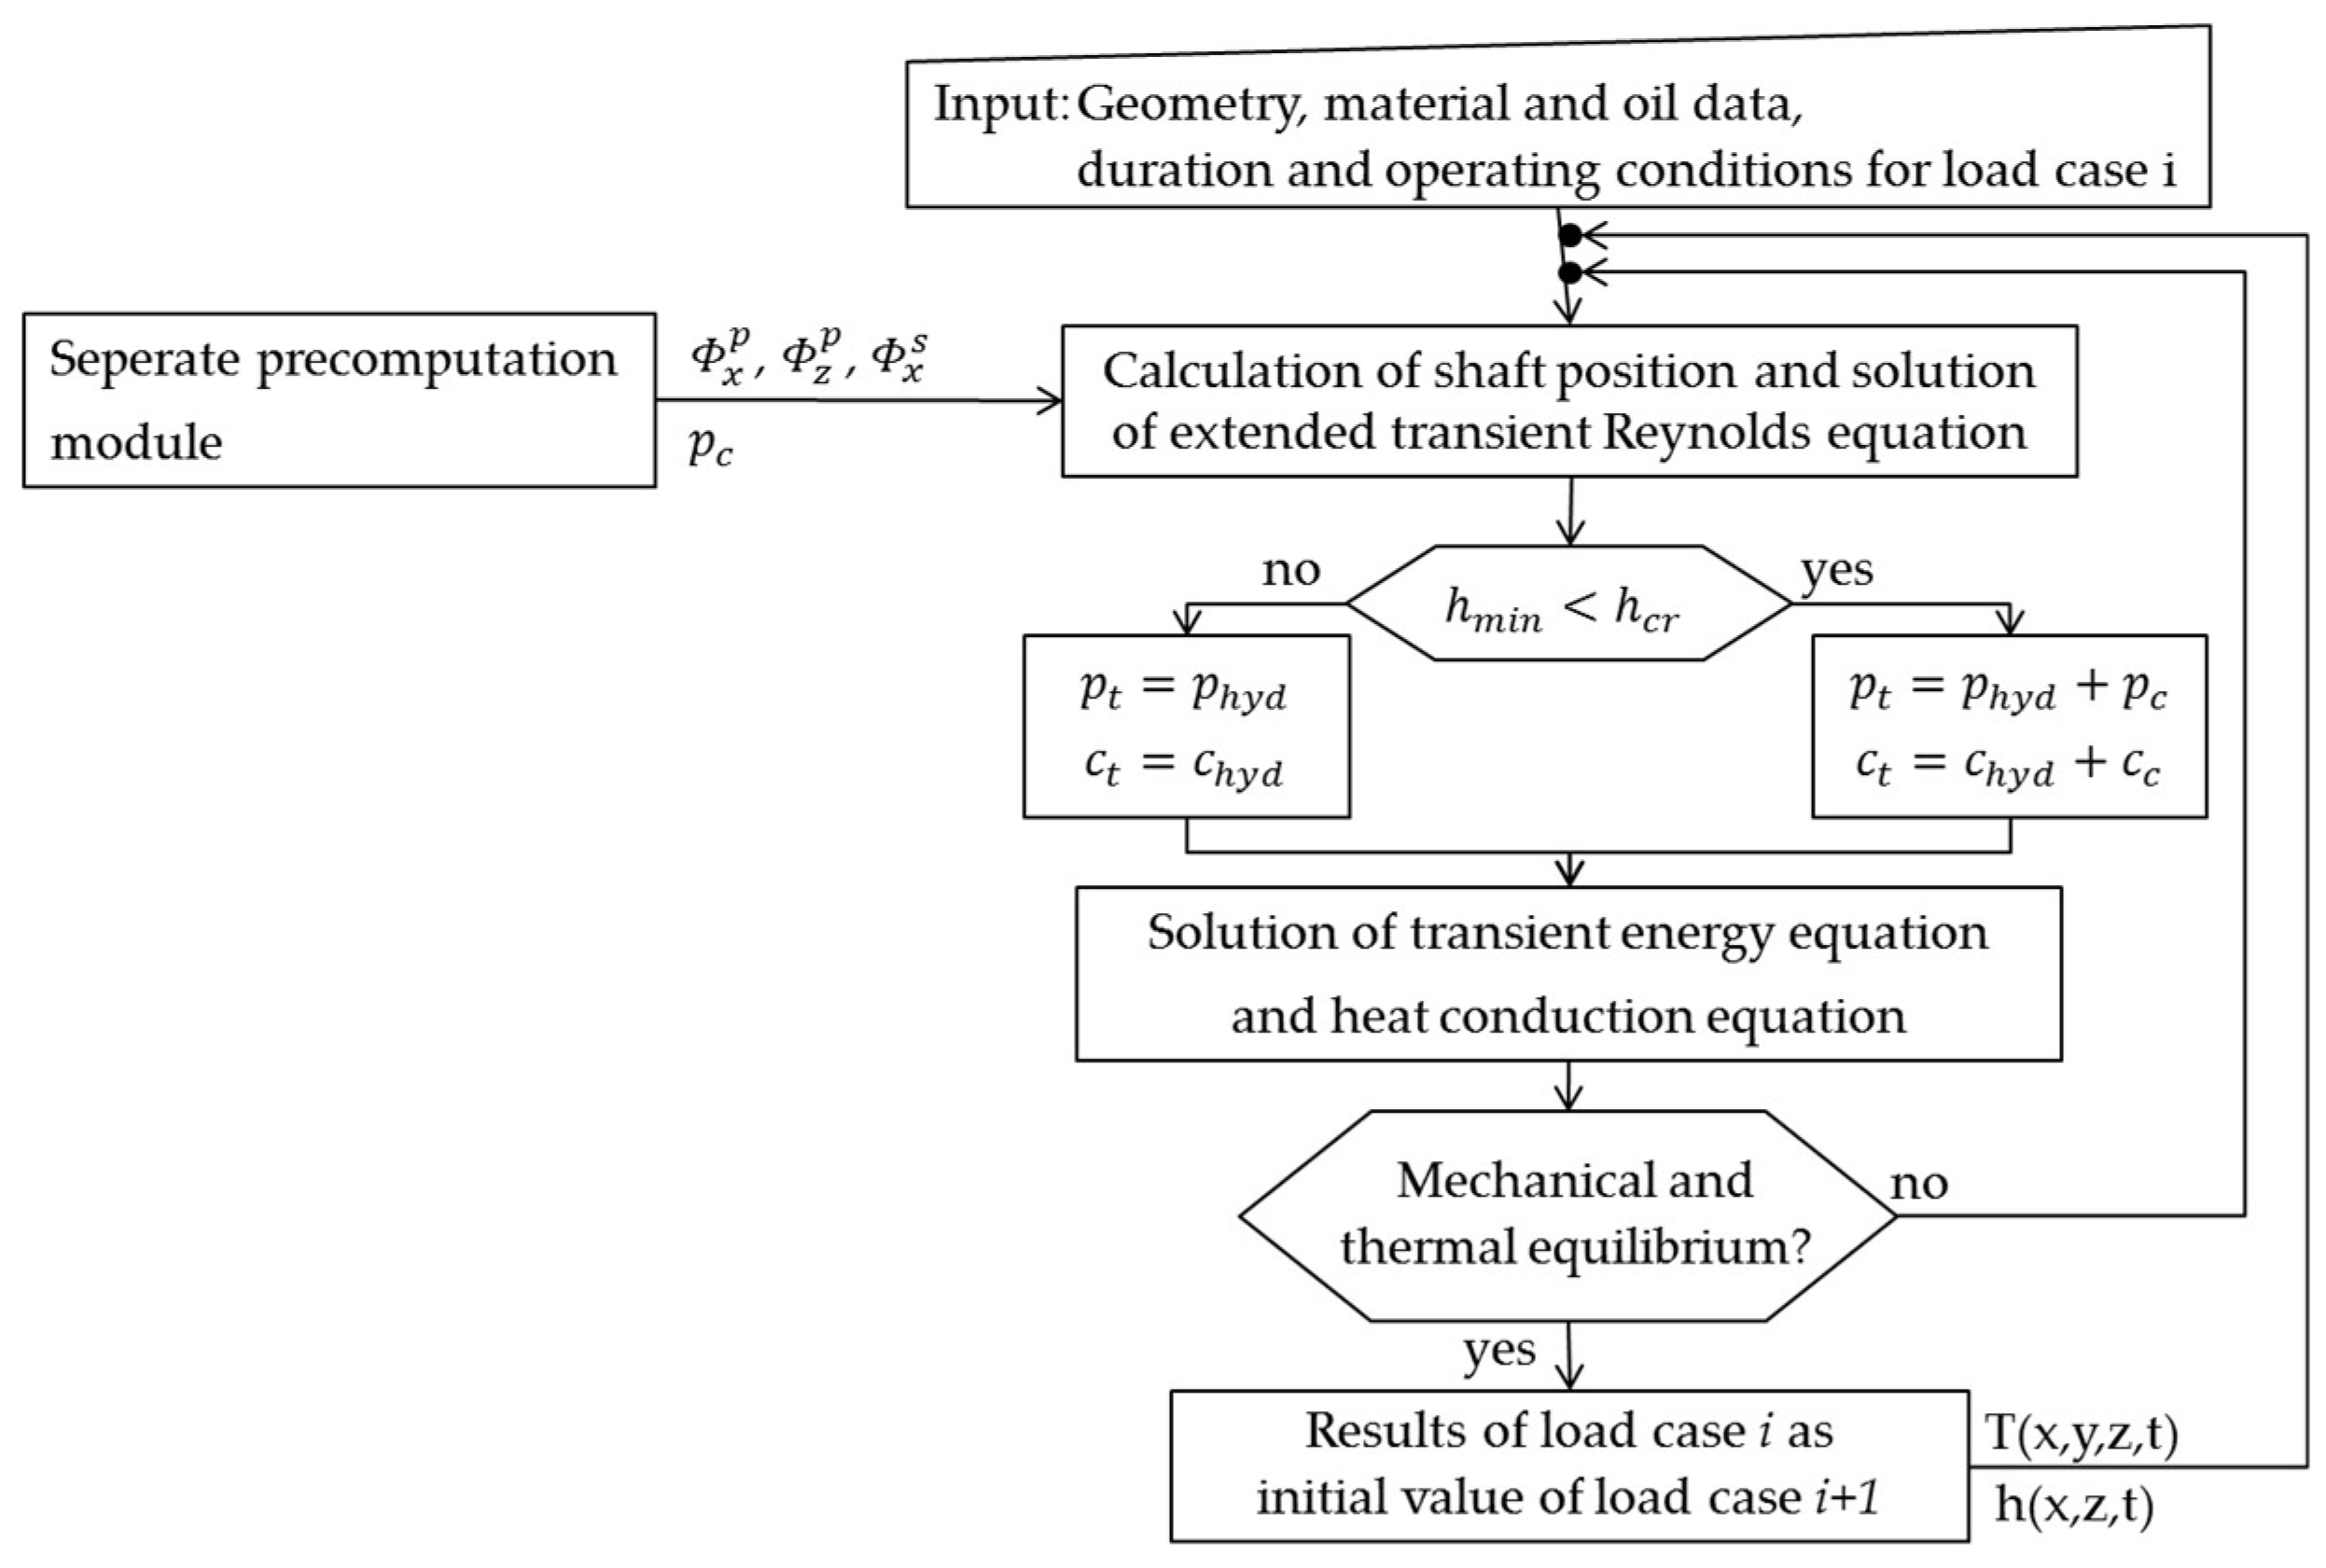
2.1. Mixed Lubrication Model

During run-ups, journal bearings without jacking oil units have to pass the mixed lubrication regime because of high loads at low rotor speeds. Consequently, a validated mixed lubrication model was necessary to reliably calculate parameters such as friction coefficient, friction torque, or power loss. In mixed lubrication regimes, the external force was compensated by the hydrodynamic pressure phyd of the lubrication film, and the solid contact pressure pc of the asperities that were in contact. The total pressure ptot was computed with:
p tot = p hyd + p c

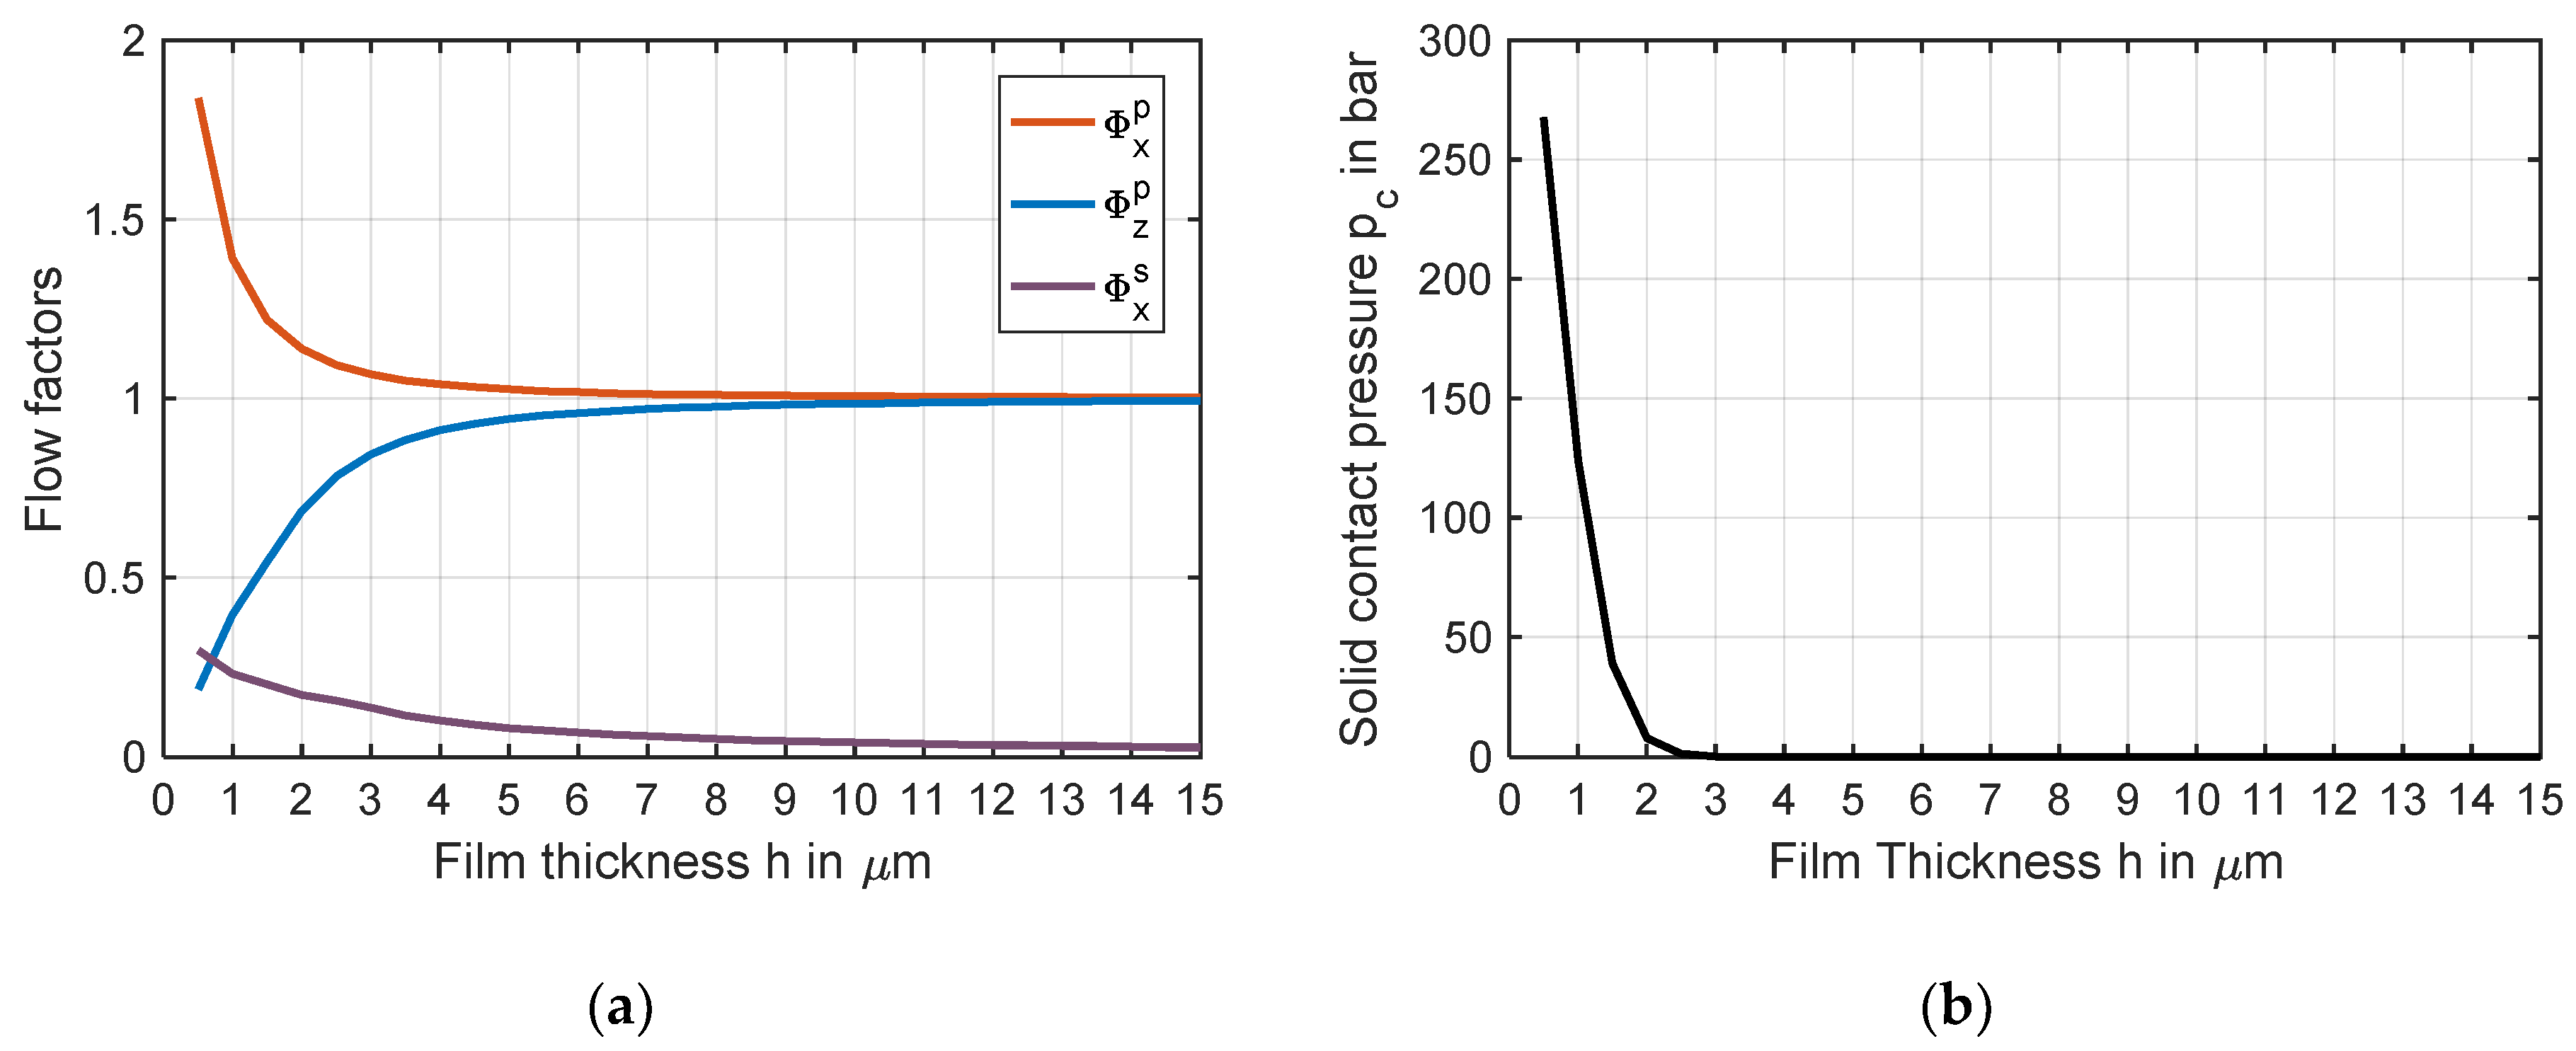
2.1.1. Hydrodynamic Pressure

At very small film thickness values the asperities on surfaces can hinder or support the oil flow depending on their orientation. Patir and Cheng [22,23] proposed an average Reynolds equation containing the so called flow factors to consider the influence of surface roughness on the hydrodynamic pressure.
x ( ϕ x p ρ   F 2 K x × p ¯ hyd x ) + z ( ϕ z p ρ   F 2 K z × p ¯ hyd z ) = u x ( ρ   ϕ x s ) + u x [ ρ ( h F 1 F 0 ) ] + ( ρ   h ) t
This concept enables simulation on a macroscopic scale and the calculation time can be extremely reduced. A three dimensional viscosity distribution due to variable temperatures in all three directions of the film was considered by the factors [24]:
F 0 = 0 h 1 η d y ,   F 1 = 0 h y η d y ,   F 2 = 0 h y η × ( y F 1 F 0 ) d y
Additionally, the effects of local turbulent flow or Taylor vortices were included using the coefficients Kx and Kz [25]. The mass conserving cavitation was described by an algorithm that was based on the JFO theory and its numerical implementation according to Elrod [26] taking fluid film rupture and reformation into account.
The dependence of flow factors on film thickness was analyzed in a separate module for a small but representative sample of the bearing. Therefore, the surface topography was measured white light interferometry and the flow factors were determined by calculating the ratio of mean flow through a smooth and a rough miniature bearing for different boundary conditions. The pressure distribution, and consequently, oil flow in the rough miniature bearings were obtained by solving Reynolds equation with the local film thickness between the single microcontacts considering contact zones that hinder the oil flow.

2.1.2. Solid Contact Pressure

The basis of the solid contact model is the elastic half-spaces theory, introduced by Boussinesq [6], which was coupled with a simplified linear-elastic ideal-plastic material law. Therefore, the magnitude of the pressure was limited by the plastic flow pressure pc,lim of the softer material. Boussinesq formulated a relation between the elastic deformation wel at a random position (x,y) and the contact pressure pc.
w el ( x , y ) = 1 E red 1 π p c ( x , y ) ( x     x ) 2   +   ( y     y ) 2 d x d y
For numeric implementation of the solid contact model, the concept of sum surfaces proposed by McCool [27] was used and the combined rough surface with a reduced Young’s modulus Ered interacted with a rigid smooth surface.
1 E red = 1 2 ( 1     ν 1 2 E 1   +   1     ν 2 2 E 2 )
In the numerical algorithm, the combined surface was stepwise moved versus the rigid surface and for each average gap height the pressure distribution was iteratively calculated, whereby a discrete convolution and fast Fourier transform approach (DC-FFT) [28] was performed to increase the computational speed.
The measured surface of bearing is represented in Figure 2, and has a RMS-roughness Rq = 2.83 μm.
Figure 3 shows the calculated curve of flow factors and contact pressure over film thickness.

2.2. Mechanical State of Equlibrium

The external load is required to be in balance with the fluid film and solid contact forces. For this purpose the stiffness coefficients of the bearing were used as relaxation parameters in a Newton–Raphson algorithm to modify the shaft position according to the current residual forces. In a mixed lubrication regime, a parallel connection of the stiffness coefficients of fluid film chyd and the asperities in contact cc was assumed.
c tot = c hyd + c c
The stiffness coefficients of the fluid film can be derived from a linear perturbation of the average Reynolds equation [29], including a linearized dynamic volume flow balance. The stiffness coefficients of the solid contact zone were obtained from the calculated relation between solid contact pressure and film thickness. Since the stiffness coefficients of the solid contact zone were the gradient in a force-displacement diagram, the function of normal force over film thickness was obtained from the calculated solid contact pressure. Again, a small linear perturbation of the current operating point was performed to determine all stiffness coefficients. Consequently, it was necessary that the used function of solid contact pressure was continuously differentiable.

2.3. Thermal State of Equlibrium

To calculate the temperature distribution one combined system of equations for bearing, film, and journal was solved. The energy equation of oil film contained a parameter for an effective heat conductivity λeff to model turbulent flow by an eddy conductivity and a dissipation term Φ caused by the internal fluid friction.
c ρ ( T t + u T x + v T y + w T z ) specific   change   of   the   internal   energy = x ( λ eff T x ) + y ( λ eff T y ) + z ( λ eff T z ) specific   heat   conduction + Φ dissipation
Three dimensional heat conduction equation of the bearing was written in cylindrical coordinates.
c B ρ B T B t = λ B ( 1 r z r z ( r z T B r z ) + 1 r z 2 T B 2 φ 2 + T B 2 z 2 )
The heat conductivity equation of the journal was concordantly written in cylindrical coordinates, although, it assumed an independence of temperature in circumferential direction due to sufficiently high rotational speed.
c J ρ J T J t = λ J ( 1 r z r z ( r z T J r z ) + T J 2 z 2 )
The time-dependent terms describe the heat quantity that is stored in the fluid and the bearing components and consider the thermal inertia. The governing time-dependent Equations (2) and (7)–(9) were solved by an implicit Euler time integration method. For the thermal bearing model, convective heat transfer was defined on the radial and axial free surfaces of the bearing as well as on the axial free surfaces of the shaft.
In the mixed lubrication regime, dissipation Φ was not only generated by inner friction in the fluid but also in the solid contacts due to boundary friction. The determination of the exact distribution of heat flows in the mixed lubrication regime was beyond the scope of a bearing model based on macroscopic scale. Therefore, an analogous model was developed wherein the dissipated energy of fluid q ˙ R,hyd and boundary friction q ˙ R,c had to be in balance with the conductive heat flows in journal q ˙ J, bearing q ˙ B, and the convective heat flow of fluid q ˙ F [29].
q ˙ R , hyd + q ˙ R , c = q ˙ J + q ˙ B + q ˙ F
The dissipated energy of fluid q ˙ R,hyd can be obtained with the shear stress in fluid τhyd and the relative speed u.
q ˙ R , hyd = τ hyd × u = η × γ ˙ × u
The frictional heat flows of solid contact can be calculated with the contact pressure pc the friction coefficient μ and the relative speed u.
q ˙ R , c = μ × p c × u
Overall, in the numerical procedure, this additional dissipation q ˙ R,c was defined as boundary condition on the interface elements between fluid and bearing bodies with consideration of a continuous heat flow. The total dissipation Φ in Equation (11) was the sum of fluid and boundary dissipation and can be expressed with
Φ = η × γ ˙ + μ × p c
The numerical implementation was controlled by the balance of forces, oil, and heat flow.
Thermal deformation was considered by a simple model that used the mean temperature of journal and bearing, and calculates a global reduction of the radial clearance regarding the different thermal expansion coefficients of the single components.
The described procedure of a transient simulation considering mixed lubrication is shown in a simplified flow chart (Figure 4).

3. Experimental Setup

In order to validate the theoretical results of the described model, a test rig was installed.

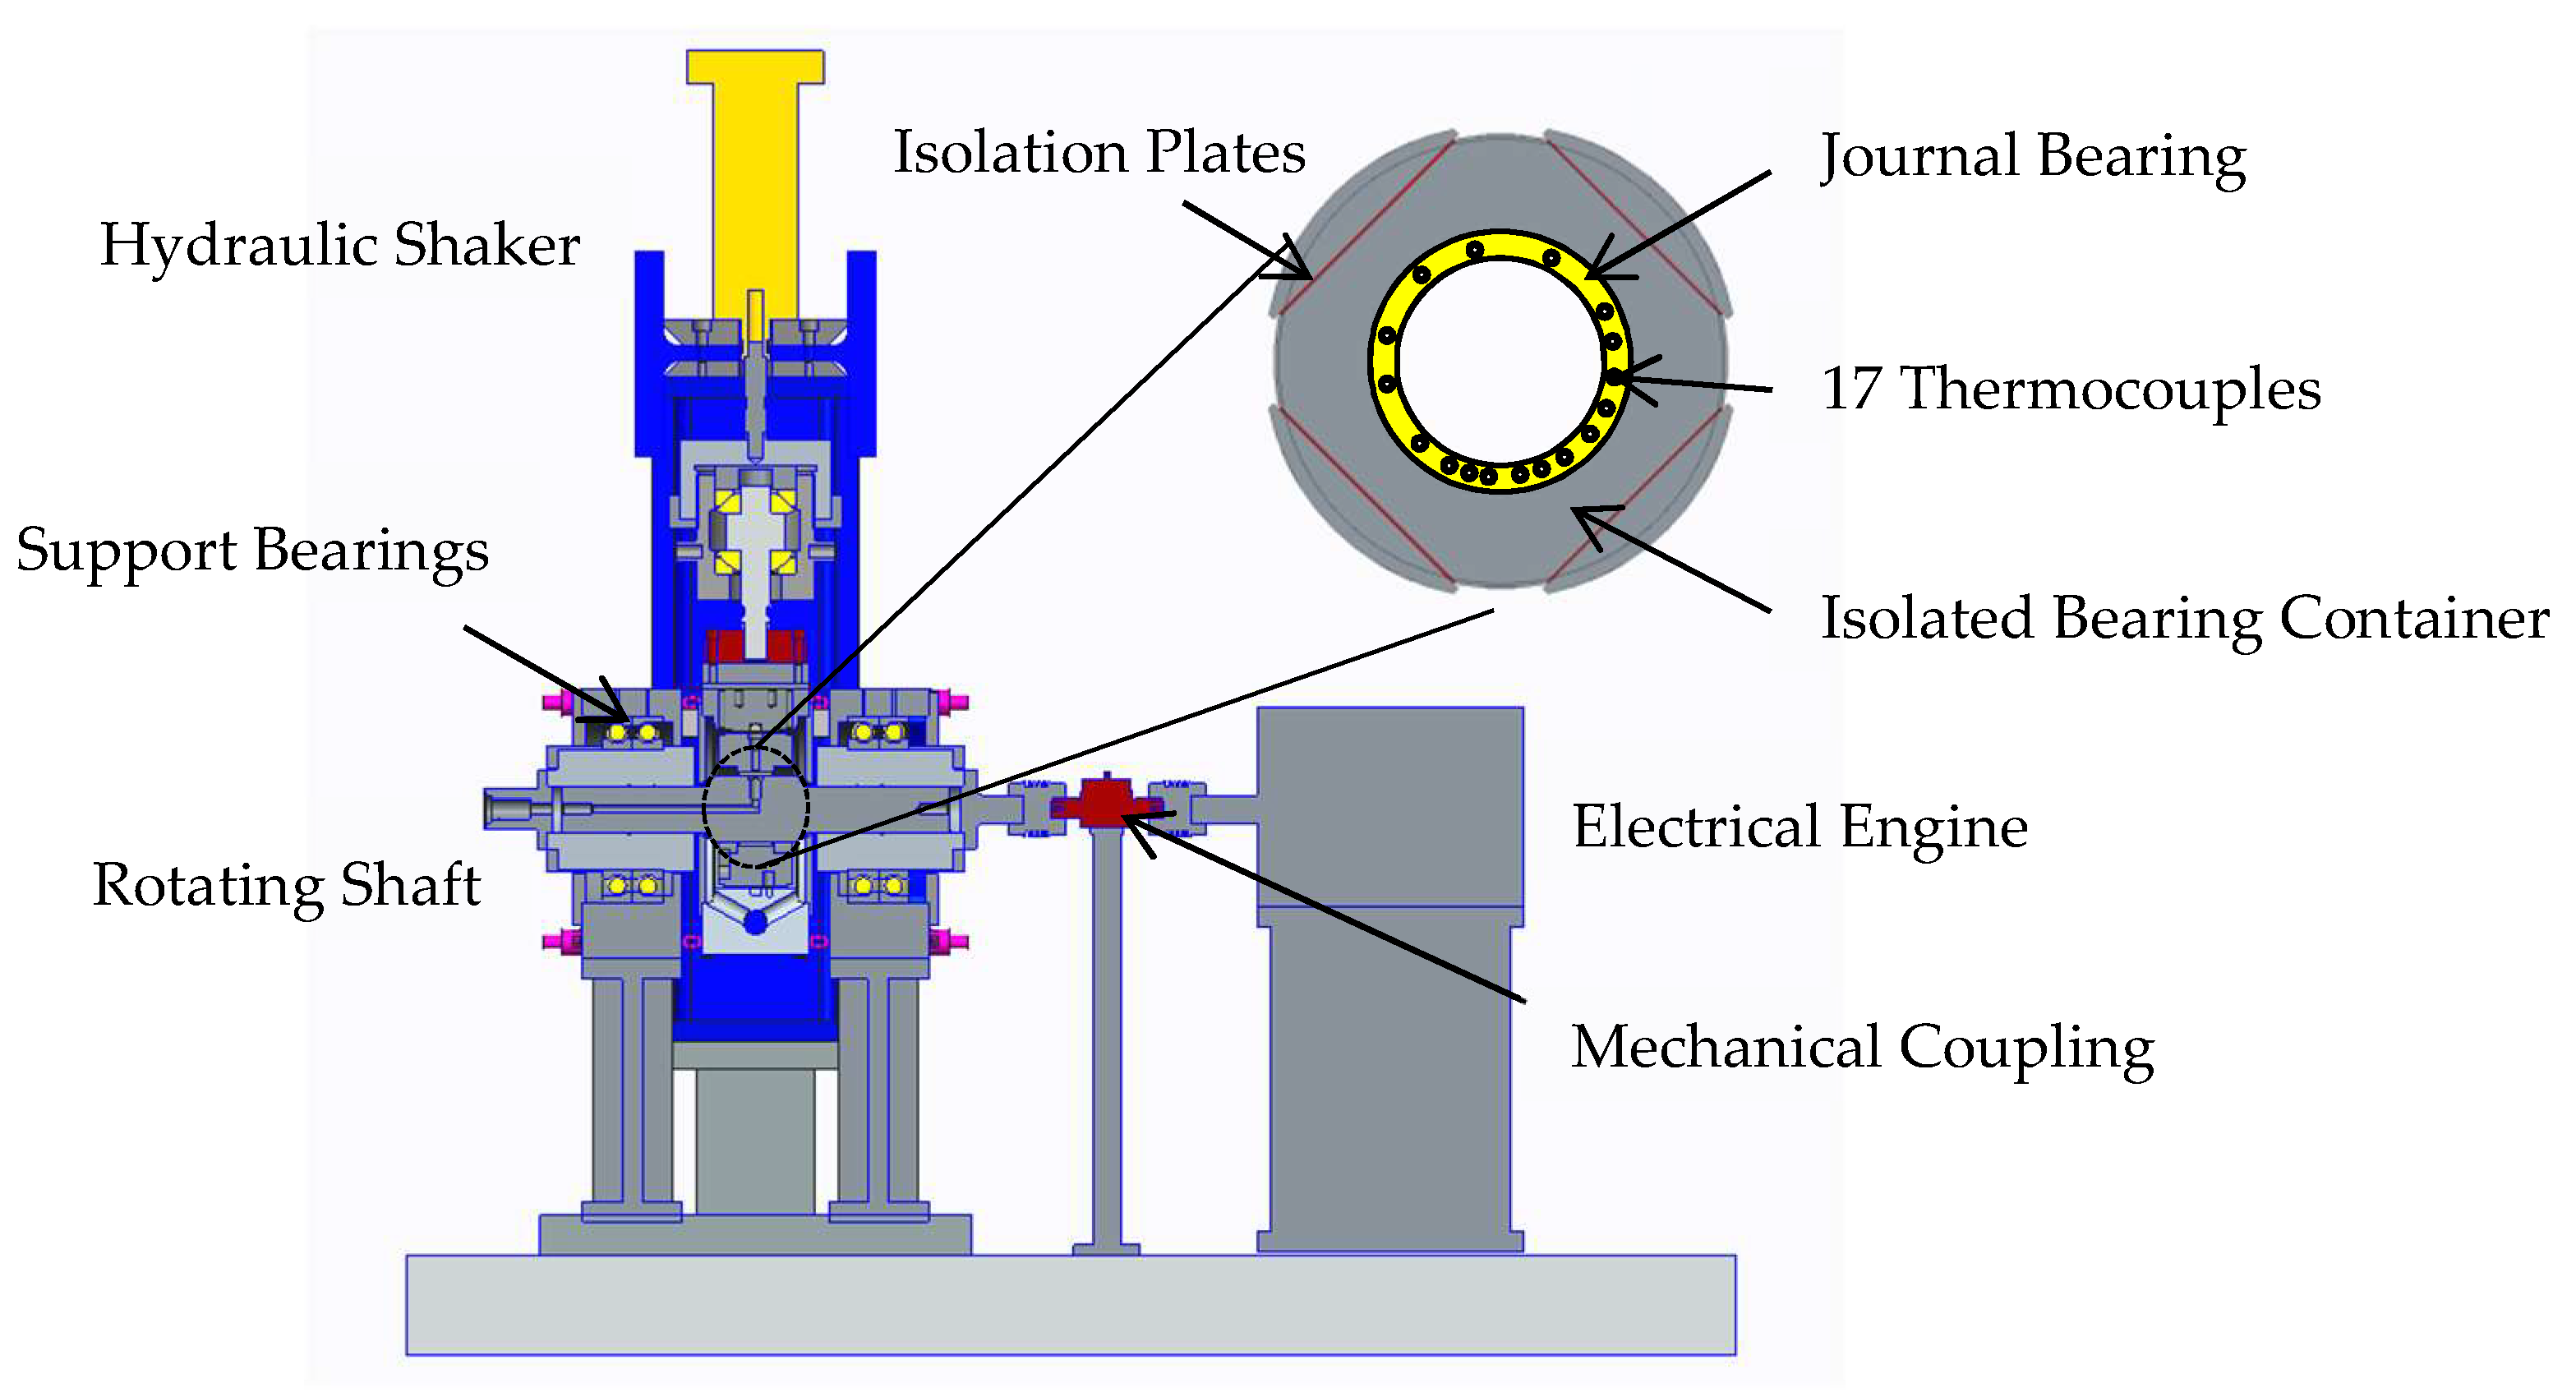
3.1. Test Bearing and Test Rig

Measurements were conducted with a cylindrical bearing with one oil lube pocket. The main geometry is listed in Table 1.
The test section of the rig consisted of a rotating shaft supported by two grease lubricated rolling bearings, and a test bearing located between the support bearings and aligned relatively to them to apply mechanical loads. Static and dynamic loads up to 50 kN (10 MPa) can be applied by a hydraulic shaker and an electrical engine enabled rotational speeds varying from 10 to 4000 rpm. The transient temperatures were detected by 17 thermocouples located in the lateral center plane of journal bearing, with 4.5 mm distance to sliding surface and distributed in circumferential direction according to the schematic drawing in Table 1. Frictional torque was measured for the whole driven part of the test rig including the support bearings. Therefore, preliminary tests without a journal bearing were performed to determine the frictional torque of the support bearings. It was assumed that frictional moments preliminary depend on rotational speed and lubricant temperature. However, the relative displacement between shaft and test bearing housing, supply pressure and temperature, as well as oil flow rate were recorded and monitored to ensure constant test conditions. No sensors were applied on the rotor side. The special feature of the test rig was a contact voltage measurement to determine the intensity of mixed lubrication. For this purpose, the bearing was isolated from the outer container, so that a voltage between journal and bearing could be measured in case of solid contact (Figure 5).
The non-repeatability of the temperature sensors integrated into the measurement chain was proven by ±1.5 K, and the uncertainties of torque measurement were ±0.13 Nm. The material data of the brass bearing, the case-hardened steel journal, and the high grade steel container as well as information on the lubricant are summarized in Table 2.

3.2. Test Conditions

For the investigation, two different test runs were considered. In a first step, stationary data under hydrodynamic conditions were established for validation of corresponding predictions. Secondly, run-ups from 100 to 4000 rpm, under a static load of 4 kN (0.8 MPa), were studied for different durations in a range from 15 s towards a quasi-static starting in about 3.5 h with identical operating conditions apart from that. In both cases the rotor speed profile was linear. The lubricant that was supplied to the test bearing was preconditioned around 30 °C and was monitored together with the grease temperature in support bearing, which was approximately 50 °C during the entire test procedure. A constant oil supply pressure of 2 barg was set for all experimental investigations.

4. Results

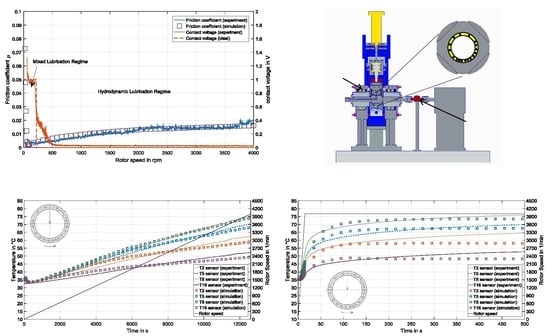
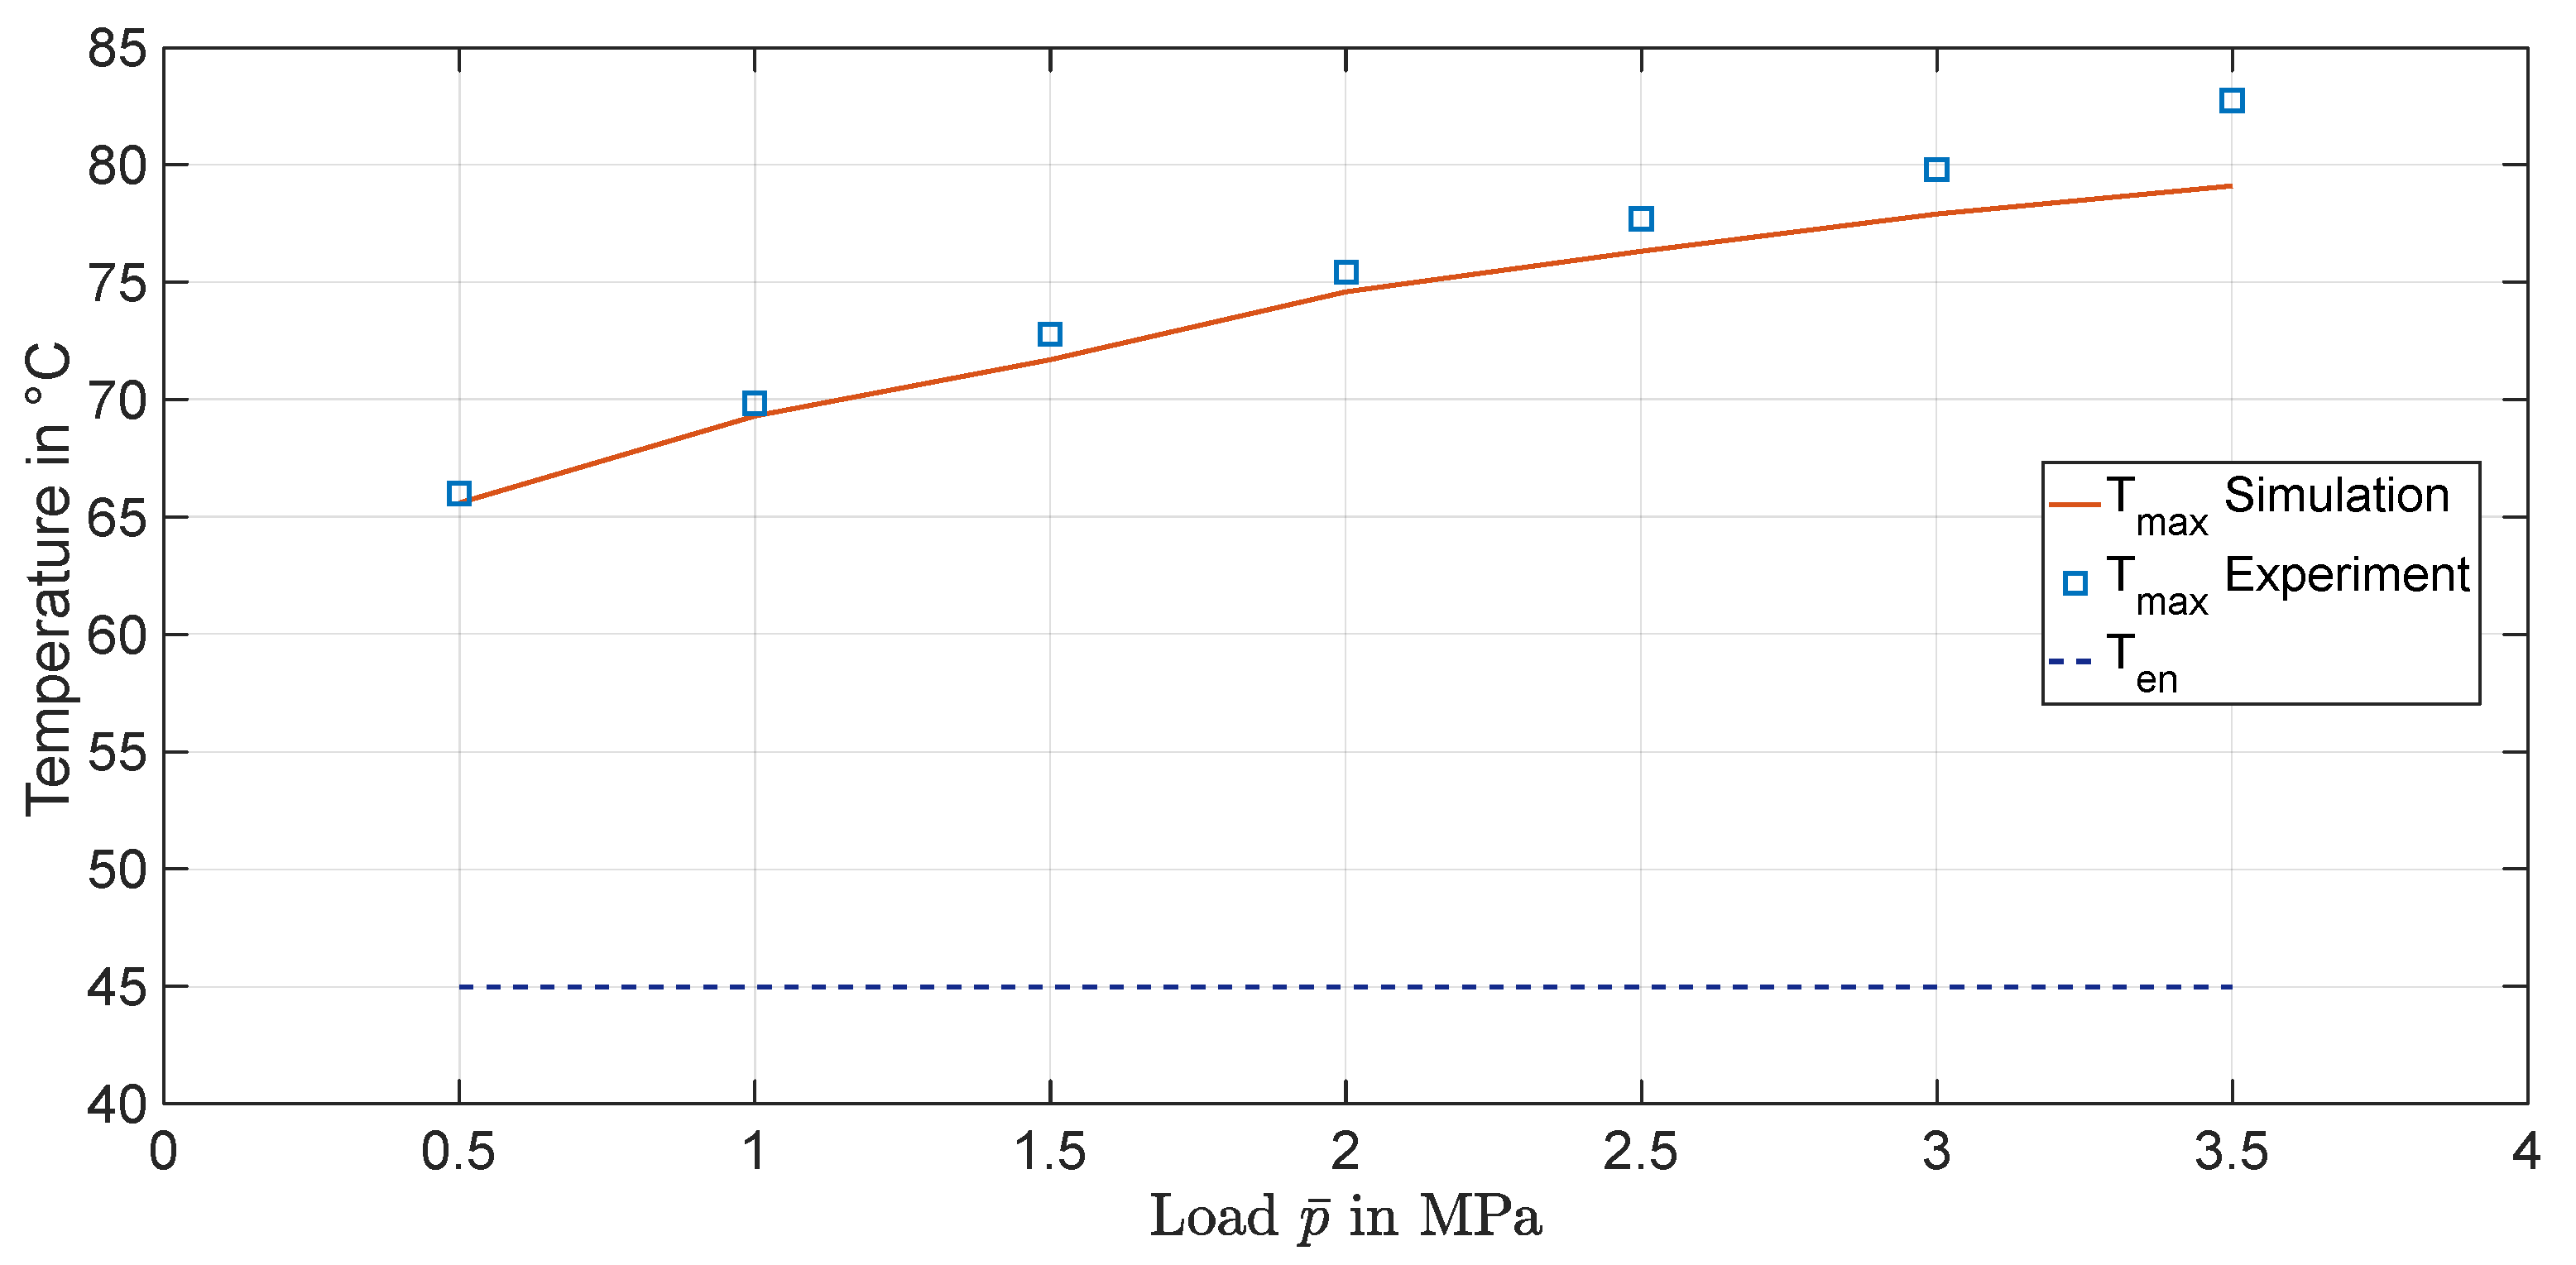
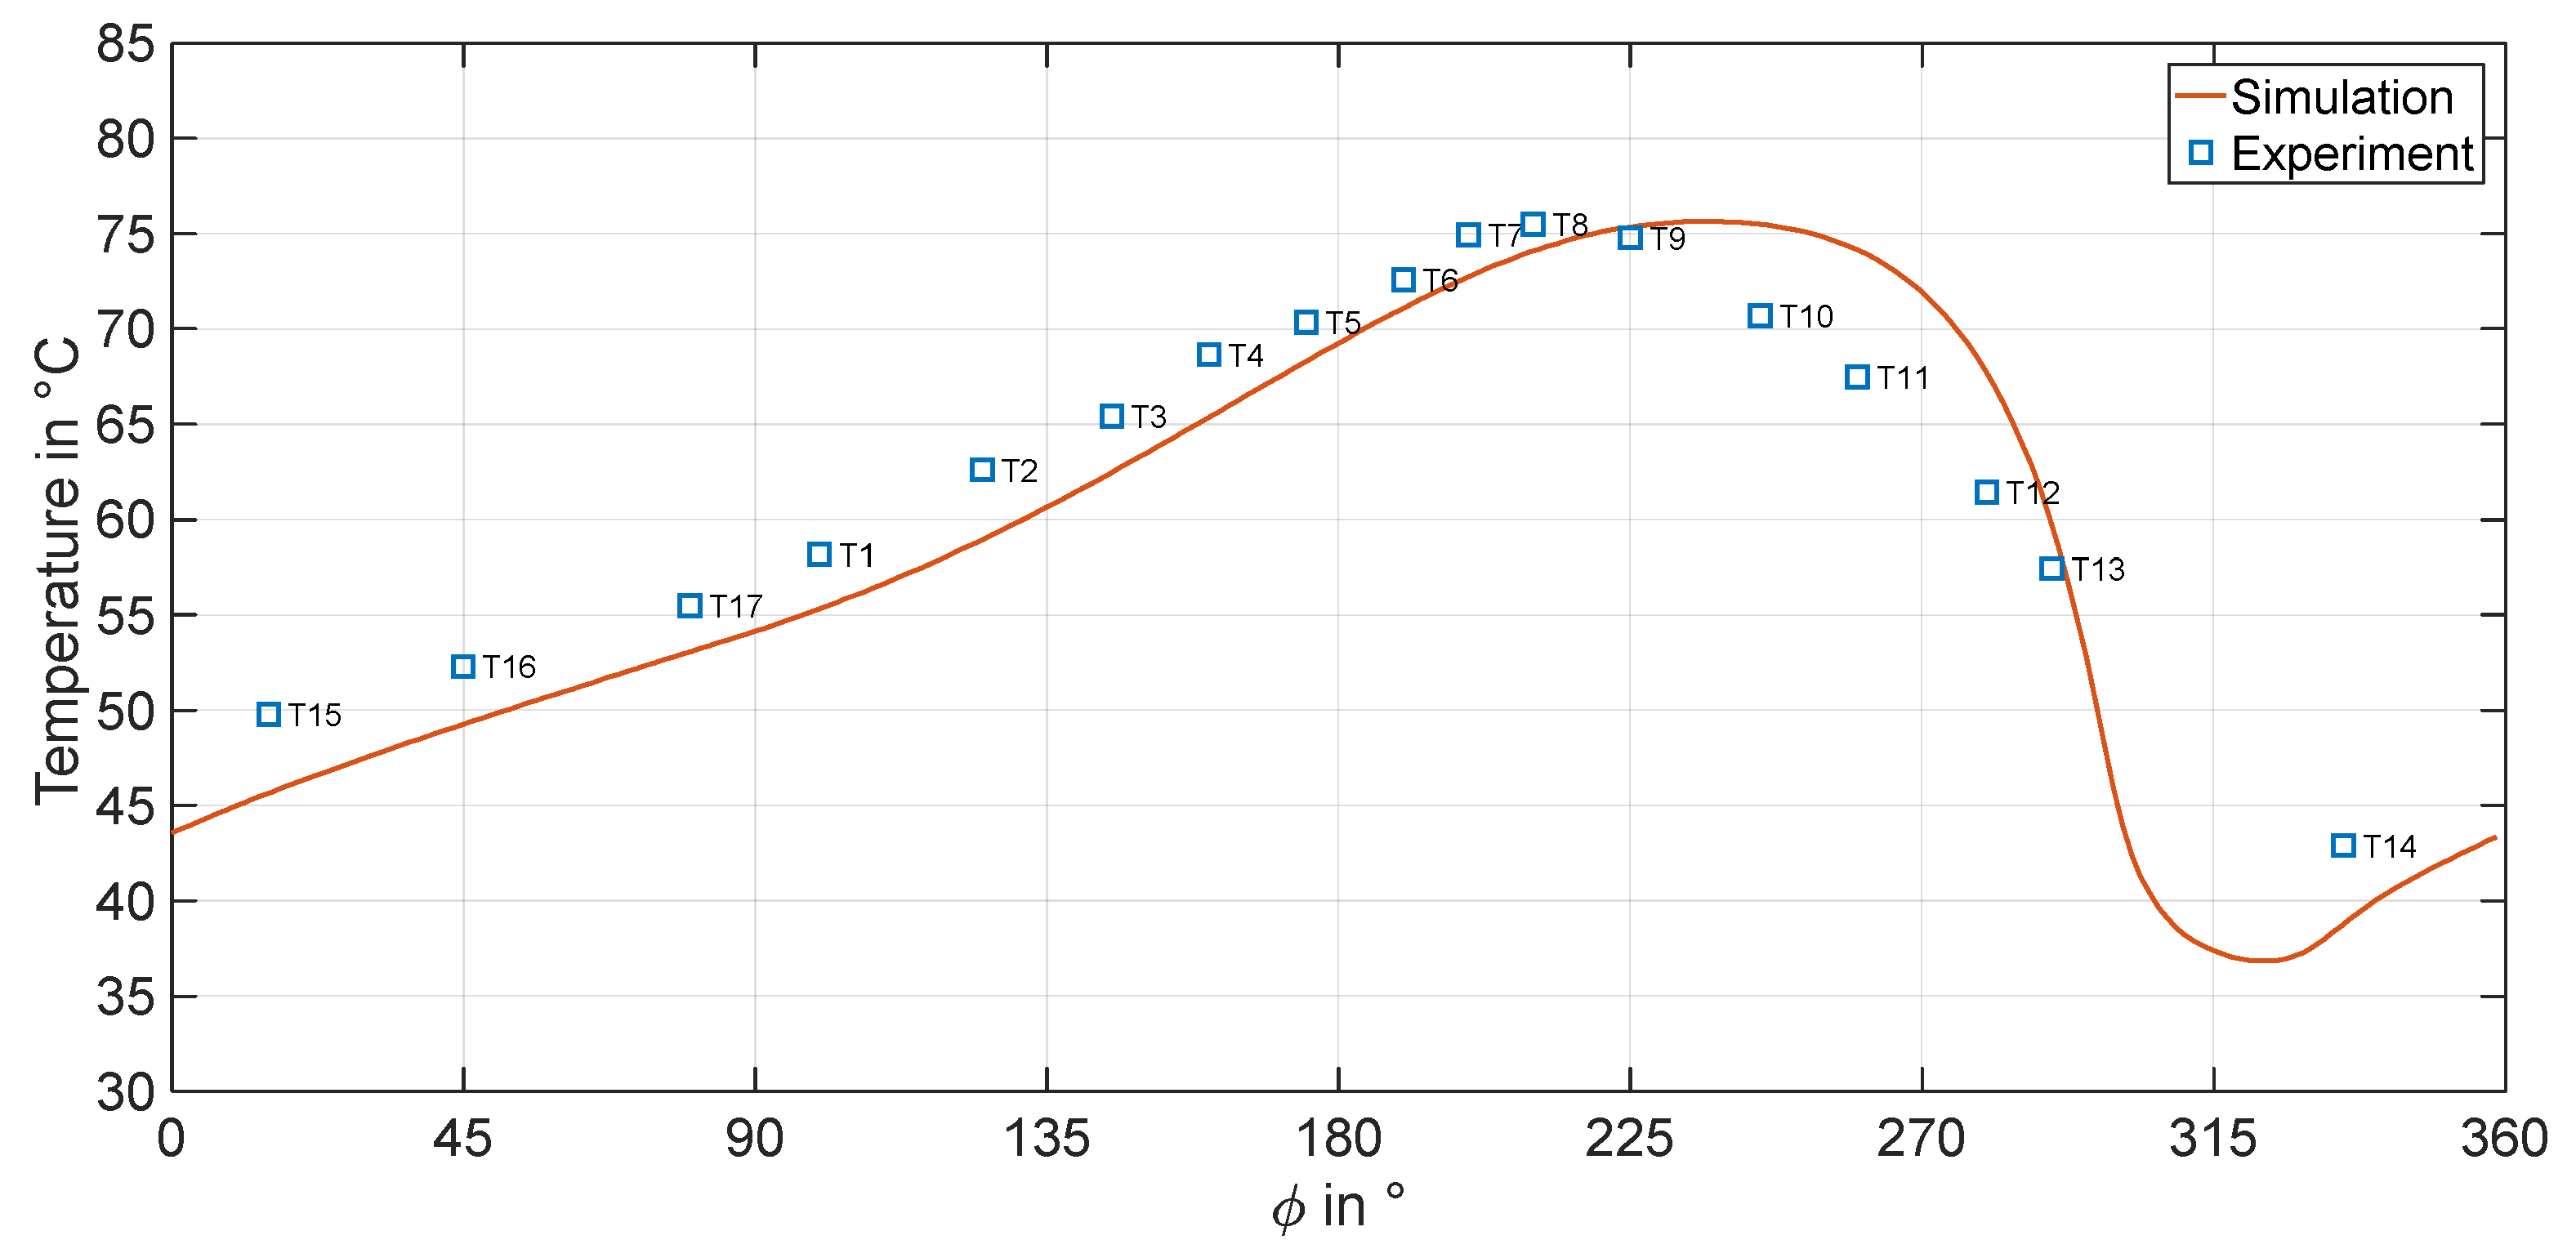
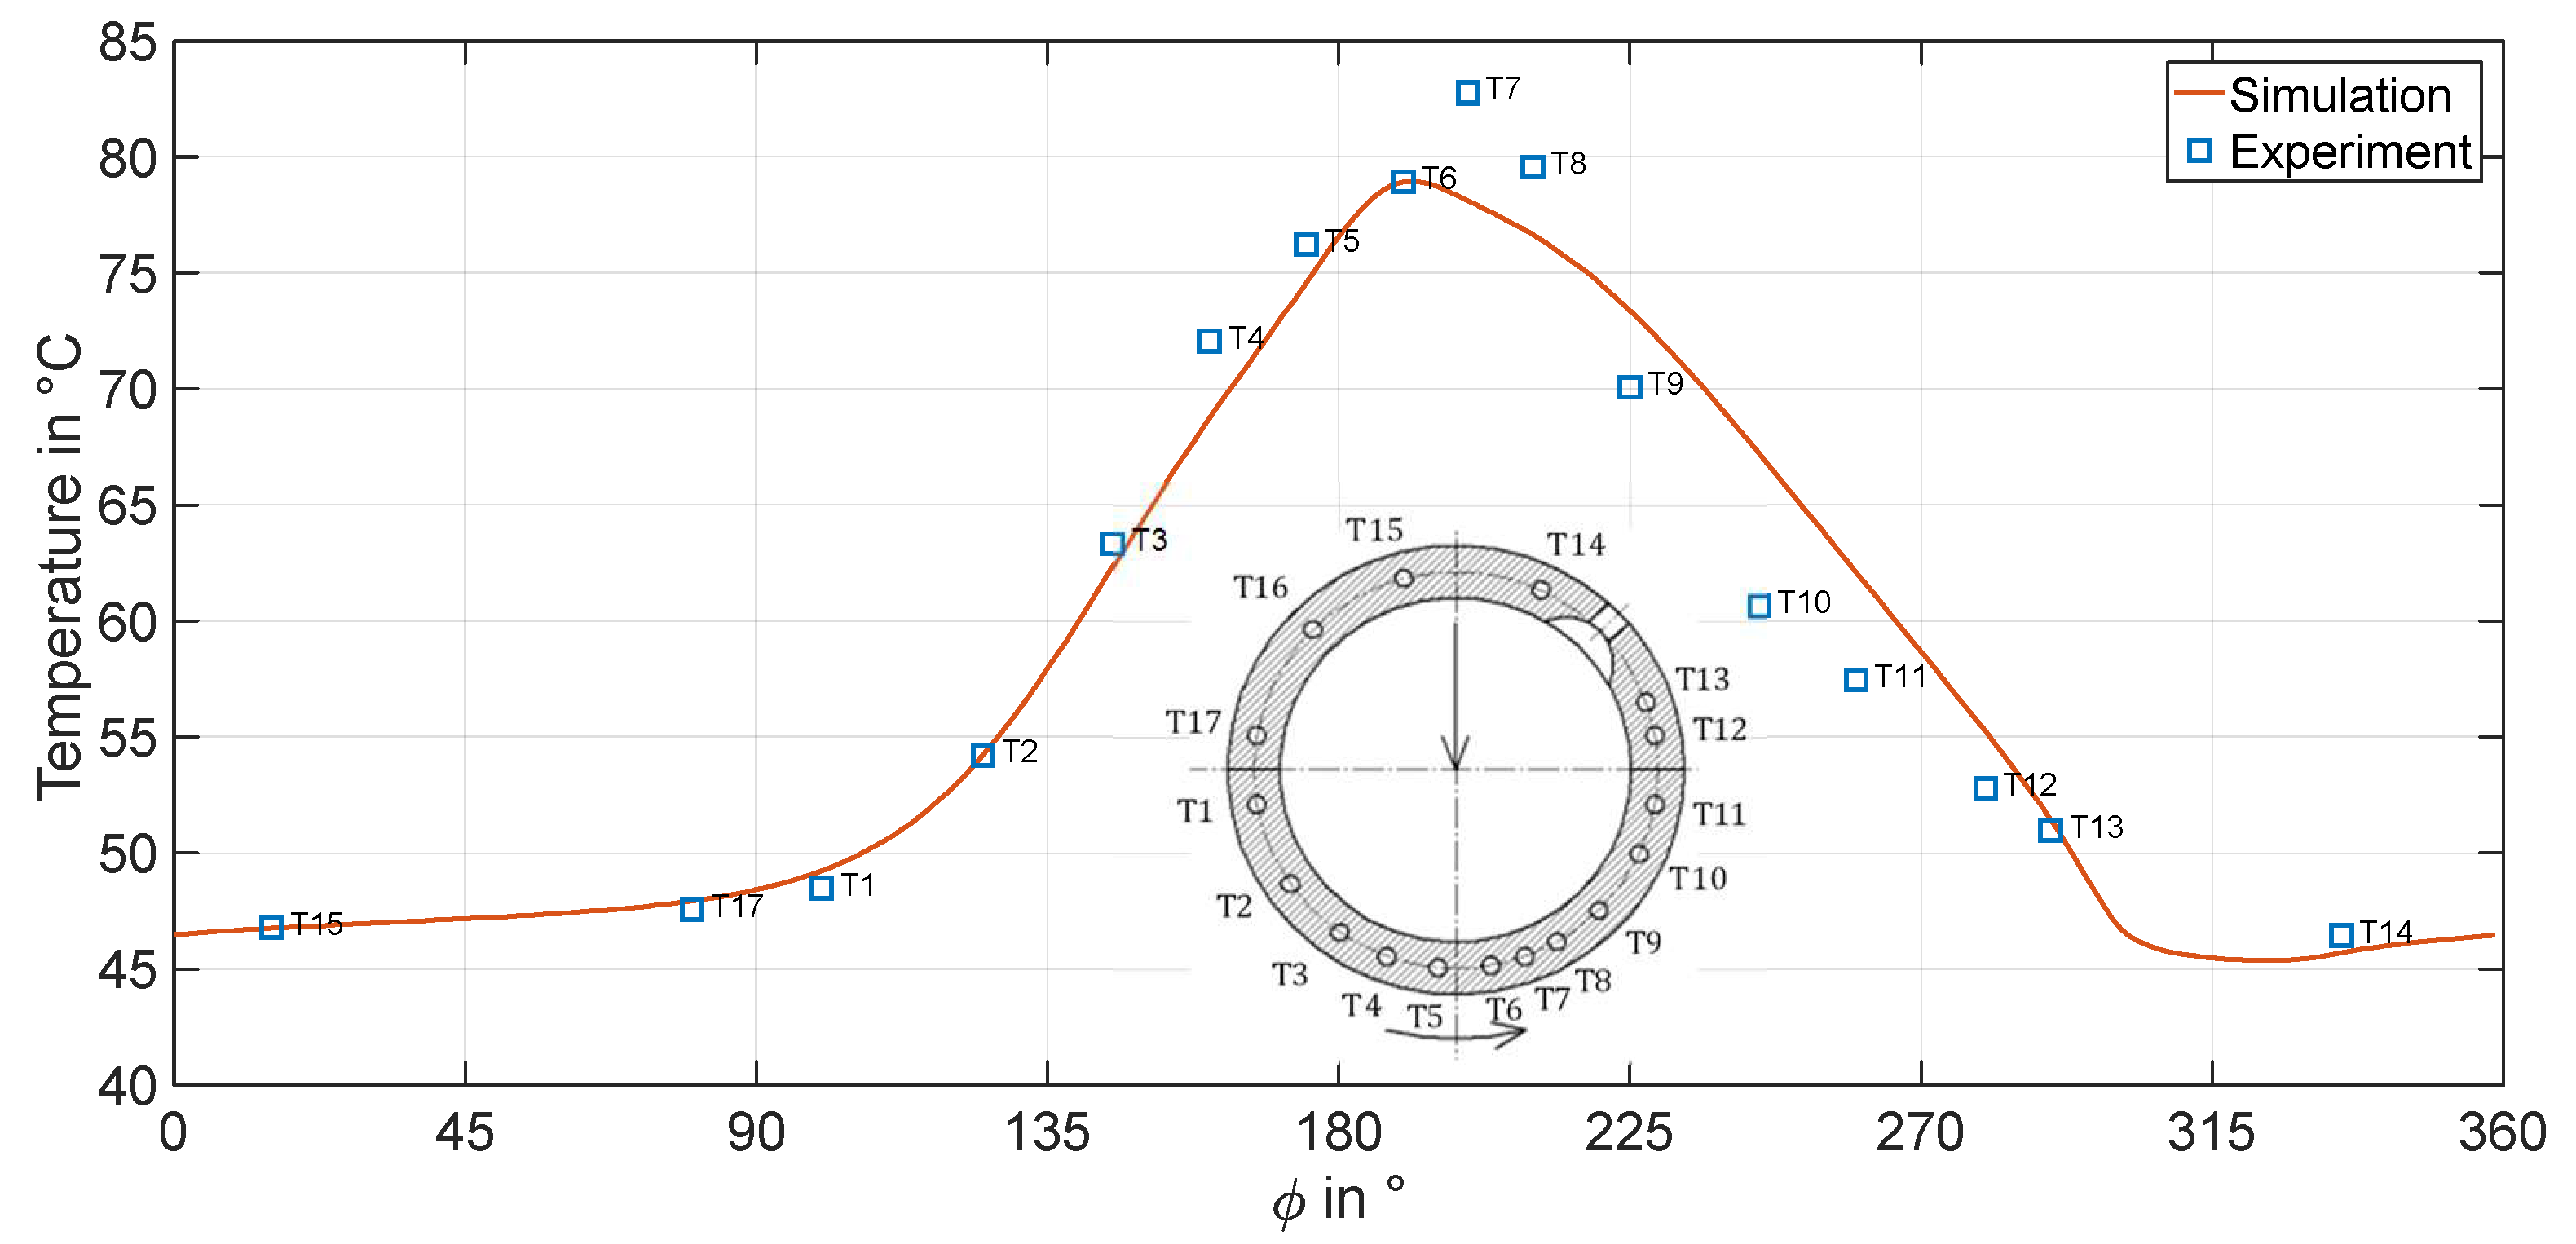
4.1. Validation for Operation in Hydrodynamic Lubrication Regime

Experiments were conducted at rotor speed of 4000 rpm, and specific loads between 0.5 and 3.5 MPa. Under these operating conditions the contact voltage was 0 V, and the bearing was reliably operating in the hydrodynamic lubrication regime (Figure 1). Temperature measurements were used to validate the theoretical model for this application. All predicted three dimensional temperature distributions were evaluated on the radius corresponding to the location of temperature probes and their axial position in the bearing. For the subsequent prediction, a heat convection coefficient of 50 W/(m2K) was assumed for all free surfaces of the bearing model. Furthermore, the ambient temperature was equal to the room temperature of approximately 20 °C in case of the bearing and housing, and 40 °C for the rotating shaft. Figure 6 presents a comparison of experimental and numerical results for the bearing for a specific load of pq = 0.8 MPa. Basically, measurement and simulation showed good agreement. Whereas the magnitude of the single thermocouples could be predicted with good accuracy, the whole curve had shifted slightly in circumferential direction. More comprehensive validation data with a higher span of specific mechanical load were measured for bearing B. Figure 7 includes measured and predicted results for bearing B operating at pq = 3.5 MPa. Deviations were observed at the maximum temperature as well as in the range behind the temperature maximum in rotating direction.
The maximum temperatures at the sensor positions in Figure 8 tend to deflect with increasing loads while they match very well for lower ones.
In general, good agreement was reached within the investigated operating range. However, there were some uncertainties that had to be considered. Local deformation of the sliding surface was neglected, though, it might be of impact as Young’s modulus of the brass bearing was comparably low and its thickness of 15 mm was high. Additionally, the thermal coefficient of linear expansion was higher than the one of the steel housing and, therefore, deviations had to be expected especially with increasing loads as shown in Figure 8. Furthermore, misalignment in different space directions cannot be completely excluded as less proximity probes and load cells were applied.
Further validations of the code for steady-state operating conditions in the hydrodynamic lubrication regime including comparisons of local pressures, film thickness, and temperatures for different types of journal bearings can be found in [19,20,21,30,31].

4.2. Effects of Transient Run-Ups

Due to slight damage of the rolling element support bearings, frictional moments varied undetermined for tests with bearing B. Consequently, no reliable run-up investigations on friction could be performed for this variant and, therefore, all consecutively presented results were related to bearing A, which were conducted before the issue on the support bearings occurred. In a first step, a slow start-up, characterized by a small acceleration from 100 rpm to nominal speed was executed. In the predictions, all initial body temperatures were set equal to the lubricant supply temperature. The development of four temperatures over time is shown in Figure 9.
Generally, the calculated temperature evolution was in good agreement with the measured temperatures. Small deviations were explainable with fluctuations in experimental conditions such as lubricant supply and ambient temperatures, rotating speed, load or misalignment. Predicted temperatures in the low speed range were notably higher then measured ones. The increase of temperature was a result of the additional dissipation that occured in the contact area during mixed lubrication. The measurements did not show the same behavior, because the electrical motor was not able to ensure a constant rotation at low rotating speed. Thus, the calculation started at 10 rpm whereas the experiments were run at a minimum speed of 200 rpm. For future experiments an additional gear will be arranged to ensure a robust and reproducible operation at low speeds.
As expected, the final temperatures of slow and rapid start-up presented in Figure 10 were nearly identical for both the simulation and experiment. The theoretical and experimental results were similar in the case of rapid start-up. The duration until a stationary temperature profile was reached varied. These differences in temperature were mainly caused by the test bearing housing, that slowed down the heating process because of its thermal inertia.
Finally, the experimental Stribeck curves were determined. In advance, the test rig was driven without journal bearing to obtain the friction moment of the two support bearings Msb. During all experiments the temperatures in the two rolling bearings were monitored. In case of the rapid run-ups, the inertia moments Min of all accelerated components had to be subtracted from the measured ones. The mass inertia for most components could be determined from CAD-models and checked with the measured torsion moment over time (Figure 11).
It was challenging for the test rig to ensure a constant rotation at low speeds. Consequently, at the current operating conditions, the integral PID controller adjusted the speed effects overshoots of torsional moment because of its I-component. These fluctuations between 0 and 2 s had to be filtered, before the friction coefficient was calculated. The average computed inertia moment was 18.31 Nm and was therefore of the same scale as the torsional moments in Figure 11. In the first twenty seconds of the experiment, the torsional moment in rolling bearings increased linearly with speed and remained nearly constant afterwards.
The investigated friction coefficient µ was calculated with the ratio of friction force FR and normal force FN.
μ = F R F N = M tot     M sb     M in F N · 0.5 · d J
The filtered Stribeck curve for the fast start-up is presented in Figure 12.
The simulated and measured results were in good agreement. The deviations in the mixed lubrication regime were caused by the electrical engine and the fluctuation of rotational speed. The contact voltage indicated a transition from mixed lubrication to hydrodynamic lubrication at 300 rpm when the contact voltage rapidly decreased. It still lasted until 1000 rpm until the contact voltage became zero. The curve of ideal contact voltage separated the mixed and hydrodynamic lubrication regimes. One cause was the time delay of the capacitor in the contact voltage measurement. Furthermore, a misalignment between journal and bearing during a fast acceleration can effect small voltage magnitudes. The use of a transmission in the test rig setup and a slower start-up time enabled better experimental results in mixed lubrication regime. The measured and simulated Stribeck curves for the slow run-up are plotted in Figure 13.
In this case, theoretical and experimental results were nearly identical, because the changes in speed were slower and the controller had more time to react. By evaluating the contact voltage a transition speed of about 220 rpm was determined, according to the ideal contact voltage in Figure 11. Although this rotation speed was more realistic than for the fast run-up, it was appreciably higher than the simulation results (Table 3). This circumstance was also explainable with the uneven rotation of shaft that hampered a formed lubrication film in the load zone. Moreover, during slow run-up, the fluid and the components had enough time to heat up, viscosity decreases, and consequently, a lower friction coefficient was calculated.
Measurement and prediction concordantly showed higher transition speeds for the fast run-up, however, at different speed levels. The thermal inertia influences causing this effect could hardly be assigned to single components, but were rather a response of the entire system and all interactions.

5. Conclusions

In the first step, the bearing code was validated with test data for the hydrodynamic lubrication regime. The experimental investigations carried out, confirmed predictions in terms of temperature evolution of the fluid film. A transient energy equation and a mixed lubrication model further extended the calculation software. The inertia of temperature distribution in the bearing mainly caused by storage effects of the solid bodies was investigated for different run-up speeds. While the results nearly matched quasi-static ones for slow run-ups, significant delays of heating up were observed for fast start-up procedures. In practical applications, this effect should be of high relevance especially for turbomachinery applications, as not only temperatures but also clearances change in comparison to quasi-static predictions. Therefore, the dynamic properties of the bearing change and vibrational levels as well as eigenfrequencies were modified. An additional result, which is not presented in detail here, was that predictions of heat flow within run-up strongly depend on the boundaries of the model. Consequently, uncertainties were present within predictions as the rotor was reduced to a shaft limited at the lateral bearing ends and a simple hollow cylinder model of the complex bearing housing. Stribeck curves presented for different start-up times showed that the code was able to predict characteristics of transition between mixed lubrication and hydrodynamic lubrication regimes in good agreement with measurement data. However, absolute values showed differences that indicated the necessity of further improvements not only of the theoretical model but also of the experimental procedure. For future studies, the test rig has to be upgraded by using a gear in the drivetrain to produce more reliable results in mixed lubrication regime. This is a basis to investigate additional wear phenomena during transient operating conditions in detail.

Author Contributions

Conceptualization, M.P. and T.H.; Methodology, M.P.; Software, T.H. and M.P.; Validation, M.P.; Formal Analysis, M.P.; Theoretical Investigation M.P.; Experimental Investigation, P.Z. and P.W.; Resources, H.S.; Data Curation, M.P.; Writing-Original Draft Preparation, M.P.; Writing-Review & Editing, T.H. and H.S.; Visualization, M.P.; Supervision, H.S.; Project Administration, T.H.

Funding

This research received no external funding.

Conflicts of Interest

The authors declare no conflict of interest.

Nomenclature

cSpecific heat capacity (J/(kg K))
ccStiffness of asperities in contact (N/mm)
chydStiffness of fluid film (N/mm)
ctotAggregate stiffness (N/mm)
dJDiameter of journal (mm)
hFilm thickness (μm)
hcrCritical film thickness (μm)
EredCombined Young’s modulus (GPa)
FExternal load (kN)
F0Correction Factor (m/(Pa s)
F1,Correction Factor (m2/(Pa s)
F2Viscosity Correction Factor (m3/(Pa s)
FRFriction force (N)
FNNormal force (N)
Kx, KzTurbulence correction factors
MsbTorsional moment of support bearings (Nm)
MinInertia moment of drivetrain (Nm)
MtotMeasured moment of drivetrain (Nm)
nRotational speed (rpm)
ncrCritical rotational speed (rpm)
pcSolid contact pressure (bar)
phydHydrodynamic pressure (bar)
ptotAggregate Pressure (bar)
q ˙ B Conductive heat flow in bearing (W/m2)
q ˙ F Convective heat flow in fluid (W/m2)
q ˙ J Conductive heat flow in journal (W/m2)
q ˙ R , c Dissipated energy of boundary friction (W/m2)
q ˙ R , hyd Dissipated energy of fluid (W/m2)
RqRoot mean square roughness (μm)
tTime (s)
TTemperature (°C)
TenEntrance temperature (°C)
uRelative velocity (m/s)
welElastic deformation (μm)
γ ˙ Shear strain (1/s)
ηDynamic viscosity (Pa·s)
λHeat conductivity (W/(m K))
μFriction Coefficient
νPoisson ratio
ρDensity (kg/m3)
τhydShear stress in fluid (Pa)
ΦDissipation (W/m3)
ϕ x p Pressure flow factor x-direction
ϕ z p Pressure flow factor z-direction
ϕ x s Shear flow factor x-direction

References

  1. Khonsari, M.M.; Wang, S.H. Notes on transient THD effects in a lubricating film. Tribol. Trans. 1992, 35, 177–183. [Google Scholar] [CrossRef]
  2. Paranjpe, R.S.; Han, T. A Study of the Thermohydrodynamic Performance of Steadily Loaded Journal Bearings. Tribol. Trans. 1994, 37, 679–690. [Google Scholar] [CrossRef]
  3. Kucinschi, B.R.; Fillon, M.; Frene, J.; Pascovici, M.D. A transient thermoelastohydrodynamic study of steadily loaded plain journal bearings using finite element method analysis. J. Tribol. 2000, 122, 219–226. [Google Scholar] [CrossRef]
  4. Akbarzadeh, S.; Khonsari, M.M. Effect of surface pattern on stribeck curve. Tribol. Lett. 2010, 37, 477–486. [Google Scholar] [CrossRef]
  5. Adatepe, H.; Bıyıklıoglu, A.; Sofuoglu, H. An experimental investigation on frictional behavior of statically loaded micro-grooved journal bearing. Tribol. Int. 2011, 44, 1942–1948. [Google Scholar] [CrossRef]
  6. Boussinesq, J. Application des potentiels à l’étude de l’équilibre et du mouvement des solides élastiques: Principalement au calcul des déformations et des pressions que produisent, dans ces solides, des efforts quelconques exercés sur une petite partie de leur surface ou de leur intérieur: Mémoire suivi de notes étendues sur divers points de physique, mathematique et d’analyse; Gauthier-Villars: Paris, France, 1885; Volume 4. [Google Scholar]
  7. Greenwood, J.A.; Williamson, J.P. Contact of nominally flat surfaces. Proc. R. Soc. Lond. A 1966, 295, 300–319. [Google Scholar] [CrossRef]
  8. Greenwood, J.A.; Tripp, J.H. The contact of two nominally flat rough surfaces. Proc. Inst. Mech. Eng. 1970, 185, 625–633. [Google Scholar] [CrossRef]
  9. Hu, Y.; Cheng, H.S.; Arai, T.; Kobayashi, Y.; Aoyama, S. Numerical simulation of piston ring in mixed lubrication—A nonaxisymmetrical analysis. J. Tribol. 1994, 116, 470–478. [Google Scholar] [CrossRef]
  10. Panayi, A.P.; Schock, H.J. Approximation of the integral of the asperity height distribution for the Greenwood—Tripp asperity contact model. Proc. Inst. Mech. Eng. 2008, 222, 165–169. [Google Scholar] [CrossRef]
  11. Teodorescu, M.; Taraza, D.; Henein, N.A.; Bryzik, W. Simplified Elasto-Hydrodynamic Friction Model of the Cam-Tappet Contact; SAE Technical Paper No. 2003-01-0985; SAE International: Warrendale, PA, USA, 2003. [Google Scholar]
  12. Pogačnik, A.; Kalin, M. How to determine the number of asperity peaks, their radii and their heights for engineering surfaces: A critical appraisal. Wear 2013, 300, 143–154. [Google Scholar] [CrossRef]
  13. Choi, J.; Kim, S.S.; Rhim, S.S.; Choi, J.H. Numerical modeling of journal bearing considering both elastohydrodynamic lubrication and multi-flexible-body dynamics. Int. J. Automot. Technol. 2012, 13, 255–261. [Google Scholar] [CrossRef]
  14. Offner, G. Modelling of condensed flexible bodies considering non-linear inertia effects resulting from gross motions. Proc. Inst. Mech. Eng. 2011, 225, 204–219. [Google Scholar] [CrossRef]
  15. Cubillo, A.; Uriondo, A.; Perinpanayagam, S. Computational Mixed TEHL Model and Stribeck Curve of a Journal Bearing. Tribol. Trans. 2017, 60, 1053–1062. [Google Scholar] [CrossRef]
  16. Lu, X.; Khonsari, M.M.; Gelinck, E.R. The Stribeck curve: Experimental results and theoretical prediction. J. Tribol. 2006, 128, 789–794. [Google Scholar] [CrossRef]
  17. Sander, D.E.; Allmaier, H.; Priebsch, H.H.; Witt, M.; Skiadas, A. Simulation of journal bearing friction in severe mixed lubrication–Validation and effect of surface smoothing due to running-in. Tribol. Int. 2016, 96, 173–183. [Google Scholar] [CrossRef]
  18. Patankar, S. Numerical Heat Transfer and Fluid Flow; Taylor & Francis: Boca Raton, FL, USA, 1980; ISBN 978-0-89116-522-4. [Google Scholar]
  19. Hagemann, T.; Schwarze, H. A model for oil flow and fluid temperature inlet mixing in hydrodynamic journal bearings. ASME J. Tribol. 2019, 141, 021701. [Google Scholar] [CrossRef]
  20. Hagemann, T. Ölzuführungseinfluss bei Schnell Laufenden und Hoch Belasteten Radial-Gleitlagern unter Berücksichtigung des Lagerdeformationsverhaltens. Ph.D. Thesis, TU Clausthal, Lower Saxony, Germany, 2011. [Google Scholar]
  21. Hagemann, T.; Kukla, S.; Schwarze, H. Measurement and prediction of the static operating conditions of a large turbine tilting-pad bearing under high circumferential speeds and heavy loads. In Proceedings of the ASME Turbo Expo 2013: Turbine Technical Conference and Exposition, San Antonio, TX, USA, 3–7 June 2013. ASME Paper No. GT2013-95004. [Google Scholar]
  22. Patir, N.; Cheng, H.S. An average flow model for determining effects of three-dimensional roughness on partial hydrodynamic lubrication. J. Lubr. Technol. 1978, 100, 12–17. [Google Scholar] [CrossRef]
  23. Patir, N.; Cheng, H.S. Application of average flow model to lubrication between rough sliding surfaces. J. Lubr. Technol. 1979, 101, 220–229. [Google Scholar] [CrossRef]
  24. Dowson, D. A Generalized Reynolds Equation for Fluid Film Lubrication. Int. J. Mech. Sci. 1962, 4, 159–170. [Google Scholar] [CrossRef]
  25. Constantinescu, V.N.; Galetuse, S.; Kennedy, F. On the comparison between lubricant theory, including turbulence and inertia forces, and some existing experimental data. ASME J. Lubr. Technol. 1975, 97, 439–449. [Google Scholar] [CrossRef]
  26. Elrod, H.G. A cavitation algorithm. J. Lubr. Technol. 1981, 103, 350–354. [Google Scholar] [CrossRef]
  27. McCool, J.I. Comparison of models for the contact of rough surfaces. Wear 1986, 107, 37–60. [Google Scholar] [CrossRef]
  28. Rempke, A. Numerische Optimierung Eines Deterministischen Kontaktmodells zur Berech-nung Reibungsbehafteter Festkörperkontakte auf großen Berechnungsgittern unter Einsatz der DC-FFT Technik. Bachelor Thesis, TU-Clausthal, Lower Saxony, Germany, 2008. [Google Scholar]
  29. Mittwollen, N. Betriebsverhalten von Radialgleitlagern bei hohen Umfangsgeschwindigkei-ten und hohen Thermischen Belastungen—Theoretische Untersuchungen; VDI Series 1, No. 187; VDI-Verlag: Dusseldorf, Germany, 1990. [Google Scholar]
  30. Hagemann, T.; Schwarze, H. Theoretical and experimental analyses of directly lubricated tilting-pad journal bearings with leading edge groove. ASME J. Eng. Gas Turb. Power 2018. [Google Scholar] [CrossRef]
  31. Hagemann, T.; Zeh, C.; Prölß, M.; Schwarze, H. The impact of convective fluid inertia forces on operation of tilting-pad journal bearings. Int. J. Rotat. Mach. 2017, 2017. [Google Scholar] [CrossRef]
Figure 1. Stribeck curve with different lubrication regimes.
Lubricants 06 00105 g001
Figure 2. Measured surface of bearing.
Lubricants 06 00105 g002
Figure 3. (a) Flow factors over film thickness; and (b) solid contact pressure over film thickness.
Lubricants 06 00105 g003
Figure 4. Simplified flow chart of a transient simulation.
Lubricants 06 00105 g004
Figure 5. Side view of the test rig construction.
Lubricants 06 00105 g005
Figure 6. Local temperature—bearing A, operating point: F = 4 kN, n = 4000 rpm, Ten = 30 °C.
Lubricants 06 00105 g006
Figure 7. Local temperature—bearing B, operating point: F = 17.5 kN, n = 4000 rpm, Ten = 45 °C.
Lubricants 06 00105 g007
Figure 8. Maximum sensor temperatures—bearing B, operating point: n = 4000 rpm, Ten = 45 °C.
Lubricants 06 00105 g008
Figure 9. Development of temperature at different circumferential locations (slow start-up), stationary operating point: F = 4 kN, n = 4000 rpm, Ten = 30 °C.
Lubricants 06 00105 g009
Figure 10. Development of temperature at different circumferential locations (fast run-up), stationary operating point: F = 4 kN, n = 4000 rpm, Ten = 30 °C.
Lubricants 06 00105 g010
Figure 11. Development of torsional moments during fast run-up, stationary operating point: F = 4 kN, n = 4000 rpm, Ten = 30 °C.
Lubricants 06 00105 g011
Figure 12. Stribeck curve of fast run-up, stationary operating point: F = 4 kN, n = 4000 rpm, Ten = 30 °C.
Lubricants 06 00105 g012
Figure 13. Stribeck curve of slow run-up, stationary operating point: F = 4 kN, n = 4000 rpm, Ten = 30 °C.
Lubricants 06 00105 g013
Table 1. Test bearing and boundary conditions.
BearingCase ACase BSchematic Drawing
Shaft diameter100 mm Lubricants 06 00105 i001
Bearing outer diameter130 mm
Relative radial clearance1.6‰3.2‰
Bearing width50 mm
Supply groove width40 mm
Supply groove length26 mm
Supply temperature30 °C45 °C
Supply pressure2 bar
Speed range0–4000 rpm
Load4 kN5–17.5 kN
Table 2. Material data of the test rig components and lubricant.
PropertyLubricantBearingJournalContainer
MaterialISOVG 32CuSn7Zn4Pb742CrMo442CrMo4
Density853 kg/m38830 kg/m37720 kg/m37720 kg/m3
Specific heat capacity2090 J/(kg·K)−1380 J/(kg·K)−1470 J/(kg·K)−1470 J/(kg·K)−1
Heat conductivity0.134 W/(m·K)68 W/(m·K)42.6 W/(m·K)42.6 W/(m·K)
Thermal expansion coefficient-18 × 10−6 K−111 × 10−6 K−111 × 10−6 K−1
Elasticity modulus-101 GPa210 GPa210 GPa
Table 3. Summary of Stribeck curves.
Rapid Run-UpSlow Run-Up
SimulationExperimentSimulationExperiment
Transition speed103 rpm~300 rpm94 rpm~220 rpm
Final friction coefficient0.0240.0280.0160.018
Speed of minimum friction coefficient95 rpm205 rpm90 rpm173 rpm
Minimum friction coefficient0.00210.00150.00240.0036

