


Abstract
To address the complex and highly variable wheel–rail adhesion behavior on high-speed railway curves, this study establishes a numerical wheel–rail rolling contact model based on starved elastohydrodynamic lubrication (EHL) theory and Herschel–Bulkley rheological characteristics. The model validation yielded RMSE = 0.0228, MAE = 0.0217, MAPE = 11.80%, R2 = 0.828, and a 95% confidence interval of the mean residual of −0.0298 to −0.0136. The study focuses on the initial operational phase after application, systematically quantifying the fluid-dynamic regulation mechanisms of water-based friction modifiers once a thin, starved lubricating film has been formed on the rail surface under curving conditions. By analyzing rail profiles (CHN60 and CHN60N), operating parameters, and track geometry, this study shows how adhesion behavior on curved track sections is governed by the coupled effects of contact mechanics and lubrication. As the outer rail superelevation increases from 0 to 70 mm, the adhesion coefficient decreases by approximately 15–25%, mainly because the reduced normal force shifts the wheel–rail interface toward the Stribeck transition regime. Increasing axle load from 14 t to 30 t reduces the dimensionless film thickness, but the enlarged contact area contributes to a more stable adhesion level, with an increase of about 12%. Compared with the CHN60 profile, the CHN60N profile exhibits better geometric conformity, producing a lubricating film that is 10–15% thicker and leading to a lower and more stable adhesion coefficient, decreasing from approximately 0.35 to 0.1. The results also identify a critical lateral displacement of around −4 mm, beyond which the contact radius becomes stable and the adhesion coefficient reaches a minimum plateau. These findings clarify the competing effects of fluid entrainment and metallic asperity contact, and provide quantitative guidance for friction management and friction modifier application on curved track sections.
1. Introduction
During train operation, wheel–rail adhesion directly influences traction and braking performance. When the available adhesion coefficient of the wheel–rail rolling contact is excessively high, it can easily lead to issues such as wheel flat, rail corrugation, and accelerated wear [1,2,3]. Particularly in curved track sections, wheel–rail adhesion behavior becomes more complex due to the presence of the attack angle and increased lateral creepage. As a train traverses a curve, changes in the curve radius significantly affect the adhesion coefficient; specifically, as the curve radius decreases and the attack angle increases, the longitudinal adhesion coefficient declines. Such variations in adhesion characteristics not only impair operational efficiency but also potentially induce abnormal wheel–rail wear and squeal noise, thereby severely compromising the service life of components and passenger comfort. Therefore, an in-depth study of wheel–rail adhesion behavior and its regulation mechanisms under curved-track conditions is of significant theoretical importance and engineering value.
Wheel–rail adhesion characteristics are influenced by a combination of factors, primarily including operational parameters (e.g., speed, axle load, creepage, and curve radius), contact interface conditions (e.g., third-body media such as water, oil, and leaves), and contact parameters (e.g., surface roughness, wheel diameter, and geometric profiles) [4]. Studies have shown that the adhesion coefficient gradually decreases as the train operating speed increases; similarly, an increase in axle load leads to a slight reduction in the adhesion coefficient [5]. During curve negotiation, the wheelset experiences lateral creepage and yaw motion, which further increases the complexity of the adhesion characteristics. Furthermore, variations in contact interface conditions significantly affect the adhesion coefficient; media such as water, oil, and leaves can mix with wear debris to form a paste-like film, thereby substantially reducing the adhesion coefficient [6,7].
To address the issue of excessively high wheel–rail adhesion coefficients under curved-track conditions, top-of-rail friction modifiers (TORFMs) are widely employed in engineering practice. By being sprayed onto the wheel–rail contact zone, friction modifiers form a thin lubricating film that reduces the interfacial shear strength to achieve adhesion control. This process can regulate the wheel–rail adhesion coefficient to an optimal level (0.3–0.4) while eliminating or mitigating the negative friction characteristics of the adhesion–creep curve [8,9,10]. Depending on the target friction level and application site, friction modifiers are categorized into three types: low-coefficient, intermediate-coefficient, and high-positive-coefficient [11]. Among these, water-based friction modifiers are currently the most widely utilized, achieving friction regulation through the evaporation of water and the subsequent deposition of solid lubricating components [12].
In addition to onboard spraying, TORFMs are also commonly applied by wayside applicators installed before or within curved sections. Both application modes aim to deliver a controlled amount of modifier to the top of rail, but the present model describes the contact response after a thin modifier layer has already reached the wheel–rail interface.
Extensive experimental research on friction modifiers has been conducted by scholars worldwide. Kalousek et al. [13] were the first to discover that friction modifiers can effectively suppress train vibrations. Eadie et al. [14] demonstrated that water-based friction modifiers can reduce overall noise levels in curved track sections, while Egana et al. [15,16] found that they can significantly decrease wheel–rail acceleration levels and delay the development of rail corrugation. Suda et al. [17] developed an onboard friction control system, reporting that spraying the modifier onto the top of the inner rail at curves significantly reduced fluctuations in lateral and tangential forces. Regarding wear control, Hardwick et al. [18] found that applying friction modifiers under heavy-haul conditions could reduce rail wear by 30% to 60%. Galas et al. [12] investigated the roles of water-based friction modifier components in adhesion and film formation, revealing that water evaporation significantly impacts their performance. However, Lundberg et al. [19] pointed out that the actual adhesion coefficient depends largely on the application rate of the friction modifier; excessive application can lead to excessively low friction, thereby resulting in extended braking distances. Furthermore, Rahmani et al. [20] conducted a field study on the carry-over behavior of liquid friction modifiers, observing that an uneven distribution of the modifier along the rail compromises its regulatory effectiveness.
Despite significant progress in the study of friction modifiers, existing research still exhibits notable limitations. First, current studies are predominantly experimental, with relatively limited theoretical analysis; in particular, systematic investigations from the perspective of elastohydrodynamic lubrication remain scarce. Second, because the wheel–rail system operates in an open environment, the amount of friction modifier applied to the rail surface is limited and gradually consumed during train operation. Consequently, the actual contact interface frequently operates under starved lubrication conditions. Under such conditions, the reduced lubricant film thickness may lead to lubrication failure and wheel–rail scuffing [21,22]. However, research concerning wheel–rail adhesion under starved conditions remains limited within the field of elastohydrodynamic lubrication. Furthermore, the mechanisms by which the performance parameters (e.g., viscosity and rheological index) and application parameters (e.g., coating thickness) of friction modifiers influence adhesion performance remain poorly understood. Galas et al. [23] found that an excessive applied dosage does not significantly reduce the adhesion force, suggesting a potentially complex nonlinear relationship between the two. Spikes [24] pointed out that the action mechanisms of friction modifier additives involve the physicochemical properties of the boundary lubrication film, which warrant further in-depth exploration. Additionally, there is a lack of systematic theoretical models addressing the impact of rough wheel–rail surfaces on the lubrication behavior of friction modifiers.
In summary, while existing research has extensively documented the macro-effects of friction modifiers, a significant theoretical gap remains in understanding the micro-hydrodynamic regulation mechanisms under the constrained and highly dynamic conditions of curved tracks. Most current models oversimplify the lubricant supply as fully flooded, failing to account for the starved lubrication state that characterizes open wheel–rail systems. This study bridges this gap by developing a comprehensive numerical framework that integrates starved elastohydrodynamic lubrication (EHL) theory with the non-Newtonian Herschel–Bulkley rheological model. Unlike previous studies, this work explicitly couples complex rail head geometries (CHN60/CHN60N) and track geometric constraints (lateral displacement and superelevation) with the fluid–solid interaction at the contact interface. By quantifying the competing mechanisms between fluid film entrainment and metallic asperity contact, this research provides a novel theoretical basis for the precise application of friction modifiers. It offers, for the first time, a predictive tool to balance traction stability and wear mitigation on small-radius curves, which is of critical importance for the operational safety of high-speed railways.
It should be noted that the action of a water-based friction modifier involves a sequence of transient processes: initial spraying, droplet deposition, spreading across the railhead, partial evaporation of the water carrier, and the final deposition of solid lubricating components to form a functional film. The very early stages of this process are dominated by macroscopic fluid dynamics and heat transfer. However, the present study specifically targets the subsequent initial phase of wheel–rail interaction, immediately following film formation, when the micro-scale fluid dynamics within the concentrated contact zone govern the adhesion behavior. By employing a starved EHL model with non-Newtonian rheology, this work captures the crucial interplay between fluid entrainment, film thickness evolution, and asperity contact that determines the immediate frictional response. This focus provides essential insights into the performance of friction modifiers during their primary function—regulating adhesion in the first few wheel passes after application—while acknowledging that the preceding spray and drying phases are governed by different physical principles.
2. Modelling
2.1. Wheel–Rail Rolling Contact Model
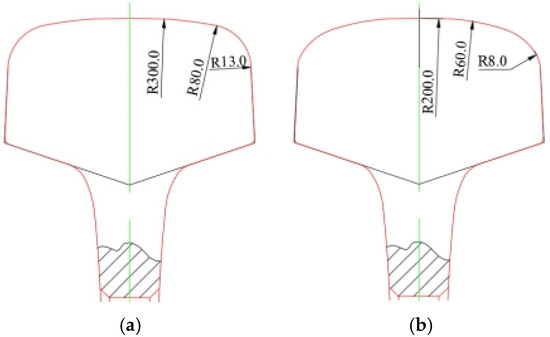
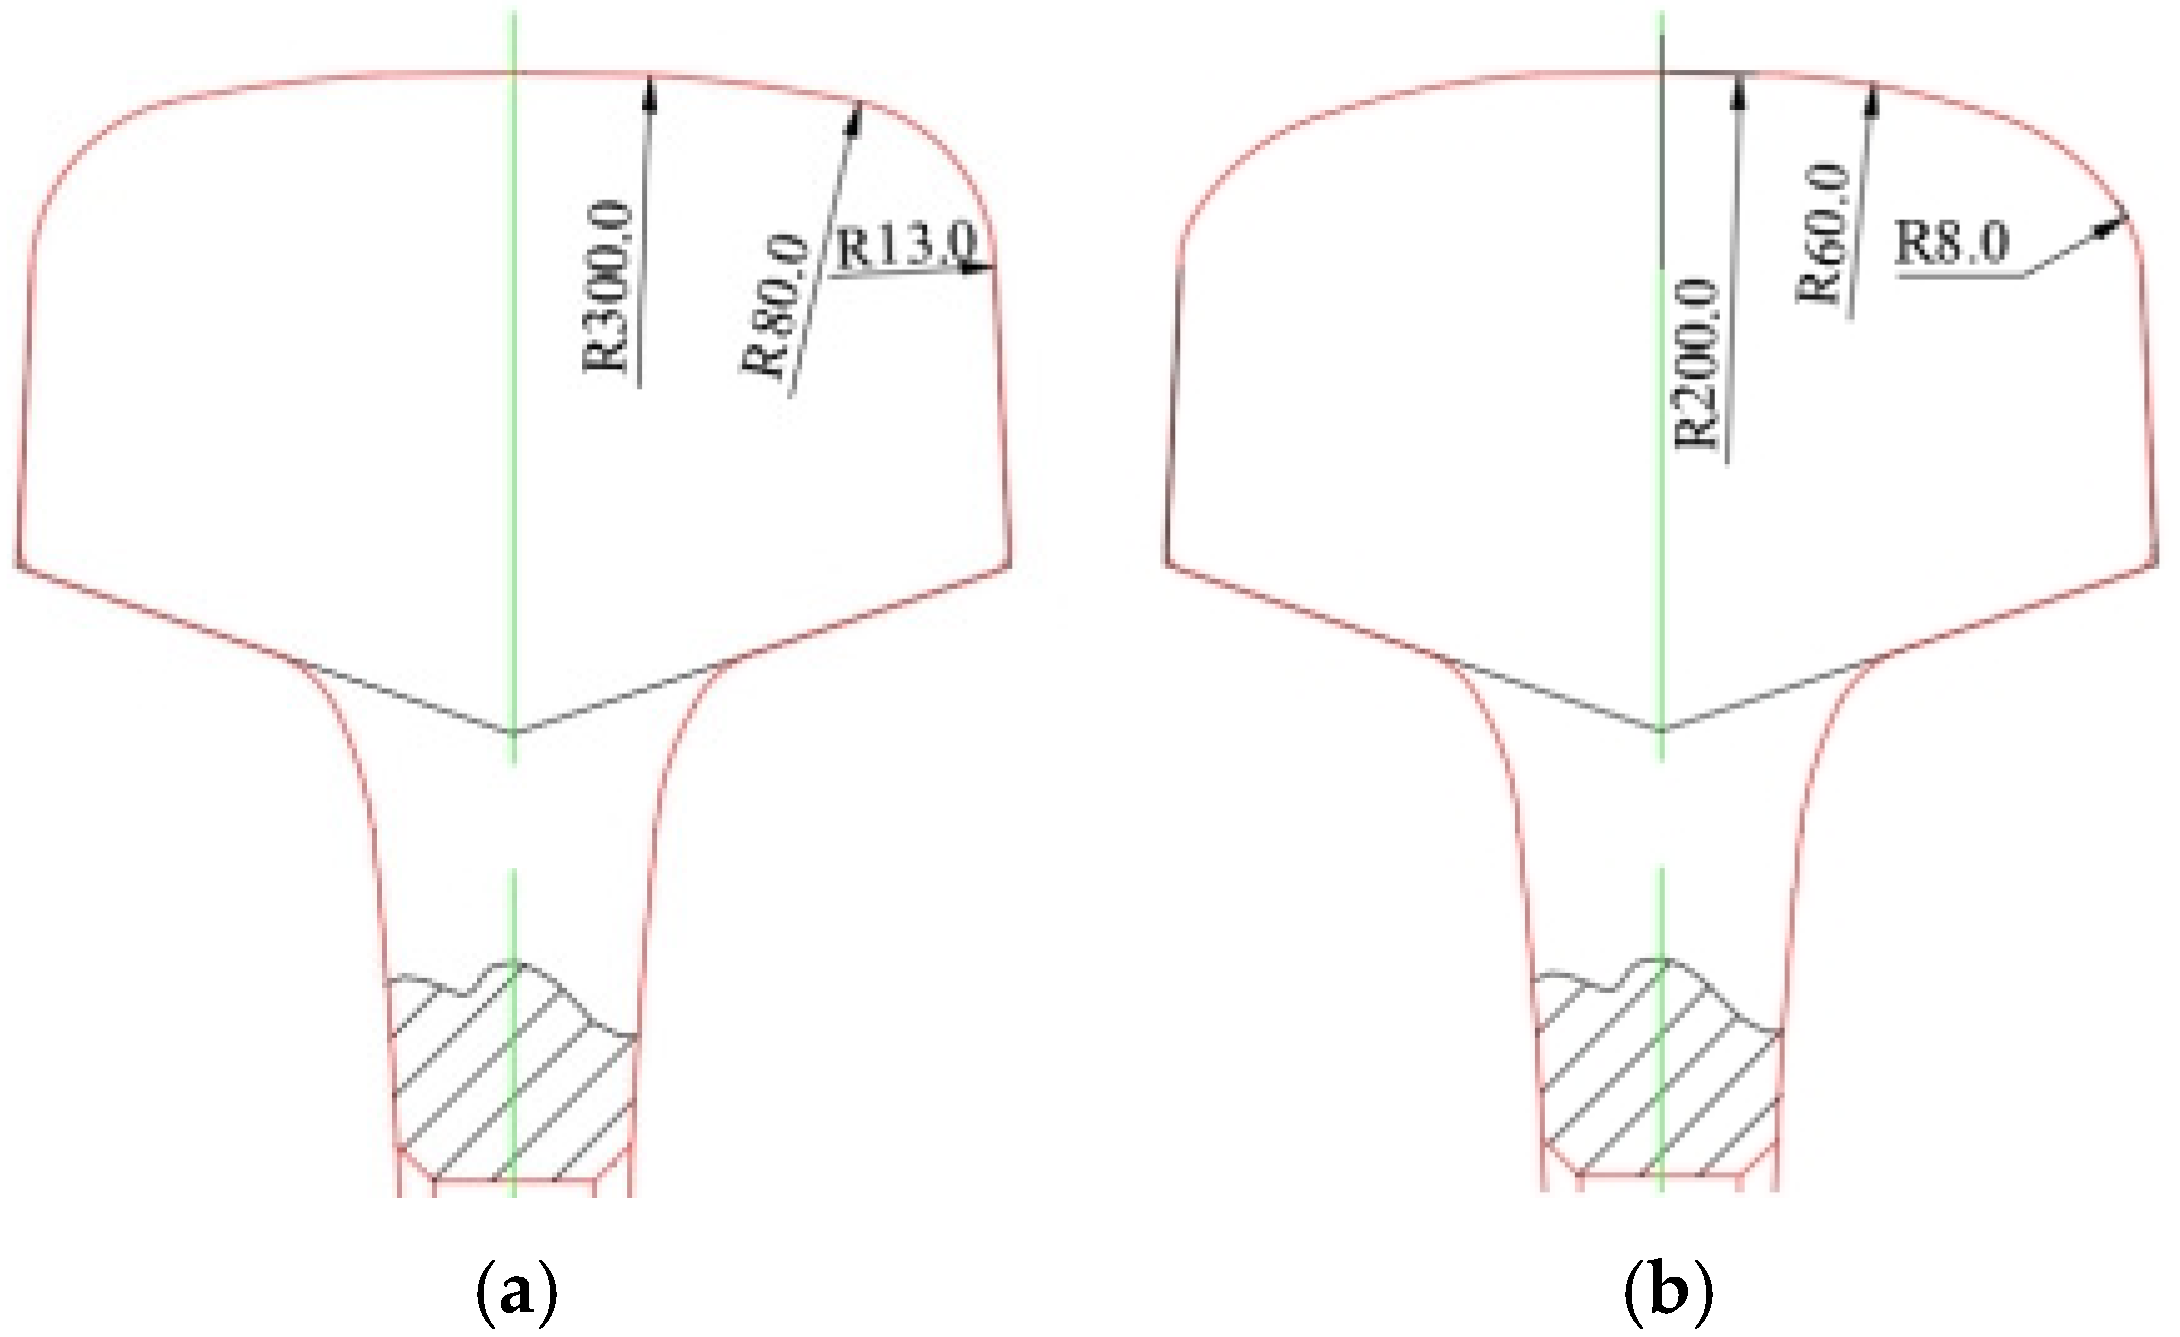
Under wheel–rail operating conditions, the crown contact radius varies among different rail head profiles. Force analysis indicates that this variation affects the rolling contact stress between the wheel and rail. Figure 1 presents the rail head profiles of CHN60 and CHN60N. A comparison shows that the crown contact radii of the two profiles are not the same. When a train negotiates a small-radius curve, different rail head profiles influence the location of the wheel–rail contact point, thereby altering the wheel–rail contact radius. Since the wheel–rail contact radius has a significant effect on lubrication performance in elastohydrodynamic lubrication analysis, it is therefore necessary to investigate the lubrication characteristics of different rail head profiles under the action of friction modifiers.
Figure 1.
Two rail head profiles. (a) Cross-section of CHN60 rail. (b) Cross-section of CHN60N rail.
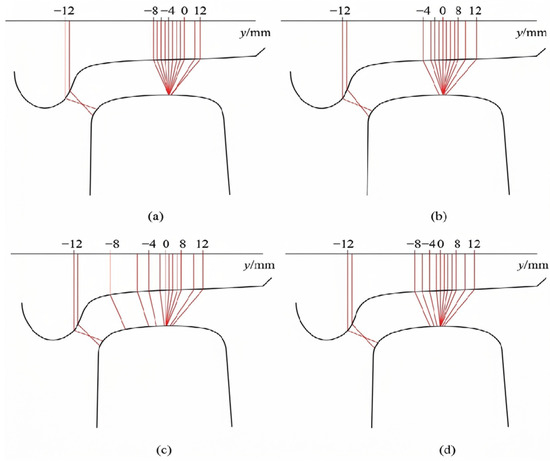
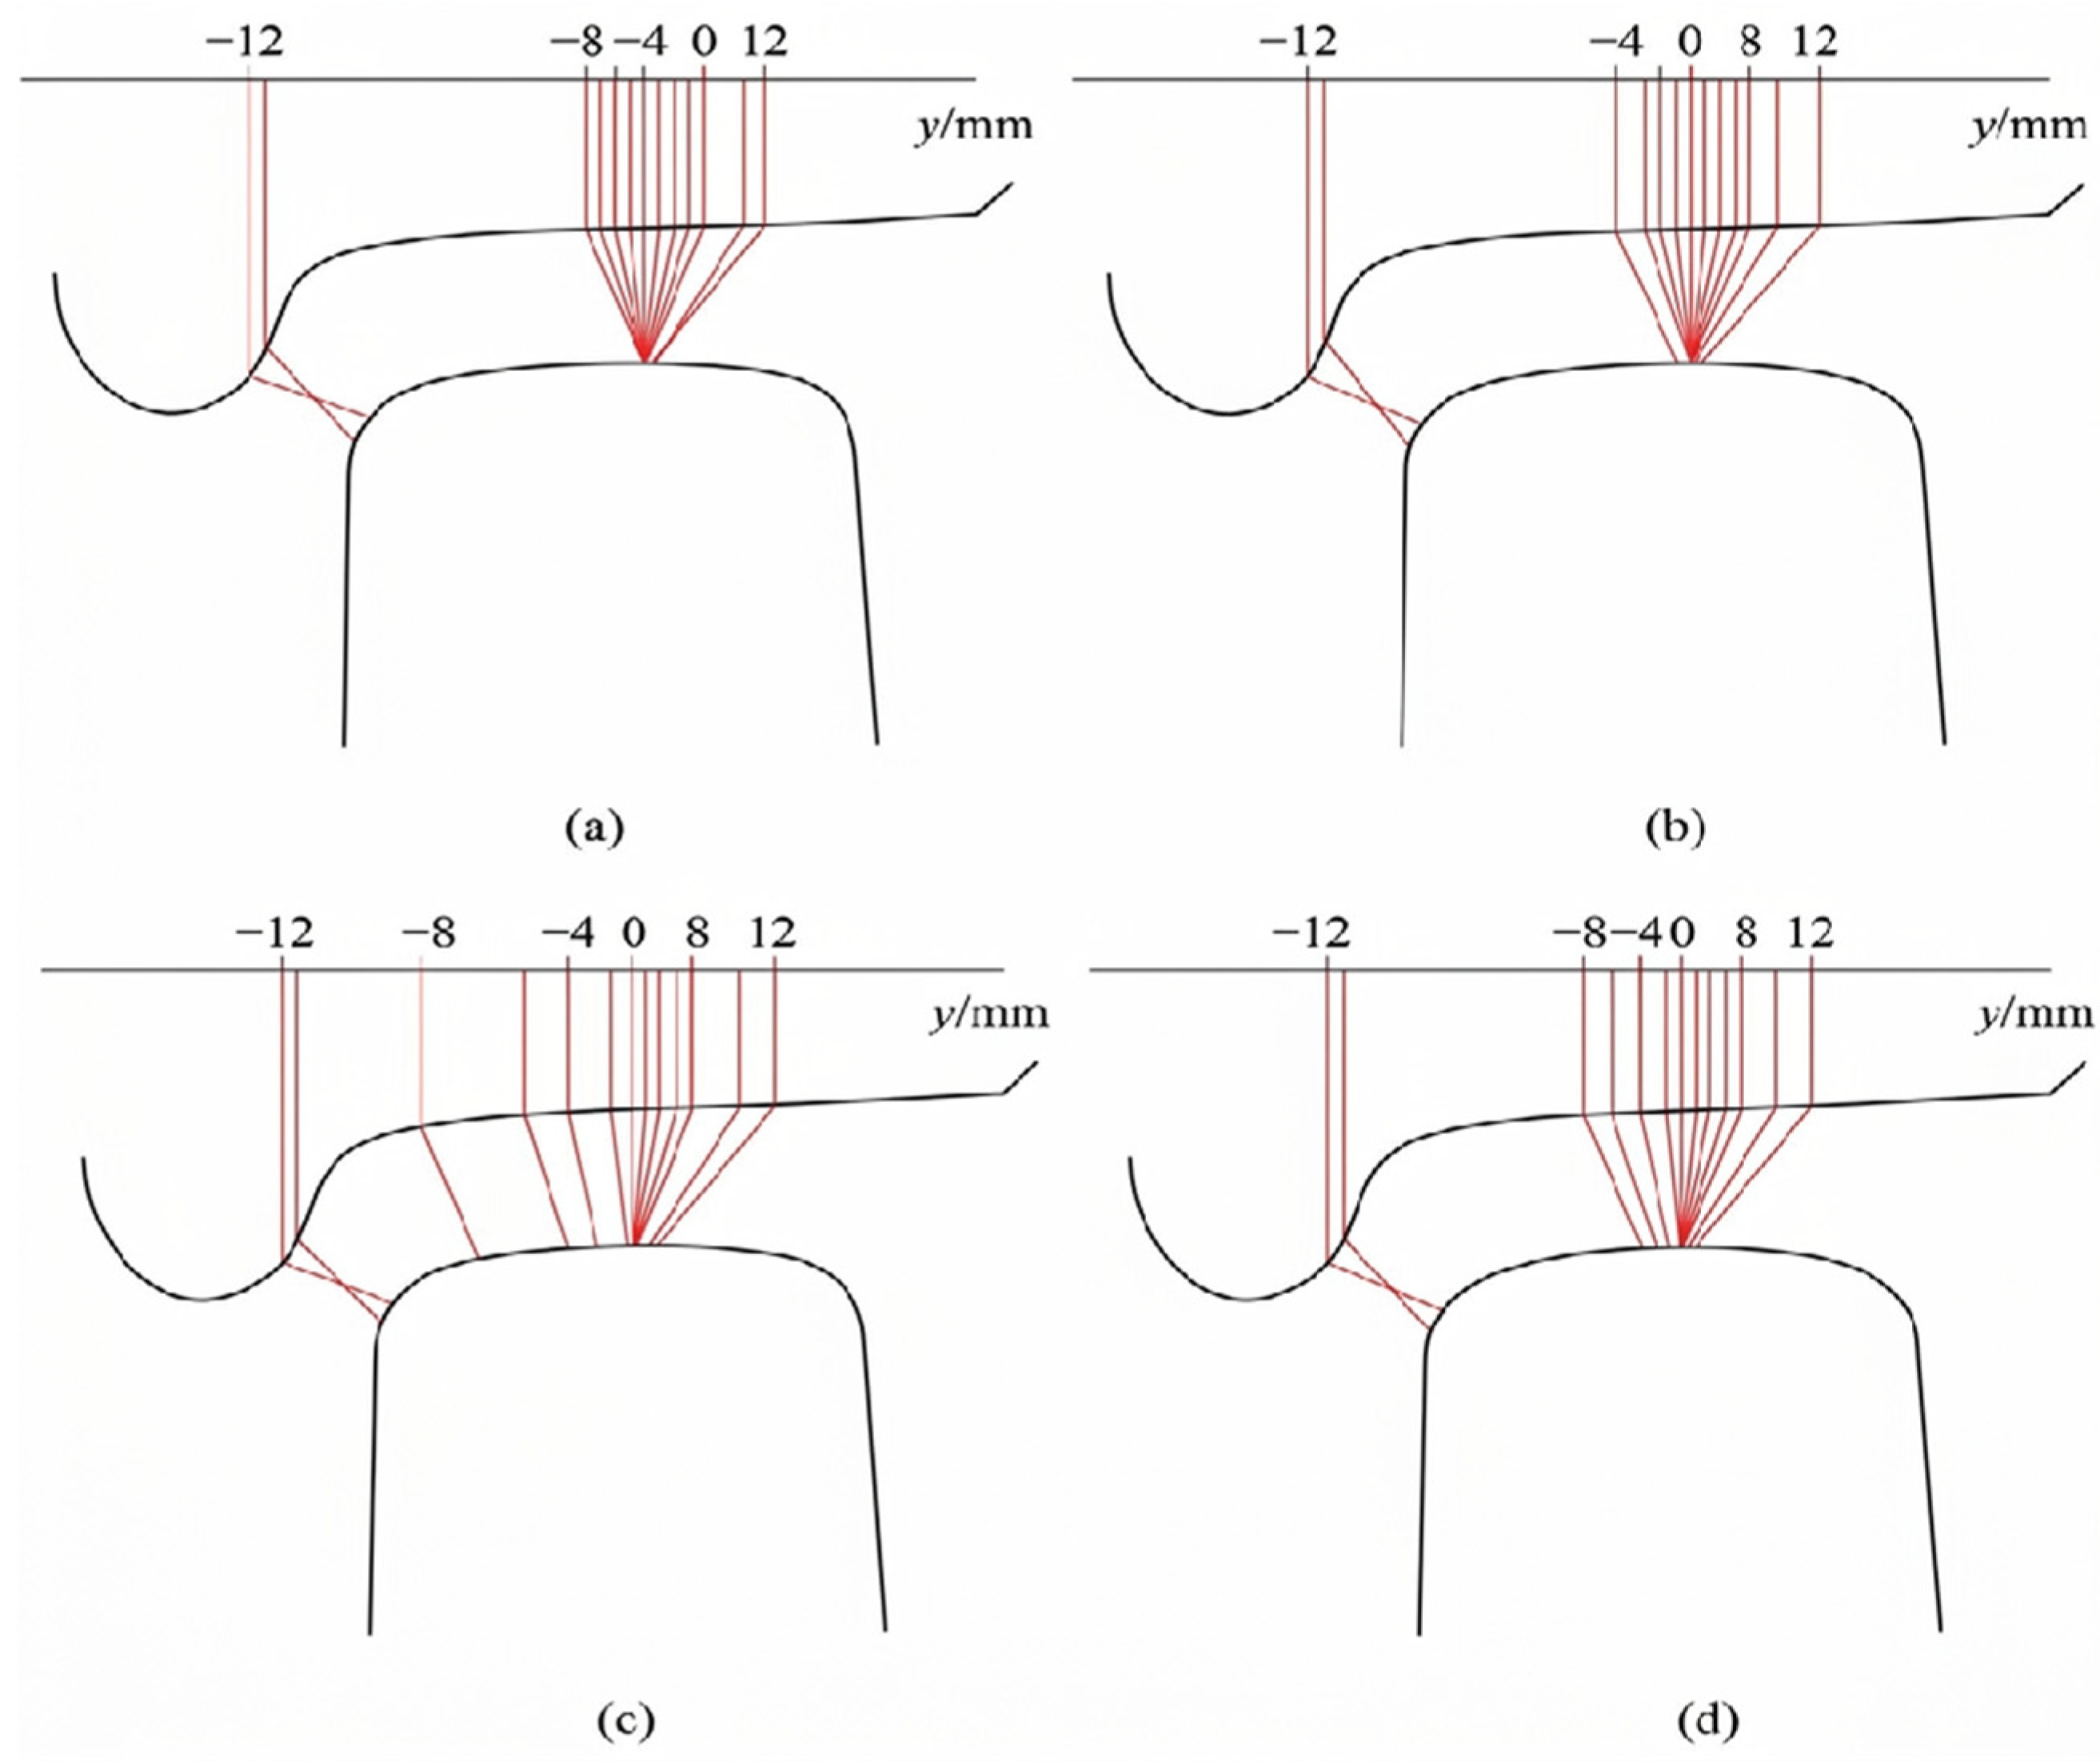
When a train passes through a curved track section, the wheelset undergoes lateral displacement. Figure 2 shows the distribution of wheel–rail contact point pairs for the LMA standard wheel profile matched with CHN60 and CHN60N rail profiles. In the figure, the coordinate origin is located at the nominal wheel radius; the vertical coordinate z is perpendicular to the rail horizontal plane and points upward; and the horizontal coordinate y lies in the rail horizontal plane, is perpendicular to the rail, and points toward the outside of the track. To facilitate the representation of the wheel–rail profile contact point positions during wheelset lateral displacement, the z-coordinate of the wheel profile is raised by 10 mm. From left to right in the figure, the lines connecting the wheel–rail profile contact points corresponding to 12 mm, 8 mm, and 4 mm represent the contact point pairs when the wheelset moves 12 mm, 8 mm, and 4 mm to the right, respectively. The value 0 indicates the centered contact position of the wheelset, while −8 and −12 represent the contact point pairs when the wheelset moves 8 mm and 12 mm to the left, respectively. As shown in Figure 2a,b, when the rail cant is 1:20 and the LMA standard wheel profile is matched with new CHN60 and CHN60N rails, a large jump in the wheel–rail contact point pair occurs when the wheelset shifts 8 mm to the left. Calculations indicate that multipoint contact is likely to occur at the location where the contact point pair jumps. As shown in Figure 2c,d, when the rail cant is 1:40, during leftward wheelset displacement (with the flange approaching the rail), the wheel–rail contact point position is distributed approximately uniformly with the amount of lateral wheelset displacement.
Figure 2.
Distribution of wheel–rail contact points under different rail profile conditions. (a) CHN60 with a 1:20 rail cant. (b) CHN60N with a 1:20 rail cant. (c) CHN60 with a 1:40 rail cant. (d) CHN60N with a 1:40 rail cant.
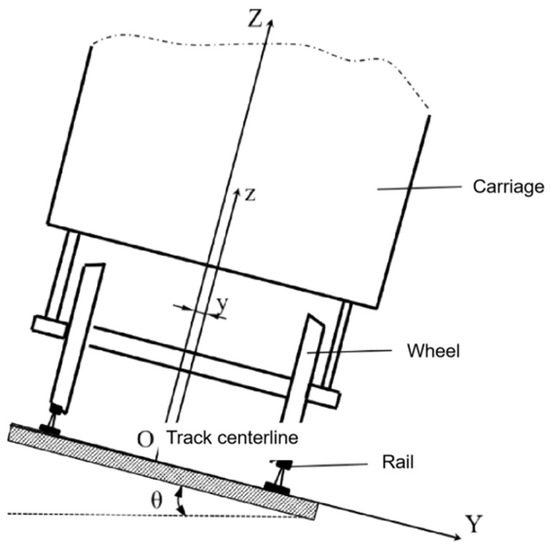
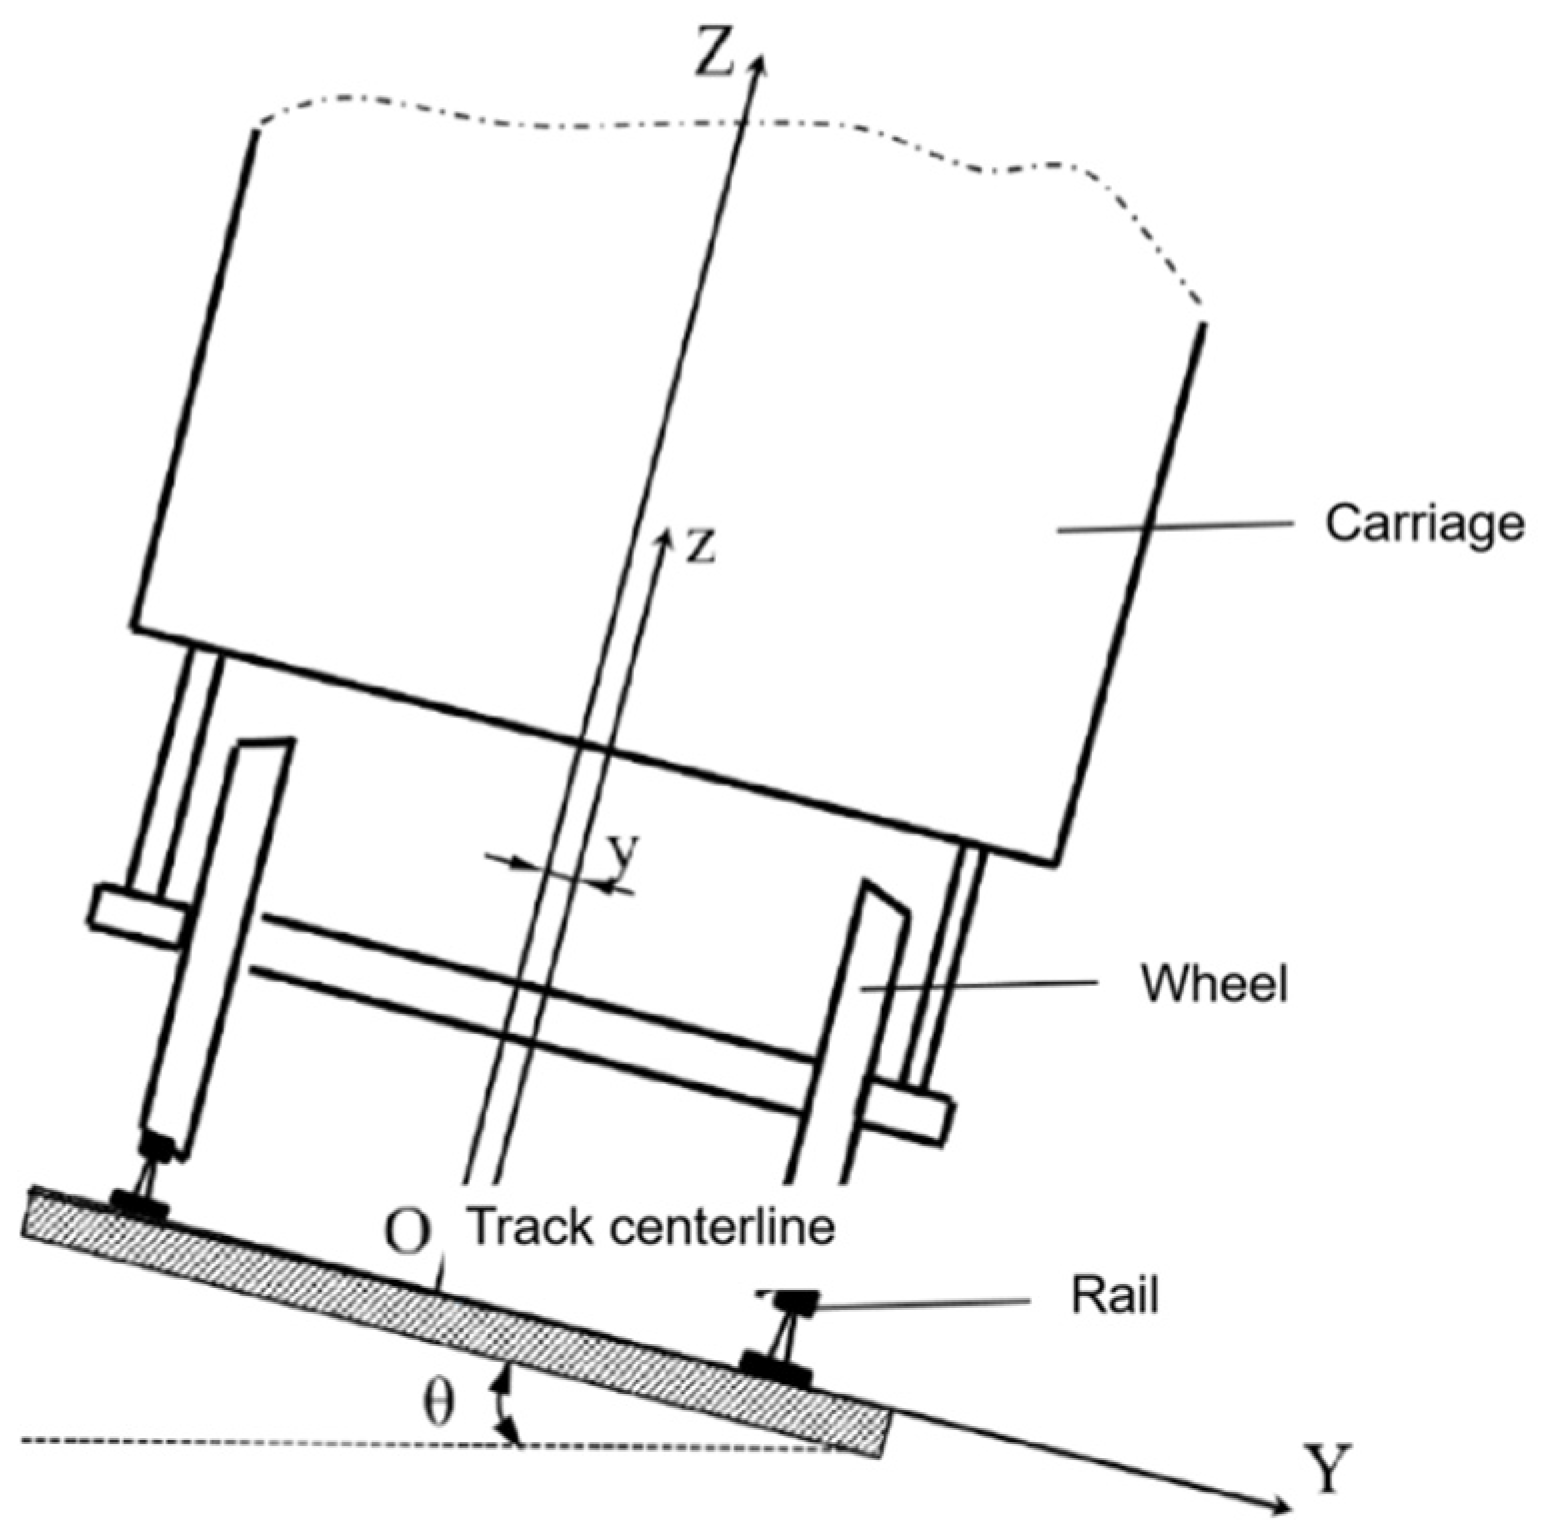
Figure 3 illustrates the wheelset–track configuration when a train negotiates a small-radius curve. Owing to the height difference between the inner and outer rails in a curved section, the vehicle is subjected to centrifugal force during curving and is pushed toward the outer rail. Assuming that the axle load of the train is W, when θ = 0, the train is running on a straight track, and the load carried by the contact surface on one side is W/2. When θ ≠ 0, the train is negotiating a curve, and due to the effect of outer rail superelevation, the load carried by the contact surface on one side becomes (W·cosθ)/2. In the calculation and analysis of curved-track conditions, the influence of wheelset yaw angle variation is neglected, and the wheel–rail contact stress is still assumed to follow the Hertzian distribution.
Figure 3.
Schematic diagram of the wheelset and track on a curved section.
In this study, the yaw angle and angle of attack are not explicitly included in the lubrication solver. The curved-track condition is represented by prescribed lateral displacement, rail-profile-dependent equivalent curvature, and the normal-load component associated with superelevation. Centrifugal force-induced dynamic load transfer is not solved through a vehicle–track dynamic model; therefore, the superelevation results should be interpreted as quasi-static contact-level trends rather than complete vehicle curving predictions.
While negotiation of small-radius curves often induces asymmetric and non-Hertzian contact characteristics due to large yaw angles and profile transitions, this study primarily focuses on the fluid–solid coupling lubrication behavior of the adhesion modifier at the wheel–rail tread interface. In the preliminary investigation of these governing physical patterns, the Hertzian contact theory is adopted as a strategic simplification to balance the heavy computational demands of the non-Newtonian starved EHL model with numerical stability. This approach is justified by the fact that for wheel–rail tread contact (excluding flange contact), the elliptical pressure distribution remains a dominant and sufficiently accurate approximation for analyzing longitudinal adhesion trends, as corroborated by existing literature [25]. Furthermore, by maintaining a consistent contact geometry, the influence of individual operating parameters on the lubricant film’s evolution can be more effectively isolated and identified.
2.2. Starved EHL Model
The rheological behavior of the friction modifier is described based on the Herschel–Bulkley model, and the extended Reynolds equation [26] is given as follows:
where ρ is the lubricant density, η is the lubricant viscosity, n is the lubricant rheological index, and θ is the partial film thickness ratio of the lubricant.
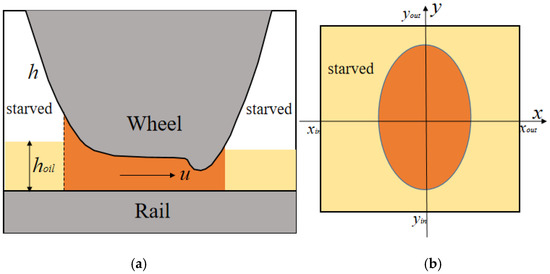
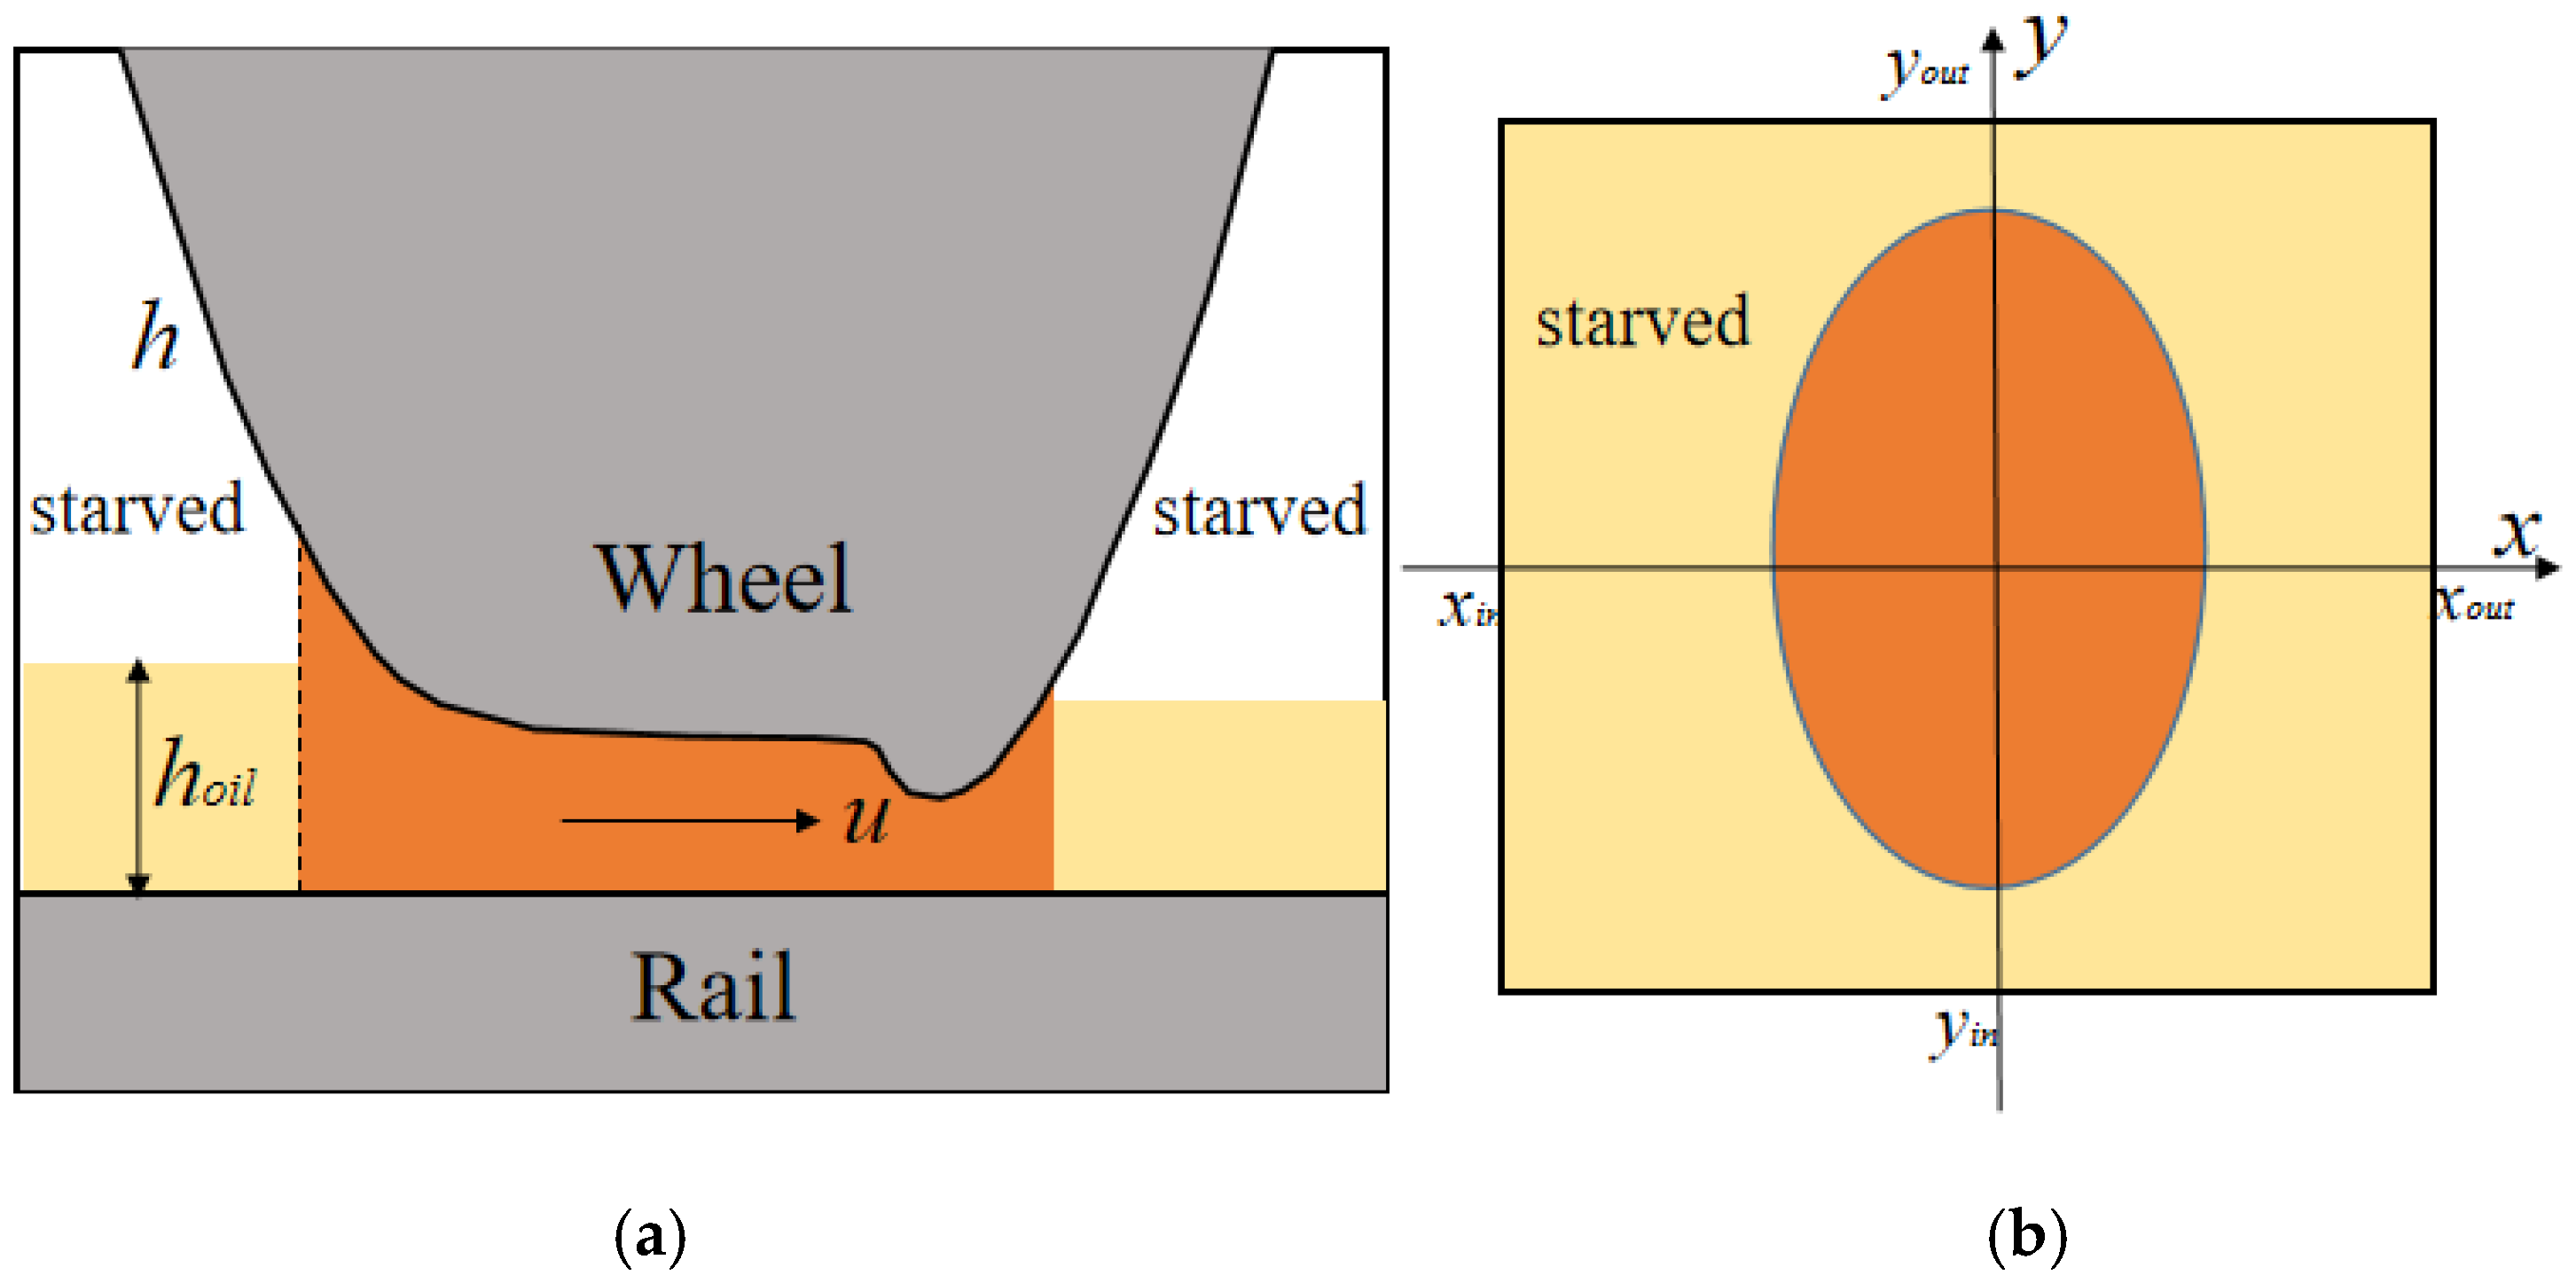
Before performing the elastohydrodynamic lubrication calculation, the computational domain must first be determined, as shown in Figure 4b. With reference to the three-dimensional elastohydrodynamic lubrication formulations for bearings or gears, the computational domain used in solving the Reynolds equation is given by: .
Figure 4.
Wheel–rail starved EHL illustration: (a) Equivalent starved lubrication at the cross-section of y = 0. (b) Calculation region.
When the contact pressure is borne entirely by the lubricant film, the partial film thickness ratio θ is equal to 1. Accordingly, the complementary equation of the Reynolds equation is given by:
With and , The partial film thickness ratio can be expressed as the ratio of the actual film thickness to the theoretical film thickness
In the lubricant-starved region, the actual film thickness is hoil, while the theoretical film thickness is the total gap h, as shown in Figure 4. In the pressurized region, the actual film thickness is equal to the theoretical film thickness, and the partial film thickness ratio is therefore 1.
Where hoil is the effective film thickness of the FM-supply layers, h is the total gap between wheel/rail surfaces, and the wheel/rail starved EHL illustration is given in Figure 4.
Only the effective liquid-film supply at the contact inlet is considered in the present starved EHL model. Real TORFM processes, including film supply history, water evaporation, solid-particle deposition, chemical boundary-film formation, progressive depletion, re-distribution by repeated wheel passages, and carry-over along the rail, are not explicitly solved. These processes are represented indirectly by the effective inlet film thickness hoil. Therefore, the model is most applicable to the initial wet or semi-wet stage after application and should not be extrapolated to long-term dry-film behavior without additional depletion and evaporation sub-models.
The boundary conditions met [27]:
The film thickness equation for point contact can be expressed as [28]:
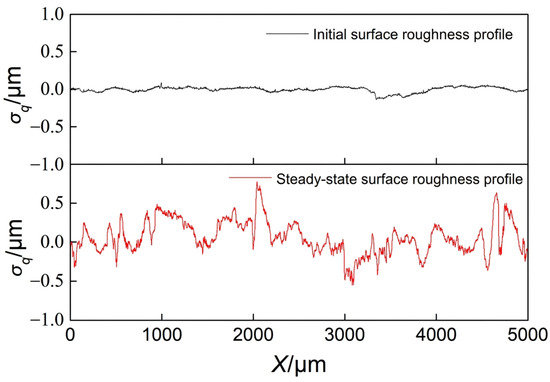
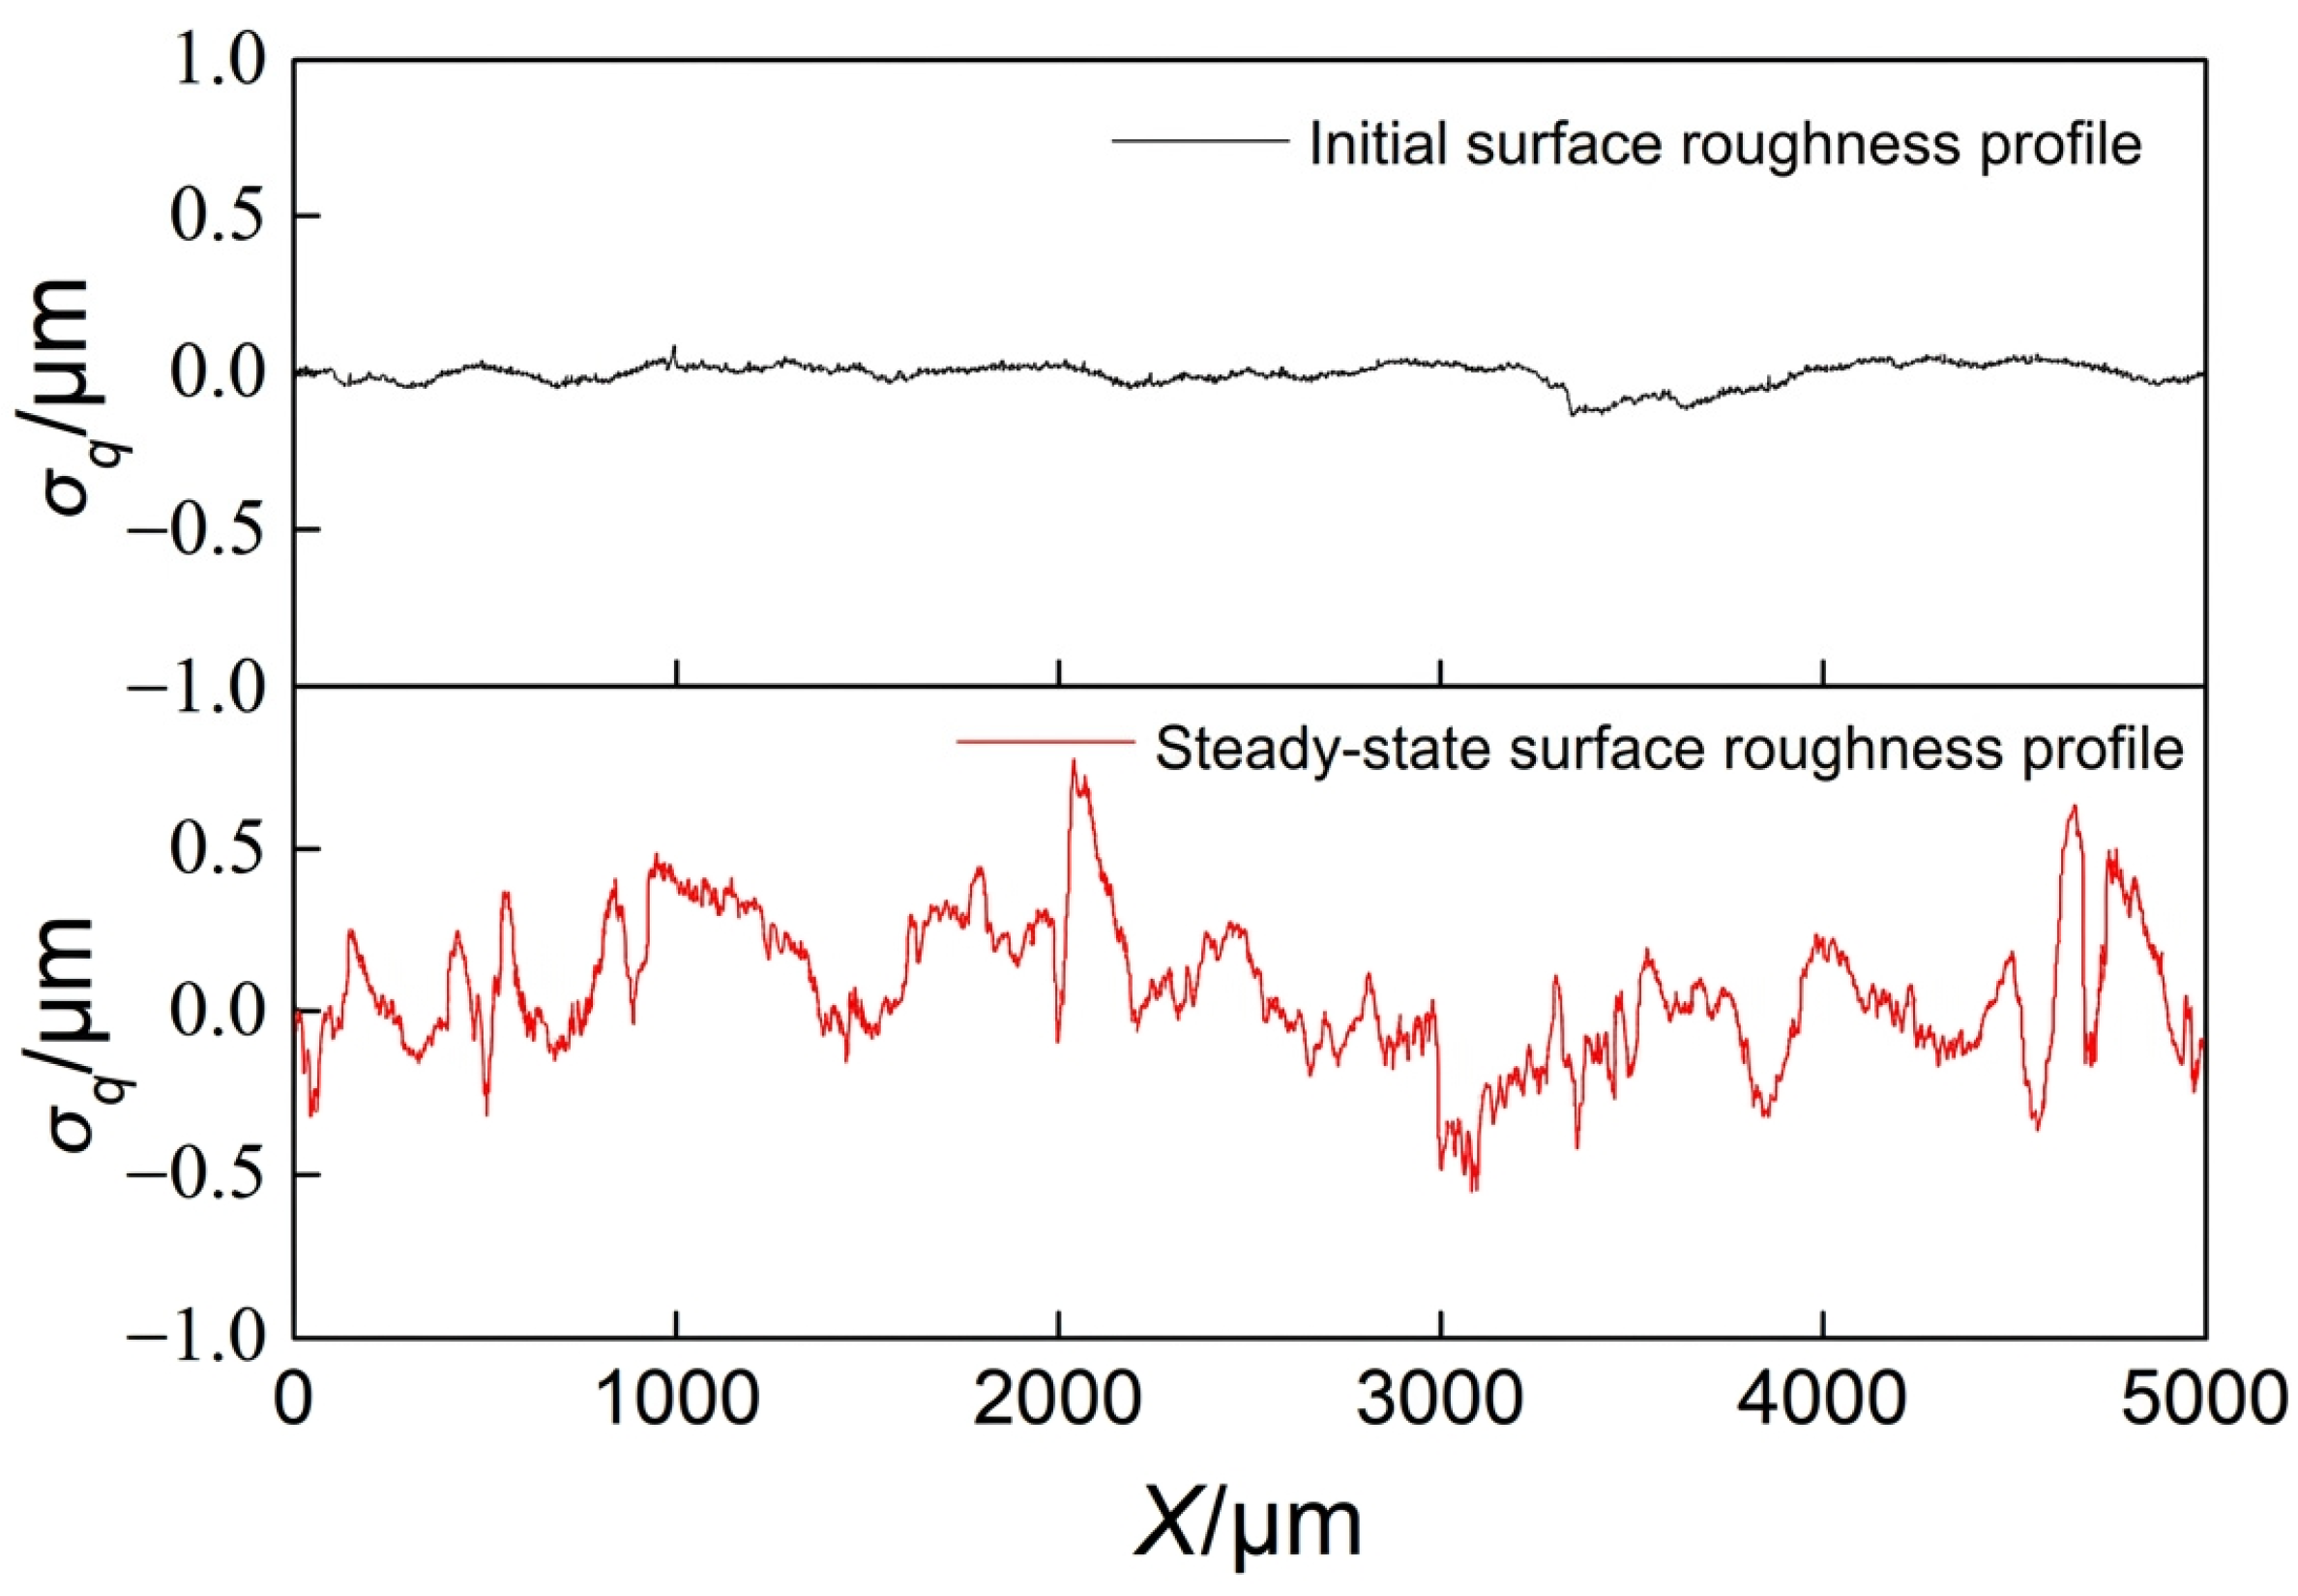
where σ denotes the surface roughness. Figure 5 shows the roughness profiles of the wheel–rail specimens before and after stabilization in the rolling contact test.
Figure 5.
Surface roughness of the specimens.
The pressure-viscosity equation is:
where .
Based on the GW model, the GT model [29] was developed, in which the pressure borne by the metallic asperities on the contact surface can be expressed as:
where k is the roughness parameter, which is expressed as:
where N is the surface density of asperity peaks, β is the average radius of asperity curvature, and σ is the standard deviation of the roughness amplitude. When we is the load carried by the lubricant film and wa is the load carried by the asperities, the total load w can be expressed as:
The value of wa is given as:
The traction coefficient is expressed as:
where μa is the friction coefficient generated by metallic asperities on the surface; under dry contact conditions, μa = 0.55 at a creepage of 2%. μe is the friction coefficient of the lubricant, which is expressed as:
3. Numerical Scheme and Model Validation
3.1. Numerical Scheme
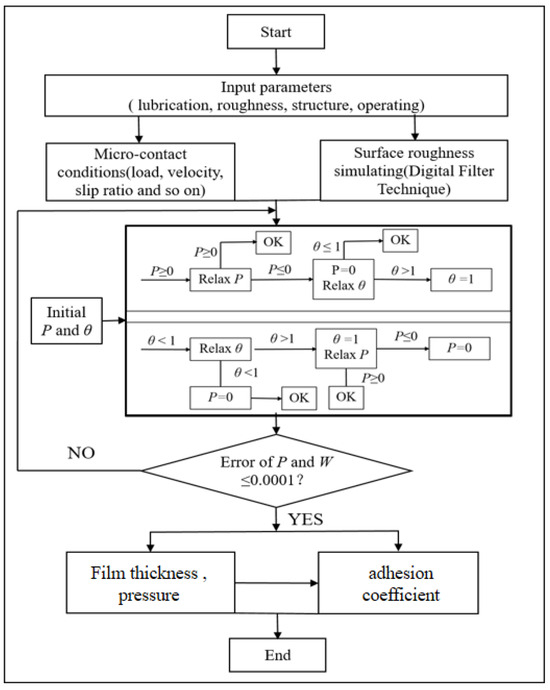
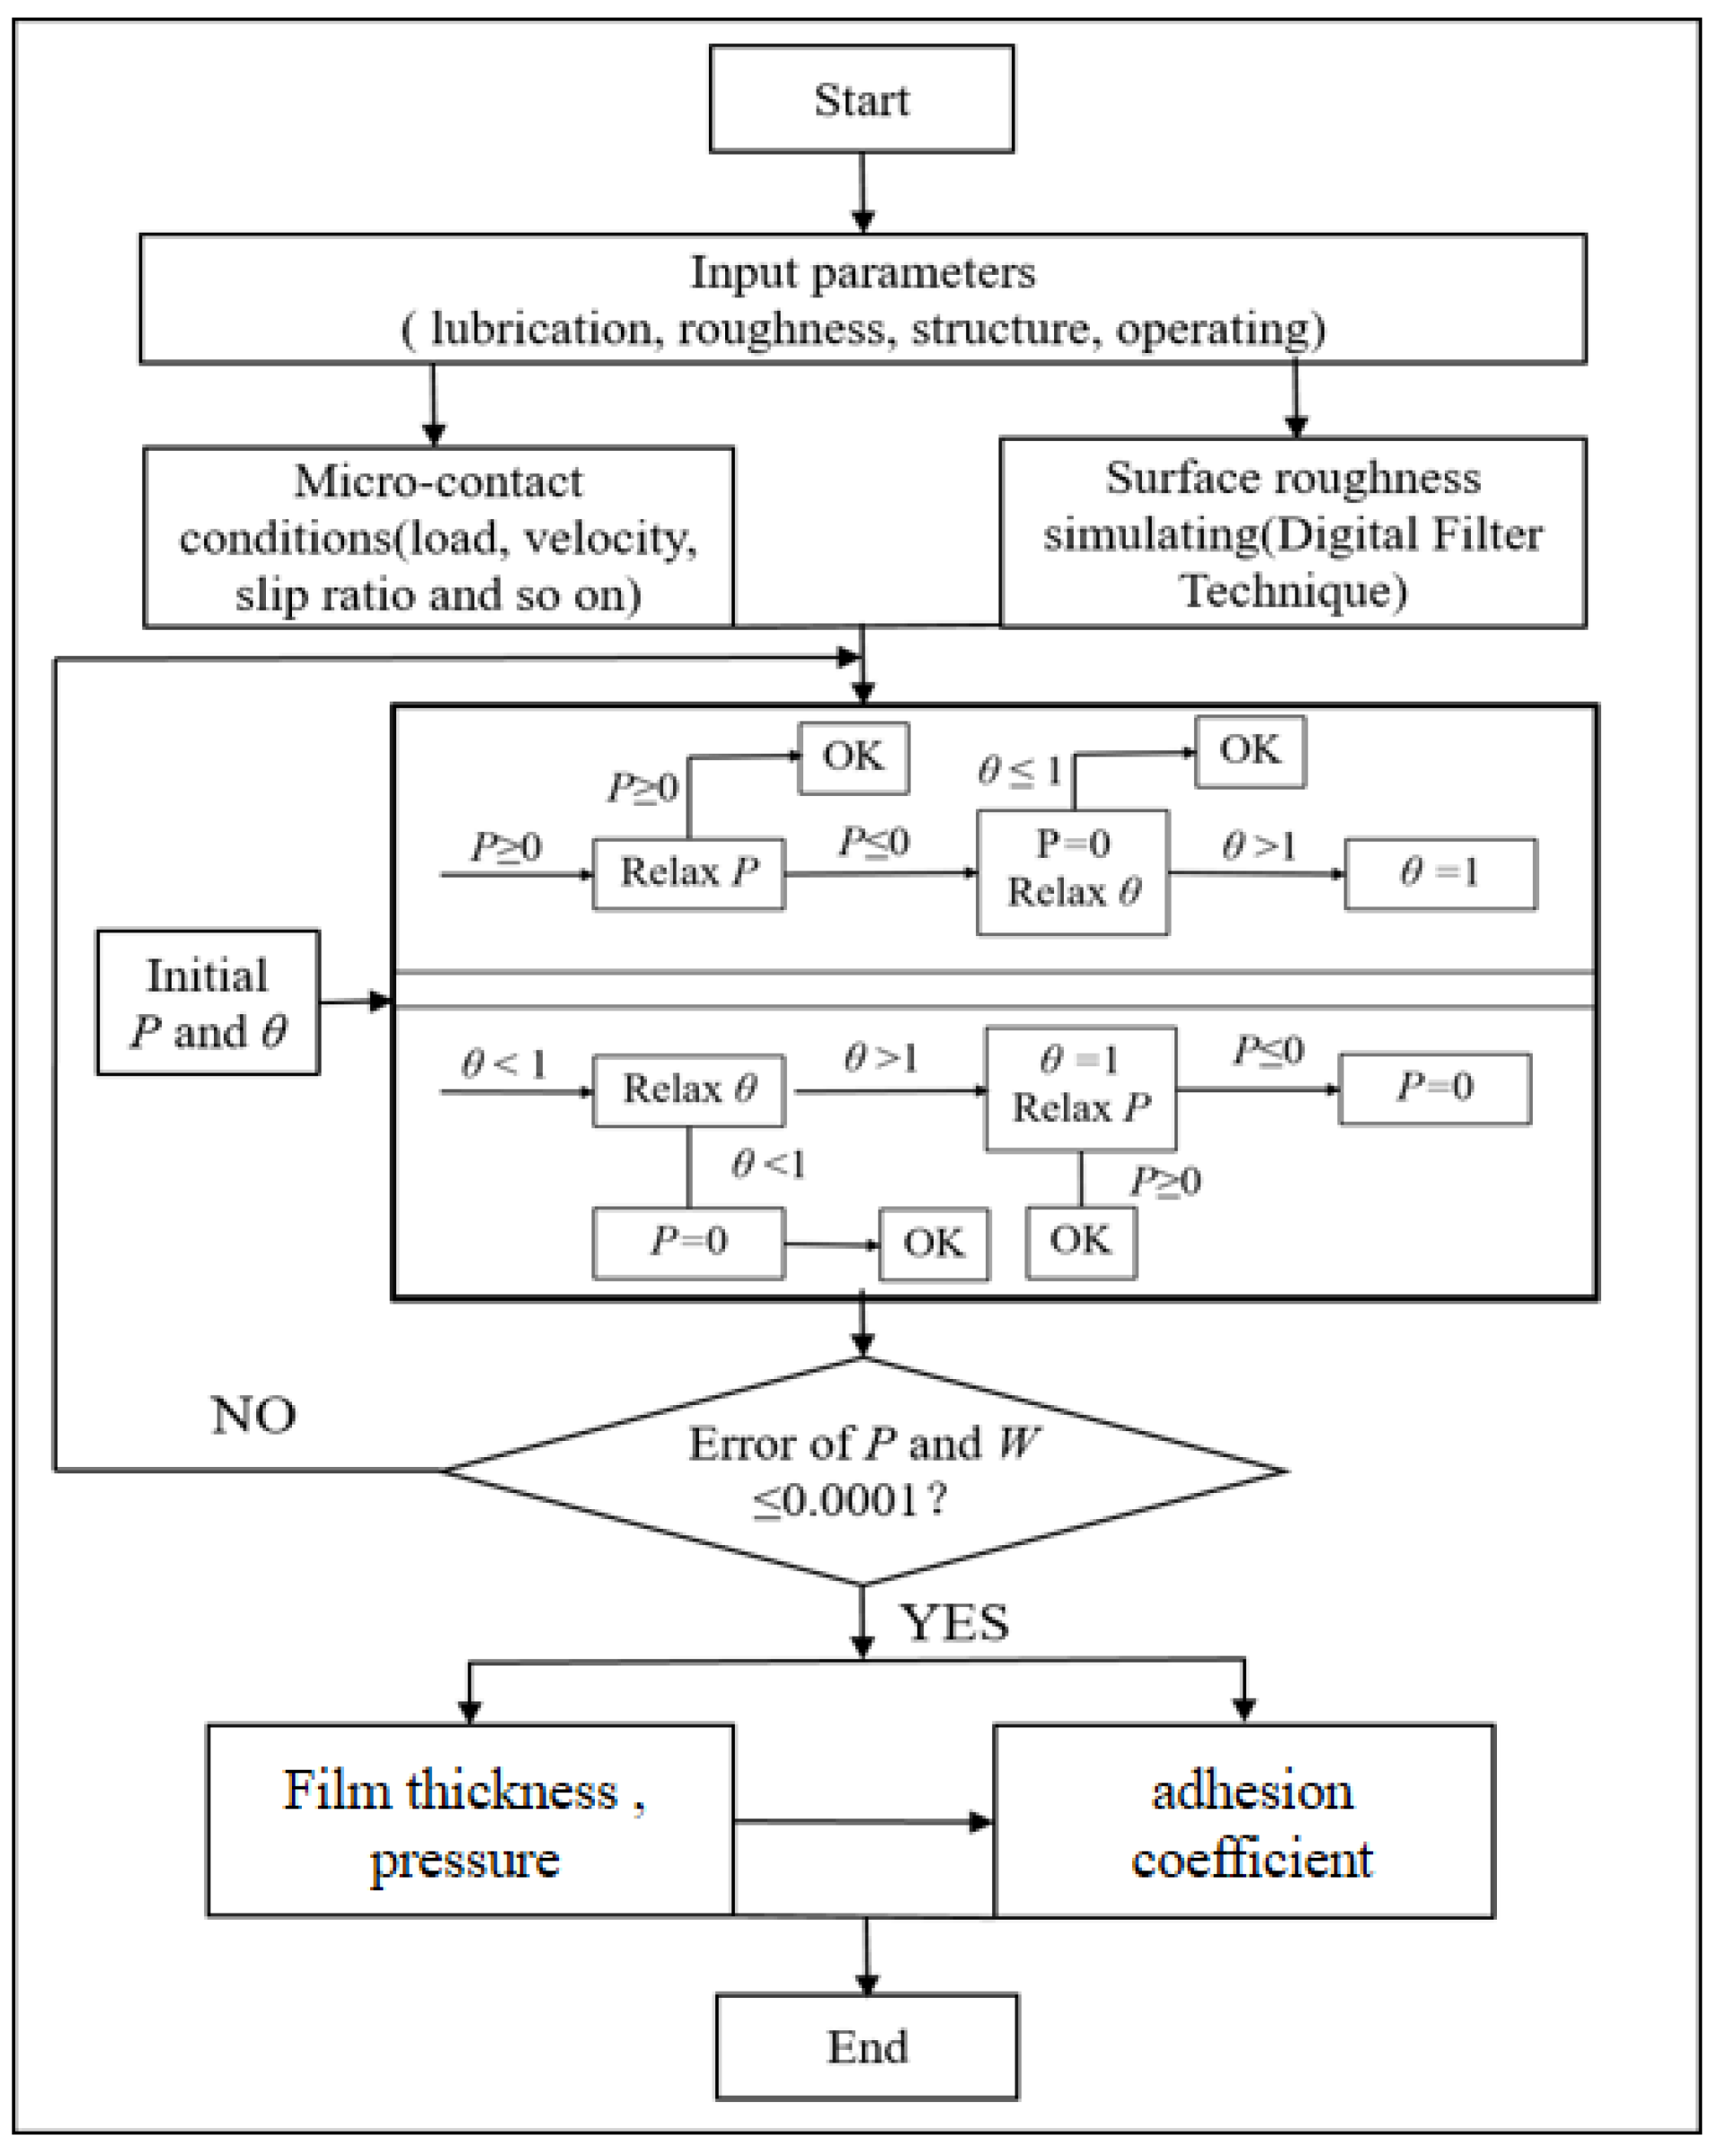
In this paper, the starved EHL model presented in Section 2.2 is first established. The wheel/rail geometry, operating conditions, and lubricant properties are then specified. Surface roughness is simulated using digital filtering technology, and the multigrid method is employed to analyze starved EHL with varying effective film thicknesses. The relaxation scheme for the fractional film content in starved lubricated contacts is adopted from Ref. [30]. The starved EHL behavior is investigated under different effective film thicknesses and roughness conditions, and the distributions of pressure, fractional film content, and film thickness are obtained. Subsequently, the surface shear stress, subsurface stress distribution, and fatigue index are determined for different effective film thicknesses and roughness conditions. Elastic analysis is performed to evaluate the subsurface stress during rail surface movement at Y = 0. Rail fatigue is analyzed on the basis of the shakedown map. Figure 6 illustrates the numerical calculation procedure.
Figure 6.
Flow chart of numerical calculation.
3.2. Model Validation
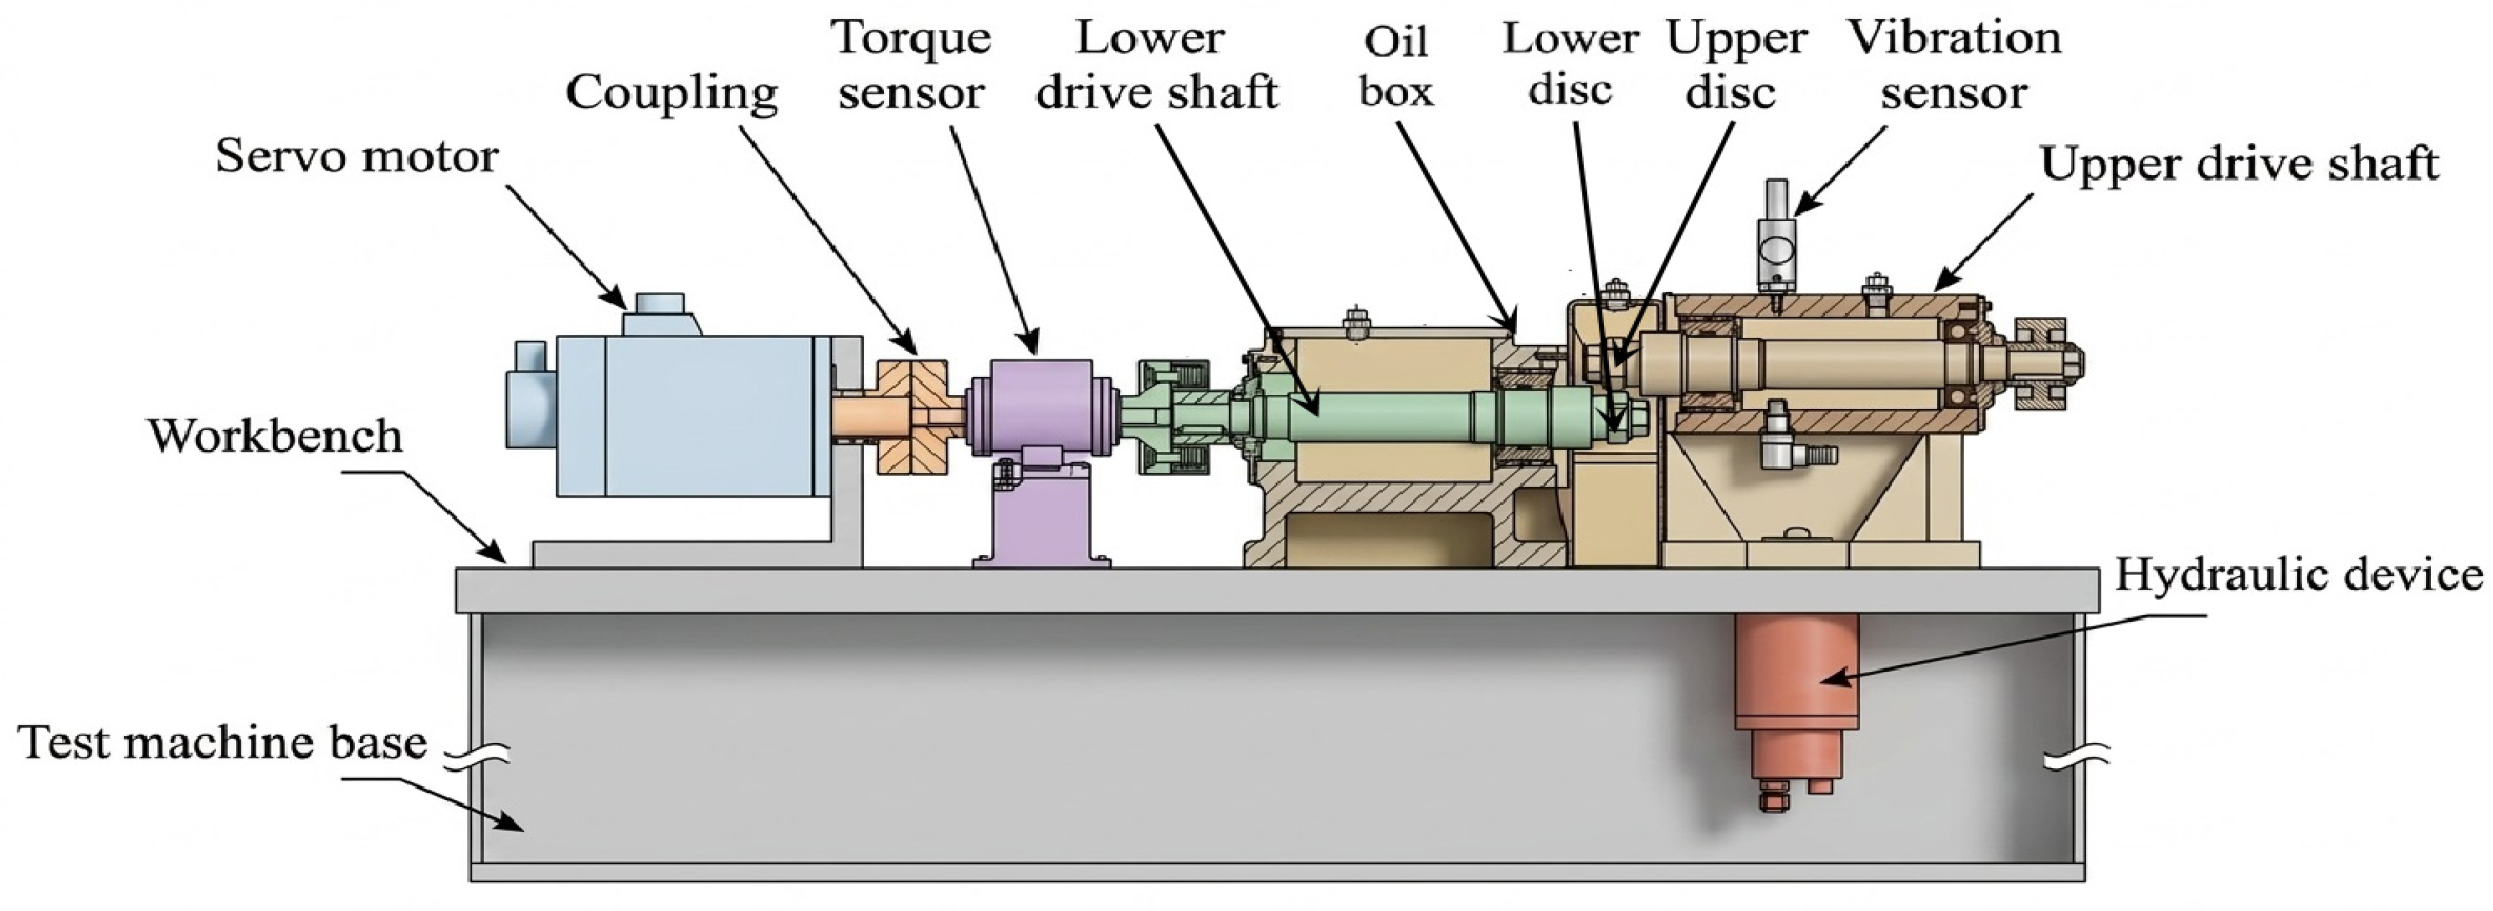
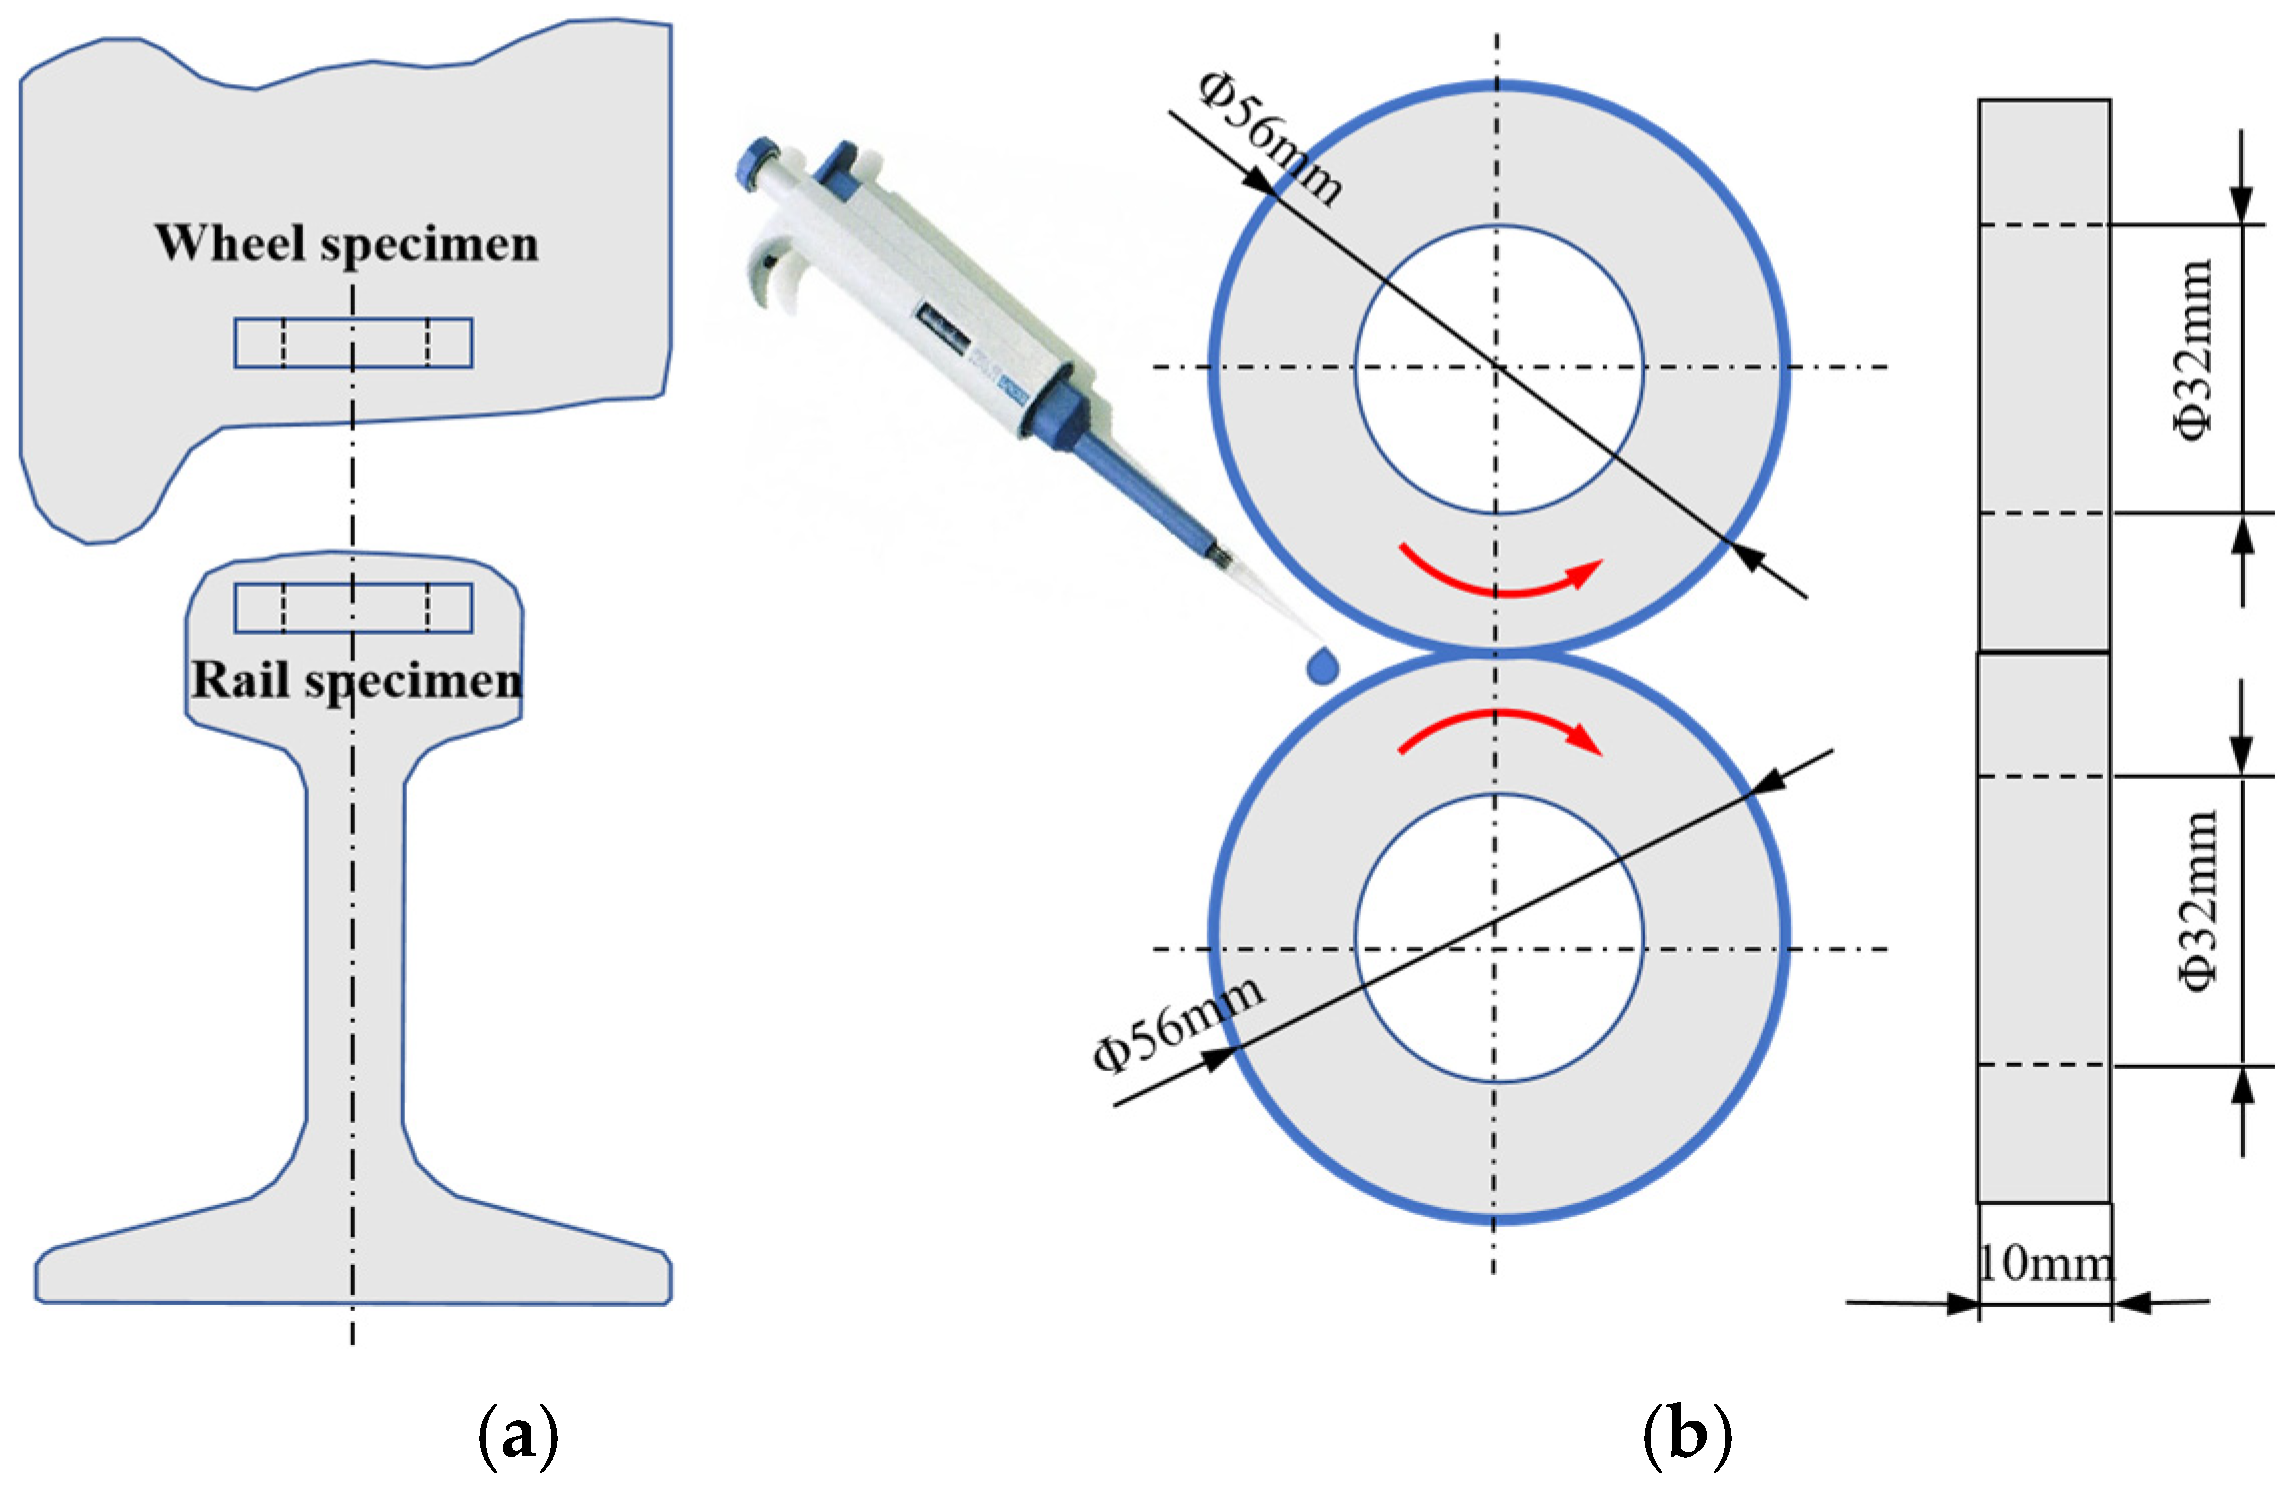
The validation experiment was conducted using a twin-disc line-contact configuration, because both specimens were cylindrical discs with a diameter of 56 mm. The laboratory condition was therefore not treated as a full-scale wheel–rail point contact, but as a controlled contact configuration for validating the trend of modifier-induced adhesion reduction.
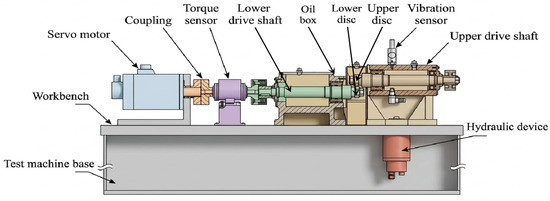
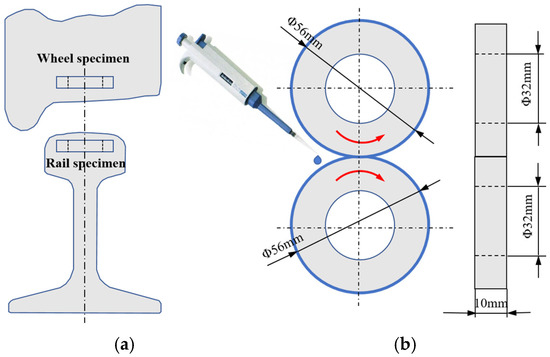
The experiments were conducted on an MJP-30A wheel–rail rolling wear and contact fatigue testing machine, as shown in Figure 7. In the tests, the upper specimen was a wheel specimen taken from the tread of a CL60 wheel, and the lower specimen was a rail specimen taken from the railhead of a U71Mn hot-rolled rail. The sampling locations and specimen geometry are shown in Figure 8. Before formal testing, a run-in test was performed on the machine until the adhesion coefficient became stable; the specimens were then removed, and the surface roughness was measured, yielding Ra ≈ 0.45 µm. Prior to each test group, the specimens were cleaned in an ultrasonic cleaner with anhydrous ethanol for 20 min to ensure that their surfaces were free of contaminants such as oil and wear debris.
Figure 7.
Structural diagram of MJP-30A rolling-sliding wear and contact fatigue apparatus.
Figure 8.
Sampling position and scheme of wheel and rail samples (a) Sampling position; (b) scheme of wheel and rail samples.
During the tests, a pipette was used to add the corresponding liquids; the addition method and location are shown in Figure 8b. The wheel and rail specimens were driven separately by two independent servo motors, with a rotational speed range of 100–2000 r/min and an accuracy of 0.1 r/min. The normal load on the specimens was applied hydraulically, with a loading range of 0–30 kN and an accuracy of 0.1 N.
The test parameters were first preset according to operating conditions. After the rotational speed and normal force between the upper and lower specimens reached the target values, the creepage between the two specimens was set. Different liquid volumes were then added using a pipette to obtain a complete adhesion recovery curve. The pipette was used to control the added volume, and the liquid was added sequentially from small to large amounts. The next addition was not performed until the adhesion coefficient from the previous addition had returned to its initial state (i.e., complete recovery). During the tests, the creepage, rotational speed, and vertical load were kept constant. The rail specimen speed was maintained at 500 r/min, the creepage at 2%, and the vertical load was set to 4.6 kN to simulate wheel–rail contact under a contact stress of 1.1 GPa.
For reproducibility, the validation calculations used the same governing starved EHL model as that described in Section 2.2. Different friction-modifier addition volumes were implemented by converting the applied liquid volume into an effective inlet film thickness hoil over the nominal supply/contact region; the rheological parameters of the modifier were kept unchanged for all addition volumes. For asperity contact, μa = 0.55 was used as the dry-contact reference value at 2% creepage, consistent with the dry twin-disc measurement. The validation statistics calculated from the digitized data in Figure 9b were RMSE = 0.0228, MAE = 0.0217, MAPE = 11.80%, and R2 = 0.828. The 95% confidence interval of the mean residual (calculated − experimental) was −0.0298 to −0.0136, indicating that the model slightly underestimates the measured minimum adhesion coefficient. These results show that the model captures the overall decreasing trend with increasing addition volume, but they do not exclude the concurrent contribution of boundary lubrication. A low-speed twin-disc test, where fluid entrainment is weaker, would be valuable in future work to further separate fluid-dynamic and boundary-film effects.
Figure 9.
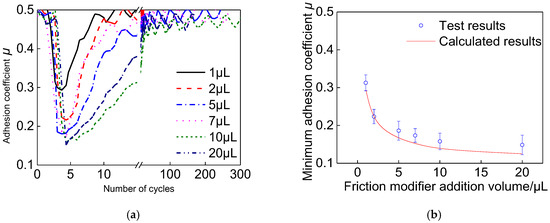
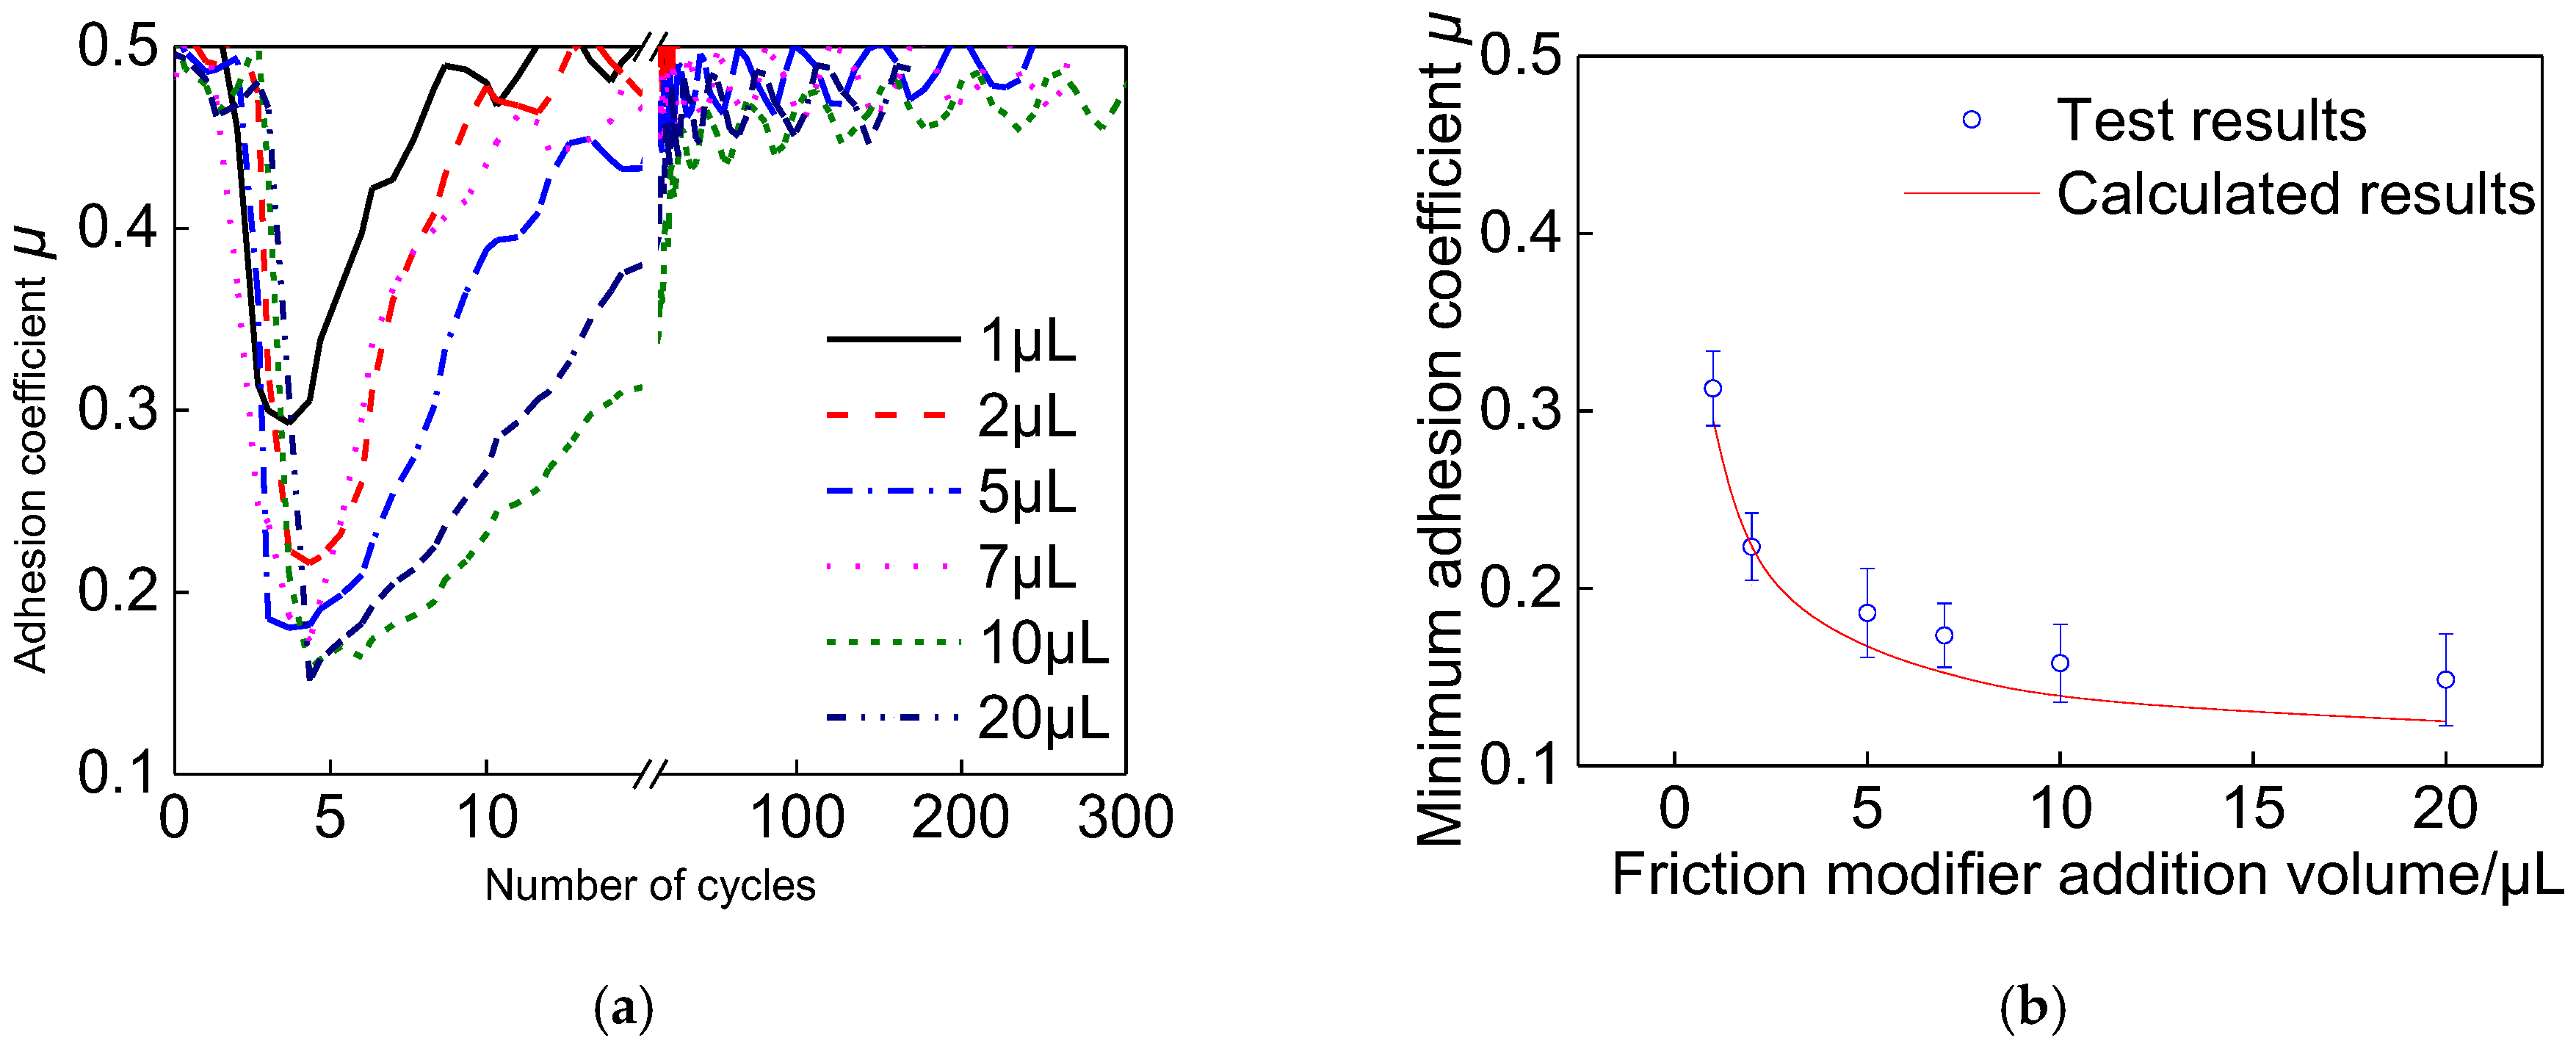
Experimental and calculated adhesion results of the friction modifier at different addition volumes: (a) Variation in adhesion coefficient with number of cycles; (b) comparison between experimental and calculated results.
It should be noted that the laboratory experiments were conducted using small-scale specimens (56 mm diameter), which inevitably introduces a scaling effect compared to the full-scale wheel–rail system. However, this study employs a strategy combining experimental validation with numerical simulation to bridge this gap. According to the friction similitude theory [31], the adhesion–creep characteristics and film formation patterns observed in small-scale tests are consistent with those in full-scale systems when the contact pressure and tangential shear stress are maintained at equivalent levels. In this study, the experimental normal load was set to 4.6 kN to achieve a maximum contact pressure of 1.1 GPa, which is representative of typical heavy-haul or high-speed railway conditions. The experimental data serve to validate the fundamental accuracy of the non-Newtonian starved EHL model, while the subsequent numerical analysis uses full-scale parameters (e.g., 14 t axle load) to provide direct technical guidance for field applications. This dual-track approach ensures that the governing mechanisms identified are physically relevant to real-world curved track conditions.
The relationship between coating volume and adhesion coefficient was obtained through experiments. Since the friction modifier coating volume below 20 μL has a significant effect on the lubricating film thickness, the wheel–rail adhesion behavior and film thickness at addition volumes less than 20 μL were investigated in depth. Figure 9 shows a comparison between the experimental and calculated results of the initial adhesion coefficient when the friction modifier dosage is less than 20 μL. From the friction modifier experimental results (Figure 9a), the adhesion coefficient decreases with increasing coating volume. Due to the pronounced non-Newtonian characteristics of the friction modifier, the resulting lubricating film thickness is relatively small. The experimental results of the friction modifier are in good agreement with the calculated results, as shown in Figure 9b. After applying the friction modifier, the wheel–rail adhesion coefficient rapidly reaches its minimum value. When the addition volume is less than 5 μL, the minimum adhesion coefficient decreases rapidly with increasing addition volume. The initial adhesion coefficient decreases with increasing friction modifier coating volume, primarily because the lubricating film thickness formed by the friction modifier in the contact zone increases with coating volume, leading to an increase in both the load carried by the friction modifier and the film thickness ratio, while the load carried by the metallic asperities decreases, resulting in a reduction in the adhesion coefficient. Under the same coating volume conditions in Figure 9b, the experimental results are slightly higher than the calculated results, which can be well explained by minor spillage losses of the friction modifier during the experiment.
Figure 9 compares the experimental and calculated minimum adhesion coefficients for addition volumes below 20 μL. The comparison confirms that the numerical model reproduces the overall decreasing trend with increasing addition volume. Nevertheless, because the tests were performed with a real water-based TORFM, the measured adhesion reduction may include both fluid-dynamic effects and boundary-film effects. Therefore, the validation is used to support the contact-level modelling framework rather than to claim that EHL alone determines the adhesion drop.
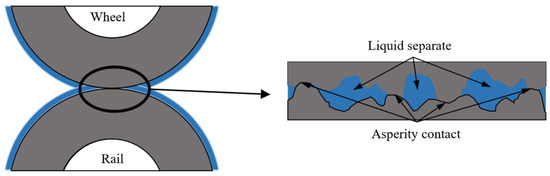
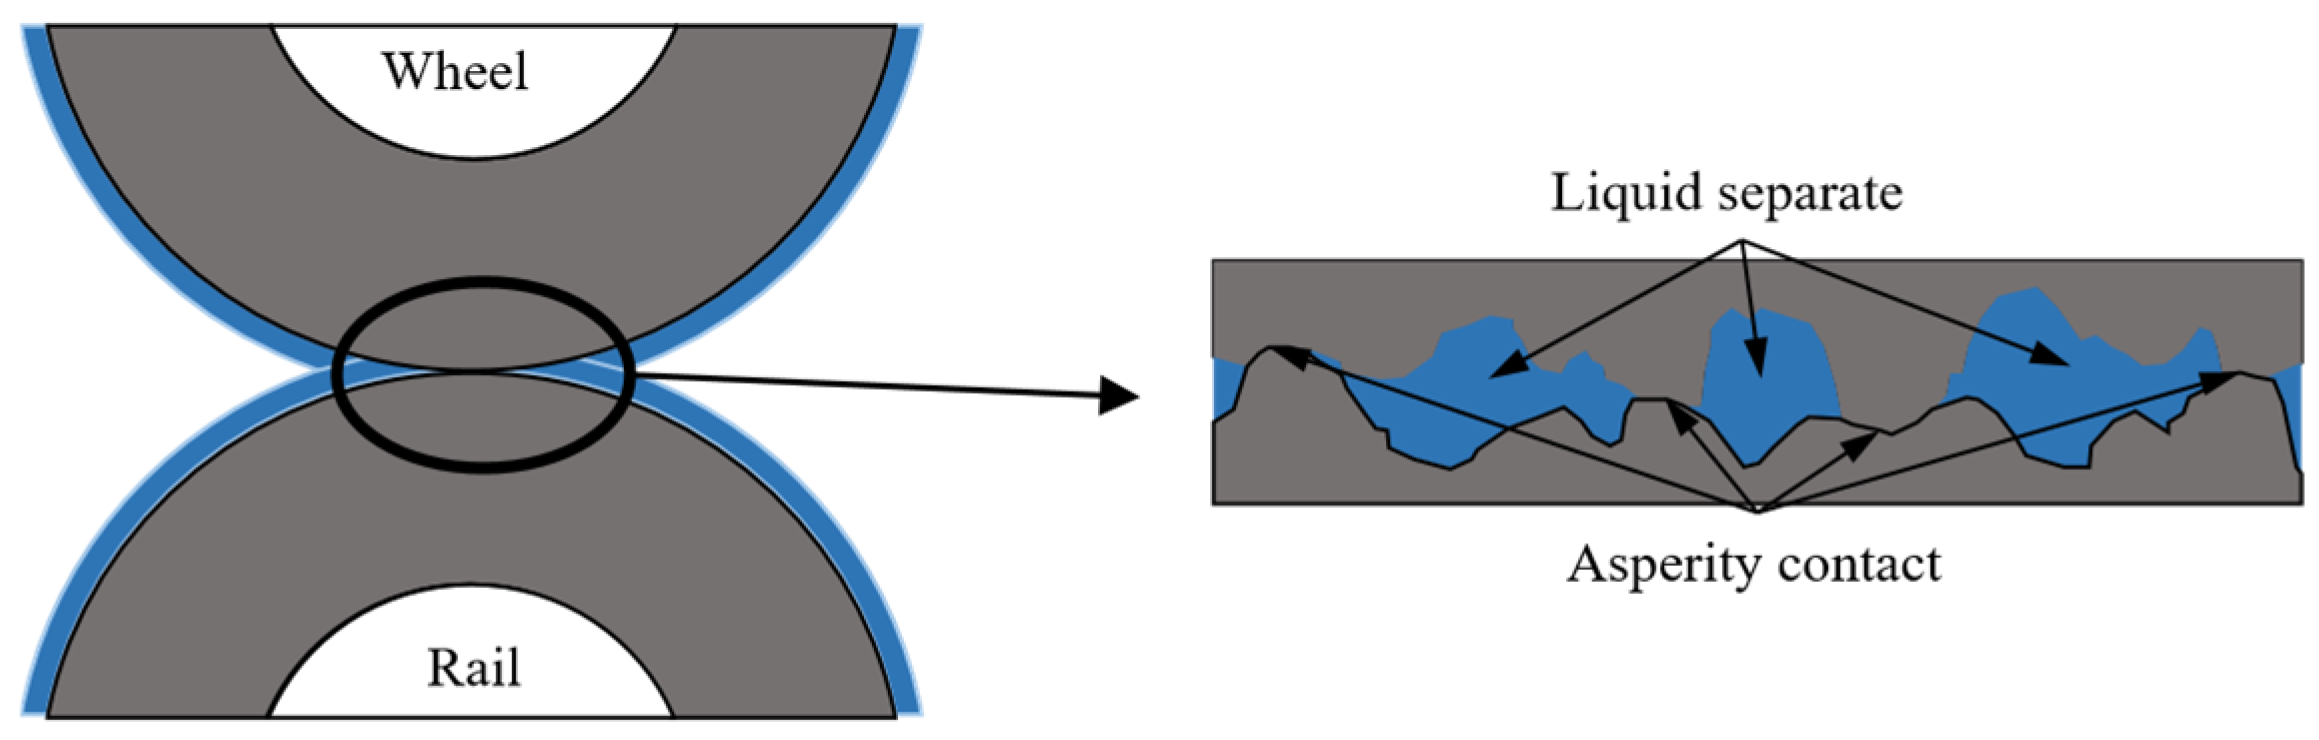
After the friction modifier is applied to the wheel–rail surfaces, under starved (mixed) lubrication conditions, part of the contact interface is separated by the friction modifier between the rail and wheel surfaces, while another part remains in direct contact through metallic asperities, as shown in Figure 10. Depending on the addition volume, the lubrication state of the wheel–rail surface differs. When the addition volume is below 20 μL, the lubrication state is starved lubrication; as the volume is further reduced, the starvation effect becomes increasingly severe. When the addition volume is below 5 μL, the adhesion coefficient changes more rapidly because starvation is more pronounced, which in turn increases the contact area of metallic asperities at the interface.
Figure 10.
Schematic diagram of wheel–rail specimen contact under friction modifier conditions.
Figure 10 is intended as a conceptual illustration of the mixed contact state during the initial wet/semi-wet stage after TORFM application. It should not be interpreted as direct evidence of the relative contributions of fluid-dynamic and boundary-film mechanisms. The relative contributions are assessed through the validation comparison and parameter sensitivity analysis described above.
4. Results and Discussions
Because real wheel–rail contact parameters vary continuously along the track owing to wear, rail inclination, gauge variation, roughness evolution, and profile degradation, the following results should be interpreted primarily as a systematic contact-level parameter study. The CHN60 and CHN60N cases provide representative geometry examples; the more general conclusions are drawn from the effects of contact ellipse size, normal load, speed, creepage, roughness, and effective film supply.
4.1. Determining the Parameters for the Model
Table 1 lists the main calculation parameters used in the numerical simulation of the fluid analysis under the action of the friction modifier, in which the rail contact radii are 0.3 m for the CHN60 profile and 0.2 m for the CHN60N profile, respectively. In the analysis of the influence of rail profile, both profiles were investigated separately. For calculations under other operating conditions, such as lateral displacement and outer rail cant, the CHN60 profile was adopted.
Table 1.
Calculation parameters.
The water-based FM used in this study was an in-house laboratory formulation; the rheological index of the FM, obtained using a DHR-3 rheometer, was 0.82, and the viscosity was 0.6 Pa·s. The uncertainty of the measurement is controlled by averaging and the error of multiple measurements. The parameter α = 2.19 × 10⁻⁸ is an empirical value in the formula; see reference [30].
The primary objective of this current study is to isolate and investigate the influence of single operating conditions (such as axle load, creepage, etc.) on adhesion. To achieve this and to clearly identify the governing patterns of these individual variables, it was necessary to employ a controlled variable approach. Therefore, we assumed the wheel–rail surface roughness parameters to remain constant at specific values during these analyses to eliminate the interference of varying surface topographies and to focus entirely on the parameter under investigation.
4.2. Rail Profile Shape
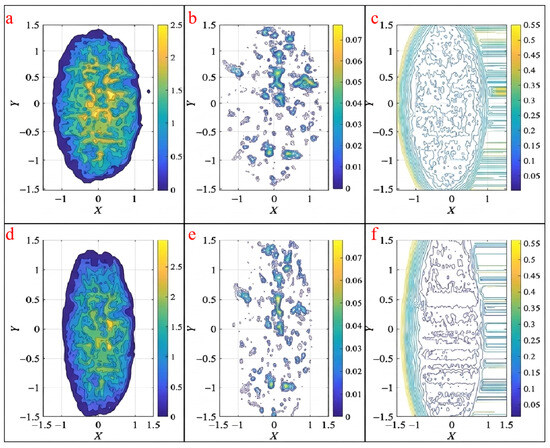
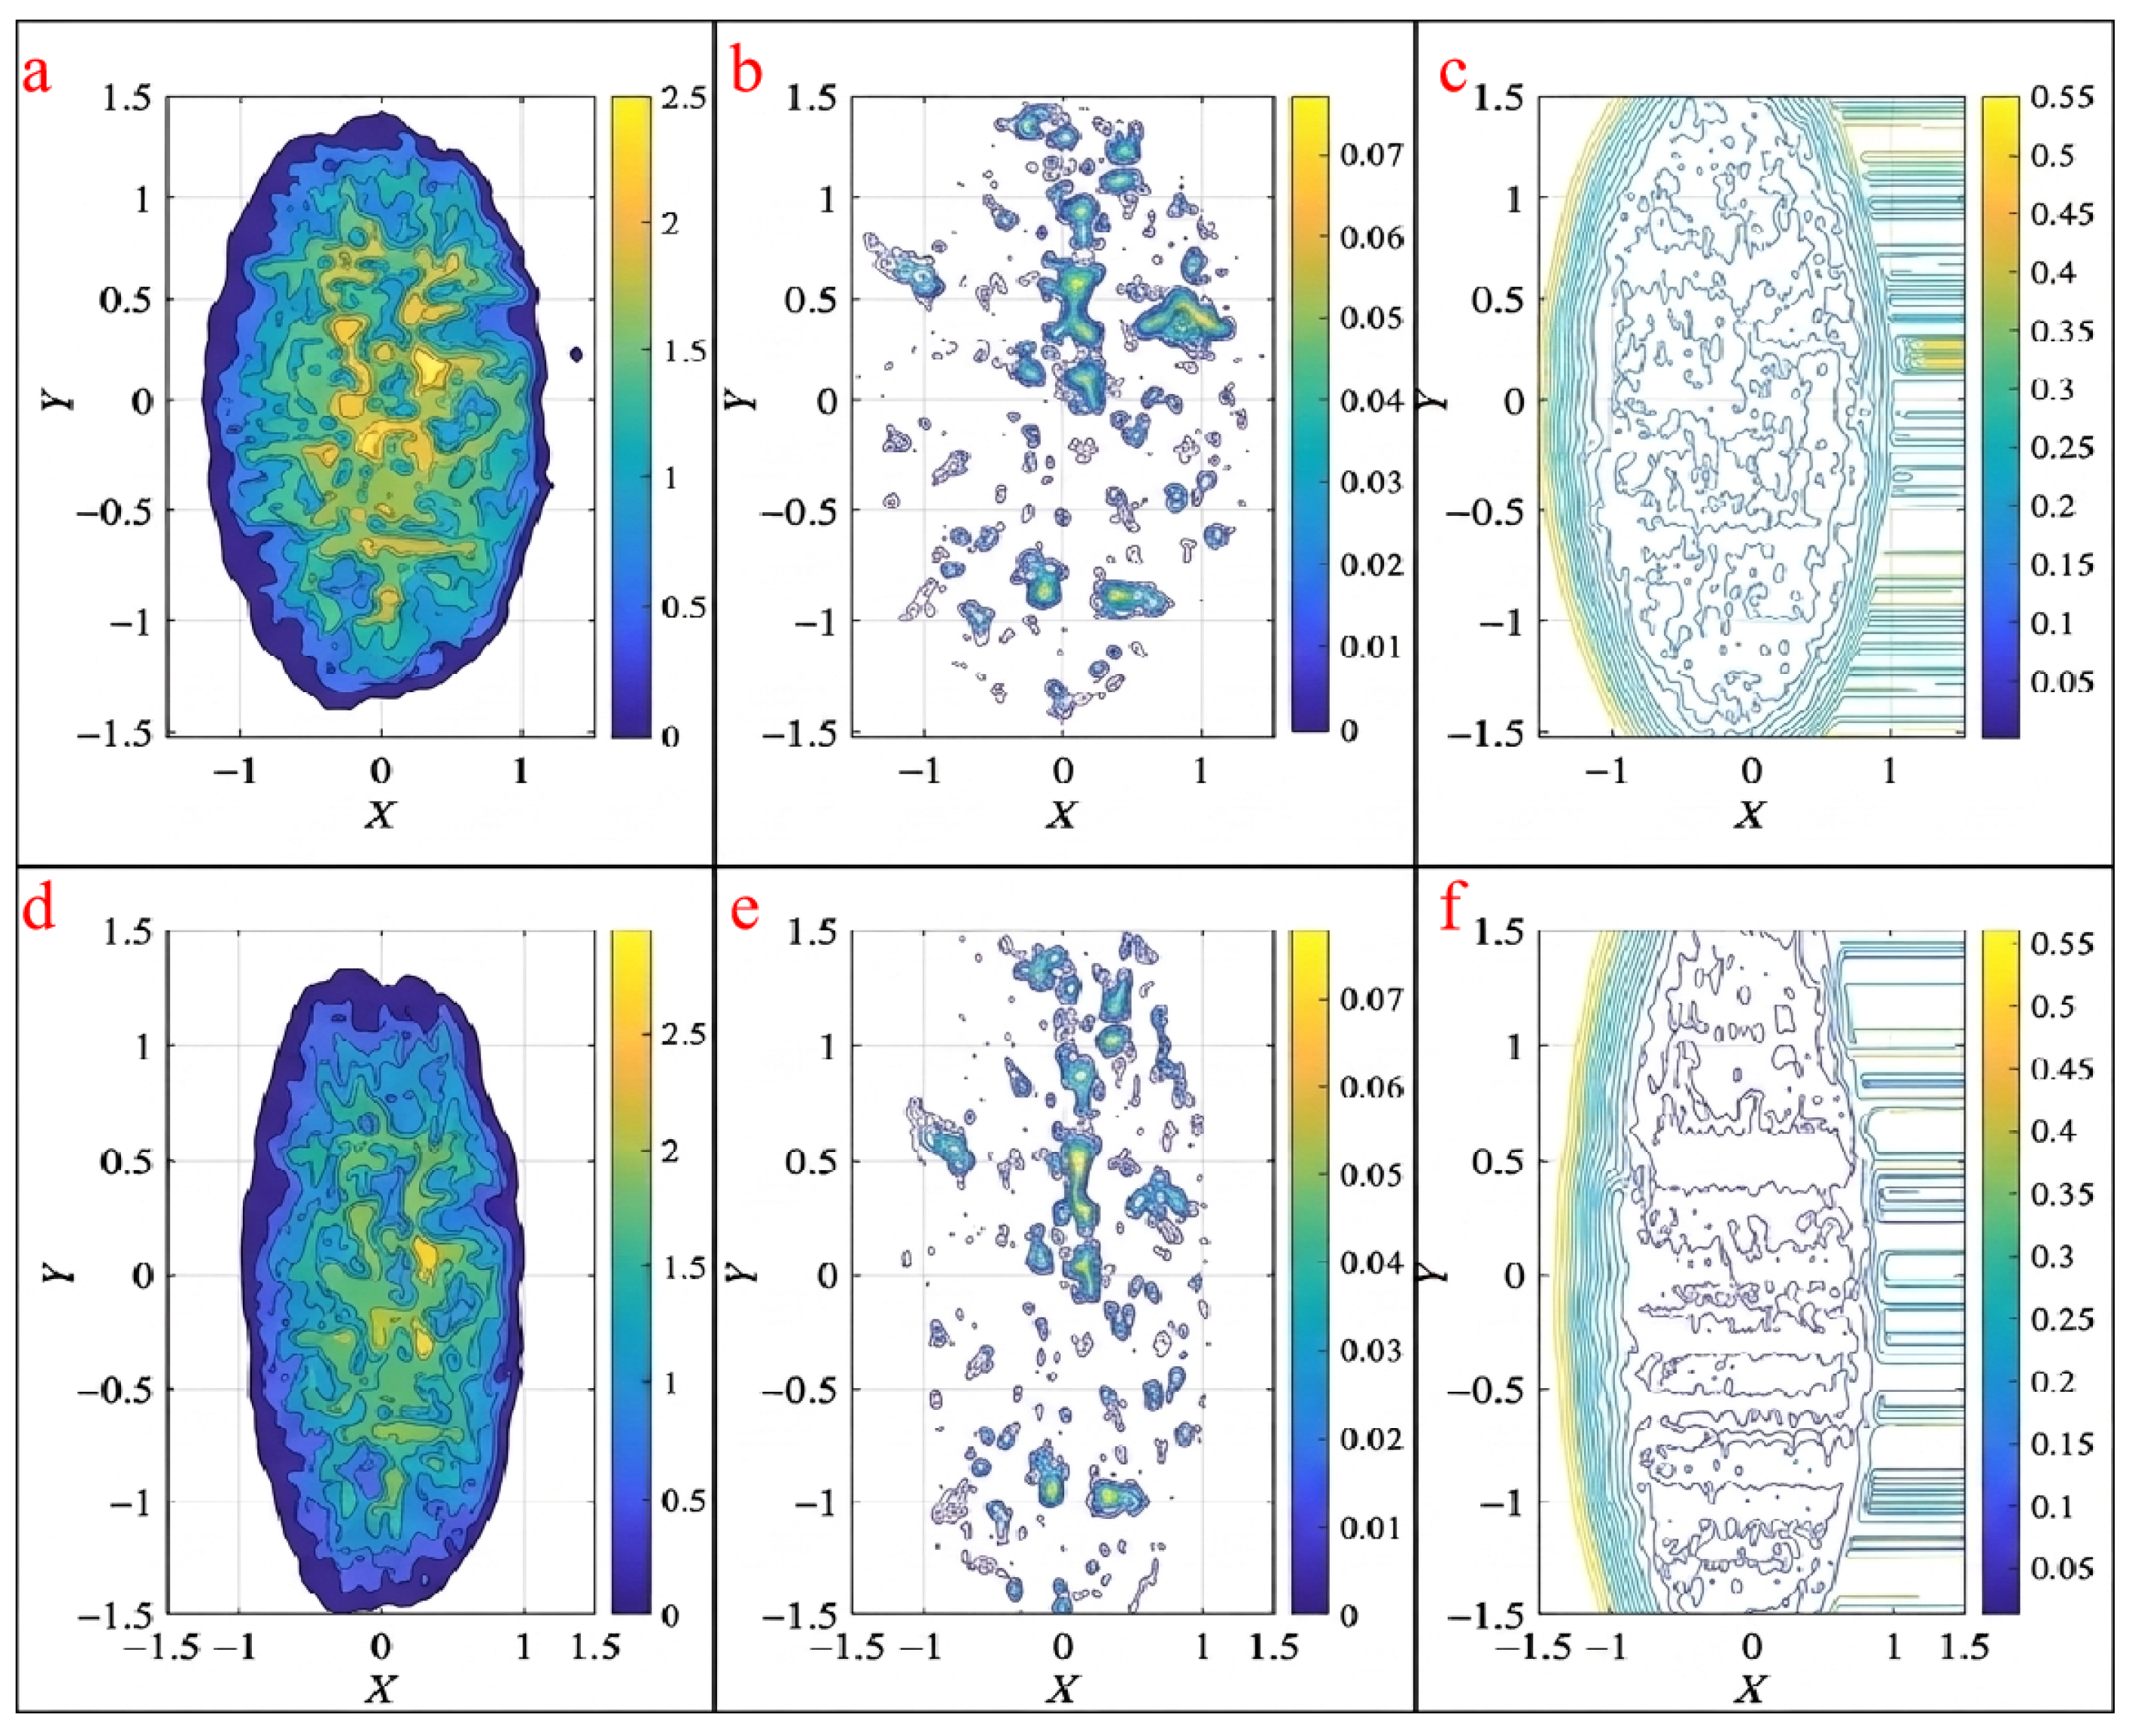
Figure 6 presents the calculated lubricant film pressure, metallic asperity pressure, and film thickness for different rail profiles under the application of a friction modifier. The calculations were performed under the following conditions: a wheel–rail roughness of 0.65 μm, roughness kurtosis of kurail = kuwheel = 3.5, skewness of skrail = skwheel = 1.0, autocorrelation lengths L1 = L2 = 0.3, and an effective film thickness of 20 μm. Figure 11a shows the results for the CHN60 rail profile, and Figure 11b shows those for the CHN60N rail profile. A comparison of the results under the same operating conditions indicates that the friction modifier film thickness is greater for the CHN60N rail profile. As shown by the film thickness results in Figure 11, the thicker film under the CHN60N profile leads to a greater share of the load being carried by the friction modifier and a smaller share being borne by the metallic asperities.
Figure 11.
Pressure carried by the friction modifier and metallic asperities, and film thickness, under different rail profile shapes. (a) Friction modifier pressure for CHN60 (b) Metallic asperity pressure for CHN60 (c) Film thickness distribution for CHN60 (d) Friction modifier pressure for CHN60N (e) Metallic asperity pressure for CHN60N (f) Film thickness distribution for CHN60N.
The observed superiority of the CHN60N profile in film formation can be attributed to its optimized rail head geometry. Compared to the standard CHN60 profile, the CHN60N profile features a modified transverse curvature that provides better conformity with the LMA wheel tread. This geometric optimization results in a larger equivalent contact radius (Ry) at the nominal contact point. According to the EHL theory, an increase in the equivalent radius broadens the contact ellipse, which subsequently reduces the maximum Hertzian pressure (pH) under the same axle load.
From a micro-tribological perspective, the lower contact pressure of the CHN60N profile mitigates the crushing effect on the lubricant film and reduces the deformation of metallic asperities. Simultaneously, the larger contact area enhances the fluid entrainment effect, allowing more water-based friction modifier to be drawn into the contact zone even under starved conditions. As shown in Figure 11, the CHN60N profile maintains a higher film thickness ratio (Λ), which shifts the lubrication regime further away from boundary lubrication toward mixed or elastohydrodynamic lubrication. Consequently, a greater proportion of the wheel–rail load is supported by the fluid film (we) rather than through direct asperity contact (wa), leading to the observed reduction in the overall adhesion coefficient and providing a more stable regulation effect.
4.2.1. Lateral Displacement
The CHN60 rail profile was adopted with a rail cant of 1:40. The wheel–rail roughness was set to 1 μm, with a roughness kurtosis of 3.5, skewness of 1.0, autocorrelation lengths of L1 = L2 = 0.3, a specific slip ratio of 2%, and an effective film thickness of 20 μm. The lateral displacement of the inner wheel–rail contact was investigated at −12, −8, −4, 0, 4, 8, and 10 mm.
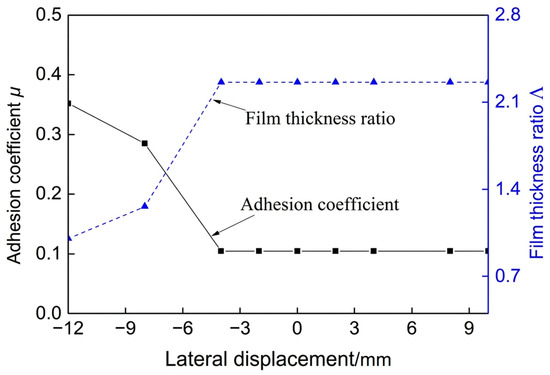
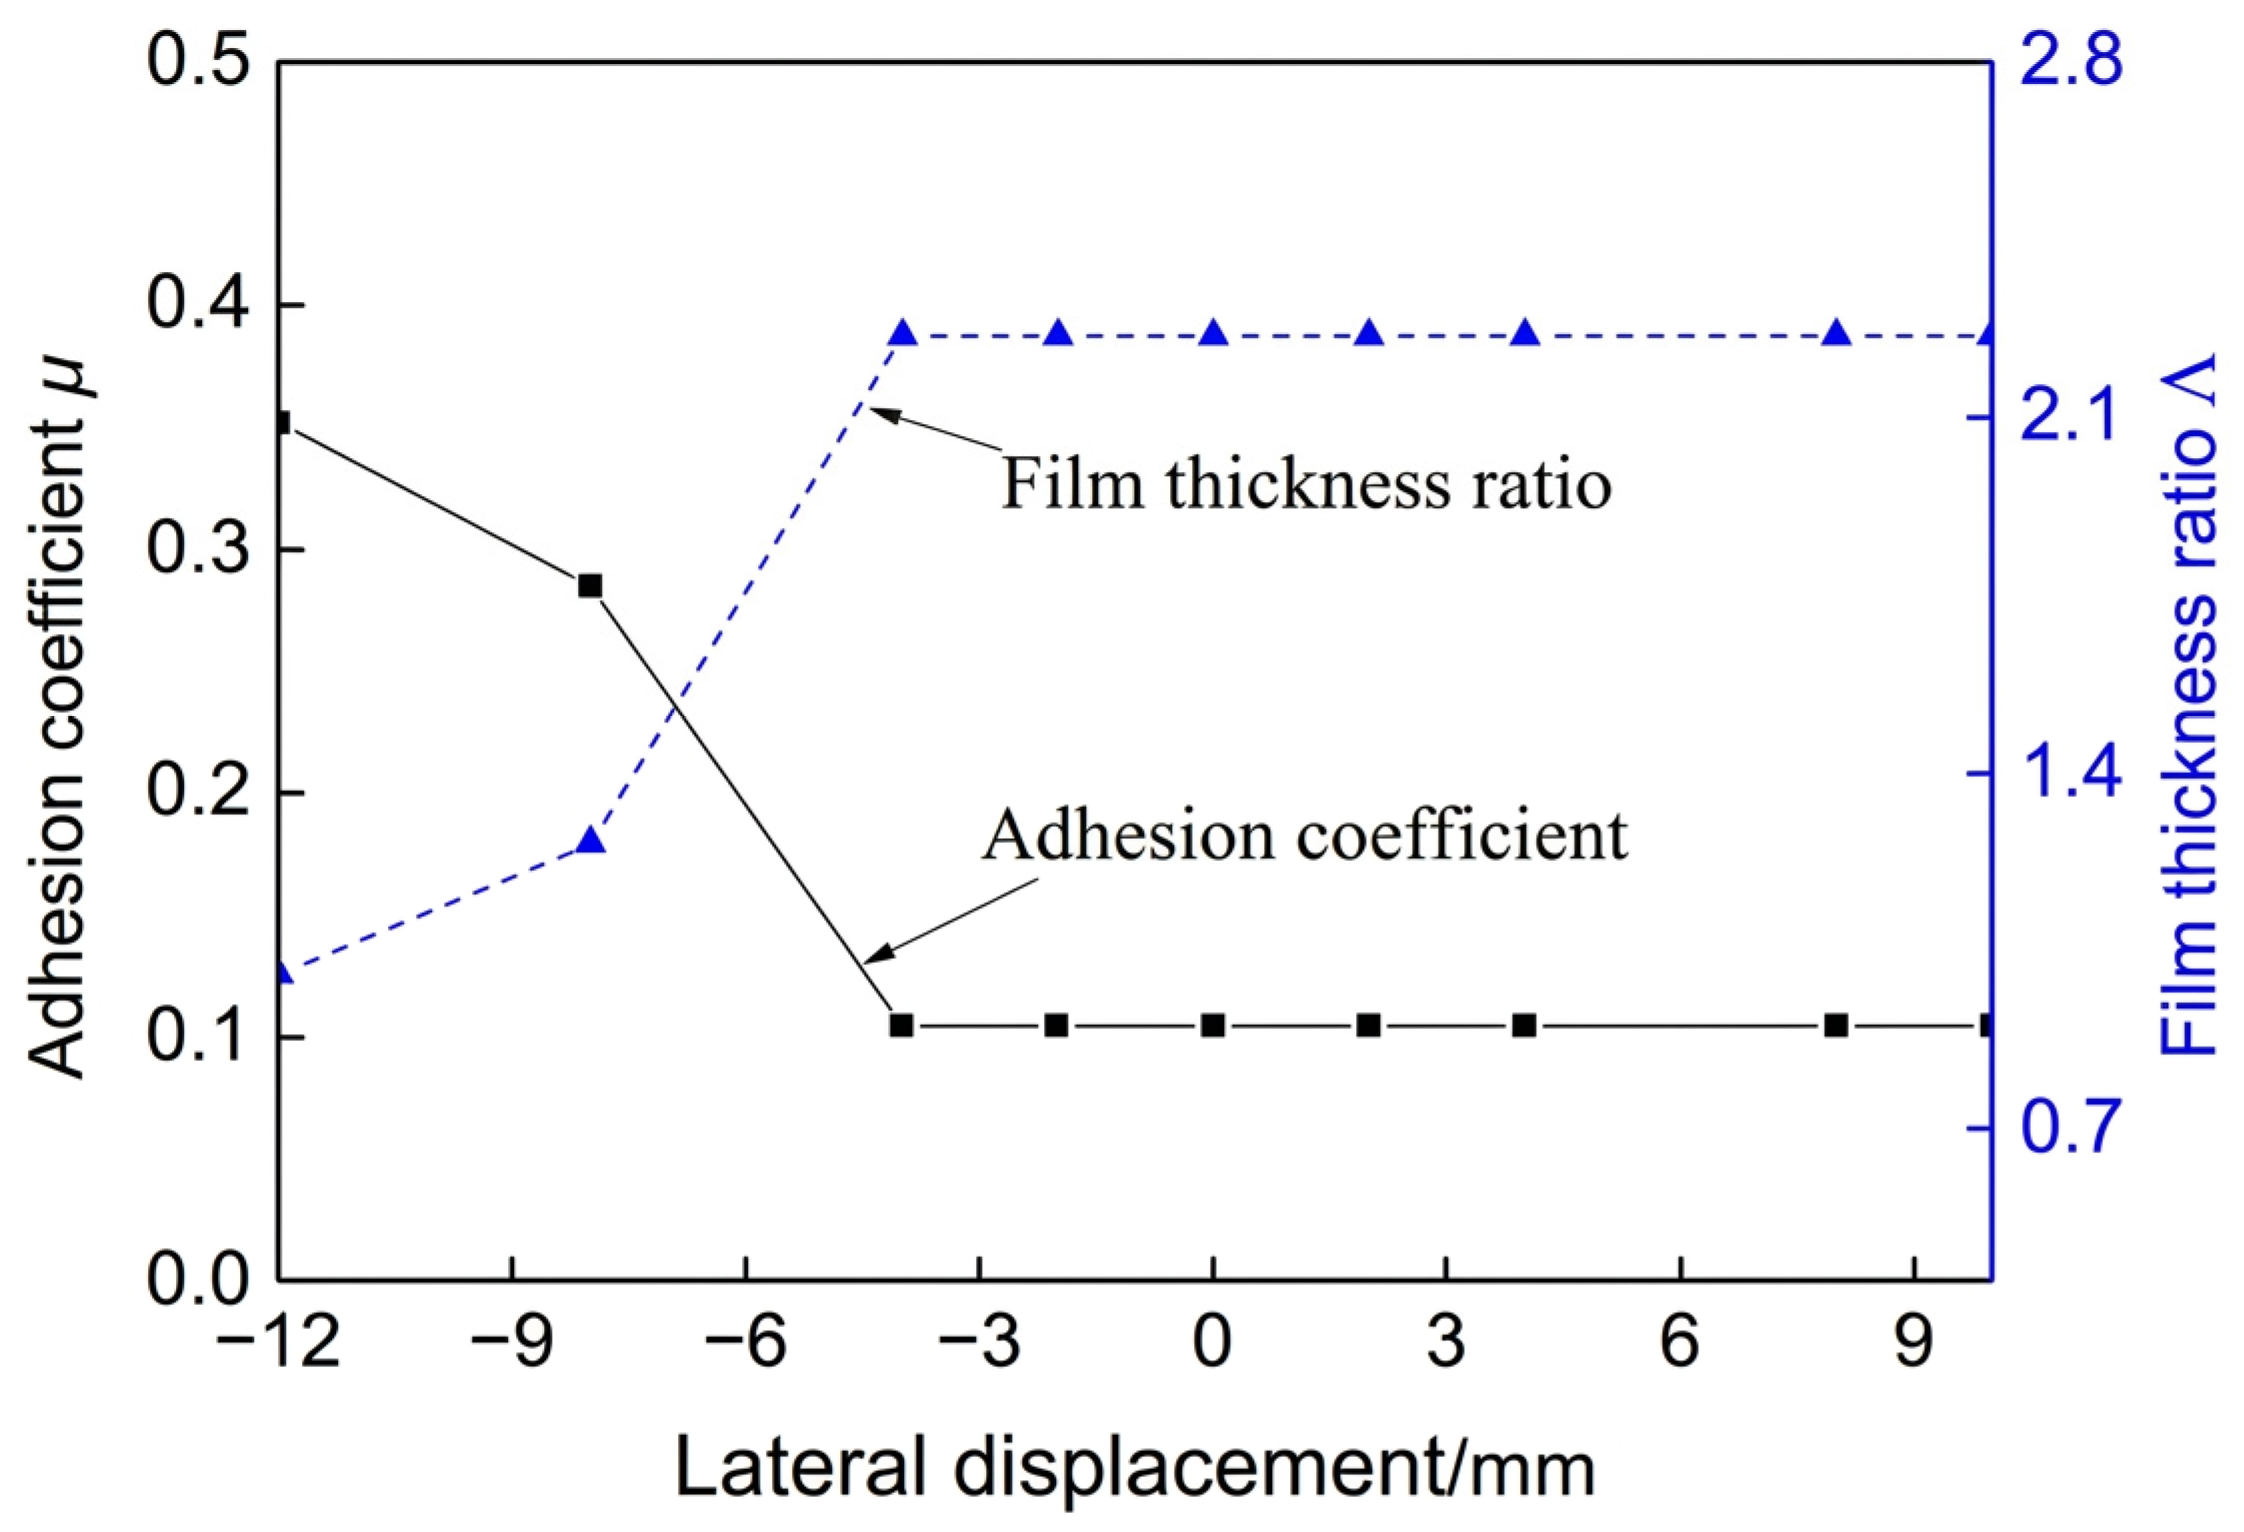
Figure 12 presents the calculated adhesion coefficient and film thickness ratio under different lateral displacement conditions. As the lateral displacement increases, the film thickness ratio gradually rises and then remains essentially constant after reaching 2.28. In contrast, the adhesion coefficient gradually decreases and becomes stable after dropping to 0.1.
Figure 12.
Calculated results of the effects of lateral displacement on the adhesion coefficient and film thickness ratio.
The analysis indicates that the principal factor affecting the adhesion coefficient and film thickness ratio is the radius of curvature of the rail profile at the contact location. Based on the transverse radius distribution of the CHN60 rail profile shown in Figure 1a and the contact positions corresponding to different lateral displacements under a rail cant of 1:40 in Figure 2c, it can be seen that when the lateral displacement is −12 mm, the contact radius is approximately 13 mm, at which point side wear occurs in the wheel–rail contact region. Even with the application of a friction modifier, the adhesion coefficient remains relatively high. As the lateral displacement increases from −12 mm to 12 mm, the rail contact radius first gradually increases to 80 mm and then further increases to 300 mm, while the adhesion coefficient correspondingly decreases. As the lateral displacement gradually increases, the contact patch also gradually enlarges. However, once the lateral displacement reaches −4 mm and beyond, the size of the contact patch remains basically unchanged, and the adhesion coefficient decreases to its minimum value; thereafter, as the lateral displacement continues to increase, the adhesion coefficient remains essentially unchanged.
The fundamental mechanism underlying these observed trends is the significant variation in the equivalent radius of curvature at the wheel–rail contact point during lateral displacement, which reshapes the contact patch geometry and pressure distribution. At large negative lateral displacements (e.g., −12 mm), the contact point is situated in the transition zone between the rail head and the gauge corner, characterized by a relatively small radius of curvature. This smaller radius constricts the contact patch area and generates high local contact pressures, which simultaneously suppresses the fluid entrainment of the friction modifier and intensifies metallic asperity interaction. Consequently, the lubrication regime shifts toward boundary lubrication, resulting in a higher adhesion coefficient. As the wheelset shifts toward the center (approaching −4 mm and beyond), the contact point moves onto the rail crown with a much larger radius. The increased radius significantly expands the contact area and reduces the average contact pressure, thereby enhancing the hydrodynamic entrainment capacity and leading to a rapid rise in the film thickness ratio (Λ). Beyond the critical threshold of −4 mm, the contact geometry enters a relatively flat region of the rail crown where the contact radius and pressure distribution stabilize, causing the adhesion coefficient and film thickness to reach a steady-state plateau.
4.2.2. Outer Rail Superelevation
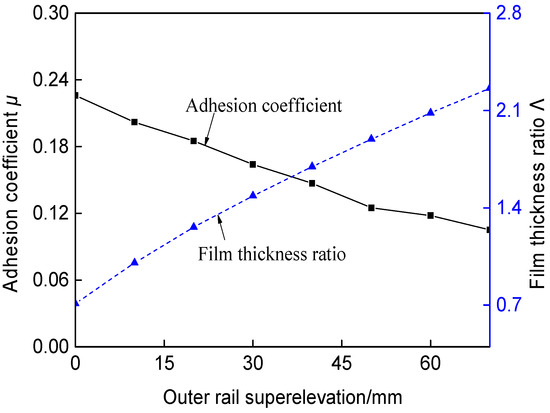
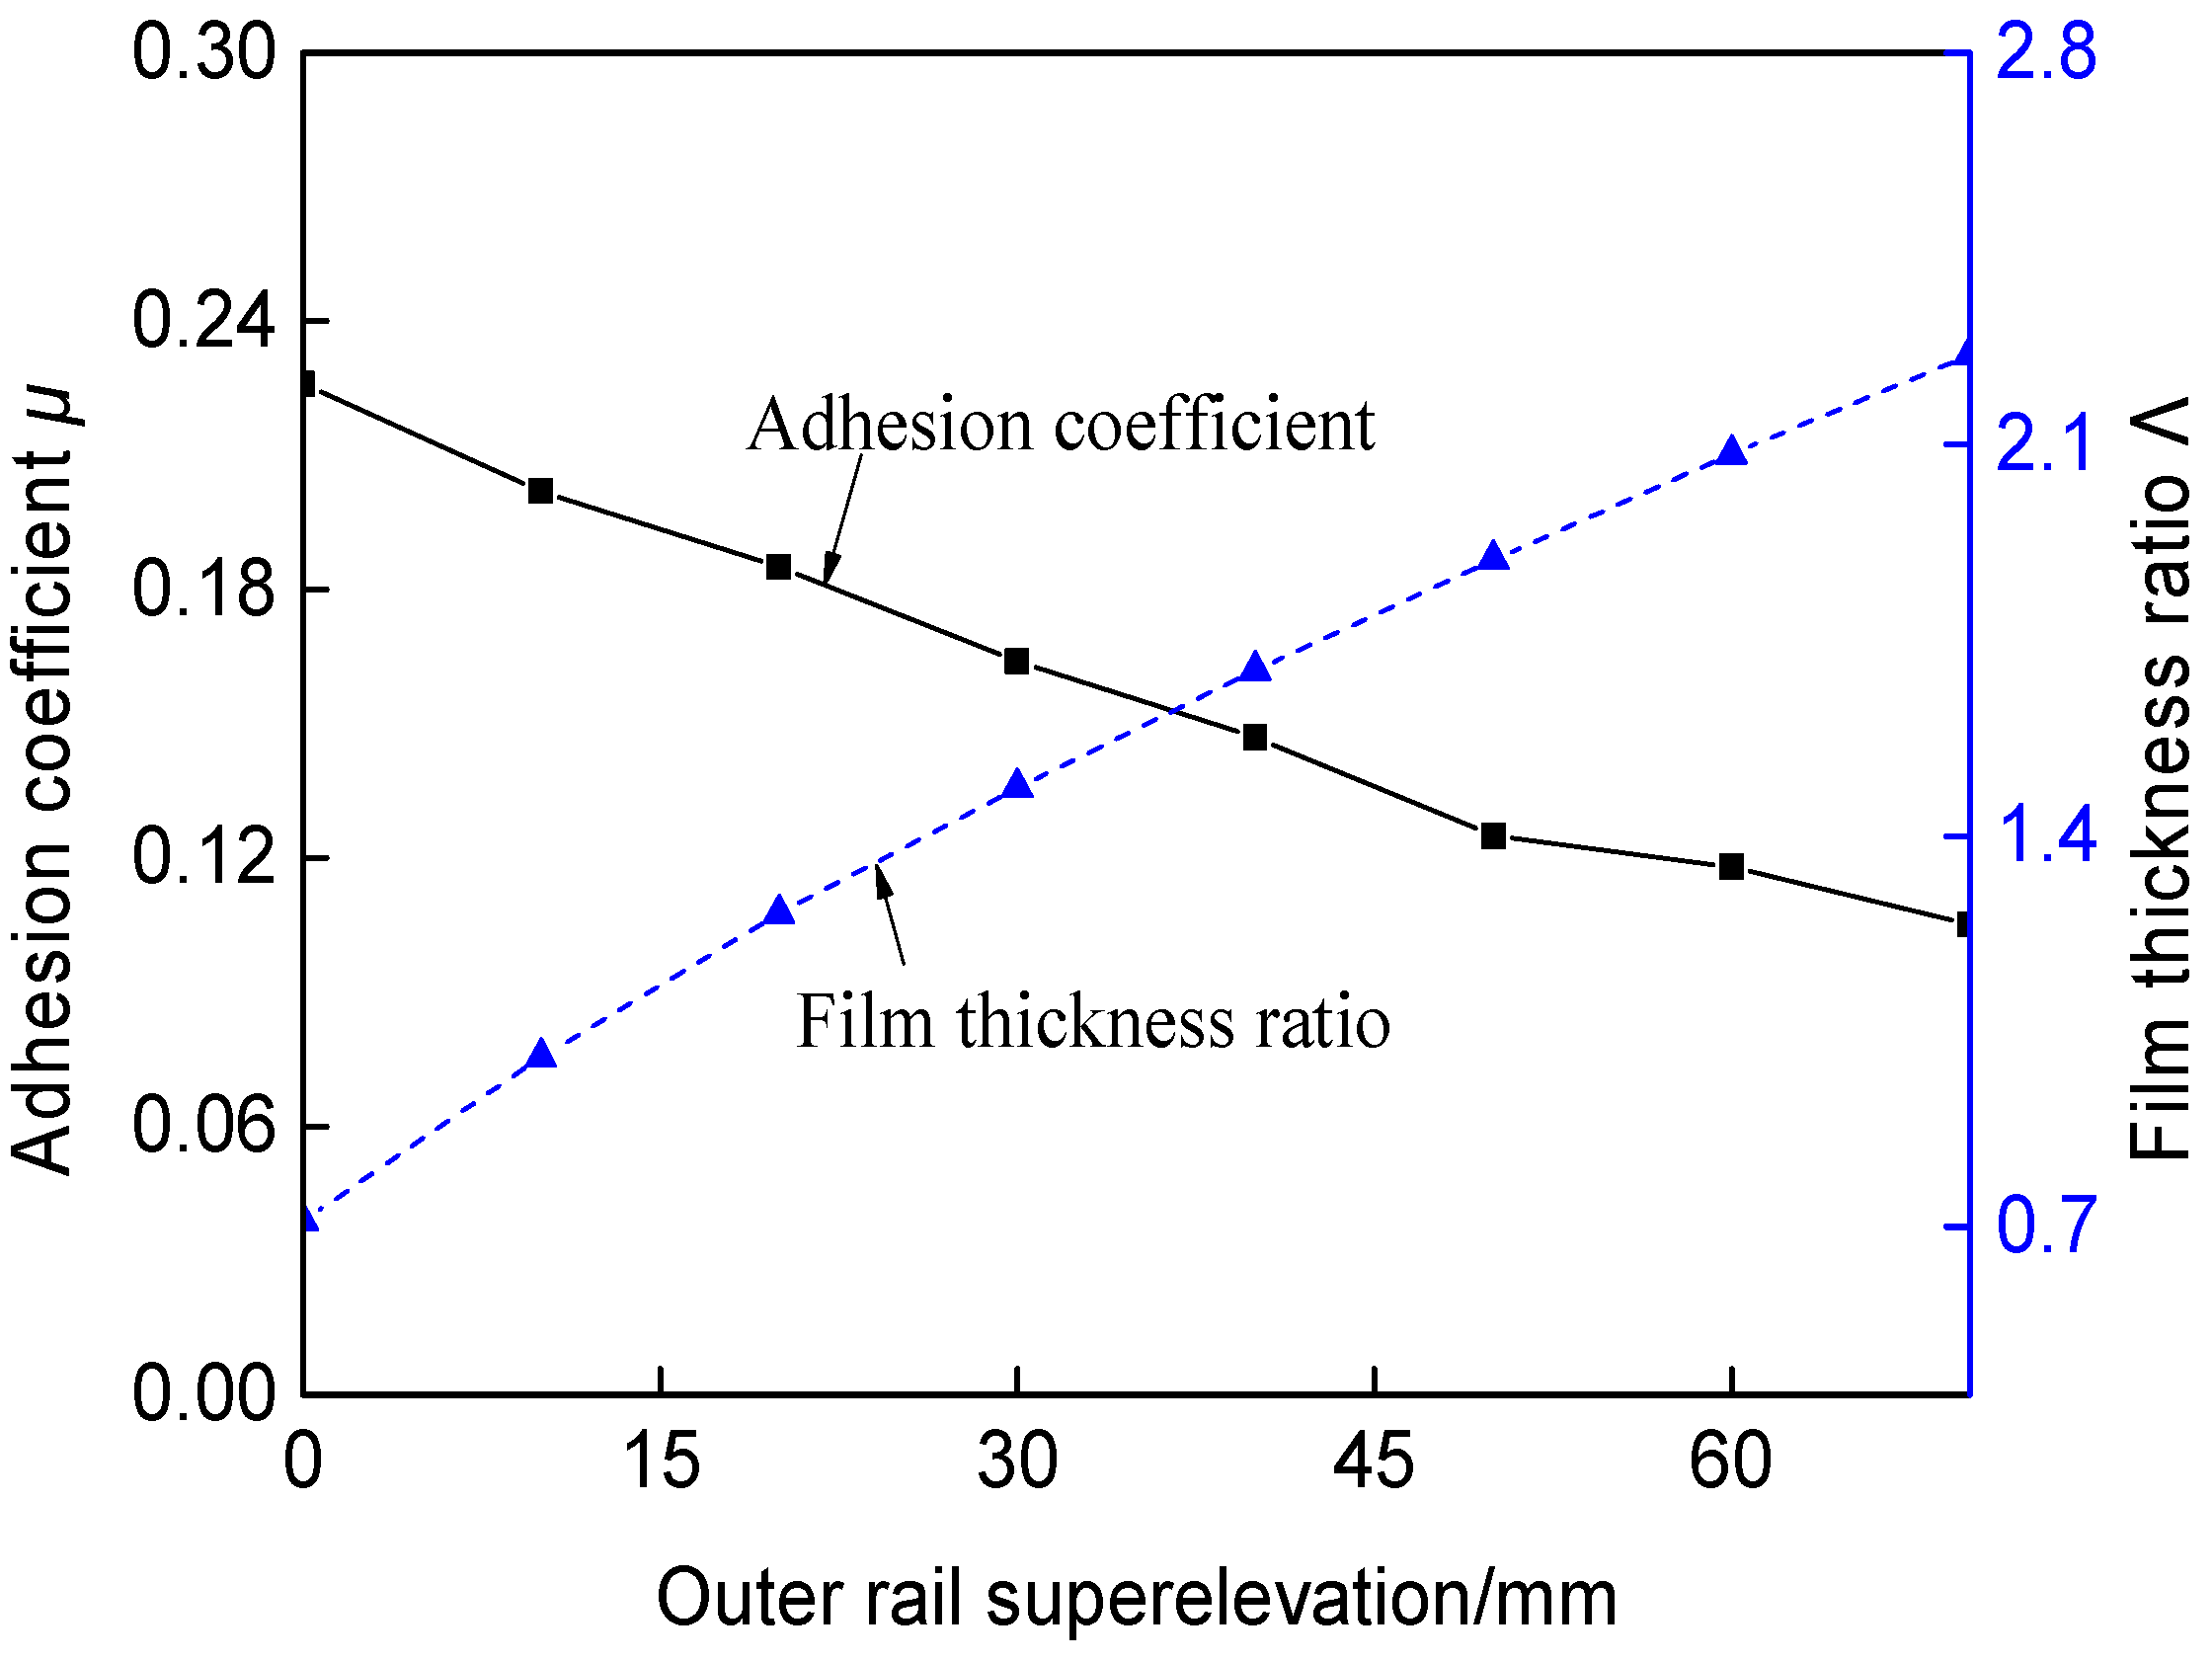
Figure 13 shows the calculated effects of outer rail superelevation on the adhesion coefficient and film thickness ratio. The CHN60 rail profile was adopted, the wheel–rail roughness was set to 1 μm, the roughness kurtosis and skewness were taken as 3.5 and 1.0, respectively, the autocorrelation lengths were L1 = L2 = 0.3, and the effective film thickness was 20 μm. The outer rail superelevation was varied as 0, 10, 20, 30, 40, 50, 60, and 70 mm for the analysis.
Figure 13.
Calculated results for the effects of outer-rail cant on the adhesion coefficient and film thickness ratio.
When a train enters a curved track section, centrifugal effects may cause load redistribution between the inner and outer rails. In the present model, however, centrifugal force-induced dynamic load transfer is not explicitly solved through a vehicle–track dynamic model. The superelevation effect is introduced in a quasi-static manner through the normal-load component associated with the rail inclination angle θ. Therefore, the superelevation results should be interpreted as contact-level trends rather than complete vehicle curving predictions.
The calculation results indicate that as the outer rail superelevation increases—that is, as the angle θ in Figure 3 increases—the film thickness ratio gradually increases, while the adhesion coefficient gradually decreases. The main reason is that the normal contact force on the wheel–rail interface decreases progressively with increasing outer rail superelevation. According to the Stribeck curve, a reduction in normal force causes the lubrication regime to shift gradually toward elastohydrodynamic lubrication, thereby leading to a progressive decrease in the adhesion coefficient.
4.3. Effects of Operating Parameters on Wheel–Rail Adhesion Behavior
4.3.1. Axle Load
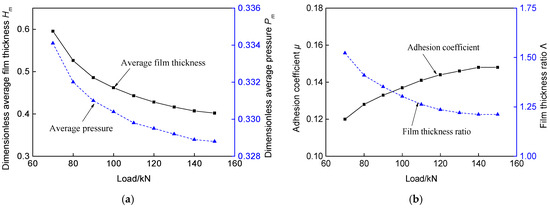
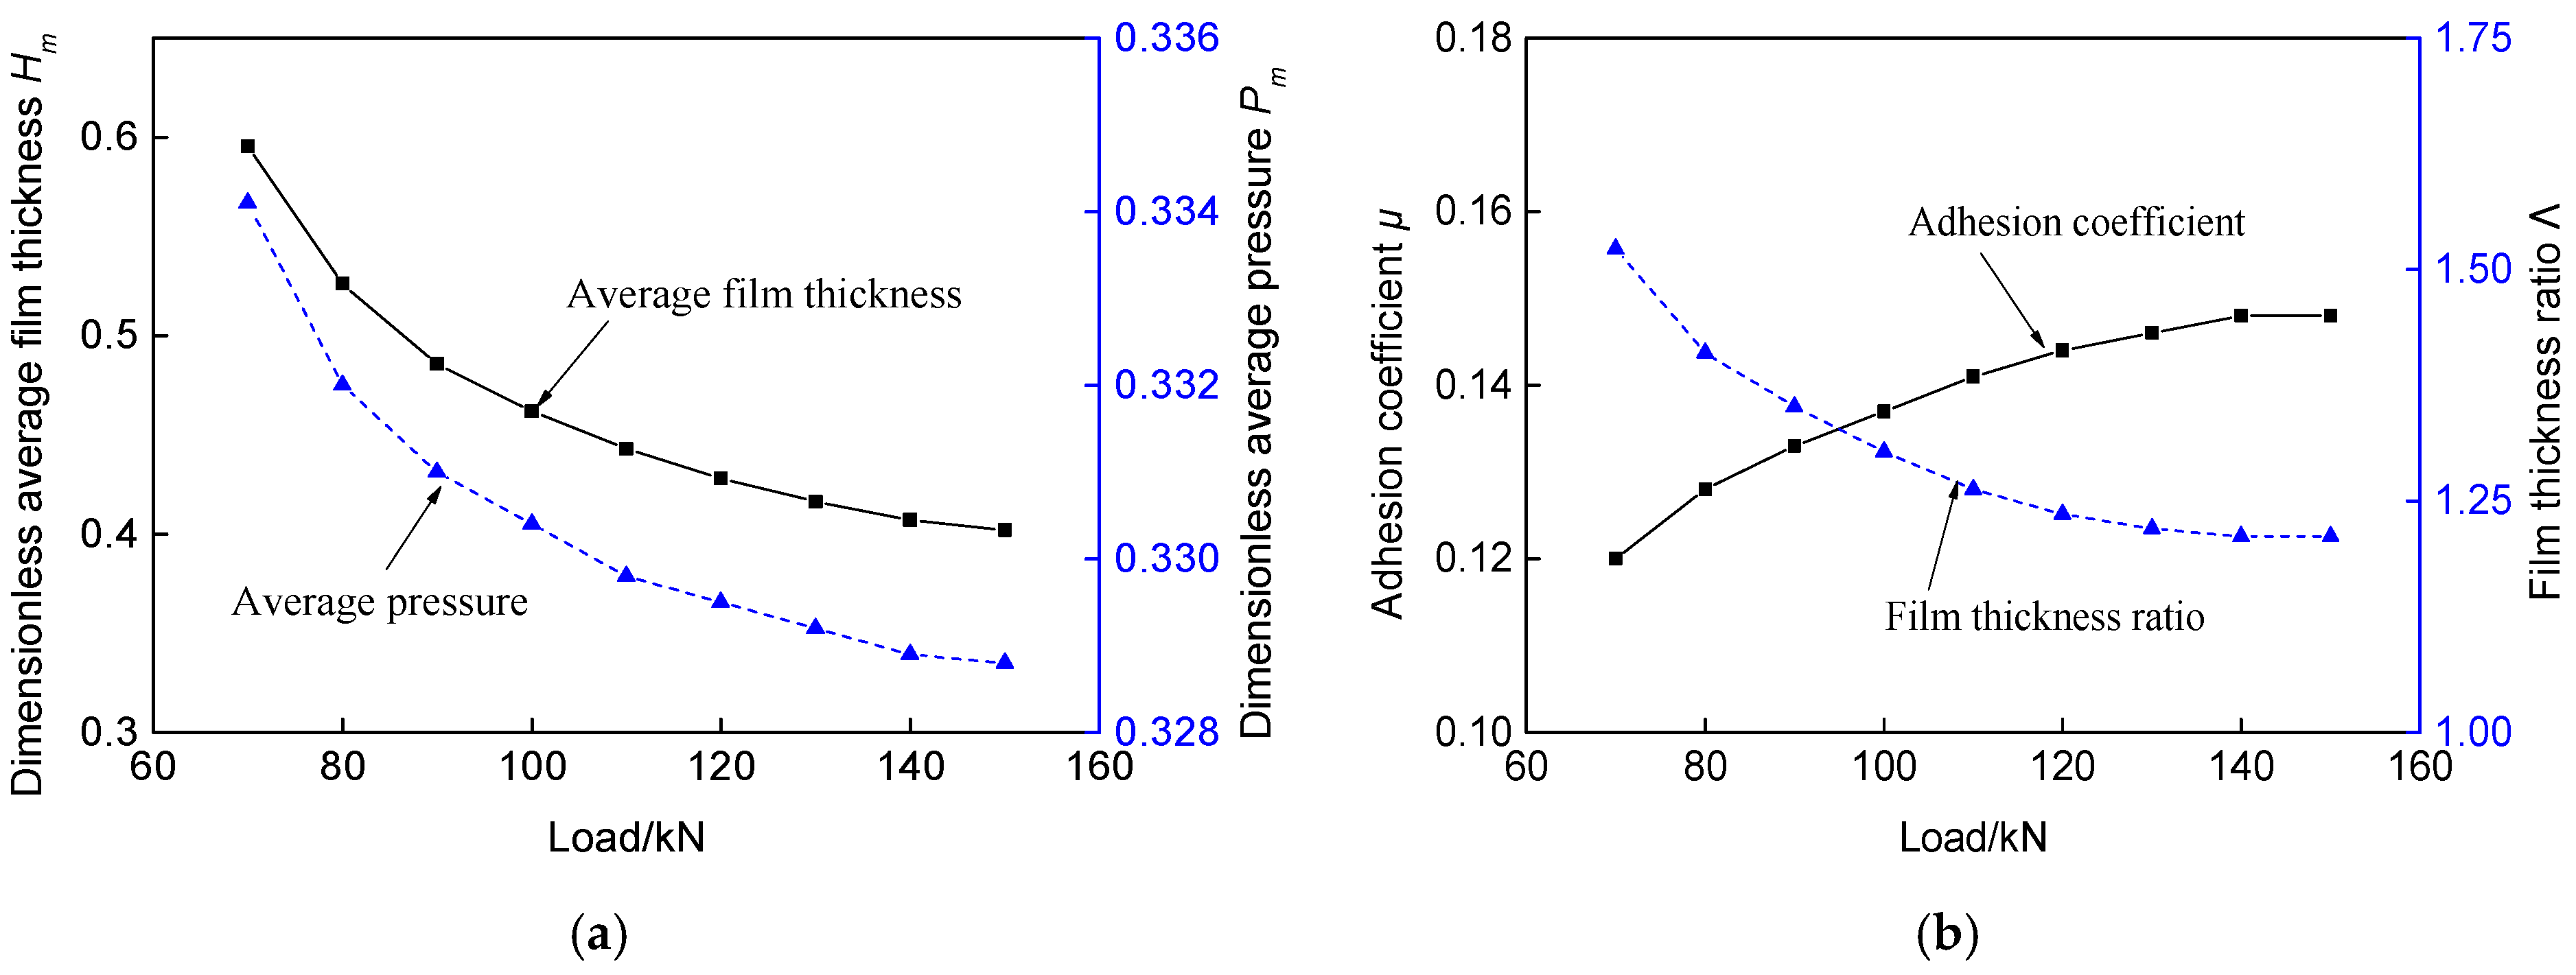
The CHN60 rail profile was adopted, with a rail cant of 1/40. The speed was set at 120 km/h, the creepage was 2%, the wheel–rail roughness was taken as 1 μm, the roughness kurtosis and skewness were set to 3.5 and 1.0, respectively, the autocorrelation lengths were L1 = L2 = 0.3, and the effective film thickness was 20 μm. Axle loads of 14, 16, 18, 20, 22, 24, 26, 28, and 30 t were considered in the analysis, corresponding to wheel–rail contact loads of 70, 80, 90, 100, 110, 120, 130, 140, and 150 kN, respectively.
Figure 14a presents the calculated effects of wheel–rail contact load on the average film thickness and average pressure in the contact zone. As the contact load increases, both the dimensionless average film thickness and the dimensionless average pressure gradually decrease. This is because a higher load makes it more difficult for the externally applied friction modifier to enter the contact region, thereby reducing its average film thickness. The reduction in film thickness lowers the film thickness ratio, which in turn decreases the pressure borne by the friction modifier and thus reduces the dimensionless average pressure, while the pressure carried by the metallic solid asperities increases correspondingly.
Figure 14.
Calculated results for the effects of wheel–rail contact load: (a) The average film thickness and average pressure in the contact zone; (b) the adhesion coefficient and film thickness ratio.
Figure 14b presents the calculated effects of wheel–rail contact load on the adhesion coefficient and film thickness ratio. As the wheel–rail contact load gradually increases, less friction modifier is entrained into the contact region, and the thickness of the resulting lubricating film progressively decreases. Consequently, the film thickness ratio declines, the pressure borne by the metallic asperities gradually increases, and the adhesion coefficient correspondingly rises. This result is consistent with the trend predicted by the Stribeck curve: as the load increases, the lubrication regime gradually shifts from elastohydrodynamic lubrication toward mixed lubrication, and the adhesion coefficient therefore increases.
4.3.2. Speed
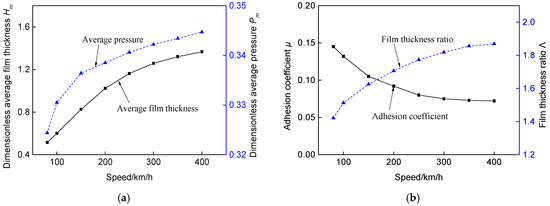
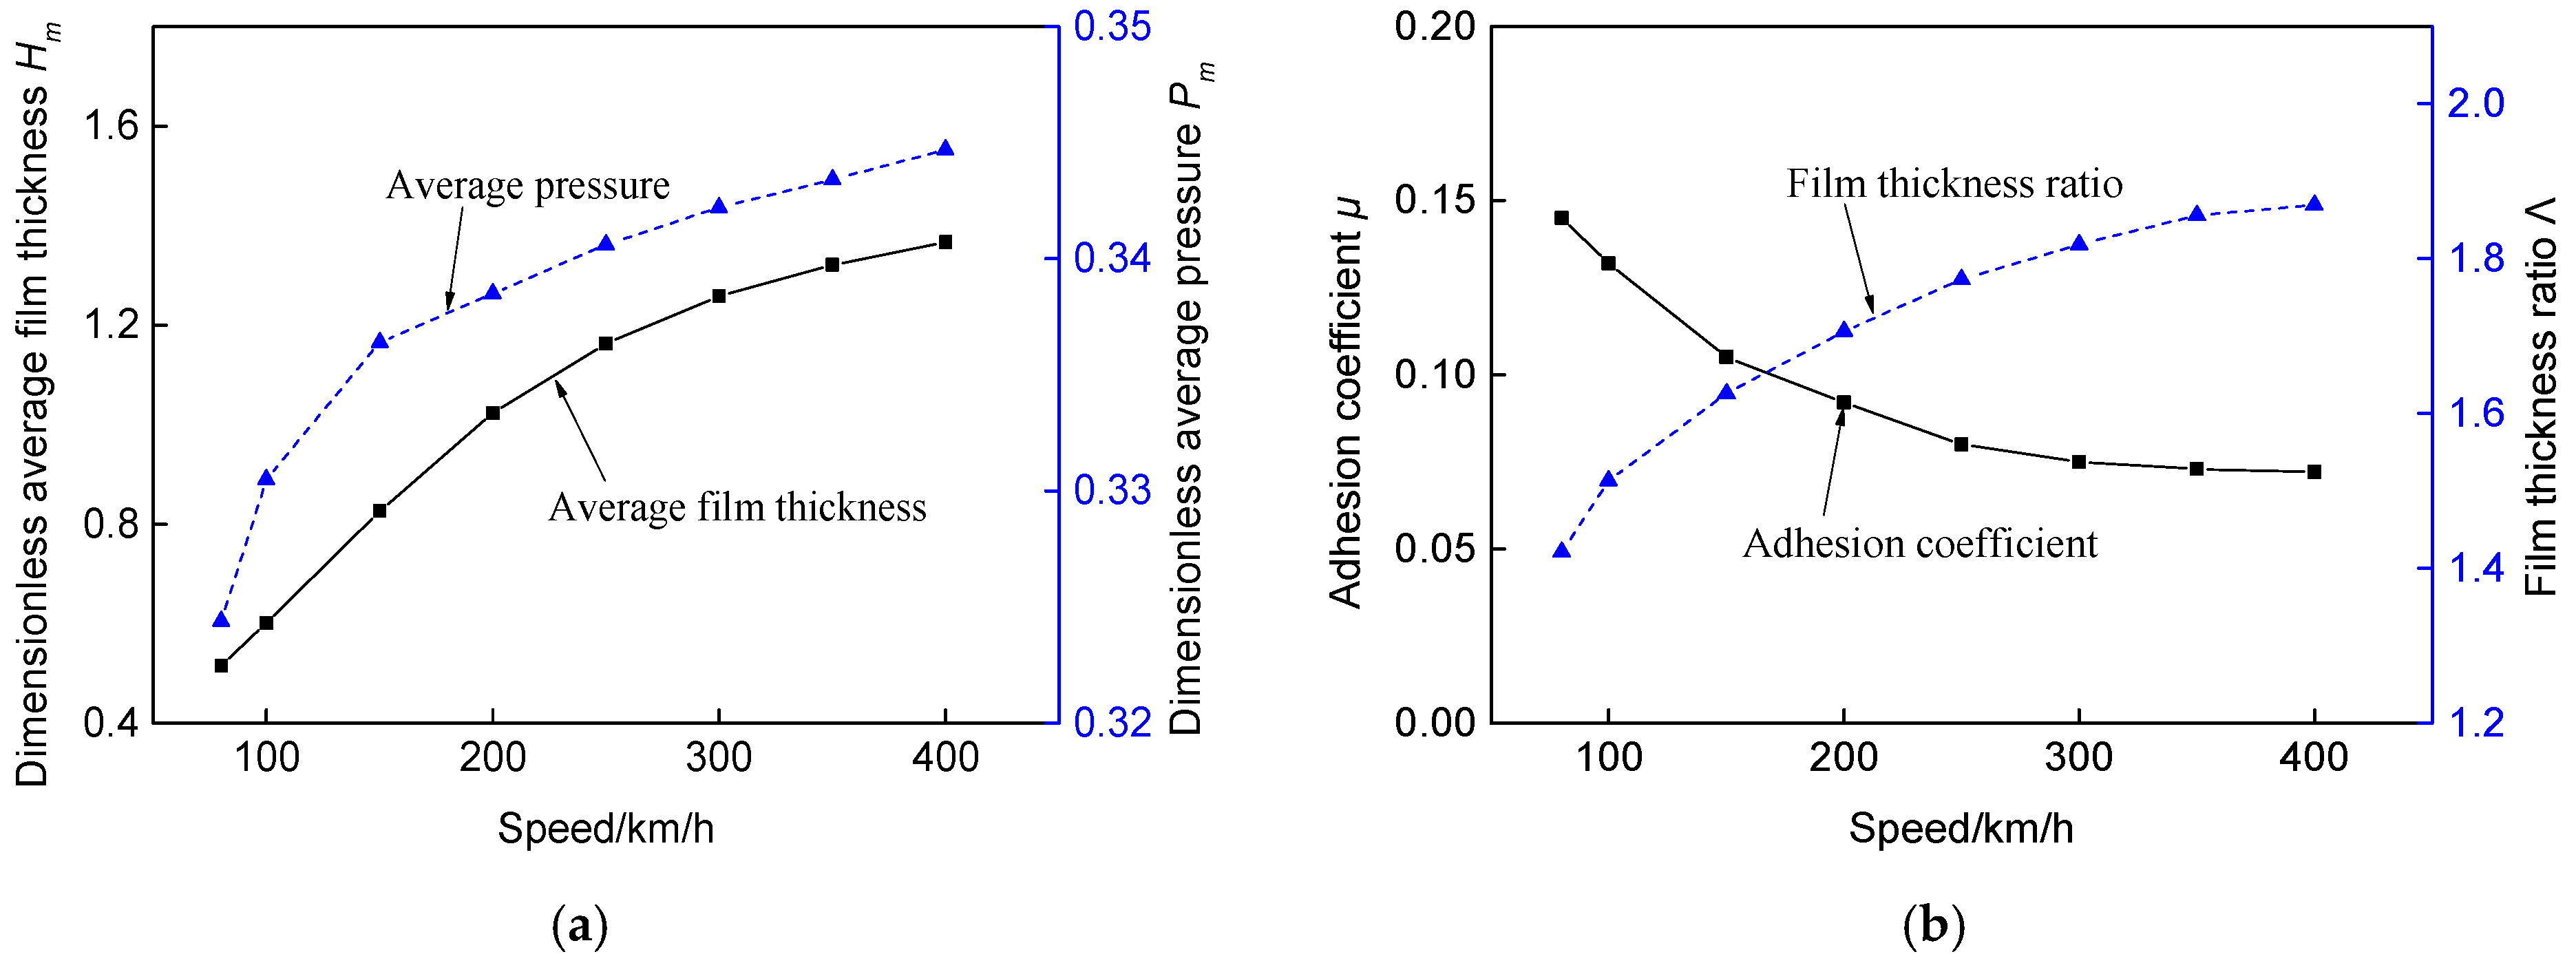
The CHN60 rail profile was adopted, with a rail cant of 1/40. The axle load was set at 14 t, the creepage was 2%, the wheel–rail surface roughness was taken as 1 μm, the roughness kurtosis and skewness were set to 3.5 and 1.0, respectively, the autocorrelation lengths were L1 = L2 = 0.3, and the effective film thickness was 20 μm. The running speeds considered were 80, 100, 150, 200, 250, 300, 350, and 400 km/h.
Figure 15a presents the calculated effects of train speed on the dimensionless average film thickness and dimensionless average pressure in the wheel–rail contact zone. As the train speed increases, the dimensionless average film thickness of the lubricating film formed by the friction modifier on the wheel–rail contact surfaces gradually increases, and the dimensionless average pressure borne by the friction modifier also increases accordingly. This is because a higher running speed increases the volume of friction modifier entrained into the contact region, thereby increasing the lubricating film thickness and film thickness ratio, which in turn raises the pressure carried by the friction modifier while reducing the pressure supported by the metallic asperities.
Figure 15.
Calculated results for the effects of running speed: (a) The average film thickness and average pressure in the contact zone; (b) the adhesion coefficient and film thickness ratio.
Figure 15b presents the calculated effects of running speed on the adhesion coefficient and film thickness ratio. As the speed increases, the film thickness ratio gradually increases, whereas the adhesion coefficient gradually decreases. This is because, with increasing running speed, the lubricating film formed by the friction modifier carries a progressively larger proportion of the load, thereby reducing the adhesion coefficient. These results are consistent with the trend predicted by the Stribeck curve: as the speed increases, the friction modifier film becomes thicker, and the lubrication regime gradually shifts from starved lubrication toward elastohydrodynamic lubrication; consequently, the adhesion coefficient decreases.
4.3.3. Creepage
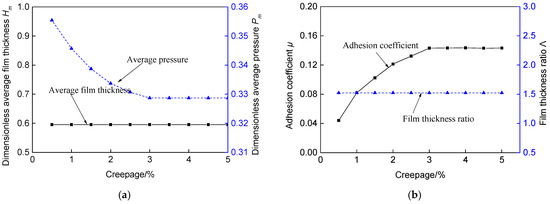
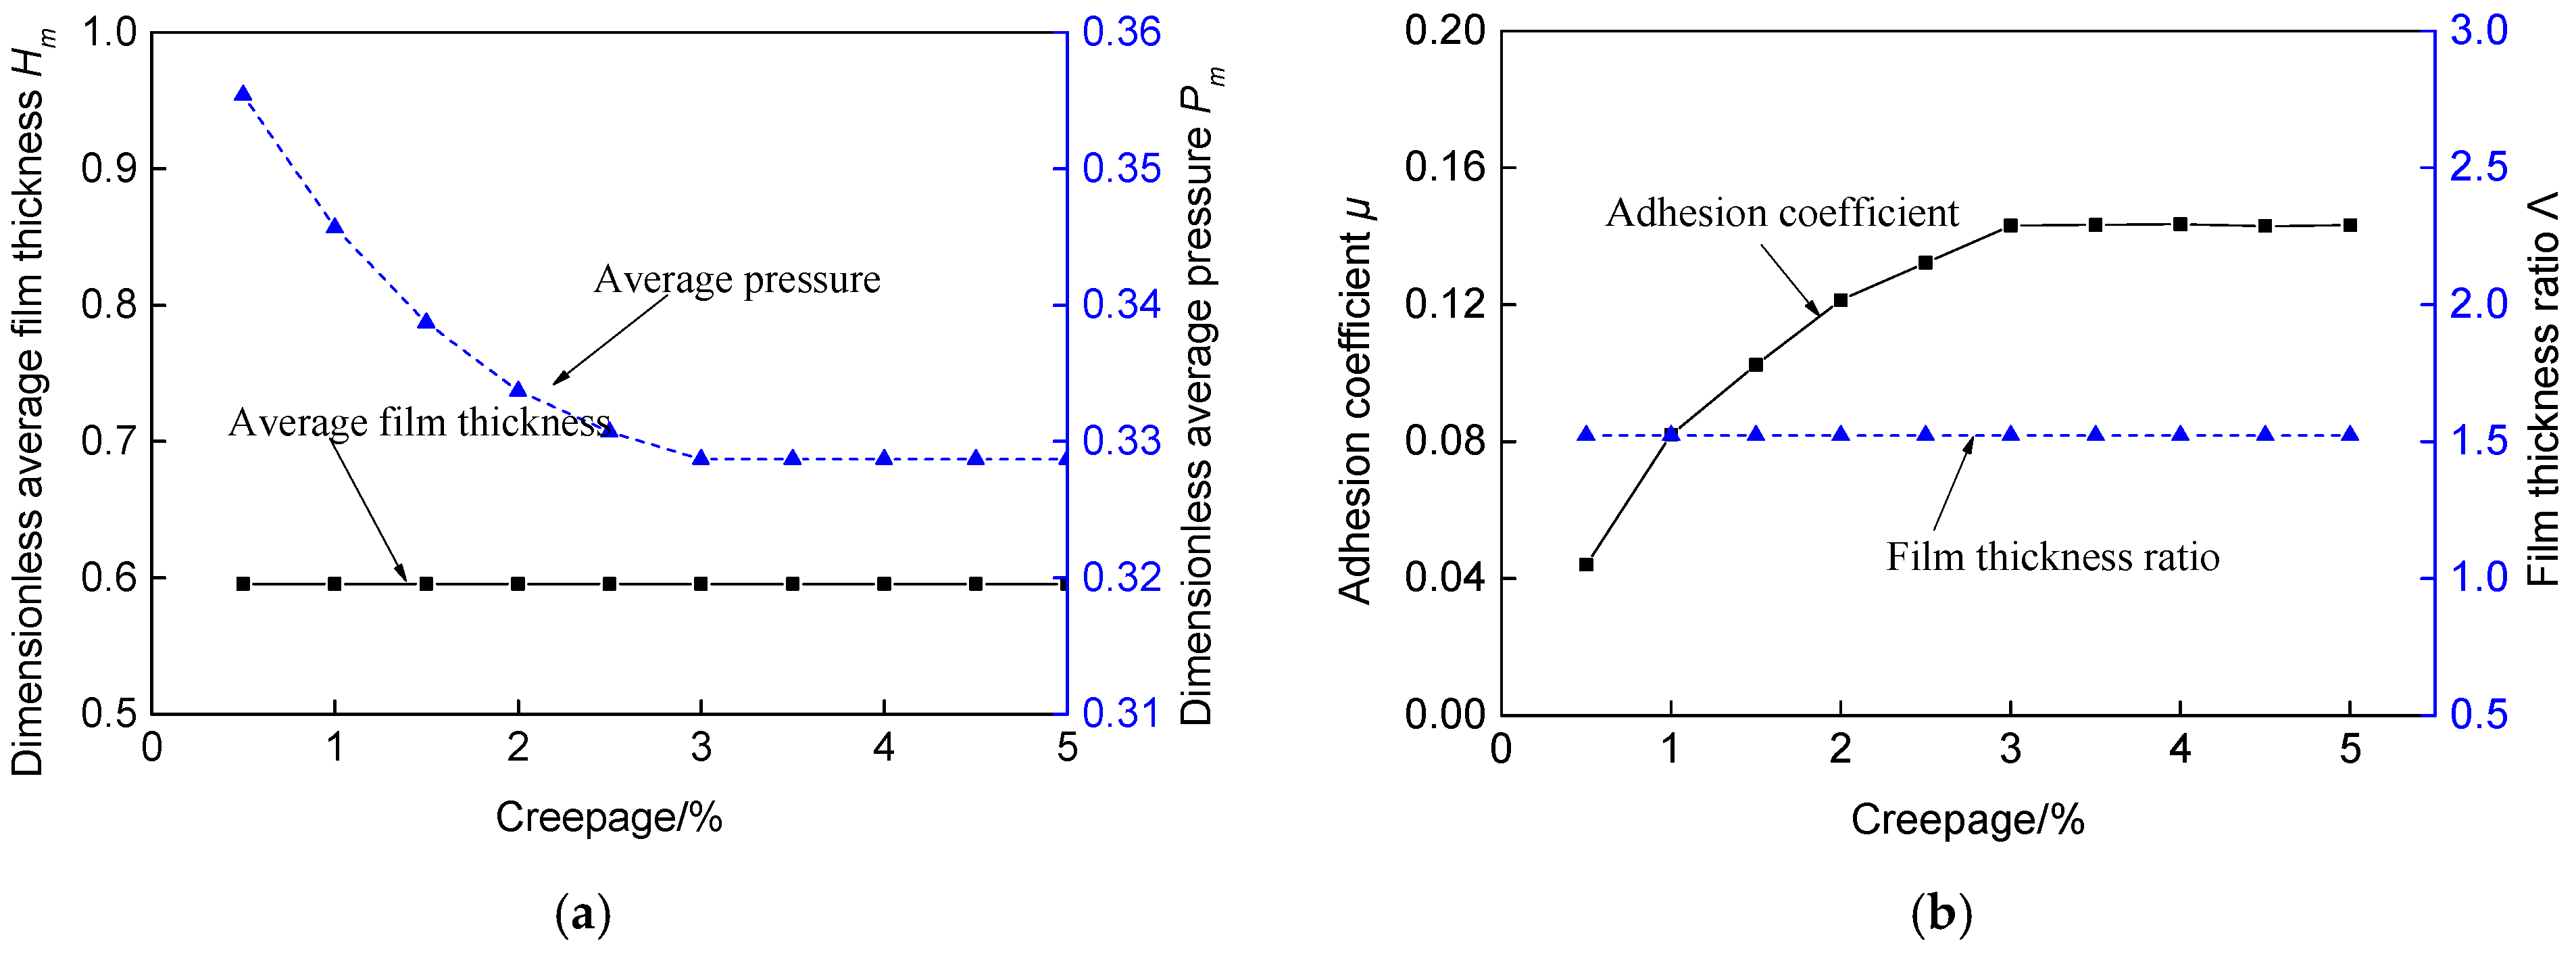
The CHN60 rail profile was adopted, with a rail cant of 1/40. The axle load was set at 14 t, the speed was fixed at 120 km/h, the wheel–rail surface roughness was taken as 1 μm, for the kurtosis kurail = kuwheel = 3.5 and skewness skrail = skwheel = 1.0, the autocorrelation lengths were L1 = L2 = 0.3, and the effective film thickness was 20 μm. Creepage values of 0.5, 1.0, 1.5, 2.0, 2.5, 3.0, 3.5, 4.0, 4.5, and 5.0 were considered in the analysis.
Figure 16a presents the calculated effects of creepage on the average film thickness and average pressure in the contact zone. As creepage increases, the dimensionless average film thickness remains essentially constant, whereas the dimensionless average pressure carried by the friction modifier gradually decreases and eventually approaches a stable value. An increase in creepage does not alter the amount of friction modifier entering the contact region, but it enhances the adhesive interaction in solid contact, thereby increasing the pressure borne by the solid asperities and correspondingly reducing the pressure carried by the friction modifier.
Figure 16.
Calculated results for the effects of creepage: (a) The film thickness and pressure; (b) the adhesion coefficient and film thickness ratio.
Figure 16b presents the calculated effects of creepage on the adhesion coefficient and film thickness ratio. As creepage gradually increases, the film thickness ratio remains essentially stable. However, under dry conditions, an increase in creepage causes the adhesion coefficient to rise progressively until it eventually reaches a stable value. Therefore, under the application of a friction modifier, the adhesion coefficient increases with the increase in creepage; specifically, when the creepage reaches 3%, the adhesion coefficient reaches a saturation point and enters a stable stage. Once the pressures borne by both the friction modifier and the solid asperities have stabilized, any further increase in creepage no longer leads to a significant rise in the adhesion coefficient.
No empirical saturation point was imposed in the numerical model. The apparent saturation around 3% creepage emerges from the calculated balance between lubricant-film shear and asperity-contact contribution under the selected parameters. Because this value is parameter-dependent, it should be regarded as a model outcome for the present TORFM and contact conditions rather than a universal threshold.
5. Conclusions
Under the application of water-based friction modifiers, the adhesion behavior of wheel–rail contact on curved track sections was investigated by integrating a non-Newtonian starved EHL model with track geometry constraints. The primary conclusions are as follows:
- (1)
- Rail profile geometry dictates the lubrication regime:
The rail head profile significantly influences the initial contact geometry and subsequent film formation. Under identical operating conditions, the CHN60N profile exhibits superior geometric conformity with the wheel tread compared to the CHN60 profile, leading to a 10–15% increase in the lubricating film thickness. This enhanced entrainment reduces the proportion of load carried by metallic asperities, resulting in a more stable and lower adhesion coefficient (decreasing from 0.35 to 0.1).
- (2)
- Track geometry alters the lubrication balance via normal force redistribution:
Lateral displacement and outer rail superelevation regulate adhesion by shifting the contact point and altering the normal force. An increase in superelevation (from 0 to 70 mm) leads to a 15–25% reduction in the adhesion coefficient, as the decreasing normal force drives the lubrication state toward the Stribeck transition zone. Furthermore, a critical lateral displacement threshold of −4 mm is identified; beyond this value, the contact radius and patch size stabilize, causing the adhesion coefficient to reach a minimum plateau.
- (3)
- Competition between speed-induced entrainment and load-induced compression:
Operating parameters play a decisive role in the film thickness ratio (Λ). Increasing running speed enhances fluid entrainment, shifting the regime from starved lubrication toward elastohydrodynamic lubrication and thus lowering the adhesion coefficient. Conversely, increasing the axle load from 14 t to 30 t compresses the lubricant film, but the simultaneous expansion of the contact area results in a 12% rise in the stabilized adhesion level. This confirms that the adhesion–creep evolution is governed by the nonlinear coupling of rheological properties and contact pressure.
- (4)
- Saturation characteristics of the adhesion–creep curve:
The adhesion coefficient exhibits a clear saturation trend with increasing creepage. From 0.5% to 3.0% creepage, the adhesion coefficient rises rapidly as asperity interaction intensifies. Once creepage exceeds 3.0%, the load-sharing ratio between the friction modifier film and metallic asperities reaches a steady state, and further increases in creepage do not yield significant changes in the adhesion coefficient, marking the transition to a stable regulation stage.
- (5)
- Guidance for precision friction management:
The study clarifies that the available wheel–rail adhesion on curves depends on the coupled distribution of fluid pressure and asperity contact stress. To prevent abnormal wear while ensuring braking safety, the spray dosage and application frequency of friction modifiers must be precisely calibrated based on the specific curve radius and rail profile type to maintain the adhesion coefficient within the optimal functional range (0.3–0.4).
Author Contributions
Conceptualization, Q.L. and L.Y.; methodology, Q.L.; software, Q.L. and H.Z.; validation, H.Z. and R.L.; formal analysis, Q.L.; investigation, X.S. and Y.W.; resources, X.S.; data curation, R.L.; writing—original draft preparation, X.S.; writing—review and editing, Q.L. and E.L.; supervision, L.Y.; project administration, E.L. and Y.W.; funding acquisition, Q.L. All authors have read and agreed to the published version of the manuscript.
Funding
This research was funded by Henan Provincial Science and Technology Research Project, grant number No. 252102241063, No. 262102230168 and No. 242102220079, and Key Research Projects of Henan Province Higher Education Institutions, grant number No. 25B460019.
Data Availability Statement
The data presented in this study are available.
Conflicts of Interest
The authors declare no conflicts of interest.
Nomenclature
| a | Hertzian contact ellipse semi-width in x direction (m) |
| b | Hertzian contact ellipse semi-width in y direction (m) |
| E′ | Effective elastic modulus (Pa) |
| h | Total gap between wheel/rail surfaces (m) |
| h0 | Initial central film thickness (m) |
| hoil | Effective film thickness of the FM-supply layers (m) |
| n | Rheological index (-) |
| pe, pa | Pressure borne by film and asperities (Pa) |
| pH | Maximum Hertzian stress (Pa) |
| Rx, Ry | Radius in x and y direction (m) |
| sk | Roughness skewness of wheel and rail (-) |
| ku | Roughness kurtosis of wheel and rail (-) |
| we | Load borne by film (Pa) |
| wa | Load borne by asperities (Pa) |
| w | Total load (Pa) |
| x | Abscissa along the rolling direction (m) |
| y | Ordinate perpendicular to the rolling direction (m) |
| X | Dimensionless abscissa X = x/a (-) |
| Y | Dimensionless ordinate Y = y/a (-) |
| Z0 | Pressure-viscous coefficient (-) |
| σ | Total roughness (m) |
| σwheel, σrail | Surface RMS roughness of wheel and rail (m) |
| μ | Total adhesion coefficient (-) |
| μe, μa | Adhesion coefficient of FM and asperities (-) |
| θ | Fractional film content (-) |
| η | Viscosity of FM at operating pressure (Pa s) |
| ρ | Density of FM at the contact area (kg/m3) |
| Ω | computational domain (-) |
| Λ | Thickness ratio (-) |
References
- Han, J.; Xiao, X.; Wu, Y.; Wen, Z.; Zhao, G. Effect of rail corrugation on metro interior noise and its control. Appl. Acoust. 2018, 130, 63–70. [Google Scholar] [CrossRef] [Scilit]
- Xin, T.; Wang, S.; Gao, L.; Huo, H.; Ding, Y.; Wang, P.; Chen, P.; Liu, P. Field measurement of rail corrugation influence on environmental noise and vibration: A case study in China. Measurement 2020, 164, 108084. [Google Scholar] [CrossRef] [Scilit]
- Galas, R. Friction Modification Within Wheel-Rail Contact. Ph.D. Thesis, Brno University of Technology, Brno, Czech Republic, 2017. [Google Scholar]
- Li, X.; Yang, T.; Zhang, J.; Cao, Y.; Wen, Z.; Jin, X. Rail wear on the curve of a heavy haul line-Numerical simulations and comparison with field measurements. Wear 2016, 366–367, 131–138. [Google Scholar] [CrossRef] [Scilit]
- Wang, W.; Wang, H.; Wang, H.; Guo, J.; Liu, Q.; Zhu, M.; Jin, X. Sub-scale simulation and measurement of railroad wheel/rail adhesion under dry and wet conditions. Wear 2013, 302, 1461–1467. [Google Scholar] [CrossRef] [Scilit]
- Lewis, R.; Gallardo-Hernandez, E.A.; Hilton, T.; Armitage, T. Effect of oil and water mixtures on adhesion in the wheel/rail contact. Proc. Inst. Mech. Eng. Part F J. Rail Rapid Transit 2009, 223, 275–283. [Google Scholar] [CrossRef] [Scilit]
- Gallardo-Hernandez, E.A.; Lewis, R. Twin disc assessment of wheel/rail adhesion. Wear 2008, 265, 1309–1316. [Google Scholar] [CrossRef] [Scilit]
- Harmon, M.; Lewis, R. Review of top of rail friction modifier tribology. Tribol.-Mater. Surf. Interfaces 2016, 10, 150–162. [Google Scholar] [CrossRef] [Scilit]
- Stock, R.; Stanlake, L.; Hardwick, C.; Yu, M.; Eadie, D.; Lewis, R. Material concepts for top of rail friction management—Classification, characterisation and application. Wear 2016, 366–367, 225–232. [Google Scholar] [CrossRef] [Scilit]
- Liu, X.G.; Meehan, P.A. Investigation of squeal noise under positive friction characteristics condition provided by friction modifiers. J. Sound Vib. 2016, 371, 393–405. [Google Scholar] [CrossRef] [Scilit]
- Olofsson, U.; Lyu, Y.Z. Open system tribology in the wheel-rail contact—A literature review. Appl. Mech. Rev. 2017, 69, 060803. [Google Scholar] [CrossRef] [Scilit]
- Galas, R.; Kvarda, D.; Omasta, M.; Krupka, I.; Hartl, M. The role of constituents contained in water-based friction modifiers for top-of-rail application. Tribol. Int. 2018, 117, 87–97. [Google Scholar] [CrossRef] [Scilit]
- Kalousek, J.; Johnson, K.L. An investigation of short pitch wheel and rail corrugations on the Vancouver mass transit system. Proc. Inst. Mech. Eng. Part F J. Rail Rapid Transit 1992, 206, 127–135. [Google Scholar] [CrossRef] [Scilit]
- Eadie, D.T.; Santoro, M.; Kalousek, J. Railway noise and the effect of top of rail liquid friction modifiers: Changes in sound and vibration spectral distributions in curves. Wear 2005, 258, 1148–1155. [Google Scholar] [CrossRef] [Scilit]
- Egana, J.I.; Vinolas, J.; Gil-Negrete, N. Effect of liquid high positive friction (HPF) modifier on wheel-rail contact and rail corrugation. Tribol. Int. 2005, 38, 769–774. [Google Scholar] [CrossRef] [Scilit]
- Eadie, D.T.; Santoro, M. Top-of-rail friction control for curve noise mitigation and corrugation rate reduction. J. Sound Vib. 2006, 293, 747–757. [Google Scholar] [CrossRef] [Scilit]
- Suda, Y.; Iwasa, T.; Komine, H.; Tomeoka, M.; Nakazawa, H.; Matsumoto, K.; Nakai, T.; Tanimoto, M.; Kishimoto, Y. Development of onboard friction control. Wear 2005, 258, 1109–1114. [Google Scholar] [CrossRef] [Scilit]
- Hardwick, C.; Lewis, R.; Stock, R. The effects of friction management materials on rail with pre existing rcf surface damage. Wear 2017, 384–385, 50–60. [Google Scholar] [CrossRef] [Scilit]
- Lundberg, J.; Rantatalo, M.; Wanhainen, C.; Casselgren, J. Measurements of friction coefficients between rails lubricated with a friction modifier and the wheels of an IORE locomotive during real working conditions. Wear 2015, 324–325, 109–117. [Google Scholar] [CrossRef] [Scilit]
- Rahmani, H.; Gutsulyak, D.; Stanlake, L.; Stoeber, B.; Green, S. Carrydown of liquid friction modifier. Proc. Inst. Mech. Eng. Part F J. Rail Rapid Transit 2022, 236, 1124–1134. [Google Scholar] [CrossRef] [Scilit]
- Wedeven, L.D.; Evans, D.; Cameron, A. Optical analysis of ball bearing starvation. J. Lubr. Technol. 1971, 93, 349–361. [Google Scholar] [CrossRef] [Scilit]
- Yang, P.; Wang, J.; Kaneta, M. Thermal and non-Newtonian numerical analyses for starved EHL line contacts. J. Tribol. 2006, 128, 282–290. [Google Scholar] [CrossRef] [Scilit]
- Galas, R.; Omasta, M.; Krupka, I.; Hartl, M. Laboratory investigation of ability of oil-based friction modifiers to control adhesion at wheel-rail interface. Wear 2016, 368–369, 230–238. [Google Scholar] [CrossRef] [Scilit]
- Spikes, H. Friction modifier additives. Tribol. Lett. 2015, 60, 5. [Google Scholar] [CrossRef] [Scilit]
- Li, Q.; Zhang, S.Y.; Wu, B.N.; Lin, Q.; Ding, H.H.; Galas, R.; Kvarda, D.; Omasta, M.; Wang, W.J.; Wen, Z.F. Analysis on the effect of starved elastohydrodynamic lubrication on the adhesion behavior and fatigue index of wheel-rail contact. Wear 2022, 510–511, 204506. [Google Scholar] [CrossRef] [Scilit]
- Wang, D.; Yang, J.; Wei, P.; Pu, W. A mixed EHL model of grease lubrication considering surface roughness and the study of friction behavior. Tribol. Int. 2021, 154, 106710. [Google Scholar] [CrossRef] [Scilit]
- Wijnant, Y.H.; Venner, C.H. Contact dynamics in starved elastohydrodynamic lubrication. Tribol. Ser. 1999, 36, 705–716. [Google Scholar] [CrossRef] [Scilit]
- Li, S.; Guo, F.; Li, X.; Liu, C.; Liu, X. Effect of the slide-roll ratio on point contact EHL under oil droplet supply. Tribol. Int. 2019, 130, 261–269. [Google Scholar] [CrossRef] [Scilit]
- Greenwood, J.A.; Tripp, J.H. The contact of two nominally flat rough surfaces. Proc. Inst. Mech. Eng. 1970, 185, 625–633. [Google Scholar] [CrossRef] [Scilit]
- Chen, H.; Namura, A.; Ishida, M.; Nakahara, T. Influence of axle load on wheel/rail adhesion under wet conditions in consideration of running speed and surface roughness. Wear 2016, 366–367, 303–309. [Google Scholar] [CrossRef] [Scilit]
- Johnson, K.L. Contact Mechanics; Cambridge University Press: Cambridge, UK, 1985. [Google Scholar]

Disclaimer/Publisher’s Note: The statements, opinions and data contained in all publications are solely those of the individual author(s) and contributor(s) and not of MDPI and/or the editor(s). MDPI and/or the editor(s) disclaim responsibility for any injury to people or property resulting from any ideas, methods, instructions or products referred to in the content. |
© 2026 by the authors. Licensee MDPI, Basel, Switzerland. This article is an open access article distributed under the terms and conditions of the Creative Commons Attribution (CC BY) license.