1. Introduction
The wheel/rail interface is one of the most important interfaces in a railway network, as it has such a large impact on train performance and safety. It is essential that friction in the interface is closely managed. If the friction is too low, acceleration and braking may be affected. This could lead to timetable delays [
1] and safety issues (e.g., signals passed at danger or, in the worst-case, collisions [
2,
3,
4]). If friction is high in the interface, the increased shear stresses generated in wheel and rail materials can raise the likelihood of wear and rolling contact fatigue occurring [
5], and energy consumption for trains is increased.
A range of methods is used to manage the wheel/rail interface friction levels. Top-of-rail products are used to give intermediate levels of friction in the wheel tread/rail head contact (0.2–3); low levels of friction are required in the wheel flange/rail gauge corner contact (below 0.05), particularly in curves, which is achieved via lubricant application. A wide range of techniques is used to mitigate low-friction conditions, which can be created by the presence of contaminants in the wheel/rail contact, such as oil [
6], water [
7], and leaves-on-the-line, which bond tightly to the rail [
8], and result in friction levels below 0.05. Application of silica sand particles as a friction recovery method, though, has been in use since the early days of railways in the UK. Typically, dry sand particles are applied to the wheel/rail contact from an onboard device by means of an air stream running through a hose directed at the contact [
9]. This can bring friction conditions up to almost dry contact values (>0.3) if applied optimally, but can certainly help achieve values > 0.1 required for effective braking and acceleration.
Recently, other particle systems, such as alumina, have also been trialled, with some success, for traction enhancement [
10,
11,
12]. Conductive particles have also been tested in the laboratory and field [
13], which, as well as aiding traction recovery, overcome any issues that sand may cause in terms of insulating the wheel from the rail. Track circuits used for train signalling rely on good conductance between wheel and rail for accurate train identification.
Consideration has been given to the use of particle systems for use in other aspects of friction management. Japanese railways have tested resin particles coated in graphite for top-of-rail application for achieving intermediate levels of friction [
14]. Extensive testing, while not characterising friction itself, captured data that indicated that the product helped reduce lateral force in curves and noise from the wheel/rail interface, and gave a significant reduction in track circuit shunting risk.
Several approaches have been used in the past across all scales for assessing the impact of particles on wheel/rail friction. Examples include small-scale twin-disc testing [
15,
16], full-scale test rigs [
17] and field tests [
18]. While twin-disc testing provides excellent control of contact conditions and the possibility for accurate measurement of friction, the constant recycling over the same contact area and the high likelihood of particle entrainment cause some issues. Recently, a different approach has been utilised based on High Pressure Torsion (HPT) test machines [
19]. Here, two flat specimens representing wheel and rail are pressed together, and then one is twisted through a small angle. This generates a shear stress that can be used to assess friction in the interface, and with the use of a creep force model, a creep curve can also be generated. Running tests one cycle at a time allows the possibility of assessing friction evolution more carefully and assessing roughness evolution, as well as adding third-body materials, either natural, such as leaves, or applied, such as sand, more easily and accurately.
The HPT approach has been used for a range of studies on friction effects of sand [
20], top-of-rail materials [
19], and surface roughness and grease [
21].
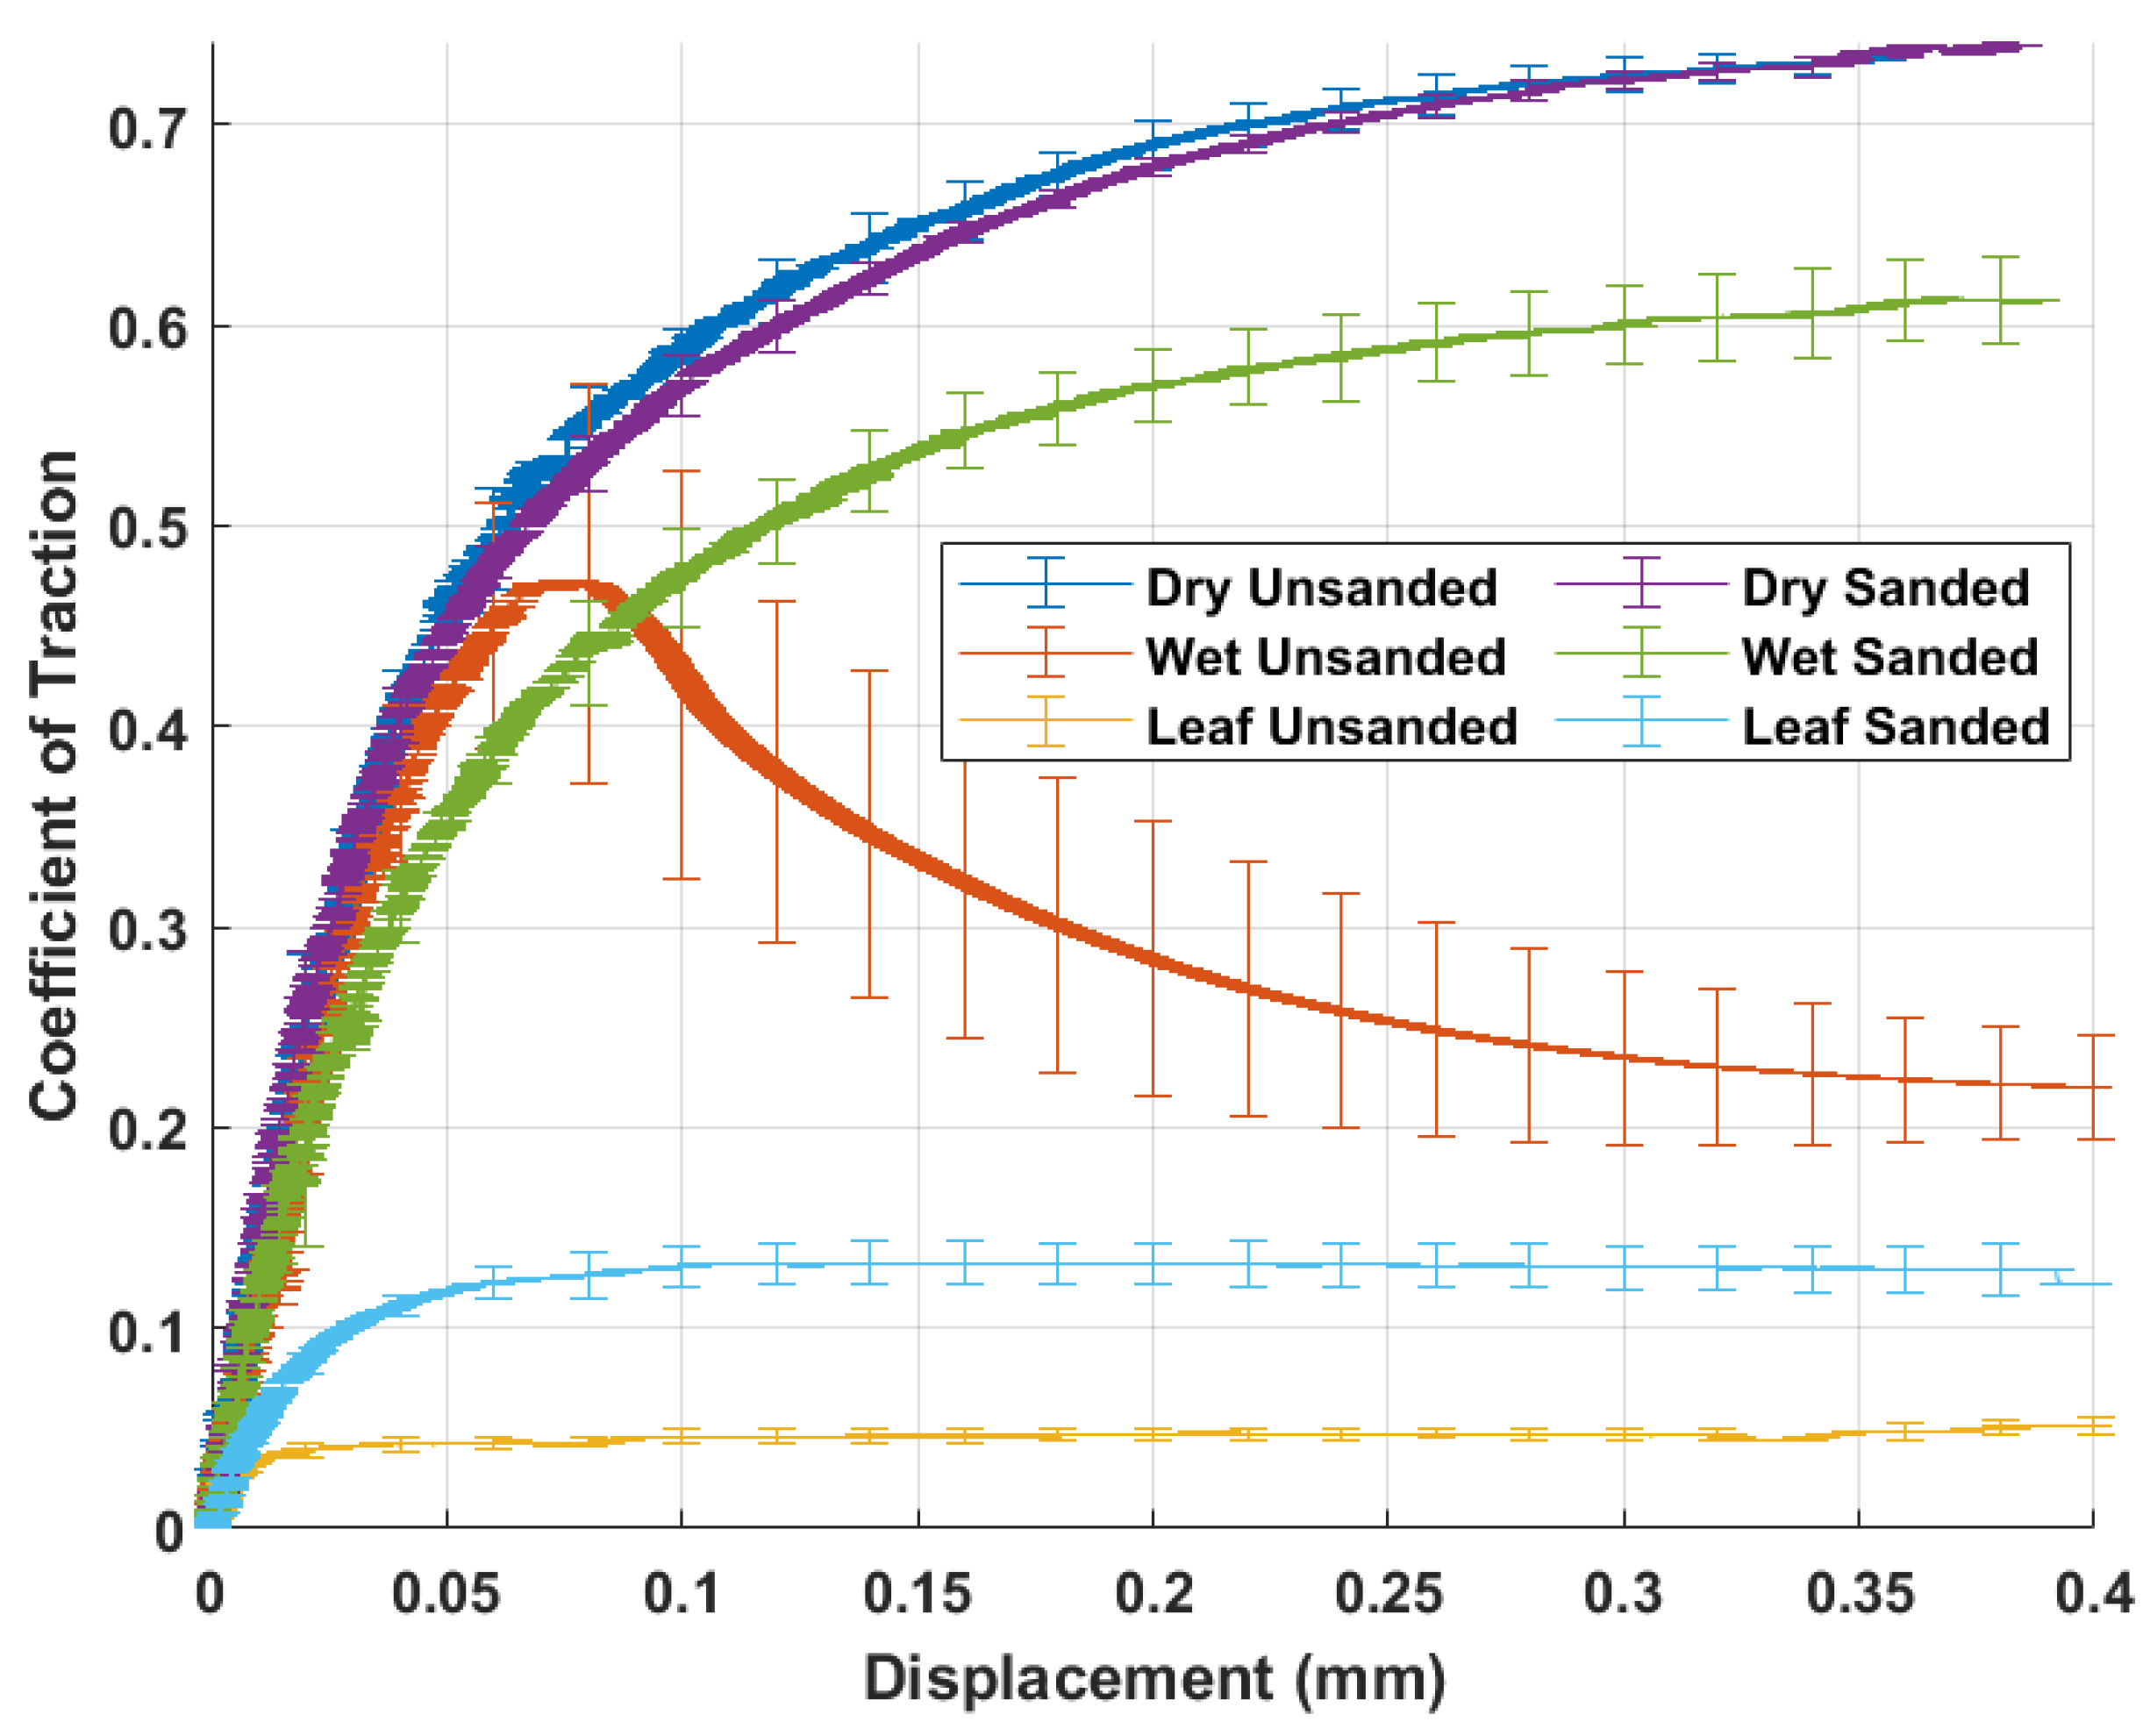
Figure 1 illustrates HPT friction data for GB rail sand tests under dry, wet, and leaf-layer conditions [
22] to show what can be achieved in the tests, but also to provide a benchmark for tests in the current study. A framework has also been created that enables HPT tests to parameterise a creep force model that can then be used for full-scale wheel/rail interface friction predictions. This has been validated for sand applications [
23].
The aim of this work was to explore the potential of other particle systems for use in friction management using a number of baseline conditions (dry, wet, and leaf layer), and how different regimes of friction could be achieved using the HPT approach.
2. Experimental Details
2.1. High Pressure Torsion Test Apparatus
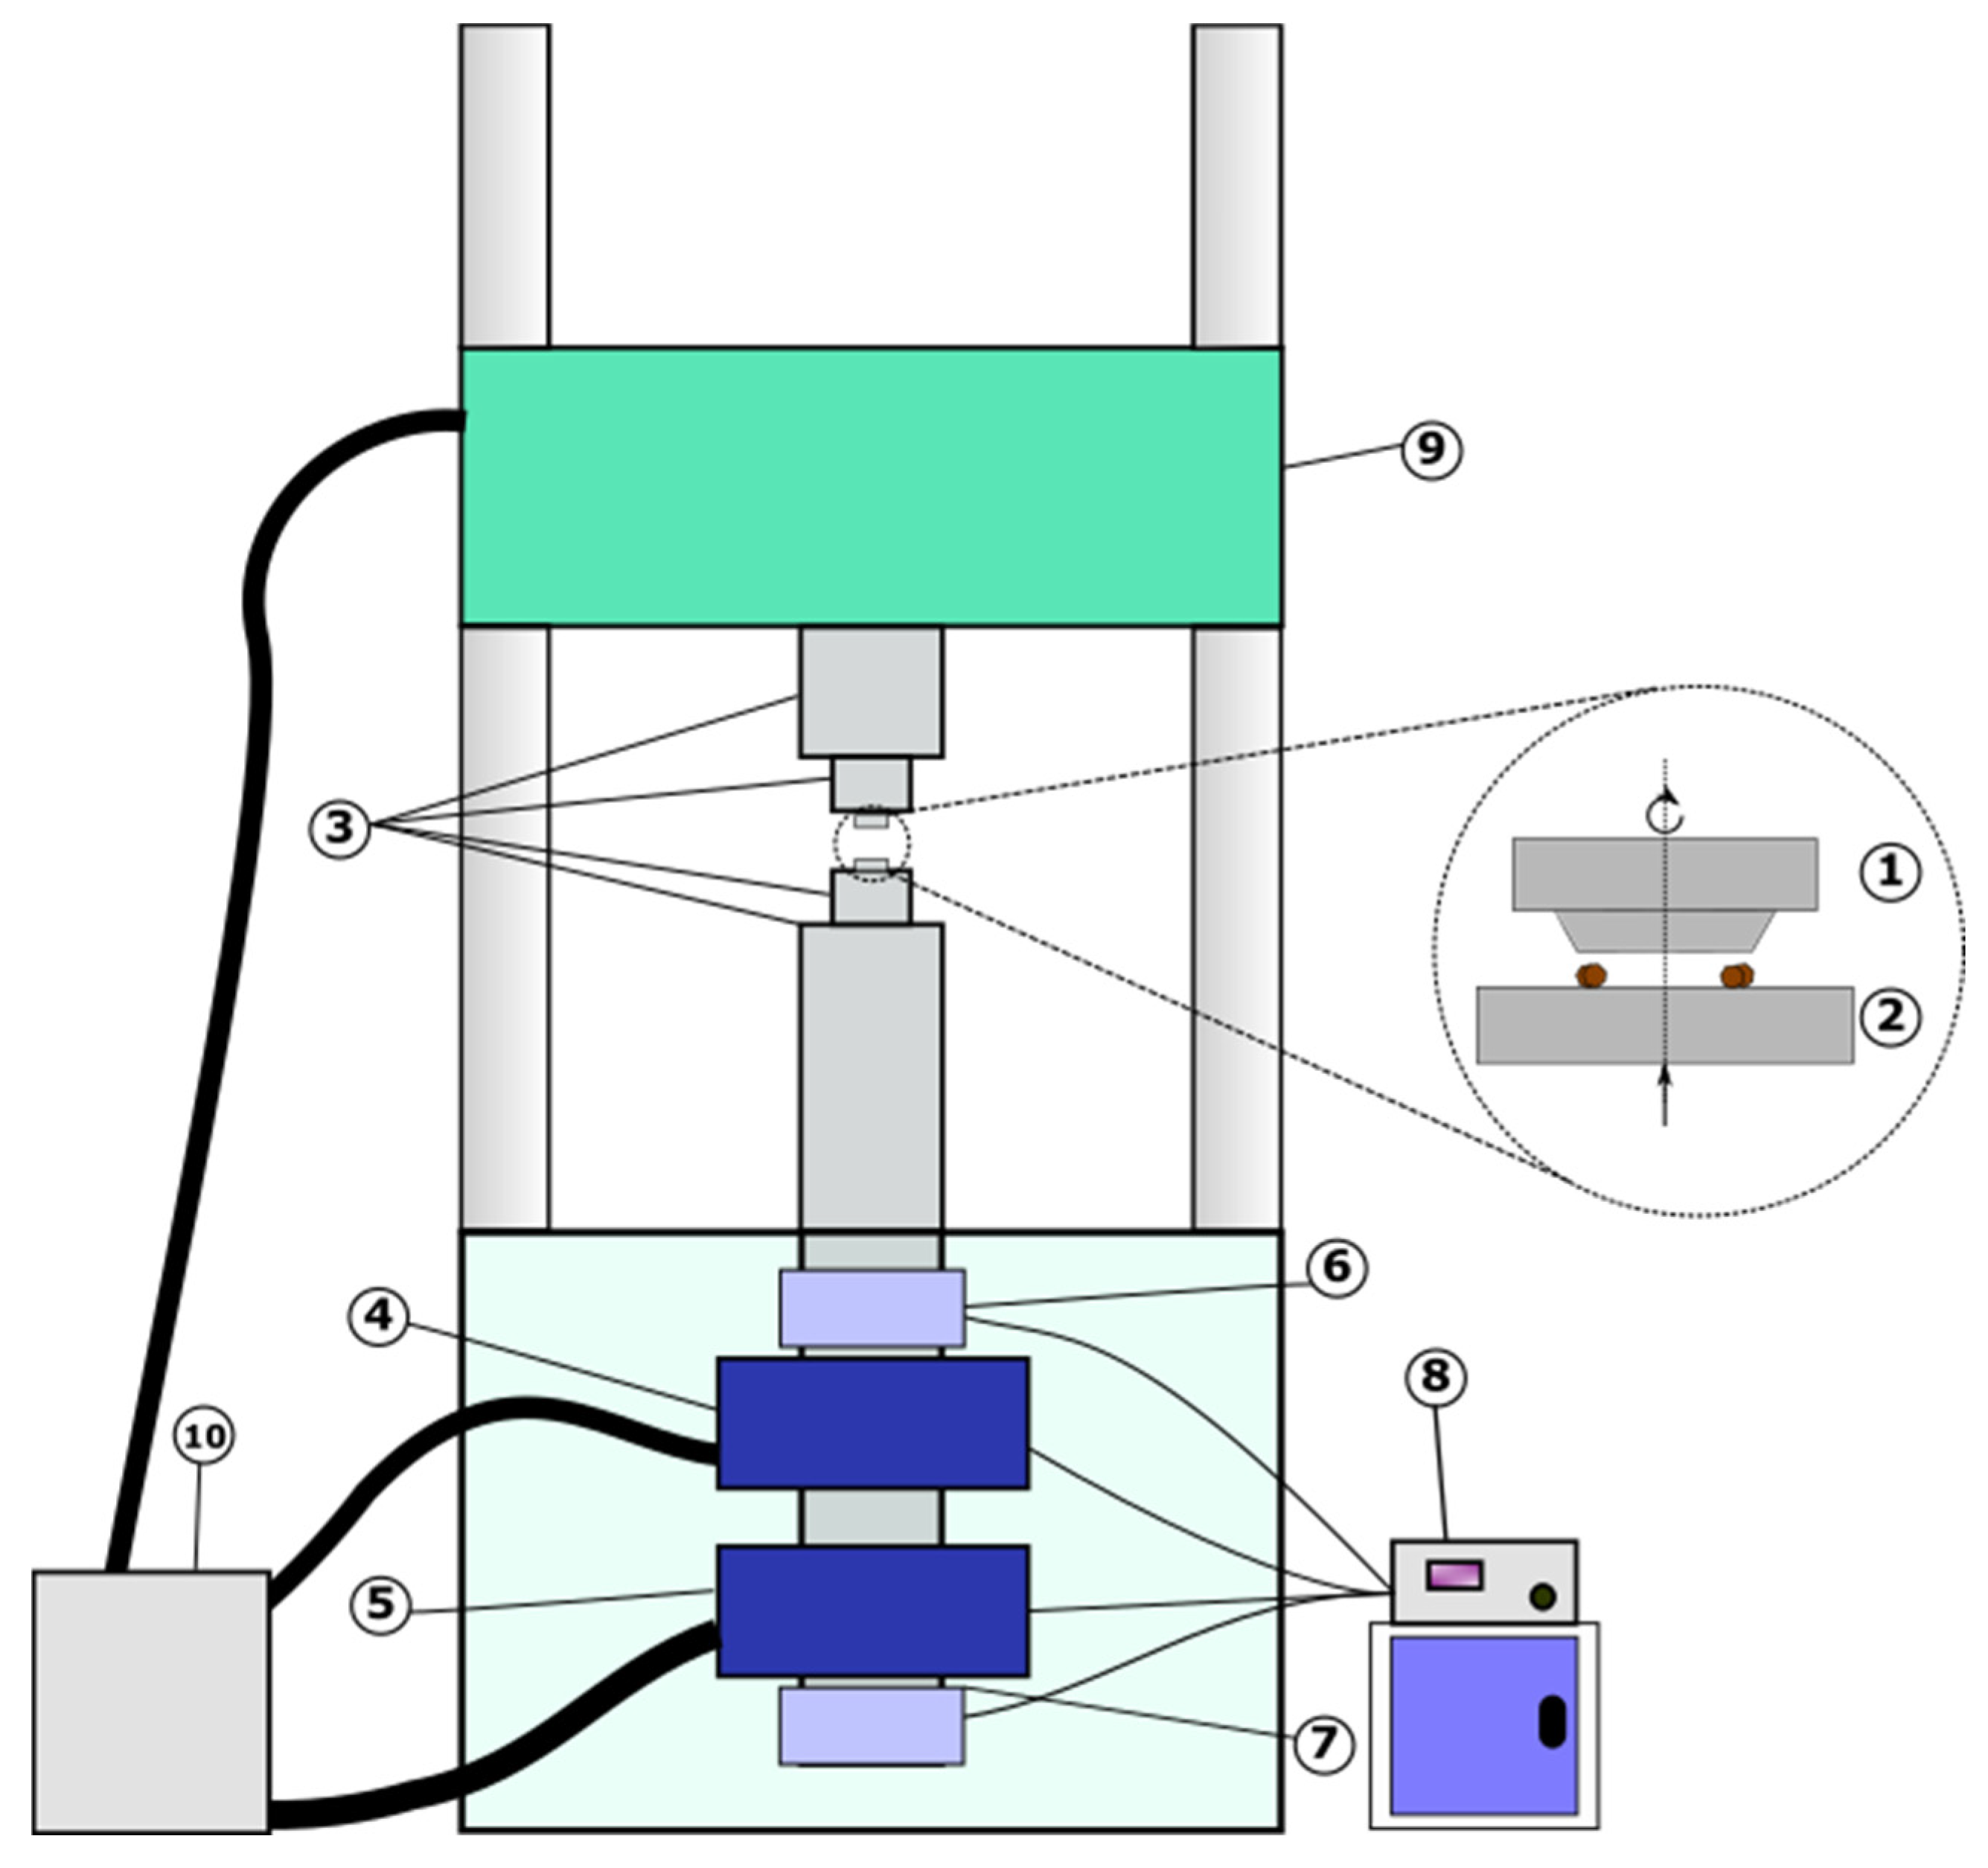
The High Pressure Torsion (HPT) rig is shown in
Figure 2, where (1) and (2) denote a top specimen (made of R8T wheel steel) and a bottom specimen (made of R260 rail steel), respectively, that, when compressed together, create an annulus contact; third body layers can be applied to the contact and a torque applied to the bottom specimen until it has moved through a set sweep length at a low speed (<1 mm/s). The two specimens are held in place by sample holders (3) made of 431 martensitic stainless steel. The axial position/force is controlled by a linear hydraulic actuator (5), and the actual axial position/force is measured by a linear variable differential transducer (LVDT)/load cell (7). The torsional position/force is controlled by a rotational hydraulic actuator (4), and the actual torsional position/force is measured by a rotary variable differential transducer (RVDT)/load cell (6). The attached controller (8) regulates the movement/applied force via PID loops and records both command signals and feedback signals. The crosshead (9) can be moved up and down to accommodate test apparatus between 500 mm and 2000 mm in length. The actuators are pressurised by a hydraulic ring main (10).
The wheel specimen was made of R8T steel cut directly from an actual train wheel. The contacting surface of the wheel specimen is annular, with an inside diameter of 10.5 mm and an outside diameter of 18 mm. The rail specimen was made from R260 steel, cut directly from an actual rail, and the contacting surface is flat. The dimensions of the annular contact between these specimens were produced from an iterative method, which is fully outlined by Evans et al. [
19].
2.2. Particle Choice and Characterisation
Several different particle materials were considered for the testing, as detailed in
Table 1. The aim was to use different properties, such as hardness, to see how this impacted friction under different conditions and the resulting surface damage, which ideally would be kept to a minimum, whether looking at a friction reduction or increase. Particles were sourced from multiple areas; some particles were taken directly from the railway industry, some for their abrasive properties, and some for providing an extreme point of difference from typical abrasive particles, i.e., lubricating particles. Considerations in the selection process were availability, sustainability of supply and environmental impact.
The particles were characterised using a variety of techniques that matched those applied to silica sand in previous work to allow comparison [
20].
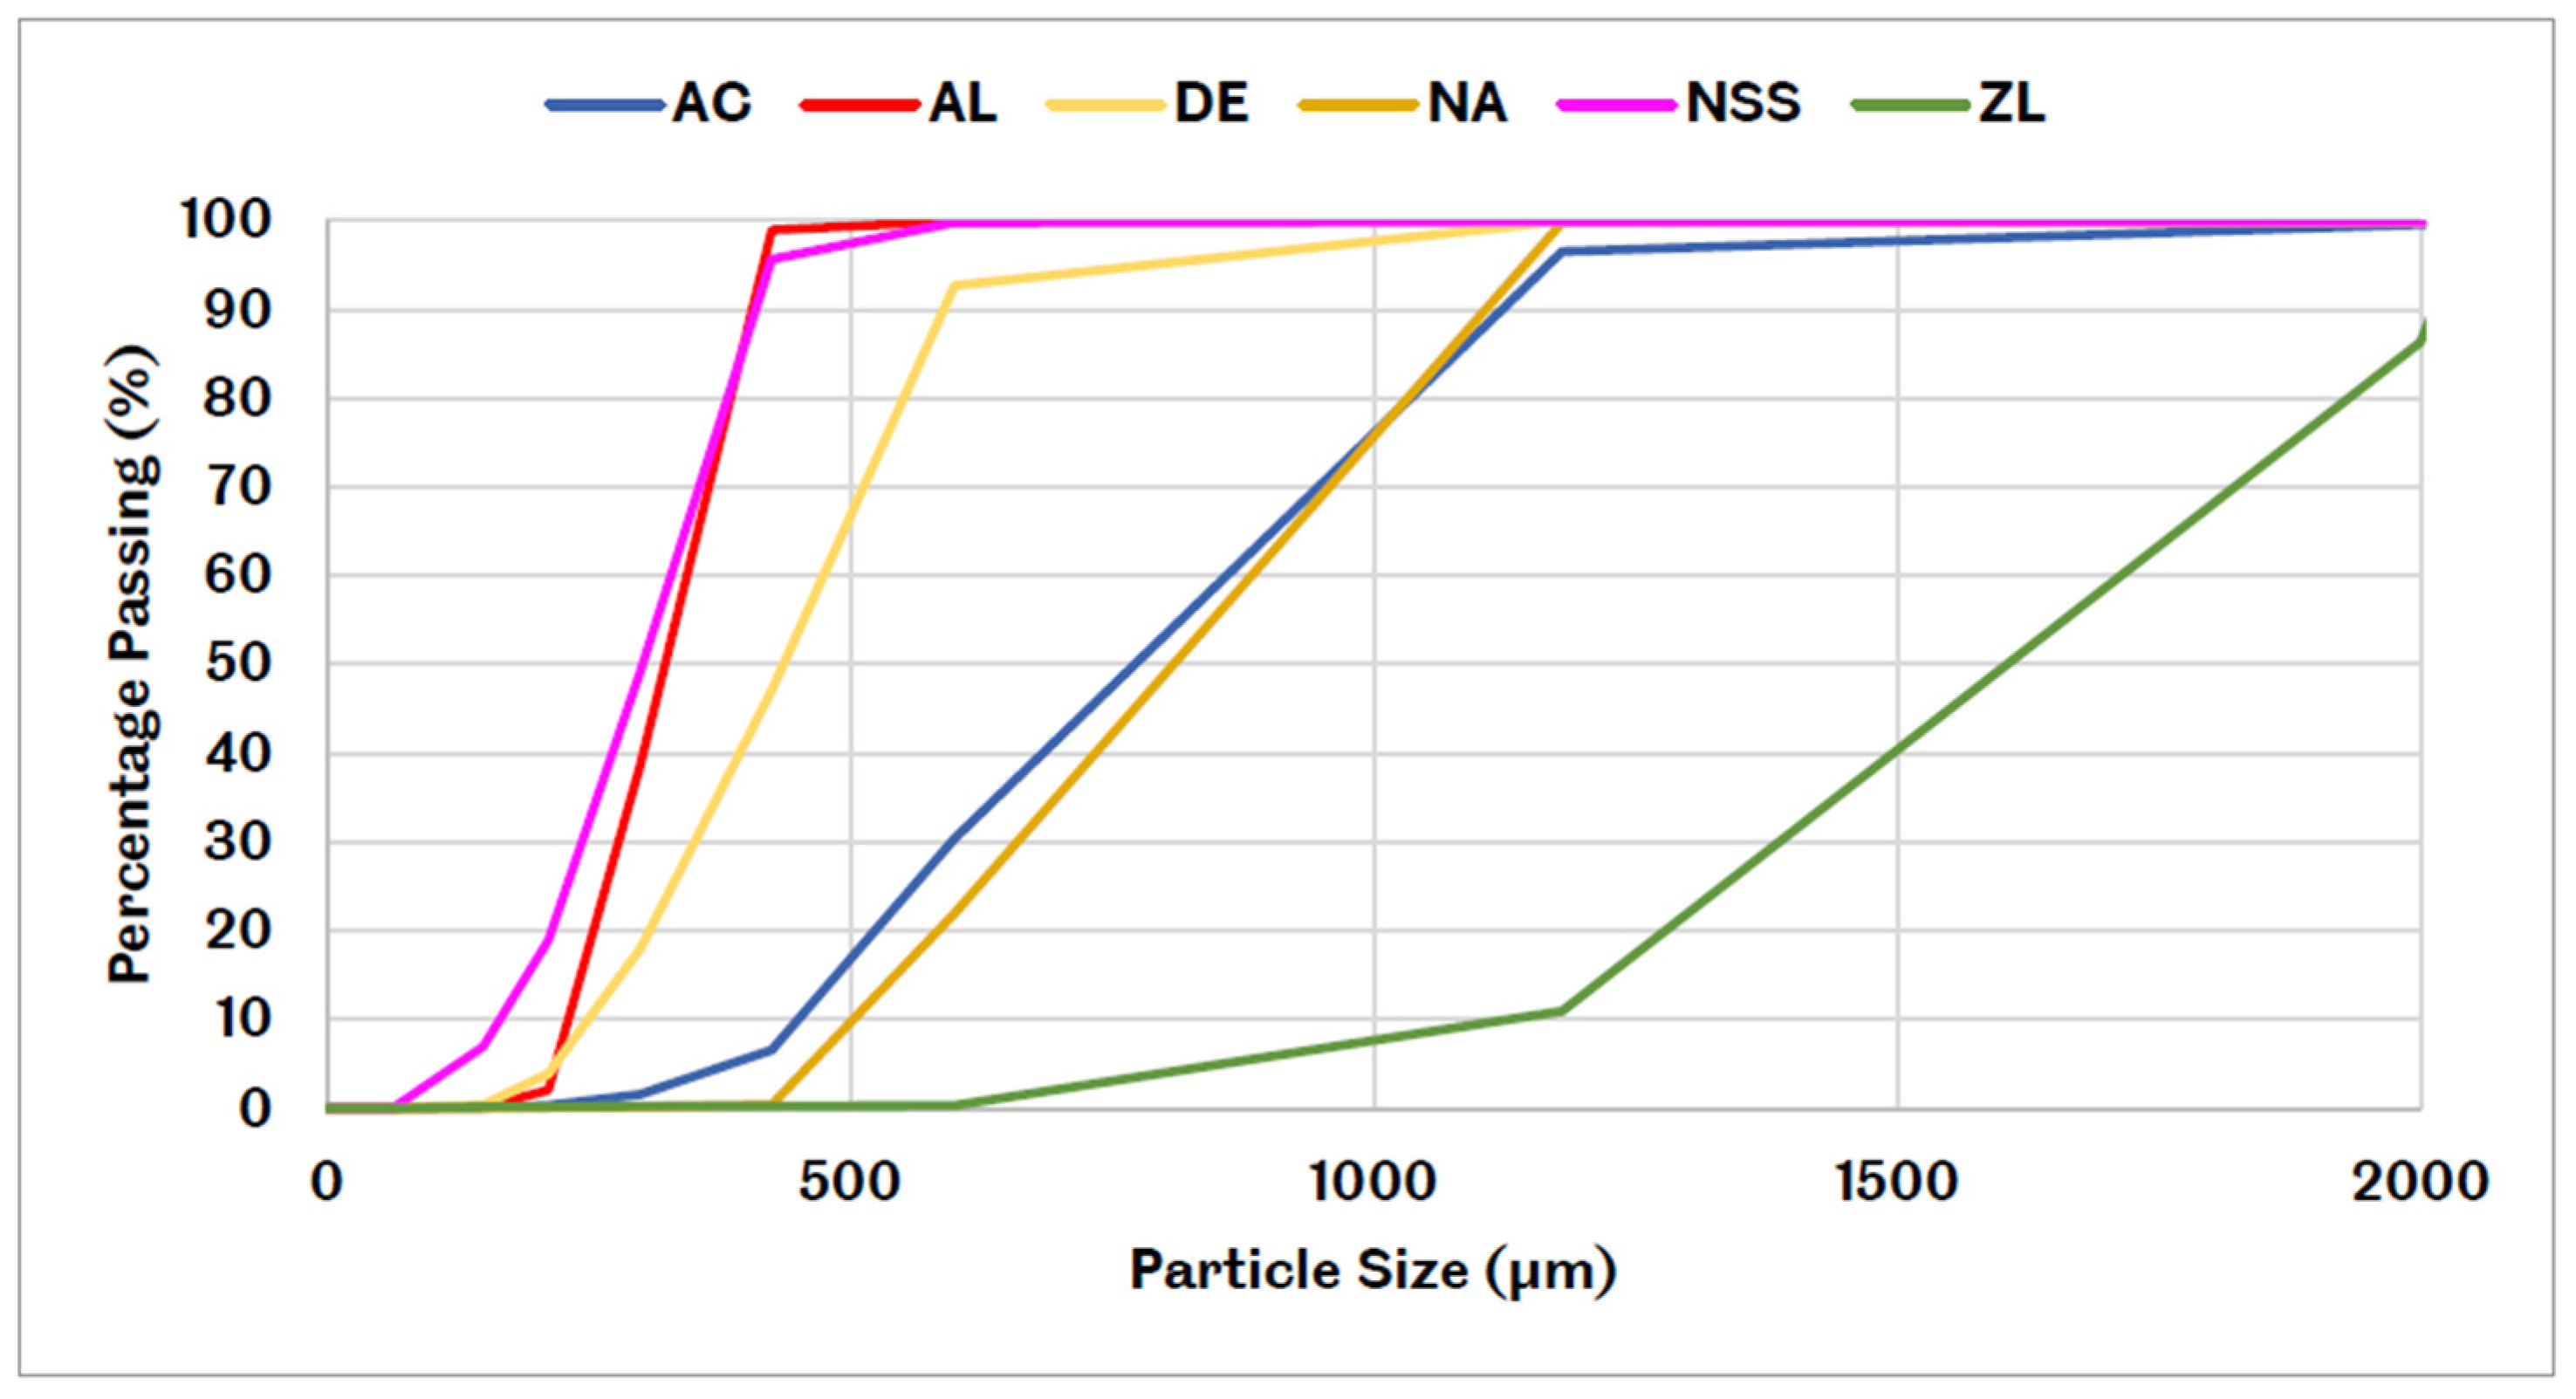
Sieving was carried out to assess particle size distribution following the method for sieving fine-grained soils set out in BS1377-2:1990 [
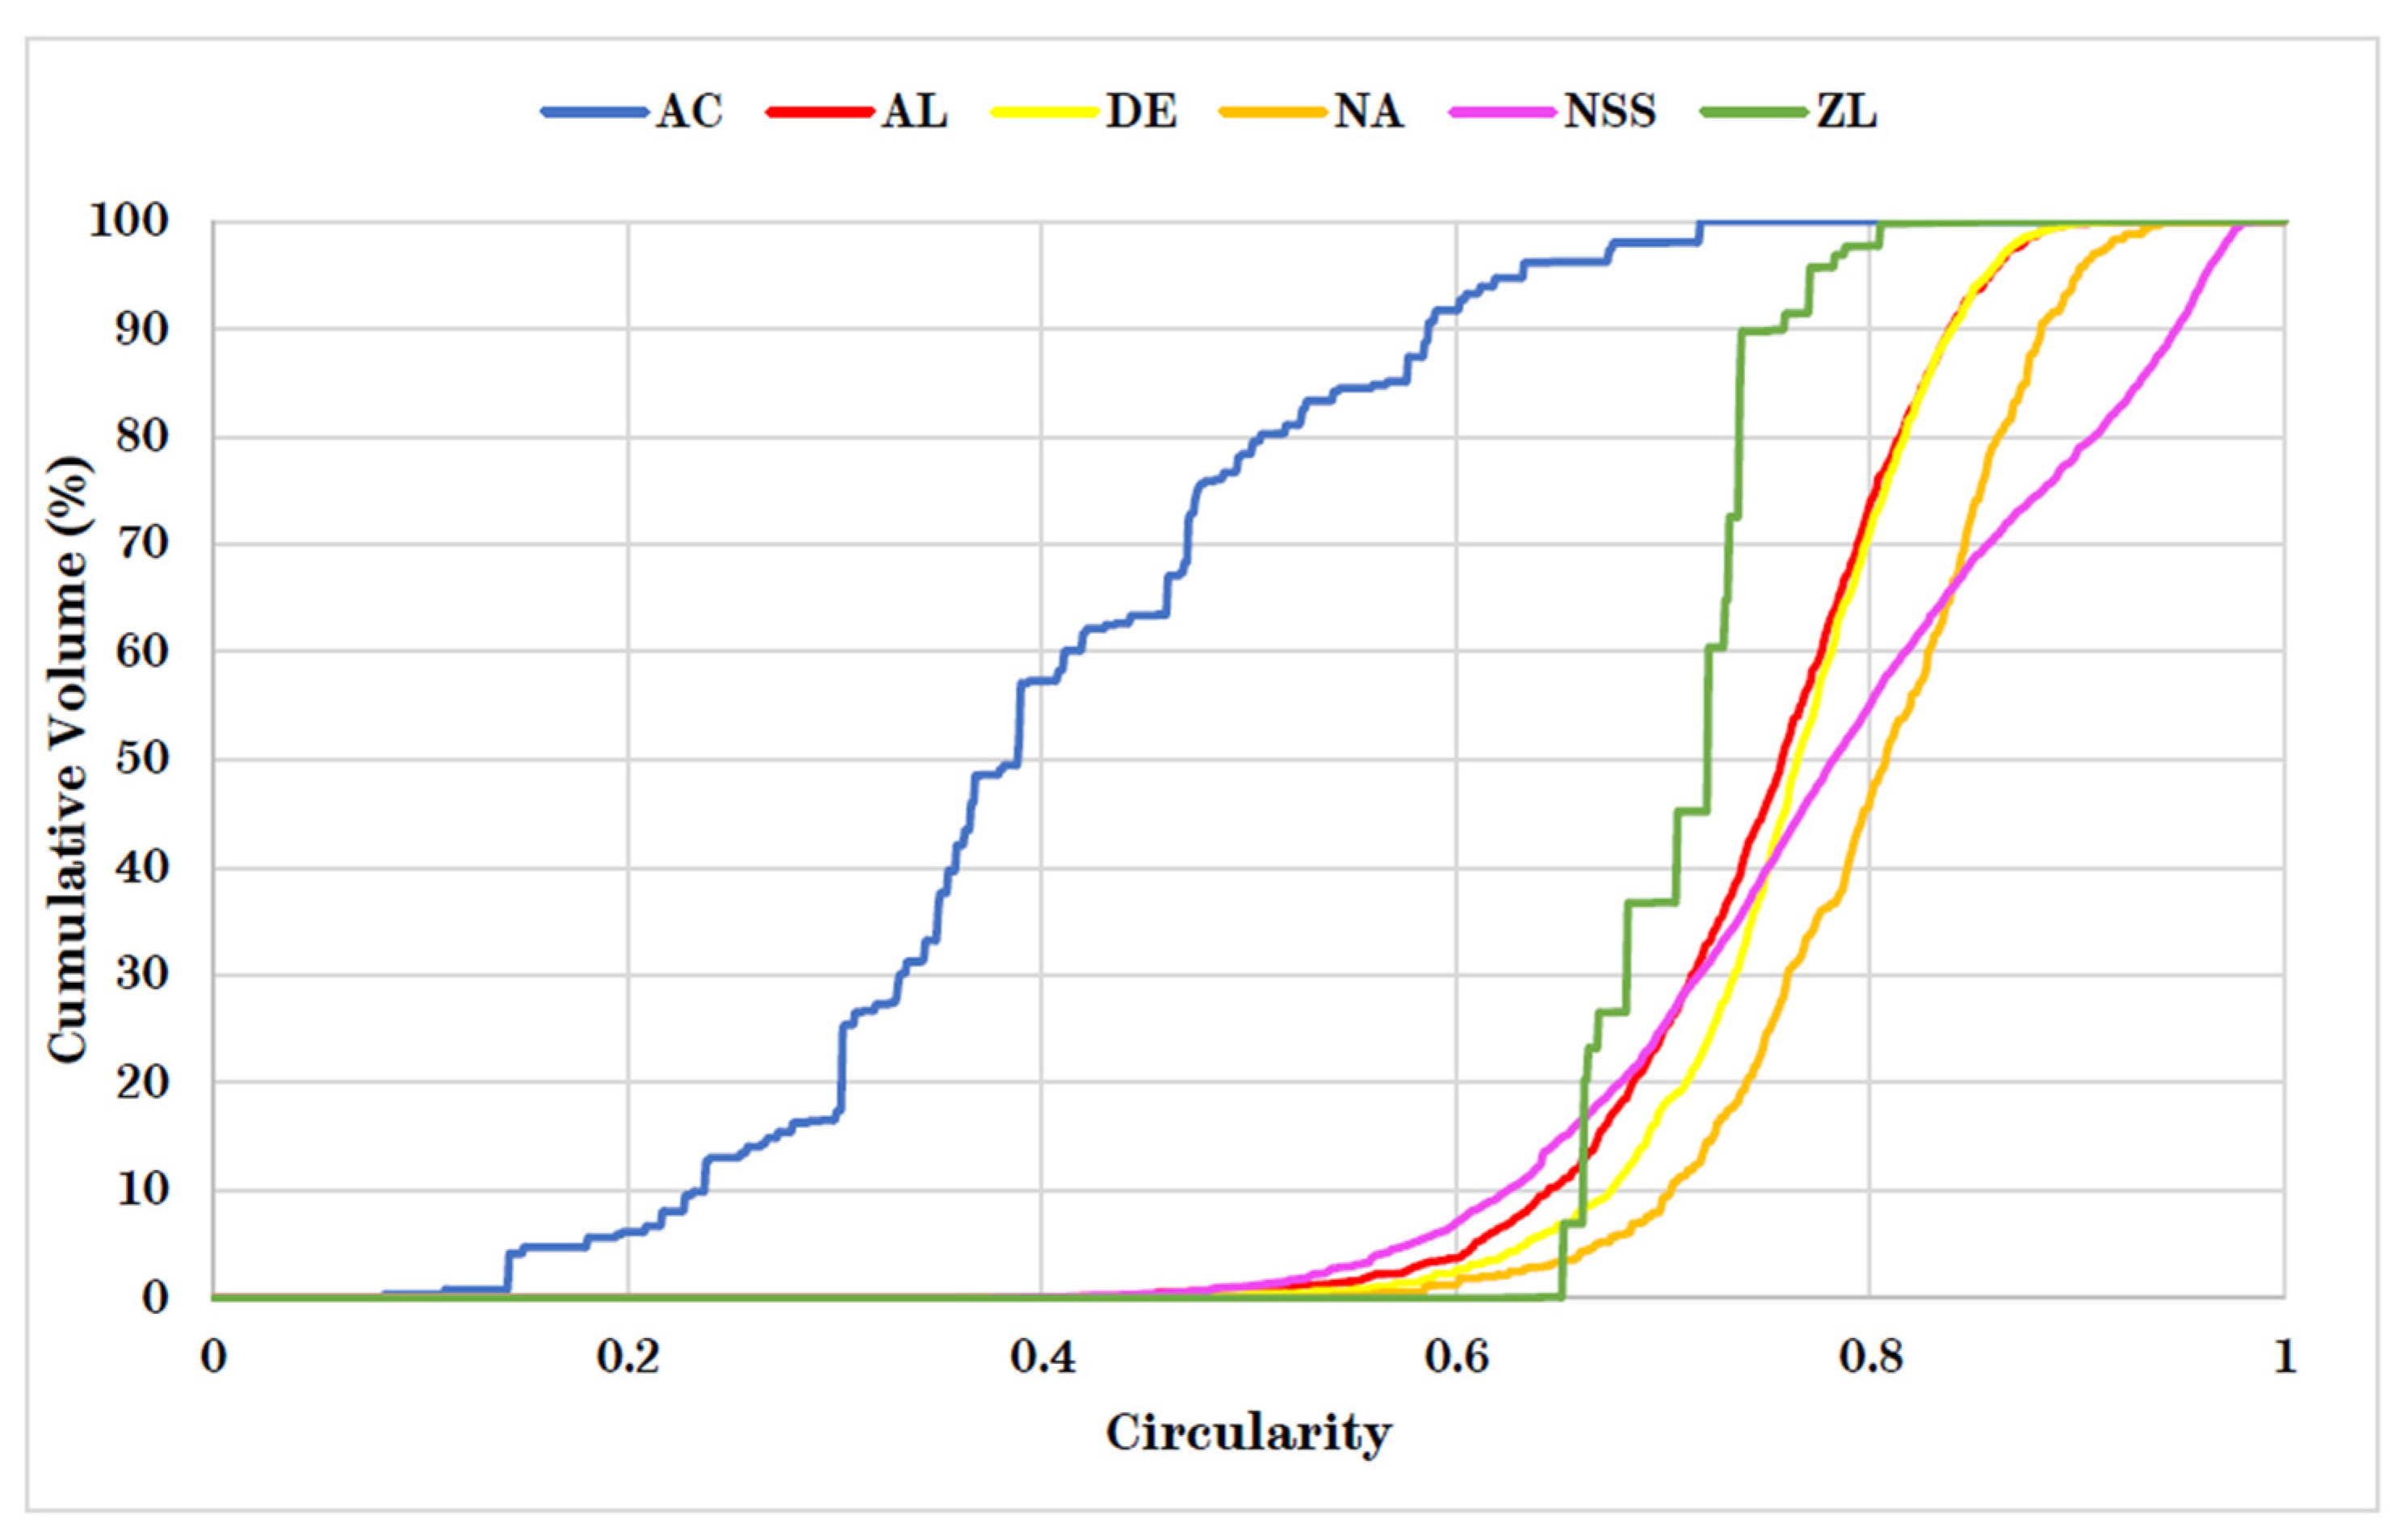
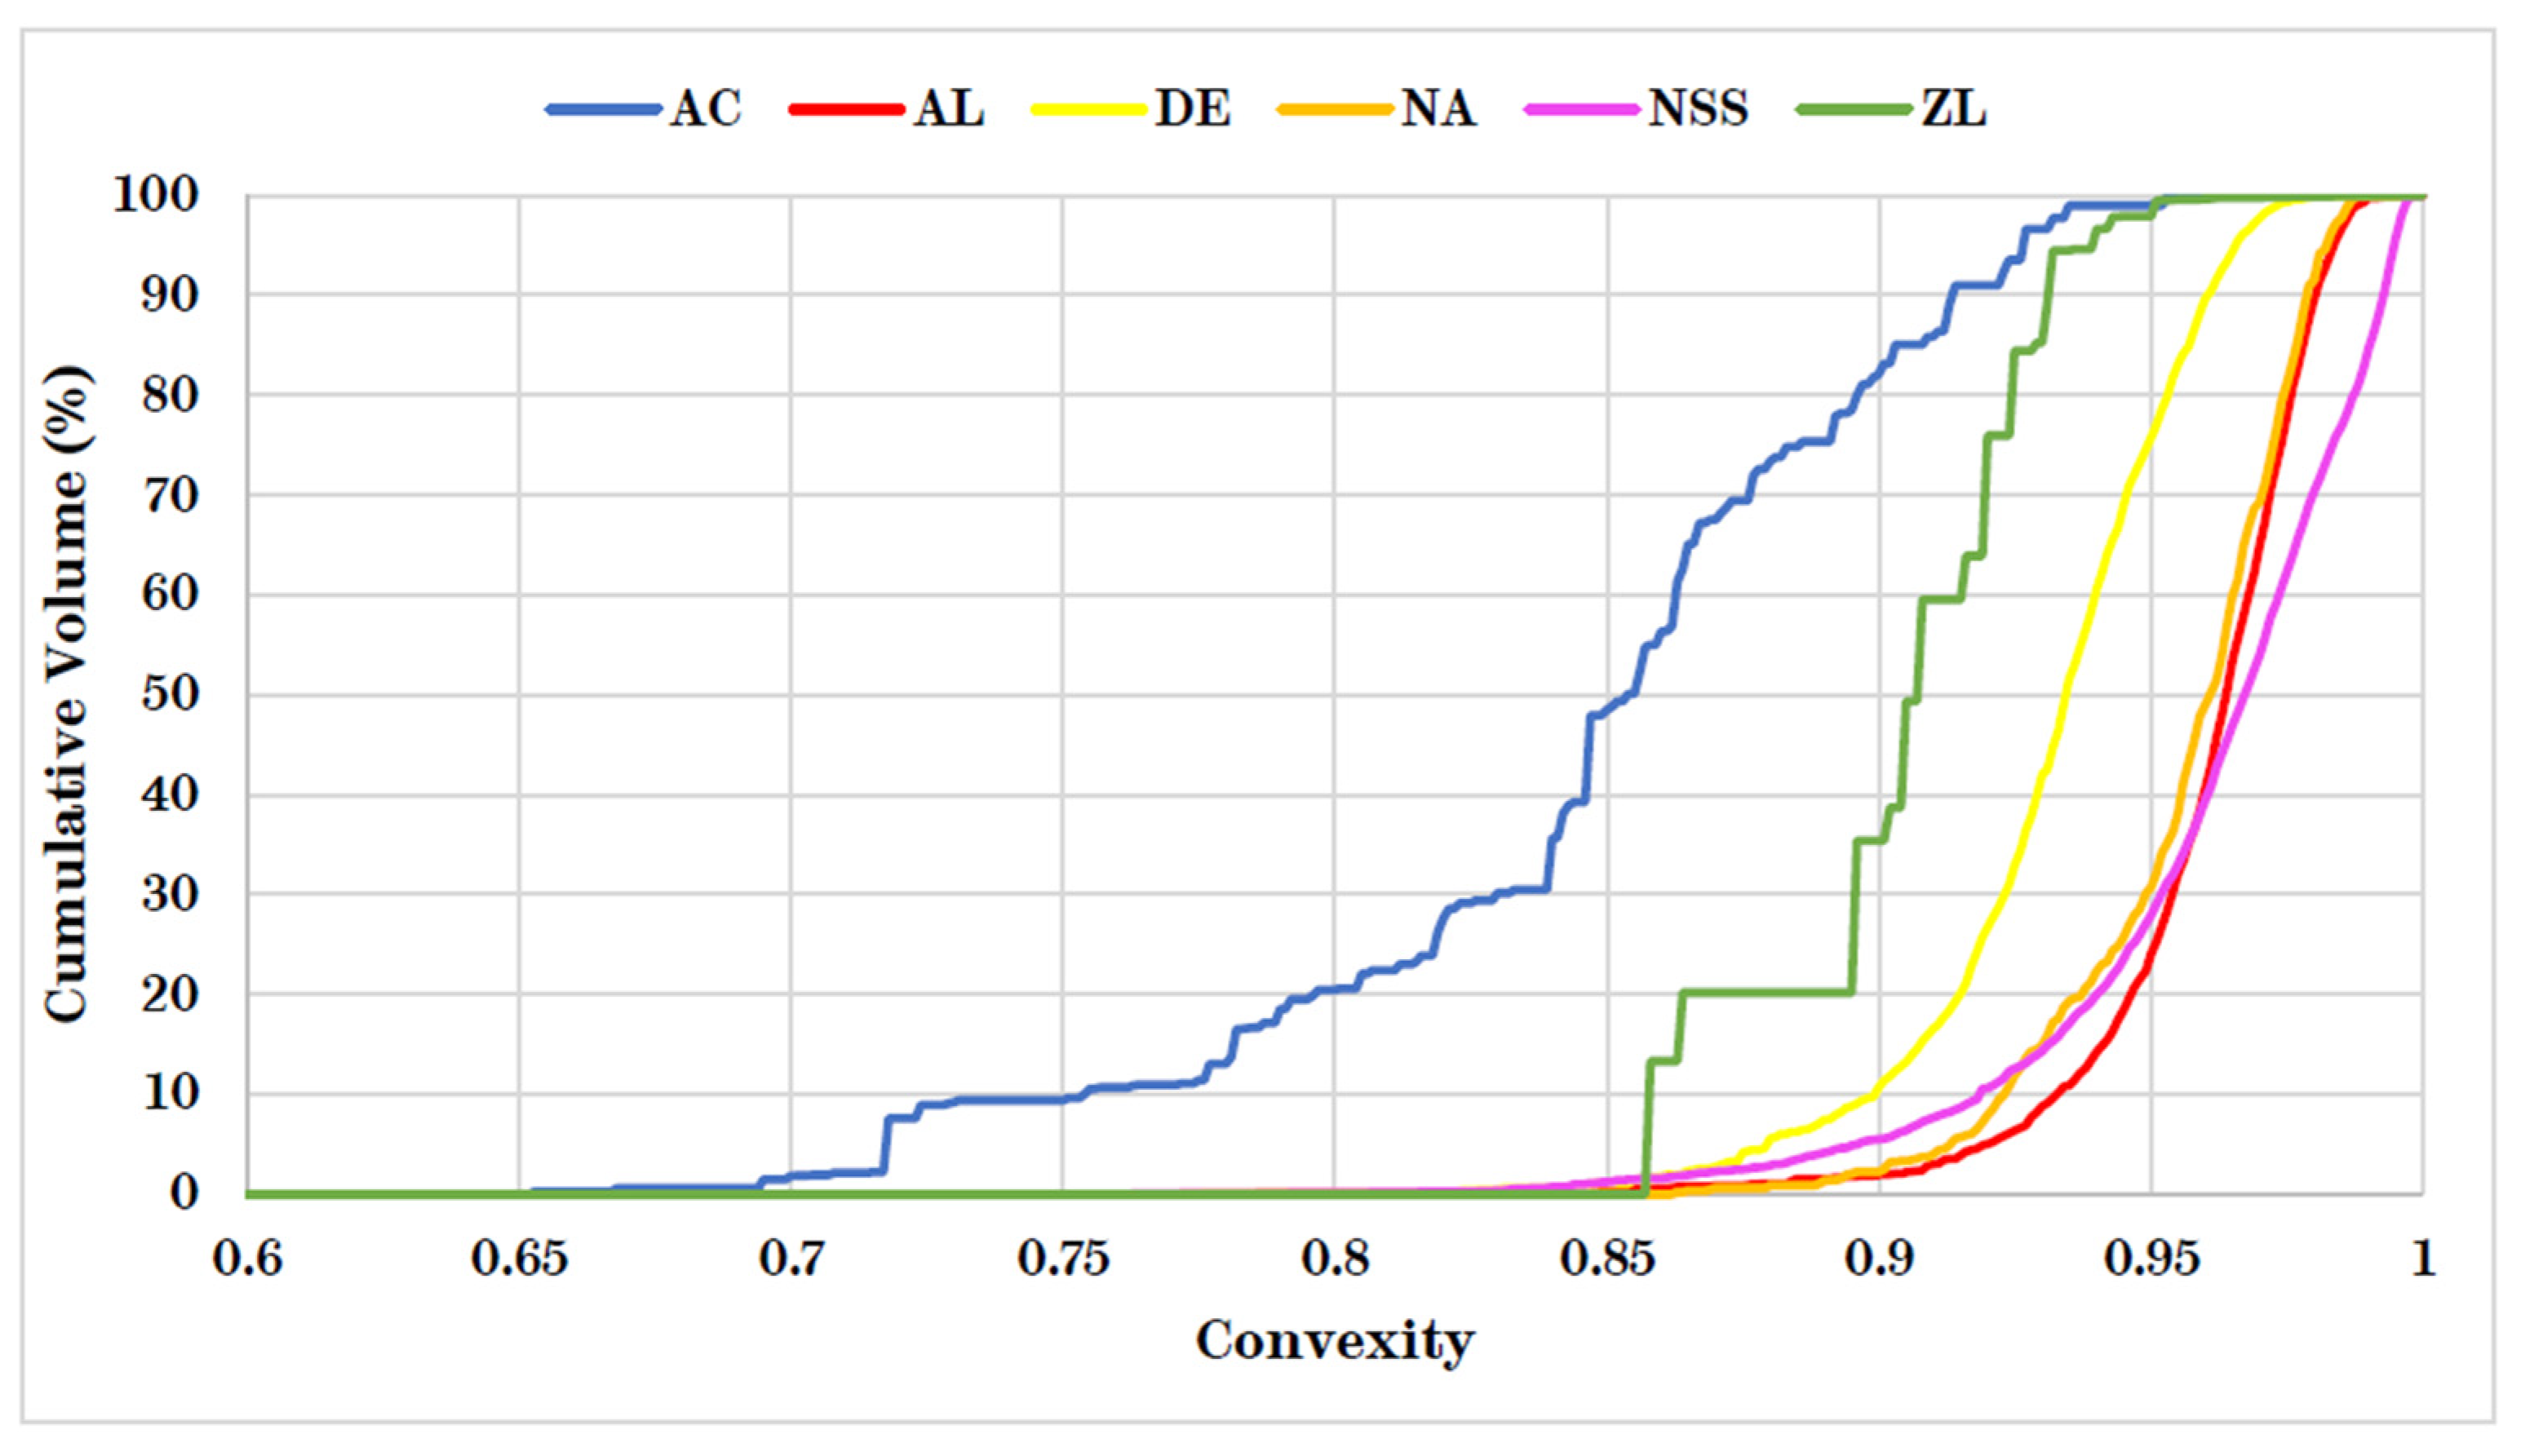
24]. The sieve apertures ranged from 2 mm to 63 μm. Image analysis was also carried out using a Morphologi G3S (Malvern Panalytical Ltd., Malvern, WR14, UK) of binarised images, which allowed measurements to be taken of each individual particle. The circle equivalent diameter was used to characterise size. In addition, circularity (the ratio between the perimeter of a circle of equivalent area to the particle and the actual perimeter of the particle) and convexity (the ratio between the convex hull perimeter of the particle shape and its actual perimeter) were determined.
From
Table 1 and
Figure A1 in
Appendix A, it can be seen that there is a similar spread in size to the silica sands measured previously (250 µm to 2000 µm) [
20]. This, in part, was deliberate so that the particle performance could be compared based on the intrinsic properties of the different particles being used.
Table A1 in
Appendix A includes detailed sieve size data on the particles. Some particles, such as AL, DE, and NSS, were slightly smaller than the lower limit of the rail silica sand, being less than <0.5 mm. ZL was slightly larger than all rail sands, at 1.6 mm in size. The measured uniformity coefficients are all similar to silica sands, all being between 1.5 and 2 [
20].
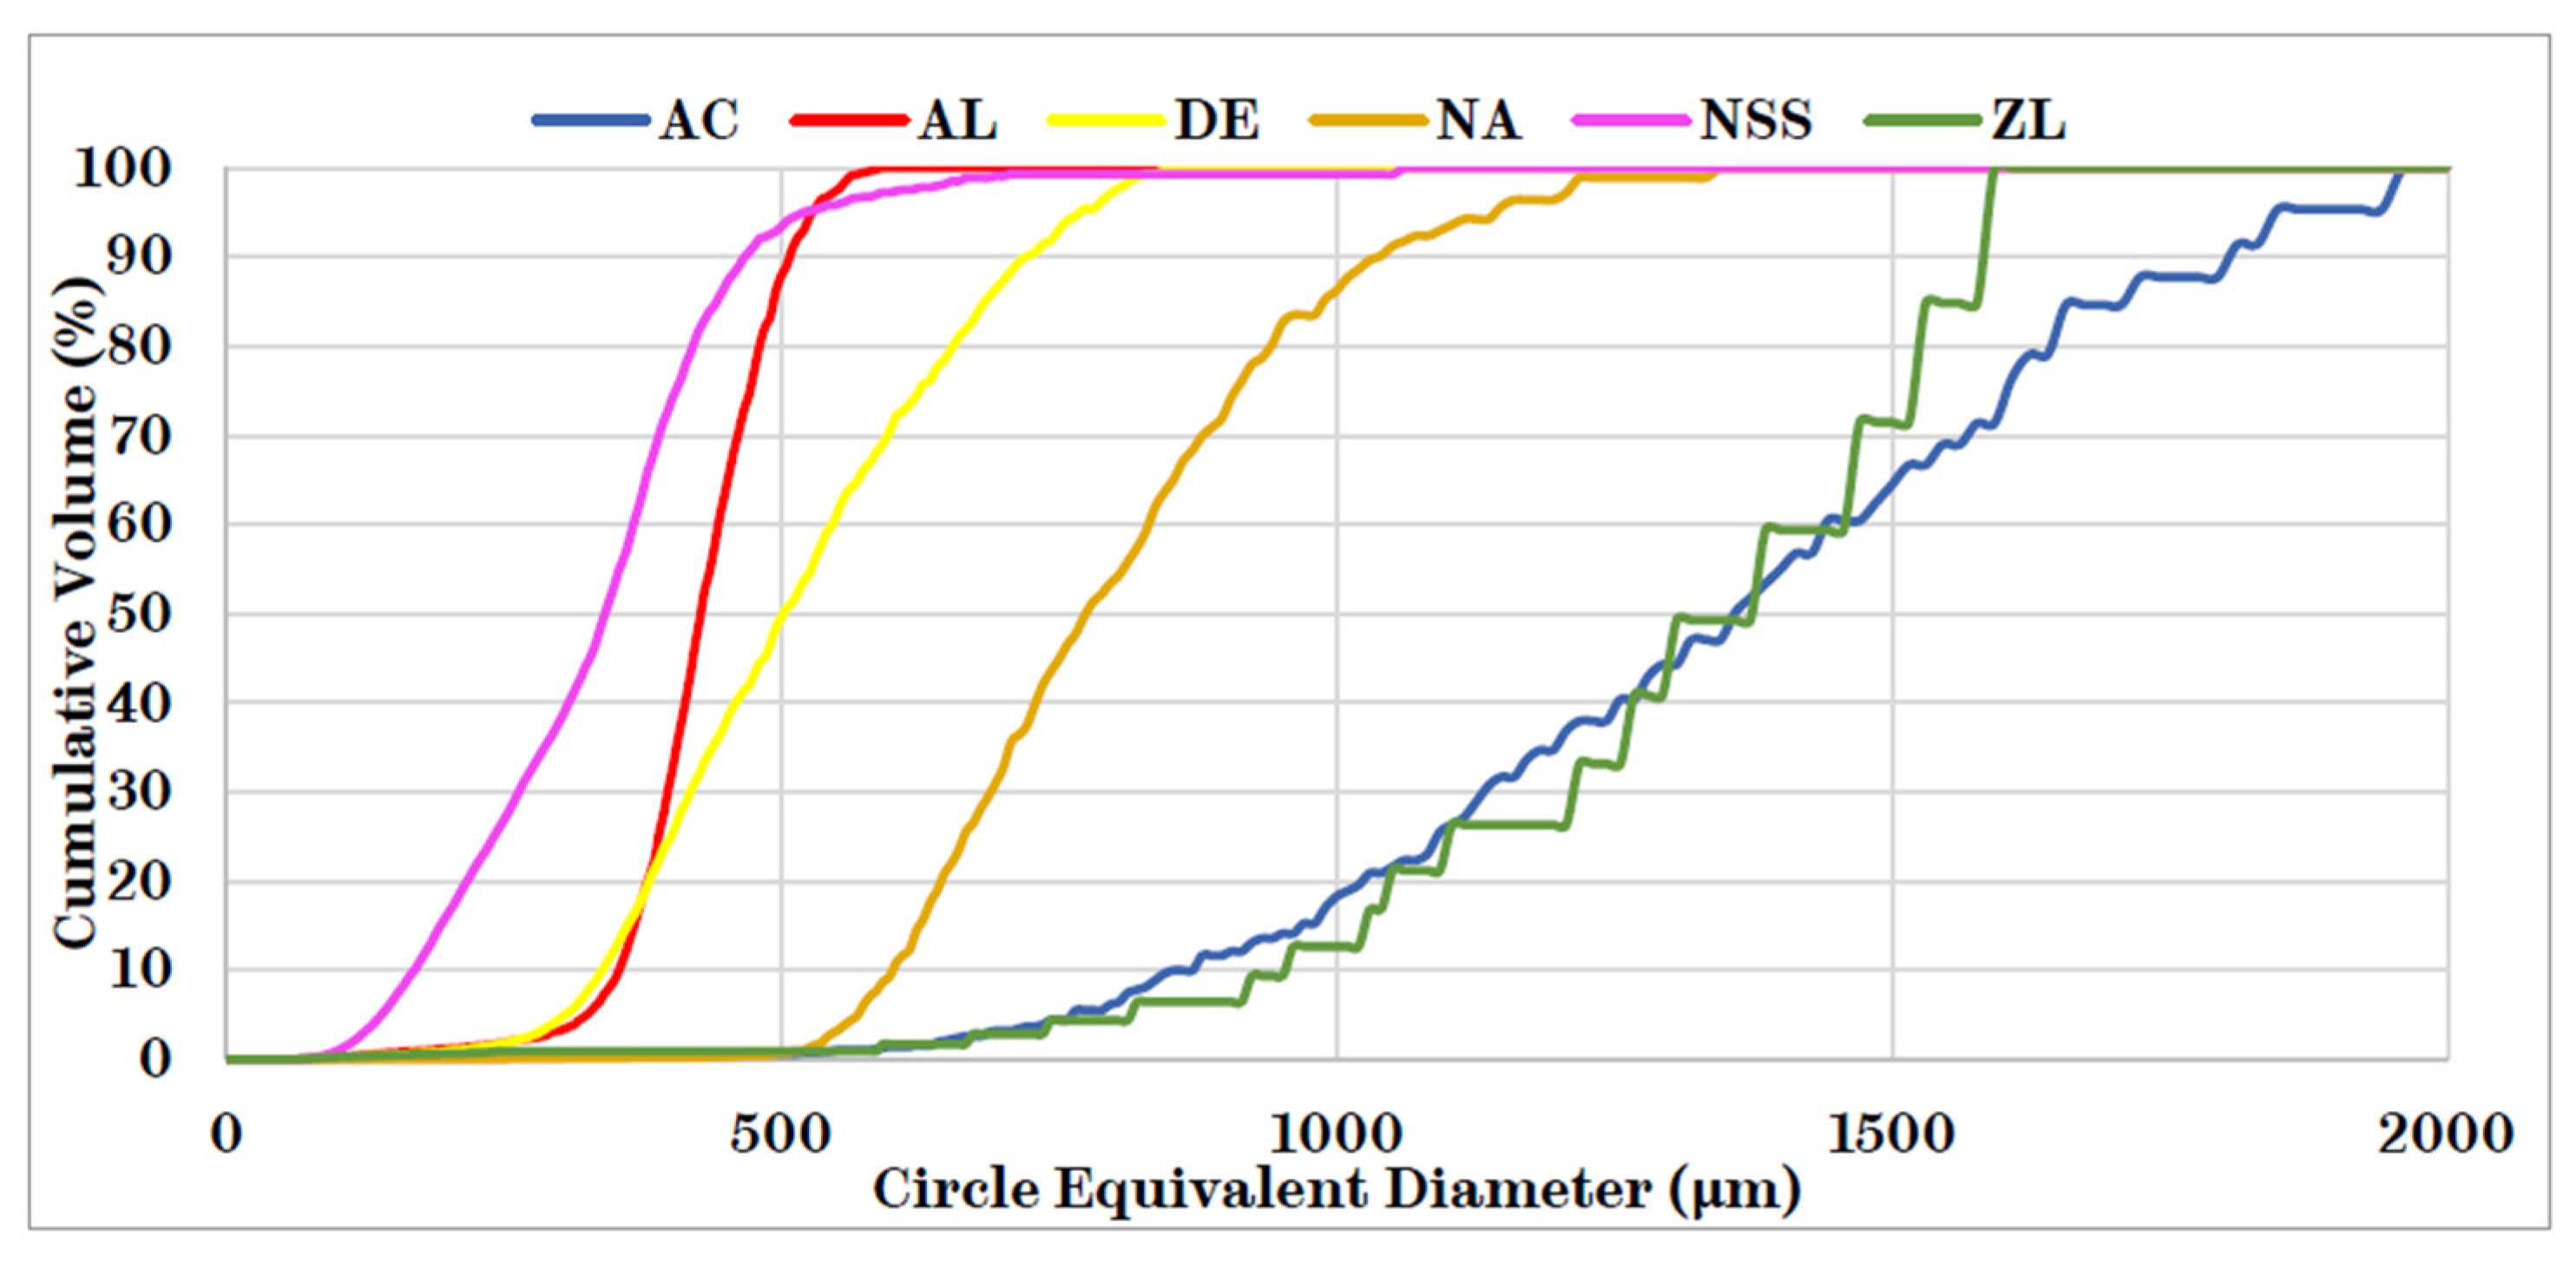
The circle equivalent diameter measurements for the particles determined from image analysis are included in
Figure A2 in
Appendix A. The results were similar to the sieving results, with a comparable range of sizes and size distributions observed between the disparate particles. The circularity data is included in
Figure A3, in
Appendix A. Most particles were between 0.7 and 0.8 and can be considered quite circular; however, AC was measured to be non-circular. A quick visual inspection of the particle showed that AC exhibits a long, flake-like shape. The convexity data for other particles are included in
Figure A4, in
Appendix A. All particles are relatively non-convex, with values ranging from 0.85 to 0.97.
Microhardness was assessed using a Durascan 70 G5 micro-indentation device from Struers, using HV0.3 loading conditions. The indentations were measured optically to produce a hardness value.
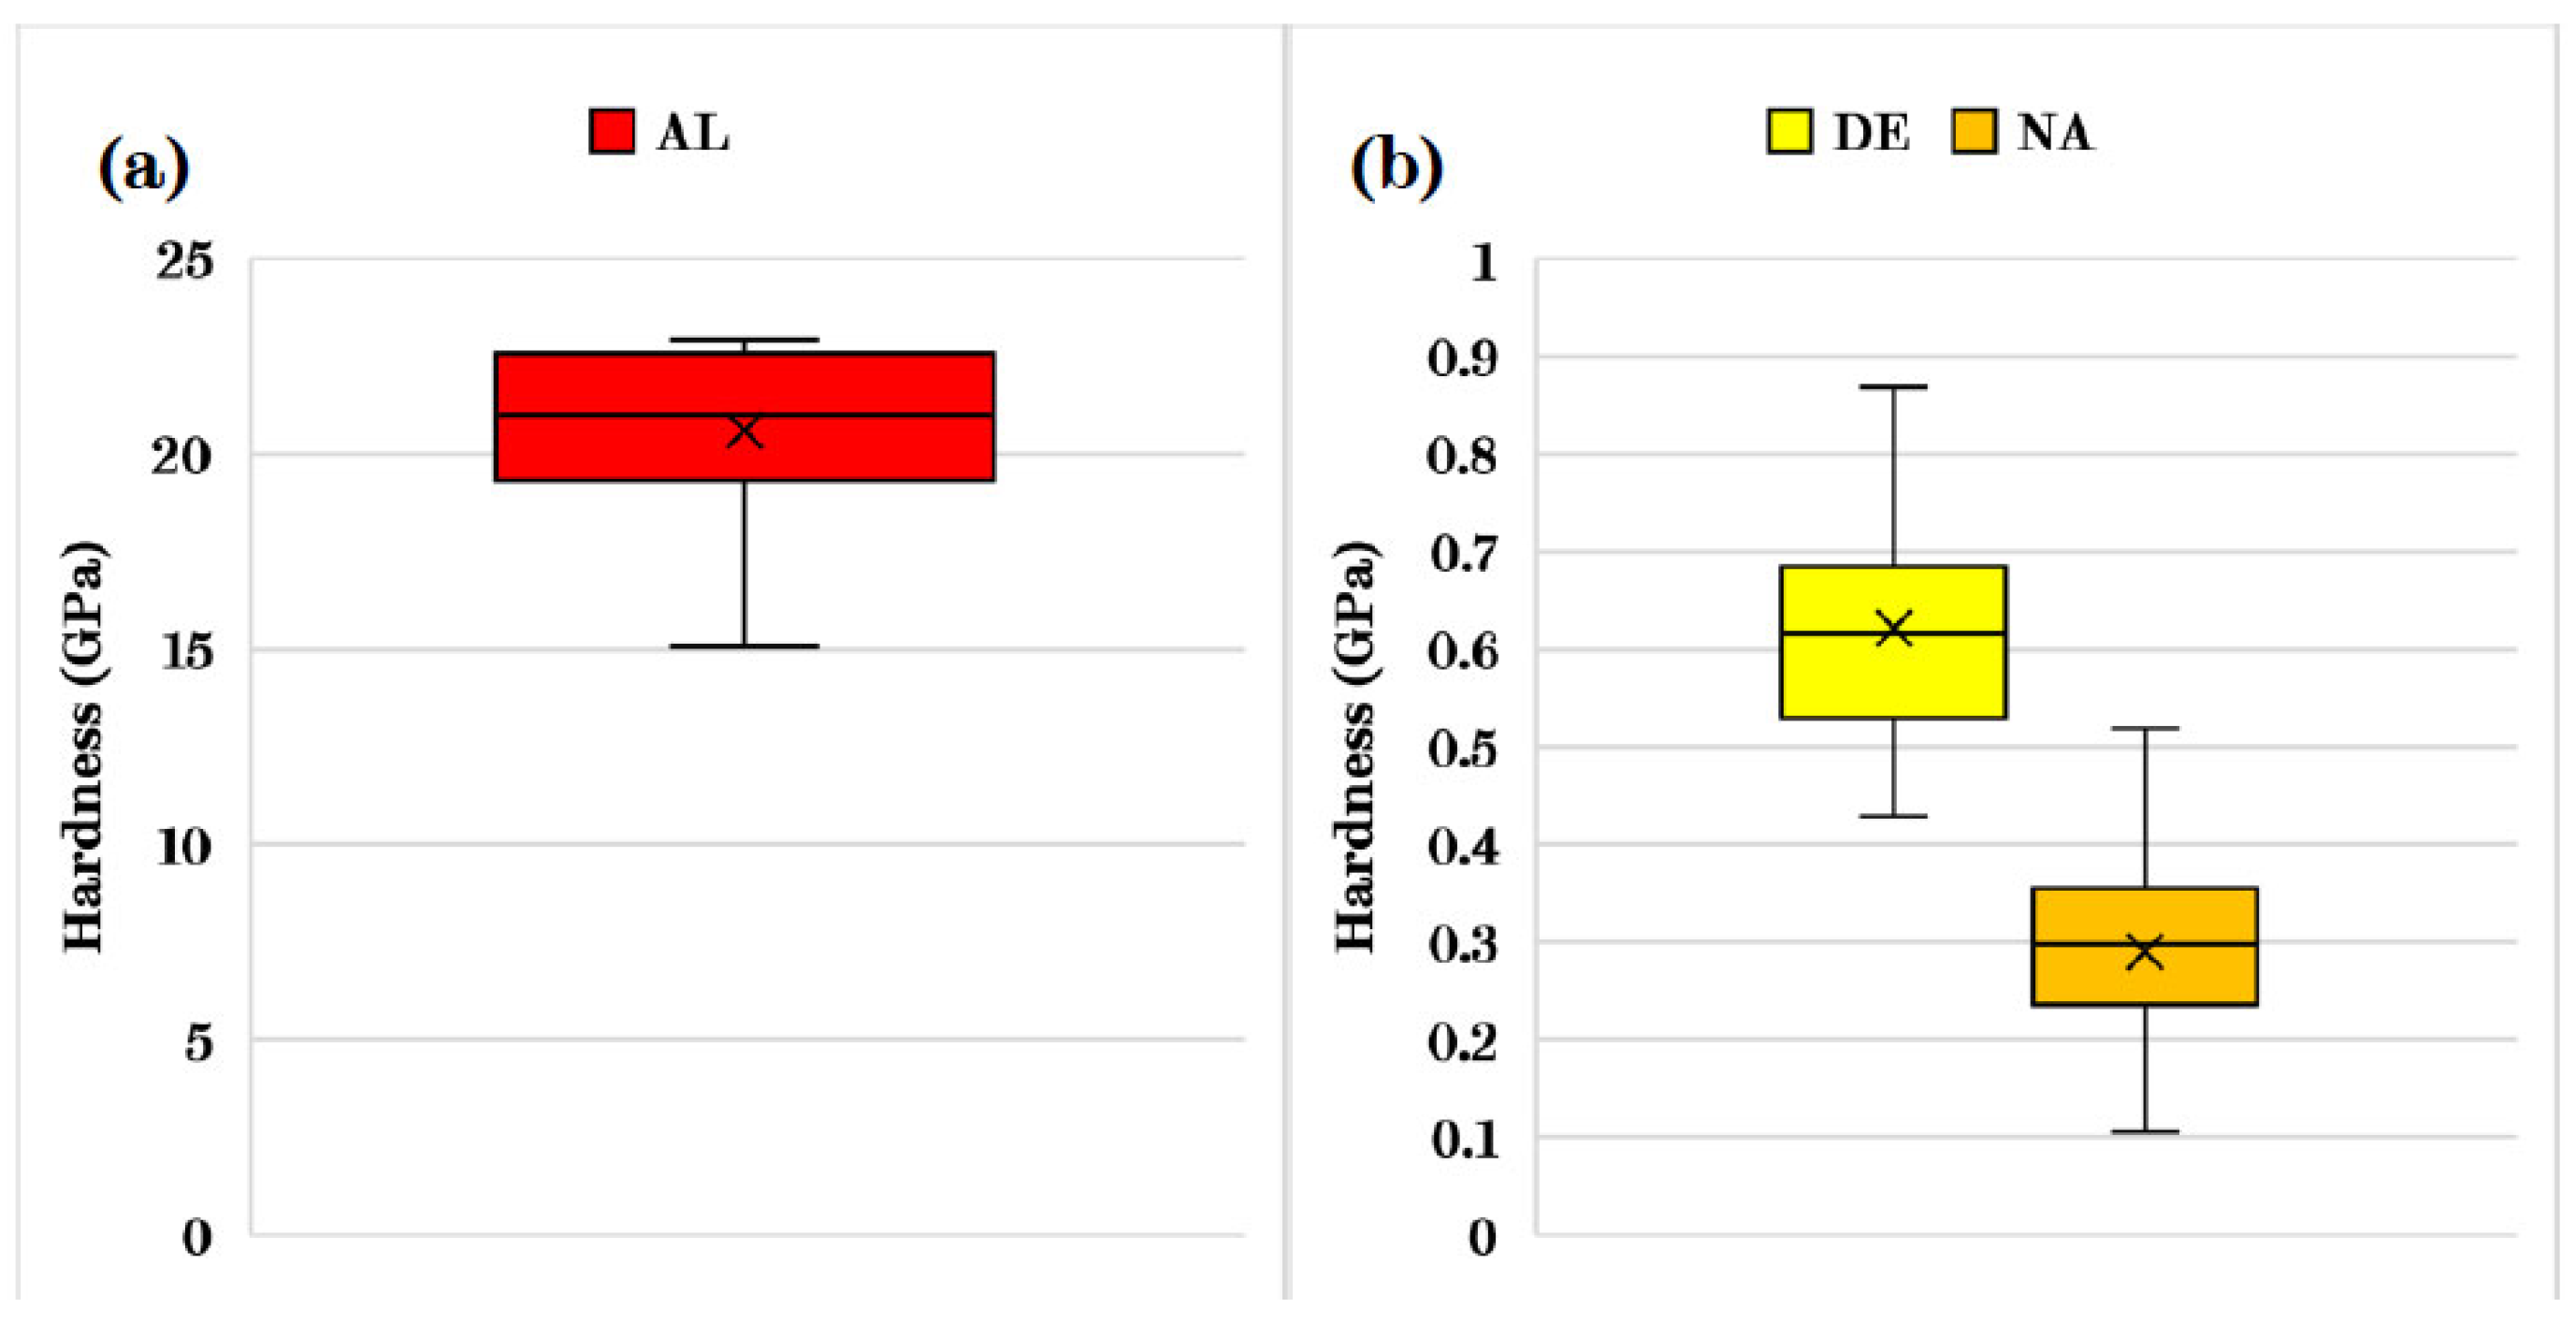
The data for AL is presented in
Figure A5a, in
Appendix A. The median value confirms that alumina is considerably harder than all rail silica sands (3–14 GPa, see [
20]). The data for DE and NA are presented in
Figure A5b. These measurements indicate that these particles are considerably softer than silica sands. AC was not appropriate for indentation measurement approaches, but a previous study [
25] on tyre tread hardness estimated a Shore A hardness of 65. NSS and ZL had given hardness measurements of 1.7–2.2 GPa and 0.6–1.5 GPa, respectively. All hardness data is summarised in
Table 1 in common units for ease of comparison.
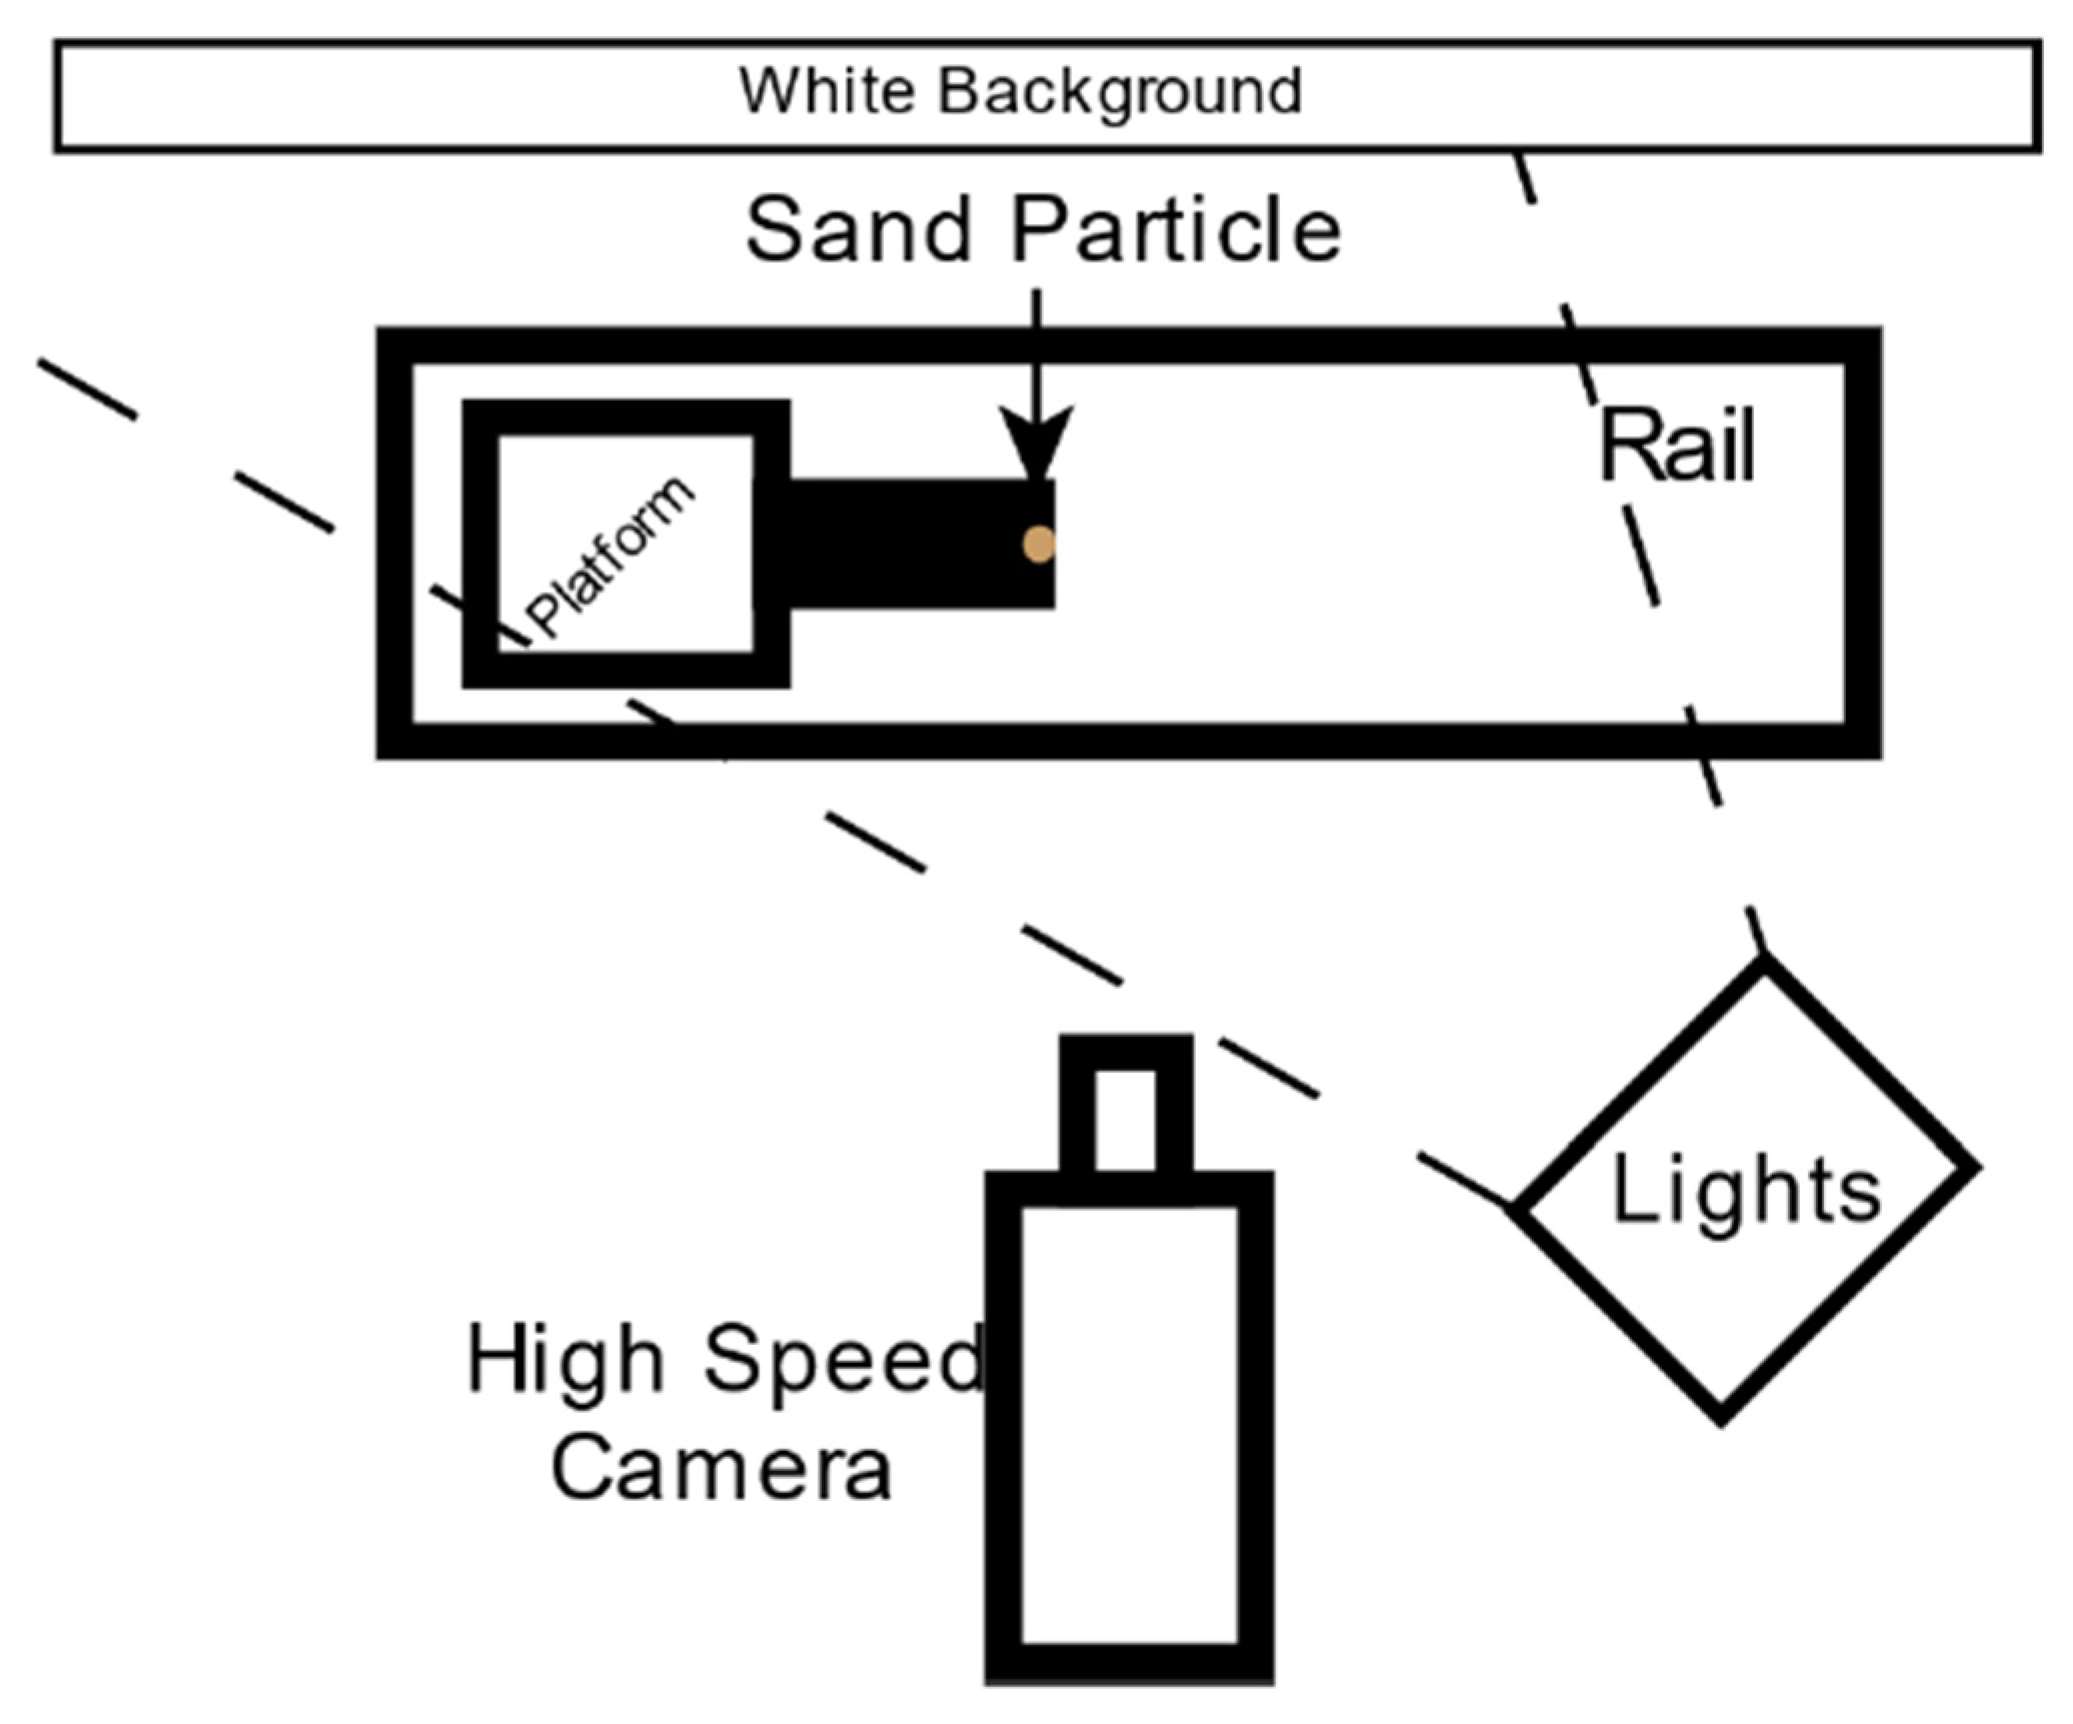
Finally, the coefficient of restitution was tested by carefully pushing individual particles off a platform and onto a rail; a high-speed camera recorded the particle bouncing on the rail. A set of lights and a white background were used to ensure sufficient contrast in order to clearly see the particle. A schematic of this set-up is included in
Figure A5, in
Appendix A. The coefficient of restitution was measured using image analysis of video recorded with a Phantom V210 high-speed camera at frame rates of 2230 fps. Particle velocities were measured immediately before and after bouncing, using the “mtrackJ” plugin in ImageJ software (version 1.52). Thus, the coefficient of restitution (CoR) could be calculated as:
A total of 20 particles of each type were tested, repeats on a single particle were found to be impractical due to the difficulty in locating sand particles after use. It has been found that particles that bounce lower tend to be more easily entrained into the wheel/rail contact [
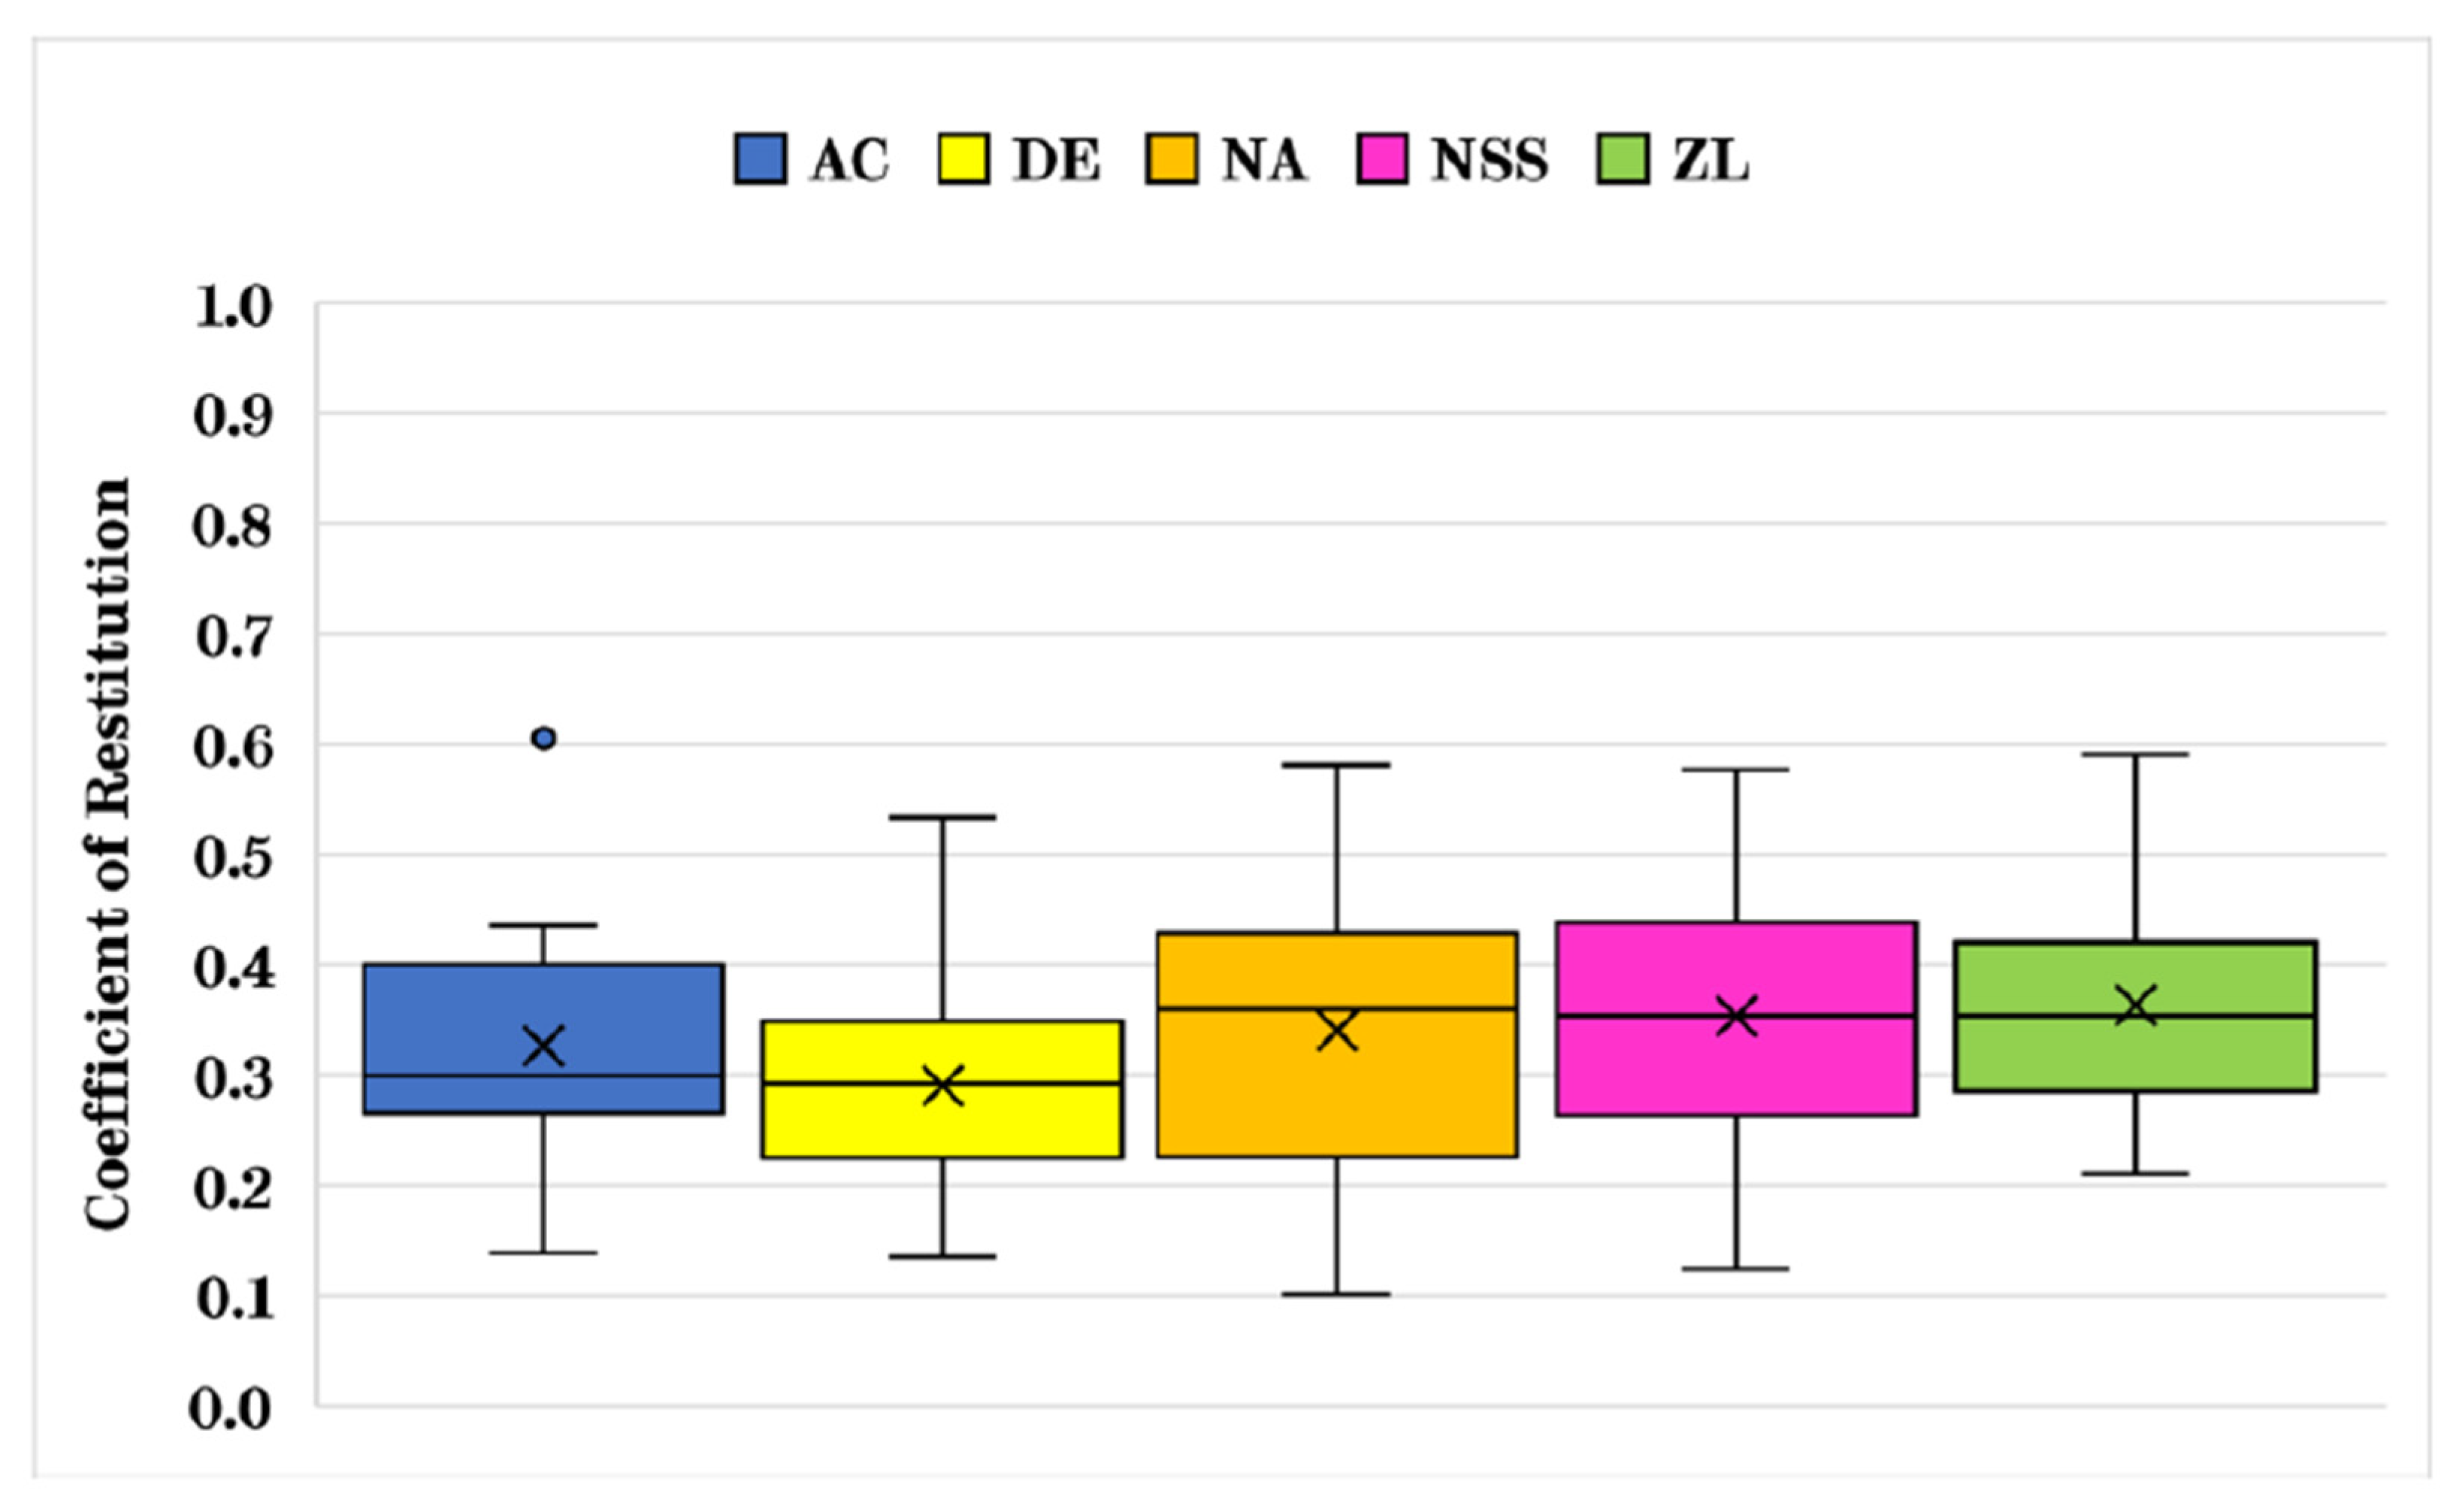
26], therefore identifying particles with lower CoRs, or even just characterising particle behaviour when kept low, may help improve understanding of how to improve entrainment. The coefficient of restitution results for the particles are shown in
Figure A6, in
Appendix A. Generally, they had lower values of coefficient of restitution than silica sand particles (median values 0.5–0.8, see [
22]) and showed a lower spread of measured values.
2.3. Third Body Application
Particles were applied to the lower rail specimen by hand, ensuring an even spread throughout the annular contact. For all tests with particles present in the contact, 0.025 g of material was used. This amount was selected such that the sand concentration in the contact was equal to 0.15 kg/m
2, the maximum allowable sand concentration for British railways [
27].
For tests conducted under wet conditions, 20 µL of distilled water was pipetted into the contact, with care taken to ensure an even spread within the contact. When both water and particles were applied, the particles were applied to the rail specimen and the water was added afterwards.
For tests conducted with a leaf layer present, 0.025 g of sycamore leaf powder was applied to the contact, ensuring an even spread. This powder was then wetted with 20 µL of distilled water using a pipette. One test run was then performed to condition the layer. After this conditioning run, another 20 µL of distilled water was pipetted into the contact. For the leaf tests with particles present, the particles were applied after the conditioning run and before the second application of 20 µL of distilled water.
All particles were tested under all conditions, i.e., dry, wet, and leaf-contaminated. Repeat tests were run for every test condition.
Laboratory environmental conditions during the tests were typically 20–30 °C and a humidity of 40–50%.
2.4. Post-Processing of HPT Data
The HPT data included in this paper were post-processed, firstly by isolating each test run, i.e., from the test start point to reaching the test finish point. The coefficient of traction was then calculated by dividing the tangential force (the torque at the effective radius of friction) by the axial force. Displacement was adjusted to account for a rig stiffness of 0.0005 °/Nm (see Evans for the calculations [
19]).
For the sake of clarity, runs under the same conditions were averaged; where further analysis was undertaken, individual runs were used instead. The traction data includes two or three runs for each condition, which were interpolated and averaged for every 0.0001 mm, and the data were plotted with error bars denoting one standard deviation above and below every 200th data point for the sake of clarity. Unless otherwise stated, the runs that were plotted were the initial test run after surface conditioning/material application.
2.5. Post-Test Surface Scanning
The roughness measurements of the tested surfaces were taken using the Alicona InfiniteFocusSL 3D optical profilometer and analysed using built-in software. Two scans were taken for each tested wheel and rail specimen at the end of all the test runs. Each 3D scan was taken over a 3.66 × 3.66 mm2 area with a vertical resolution of 500 nm, though it should be noted that when this was not possible (e.g., due to immovable contamination), a smaller area was used to obtain measurements. The measure of roughness used in this paper was the RMS height, Sq, from a reference plane (calculated from a default function of the software). The roughnesses (Sq) of the pre-test specimens were 2.57 ± 0.20 µm for the wheel specimen and 2.43 ± 0.13 µm for the rail specimen.
For presentation purposes, the RMS height, Sq, was calculated for each set of test specimens and averaged over repeat runs, with the standard deviation included as an error bar. Where further analysis was undertaken, individual measurements were used.
3. Results
The following section includes traction data and post-test surface analysis for the various particles tested under dry, wet and leaf-contaminated conditions.
3.1. Dry Conditions
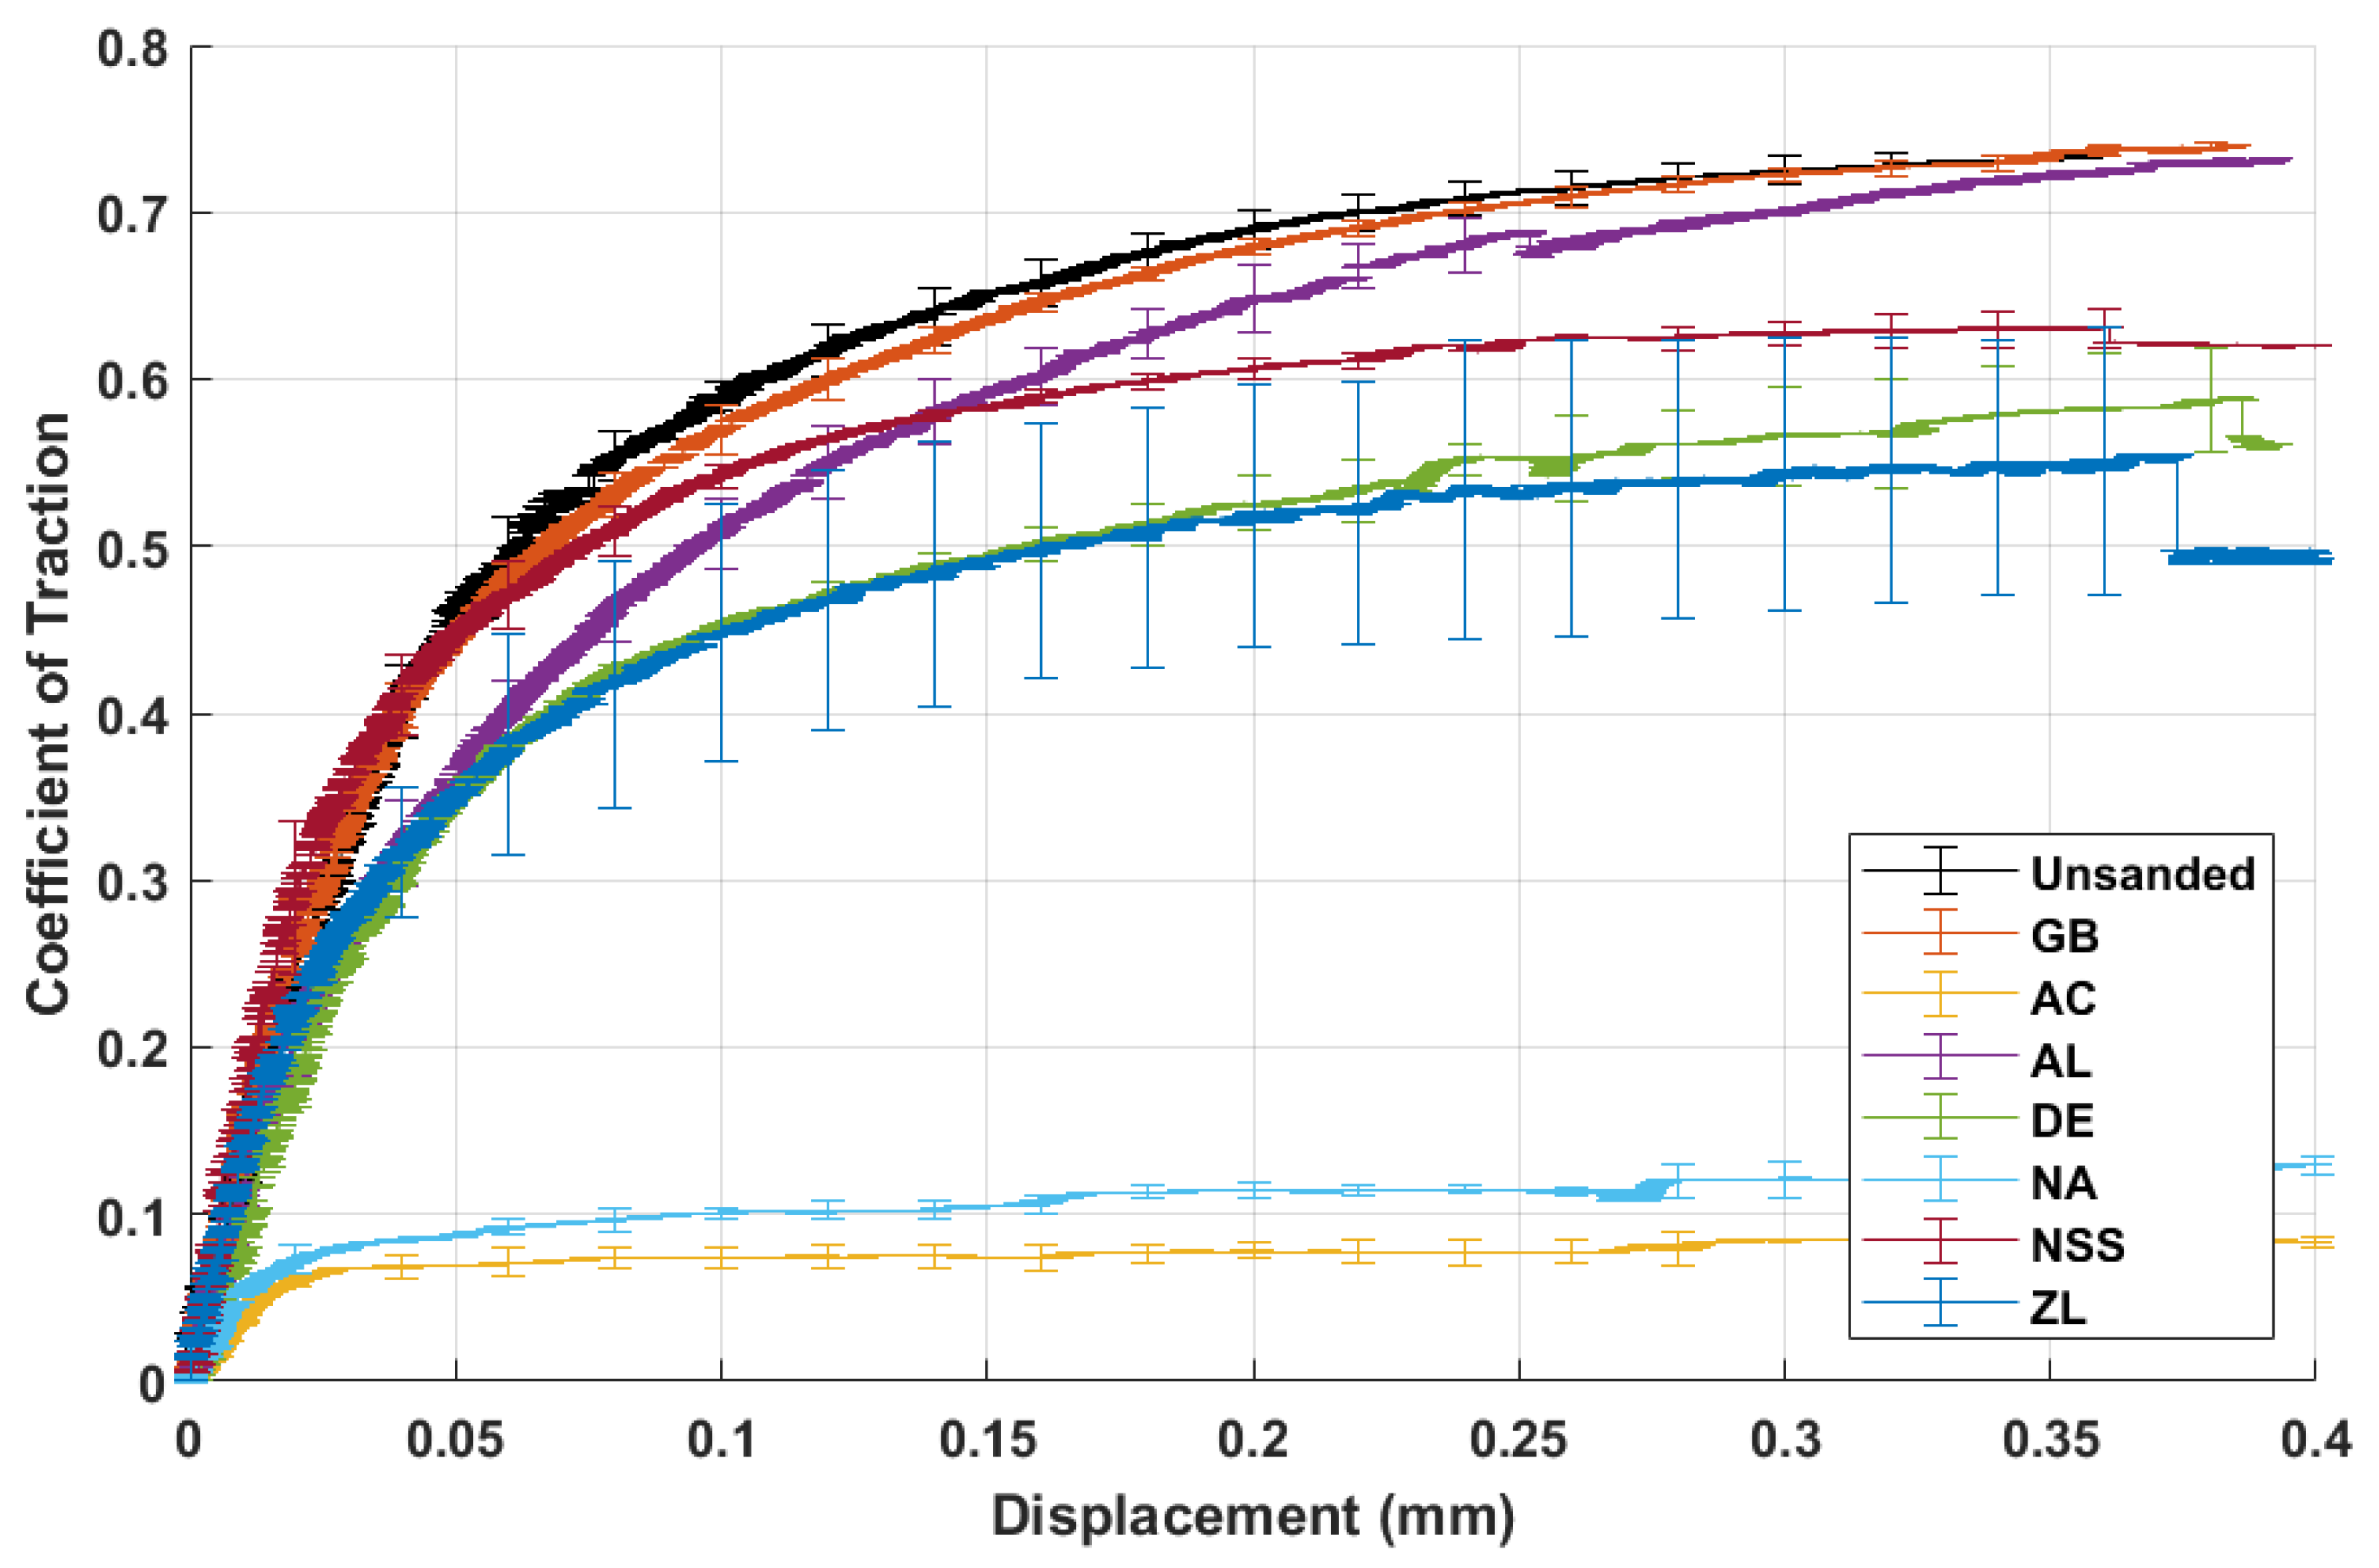
Figure 3 shows the traction data for the particles in a dry interface. A wide range of behaviours is seen. AL eventually reached a similar peak coefficient of traction (CoT) to a clean steel-on-steel interface (“unsanded”), but due to a lower initial gradient, it took longer for AL to reach a peak CoT of 0.73. NSS had a similar initial gradient to the unsanded case, but failed to reach a similar peak CoT, instead peaking at 0.63. DE and ZL behaved very similarly, exhibiting similar initial stiffnesses to one another, although slightly lower initial “stiffnesses” when compared to the unsanded case. They also peaked at similar CoTs of 0.59 and 0.56, respectively. AC and NA also acted similarly, with a much lower gradient and peak CoT compared to the unsanded case. AC peaked at 0.08 and NA at 0.13, both of which can be considered to have caused low enough adhesion to be classified as lubricants.
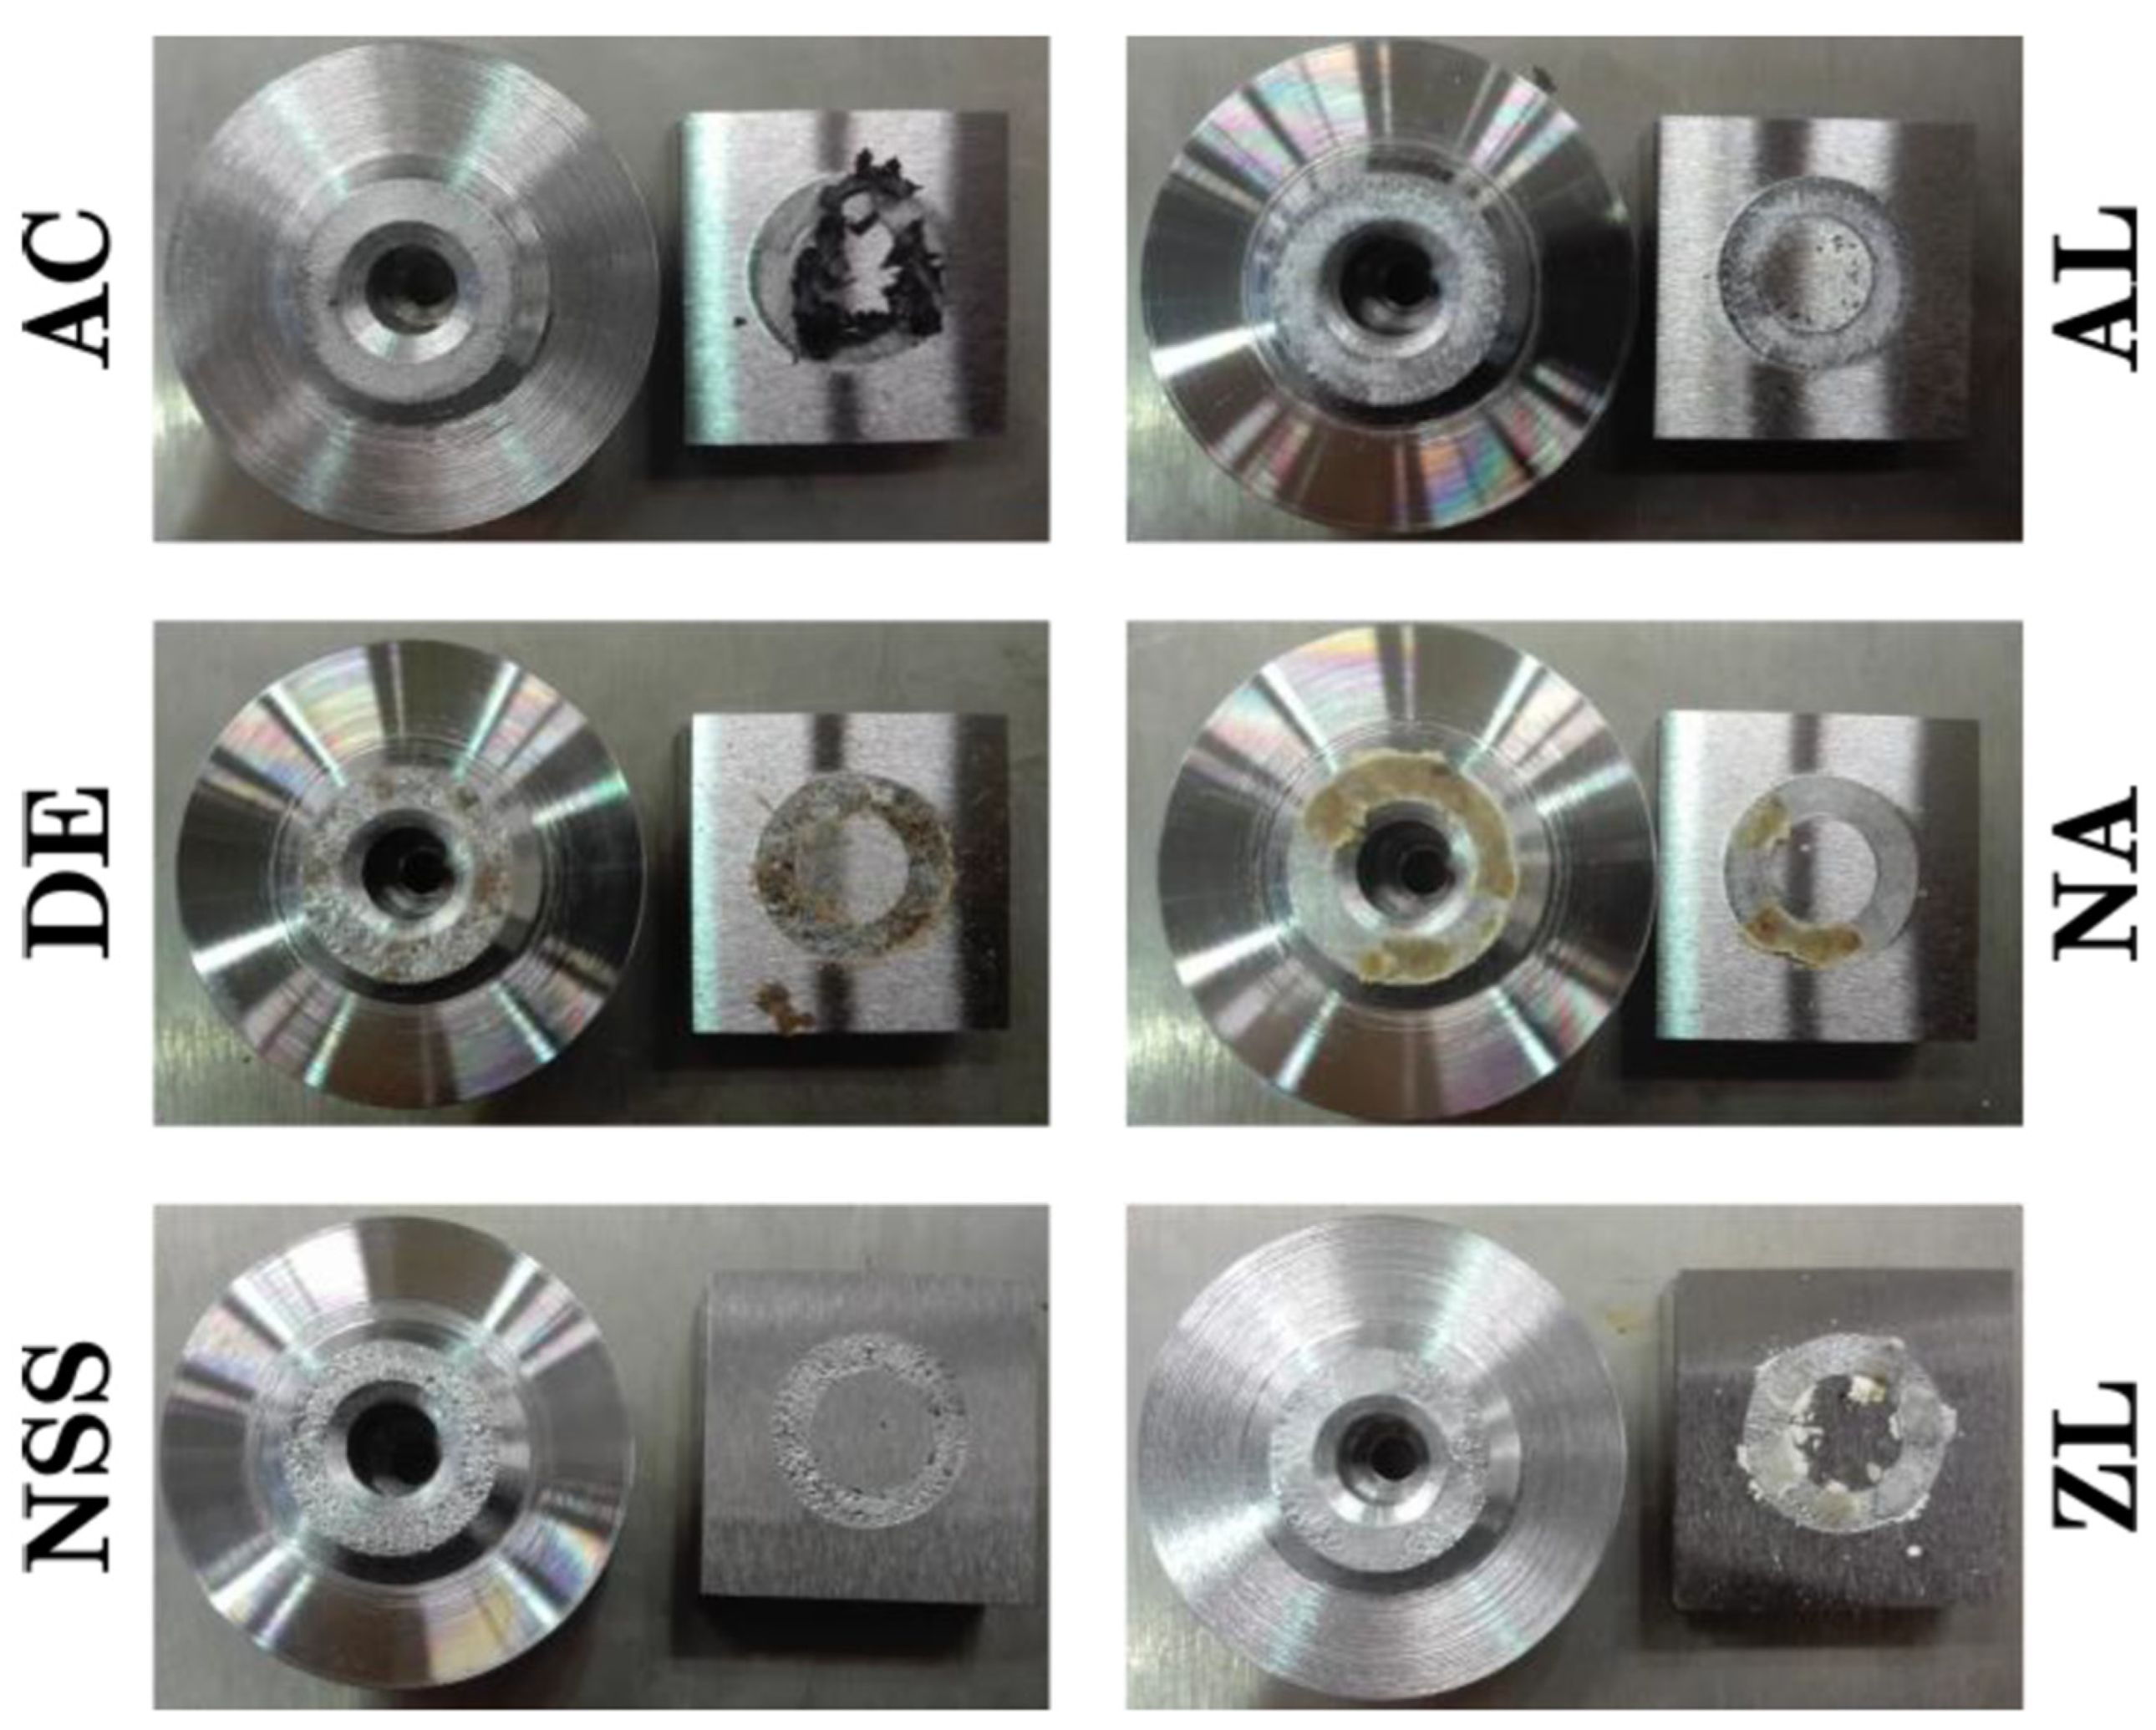
The images of the post-test specimen surfaces included in
Figure 4 also show how varied the behaviour of the other particles was. AC seemed to agglomerate, whilst not adhering to the surface. AL was retained in the contact and was spread relatively evenly across the contact. DE and Zl remained in the contact, but in clumps, similar to silica sand particle behaviour [
20]. NA appears to have been crushed down into a continuous layer around the contact, with most of the material being present on the wheel specimen. Some NSS material was visible after the test; it appears to have spread relatively evenly around the contact.
In most cases, the wheel specimen roughness (
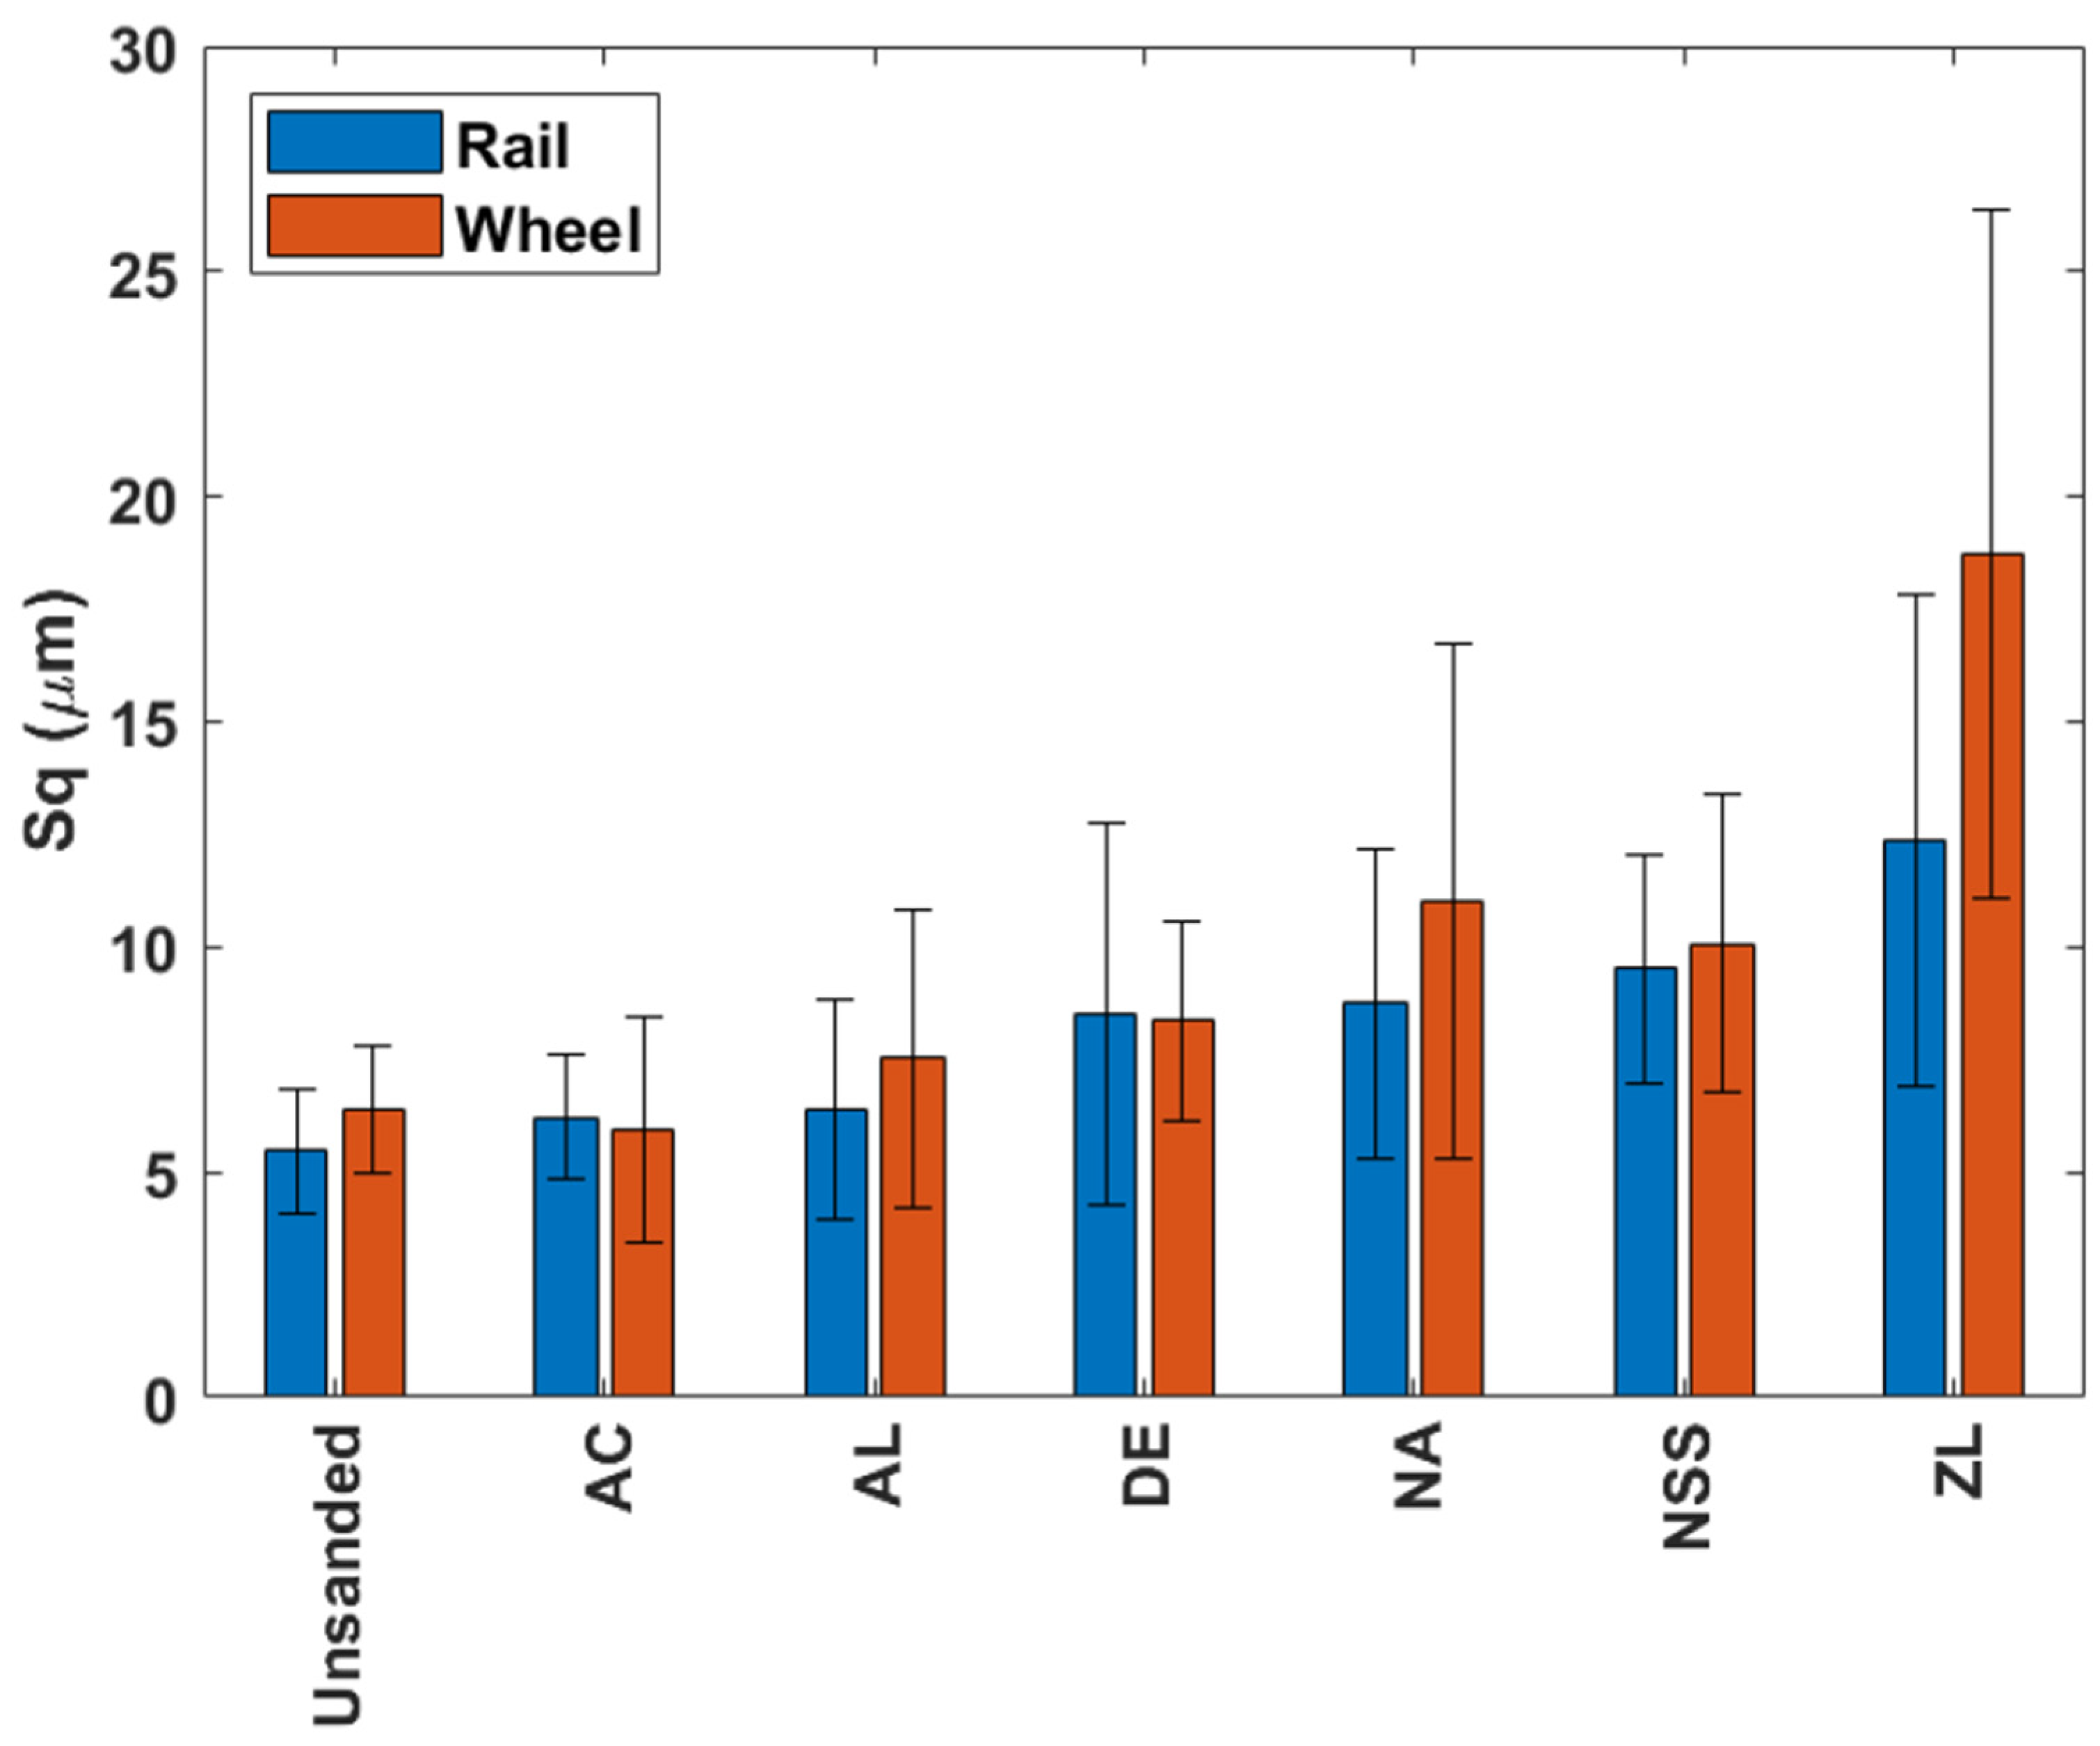
Sq) was higher than the rail specimen roughness (see
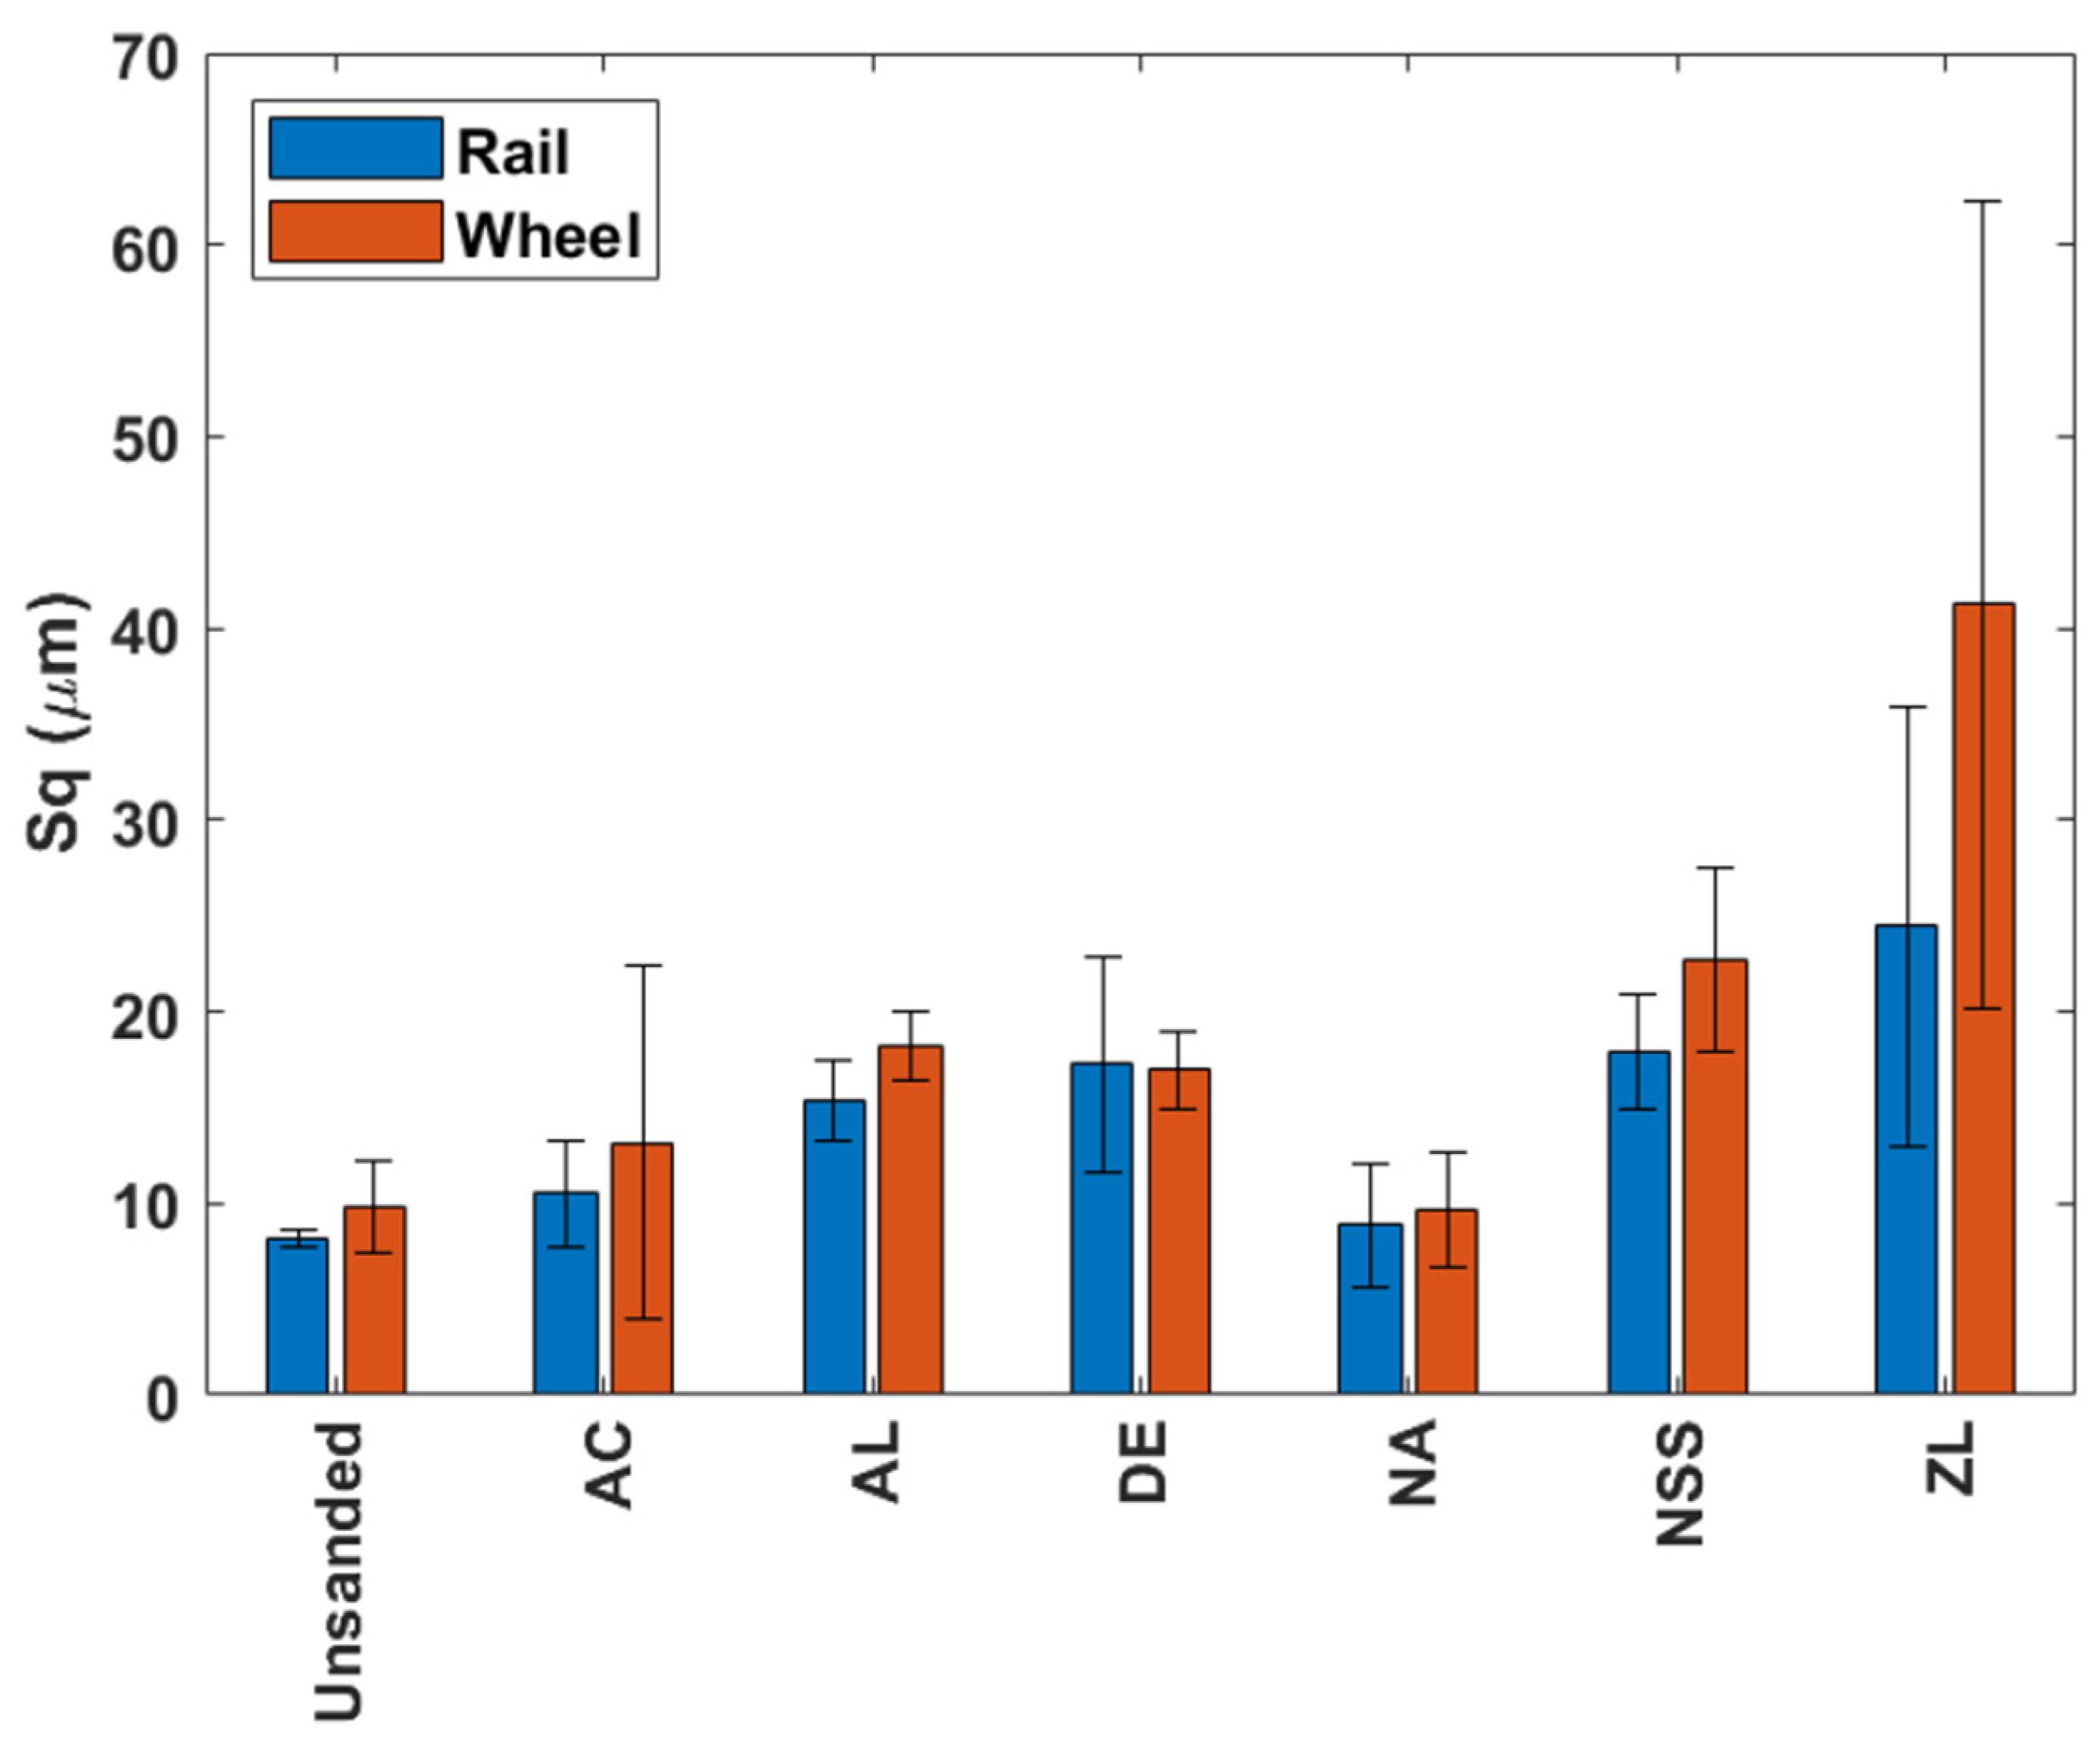
Figure 5), with DE marginally excepted. AC and NA showed similar surface roughness to the unsanded case, whereas AL, DE, and NSS showed slightly higher roughness values. ZL showed significantly higher roughness than the unsanded case, though the variation in measurement was especially large.
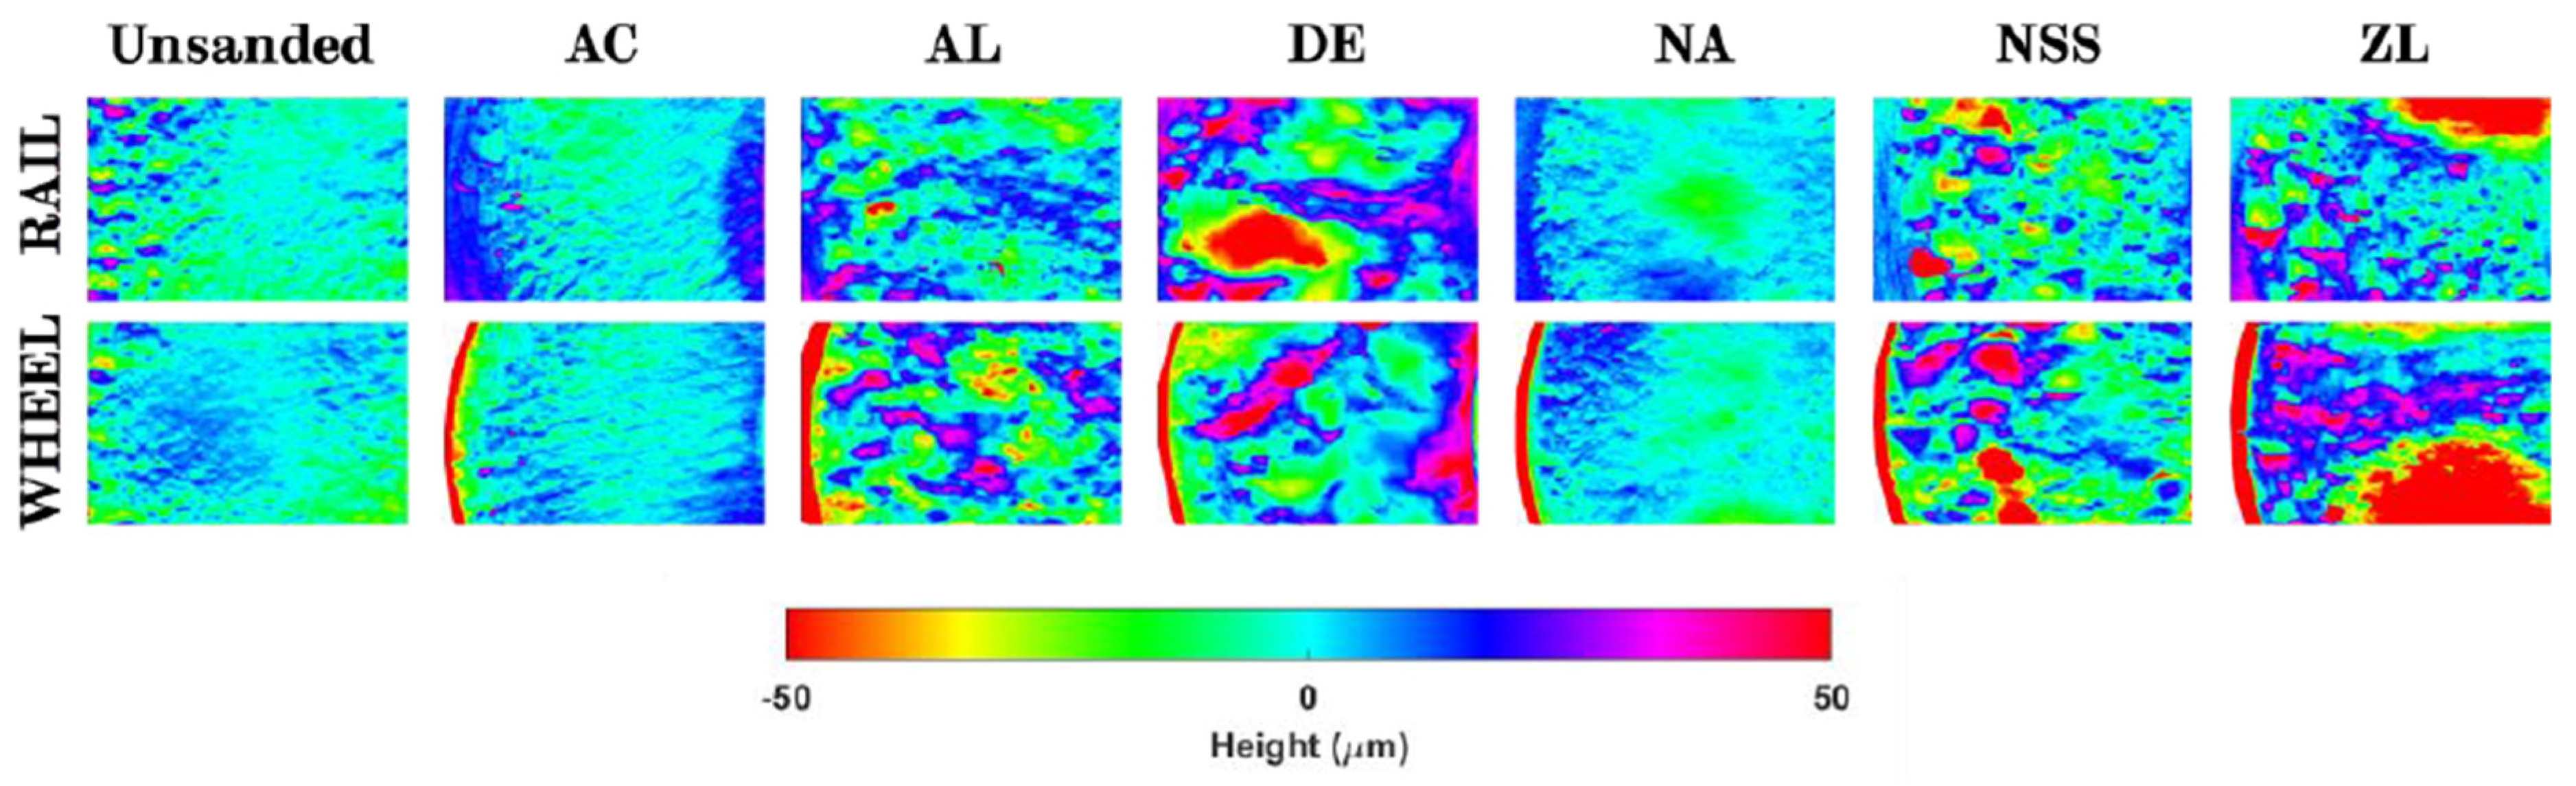
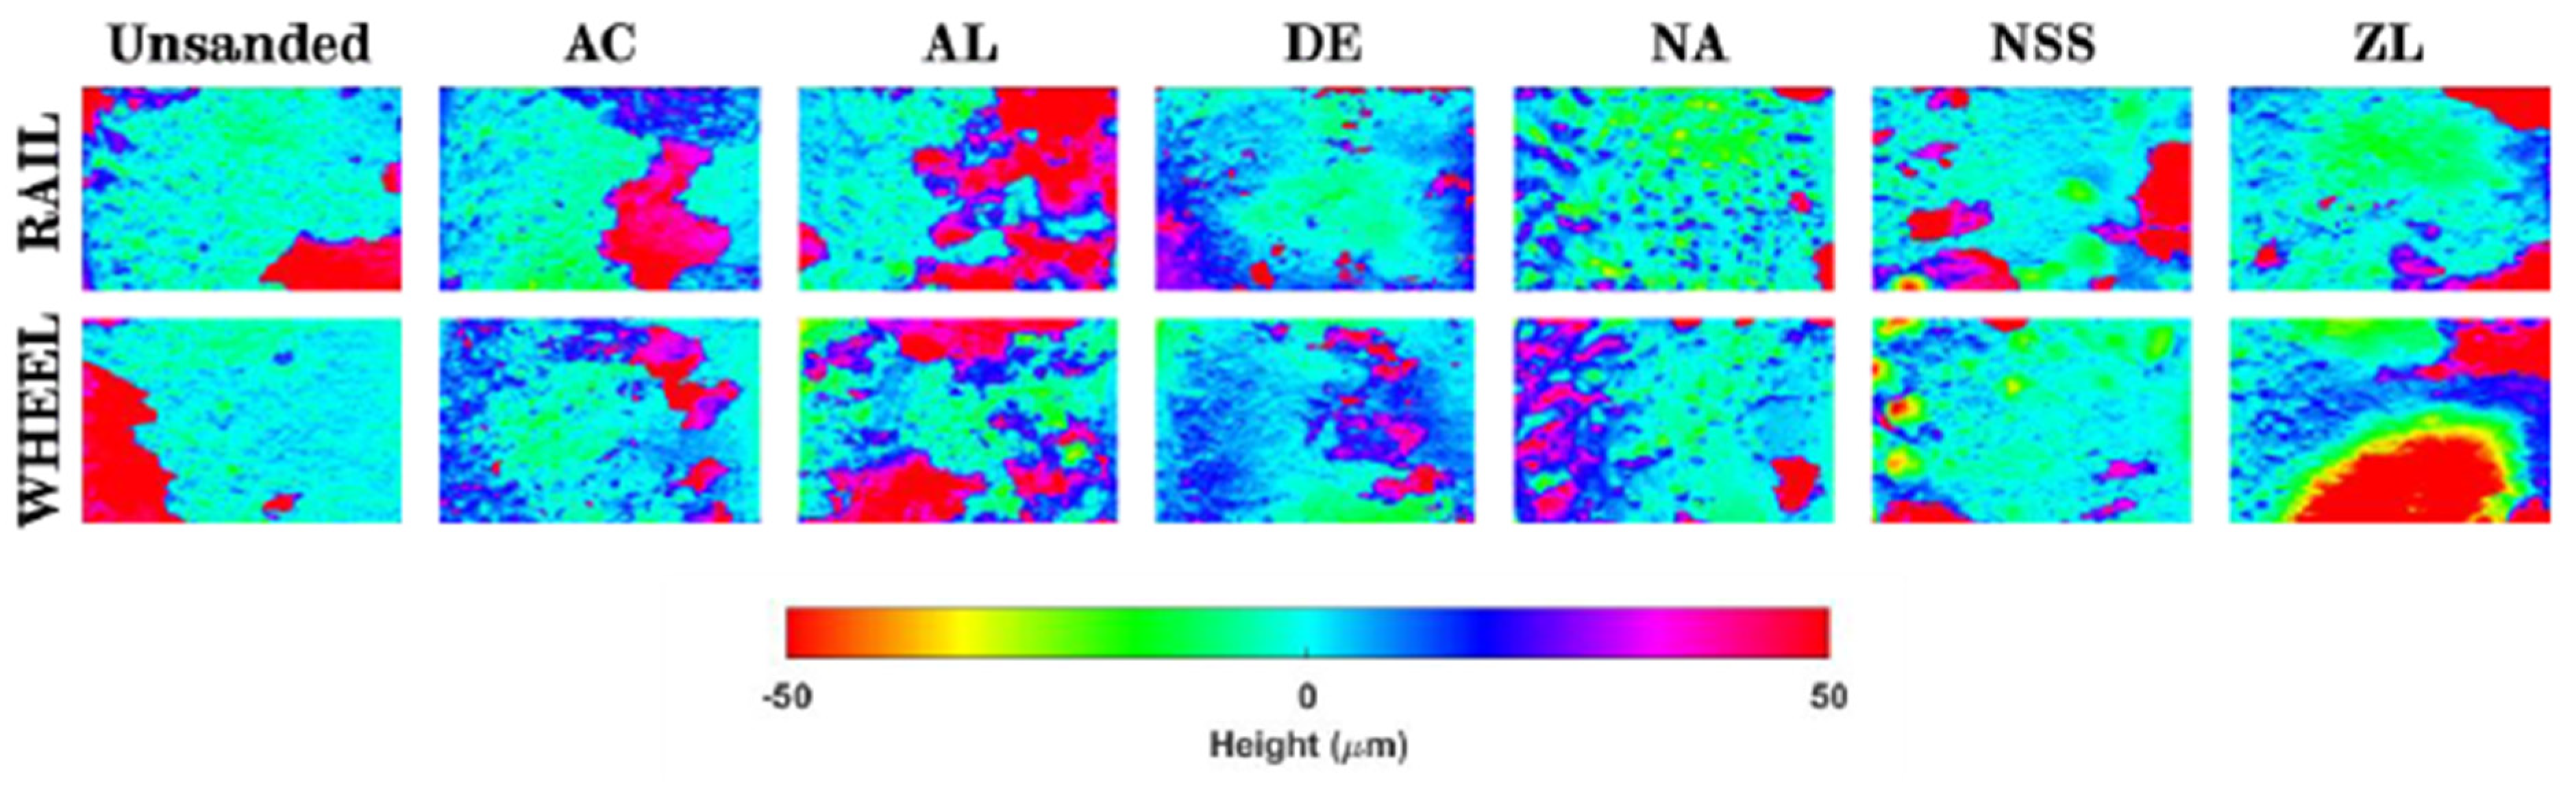
The post-test surface scans, included in
Figure 6, show how scans from AC and NA tests compare well to the unsanded case. AL and NSS showed a marked difference between the unsanded case, with small indentations and disturbances on their surfaces. DE and ZL included large indentations on the surface.
Though all these particles have very different characteristics, they are all similar in one respect: all particle types were retained within the contact during the test, unlike silica sand under dry conditions. The low adhesion particles (AC and NA) did not appear to affect the surface roughness or appearance, though both were present in the contact. DE and ZL both acted similarly, in that they clumped together in the contact, creating higher roughness and large indentations compared to an unsanded case; this was more severe for ZL. AL and ZL, though being very different types of particles, both acted similarly, spreading relatively evenly throughout the contact and roughening the surface without creating the large indents that DE and ZL created.
The key outcome from these tests was identifying two possible particles (AC and NA) as candidates for use where lubrication of the wheel/rail interface is needed.
3.2. Wet Conditions
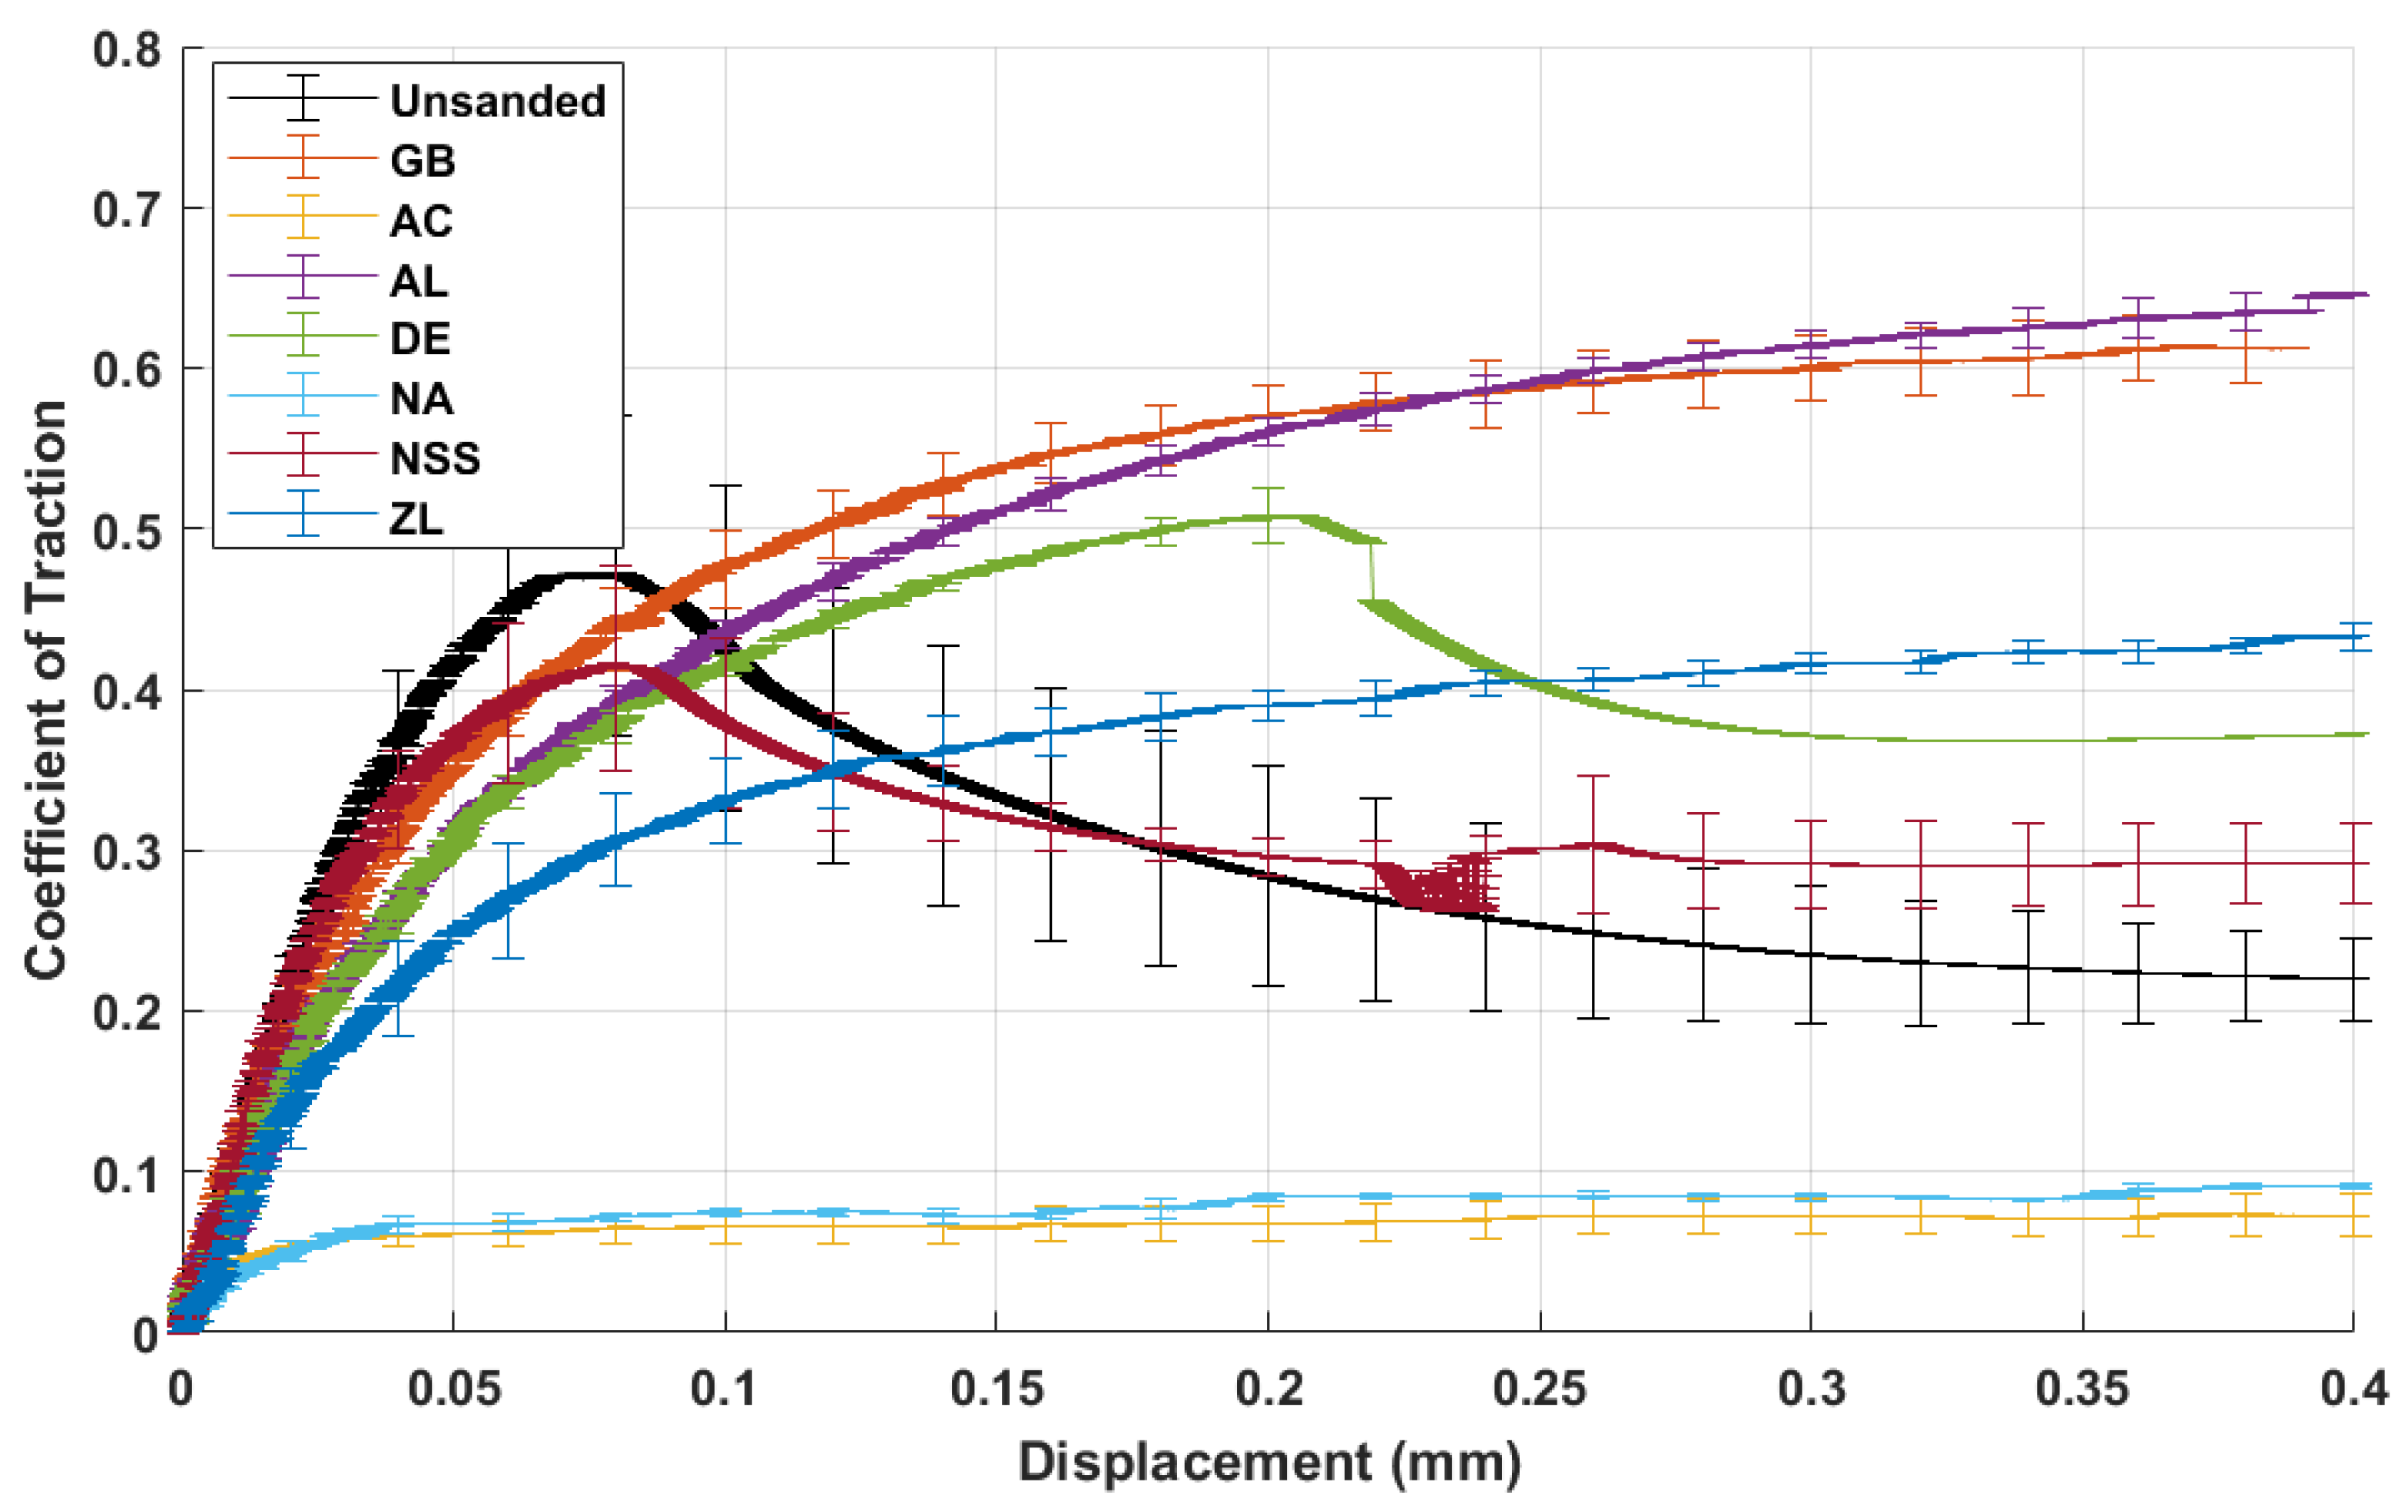
The traction data for the particles under wet conditions are shown in
Figure 7. Both AC and NA behaved as they did under dry conditions, though their CoTs are slightly lower, at 0.07 and 0.09, respectively. Only NSS matched the initial stiffness of the unsanded case, though gross stick–slip (rise and then drop in CoT) happened at a lower CoT of 0.42, though it did not drop as low as the unsanded case. Gross stick–slip also occurred with DE, though not till much later and much less significantly than the gross stick–slip event for the unsanded case; DE had a peak CoT of 0.51. Both AL and ZL did not undergo gross stick–slip events, though there was a relatively large difference in their peak CoTs, at 0.65 for the former and 0.43 for the latter. All particles returned lower peak values of CoT compared to dry conditions.
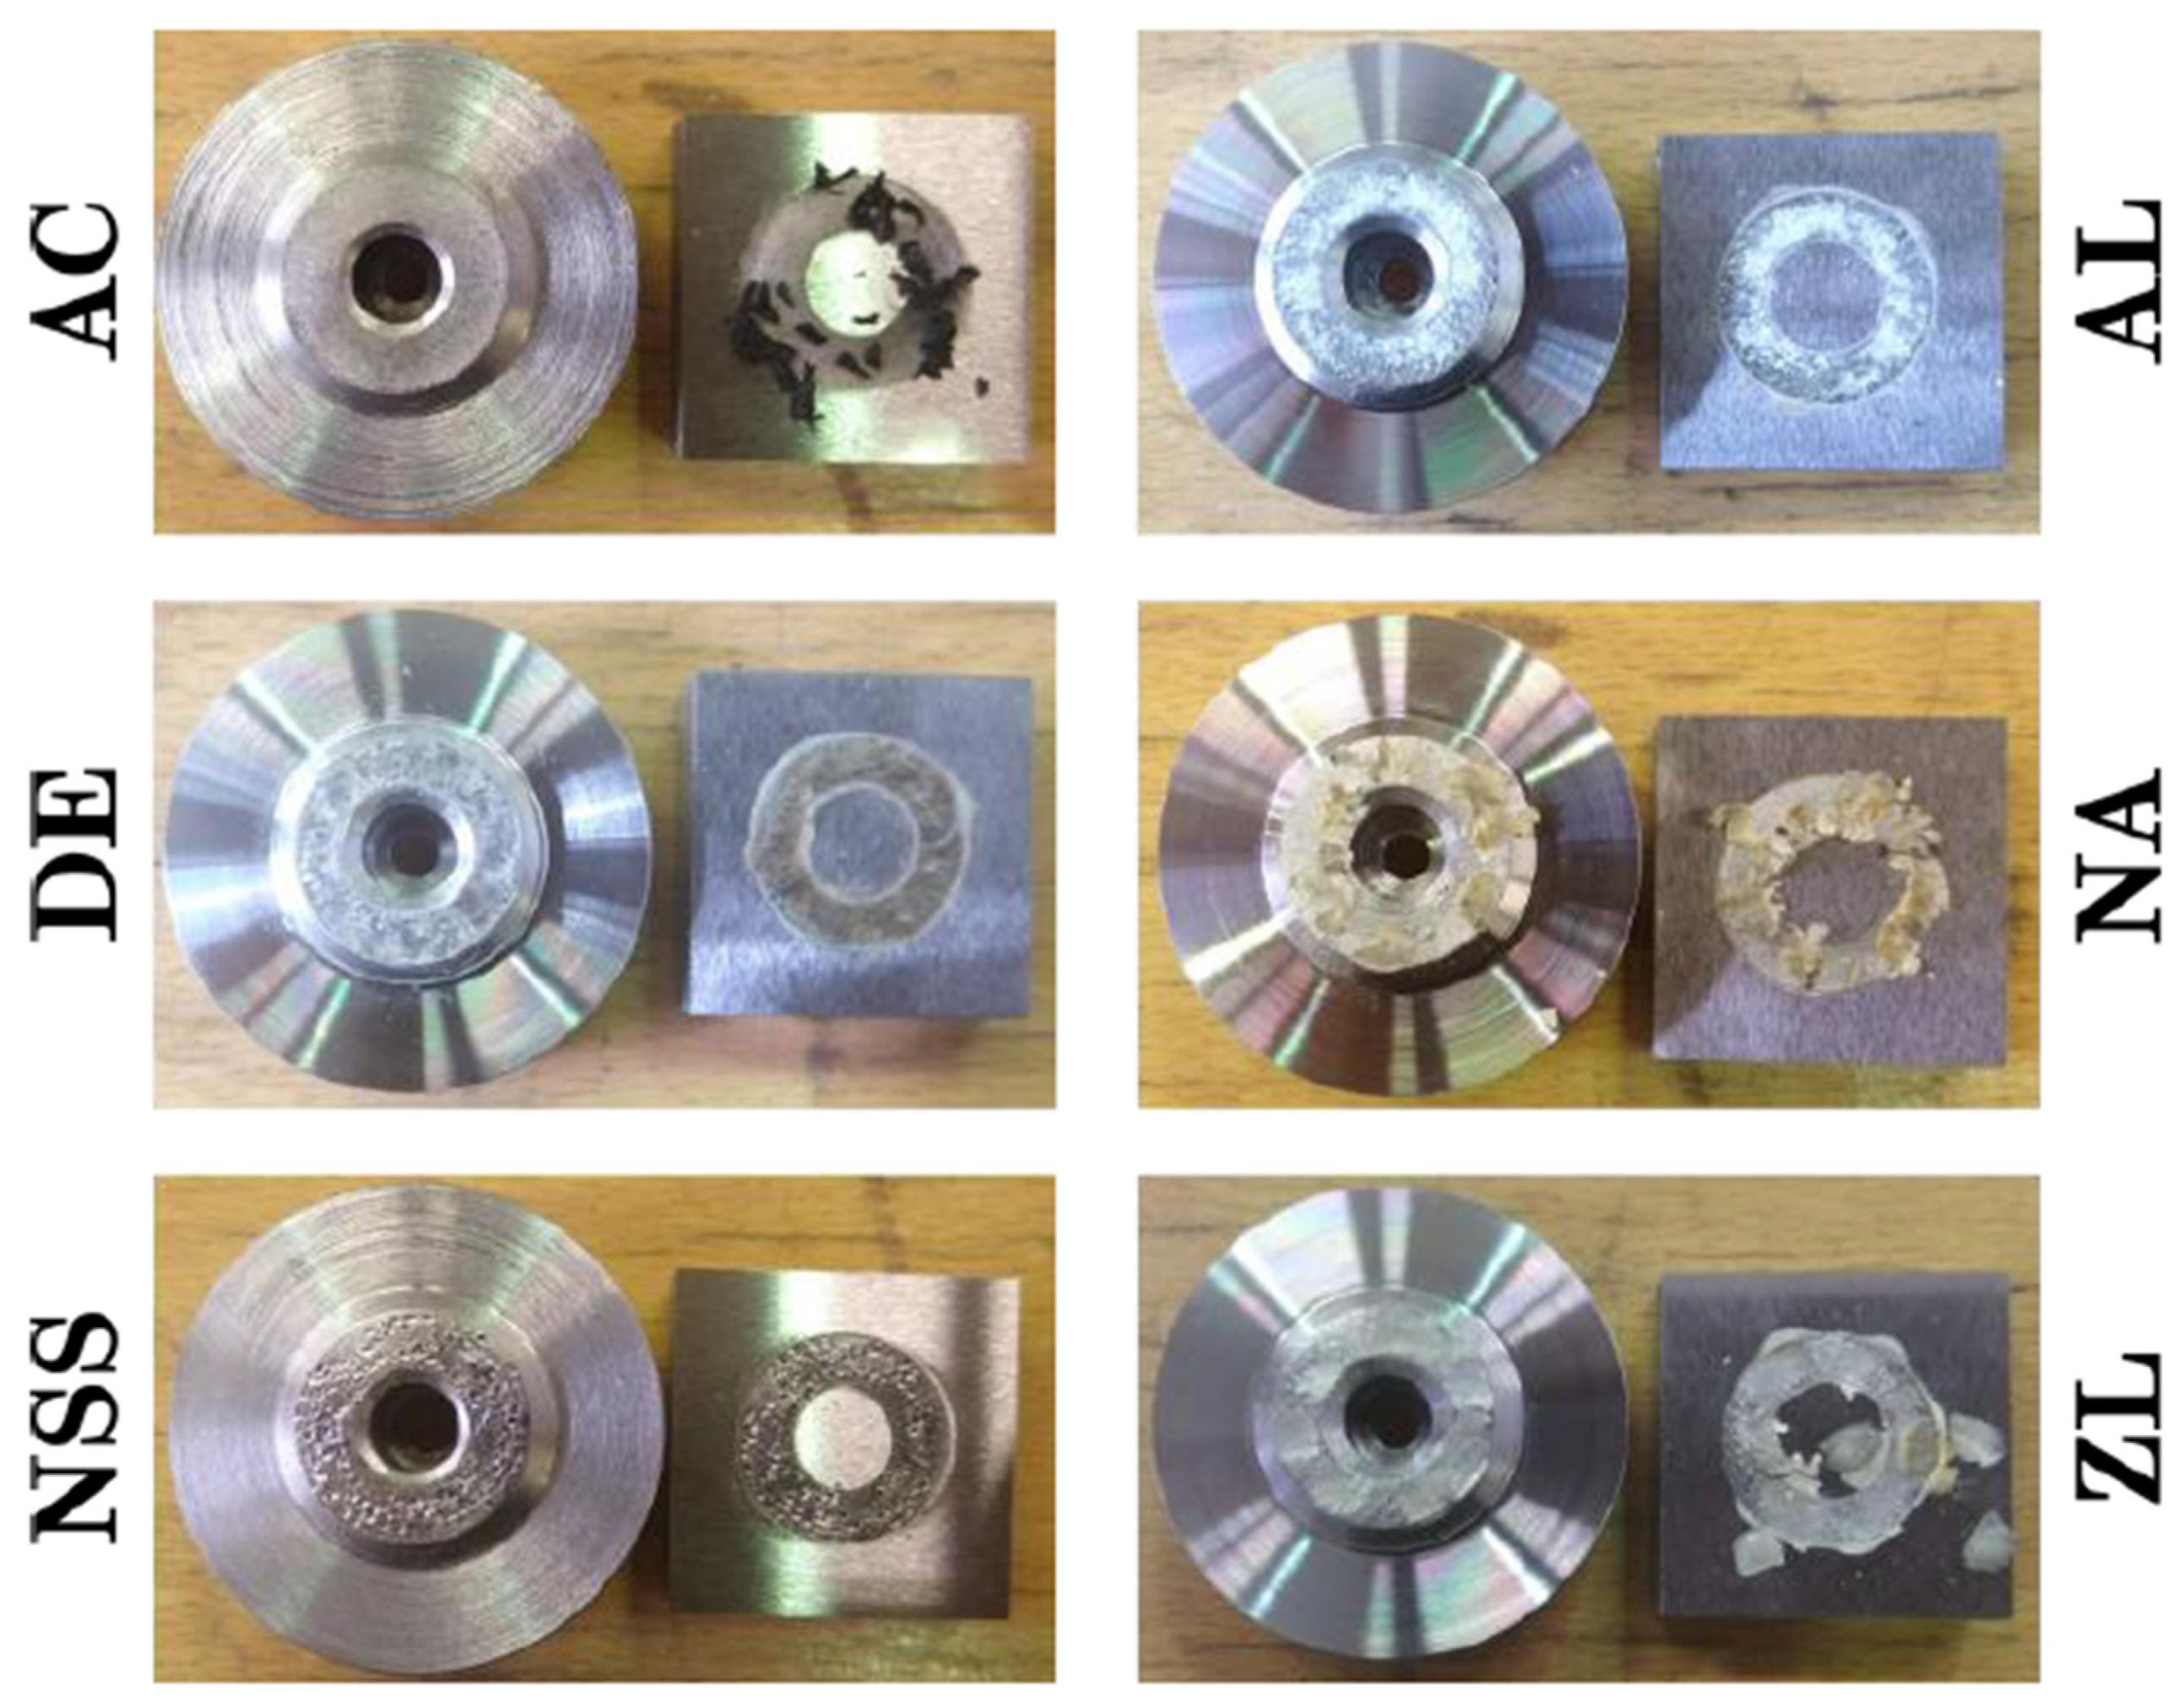
The pictures of the post-test wheel and rail specimens have been included in
Figure 8. As for dry conditions, AC did not adhere to the surface and bunched together during the test. Similarly, AL, NSS, and ZL also acted similarly to the dry contact, the former two spreading relatively evenly around the contact and the latter clumping up. Conversely, DE did not act as it did under dry conditions, spreading around the surface more evenly in this instance. Whilst the spread of NA was similar to that observed under dry conditions, there are differences in its appearance, being less brown and appearing flakier after undergoing wet conditions.
The post-test surface roughness measurements, included in
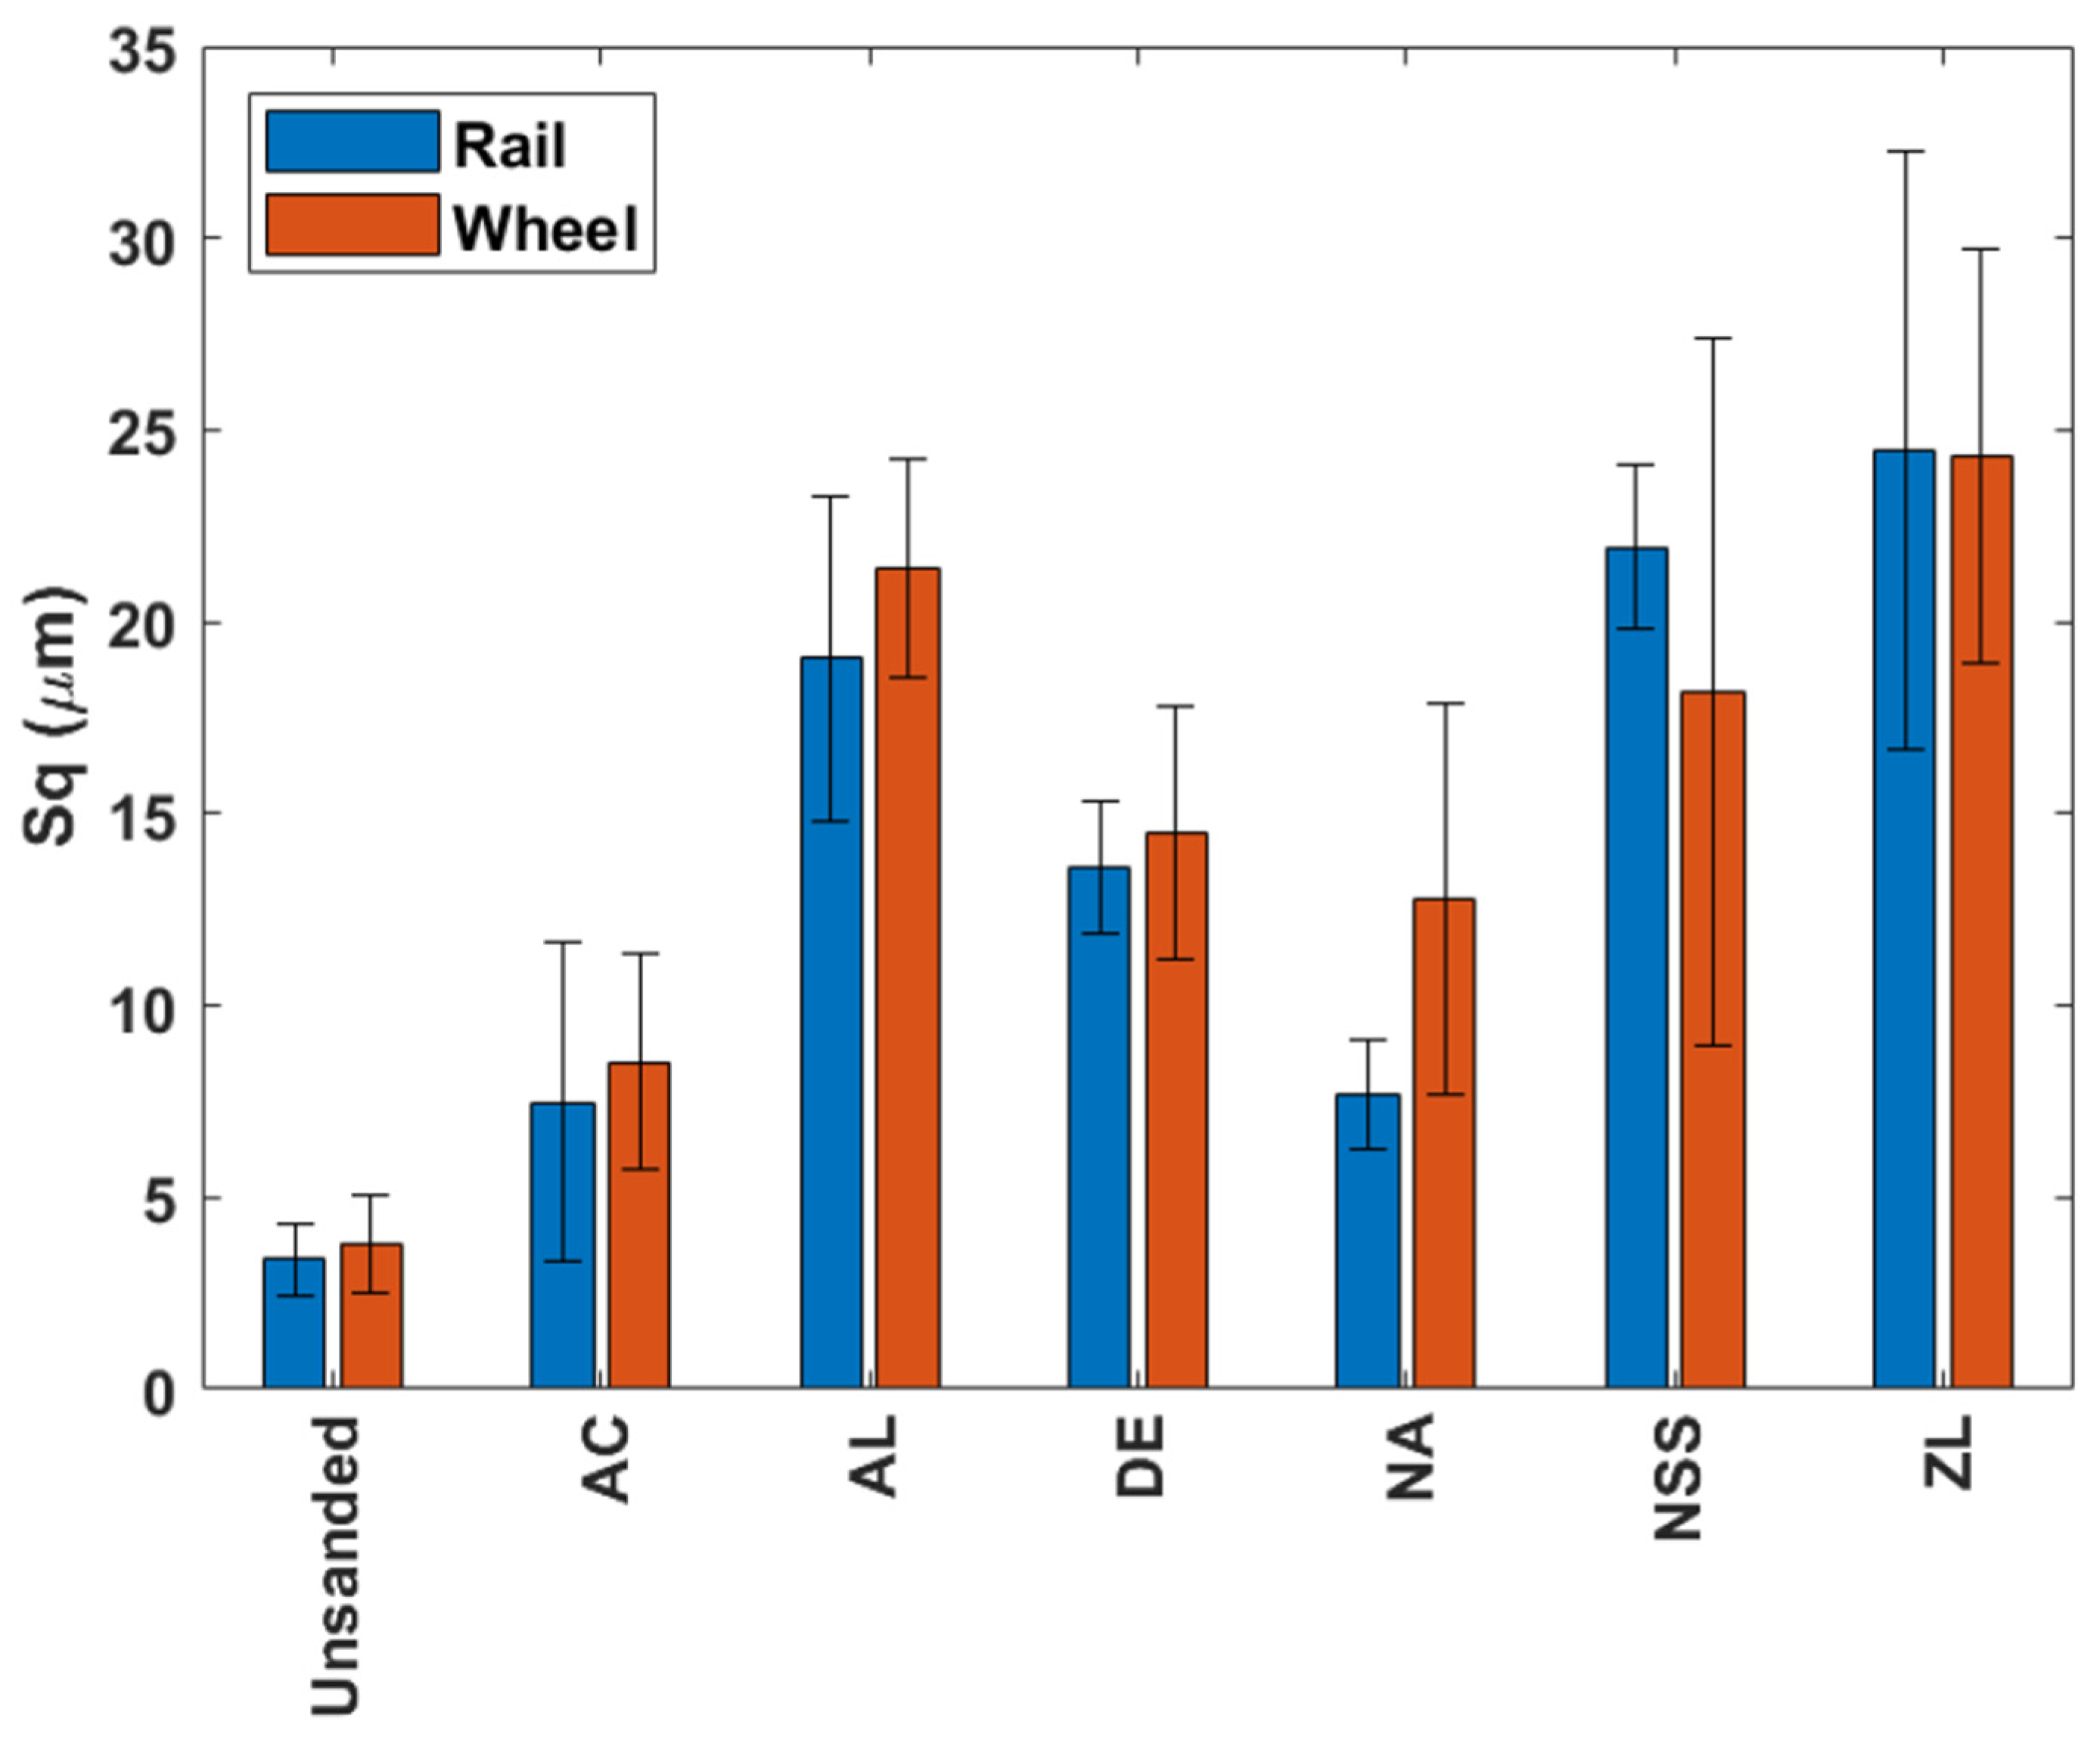
Figure 9, show how roughness was increased in the presence of all other particles under wet conditions. In the cases of AC and NA, the increase in roughness brings measurements up to a similar level to those seen under dry, unsanded conditions. All remaining particles exhibited a relatively similar increase in roughness.
The surface scans for AC, shown in
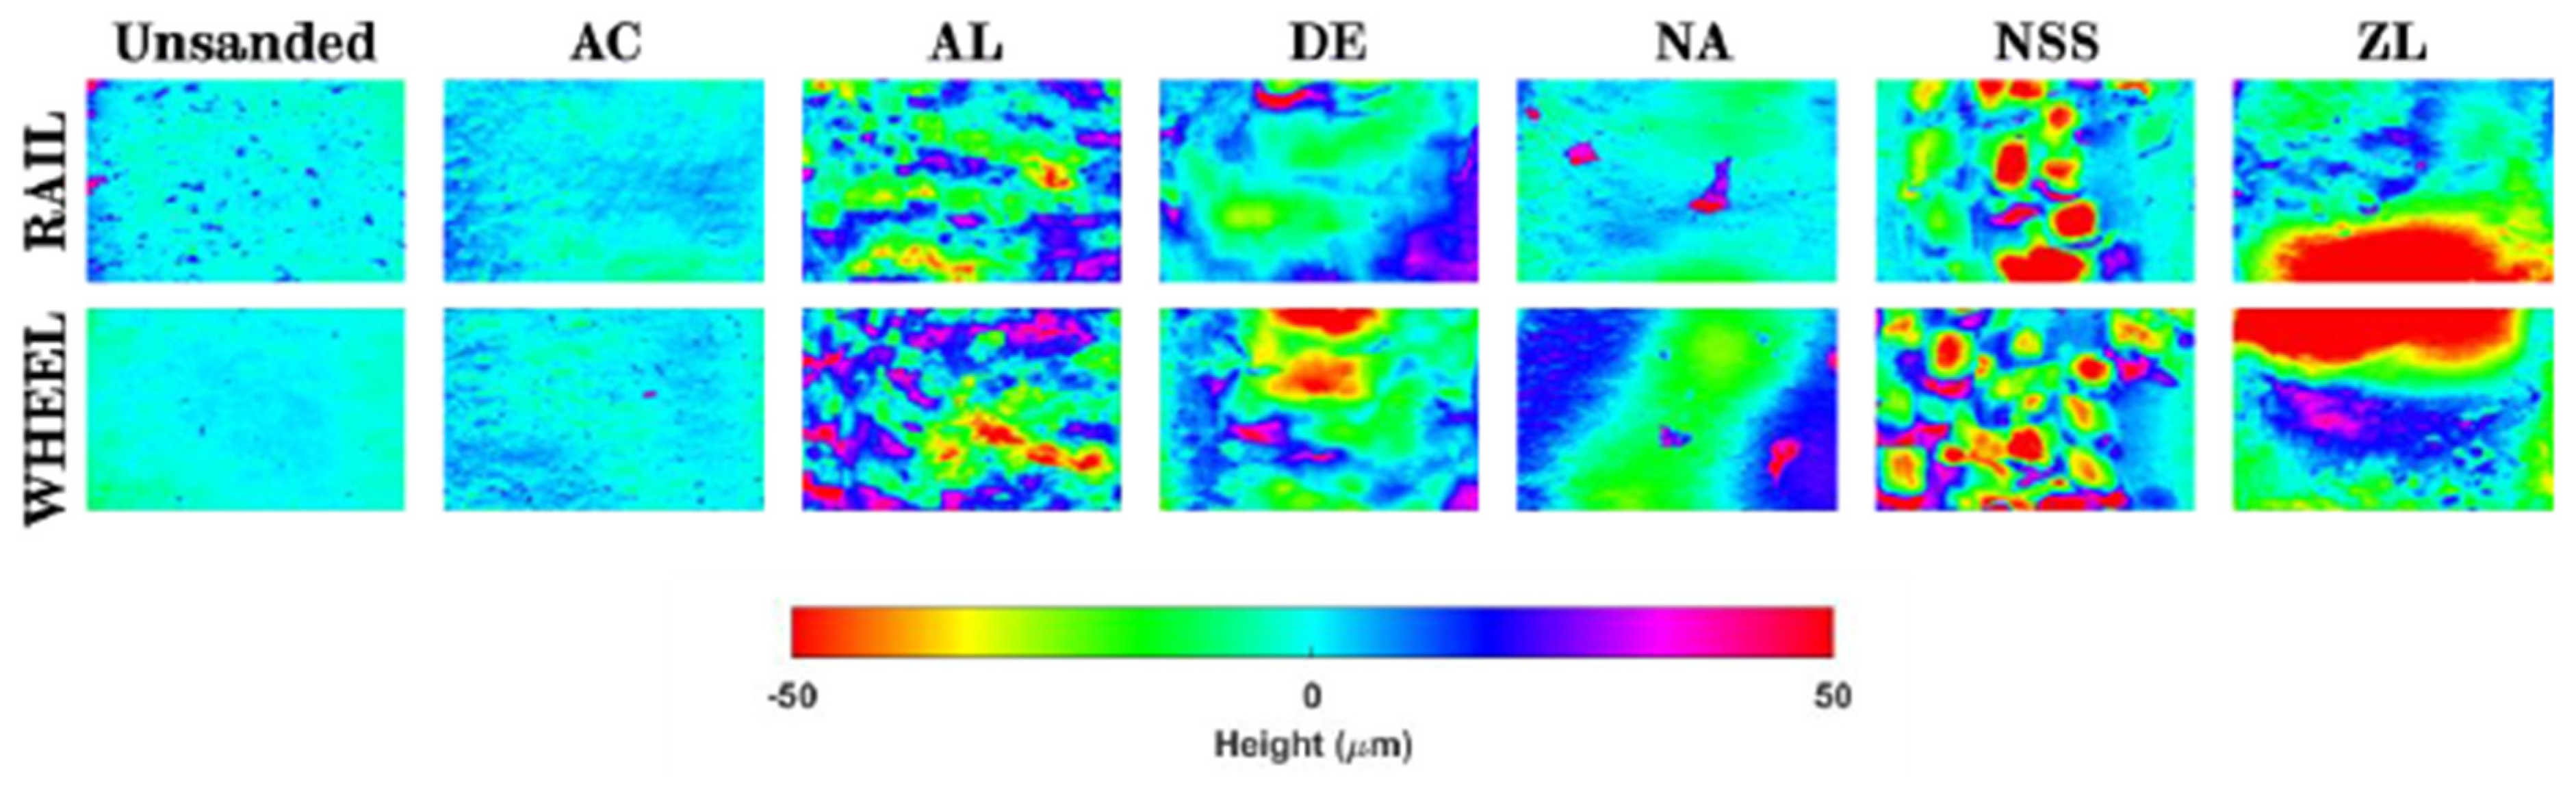
Figure 10, show how relatively similar the surfaces are to the unsanded case. NA showed some surface wear, including a shallow, broad scar. The remaining particles all exhibit areas of indentation, with NSS having the highest number of indentations and ZL showing the largest indents.
All particles remained within the contact to some extent under wet conditions, and all had a marked effect on the surface characteristics post-test. AC and NA appeared to have a lesser effect than the other particles, whereas AL, NSS, and ZL all produced a rougher, more indented surface. DE produced indents and roughness, but not to the same extent as these other particles.
The key outcome from these tests was identifying possible particles as candidates for use where intermediate friction is required (on top-of-rail). ZL is probably the most ideal for this, as it could also achieve this under dry conditions.
3.3. Leaf-Contaminated Conditions
The traction data from the HPT tests for the particles in a leaf-contaminated contact is presented in
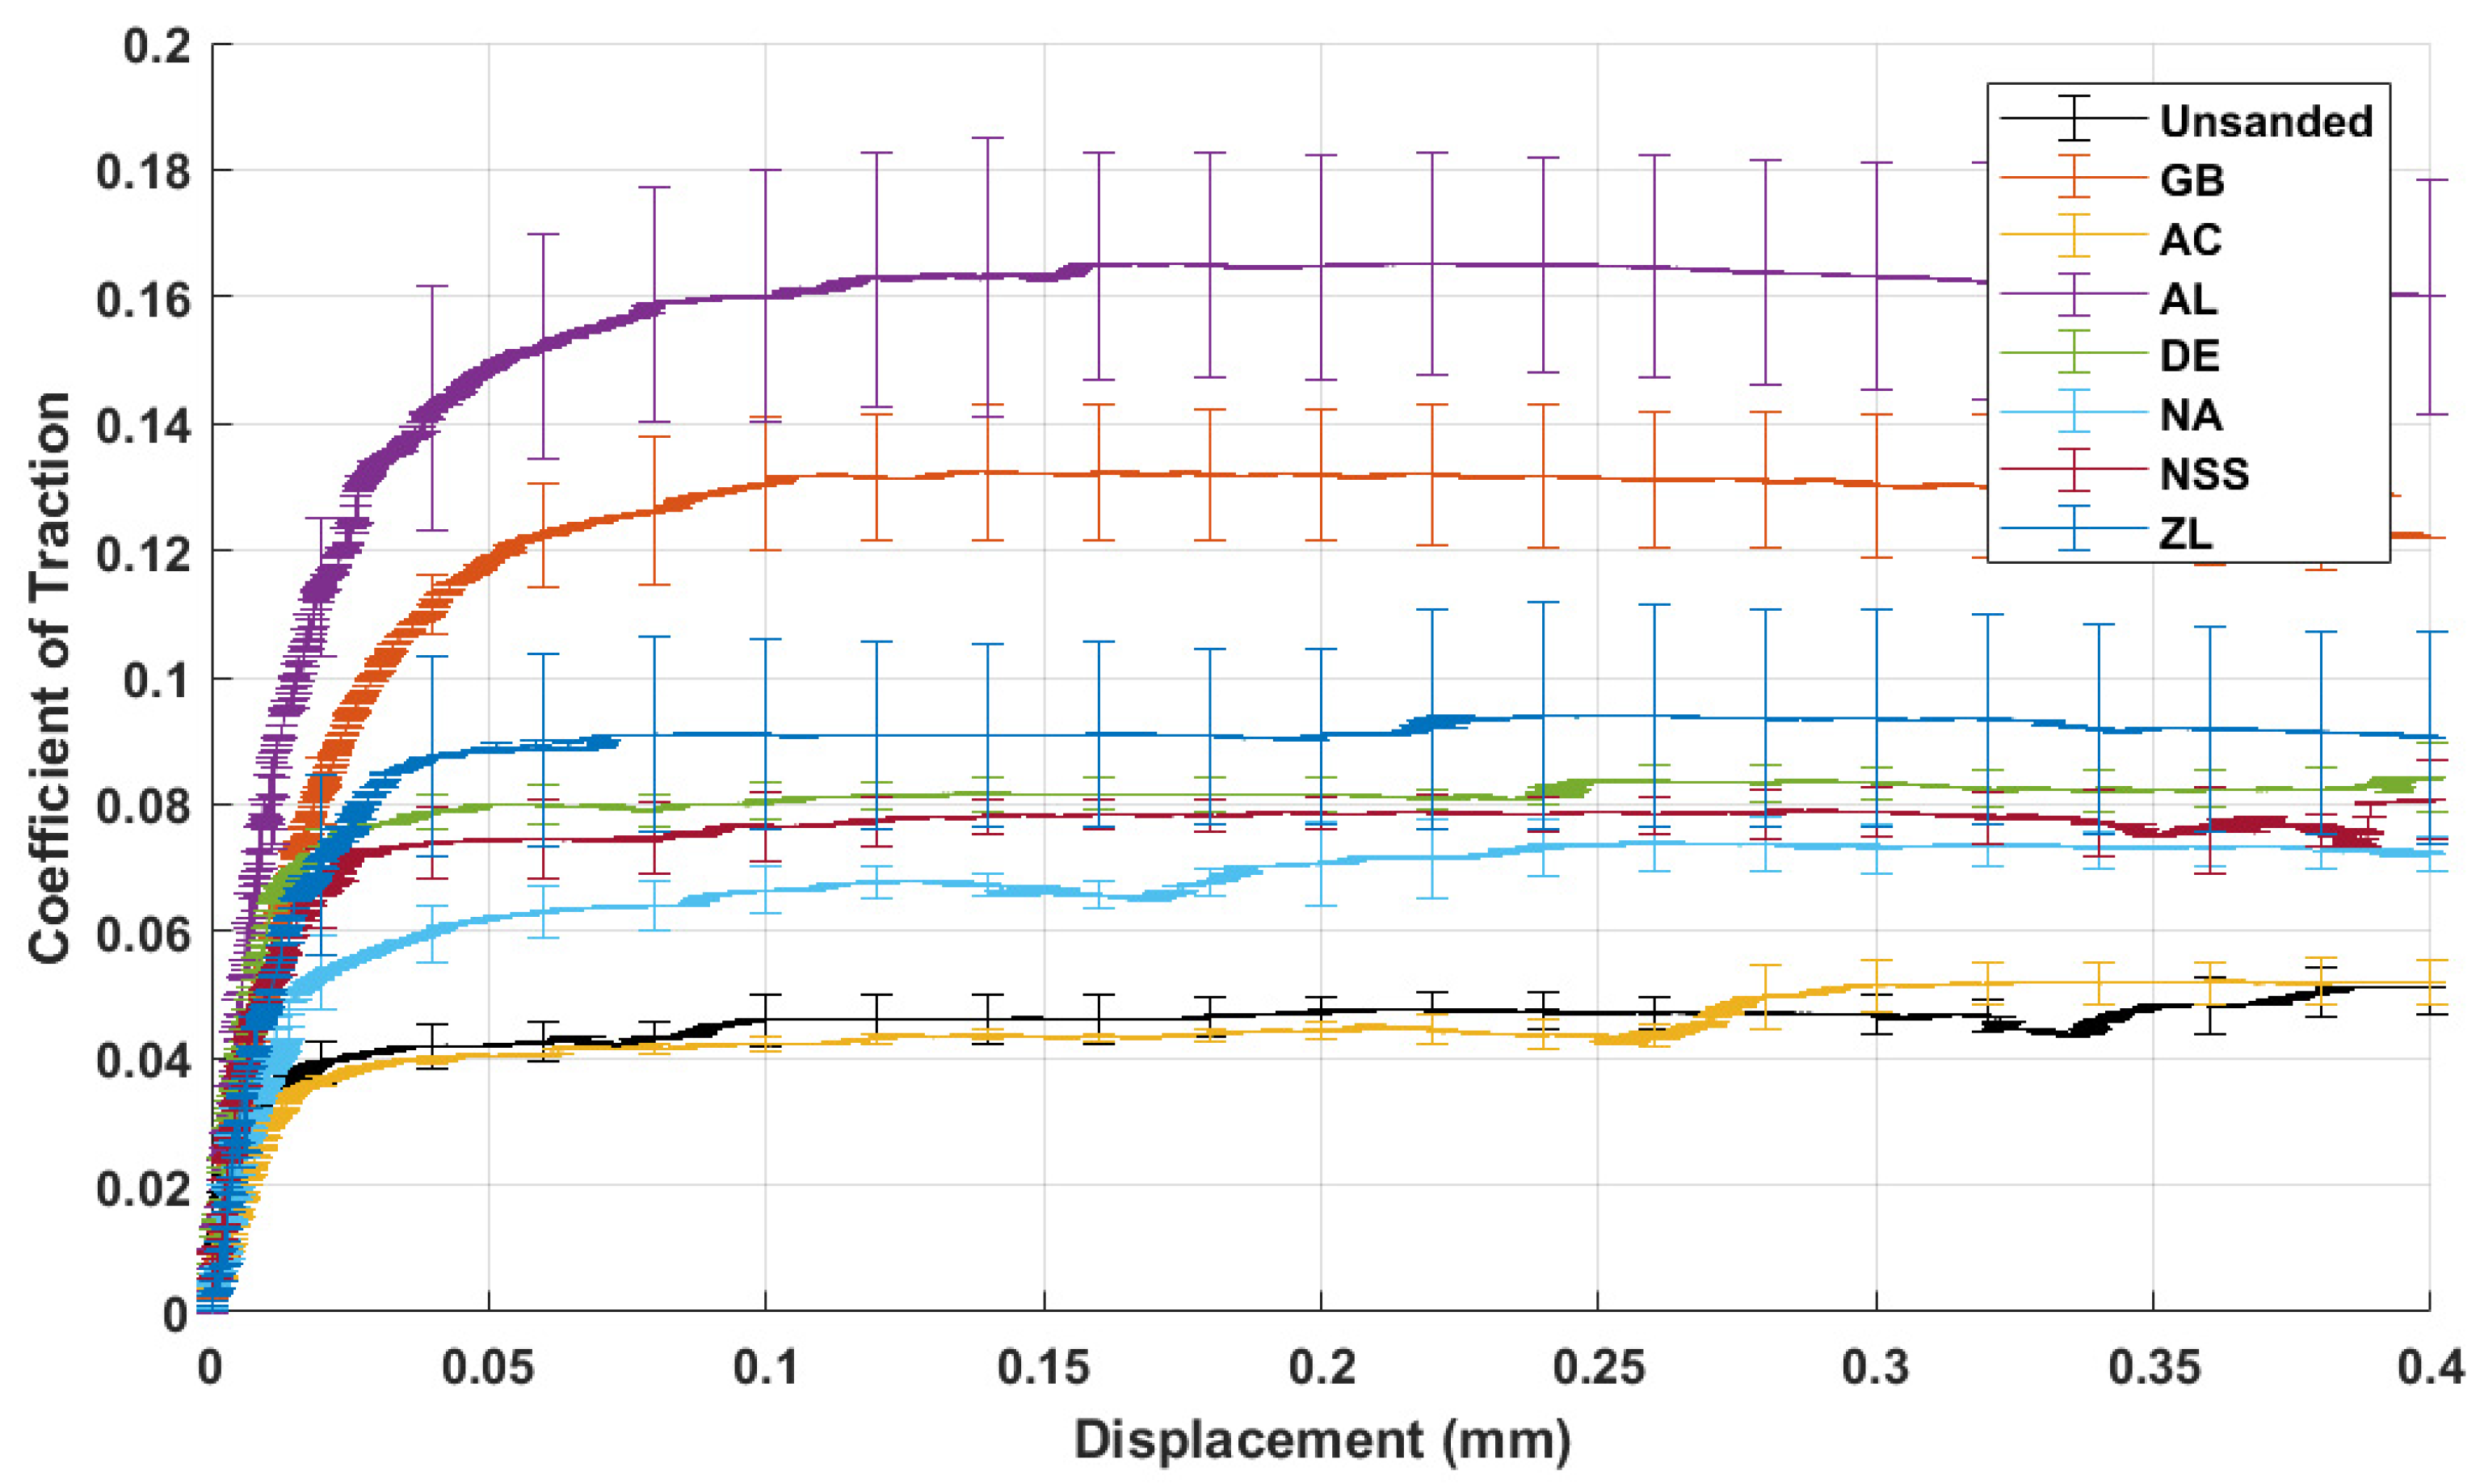
Figure 11. AC made very little difference upon its application when compared to the unsanded case, with a peak CoT of 0.05. DE, NA, NSS, and ZL all increased the level of traction, with peaks of 0.08, 0.07, 0.08, and 0.09, respectively (see
Figure 1 for leaf-only data). In the case of ZL, there also appears to have been greater variance in traction data. AL was the only particle to increase traction above the minimum required level, peaking at 0.17. AL also showed some variance in traction results.
Pictures of wheel and rail specimens post-test are included in
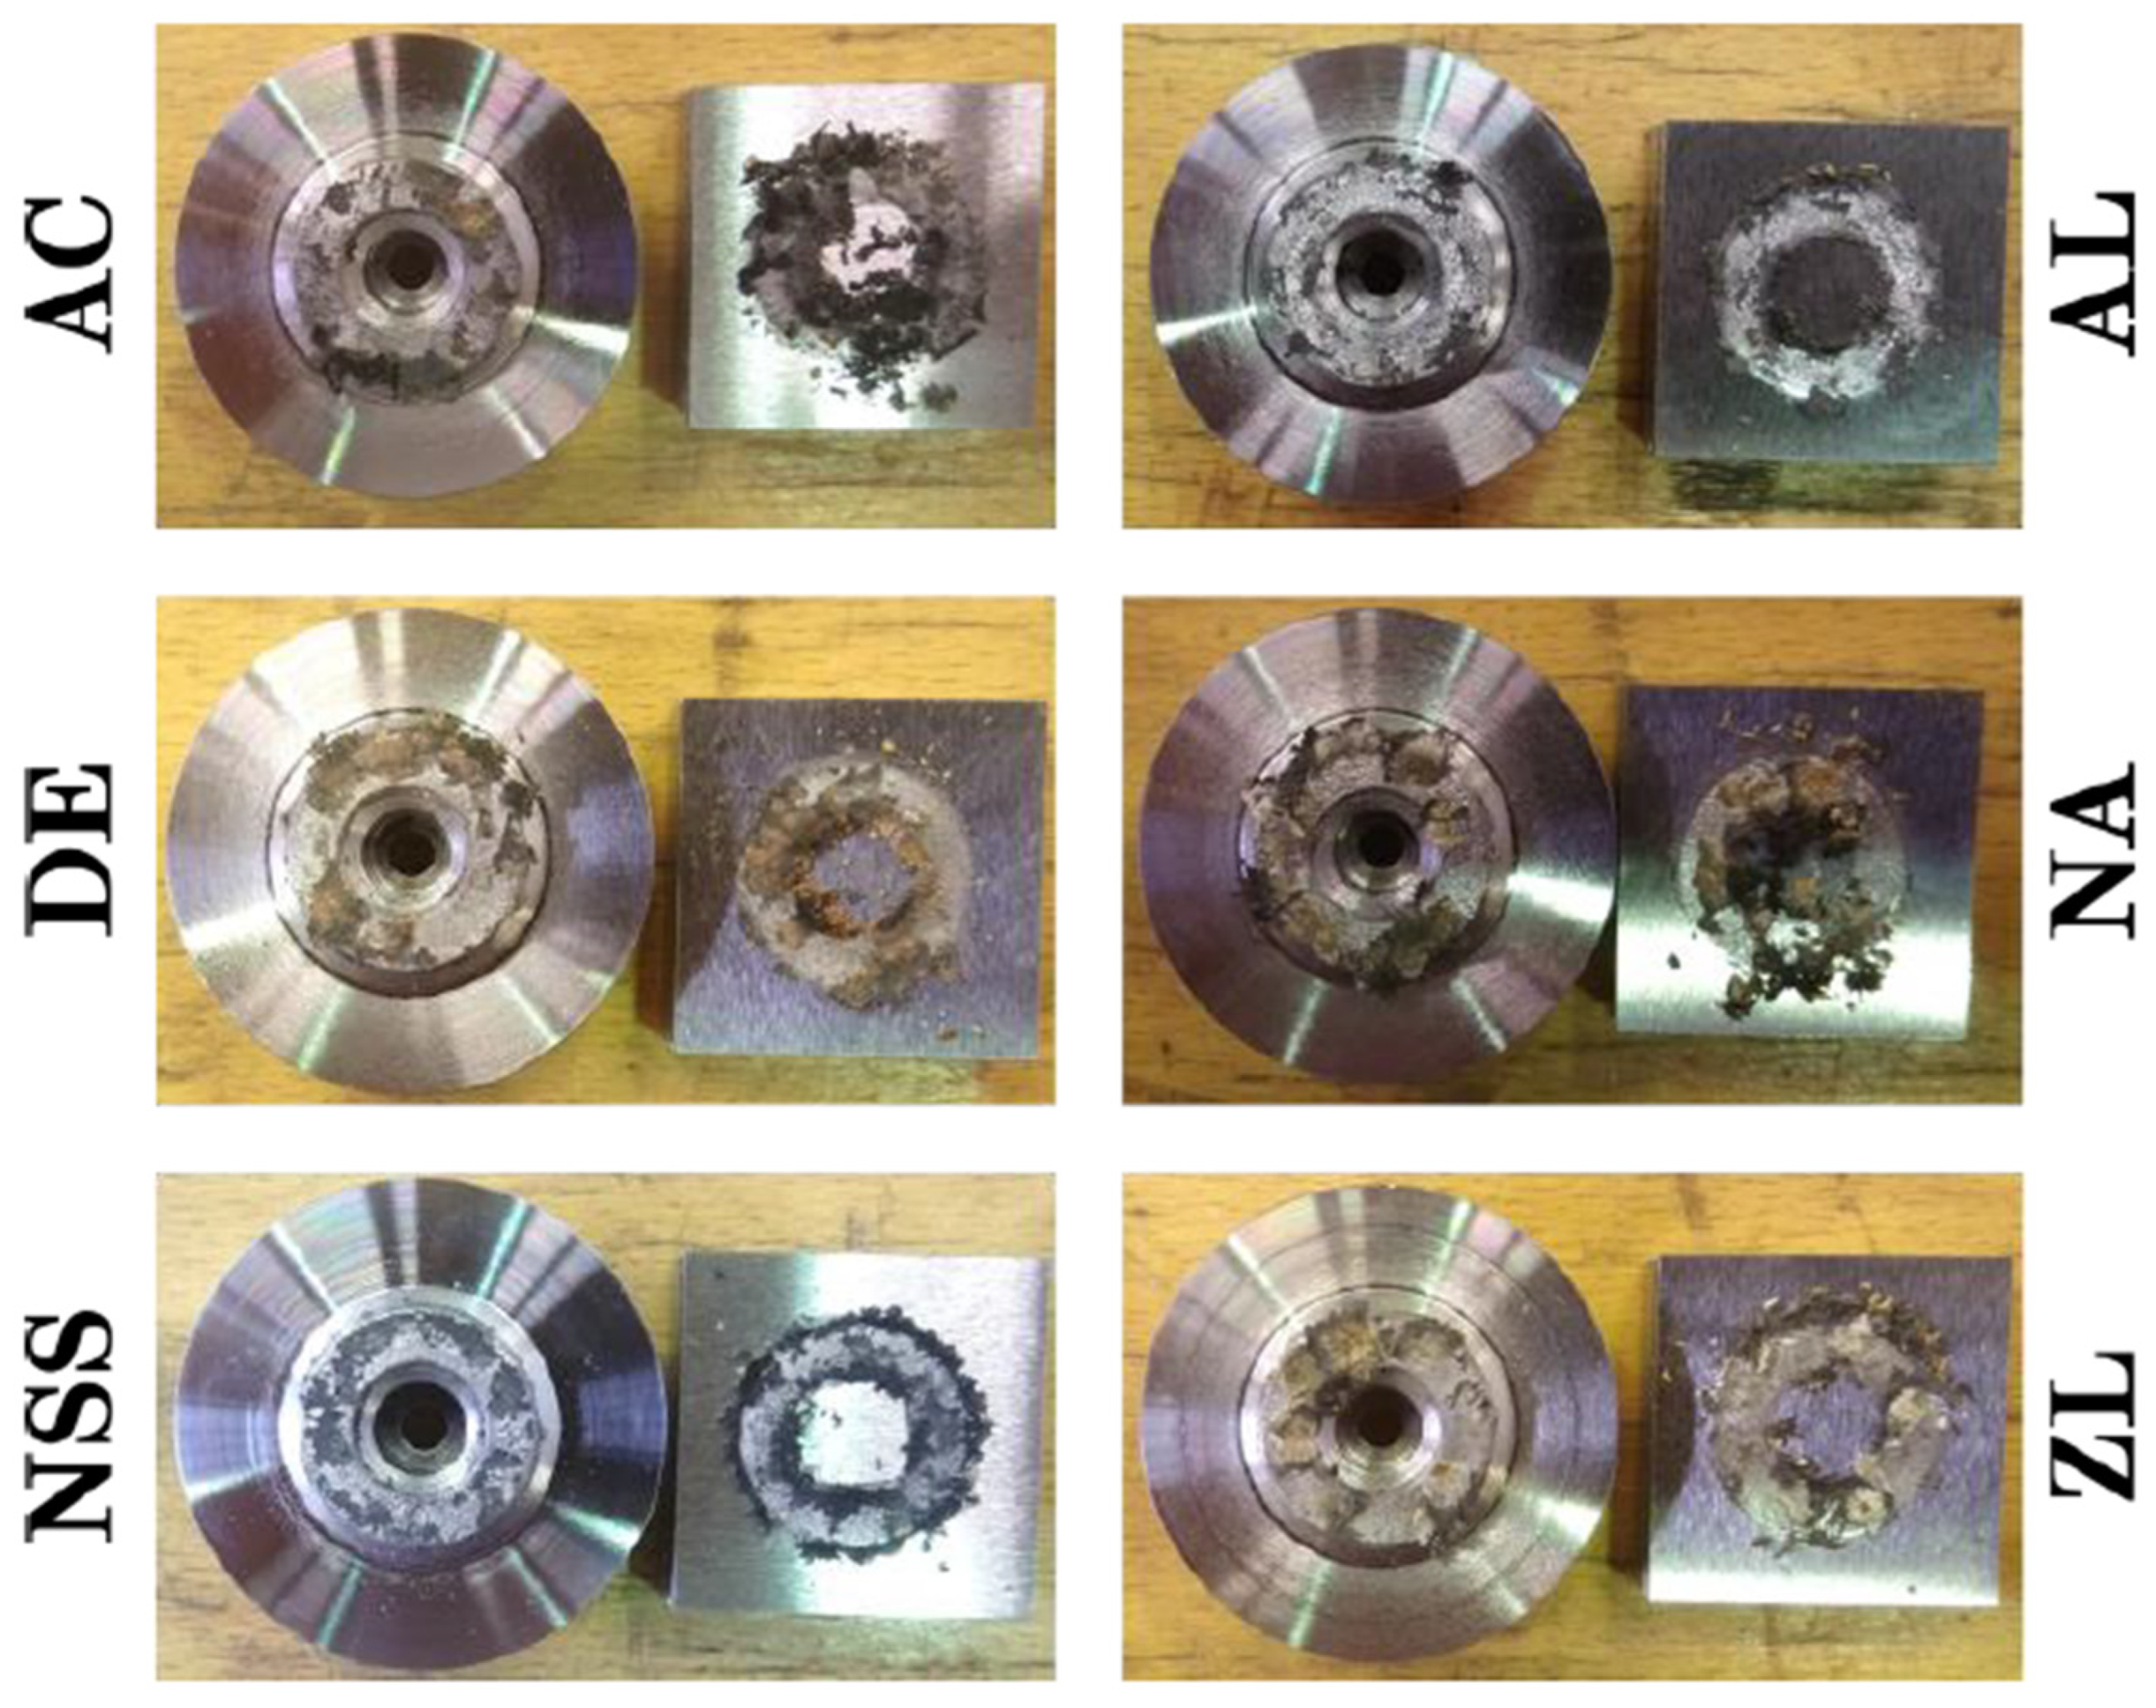
Figure 12. As was seen for the particles under dry and wet conditions, all particles remained in contact at the end of the test. AC acted similarly under dry and wet conditions, not adhering to the surface and agglomerating. All the particles became embedded into the leaf-layer surface, with DE, NA, and ZL doing so in clumps.
The measurements of post-test surface roughness have been included in
Figure 13. ZL had the largest impact on surface roughness post-test, though with a large variance in roughness values. AC and AL both seemed to have little effect on roughness, whilst DE, NA, and NSS seemed to have slightly more effect.
The post-test surface scans of other particles in a leaf-contaminated contact are included in
Figure 14. The red regions at around 50 mms are likely to be the leaf layer. Only in ZL were large indentations noticeable, with NSS appearing to have smaller indentations. All other particles showed only shallow disturbances on the surface. ZL was the only particle to demonstrate a marked difference in surface condition post-test when compared with the unsanded case. All other particles only showed a slight roughening of the surface, with little indentation present. This relatively small change may be due to particles embedding into the leaf layer, thereby not affecting the steel surfaces of the wheel and rail specimens as greatly as was seen under dry and wet conditions.
The key outcome here was identifying that AL achieves traction enhancement under all contamination conditions.
4. Discussion
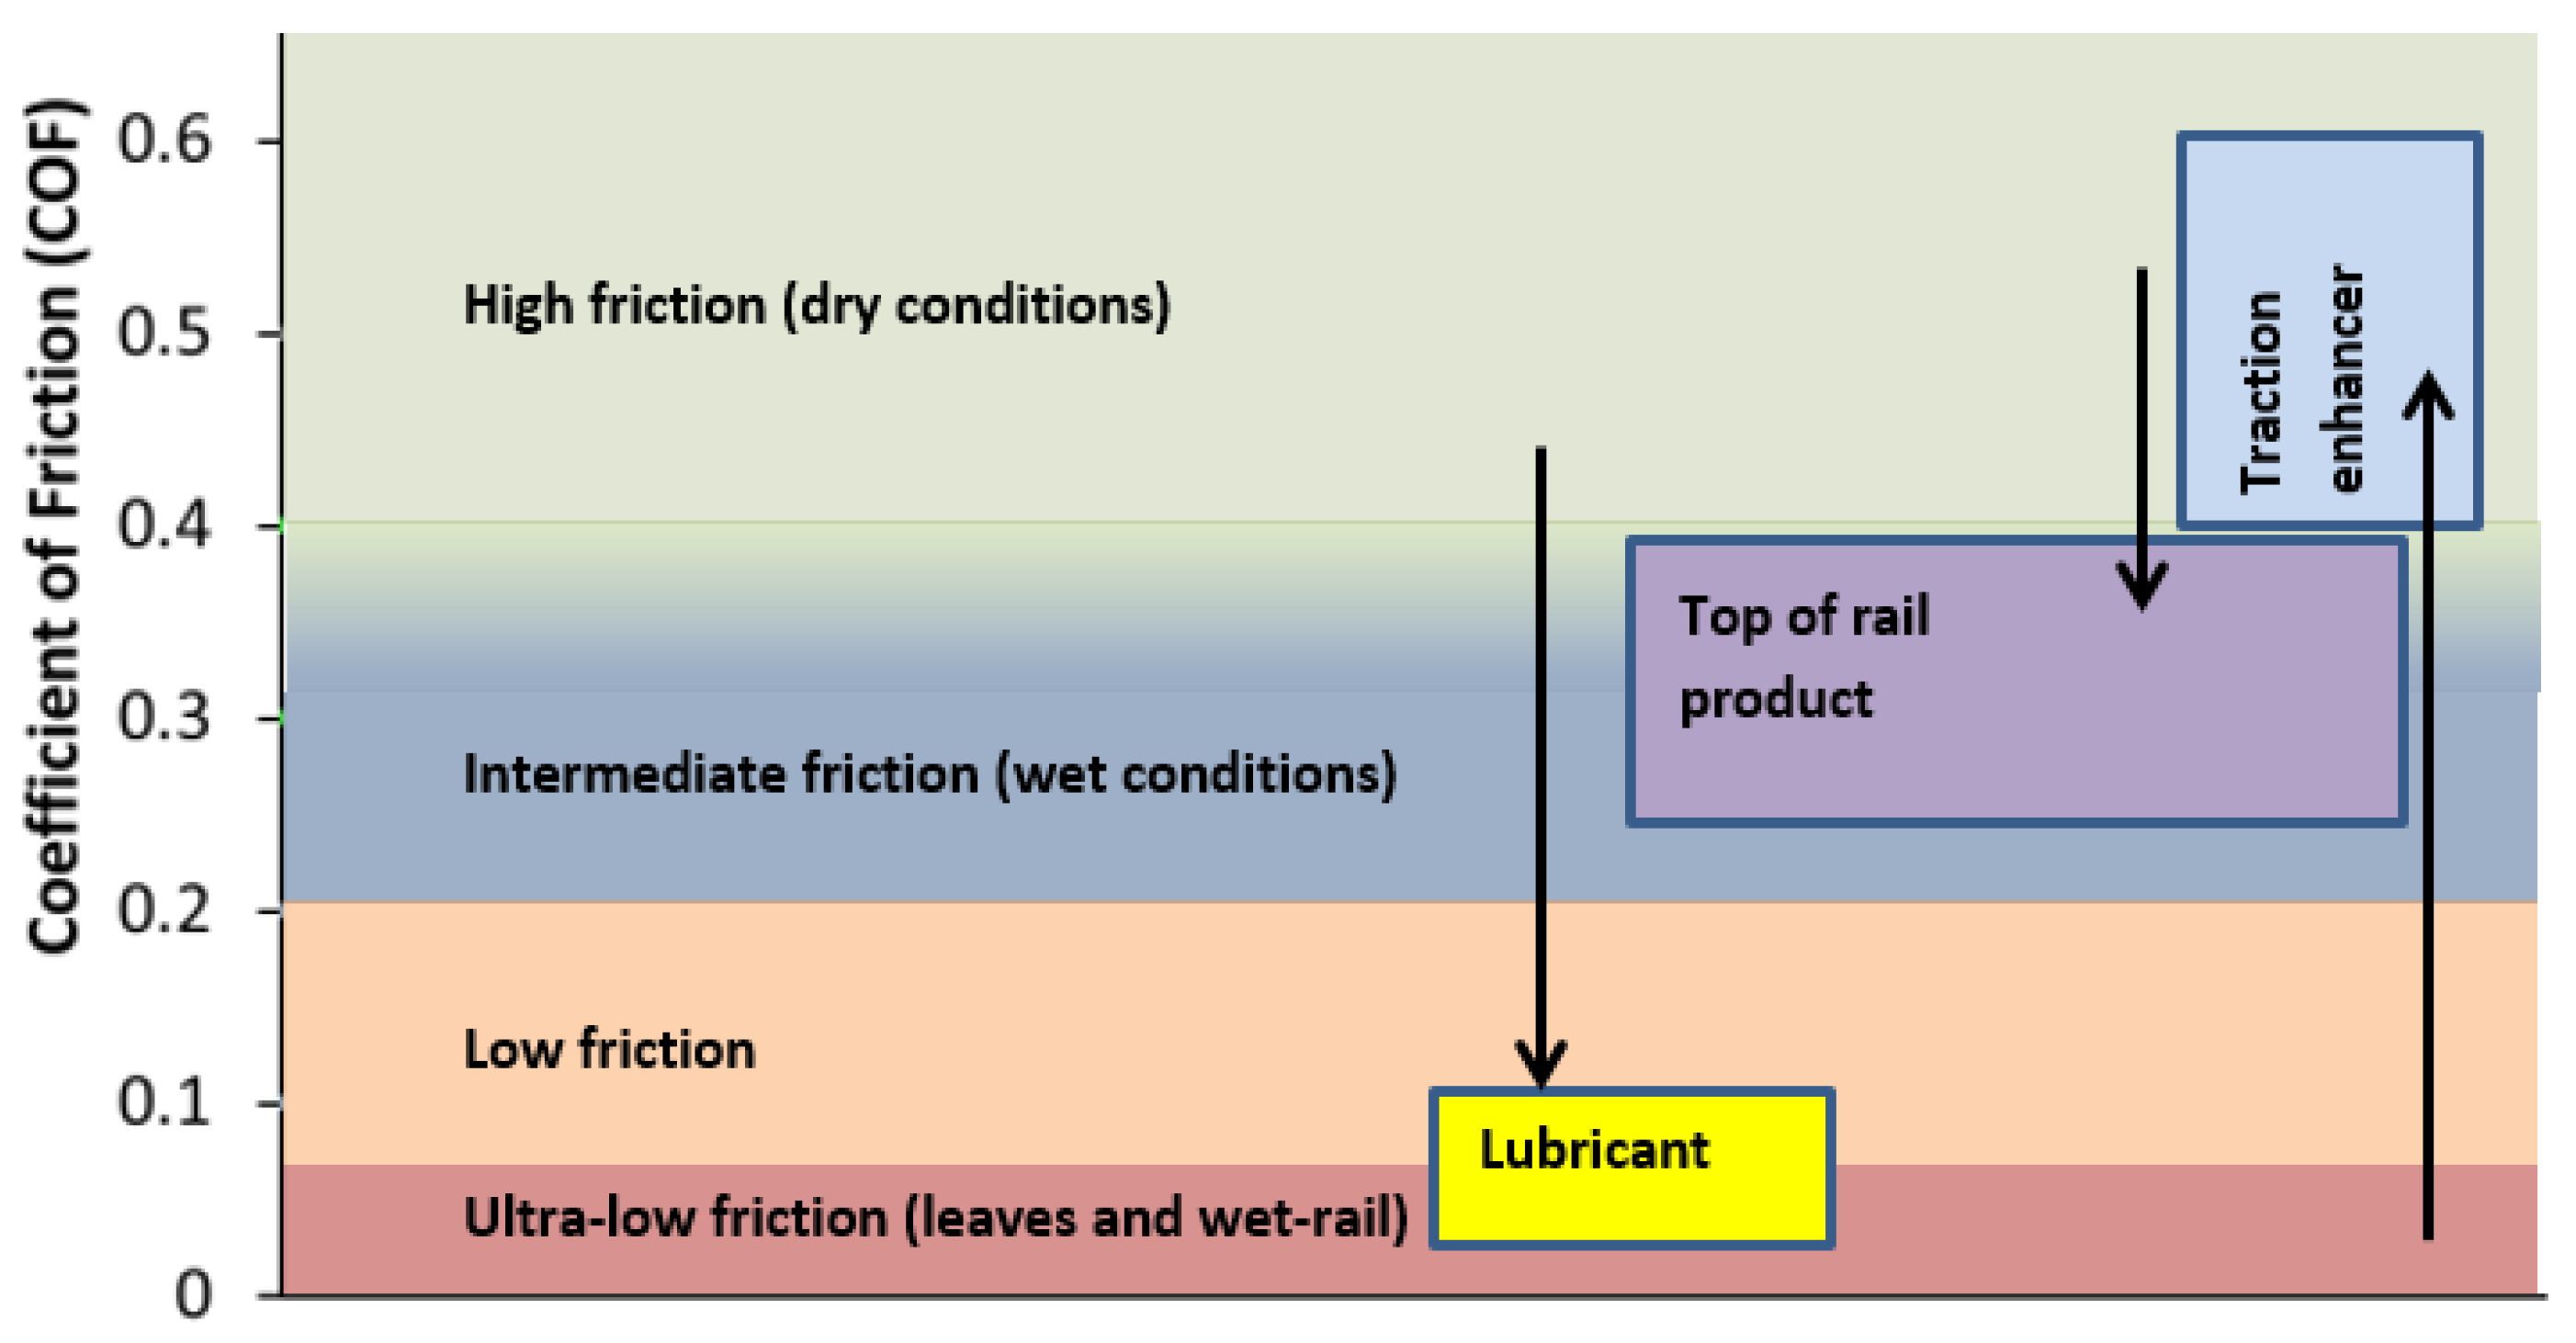
The particles assessed gave a range of friction values falling across the regimes outlined in
Figure 15. AL was the only particle that raised friction significantly from the low value experienced with leaf layers and gave a similar performance to silica sand [
20]. It also gave high values when water was present in the interface. This particle has already been considered as a viable alternative to silica sand, so this result backs this thinking up. Shi tested alumina in a twin-disc test with water applied and saw a similar friction increase to that of this study, reaching 0.3 for a feed rate of 30 g/min [
10]. Zobel [
28] assessed alumina, which had the same hardness as that used in this study, in dry field tests and recorded a friction of around 0.6, again very similar to the results from this study.
Particles of DE, ZL and NSS gave values approaching “intermediate” levels under both dry and wet conditions. They show potential for use as top-of-rail products.
AC and NA gave low values under all conditions, so they were effective in lubricating the contact. They also led to the lowest roughening of surfaces.
The comparisons described above in small-scale twin-disc tests and field tests with the actual wheel/rail interface geometry show that the HPT test, despite not having the rolling element, can produce similar results. Next steps could include parameterising the creep force model used in [
23] to generate predictions for a full-scale interface to better understand how the particles perform in real operation.
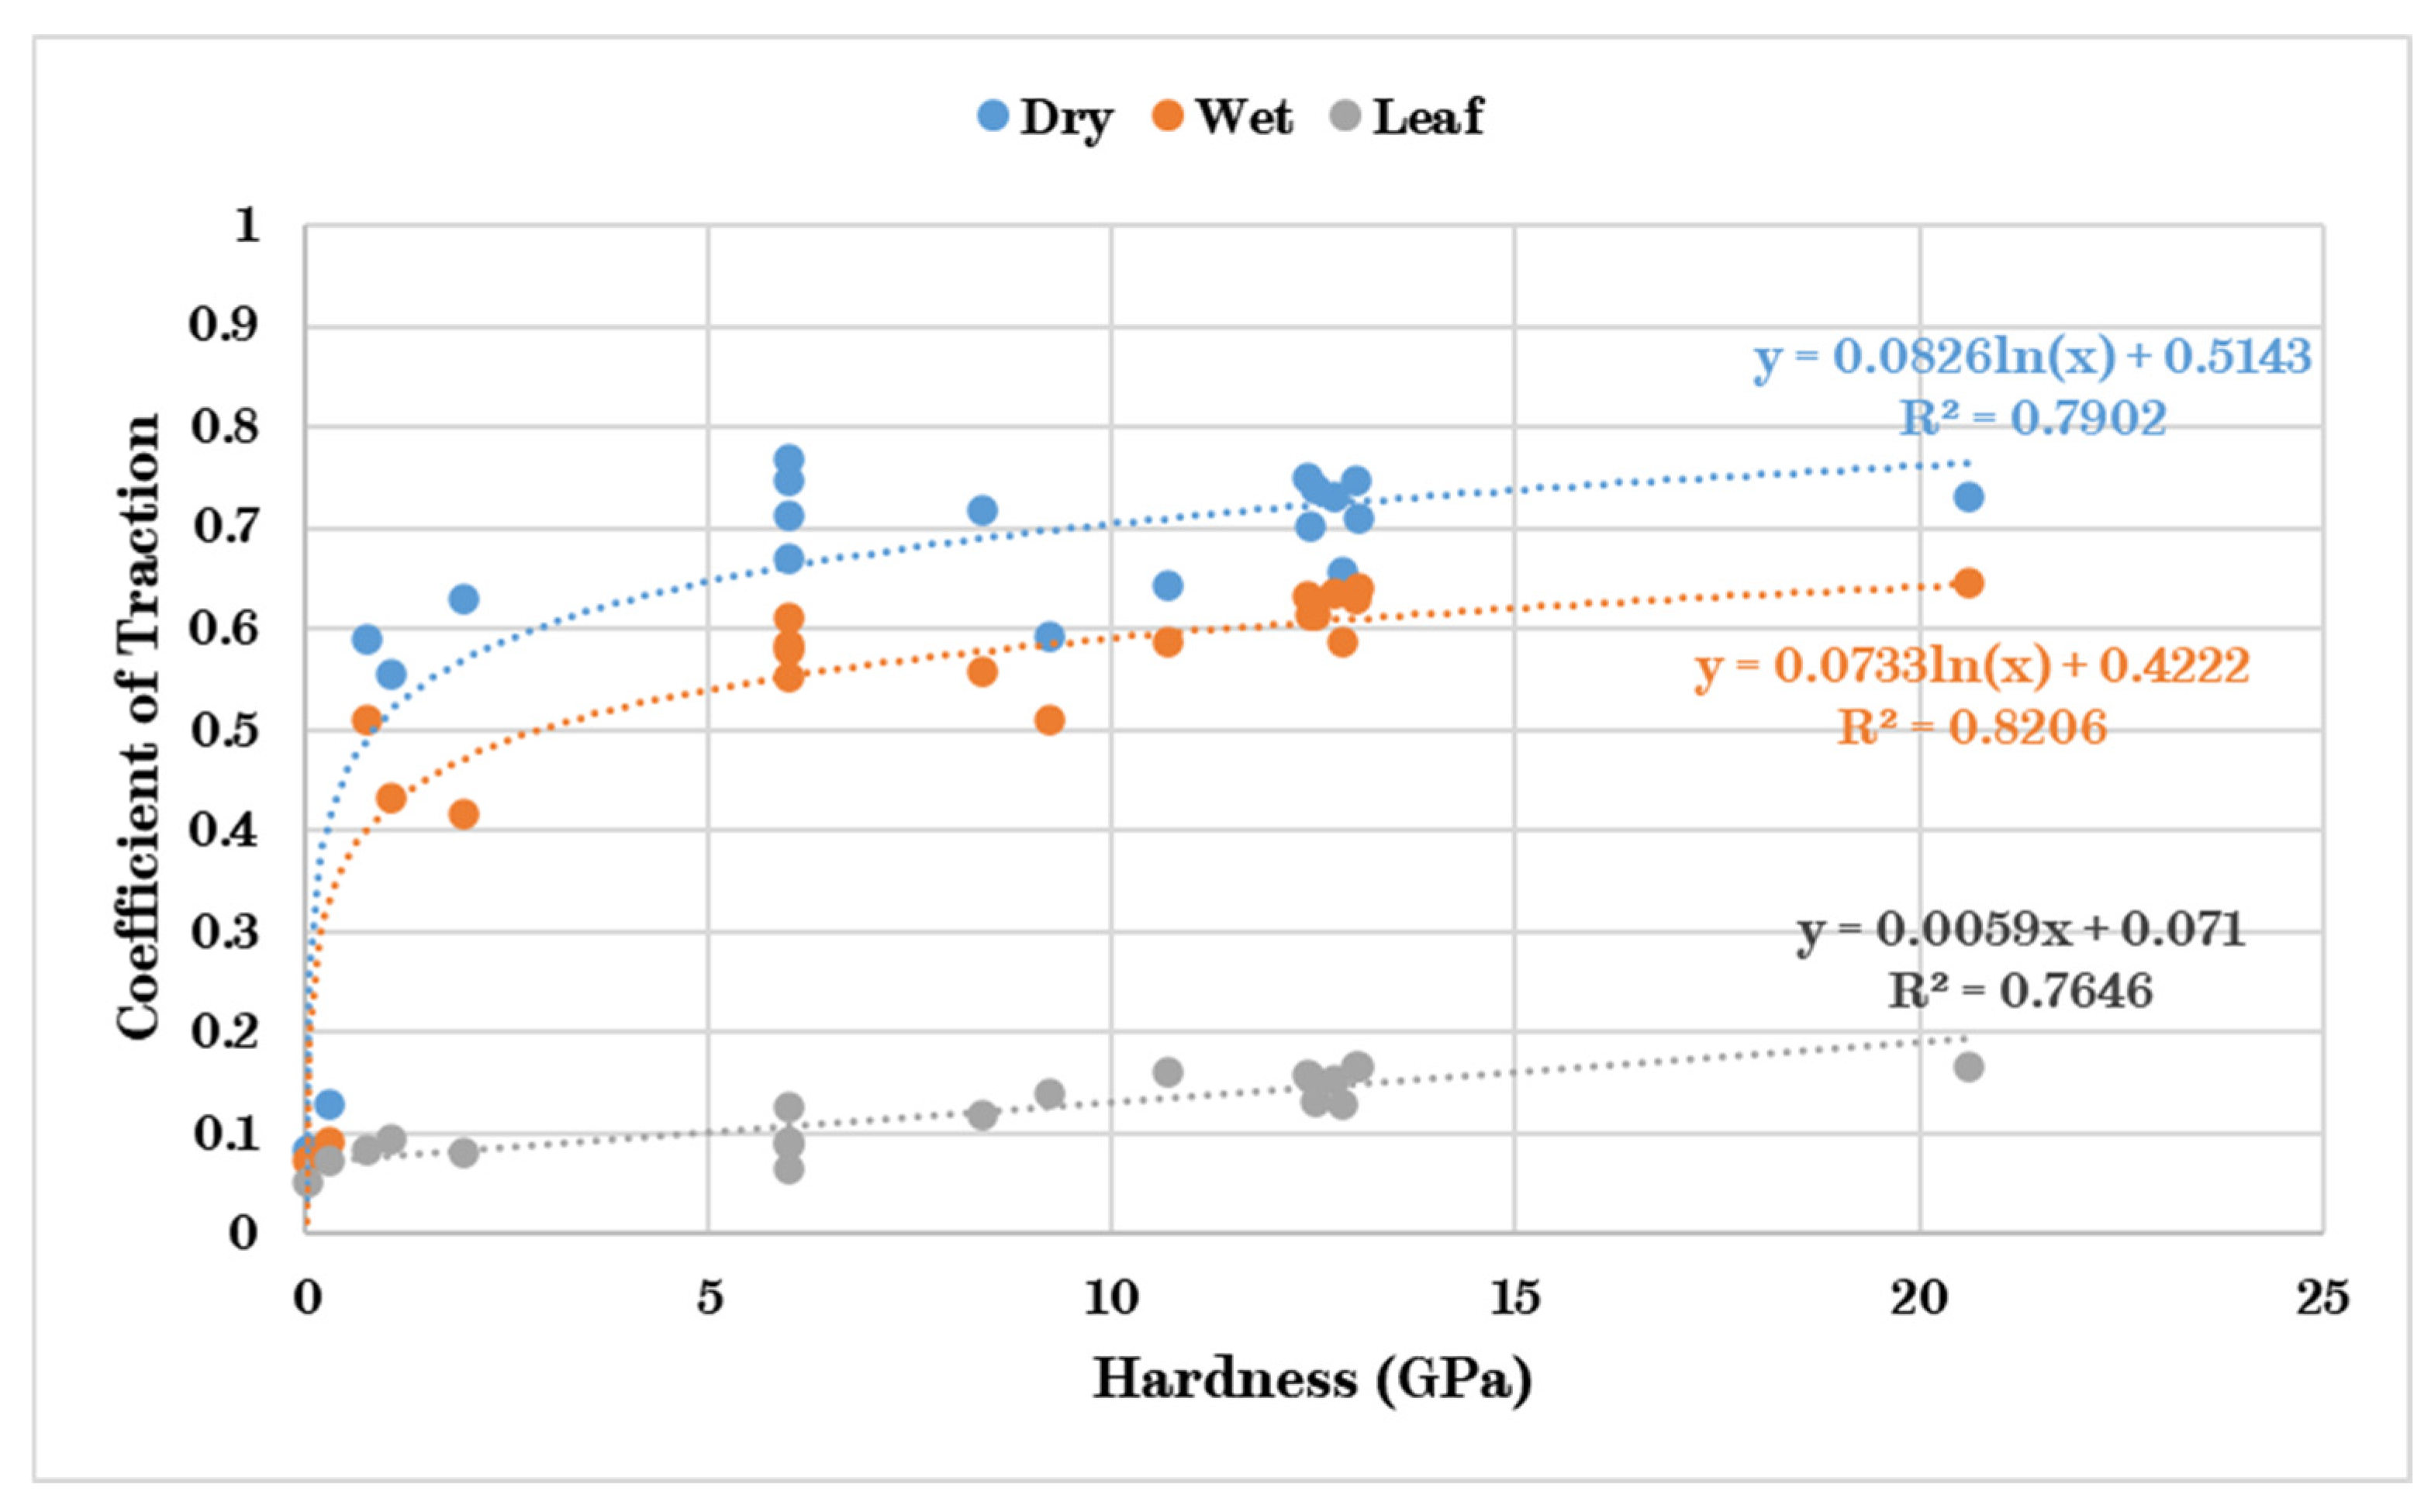
In terms of particle properties, the strongest relationship was between traction coefficients and hardness. In
Figure 16, particle hardness is plotted against traction for all the particles from this study and silica sand particles tested previously [
20]. Both dry and wet conditions show a similar trend: traction increases with particle hardness, with this change plateauing with increasing particle hardness. Under leaf-contaminated conditions, the relationship is the same, though linear. A similar relationship between particle hardness and traction coefficients under dry conditions was observed by Zobel in field tests using a “tribometer train” [
28]. The friction level that his data levelled off at was 0.5–0.6, which was reached at a particle hardness of around 1 GPa. He tested this using diamond particles with a hardness of nearly 80 GPa, where there was still a similar friction level. This work has extended the knowledge of how hardness impacts tests involving water and leaf layers.
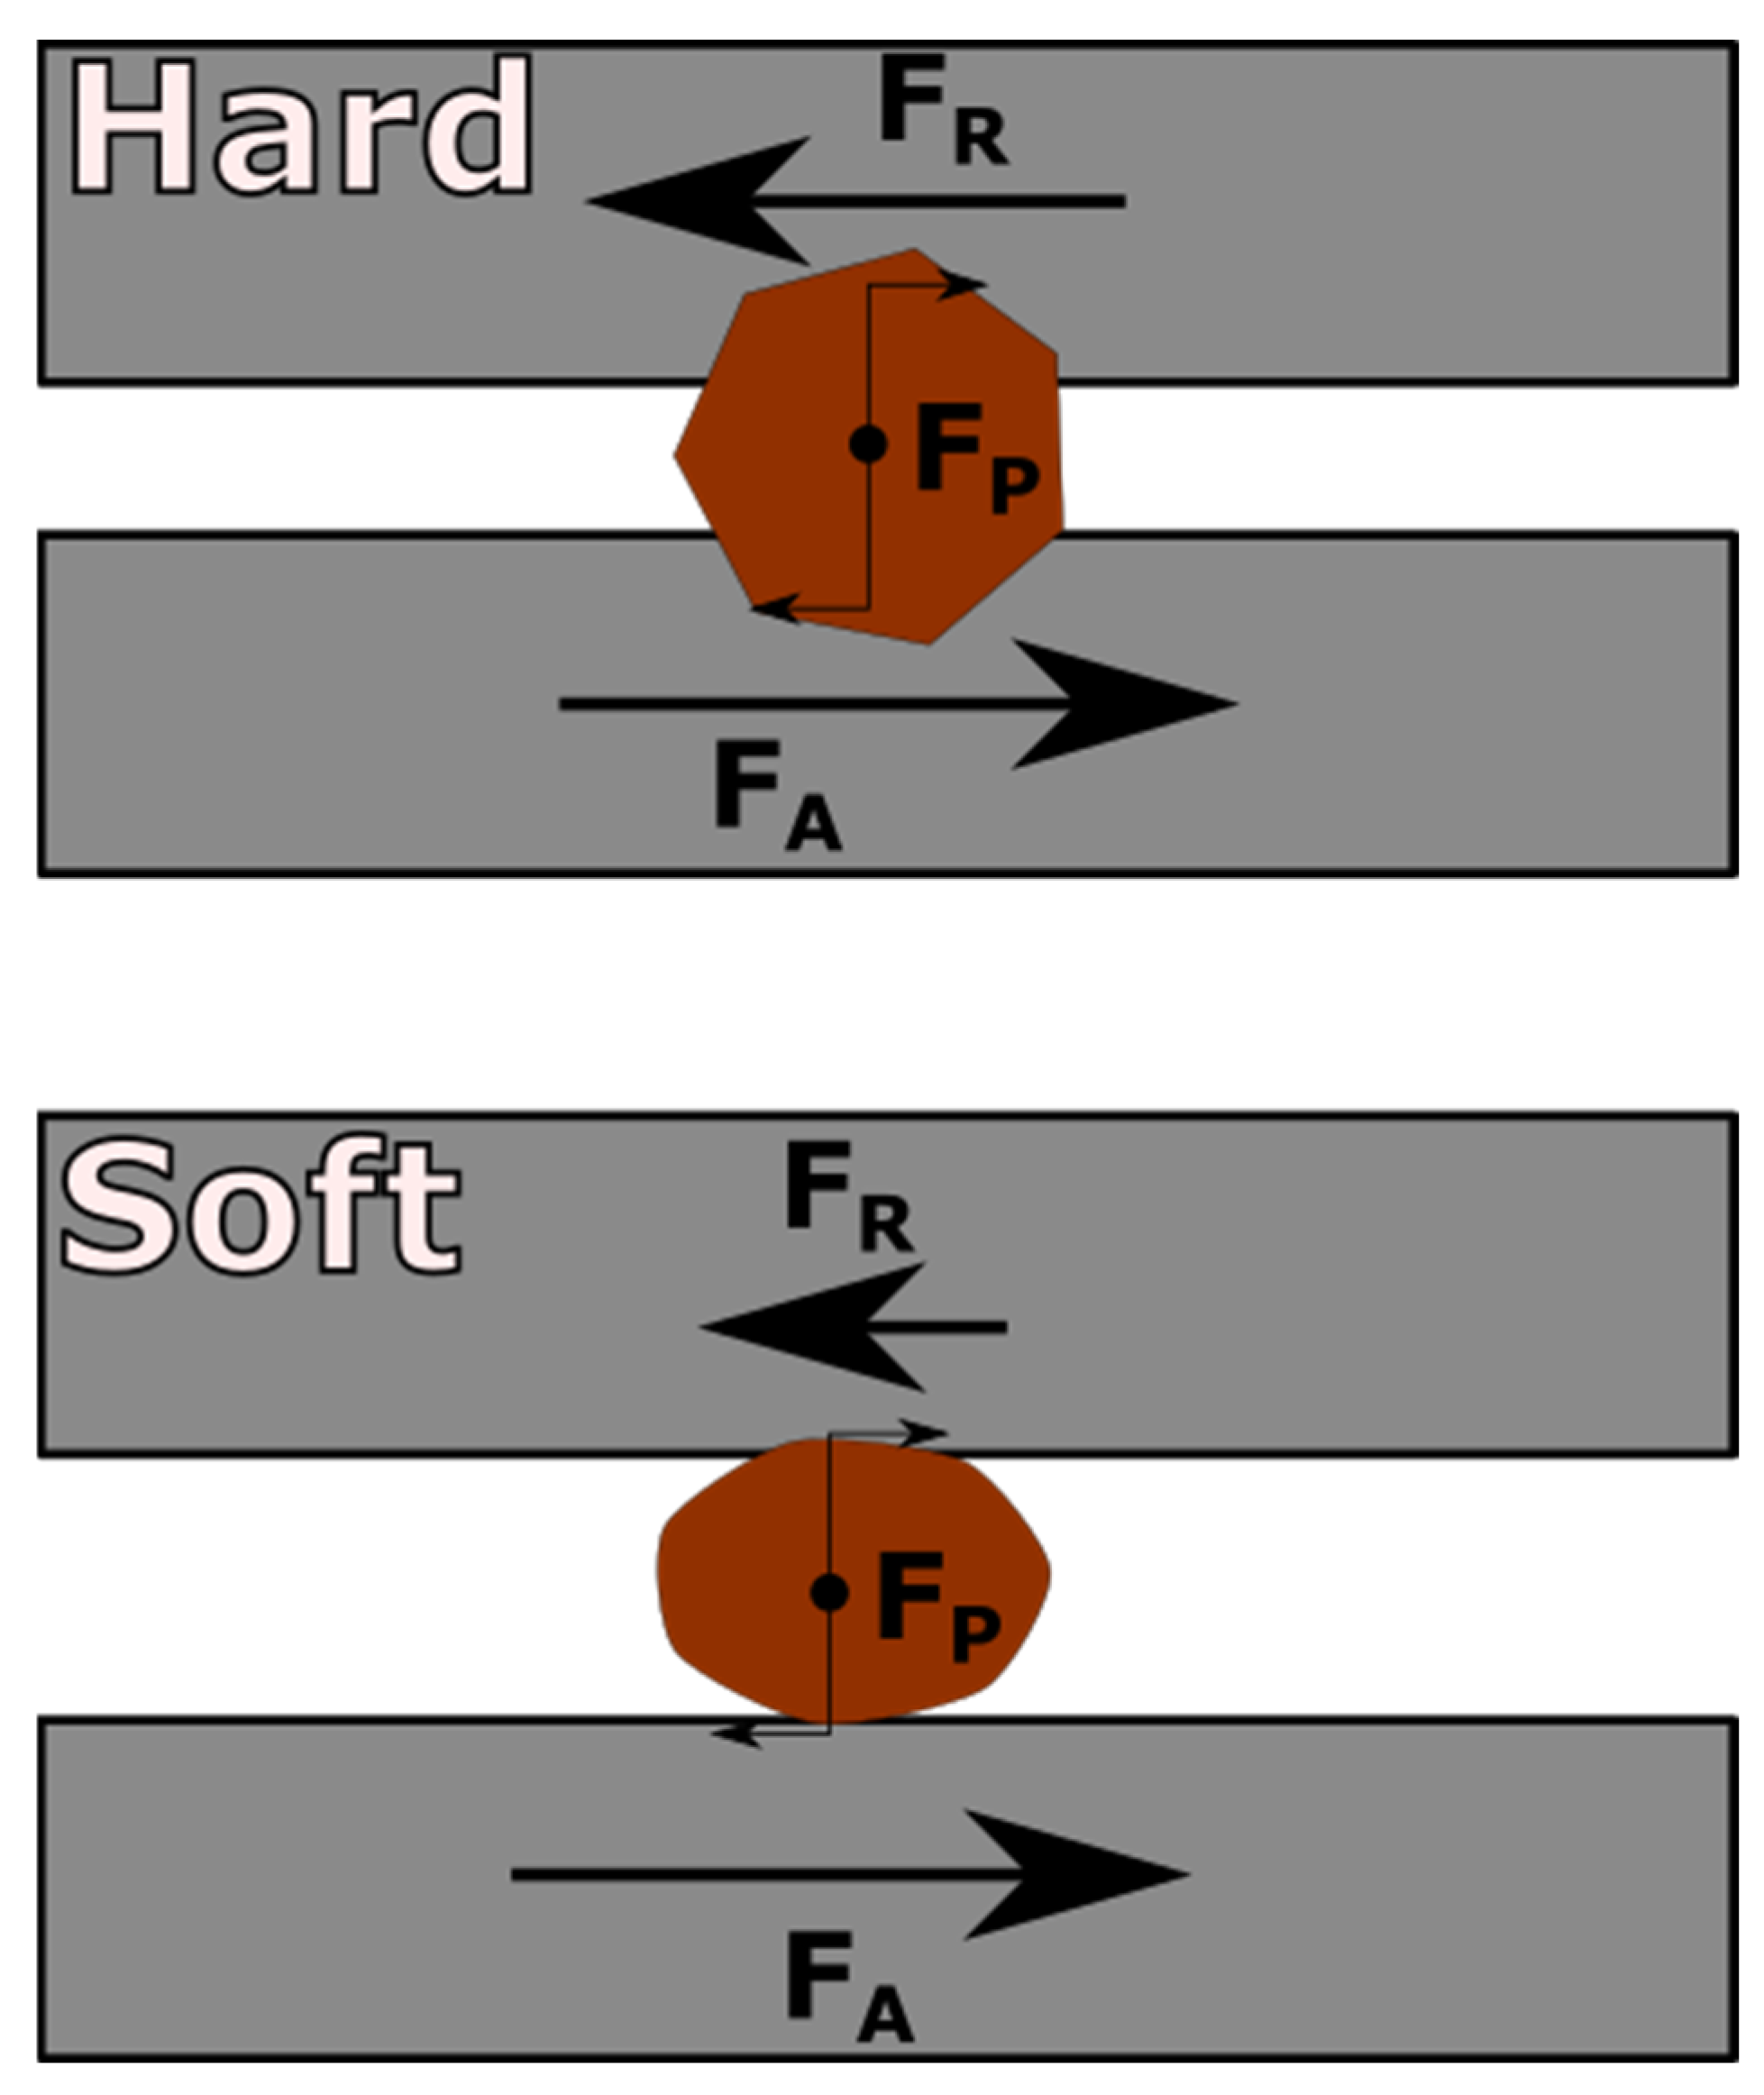
The mechanism behind this trend is outlined in
Figure 17, where harder particles were able to indent into the surface and transfer traction more effectively. Further analysing
Figure 16, the point at which the gradient begins to lessen is around the same hardness as rail and wheel steel, i.e., 1.9 GPa and 2.9 GPa [
30], respectively. From this, it can be concluded that a prospective adhesion material should have a hardness greater than the wheel/rail surfaces, and after this point, the increase in traction is relatively minor. Soft particles tend not to indent or fracture explosively. They may still have some scope to break up a leaf layer, as seen when the particle NA is applied to a leaf layer, which almost gives the same response as the harder particles of DE and NSS.
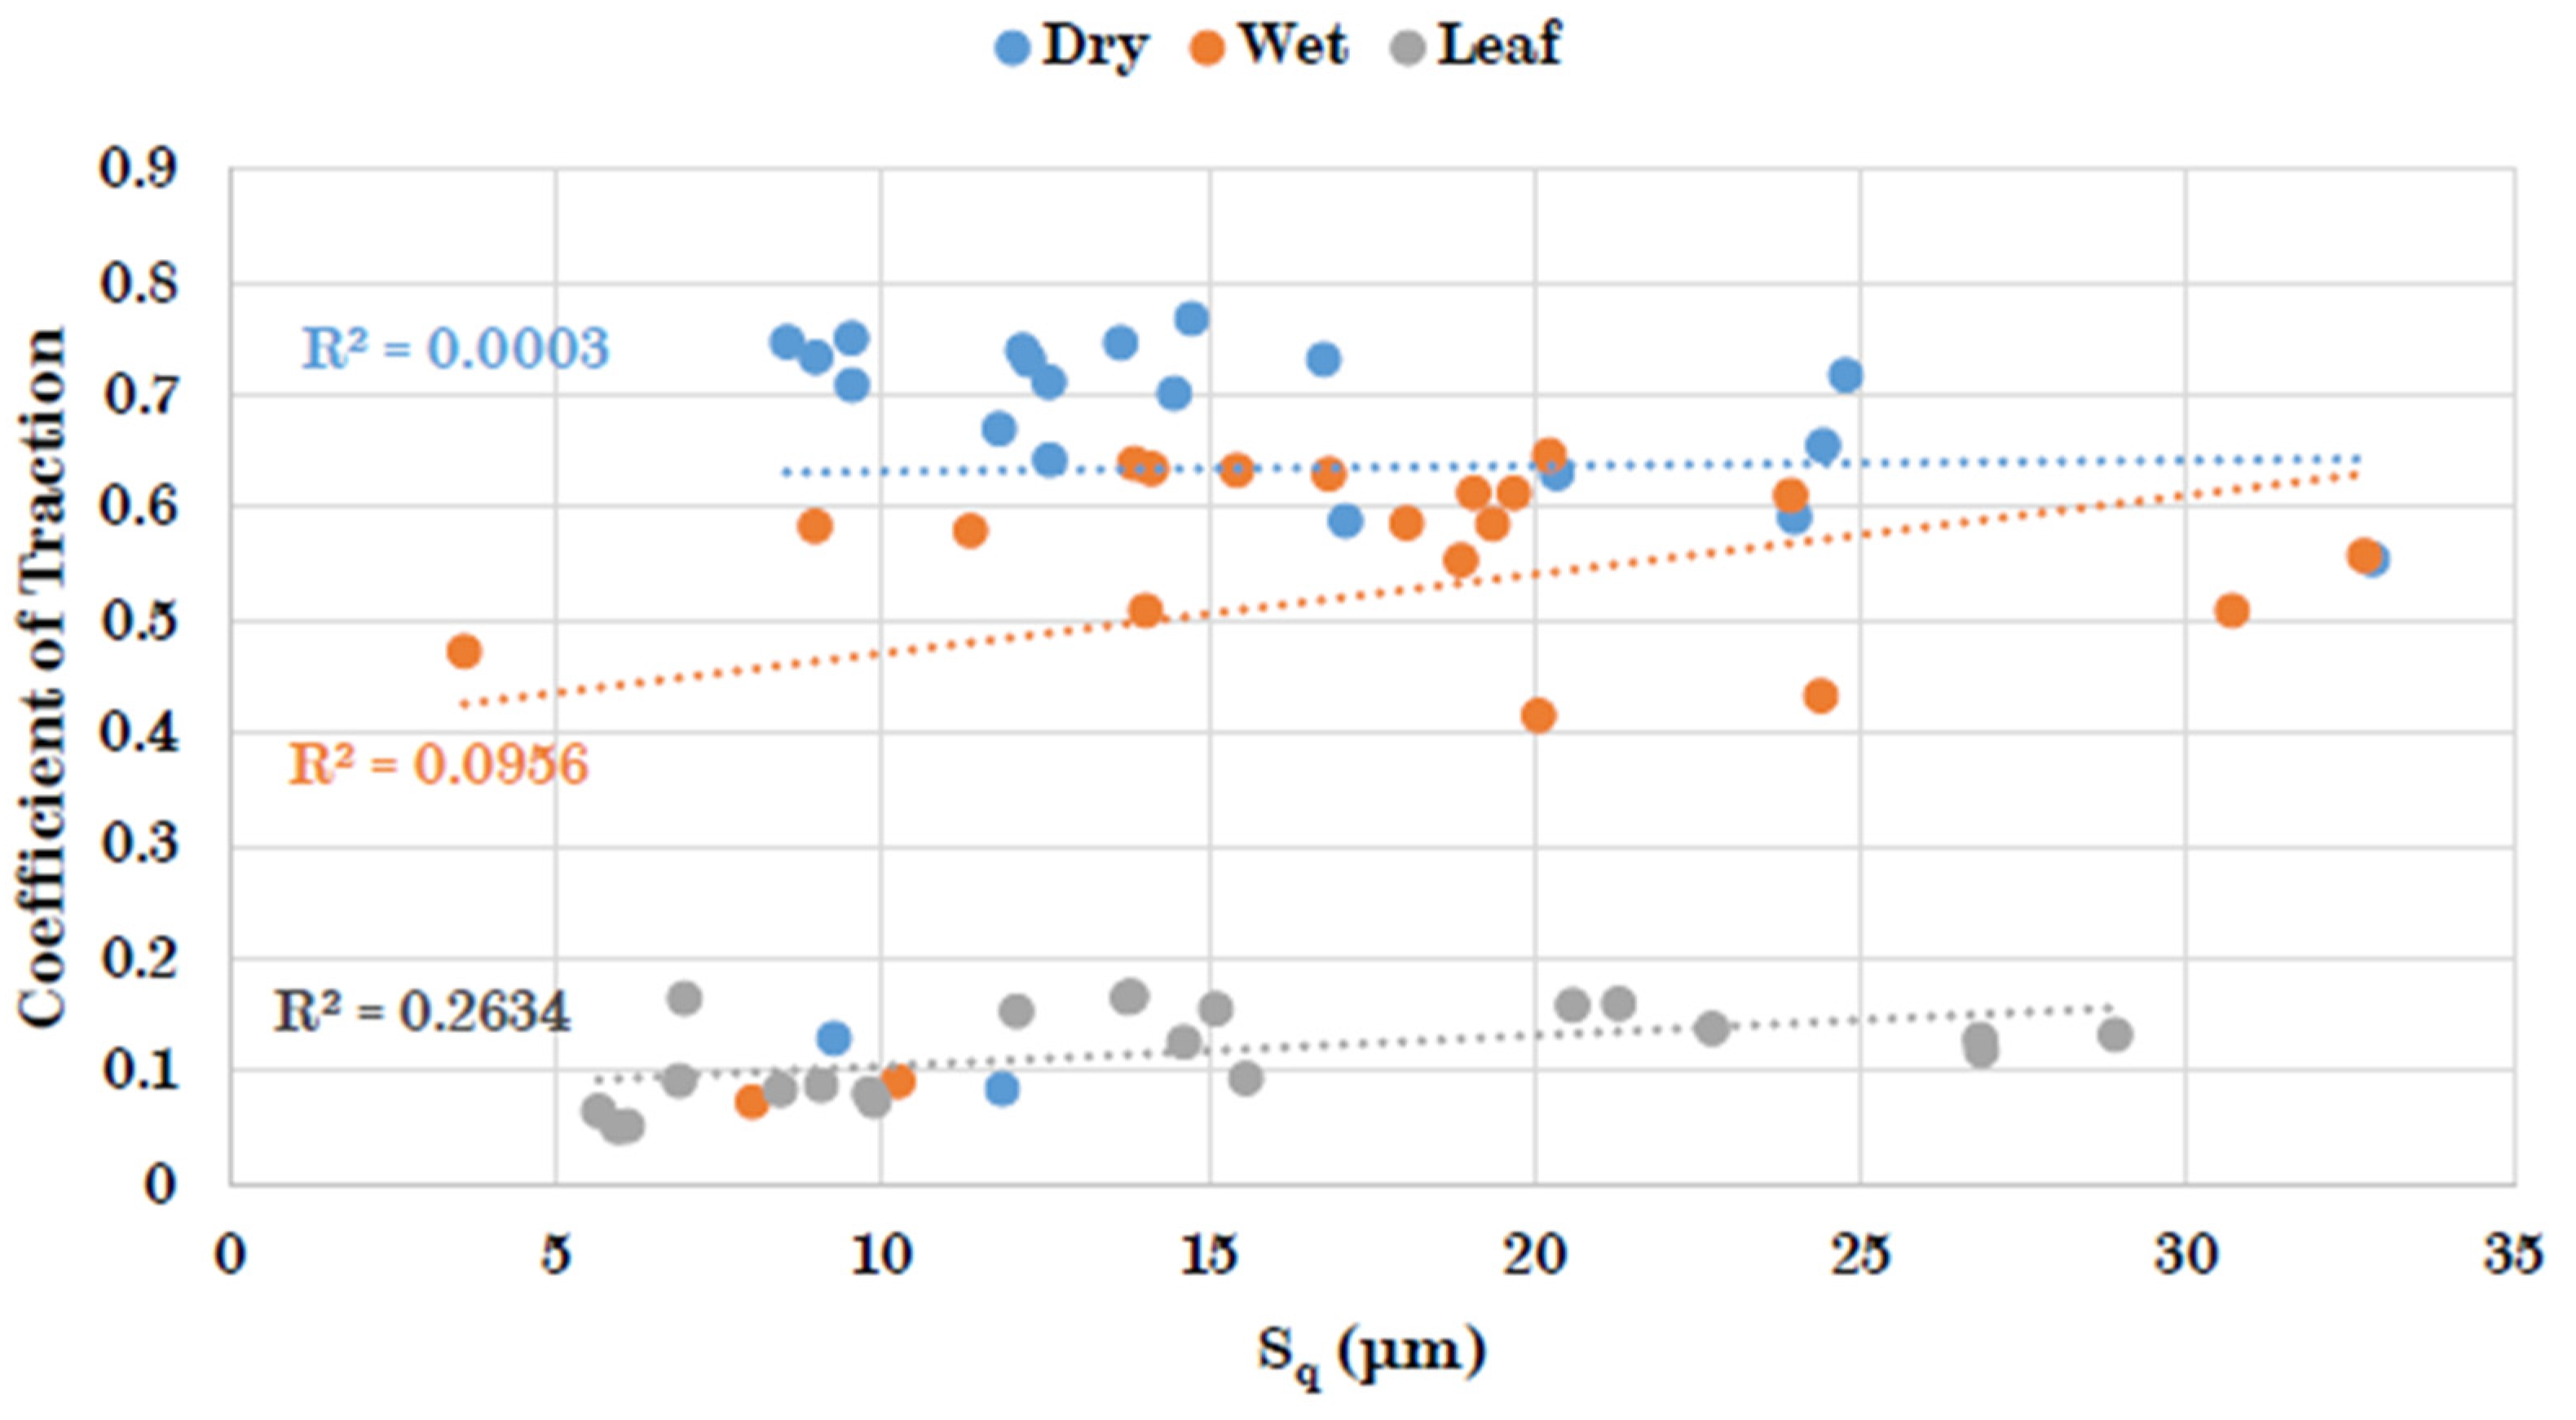
Converse to the particle hardness effect on traction, there appears to have been no obvious relationship with surface roughness, as shown in
Figure 18, where once again silica sand values from [
20] were added. The effect of increasing particle size on surface roughness was also observed in work undertaken by Huang et al. [
31].
Notably, there was no statistically significant link observed between particle hardness and surface roughness (though this does not mean no link between the two exists). This could have been because of the nature of the test, where only small sliding distances are achieved. With a rolling element and entrainment and crushing of the particles, other effects could have been seen. Work undertaken by Wang et al. [
32] did find a link between increasing particle hardness (for similar particle material) and increasing wheel/rail damage, using a twin-disc set-up over thousands of cycles. The inability to see how damage progresses over many cycles is a limitation of the HPT rig, with inferences made about the effect of damage from the initial few cycles of the application of only sand. This may explain why no significant trend was observed between hardness and roughness during the HPT testing.
The coefficient of restitution results indicate that the particles tested in this study have more favourable values, with a lower spread than those of silica sand, which should increase the likelihood of them being entrained to the wheel/rail interface. Many silica sand particles are lost in the application process due to them bouncing off wheel and rail surfaces away from the wheel/rail nip.
5. Conclusions
In this study, the High Pressure Torsion (HPT) test approach was used for testing granular materials under a range of interface conditions. The HPT rig simulates the wheel/rail interface through high contact pressures and the small amount of slip present in the contact.
Numerous particle types were applied to the HPT contact under dry, wet, and leaf-contaminated conditions, with the latter third-body condition being developed as part of this work and returning extremely low traction (<0.05). Dry conditions generally gave the highest traction, with the presence of water reducing available traction, and the leaf-contaminated test returning the lowest traction.
Under both dry and wet conditions, increasing particle hardness increased the measured peak coefficient of traction. The effect of hardness appears to be non-linear, where a hardness value exists below which efficacy rapidly decreases and above which efficacy is only marginally increased.
Two particles gave a lubricating effect under dry conditions with low surface damage, and some gave intermediate values. This raises the possibility of particle systems being used for managing all aspects of wheel/rail interface friction, not just traction enhancement.
In terms of application, the CoR values measured for the particles indicated that all particles tested have values that make their entrainment to the wheel/rail interface more likely than silica sand.