Article

Determination of Local Friction Conditions in Hot Forging and Application to the Flash Section of Die in Crankshaft Forging

1
Nissan Motor Co., Ltd., 2 Takara-cho, Kanagawa-ku, Yokohama 220-8623, Japan
2
Department of Electrical and Mechanical Engineering, Nagoya Institute of Technology, Gokiso-cho, Showa-ku, Nagoya 466-8555, Japan
3
Daido Steel Co., Ltd., 30, Daido-cho, 2-chome, Minami-ku, Nagoya 457-8545, Japan
*
Author to whom correspondence should be addressed.
Lubricants 2026, 14(3), 133; https://doi.org/10.3390/lubricants14030133
Submission received: 25 February 2026 / Revised: 11 March 2026 / Accepted: 13 March 2026 / Published: 18 March 2026

Abstract

To accurately predict the shape of an automobile product, such as a crankshaft, produced by hot die forging, a preliminary simulation of the forging process indicated the significant impacts of local and varying friction coefficients between the complex-shaped die and the material. This study identified the friction coefficients through ring compression and tapered plug penetration tests, focusing on regions with high pressure or large contact areas. The results revealed variations in the friction coefficients across different regions. Consequently, the study suggests implementing locally appropriate friction coefficients on specific die surfaces exhibiting conditions akin to those observed in the friction tests. Specifically, a Coulomb’s friction coefficient of 0.14 was assigned to the product shape region of the crankshaft die. Additionally, a friction model transitioning from a Coulomb’s friction coefficient of 0.5 to a shear friction coefficient of 0.6 was applied in the flash region with significant sliding distances. By incorporating these tailored friction conditions into the simulation of hot die forging for crankshaft manufacturing, the study achieves more accurate material flow, die filling, and underfill replication.

1. Introduction

The crankshaft, a vital component of automotive engines and a key element in internal combustion engines, converts the reciprocating motion of the piston into rotational motion. As a result, high fatigue strength, torsional rigidity, and dimensional accuracy are required. To ensure this performance, internal metal flow of the material must be formed along the crankshaft geometry; thus, hot forging processes are widely employed.
In hot flash-forming semi-closed die forging for crankshafts, heating reduces the workpiece’s deformation resistance, allowing the material to flow into the flash region between the dies. This facilitates adjusting the internal pressure in the product shape region, making the process suitable for forming intricate geometries. Multiple stages of flash-forming semi-closed die forging are typically used to achieve the preformed crankshaft shape [1]. In this process, as the flash is eventually trimmed, material loss amounts to around 20–40% of the original billet [2]. Research on flashless forging without flash generation has been documented for two-cylinder engine crankshafts [3]. Despite being an innovative approach, precise material flow control in a single forging operation is challenging due to the complex die structure and high forming pressure. Moreover, ensuring product quality consistency in mass production, where external conditions vary significantly, is unrealistic using this method. Consequently, many forged components are still produced through flash-forming semi-closed die forging. The flash plays a crucial role in regulating material flow and preventing underfill in hot forging, with a properly designed flash volume serving as an indicator of enhanced product quality and process optimization [4].
On the other hand, simulations are commonly employed to predict product geometry in hot forging processes [5] and play a crucial role in estimating die filling rates and forming loads. Despite the widespread use of simulations, conventional knowledge about friction in hot forging is limited. Friction coefficients have been determined under specific conditions through ring compression tests [6,7,8,9,10] and spike tests [11]. In industrial design practice, Coulomb’s friction coefficients are frequently utilized in forming simulations owing to their ease of application and broad acceptance across various lubrication conditions. However, under severe contact conditions in metal forming, such as significant macroscopic and microscopic material surface deformations, extended sliding distances, extremely high surface pressures several times greater than the flow stress, and large temperature differentials between the die (200 °C) and the workpiece (1000 °C), Coulomb’s friction coefficients may not adequately represent the actual frictional behavior [12].
In flash-forming semi-closed die forging, the region where the flash is compressed undergoes high sliding distances and surface pressures, leading to rapid deterioration of lubrication conditions. Therefore, maintaining a consistent low friction coefficient throughout the forming process becomes challenging, and it is presumed that this region transitions into the high-friction regime. To precisely forecast material flow in forming simulations, it is essential to employ suitable friction models based on anticipated similar friction conditions at specific locations and to allocate estimated friction coefficients accordingly.
In this study, it was deduced that the lubricant performed adequately in the crank section of the crankshaft during deformation. By contrast, in the flash region, although the lubricant performed well initially during formation, it was noted that the lubricant layer thinned or nearly disappeared in subsequent stages. Hence, it was postulated that the flash region shifted to a high-friction phase in the later stages of formation. These frictional circumstances are typical in other flash-forming semi-closed die forging procedures.
Accordingly, to determine the friction coefficient in areas where the lubricant broke down in the flash zone, two experimental methods and two friction models were utilized, as detailed later. These approaches quantitatively assessed the frictional behavior under (a) conditions where the lubricant functioned effectively and (b) conditions where the lubricant deteriorated or vanished due to heat, pressure, and sliding distance during the forming process. Subsequently, the change in the friction coefficient in the high-friction range following lubricant loss in the final stage of formation was measured. These findings were then applied to a real case of hot forging crankshaft production to evaluate the appropriateness of selectively employing friction models and coefficients based on the lubrication conditions. In the hot forging crankshaft production line targeted in this study, the lubricant adhesion weight was measured and found to range from 2 g/m2 to 30 g/m2. Based on these measurements, the lubricant coating weight used in the present experiments was set within the same range as that employed in the actual production process.

2. Experimental Methods

2.1. Measurement of the Flow Stress of the Material

Ring compression and tapered plug penetration tests were performed on Steel A, and its chemical composition is detailed in Table 1. The flow stress utilized in the numerical simulations was determined through a cylindrical compression test. Tools heated to 200 °C were coated with a graphite-based lubricant (Nippon Graphite Industries, Co., Ltd., Shiga, Japan). The upper die and lower die were set parallel in the press so that the specimen could be compressed to a predetermined height.
The cylindrical specimen had an initial diameter of 30 mm and an initial height of 40 mm. After compression, the height of the specimen ranged from 14.1 mm to 14.5 mm, corresponding to a reduction ratio of 63–64% for flow stress measurement. The specimens were heated in a nitrogen atmosphere using an electric furnace set at 900 °C, 1000 °C, and 1100 °C. Each heating condition and temperature were tested three times for consistency.
A 2.5 MN mechanical knuckle joint press (Aida Engineering, Ltd., Kanagawa, Japan) was used in the experiments. If the applied load was within the capacity of this press, the specimen could be compressed regardless of whether the material had any flow stress. Therefore, all specimens were compressed to the same height, resulting in the same strain being applied. An important consideration in hot forging experiments is to prevent excessive temperature reduction of the material during the test. Therefore, in this study, both the ring compression test and the tapered plug penetration test were conducted under forming conditions close to those used in the actual crankshaft forging process.

2.2. The Lubricant Used in the Experiments

Non-graphite-based and graphite-based lubricants were utilized for the friction tests, as detailed in Table 2. Non-graphite-based lubricants (Daido Chemical Ca., Ltd., Osaka, Japan) mainly comprise water-soluble polymer compounds and fatty acid salts. The utilization of non-graphite-based lubricants in hot forging has seen an uptick in recent years owing to lower expenses associated with waste lubricant disposal and enhanced working conditions. For instance, in this investigation, a non-graphite-based lubricant currently employed in the hot forging process of crankshafts underwent friction experiments. To provide a comparison, a traditional graphite-based lubricant, extensively utilized for numerous years, was also assessed. Graphite-based lubricants are generally acknowledged for offering superior heat resistance and lubricity compared to non-graphite-based lubricants. The graphite-based lubricant examined in this study was a fine colloidal graphite dispersed in water with an organic binder.

2.3. Selection of the Friction Test Method

Simulations were performed for the crankshaft forging process, which was the focus of this study. The results included the sliding distance between the tool and workpiece and the contact pressure on the workpiece surface, as detailed in Table 3. Furthermore, the sliding distance and contact pressure results from deformation simulations for friction tests representative of forging are presented in Table 3.
Compared to the product shape region of the crankshaft die, the flash region experiences higher pressure and longer sliding distances. Appropriately constraining the flash stabilizes the material flow, enhancing the forgeability of the crank portion. As a result, a significant temperature rise at the frictional interface in the flash region can lead to lubricant decomposition, loss of effectiveness, and burning off, resulting in increased friction between the die and the material. This phenomenon is typical in flash-forming semi-closed die forging and is prevalent in most hot forging processes. Therefore, when considering crankshaft forging, the friction coefficient cannot be determined solely through the ring compression test. In previous studies, various tests have been conducted to evaluate the friction coefficients of lubricants [13,14]. Consequently, a hot tapered plug penetration test was conducted, and an evaluation method capable of replicating surface pressures and sliding distances similar to those in actual crankshaft formation was chosen. During this process, the forming material adhered severely to the die surface, leading to galling. This is a common occurrence in hot forging. In regions with adhesion, the effective area of the lubricant film decreases. The Coulomb friction model (Coulomb’s friction law) was deemed suitable in lubricated regions, while a friction shear model (shear friction law) based on the internal shear resistance of the adhered material should be applied in regions affected by adhesion.
(a) 
Hot Ring Compression Test
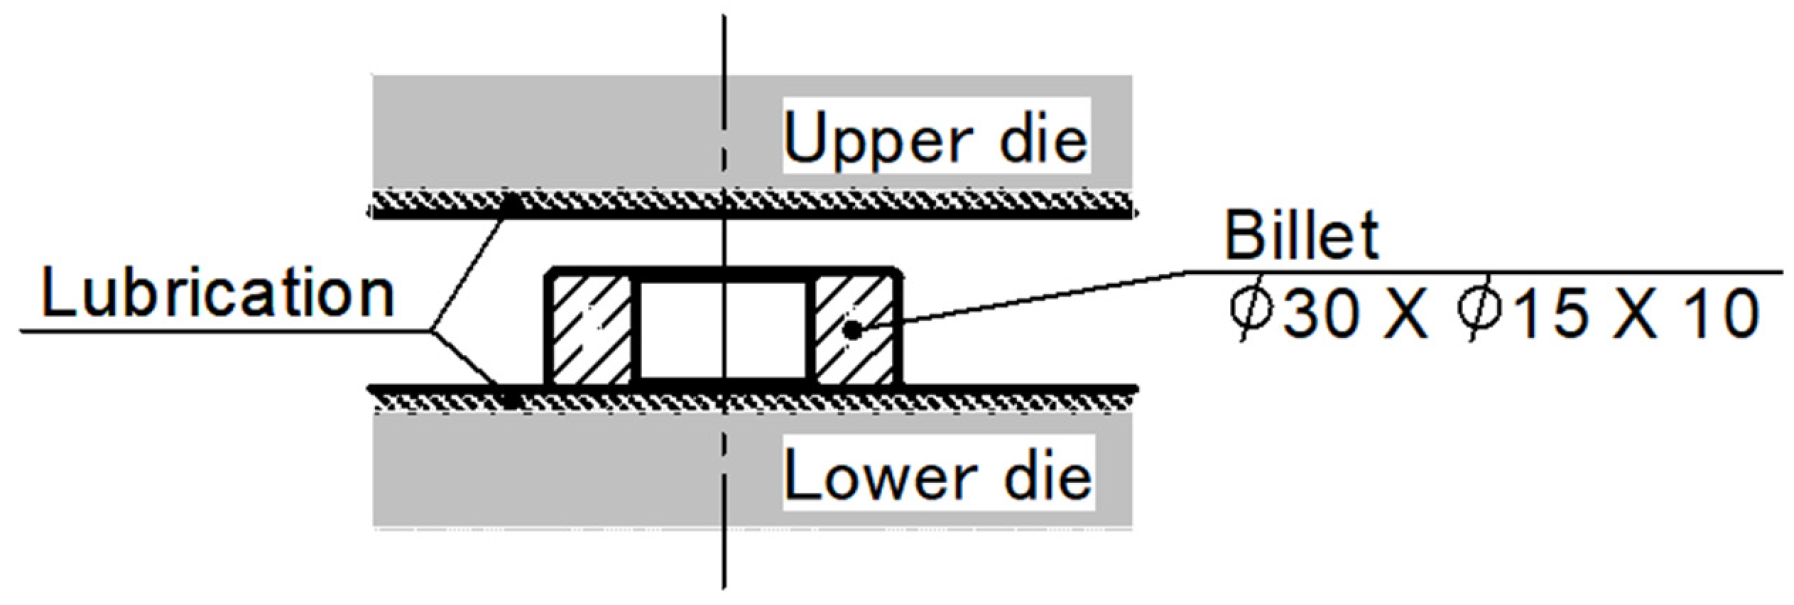
Figure 1 shows an overview of the hot ring compression test. This test has been widely utilized to evaluate the friction-reducing performance of lubricants for forging because the friction coefficient can be conveniently determined from the deformation of the specimen’s shape after compression. In particular, in hot forging, where plastic deformation occurs at elevated temperatures, it is difficult to directly measure the frictional force. Therefore, this testing method is considered useful [6,7,8,9,10]. The initial dimensions of the specimens prior to compression are shown in the figure. The specimens had an outer diameter of 30 mm, an inner diameter of 15 mm, and a height of 10 mm. Prior to compression, the specimen was heated to a prescribed temperature of 1000 °C in an electric furnace, placed at the center of the lower die, and immediately compressed. The upper and lower dies were parallel and SKH51 (JIS) was used as the tool material. A graphite-based lubricant (Gr) and a non-graphite-based lubricant (Wh), which are currently used in crankshaft production, were applied to tools heated to 200 °C using a brush and a sprayer. Two lubrication conditions, thin and thick lubricant films, were prepared. The measured lubricant adhesion weight values for Wh and Gr are listed in Table 4. Non-lubricated tools were also prepared. In the hot forging crankshaft production targeted in this study, the lubricant adhesion weight was measured and found to range from 2 g/m2 to 30 g/m2. Based on these measurements, the lubricant adhesion weights used in these experiments were set within the same range as that employed in the actual production process. The lubricant adhesion weights corresponded to the initial thickness of the lubricating film.
Compression was performed using a knuckle joint press with a capacity of 2.5 MN. The compression time required for the ring specimen was approximately 0.1 s, and the reduction ratio was set between 40% and 55%. To identify the Coulomb’s friction coefficient between the tool and the specimen from the reduction ratio and the change in inner diameter, calibration curves obtained in advance via finite element analysis were used.
(b) 
Hot tapered plug penetration test
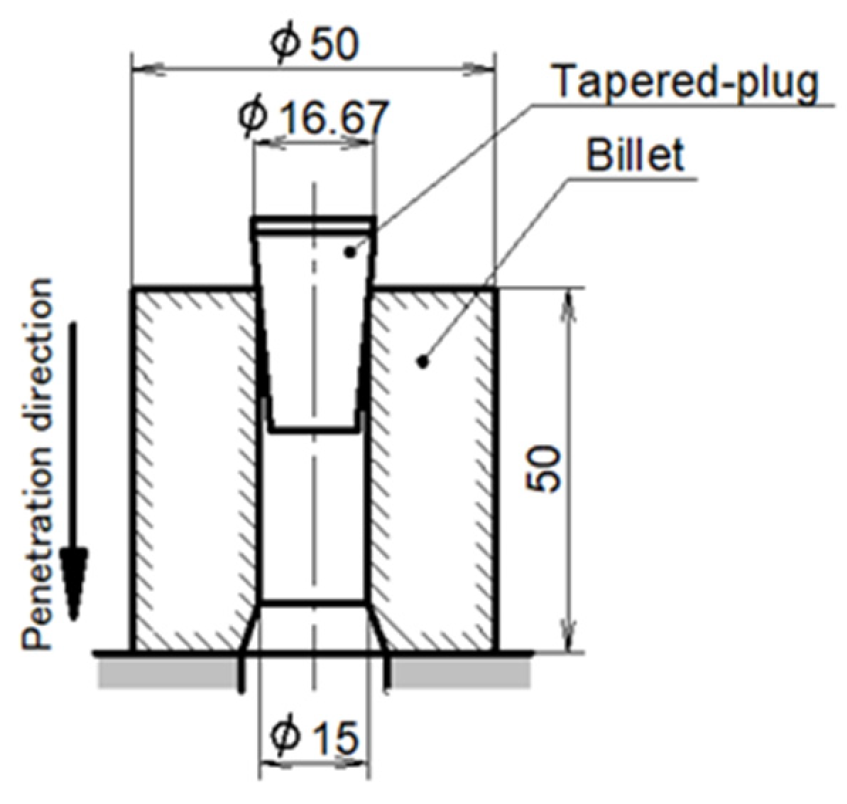
Figure 2 shows the hot tapered plug penetration test without an outer circumferential constraint, assuming hot forging conditions. This testing method has been effective for the development of lubricants for hot forging and for investigating the interactions between tool surface nitriding treatments and lubricants [15]. In this test, a tapered plug was pressed into the specimen to increase the inner diameter. Because the outer circumference of the specimen was not constrained by the container, friction occurred only between the tapered plug and the specimen.
The tapered plug material was equivalent to SKD61, which was used for the crankshaft forging die. The maximum diameter of the tapered plug was 16.67 mm, and the half angle was set to 5°. Three surface roughness levels were determined: Ra = 0.10, 1.60, and 1.71. The tapered plug with Ra 1.71 was produced by fixing the tapered plug with Ra 1.60 to a lathe and polishing its surface with sandpaper wrapped around a wooden block. The resulting surface roughness was Ra = 1.71. The specimen material was Steel A, which was the same as that used in the ring compression test. The specimens had an outer diameter of 50 mm, an inner diameter of 15 mm, and a height of 50 mm. The specimens were heated in a nitrogen atmosphere using an electric furnace set to 1000 °C. The tapered plug was pressed into the hole of the specimen using the same 250 ton knuckle joint press used in the ring compression test. The average penetration speed was 340 mm/s. The lubricants used were the same as those used in the ring compression test, namely Gr and Wh. The lubricants Gr and Wh were diluted five times with water, and a tapered plug heated to 200 °C was immersed in the lubricant solution to apply the lubricant, followed by drying and solidification. Under some conditions, to increase the amount applied, the lubricant was also brushed onto the surface of the tapered plug, heated to 200 °C, and then dried. The experimental conditions are summarized in Table 5a,b. Non-lubricated tests were conducted to identify the friction coefficient in the high-friction regime after lubricant breakdown. The experiments were performed by varying the material temperature, tapered plug surface roughness, and lubricant film thickness. Eighteen experiments were conducted using eight patterns. In addition, the lubricant adhesion weight was measured to estimate the thickness of the lubricant films (Table 5b). These lubricant weights were selected according to the practical conditions applied in crankshaft forging, as similarly mentioned for Table 4.

3. Experimental Results

3.1. Flow Stress Measurement

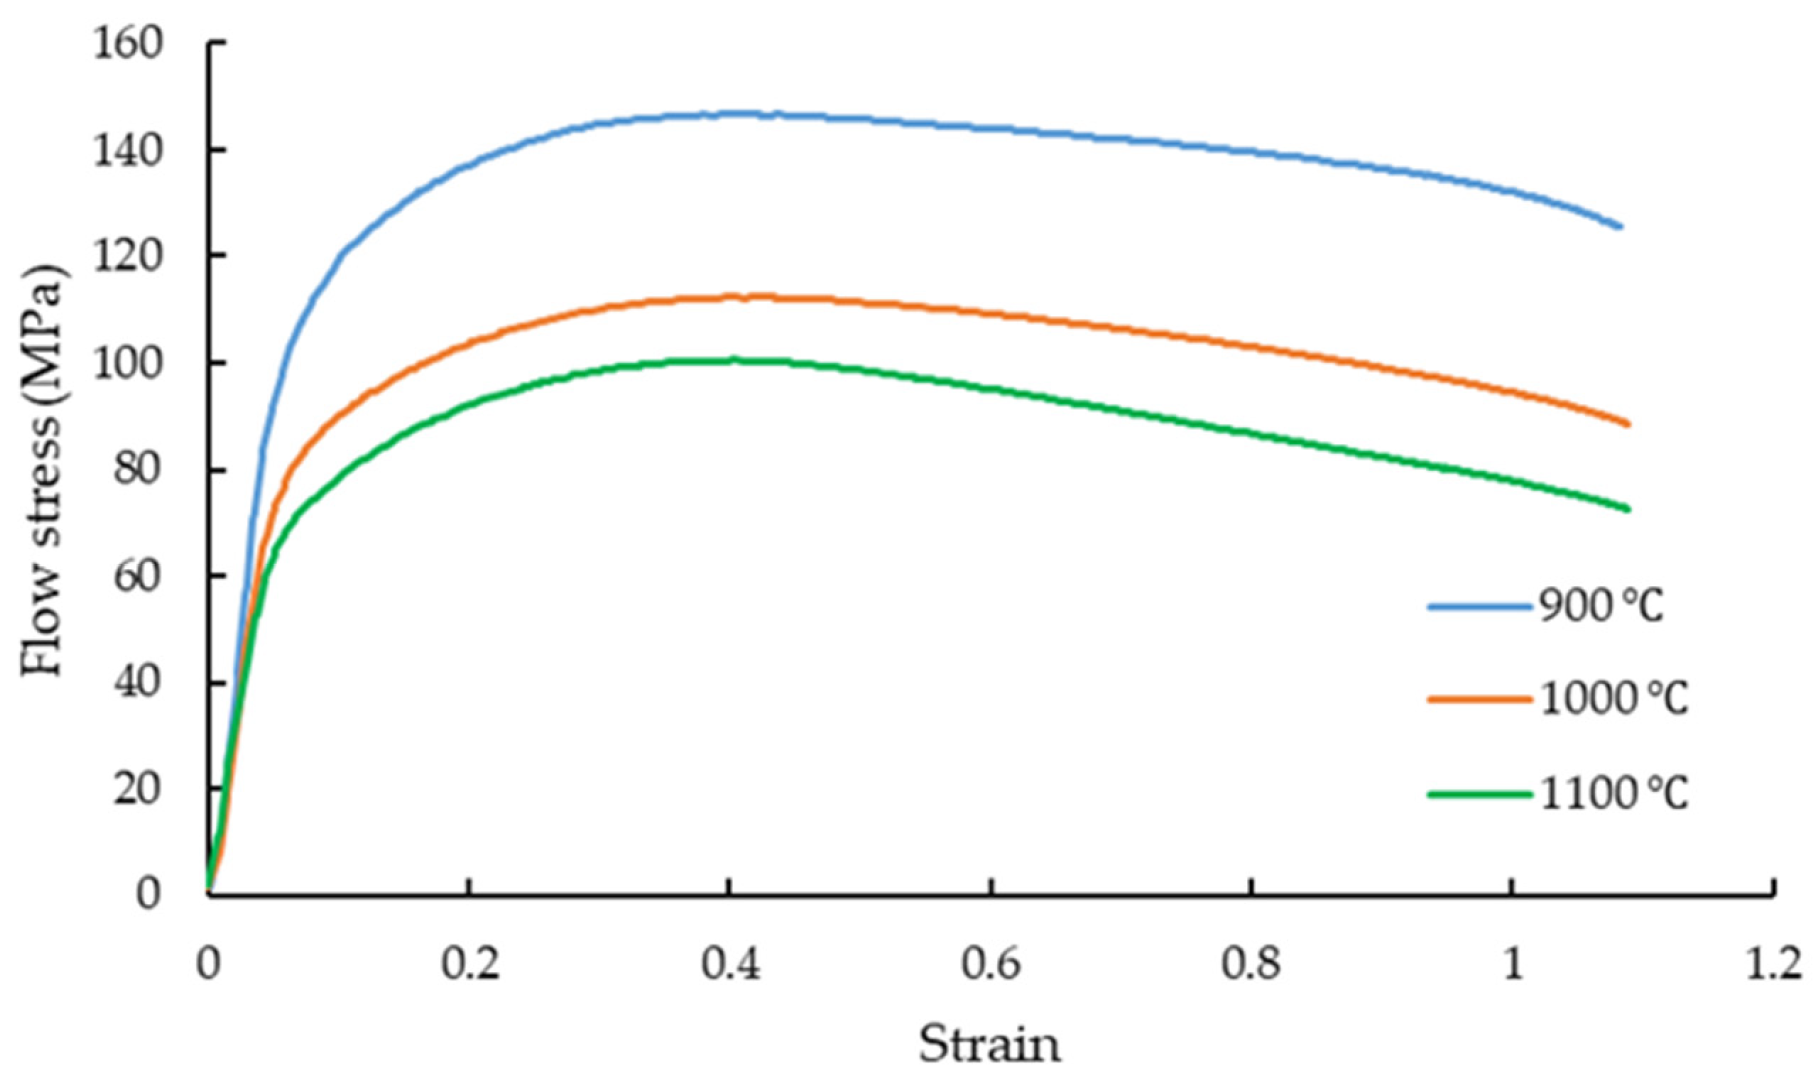
Figure 3 illustrates the flow stress derived from cylindrical compression tests conducted at 900 °C, 1000 °C, and 1100 °C. After the compression tests, as mentioned in Section 2.1, these results facilitated the determination of the material’s deformation resistance through solving a coupled thermomechanical analysis problem using the commercial simulation software DEFORM-2D version 13.1 (SFTC). The Coulomb’s friction coefficient between the die and material was established as 0.14, based on the outcomes of the ring compression test. Subsequently, utilizing the identified deformation resistance values, a finite element analysis of the tapered plug penetration test was executed.

3.2. Hot Ring Compression Test

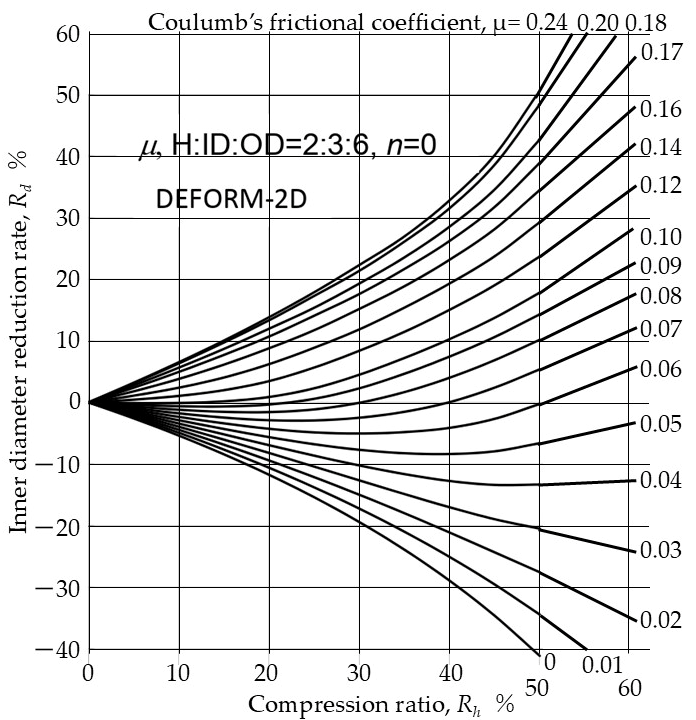
From the specimens after the ring compression test, the height reduction ratio [(h0 − h1)/h0] and the inner diameter reduction ratio [(d0 − d1)/d0] were calculated. Here, h0 and d0 represent the initial height and inner diameter of the specimen, respectively, while h1 and d1 represent the height and inner diameter after compression, respectively. The Coulomb’s friction coefficient was determined utilizing the calibration curve depicted in Figure 4.
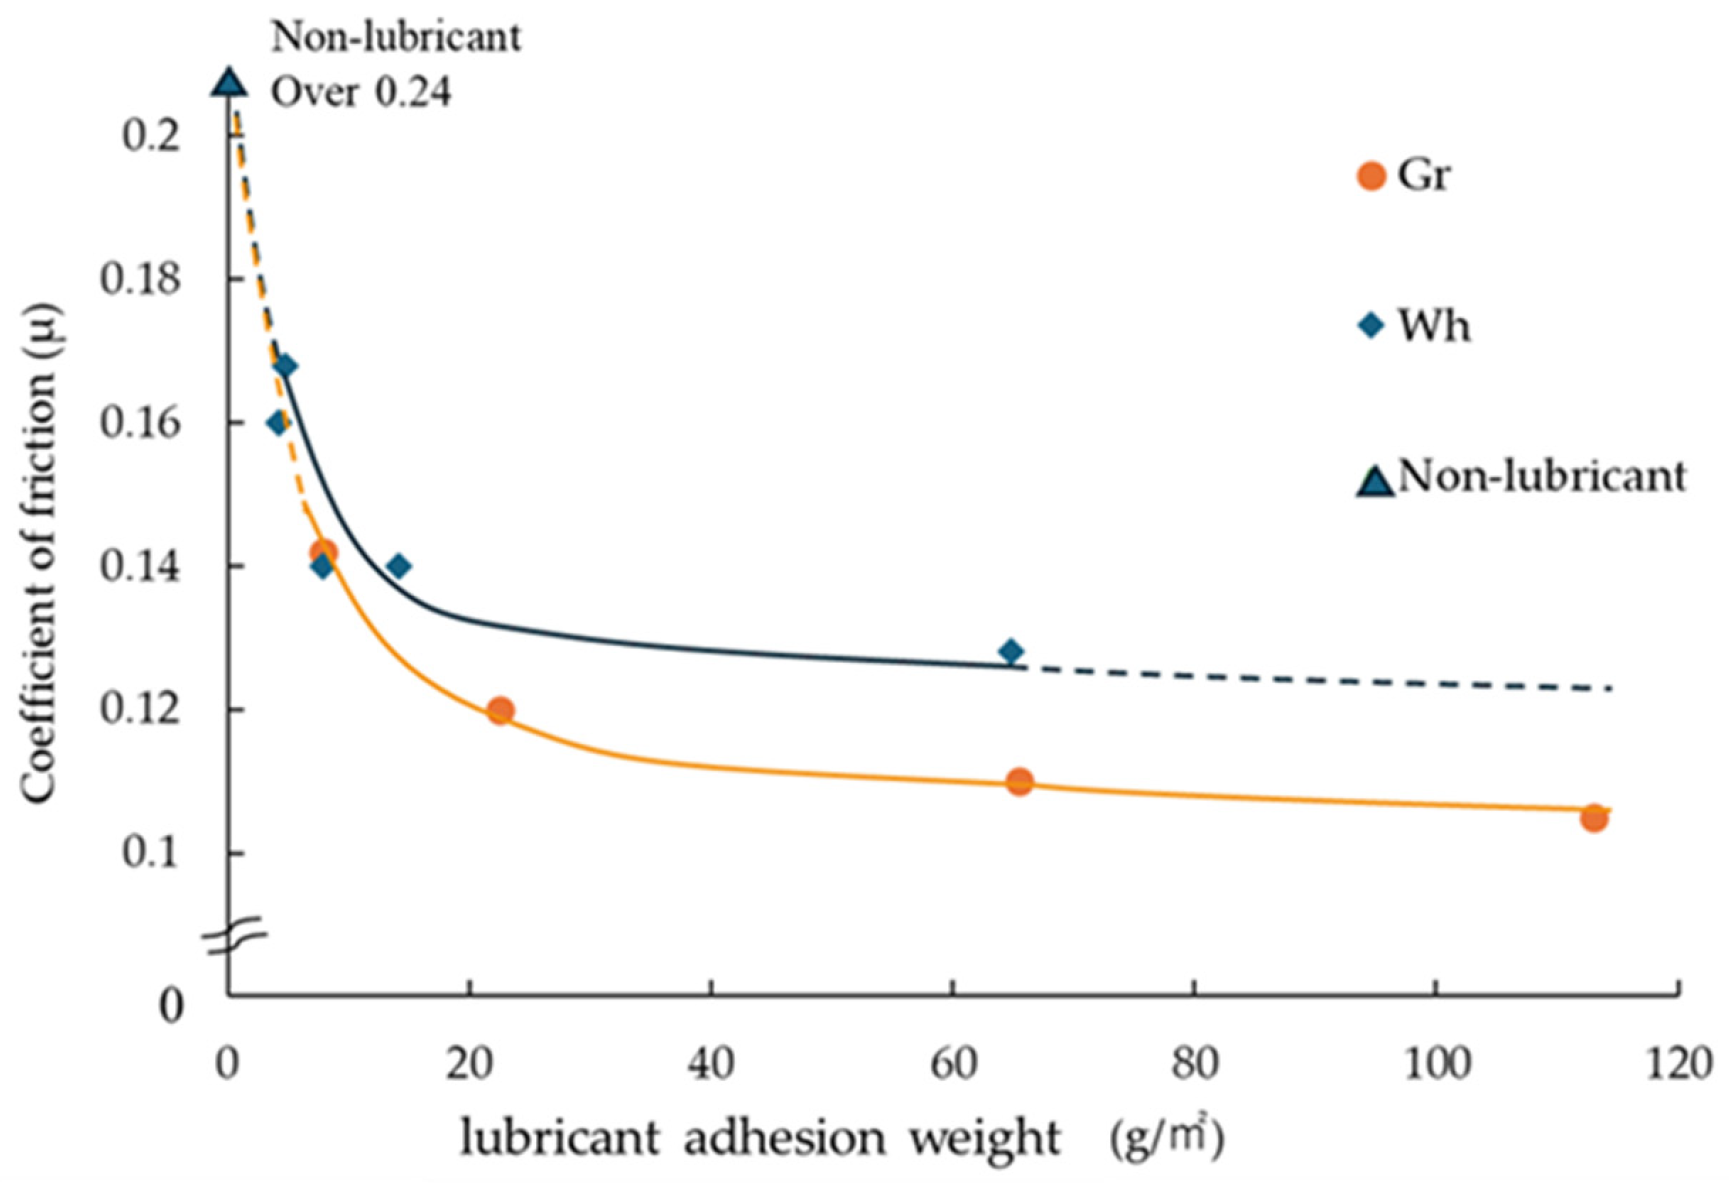
Figure 5 illustrates the correlation between the lubricant adhesion weight and Coulomb’s friction coefficient. The confidence intervals are shown as solid lines. Under dry conditions, the Coulomb’s friction coefficient exceeded μ = 0.24. For lubricants not based on graphite, the Coulomb’s friction coefficient varied from μ = 0.128 to 0.168. When the non-graphite-based lubricant was generously applied to the die surface, such as at an adhesion quantity of 60 g/m2, the Coulomb’s friction coefficient was μ = 0.13. Decreasing the adhesion quantity to 20 g/m2 resulted in an increase in the μ value to 0.14. Consequently, the friction-reducing effectiveness of the tested non-graphite-based lubricant marginally diminished as the adhesion quantity decreased from 60 to 20 g/m2. Further reducing the adhesion quantity to 5 g/m2 led to an increase in the μ value to 0.17. This value signified a friction level that notably hindered material flow during forging.
On the other hand, the graphite-based lubricant displayed a Coulomb’s friction coefficient (μ) in the range of 0.105–0.142. At an adhesion level of 60 g/m2, μ = 0.10, showing sufficiently high performance in reducing friction. Even with a reduced adhesion level of 20 g/m2, the μ value slightly increased to 0.12, indicating a partial decrease in friction- reducing performance. However, compared with the non-graphite-based lubricant applied at the same adhesion level, the graphite-based lubricant still exhibited superior friction reduction. These variations in friction-reducing performance aligned with practical forging observations.
When the adhesion amount was decreased to 5 g/m2, both the non-graphite-based and graphite-based lubricants exhibited a similar coefficient of friction (μ = 0.14). Although lubricants vary in their ability to reduce friction, at very low application rates, distinctions diminish, leading to a potential increase in friction. These findings emphasized that with a practical lubricant adhesion weight as low as 10−1 g/m2, the material flow during hot forging could be notably inhibited, affecting the expected deformation behavior.

3.3. Hot Tapered Plug Extrusion Test

3.3.1. Verification of Variability in Experimental Data

Under well-lubricated conditions (with a sufficiently thick lubricant film) or conditions where the lubricant is less likely to be consumed (e.g., at relatively low test temperatures), the load stabilizes with low frictional resistance. Conversely, inadequate lubrication from the outset can lead to the load stabilizing at a high friction level. The presence of a significant amount of oxide scale can inhibit adhesion or galling between the die and forming material, resulting in high but relatively stable friction. Transitions between these states of low and high friction may occur when lubricant performance is initially effective but deteriorates during the forming process. Similar transitions in friction conditions were also observed in the hot friction tests.
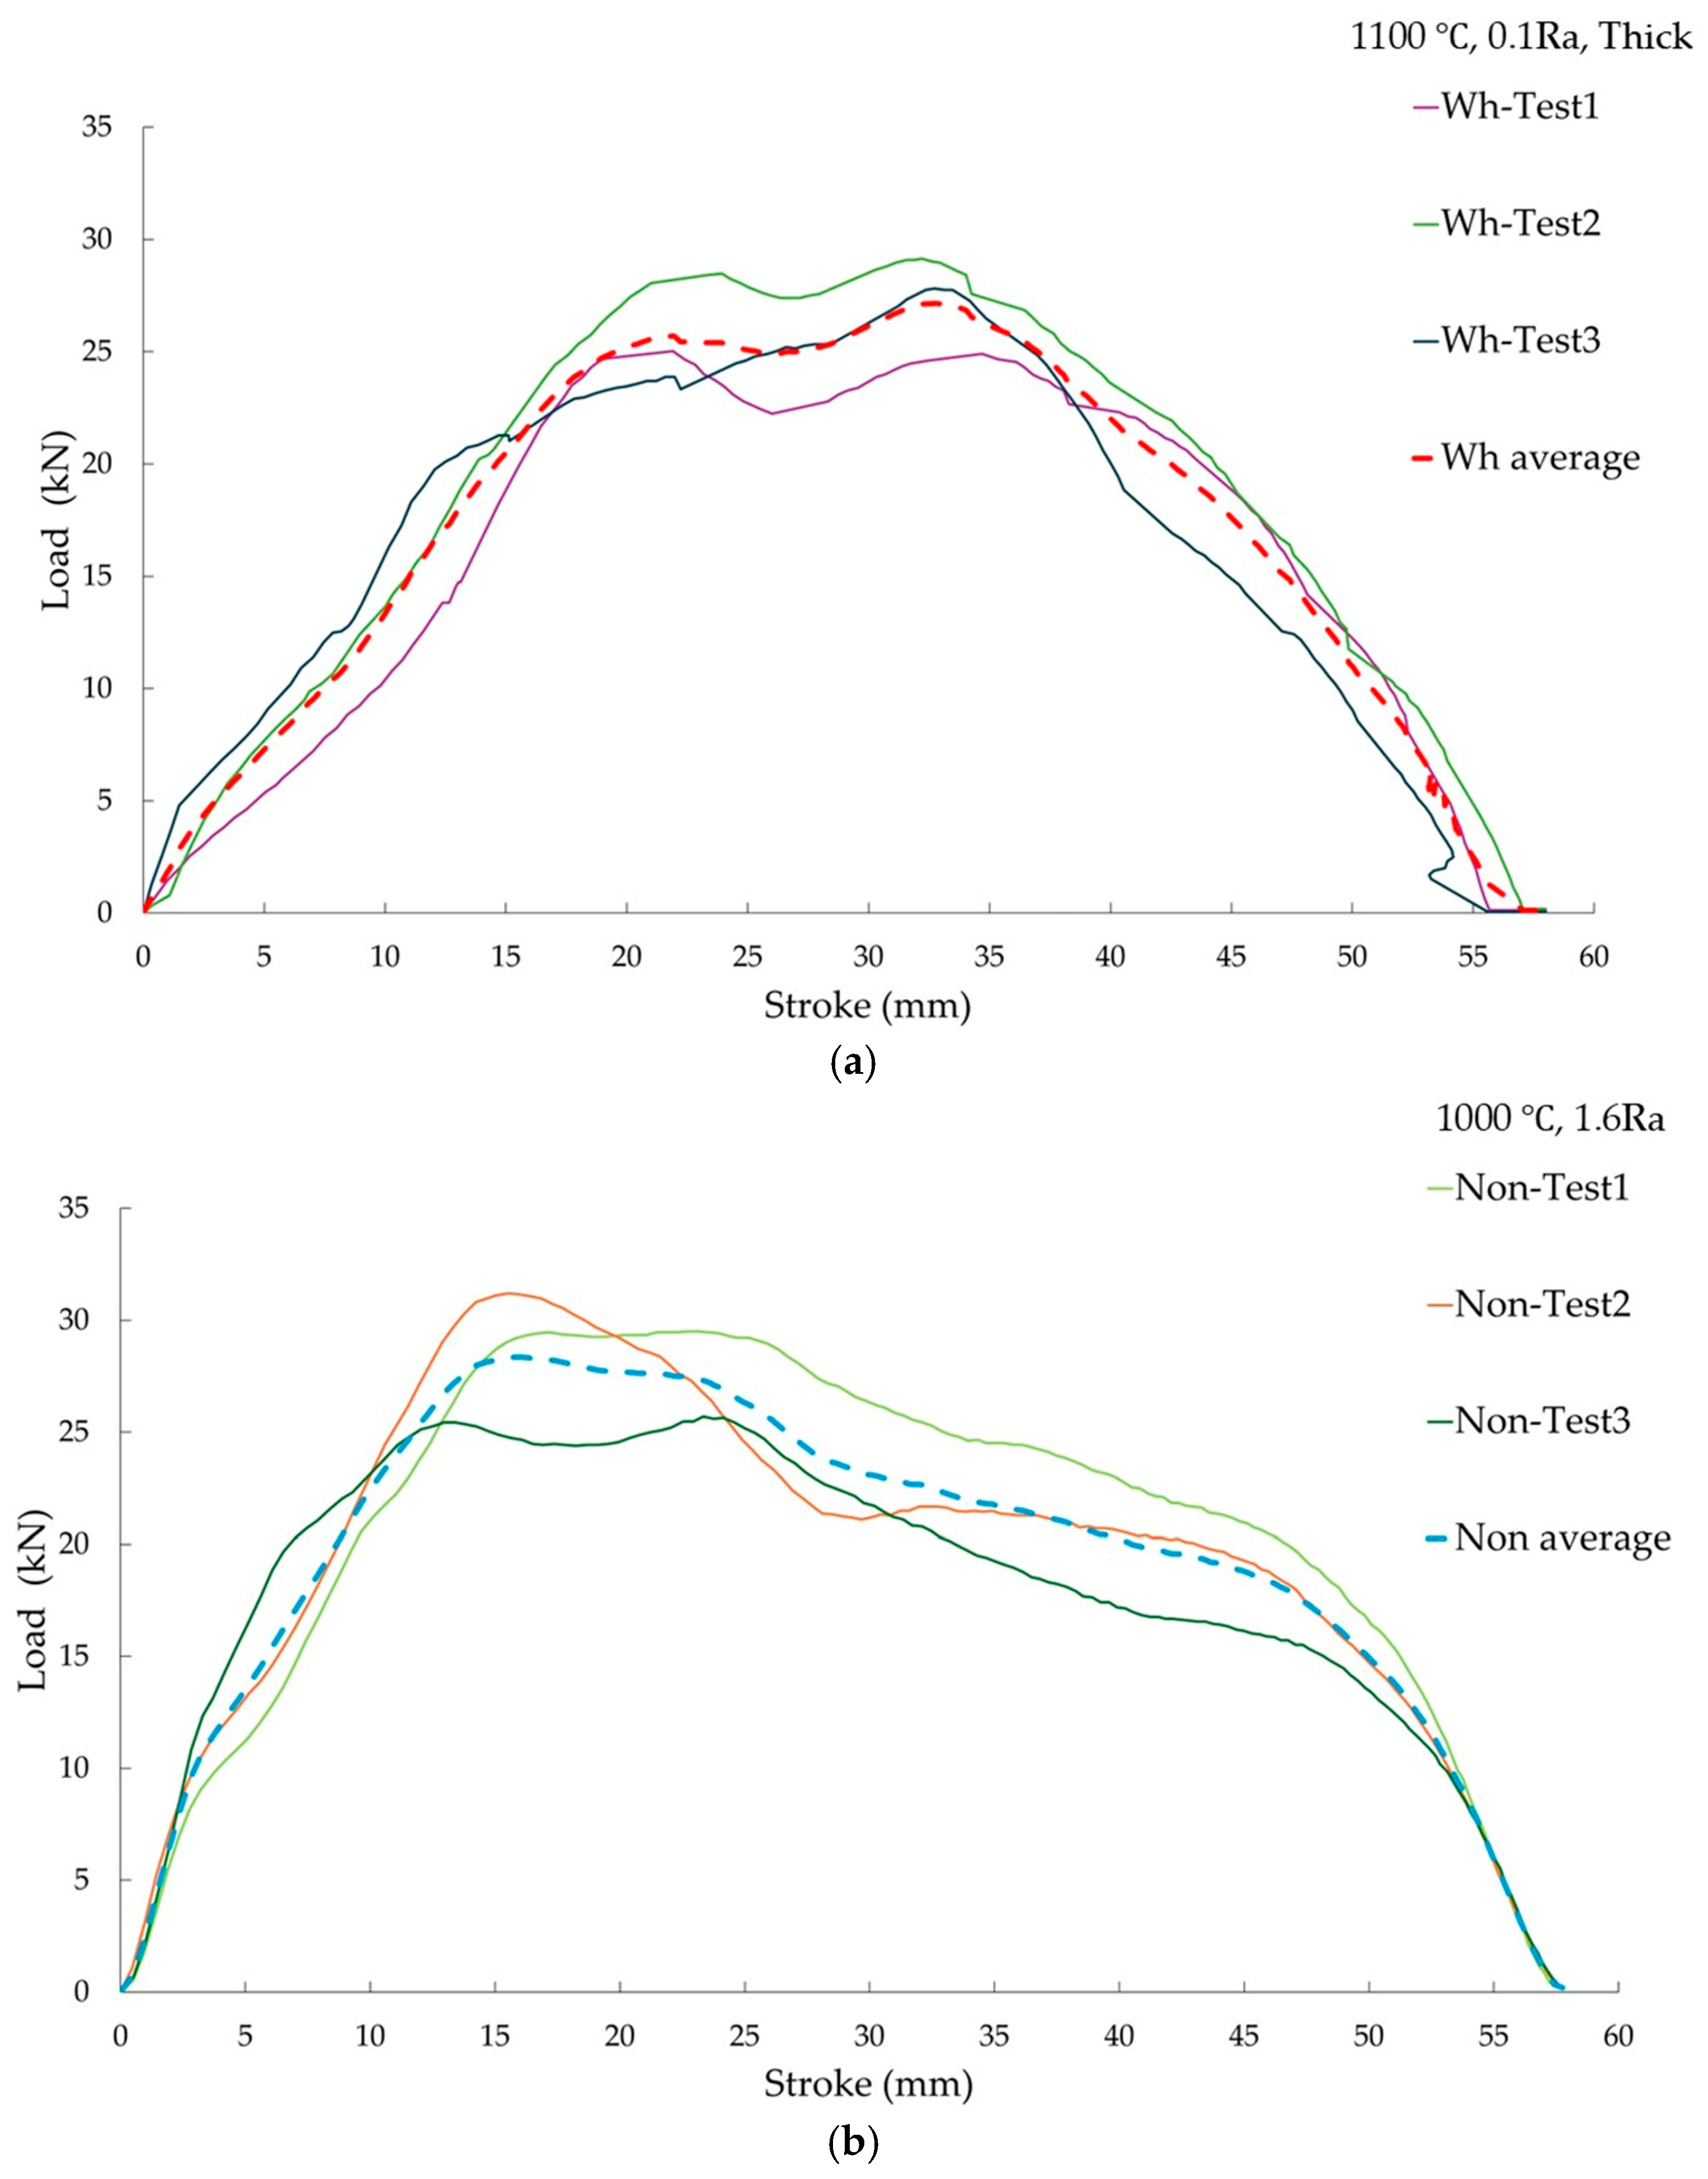
Thus, in hot forming processes (including hot friction tests), variations in conditions such as adhesion of oxide scale and contact time between the die and material can arise. These differences might impact experimental outcomes, leading to scattering of the measured data. In instances where the experimental results showed significant variability, the load values during the stroke were averaged at each point for subsequent discussion. These instances of substantial scatter corresponded to two specific cases selected from the experimental conditions outlined in Table 5b.
(1) Combination of test temperature 1100 °C, thick non-graphite-based lubricant film, and tapered plug surface roughness of Ra 0.1 μm
(Wh-1100 °C- 0.10Ra-Thick)
Because non-graphite-based lubricants have a lower heat resistance than graphite-based lubricants, the binder and lubricating components may deteriorate even when applied thickly to the die surface during forming. This can lead to insufficient adhesion to the die surface, and at higher test temperatures, such damage is likely to be accelerated. Consequently, the load (friction) was considered unstable under these conditions.
(2) Combination of test temperature of 1000 °C, non-lubricated conditions, and tapered plug surface roughness of Ra 1.6 μm
(Non-1000 °C-1.60Ra)
Under non-lubricated conditions, the die and forming material come into direct contact, potentially resulting in adhesion, with the adhered material possibly detaching during forming. Moreover, elevated die surface roughness can lead to asperity peaks scratching the material surface, causing intermittent plowing. These factors are believed to play a role in the unstable load (friction) behavior.
To enable comparison with other conditions, three experiments were conducted for each case. Following an assessment of result variability, the data were averaged. The stroke and load profiles of the tapered plug from the three repetitions and their averages are depicted in Figure 6a,b. In the case of Wh-1100 °C-0.10Ra-Thick, the load scatter was initially minimal due to the absence of lubricant breakdown. However, the behavior gradually became unstable, reaching a maximum scatter of approximately 5 kN. Conversely, in the case of Non-1000 °C-1.60Ra, a load scatter of approximately 5 kN was evident from the onset of the stroke. Despite this, as notable differences among the experimental conditions persisted, subsequent results could be compared using the averaged values.

3.3.2. Impact of Variance Among Non-Graphite-Based Lubricant, Graphite-Based Lubricant, and Non-Lubricated Conditions

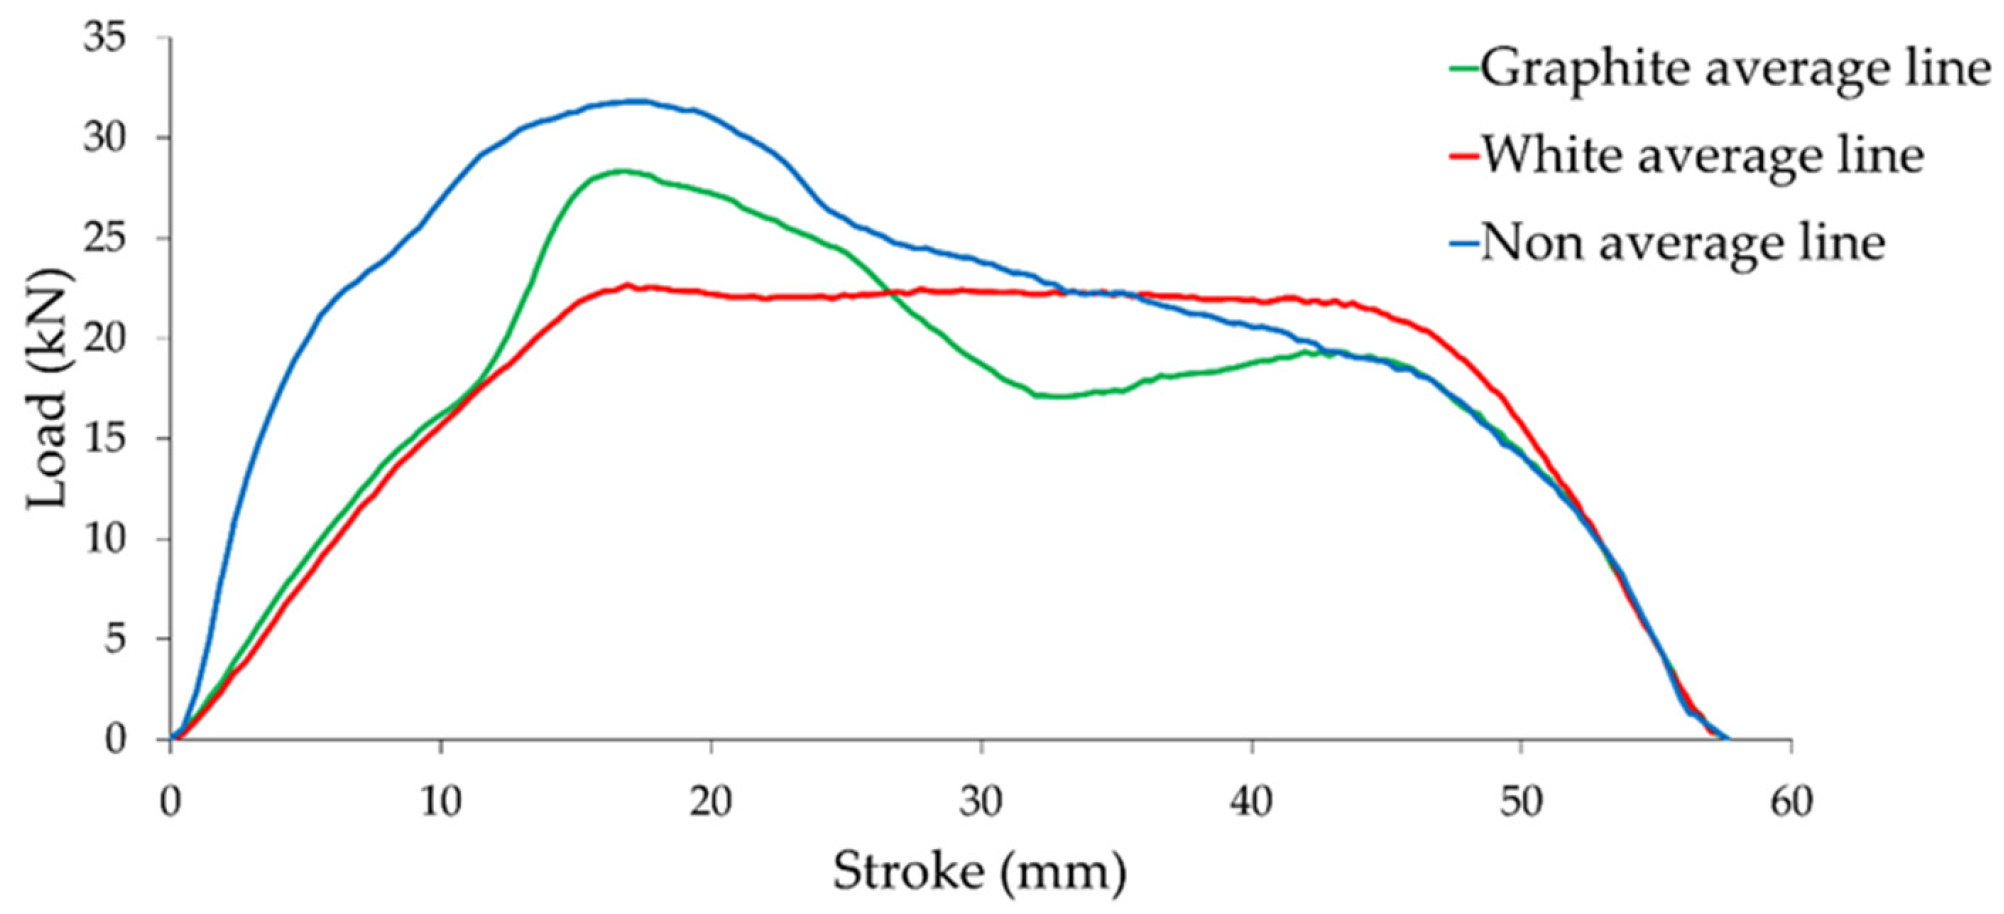
To compare the effects of lubricant type, we evaluated the averaged load–stroke curves of W10-1.71-thick, B10-1.71-thick, and N10-1.71. The results are shown in Figure 7. Throughout these experiments, the material temperature (1000 °C) and die surface roughness (Ra = 1.71) were kept constant.
In the tapered plug penetration test, the load under non-lubricated conditions was approximately twice as high as that with lubricant application up to a 12 mm stroke. The application of a lubricant significantly reduced the load. Comparing lubricants Wh and Gr, both showed similar loads during the initial penetration stroke, suggesting no difference in friction-reducing performance at this stage. As the stroke progressed to 17 mm without lubrication, the load gradually increased to a maximum of 32 kN. With Gr application, the load rapidly increased between 12 and 17 mm, peaked, and then decreased. At a stroke of approximately 26 mm, the load was lower than that with Wh, continued to decrease up to a stroke of 32 mm, and remained relatively steady and stable up to a stroke of 43 mm. In the case of Wh, the increase in load was more gradual than that in the case of Gr, and a steady behavior was observed from strokes of 17 to 43 mm. Even as the stroke progressed from 12 to 43 mm, a load-reducing effect of the lubricants was observed. When considering the average load variation under each lubrication condition or the total work over the entire stroke, the difference between Gr and Wh was small, indicating that both exhibited similar load-reducing effects. From the viewpoint of load variation with respect to stroke, Wh exhibited more stable behavior than Gr.
In the ring compression test, the friction-reducing effect of Wh was lower than that of Gr; therefore, the lubrication performance of Wh in the tapered plug penetration test was better than expected. The forming energies calculated by integrating the load–stroke curves for Wh and Gr were 989.3 kN·mm for Wh and 978.5 kN·mm for Gr, indicating comparable values under both conditions, and suggesting that both Wh and Gr were effective lubricants. By contrast, under non-lubricated conditions, the load increased sharply from the initial stage of the stroke, showing a clear difference from the results obtained with Wh and Gr.

3.3.3. Effect of Lubricant Film Thickness When Using a Non-Graphite-Based Lubricant

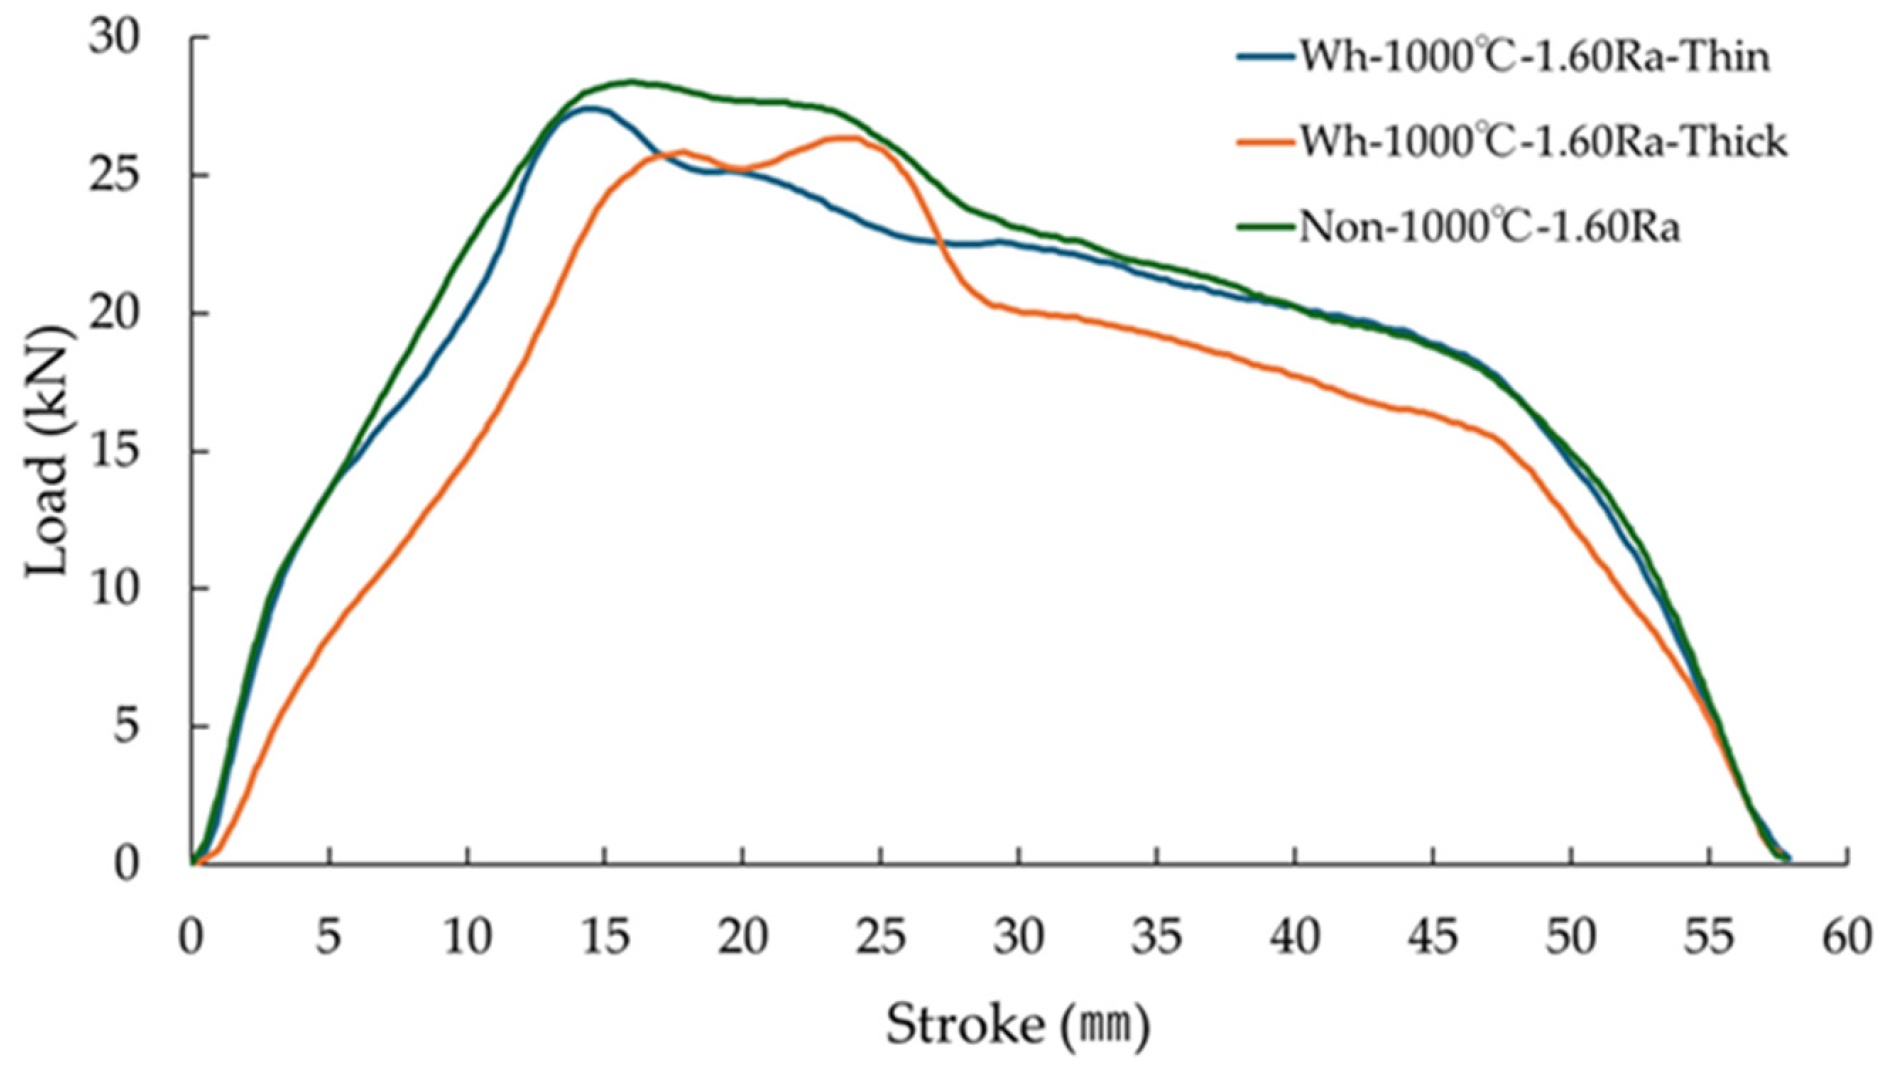
To evaluate the effect of lubricant film thickness on friction-reducing performance, Figure 8 illustrates the stroke–load curves obtained using Wh with varying lubricant film thicknesses. The conditions of Wh-1000 °C-1.60Ra-Thin, Wh-1000 °C-1.60Ra-Thick, and the non-lubricated conditions of Non-1000 °C-1.60Ra from Table 5b were selected for comparison of the average load transition. The conditions of Wh-1000 °C-1.60Ra-Thin represented the lubrication state during mass production in actual crankshaft forming. Under the conditions of Wh-1000 °C-1.60Ra-Thin, characterized by a thin lubricant film thickness, the load up to the initial 5 mm stroke matched that under the non-lubricated conditions of Non-1000 °C-1.60Ra. However, between the 5 to 40 mm stroke range, the load under the conditions of Wh-1000 °C-1.60Ra-Thin was lower than that under the conditions of Non-1000 °C-1.60Ra. During the experiment, it took 2–3 s from placing the lubricant-coated tapered plug on the high-temperature specimen until the plug was pressed in, followed by an additional 0.2 s to complete penetration of the tapered plug. It was deduced that within the several seconds between setting the lubricant-coated tapered plug (die) on the high-temperature specimen (workpiece) and the initiation of penetration, the thin lubricant film had already dissipated and could not function effectively. However, after this stage, even the thin lubricant film demonstrated a reduction in load compared to the non-lubricated conditions. This reduction was attributed to the lubricant film applied to the areas of the tapered plug not yet in contact with the specimen being less prone to damage, thereby averting direct contact between the tapered plug and the high-temperature material and enabling the lubricant to manifest its lubricating properties.

3.3.4. Effects of Material Temperature and Die Surface Roughness When Using a Non-Graphite-Based Lubricant

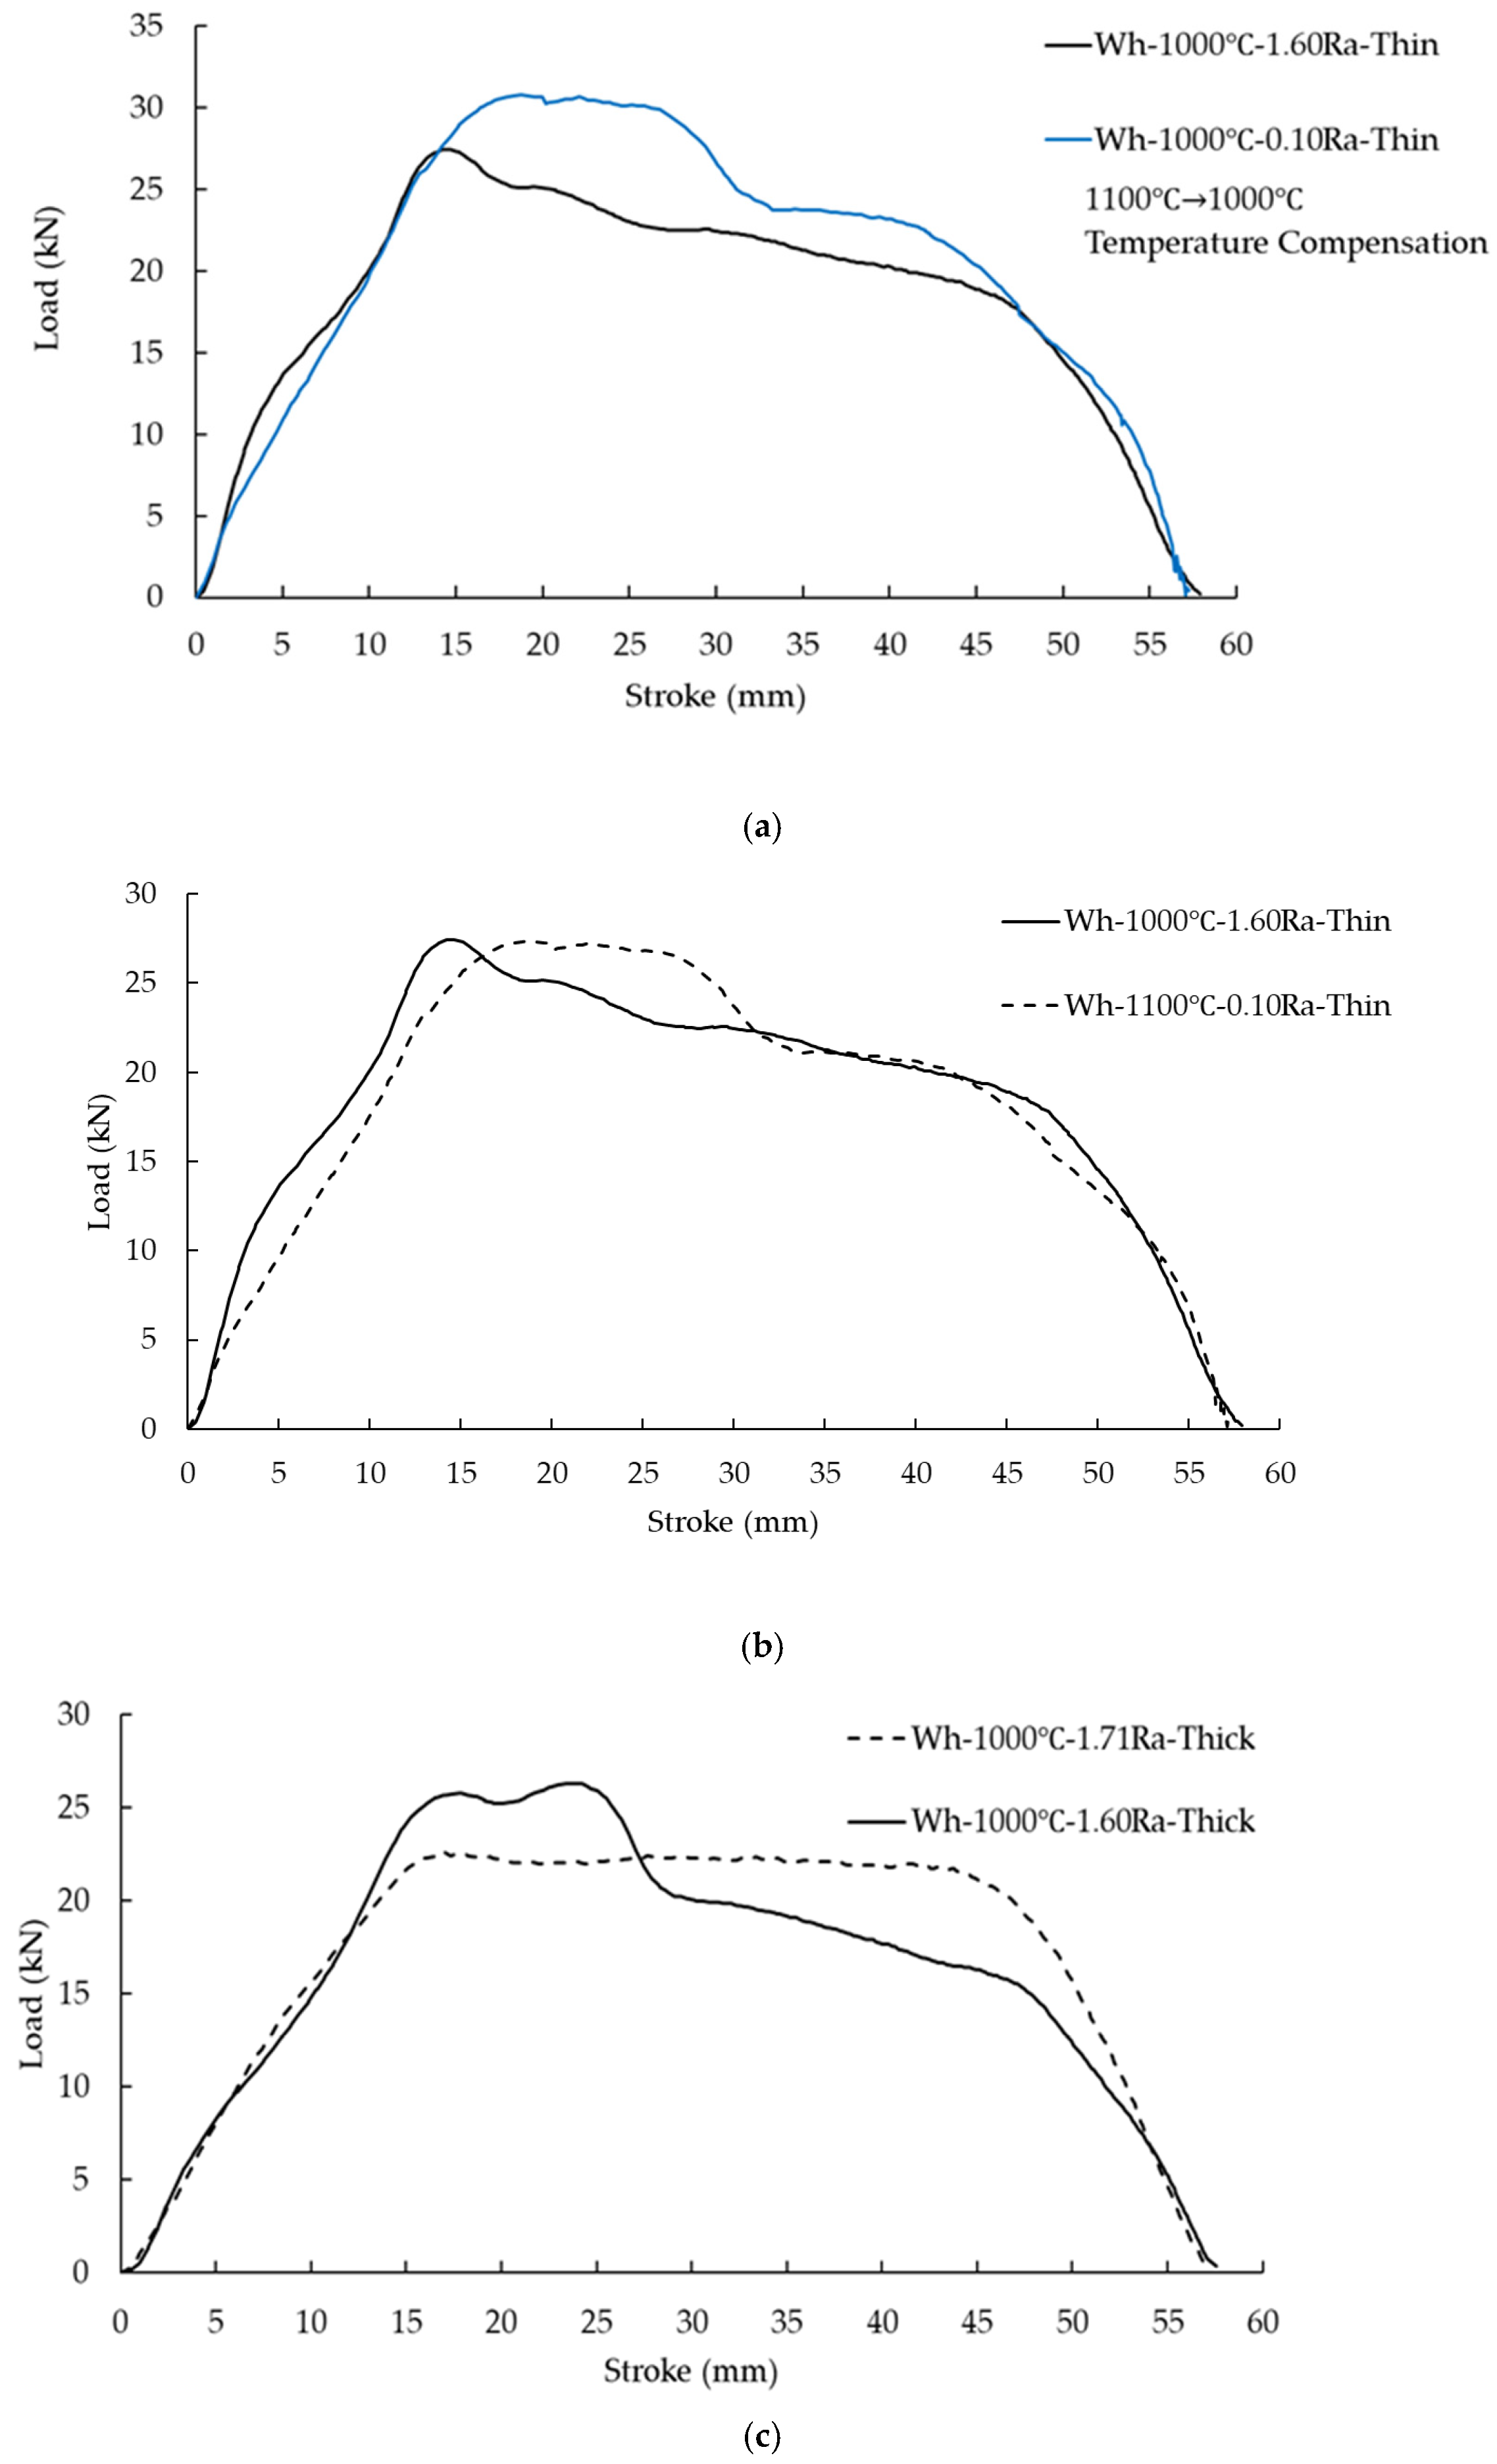
To investigate the impact of die surface roughness in this test, Figure 9a shows a comparison of the average load transitions for Wh-1000 °C-1.60Ra-Thin and Wh-1100 °C-0.10Ra-Thin using the same non-graphite-based lubricant. The load increased rapidly up to a stroke of 15 mm, stabilized, and then gradually decreased up to a stroke of 30 mm. The slightly lower load observed at a material temperature of 1100 °C compared to 1000 °C was attributed to the reduced flow stress, as depicted in Figure 3. The lubricant adhesion weights amounted to 2.0–3.0 g/m2 for Ra 1.60 and 0.6–1.3 g/m2 for Ra 0.10, with the load being higher for Ra 1.60. In this scenario, the impact of material temperature outweighed that of lubricant quantity. Therefore, to assess the effect of die surface roughness on a thin lubricant film, the material temperature of Wh-1100 °C-0.10Ra-Thin was adjusted to 1000 °C based on the flow stress results in Figure 3, as shown in Figure 9b. Owing to the disparity in surface roughness between Ra 0.10 and Ra 1.60, the lubricant adhesion weight differed and the load was higher for Ra 0.10, which had a lower lubricant adhesion weight.
Furthermore, the effects of die surface roughness and minor variations in lubricant application under conditions with thick lubricant films were compared. Such variations in conditions are common in practical scenarios and were thoroughly investigated. Figure 9c shows a comparison of the average load transitions between Wh-1000 °C-1.60Ra-Thick and Wh-1000 °C-1.71Ra-Thick. No significant difference in load was noted up to a stroke of about 14 mm. The lubricant film thickness was slightly higher at 25–27 g/m2 for Ra 1.71 compared to 19–22 g/m2 for Ra 1.60. The latter displayed a more consistent load and was deemed to offer superior lubrication. Given that the sliding distance in the tapered plug penetration test exceeded that in the ring compression test, a higher lubricant quantity might have been beneficial, even at around 20 g/m2. Alternatively, this could have facilitated better retention of the lubricant within rough surface valleys. Irrespective of the average load or work throughout the stroke, Figure 9c suggests that when the lubricant film thickness is significantly greater than the die surface roughness, minor variations in lubricant film thickness do not impact friction reduction.

4. Discussion

4.1. Measurement Results of Residual Lubricant Components After the Hot Tapered Plug Penetration Test

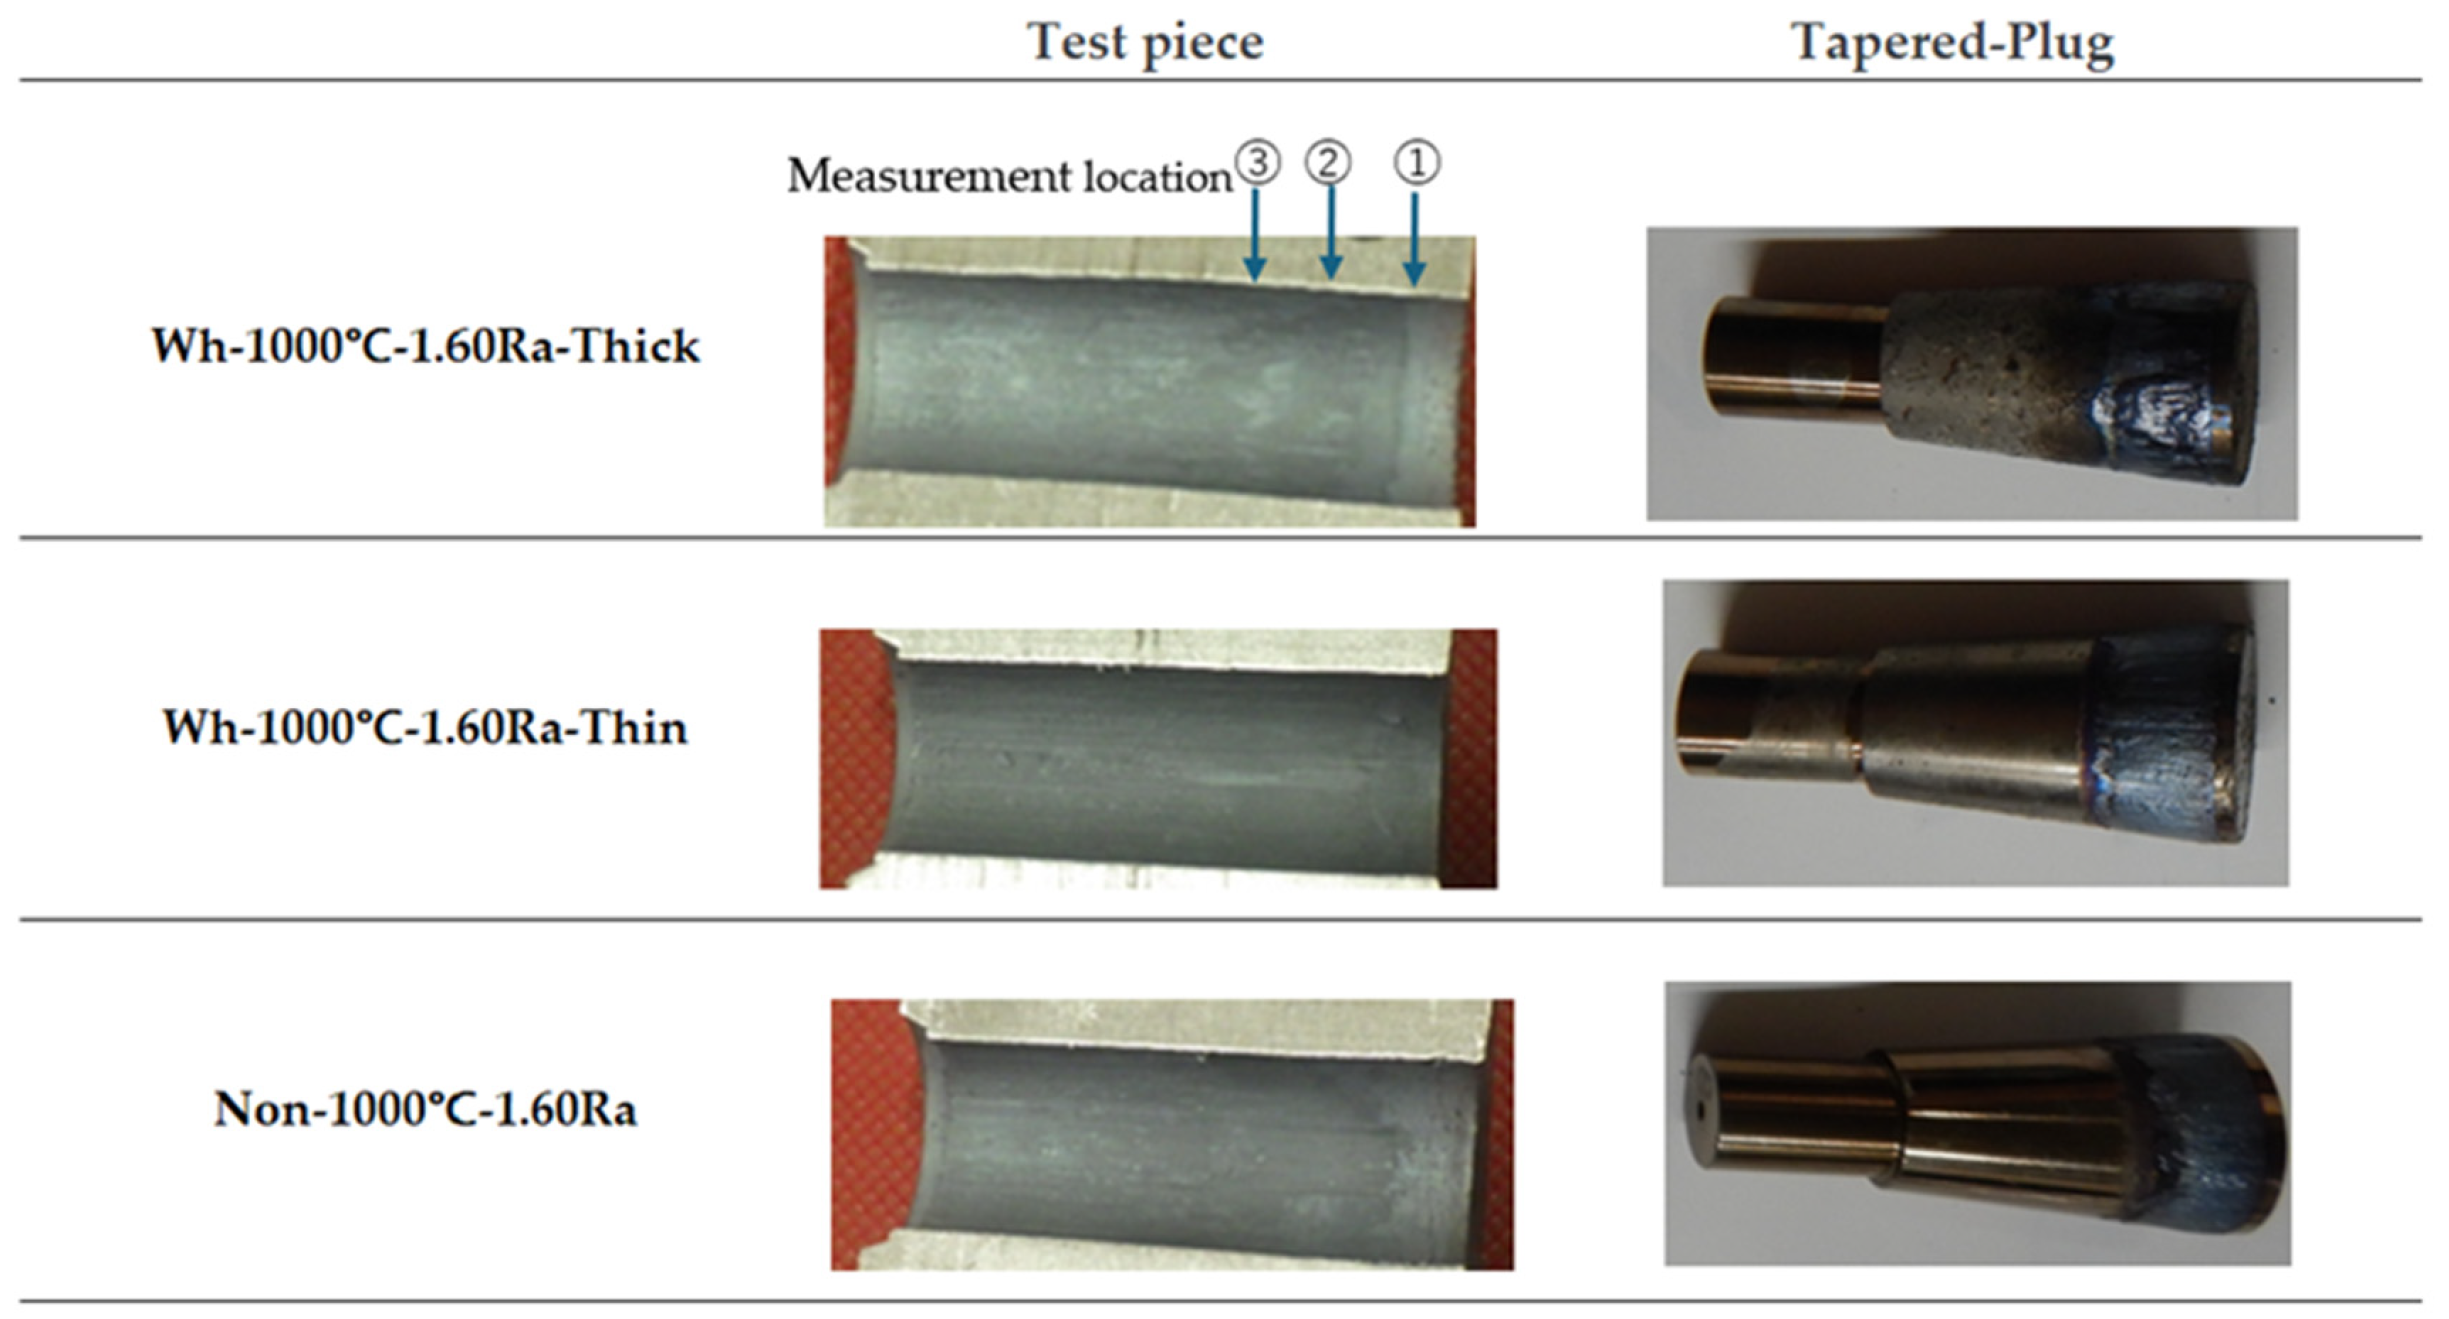
In the tapered plug penetration test, instances were noted where the load sharply increased, reaching a level comparable to that under non-lubricated conditions, despite using a lubricant-coated tapered plug. This indicated that during the penetration of the tapered plug into the high-temperature specimen, the lubricant on the plug became insufficient, leading to a state similar to non lubrication. Consequently, efforts were made to identify the elements originating from the lubricant components on the inner surface of the specimen through which the tapered plug passed. Surface analysis was conducted using a scanning electron microscope (SEM, JSM-IT800) (JEOL Ltd., Akishima, Tokyo, Japan) equipped with an energy-dispersive X-ray spectroscopy (EDS) system. EDS is a technique for elemental analysis that allows the identification of elements at specific locations on a specimen’s surface observed at high magnification [16]. The white lubricant utilized in this study contained Na2B4O7·10H2O. Boron (B) is a light element with limited detection sensitivity, while sodium (Na) is more easily detected than boron and was not present in the steel material. Hence, sodium was chosen as the tracer element for detection on the inner surface of specimens post-testing.
The measurement positions were at distances of 5, 15, and 20 mm from the specimen inlet side in the direction of tapered plug penetration after the tapered plug rubbed against the specimen surface. The test specimens and measurement locations are illustrated in Figure 10. The EDS results are summarized in Table 6, where the values represent the detected amounts. When the lubricant application amount was small (Wh-1000 °C-1.60Ra-Thin, 2.0 g/m2), Na was below the detection limit at all measurement positions, and the results were indistinguishable from those under non-lubricated conditions (Non-1000 °C-1.60Ra) used as a background analysis. By contrast, when the lubricant application amount was 20.9 g/m2 and the lubricant film was thick (Wh-1000 °C-1.60Ra-Thick), 0.18% Na was detected at a stroke of s = 5 mm, whereas only trace amounts of Na were detected at strokes of s = 15 mm and s = 20 mm. These results suggested that, in the case of Wh-1000 °C-1.60Ra-Thin with a thin lubricant film, only a very small amount of lubricant remained on the inner surface beyond a stroke of 15 mm.

4.2. Analytical Results of the Hot Tapered Plug Penetration Test

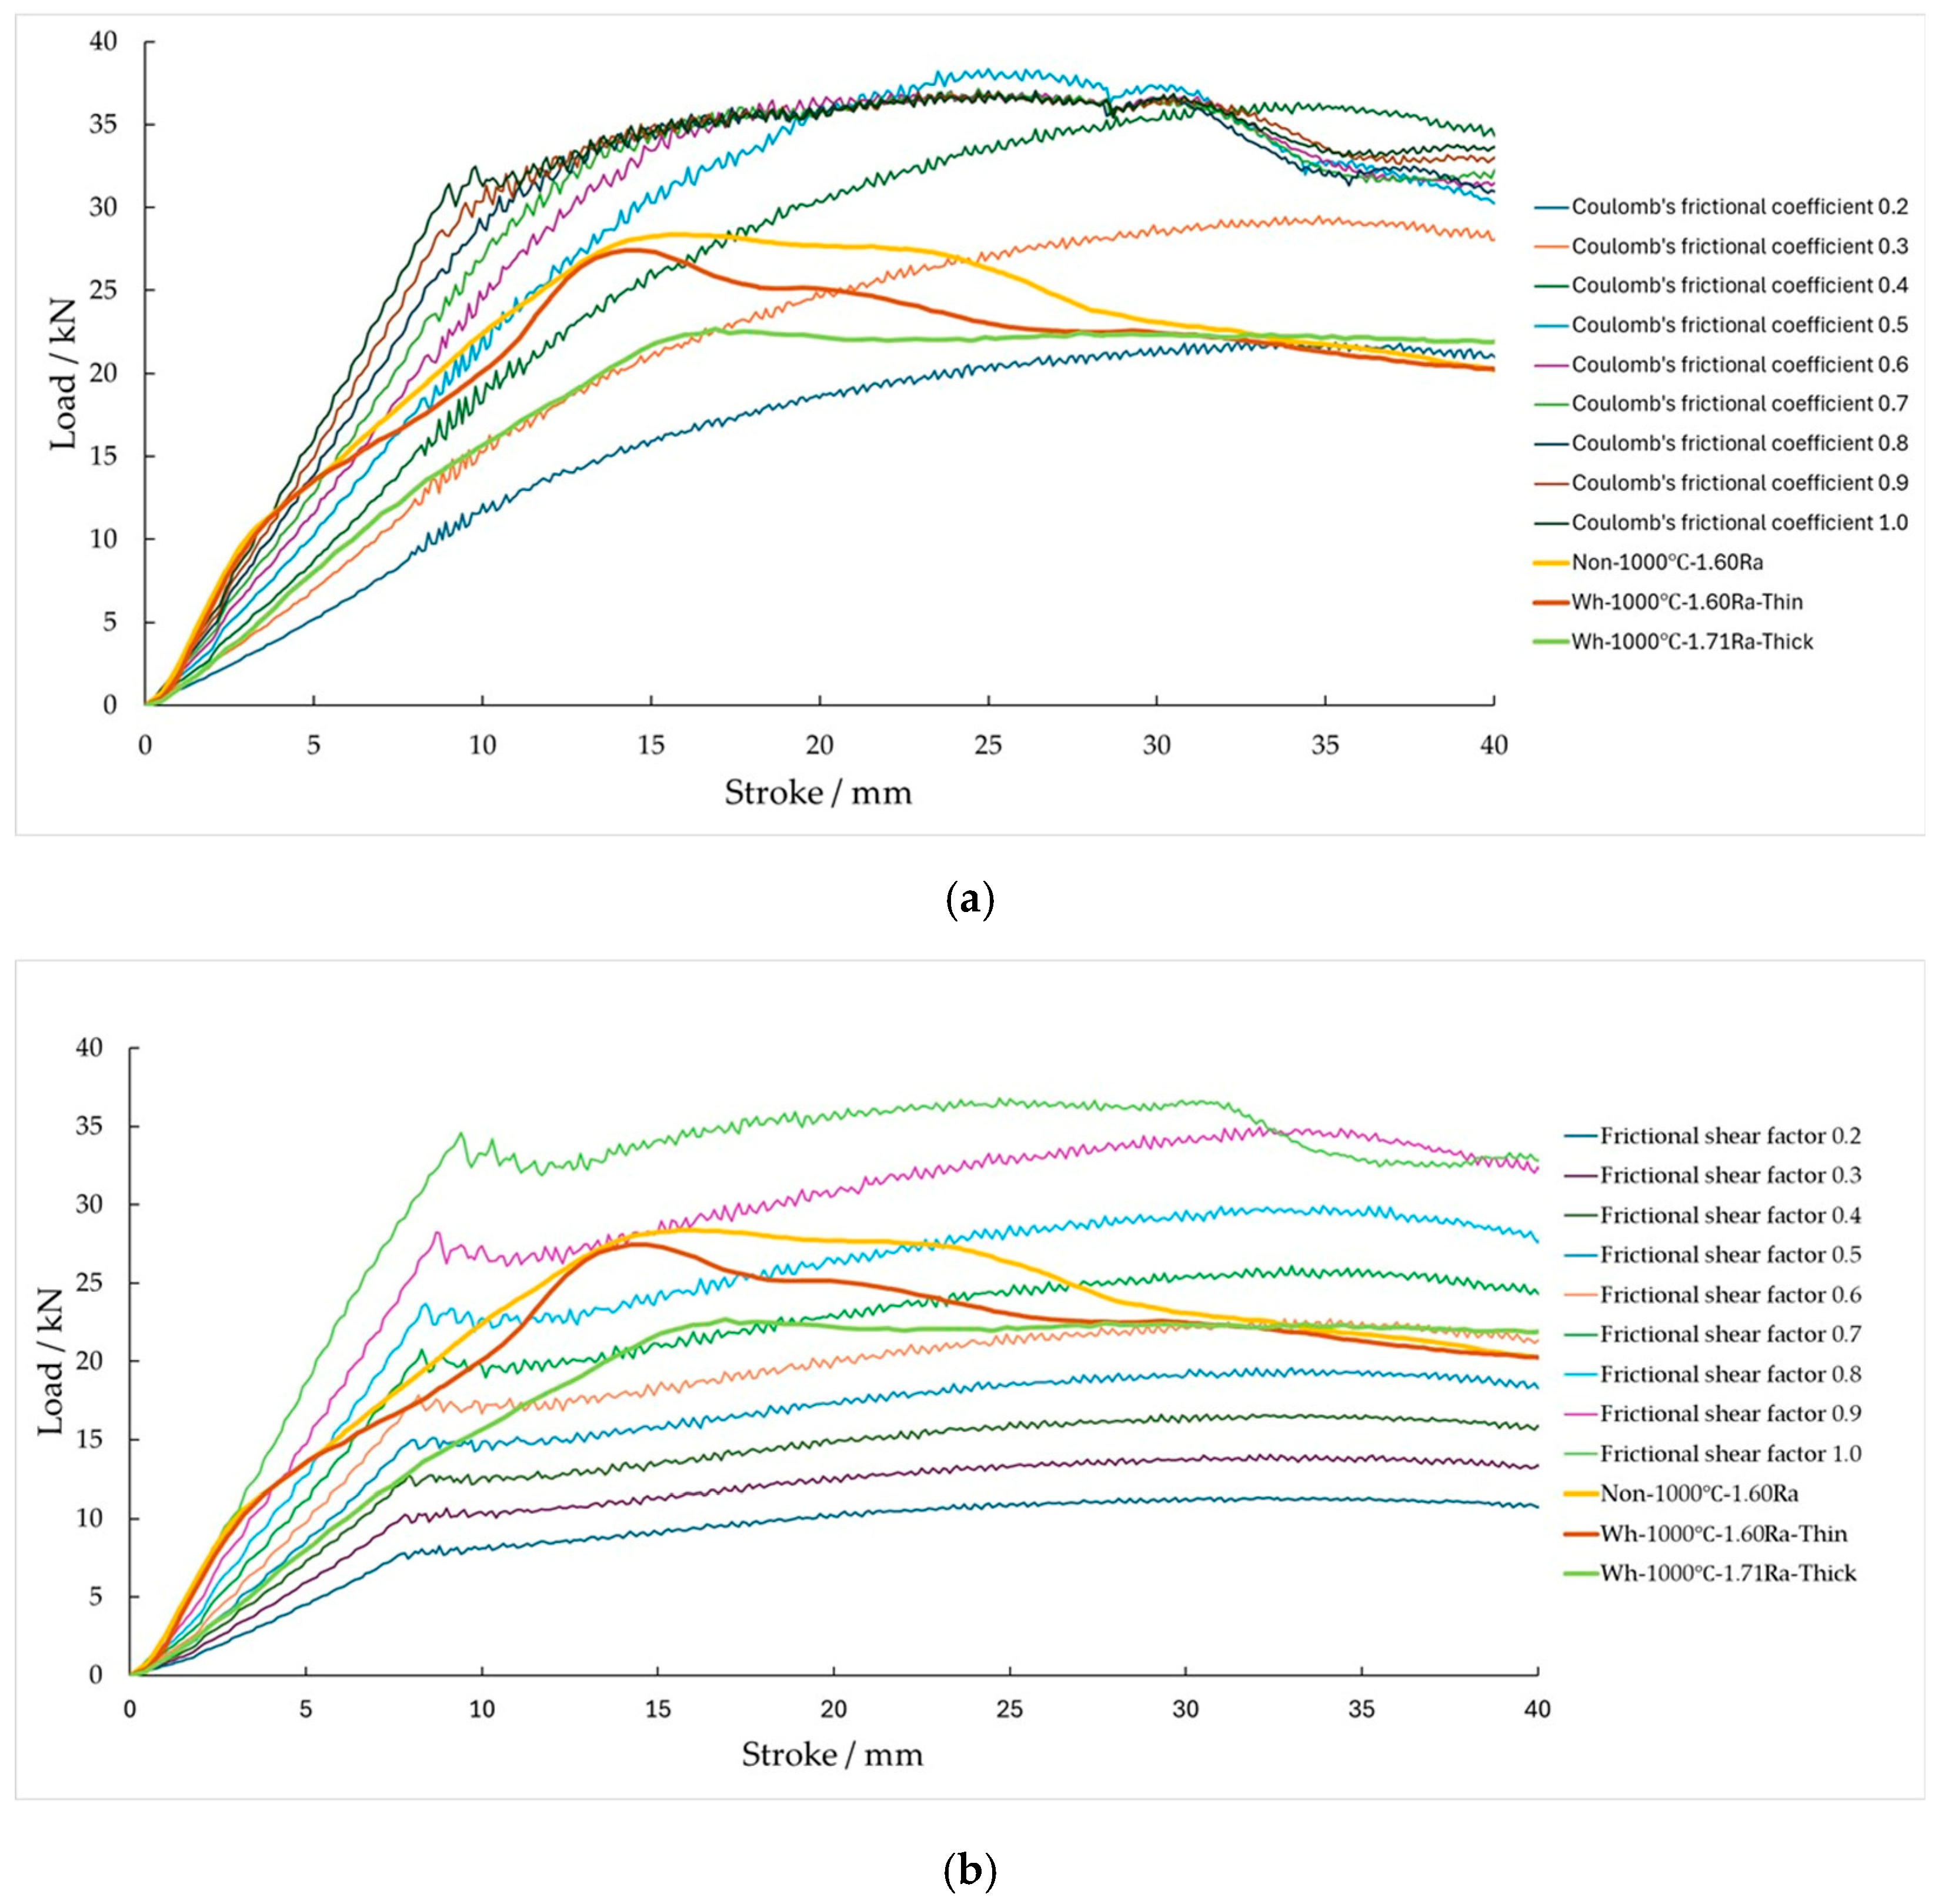
The experimental results of the hot tapered plug penetration test were compared with the analytical results. The analytical conditions are detailed in Table 7. The analysis utilized the commercial finite element analysis software DEFORM-3D. In hot forming simulations, the heat transfer coefficient setting significantly impacts simulation accuracy. Heat transfer among the billet, die, and atmosphere results in billet temperature reduction, leading to increased flow stress, contact pressure, and forging load [17]. The heat transfer coefficient values in this study were determined based on the existing literature [18,19]. A coupled thermomechanical analysis was conducted using the flow stress data depicted in Figure 3. Considering the substantial influence of friction at the die–billet contact interface on the analytical outcomes, calculations were performed under varying friction conditions. It was assumed that the Coulomb’s friction coefficient and the shear friction coefficient remained constant during tapered plug penetration, with calculations conducted by adjusting the value of each coefficient from 0.1 to 0.9 in 0.1 increments. The results of the coupled thermomechanical analysis with the Coulomb’s friction coefficient ranging from 0.1 to 0.9 are presented in Figure 11a. Similarly, the analytical outcomes with the shear friction coefficient varying from 0.1 to 0.9 are illustrated in Figure 11b.
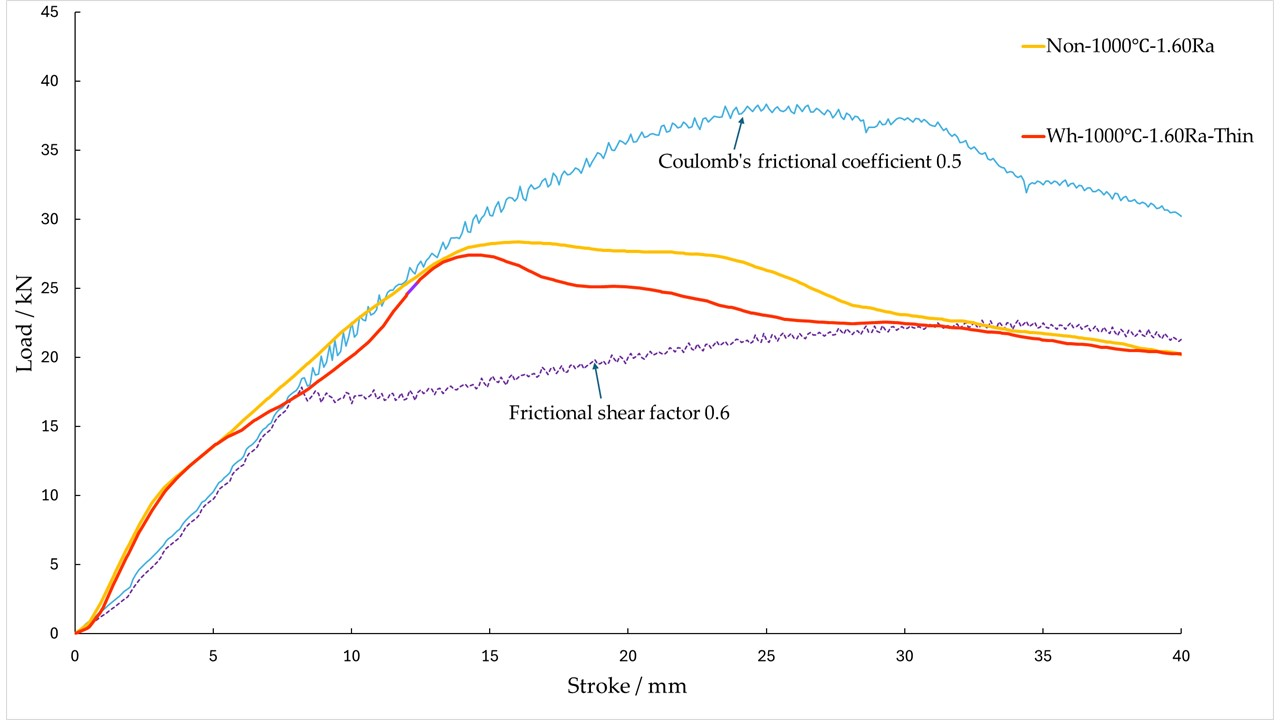
Figure 12 illustrates a comparison between the analytical results and the experimental results obtained under high-friction conditions, specifically the non-lubricated conditions (Non-1000 °C-1.60Ra) and the thin-lubricant-film conditions (Wh-1000 °C-1.60Ra-Thin), as detailed in Section 3.3.3. The inner and bottom surfaces of the specimen were in contact with the die, while the outer surface remained free during the test. Initially, plastic deformation did not occur near the bottom surface; thus, plastic flow extended outward from the contact region between the tapered plug and specimen. The axial backward plastic flow and friction between the tapered plug and specimen influenced the penetration load. The friction conditions were determined as the die was withdrawn after shaping the specimen, with friction identified for strokes up to 40 mm while the die maintained contact with the specimen.
Under conditions with a sufficiently thick lubricant film (Wh-1000 °C-1.71Ra-Thick and Wh-1000 °C-1.60Ra-Thick), the load at a stroke of 3 mm was approximately half of that under the non-lubricated or thin-lubricant-film conditions. This clearly indicated the load-reducing effect of lubricant Wh in the initial stage of penetration, which corresponded to friction reduction. As the stroke increased further, up to approximately 15 mm, the load under thick-lubricant-film conditions remained lower than that under non-lubricated or thin-lubricant-film conditions. Up to this stage, the load reduction could be attributed to the effect of the remaining lubricant on the inner surface, as indicated by the surface analysis results. The load–stroke curves in the region where the lubricant was effective were lower than the predicted loads obtained using the shear friction coefficient. Instead, similar load variations were observed in the FEM results obtained using the Coulomb’s friction coefficient. However, beyond a stroke of approximately 15 mm, the experimental load values did not increase as much as the FEM results calculated using the Coulomb’s friction coefficient, and instead became constant or began to decrease.
Assuming that the frictional behavior adhered to the Coulomb friction model in the presence of sufficient lubricant, a Coulomb’s friction coefficient of 0.3 could be applied in this scenario. It was also assumed that the frictional behavior shifted to the Tresca friction model as the lubricant film diminished beyond a stroke of 15 mm, where a shear friction coefficient of 0.6 was deemed suitable. Similarly, for Wh-1000 °C-1.60Ra-Thick under similar conditions, utilizing the Coulomb friction model up to a stroke of approximately 15 mm resulted in a Coulomb’s friction coefficient of μ = 0.3, while transitioning to the shear friction law beyond 15 mm corresponded to a value of m = 0.6.
The experimental results under non-lubricated conditions (Non-1000 °C-1.60Ra) indicated higher loads compared to those under lubricated conditions. It is reasonable to infer that the friction between the tapered plug and the specimen was greater without a lubricant-coated plug, leading to increased load. Nevertheless, even under non-lubricated conditions, adhesion friction may not have necessarily manifested, as the thick oxide scale developed on the billet surface at 1000 °C was anticipated to impact friction.
For the non-lubricated conditions (Non-1000 °C-1.60Ra) and the conditions with a thin lubricant film (Wh-1000 °C-1.60Ra-Thin), both showing significant load increases, a notable feature was the rapid load rise at the beginning of penetration. A comparison of these results with the FEM analysis did not reveal matching load curves based on the Coulomb’s friction coefficient. However, some load variations in the FEM results, assuming a high shear friction coefficient, aligned with the experimental findings. Hot forging often leads to increased die–material adhesion compared to cold forging, potentially resulting in direct die–material contact under non-lubricated conditions. Assuming conditions akin to sticking friction with m ≈ 1 yielded load curves that closely resembled experimental values. Similarly, even with a thin lubricant film, a sharp load increase akin to non-lubricated conditions was observed, with loads resembling the FEM results using high m values. These outcomes suggested that in the absence of lubrication or with an extremely thin film, friction reduction was inadequate, leading to sticking-like conditions due to direct die–material contact. Under such poor lubrication conditions, where the tapered plug became stuck in the specimen hole at a 12 mm stroke, it was concluded that a friction model like the Tresca friction model, which assesses the relationship between the internal shear strength of a soft material and the surface frictional force, was more suitable.
From the above discussion, the analytical results obtained using a constant Coulomb’s friction coefficient of 0.5 and a constant shear friction coefficient of 0.6 demonstrated good agreement with the experimental results. However, up to a stroke of approximately 10 mm, a Coulomb’s friction coefficient of 0.5 provided a closer match, while in the latter half of the stroke, a shear friction coefficient of 0.6 became more appropriate, resulting in discrepancies in the load curve over the entire stroke. As discussed in Section 4.1, it was inferred that the lubricant almost completely disappeared after a stroke of approximately 10 mm, leading to similar high-friction conditions for both the non-lubricated and Wh cases. Therefore, the frictional behavior in the high-friction region of hot forging cannot be accurately reproduced using a single friction law with a constant friction coefficient.

4.3. Identification of Friction Coefficients Through Comparison with Analytical Results of the Hot Tapered Plug Penetration Test

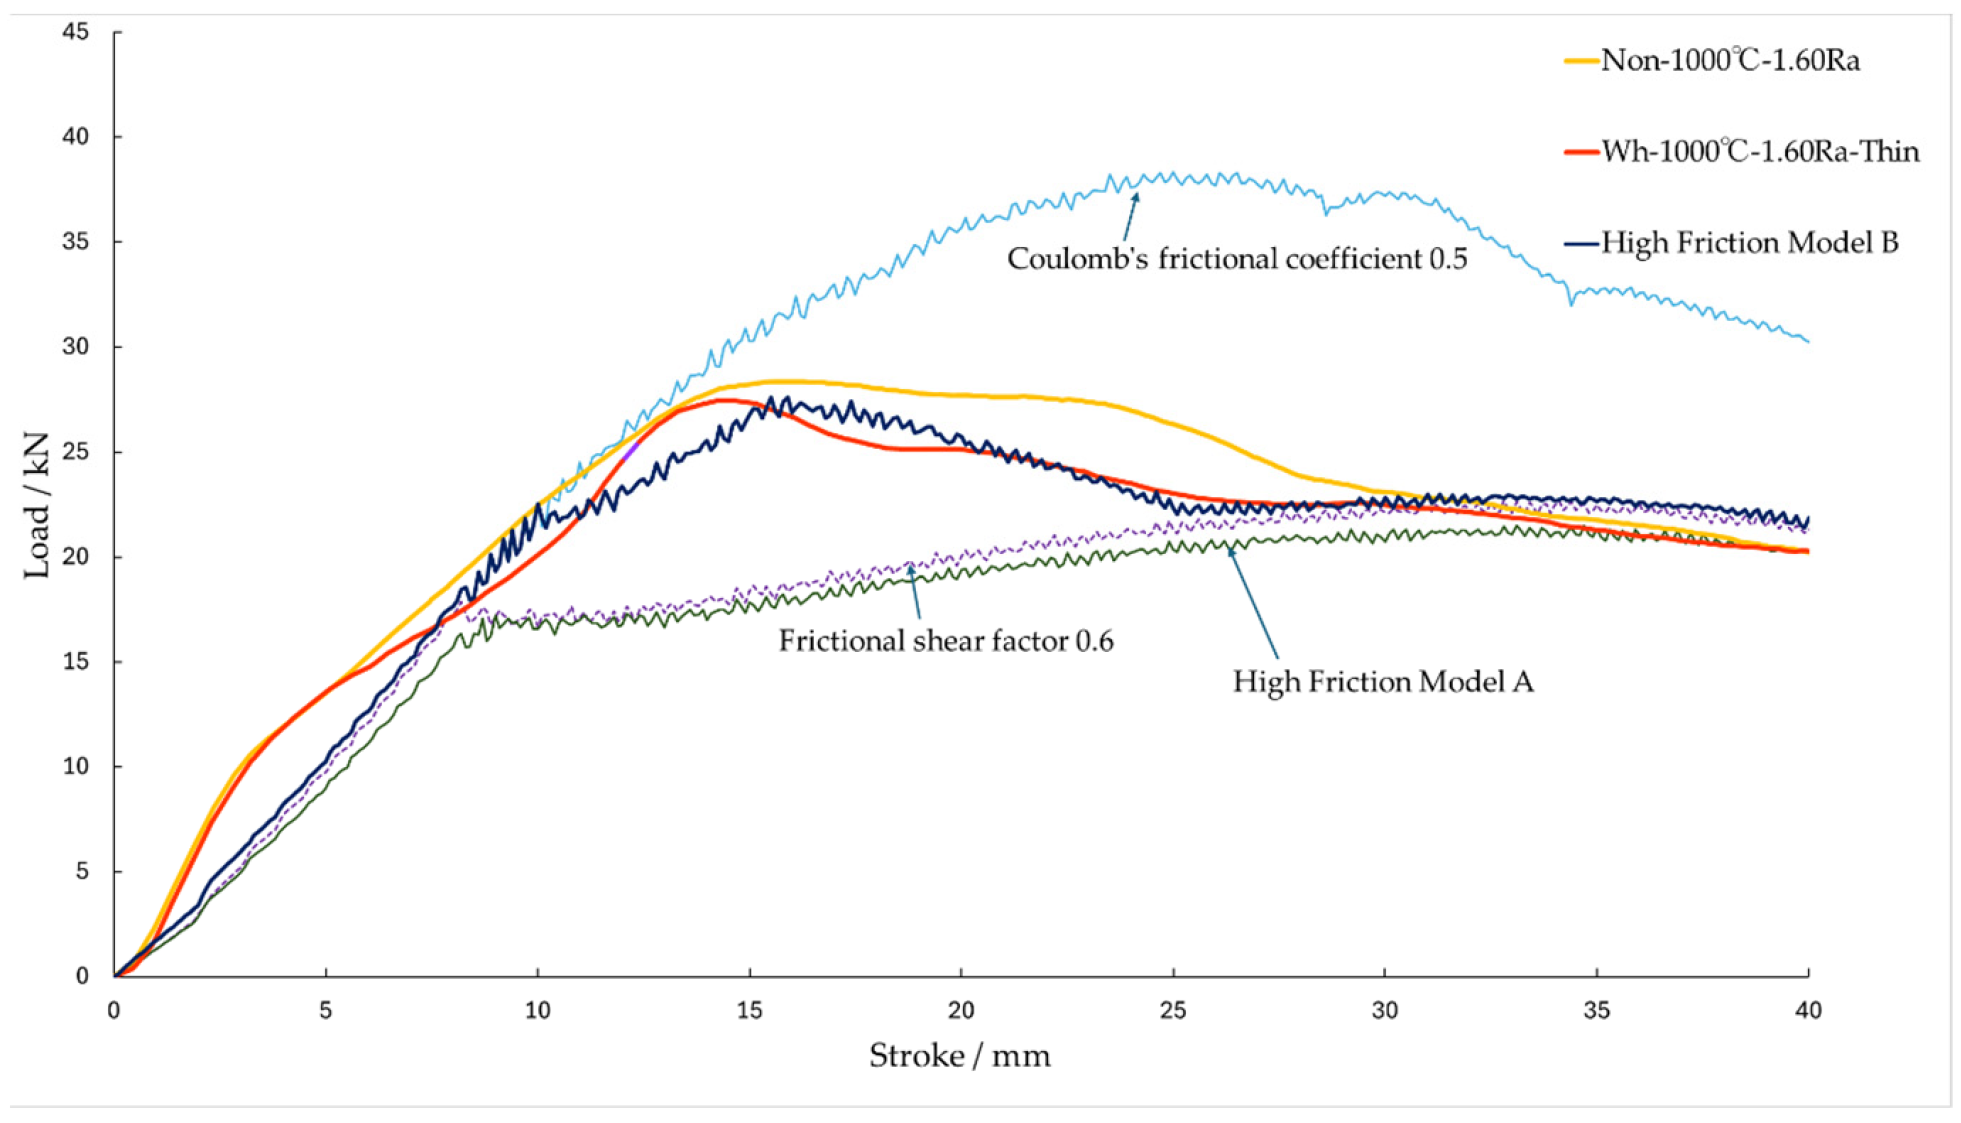
The analysis software DEFORM-3D utilized in this research incorporates a standard feature that switches the friction coefficient by comparing the magnitude of the frictional shear stress (τ) obtained from the Coulomb’s friction coefficient (μ) and the shear friction coefficient (m). This is denoted as Model A. Furthermore, Wang et al. illustrated through a high-contact-pressure friction test method under cold conditions [20] that once the contact pressure reached a critical value “pcr,” the frictional behavior shifted from Coulomb’s friction coefficient “μ” to the shear friction coefficient “m,” referred to as Model B. The high-friction models employed in this investigation are outlined in Table 8. For both models, Coulomb’s friction coefficient “μ” was fixed at 0.5, and the shear friction coefficient “m” was set to 0.6. The contact pressure exerted on the specimen during the forming process is represented as “p,” and the shear yield stress is denoted as “k.” Assuming the relevance of these high-friction models to hot forging, the analytical outcomes derived from the application of each model are depicted in Figure 13.
For Model A, the results did not align with the experimental outcomes for both the non-lubricated and Wh conditions. In a high-contact-pressure test like the hot tapered plug penetration test, it is believed that significant contact pressure occurs early in the stroke, leading to a transition to the condition μp > mk. Consequently, the friction conditions corresponded to a shear friction coefficient of 0.6 at an early stage. By contrast, Model B exhibited load transitions that closely mirrored the experimental results for both the non-lubricated and Wh conditions. The calculations involved varying critical contact pressures, with the best agreement observed when the critical contact pressure was pcr = 130 MPa.
From these results, it was concluded that the high-friction model in hot forging can be identified as a model in which the friction condition transitions from a Coulomb’s friction coefficient of 0.5 to a shear friction coefficient of 0.6 at a critical contact pressure of pcr = 130 MPa.

5. Application of the High-Friction Model to the Flash Region of the Crankshaft Die

5.1. Hot Forging Process of the Crankshaft

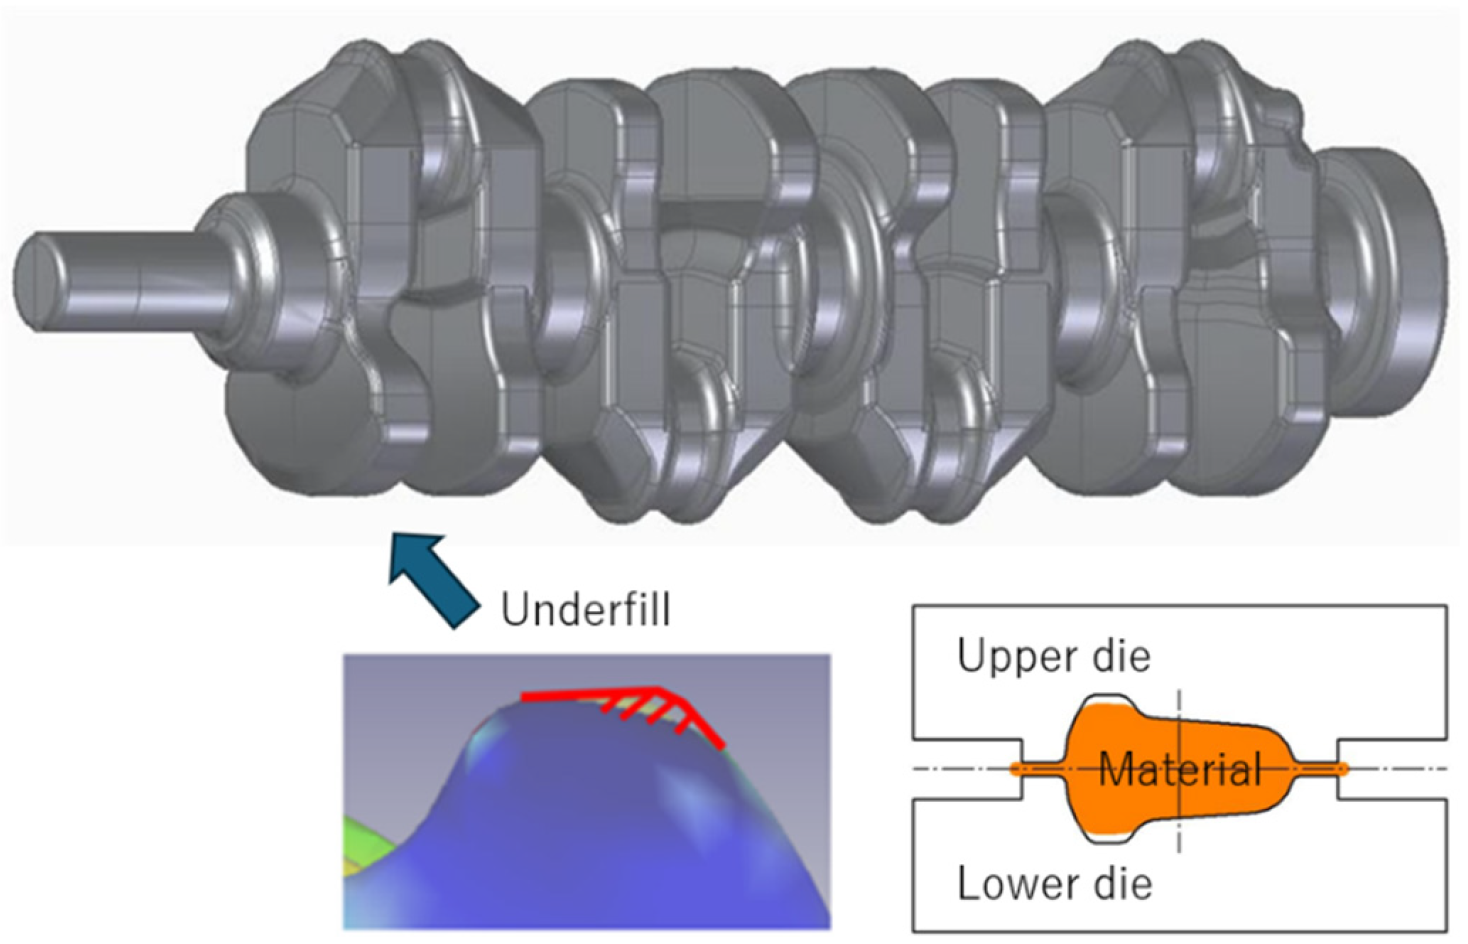
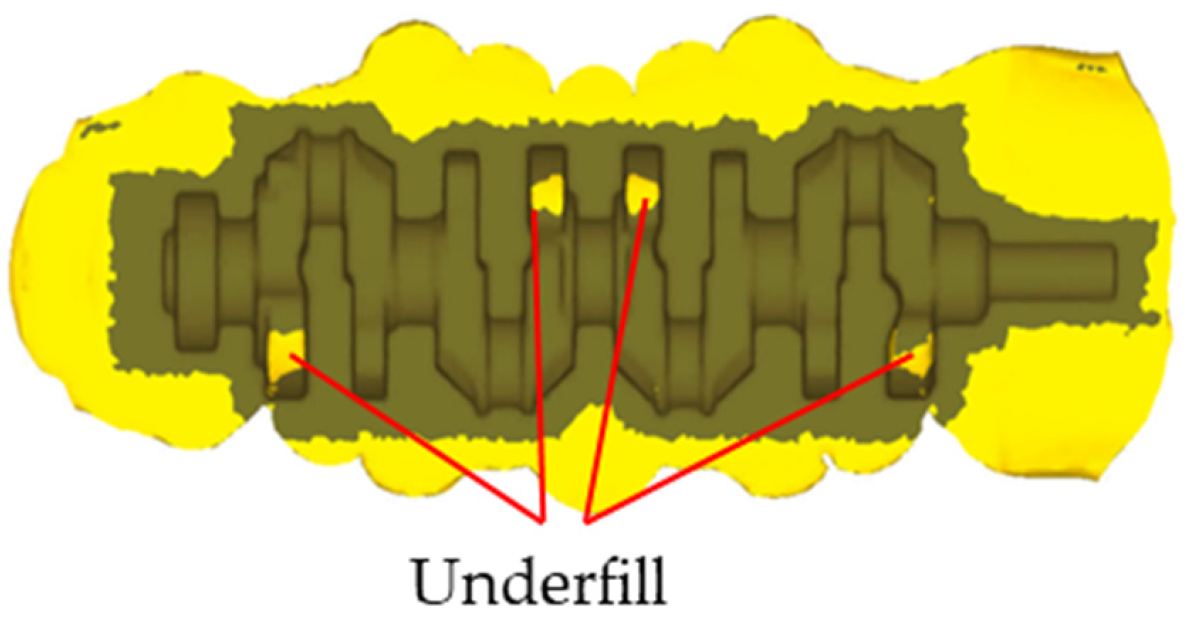
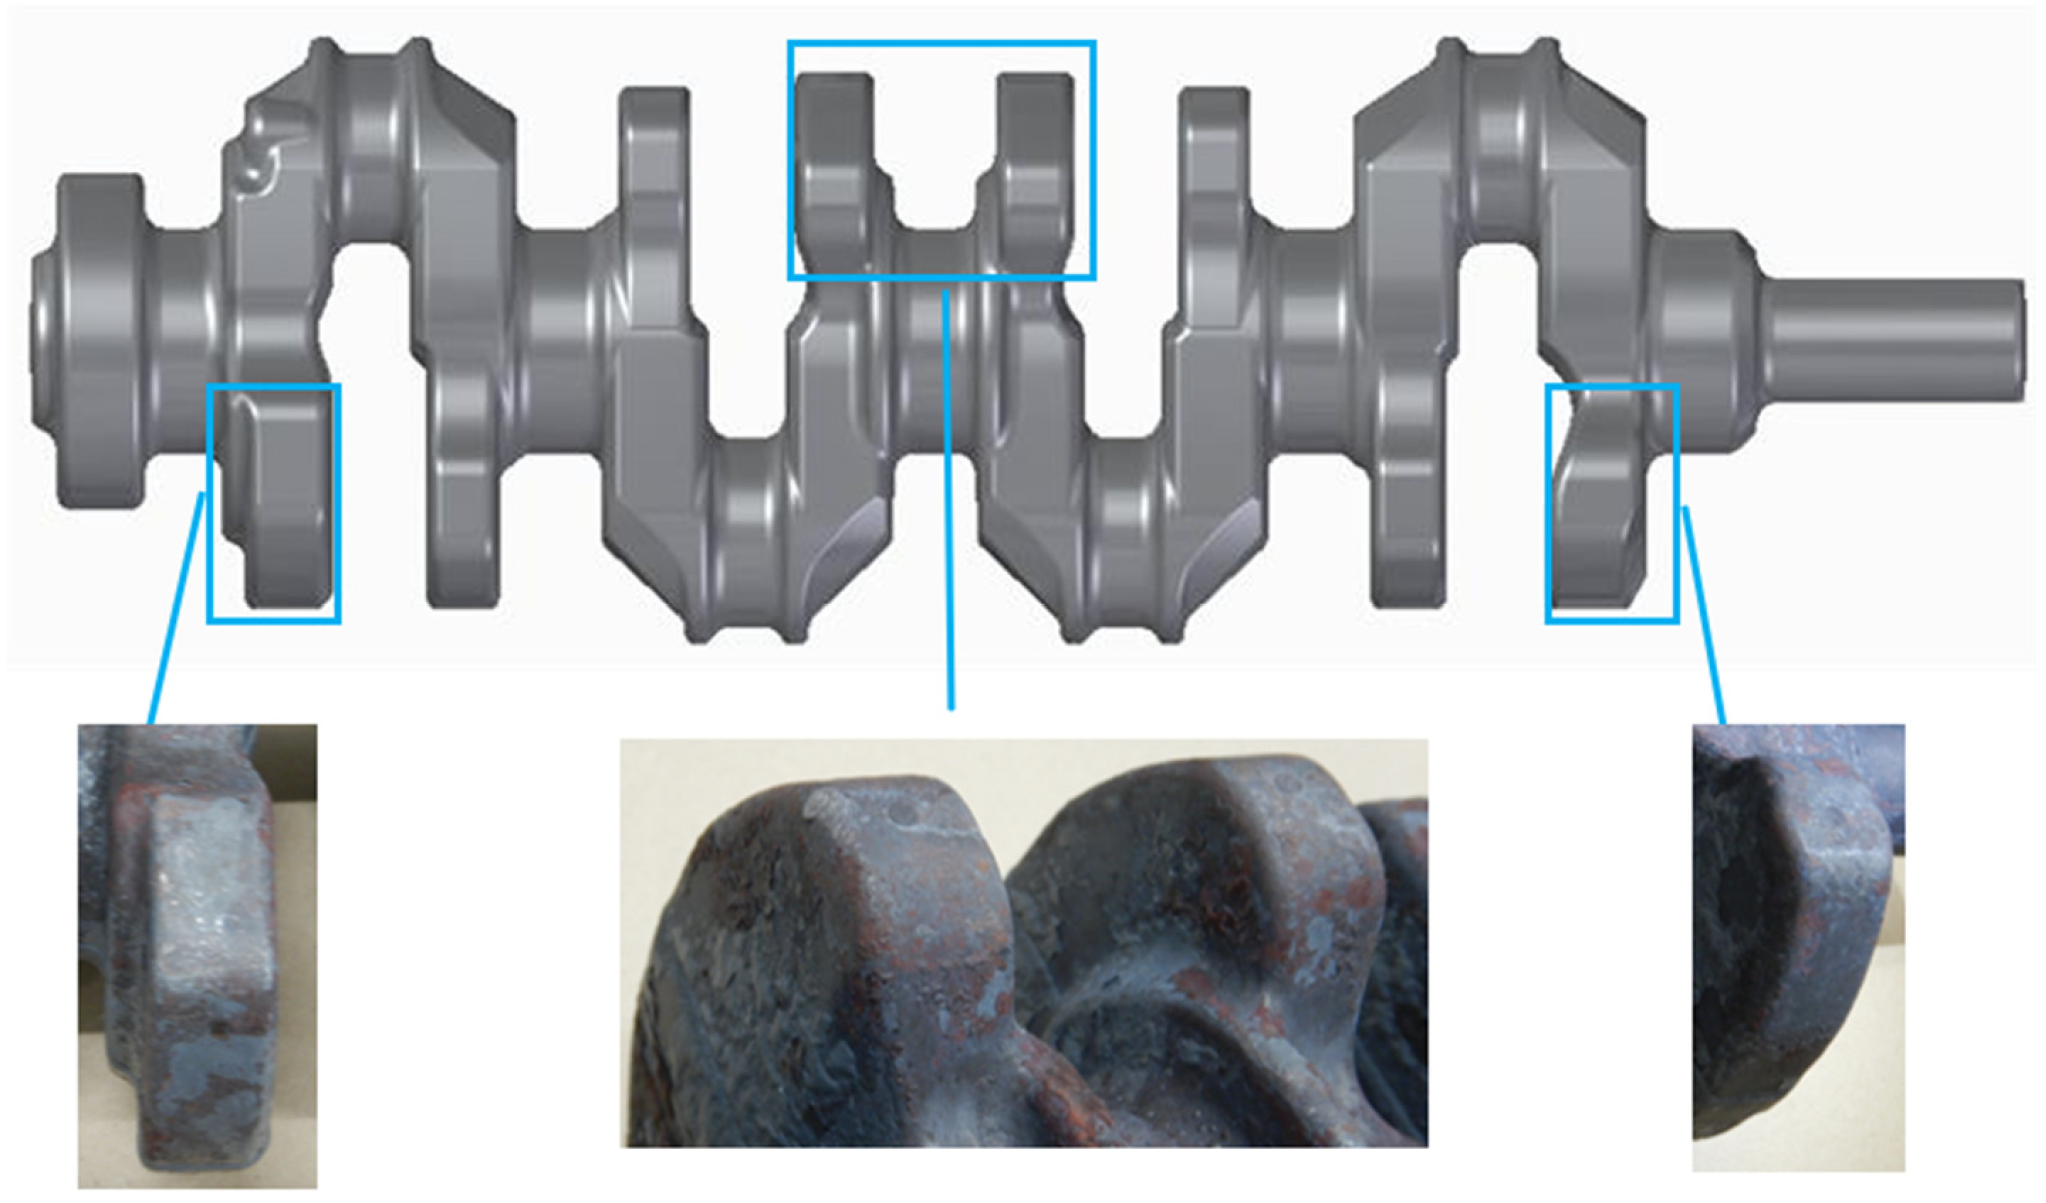
The hot forging process of the crankshaft examined in this study comprised the four stages of upsetting, blocker forging, finish forging, and trimming (flash removal), following the heating of a cylindrical bar billet to 1200 °C. Figure 14 illustrates the crankshaft of an inline four-cylinder engine. Challenges arise during forging in filling the counterweight region’s tip adequately, often leading to underfill defects.
There are various approaches for improving the occurrence of underfill defects. One possible method is to modify the die geometry; however, this requires significant design effort and additionally higher cost. Another approach is to increase the material size or weight, but this is not desirable from the viewpoint of resource efficiency and would also increase the material cost. For these reasons, such approaches are not as easy to implement as practical improvements in production. In this study, therefore, we focused on improving underfill defects by modifying the lubrication conditions, which can be more easily controlled but are more sensitive in the forging process. To address this issue, a closed-die forging technique was applied during the blocker and finish forging processes, incorporating a flash region between the upper and lower dies. This approach facilitated the creation of intricate shapes by allowing excess material to flow into the flash region. The analysis presented in Table 3 indicates significant material flow within the flash region, designating it as a high-friction area. The efficacy of the proposed friction model was evaluated within this specific region.
Based on the analytical results presented in Figure 13, it was deduced that the frictional state transitioned to a shear friction coefficient of 0.6 when the lubrication film ruptured at a later phase of the stroke. With reference to this finding, the lubrication status during the mass production of crankshaft forgings was presumed to be similar to the conditions of Wh-1000 °C-1.60Ra-Thin. Assuming this scenario, the frictional state in the high-sliding-distance zone of the die flash area could be approximated using high-friction Model B, as outlined in Section 4.3. By employing this model, the efficacy of selecting friction models based on the predominant friction conditions in distinct die regions was examined.

5.2. Analytical Conditions for Hot Forging of the Crankshaft

Deformation simulations were carried out using Coulomb’s friction coefficient and the shear friction coefficient, which were estimated from the ring compression and tapered plug penetration tests. The forgeability of the crankshaft was assessed through finite element analysis, utilizing DEFORM-3D for the forming simulations. Given that the crankshaft material was Steel A (Table 1), the flow stress was determined by extrapolating the flow stress data at 1200 °C from Figure 3. The primary aim of this analysis was to explore the impact of various friction conditions; hence, thermal calculations were excluded, and isothermal forming analyses at 1200 °C were conducted.
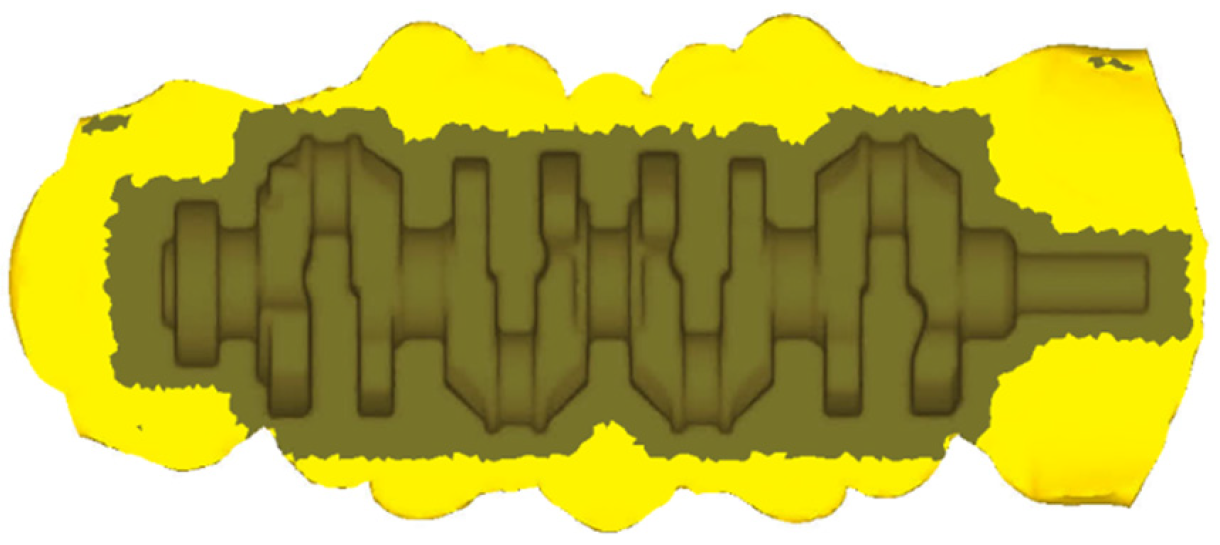
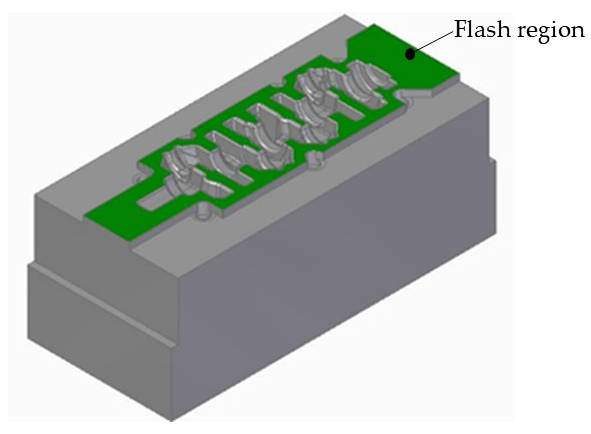
In the analyses, two calculation conditions were compared: one applying a constant Coulomb’s friction coefficient of 0.14 to the entire die surface, and another using a high-friction model solely for the flash region in Figure 15. The Coulomb’s friction coefficient of 0.14 was determined from the hot ring compression test detailed in Section 3.2. The former conditions represented the traditional analytical approach. Previous studies have indicated that the friction coefficient in hot forging typically falls within the range of μ = 0.15 to 0.2 in terms of Coulomb’s friction coefficient. The latter conditions introduce the approach proposed in this study. For the high-friction model, a frictional transition from a Coulomb’s friction coefficient of 0.5 to a shear friction coefficient of 0.6, as outlined in Section 4.2, was employed. A Coulomb’s friction coefficient of 0.14 was utilized for all die regions except the flash region.
Figure 15. Application range of the high-friction model in the crankshaft die.
Lubricants 14 00133 g015

5.3. Analysis of the Crankshaft Using the High-Friction Model

Figure 16 and Figure 17 depict the simulation results for the entire forging process of the crankshaft. Figure 16 illustrates the outcomes using the traditional analytical approach, employing a constant Coulomb’s friction coefficient of 0.14. This approach led to underfill in the counterweight area during both the blocker and finish forging processes. Conversely, Figure 17 displays the analytical findings utilizing the high-friction model. In this scenario, the material successfully filled the die cavity during the finish forging phase, eliminating underfill. The enhanced frictional resistance in the flash zone of the die facilitated material flow into the die cavity, aligning with the product’s shape and ensuring adequate filling of the counterweight region.
Figure 18 displays a photograph of the crankshaft manufactured in mass production. Consistent with the analytical findings from the high-friction model, the counterweight area was completely filled. The application of the high-friction model, as suggested in this study, effectively replicated adequate filling of the counterweight region, aligning with the real production output. This replication enabled a more precise forecast of the ultimate product shape.

6. Conclusions

By conducting a hot tapered plug test, the friction conditions in the high-friction region of hot forging were determined. Applying these conditions to the flash region of an actual crankshaft die structure enhanced the accuracy of the forming simulation. The findings of this study can be summarized as follows:
  • In the hot ring compression test, the friction coefficient for the product die cavity region of the crankshaft, known for its short sliding distance, was determined. Furthermore, the relationship between lubricant film thickness and Coulomb’s friction coefficient was examined. It was observed that Coulomb’s friction coefficient decreased as the amount of adhered lubricant increased. However, beyond a certain threshold of lubricant adhesion weight, the friction coefficient did not decrease further.
  • The friction coefficient was estimated during the initial stroke when the lubricant was present, utilizing a tapered plug test and elemental analysis of the specimens. According to the experimental findings obtained under lubrication conditions resembling mass production of the crankshaft, the friction coefficient in the high-sliding-distance area of the flash part of the die changed from Coulomb (0.5) to shear (0.6).
  • Applying the friction coefficient transition obtained from these experimental results to the forming analysis of hot-forged crankshafts enabled accurate reproduction of the product’s shape under mass production conditions.
  • As shown in this study, in crankshaft forging, the contact pressure and sliding distance differ depending on the region. Future work will focus on understanding the underlying physical phenomena associated with region-specific lubricant application according to the die temperature, surface roughness, flash geometry, and lubricant degradation, with the aim of continuing this research until it can be applied in an actual production line.

7. Future Work

(1) Clarification of the applicability of the proposed friction model
In this study, the friction conditions in the high-friction regime were identified by focusing on the flash region during hot semi-closed die forging with flash formation. Elemental analysis of the lubricant residue confirmed lubricant depletion during forging. Furthermore, by combining the experimental results with numerical simulations, it was clarified that when the contact pressure between the workpiece and die reached 130 MPa, the frictional behavior transitioned from a Coulomb’s friction coefficient of 0.5 to a shear friction coefficient of 0.6. These findings provide useful data that can improve the accuracy of crankshaft forging simulation predictions used in practical die design.
However, even though the transition of the friction coefficient was elucidated under specific conditions simulating severe crankshaft forging environments, such as the hot forging temperature range, high contact pressure, long sliding distance, and use of a white lubricant (Wh), the applicability range of this model has not been fully defined. Furthermore, the impacts of oxide scale formation, lubricant combustion, decomposition, and melting due to heat on the friction coefficient remain unclear. The initial amount of lubricant may have also affected the rate of lubricant depletion based on the processing conditions (temperature, sliding distance, and contact pressure), consequently influencing the critical contact pressure of 130 MPa. Therefore, investigating the influences of these parameters and their respective contributions is crucial for clarifying the applicability of the proposed friction model in the future.
(2) Effects of region-specific lubricant application on the die surface
Traditionally, lubricants are uniformly applied over the entire die surface. Recent studies have indicated that applying lubricants based on specific regions, taking into account local die temperatures and contact conditions, can be more effective [21,22]. Subsequent research will concentrate on developing optimal lubricant application approaches for distinct die regions to enhance both die longevity and product quality.
(3) Effects of surface conditions in the die flash region
The results from the hot tapered plug penetration tests indicated that smooth, polished die surfaces tend to retain less lubricant, resulting in an elevated friction coefficient and accelerated wear. In this study, the impact of die surface roughness was assessed by varying the surface roughness in a simplified manner. To predict the friction properties of low-viscosity lubricants like white lubricants, it is crucial to account for lubricant retention on the die surface [23]. Hence, forthcoming research should explore the surface roughness of various die regions under real production conditions.

Author Contributions

Conceptualization, K.N., A.W., K.K. and F.I.; methodology, K.N., A.W., K.K. and F.I.; software, K.N., A.W. and K.K.; validation, K.N., A.W., K.K. and F.I.; formal analysis, K.N., A.W. and K.K.; investigation, K.N., A.W. and K.K.; resources, K.N.; data curation, K.N.; writing—original draft preparation, K.N.; writing—review and editing, A.W. and K.K.; visualization, K.N.; supervision, A.W., K.K. and F.I. All authors have read and agreed to the published version of the manuscript.

Funding

This research received no external funding.

Data Availability Statement

It is not necessary to share research data beyond what has already been included in the manuscript.

Conflicts of Interest

Author Kimika Nakamura was employed by the company Nissan Motor Co., Ltd. Author Atsuo Watanabe was employed by the company Daido Steel Co., Ltd. The remaining authors declare that the research was conducted in the absence of any commercial or financial relationships that could be construed as a potential conflict of interest.

References

  1. Nakamura, K.; Matsunae, H.; Watanabe, A.; Ishii, K. Quality improvement of crank forging line using IoT technology. PLASTOS 2023, 6, 750–754. [Google Scholar]
  2. Vazquez, V.; Altan, T. Die design for flashless forging of complex parts. J. Mater. Process. Technol. 2000, 98, 81–89. [Google Scholar] [CrossRef] [Scilit]
  3. Behrens, B.A.; Nickel, R.; Müller, S. Flashless precision forging of a two-cylinder-crankshaft. Prod. Eng. Res. Devel. 2009, 3, 381. [Google Scholar] [CrossRef] [Scilit]
  4. Altan, T.; Ngaile, G.; Shen, G. Cold and Hot Forging: Fundamentals and Applications; ASM International: Materials Park, OH, USA, 2005. [Google Scholar]
  5. Kakimoto, H.; Nagata, T.; Takahara, K.; Takahashi, Y.; Mori, H. 3-D deformation analysis of crankshaft forging process using FEM. In Proceedings of the JSME Annual Conference, Tokushima, Japan, 5–8 August 2003; No. 03-1. pp. 467–468. [Google Scholar]
  6. Kitamura, K.; Asai, K. Evaluation method of lubrication performance for hot forging processes. Plus Times (J. JSTP) 2019, 2, 8–13. [Google Scholar]
  7. Kitamura, K.; Asai, K. Estimation of friction coefficient between tool and workpiece in cold extrusion and hot ring compression using FEM analysis. Plus Times (J. JSTP) 2021, 4, 18–23. [Google Scholar]
  8. Sawamura, M.; Yogo, Y. Evaluation of hot forging lubricants for steel by ring compression test with rotating die. J. JSTP 2020, 61, 233–238. [Google Scholar] [CrossRef] [Scilit]
  9. Kudo, H. An Analysis of Plastic Compressive Deformation of Lamella between Rough Plates by Energy Method. In Proceedings of the 5th Japan National Congress for Applied Mechanics; Japan National Committee for Theoretical and Applied Mechanics, Science Council of Japan: Tokyo, Japan, 1955; pp. 75–78. [Google Scholar]
  10. Male, A.T.; Cockcroft, M.G. A Method for the Determination of the Coefficient of Friction of Metals under Conditions of Bulk Plastic Deformation. J. Inst. Met. 1964, 93, 38–46. [Google Scholar]
  11. Kitamura, K. Study on Tribological Performance Evaluation Simulating Hot Working; Amada Foundation Research Report; The Amada Foundation: Kanagawa, Japan, 2018; Volume 31, pp. 146–149. [Google Scholar]
  12. Vashishtha, G.; Chauhan, S.; Singh, R.; Singh, M.; Tejani, G.G. A review of numerical techniques for frictional contact analysis. Lubricants 2025, 13, 18. [Google Scholar] [CrossRef] [Scilit]
  13. Danno, A.; Abe, K.; Nonoyama, F. Evaluation of Lubricating Performance of Zinc Phosphate Coatings by Cold Piercing Test. J. Jpn. Soc. Technol. Plast. 1983, 24, 213–220. [Google Scholar]
  14. Schey, J.A. Tribology in Metalworking: Friction, Lubrication, and Wear; American Society for Metals: Metals Park, OH, USA, 1983. [Google Scholar]
  15. Asai, K. Estimation of Friction Coefficient Between Tool and Material in Lubrication Performance Evaluation Tests; Amada Foundation Research Report; The Amada Foundation: Kanagawa, Japan, 2022; Volume 35, pp. 365–370. [Google Scholar]
  16. Su, H.; Chen, Y.; Ma, R.; Li, W.; Zhao, G.; Qi, Y.; Lou, W. Influence of additive chemistry on the tribological behavior of steel/copper friction pairs. Lubricants 2022, 10, 91. [Google Scholar] [CrossRef] [Scilit]
  17. Inagaki, Y. Application of numerical simulation to forging process design. J. Jpn. Inst. Light Met. 2020, 70, 536–544. [Google Scholar] [CrossRef] [Scilit]
  18. Saiki, H.; Minami, A.; Mikawa, H. Study on measurement of friction coefficient and die surface temperature in cold forging and warm/hot forging. J. JSTP 1989, 30, 51–56. [Google Scholar]
  19. Lapovok, R. Improvement of die life by minimisation of damage accumulation and optimisation of preform design. J. Mater. Process. Technol. 1998, 80–81, 608–612. [Google Scholar] [CrossRef] [Scilit]
  20. Wang, Z.G.; Yoshikawa, Y.; Suzuki, T.; Osakada, K. Determination of friction law in dry metal forming with DLC coated tool. Ann. CIRP 2014, 63, 277–280. [Google Scholar] [CrossRef] [Scilit]
  21. Hansen, B.G.; Bay, N. Two new methods for testing lubricants for cold forging. J. Mech. Work. Technol. 1986, 13, 189–204. [Google Scholar] [CrossRef] [Scilit]
  22. Hawryluk, M.; Dudkiewicz, Ł.; Marzec, J.; Rychlik, M.; Tkocz, R. Selected aspects of lubrication in die forging processes at elevated temperatures—A review. Lubricants 2023, 11, 206. [Google Scholar] [CrossRef] [Scilit]
  23. Kramer, P.; Groche, P. Friction measurement under consideration of contact conditions and type of lubricant in bulk metal forming. Lubricants 2019, 7, 12. [Google Scholar] [CrossRef] [Scilit]
Figure 1. Dimensions (mm) of the specimen for the hot ring compression test.
Lubricants 14 00133 g001
Figure 2. Dimensions of the tapered plug test.
Lubricants 14 00133 g002
Figure 3. Deformation resistance of Steel A (Table 1).
Lubricants 14 00133 g003
Figure 4. Calibration curve for determining the Coulomb’s friction coefficient in the hot ring compression test.
Lubricants 14 00133 g004
Figure 5. Relationship between the lubricant adhesion weight and the Coulomb’s friction coefficient derived from the hot ring compression test.
Lubricants 14 00133 g005
Figure 6. (a) Example of scatter in three repeated test results of load–stroke curves in the hot tapered plug penetration test (non-graphite-based lubricant). (b) Example of scatter in three repeated test results of load–stroke curves in the hot tapered plug penetration test (unlubricated conditions).
Lubricants 14 00133 g006
Figure 7. Comparison of non-graphite-based lubricant, graphite-based lubricant, and non-lubricated conditions.
Lubricants 14 00133 g007
Figure 8. Effect of lubricant film thickness when using a non-graphite-based lubricant.
Lubricants 14 00133 g008
Figure 9. (a) Differences in material temperature and die surface roughness when utilizing a non-graphite-based lubricant. (b) Differences in die surface roughness with material temperature correction when using a non-graphite-based lubricant. (c) Differences in material temperature and die surface roughness when utilizing a non-graphite-based lubricant.
Lubricants 14 00133 g009
Figure 10. Investigated specimens and SEM/EDS analysis locations.
Lubricants 14 00133 g010
Figure 11. (a) FEM results for the tapered plug penetration test with a constant Coulomb’s friction coefficient. (b) FEM results for the tapered plug penetration test with a constant shear friction coefficient.
Lubricants 14 00133 g011
Figure 12. Comparison of experimental and analytical results for the tapered plug penetration test.
Lubricants 14 00133 g012
Figure 13. Transition behavior of friction coefficients under the condition of using a white lubricant.
Lubricants 14 00133 g013
Figure 14. Forged preform shape of the crankshaft and underfilling in the counterweight section.
Lubricants 14 00133 g014
Figure 16. Results of the analysis assuming a constant Coulomb’s friction coefficient (μ = 0.14), indicating underfill in the counterweight region.
Lubricants 14 00133 g016
Figure 17. Results of the analysis using the high-friction model on the flash area, demonstrating full filling of the counterweight region.
Lubricants 14 00133 g017
Figure 18. Manufactured crankshaft.
Lubricants 14 00133 g018
Table 1. Chemical composition of Steel A (specimen) (mass %).
CSiMnPSCrV
0.390.200.720.0220.0220.190.04
Table 2. Test lubricants.
Lubricant NameSymbolMain Contents
Non-graphite typeWhWater-soluble polymer and fatty acid salt
Graphite typeGrOrganic based binder and colloidal graphite
Table 3. Differences in sliding distance and contact pressure for experiments and the forming process.
Sliding Distance/mmSurface Pressure/MPa
Ring compression test2150–300
Tapered-plug penetration test46200–300
CrankshaftProduct shape region of the crankshaft die0–100–300
Flash15–25200–500
Table 4. Amounts of lubricant applied (Wh and Gr) in the hot ring compression test.
Lubricant Name <Symbol> (Main Contents)Lubricant Film ThicknessLubricant Adhesion Weight/g/m2
Non-graphite-type lubricant <Wh>
(Water-soluble polymer and fatty acid salt)
Small/Thin4.25
4.73
7.85
Large/Thick14.16
64.88
Graphite-type lubricant <Gr>
(Organic based binder and colloidal graphite dispersed in water)
Small/Thin7.84
22.46
Large/Thick65.49
112.99
Table 5. (a) Testing conditions. (b) Notation of conditions, including lubricant type, billet temperature, die surface roughness, lubricant amount, and number of repetitions.
(a)
LubricantNon, Gr, Wh
Billet temperature [°C]1000, 1100
Die surface roughness in Ra [μm]0.10, 1.60, 1.71
(b)
Notation of Conditions in Experiment
Lub.-Temp.-Roughness-Lub. Thickness
LubricantBillet Temperature [°C]Die Surface Roughness in Ra [μm]Lubricant Adhesion Weight [g/m2]Number of Repetitions
Wh-1000 °C-1.60Ra-ThinWh10001.602.0– 2.32
Wh-1000 °C-1.60Ra-ThickWh10001.6019.2–22.52
Wh-1000 °C-1.71Ra-ThickWh10001.7125.1–27.32
Wh-1100 °C-0.10Ra-ThinWh11000.100.6–1.32
Wh-1100 °C-0.10Ra-ThickWh11000.1014.3–18.03
Gr-1000 °C-1.71Ra-ThickGr10001.7134.2–34.82
Non-1000 °C-1.60RaNon10001.6003
Non-1000 °C-1.71RaNon10001.7102
Table 6. EDS results for residual Na derived from lubricant components.
Experimental ConditionsLocation ①, L = 5 mmLocation ②, L = 15 mmLocation ③, L = 20 mm
Non-1000 °C-1.60Ra0.00% N.D.0.00% N.D.0.00% N.D.
Wh-1000 °C-1.60Ra-Thin0.00%0.00%0.00%
Wh-1000 °C-1.60Ra-Thick0.18%0.01%0.03%
“N.D.” means “not detected” in the inspection results.
Table 7. Conditions for thermomechanical analysis.
ParameterCondition
Taper plugRagid body
Dimension: Figure 2
Initial temperature: 200 °C
Thermal conductivity: 24.6 W/(m·K)
Specific heat: 3.8 kJ/(kg·K)
SpecimenRagid plastic body
Dimension: Figure 2
Flow stress: Figure 3
Initial temperature: 1000 °C
Friction coefficientShear friction factor, m = 0.1 to 0.9, by 0.1
Coulomb friction coefficient, µ = 0.1 to 0.9, by 0.1
Punch speed0.1 mm/s
Heat transfer coefficient (a)63 kW/(m2·K)
Thermal conductivity of workpiece30.0 W/(m·K)
Specific heat of workpiece5.4 kJ/(kg·K)
Table 8. Friction models in the high-friction region.
Modelτ = μpτ = mk
High-friction Model Aμpmkμp > mk
High-friction Model Bppcrp > pcr
Disclaimer/Publisher’s Note: The statements, opinions and data contained in all publications are solely those of the individual author(s) and contributor(s) and not of MDPI and/or the editor(s). MDPI and/or the editor(s) disclaim responsibility for any injury to people or property resulting from any ideas, methods, instructions or products referred to in the content.