Article

Lubrication Reliability and Evolution Laws of Gear Transmission Considering Uncertainty Parameters

1
School of Mechanical and Equipment Engineering, Hebei University of Engineering, Handan 056038, China
2
School of Mechanical and Aerospace Engineering, Nanyang Technological University, 50 Nanyang Avenue, Singapore 639798, Singapore
3
State Key Laboratory of Reliability and Intelligence of Electrical Equipment, Hebei University of Technology, Tianjin 300401, China
4
College of Mechanical Engineering, Tianjin University of Technology, Tianjin 300401, China
*
Authors to whom correspondence should be addressed.
Lubricants 2025, 13(9), 392; https://doi.org/10.3390/lubricants13090392
Submission received: 25 July 2025 / Revised: 27 August 2025 / Accepted: 1 September 2025 / Published: 3 September 2025
(This article belongs to the Special Issue Novel Tribology in Drivetrain Components)

Abstract

To address the challenge of predicting lubrication states and reliability caused by the uncertainty of gear materials and structural parameters, a lubrication reliability analysis method considering the randomness of gear parameters is proposed. Firstly, a nonlinear dynamic model of a gear pair is established to derive the dynamic meshing force. The geometric and kinematic analyses are then performed to determine time-varying equivalent curvature radius and entrainment velocity. The minimum film thickness during meshing is further calculated. Considering gear parameters as random variables, a gear lubrication reliability model is formulated. Monte Carlo Simulation method is employed to accurately analyze the dynamic response, dynamic meshing force, equivalent curvature radius, entrainment velocity, probability distribution of minimum film thickness, and gear lubrication failure probability. Additionally, a specialized wear test device is designed to investigate the evolution of tooth surface roughness with wear and to forecast trends in gear lubrication failure probability as wear progresses. The results indicate that the uncertainty in gear parameters have minimal impact on the equivalent curvature radius and entrainment velocity, but significantly affect the dynamic meshing force. The gear speed and root mean square roughness are critical factors affecting lubrication reliability, and the early wear of the teeth enhances the lubrication reliability. The present work provides valuable insights for the design, maintenance, and optimization of high-performance gear systems in practical engineering applications.

1. Introduction

Gear drives are widely utilized in aerospace, robotics, and construction machinery due to their high transmission efficiency, precision, and reliability. High reliability constitutes the principal characteristic of gears and represents an important area of gear research. In engineering practice, gear failures primarily manifest as pitting, scuffing, and other surface defects, with inadequate lubrication being the predominant cause. Therefore, the gear lubrication has being garnered significant attention. However, most studies have relied on deterministic models and theories, which are inadequate for analyzing lubrication performance gearsets with random parameters.
With the continuous improvement of lubrication theory, the research in gear lubrication has gradually matured. The properties of lubricants [1,2,3,4], thermal effect [5,6,7], transient effect [8,9,10], and rough surface effect [11,12] have been comprehensive studied in the field of gear lubrication. However, existing studies on gear lubrication is mainly based on deterministic models and theories, assuming that the gear has deterministic material and dimensional parameters, as well as deterministic loads and velocities. In engineering practice, the parameters of gear transmission system and external excitation are inevitably random. These uncertainties stem from the variations in material properties due to the production environment and technical conditions, as well as the geometric deviations caused by machining, installation, and measurement errors. Additionally, the random external incentives further complicate the problem. The coupling propagation of these various uncertainties makes it challenging to accurately predict the gear lubrication state.
Recently, the influence of randomness on gear lubrication behaviors has gained attention. The lubrication characteristics of a gear system were investigated under stochastic load through modeling the load as a combination of a constant component and random noise [13]. The numerical characteristics of the minimum film thickness (MFT) was successfully captured. A random tribodynamic model of a gear pair was proposed to study the effect of uncertainty rotation speed on the lubrication behaviors [14]. The pinion rotation speed was supposed to obey Gaussian distribution. The MFT was selected to indicate the lubrication performance. The results revealed that the MFT was no longer obey Gaussian distribution, and the uncertainty can be suppressed by increasing the lubricant viscosity. Although some progress has been made in studying the effects of random external excitations on gear lubrication, the impact of uncertainties in material and dimensional parameters has received insufficient attention.
As the principal characteristic of gear transmission, the reliability of gear system has been studied from different perspectives. For example, an innovative method was proposed to evaluate the reliability of the motion accuracy of gear systems [15]. The probability density function (PDF) and its cumulative distribution function of the transmission error were obtained by the saddle point approximation. The response surface method and artificial neural network were used to capture the fatigue reliability of involute gear under elastohydrodynamic lubrication [16,17]. The fatigue reliability of aero-engine gear was studied using an active learning Kriging-based method, the analysis efficiency of fatigue reliability was significantly improved [18]. A reliability prediction model was built for the helicopter planetary gear drive and the impact of load distribution uniformity on the overall reliability was studied [19]. Different from the reliability of gear structural strength mentioned above, the time-dependent kinematic reliability model of gear system was established [20]. The impact of meshing stiffness, manufacturing errors uncertainty, and material characteristics of gear system on the kenimatic reliability were studied. Furthermore, some scholars started to focus on the lubrication reliability of gear system in recent years. The lubrication reliability of gear system under stochastic load was investigated [13]. The lubrication reliability model was proposed based on the stress-strength interference model. It was revealed that the failure probability of lubrication at the dedendum of the pinion was higher than the other regions. To evaluate the lubrication reliability of rolling bearing [21], a model on grounds of a probability box model was proposed with considering the uncertainty of lubricant material, load, and raceway structure. In summary, while the lubrication reliability has attracted increasing attention, existing models and methods remains un-developed, especially for gear lubrication reliability analysis considering the uncertainty of material and dimensional parameters.
Reliable lubrication reduces direct contact between rough peaks, reducing wear, improving transmission efficiency, and extending the service life and reliability of gears. The lubrication state of gears demonstrates significant randomness under the action of uncertain parameters and external excitation. However, the model and approach considering the randomness of gear system remains undeveloped. To address this, a gear dynamic model was established that considers the time-variant meshing stiffness, side backlash, and static transmission error to calculate the dynamic meshing force of the gear pair. The geometric and kinematic analyses of the gear pair were carried out to obtain the equivalent curvature radius and entrainment velocity. Finally, a gear lubrication reliability model was constructed based on the film thickness ratio, and the failure probability of the gear lubrication system is accurately calculated by the Monte Carlo simulation (MCS) method. The remainder of this paper can be summarized as follows. In Section 2, gear lubrication reliability model is established. In Section 3, lubrication reliability analysis and its numerical procedure is provided. Results and discussion are exposited in Section 4. Finally, conclusions for the current study are drawn in Section 5.

2. Derivation of Gear Lubrication Reliability Model

2.1. Dynamics Model of the Gear Pair and Load

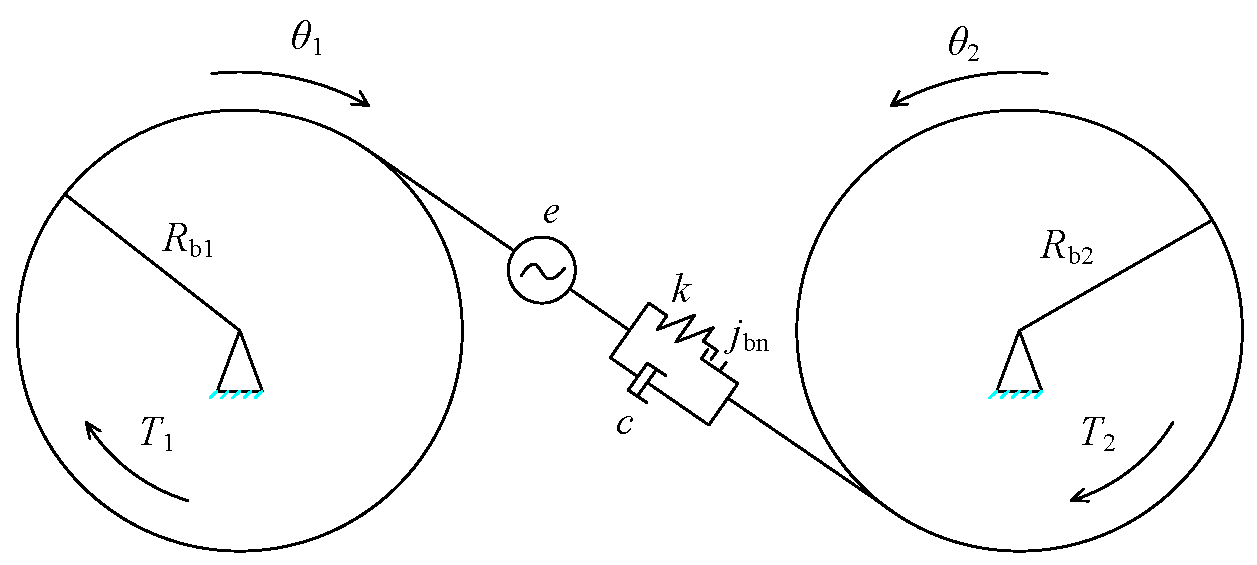
The dynamic model simplifies the gear pair into two disks whose masses are equal to the driving and driven gears, respectively. The interaction between the teeth is simulated by massless springs and dampers as shown in Figure 1. According to Newton’s law, the dynamic equation of the gear pair is written as [22]:
I 1 θ ¨ 1 + R b 1 c R b 1 θ ˙ 1 R b 2 θ ˙ 2 e ˙ + R b 1 k ( t ) R b 1 θ 1 R b 2 θ 2 e = T 1 I 2 θ ¨ 2 + R b 2 c R b 1 θ ˙ 1 R b 2 θ ˙ 2 e ˙ R b 2 k ( t ) R b 1 θ 1 R b 2 θ 2 e = T 2
where I1 and I2 are the rotary inertia of the pinion and gear. θ1 and θ2 denote the torsional displacement of the pinion and gear. Rb1 and Rb2 are the base radius of the pinion and gear. c is the damping coefficient; e denotes static transmission error; k(t) represents the time-variant meshing stiffness; T1 and T2 correspond to input and output torques.
Define the relative displacement of the gear pair (hereinafter referred to as “displacement”, the first and second derivatives are called “speed” and “acceleration”, respectively) as x = Rb1θ1Rb2θ2e, Equation (1) reads:
m e x ¨ + c x ˙ + k ( t ) g ( x ) = F m m e d 2 e d t 2
where, me represents the gear system’s equivalent mass; g(x) represents a nonlinear function of x, Fm is the equivalent driving force, and is regarded as a constant value in this paper. Their expressions are as follows:
m e = I 1 I 2 I 1 R b 2 2 + I 2 R b 1 2
g ( x ) = x j bn , x > j bn 0 , j bn x j bn x + j bn , x < j bn
F m = T 1 R b 1 = T 2 R b 2
where jbn denotes backlash, which is employed to ensure lubrication and prevent jamming resulting from thermal deformation.
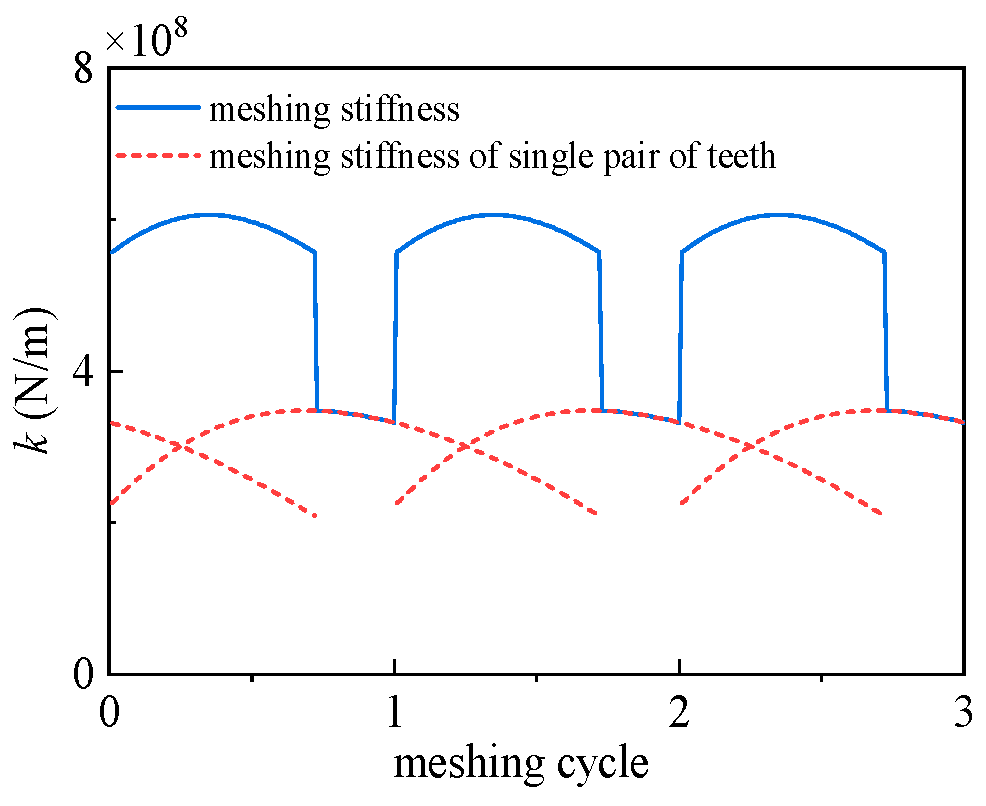
The Ishikawa method, recommended by the Japanese Mechanical Society, is employed to capture the time-variant meshing stiffness. According to the gear parameters provided in Table 1, the time-variant meshing stiffness is shown in the Figure 2.
In the meshing process, the damping effect is often difficult to describe accurately. So it is generally simplified as a function of equivalent mass and average meshing stiffness:
c = 2 ζ m e k m
where ζ is the damping ratio which takes 0.05 in this paper [22], and km represents the average meshing stiffness. The detail solution process can be found in reference [23]
Static transmission error refers to the deviation between the actual meshing position and the theoretical meshing position along the meshing line, usually assumed as a harmonic function [24]:
e = e r sin ( 2 π t t c + φ )
where tc represents meshing cycle, er denotes the amplitude of static transmission error, usually between 1 μm and 10 μm, and is considered as a random variable with Gaussian distribution in this paper, φ is the phase angle.
By solving the dynamic equation, the meshing force on the single tooth of pinion can be obtained [25]:
w t = k 1 ( t ) x + c x ˙
where wt is the mesh-force on a single tooth, k1(t) is the meshing stiffness of a single pair of teeth, defined as the stiffness of a single tooth from the approach action point to the recess action point.

2.2. Curvature and Entrainment Velocity

The curvature radius of the pinion and gear at the contact point are:
r 1 = R b 1 tan ( β ) + S p
r 2 = R b 2 tan ( β ) S p
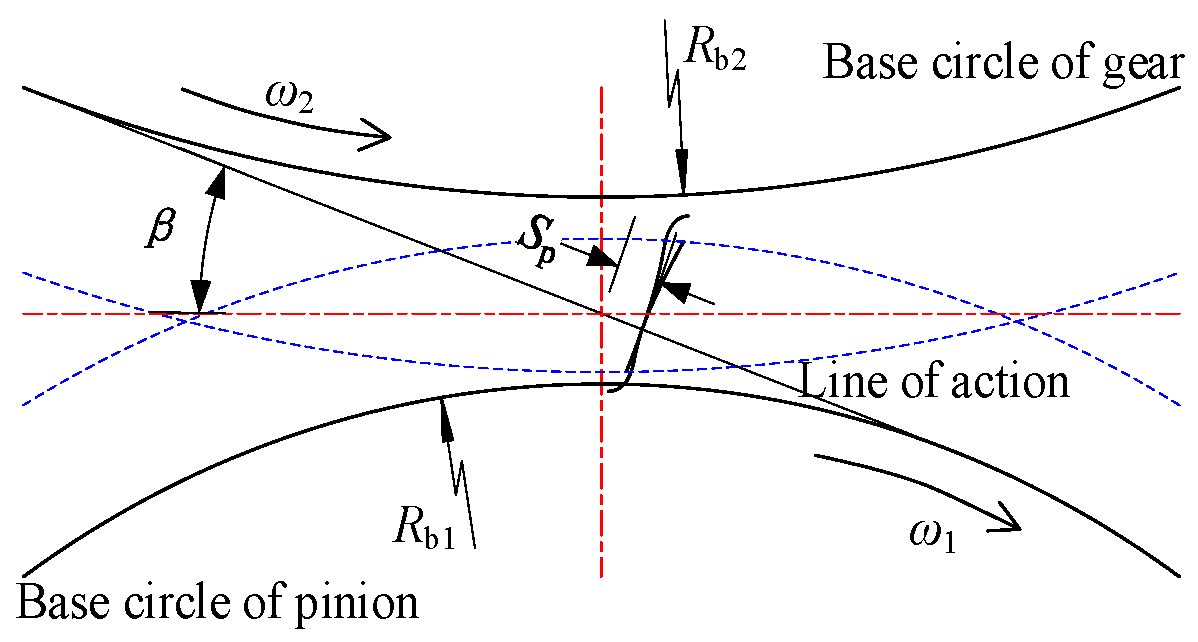
where Rb1 and Rb2 are the base circle radius of the pinion and gear; β represents the pressure angle; SP is the distance from the meshing point to the pitch point, as shown in Figure 3, which can be obtained by the geometric relationship of the gear meshing.
The contact between the two tooth surfaces can be equivalent to the contact between a cylinder and a plane. The radius of the equivalent cylinder is
r = r 1 r 2 r 1 + r 2
Through kinematics analysis, the instantaneous tangential velocity of the two teeth at the contact point can be obtained:
u 1 = ω 1 r 1
u 2 = ω 2 r 2
where ω1 and ω2 are the speed of the pinion and gear, respectively.
The lubrication entrainment velocity at the contact point written as:
u = ( u 1 + u 2 ) / 2
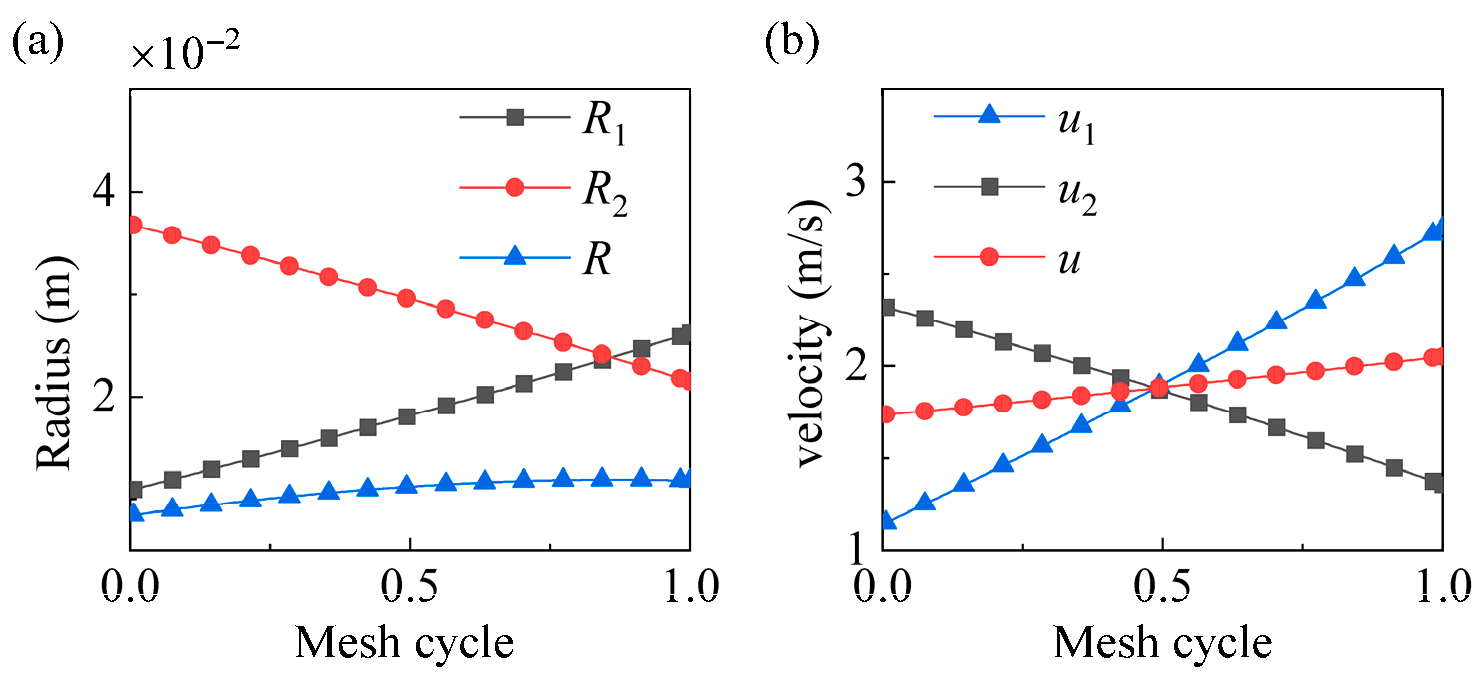
The equivalent radius of curvature and entrainment speed in a tooth meshing cyclesare shown as Figure 4.
Figure 4. Curvature radius and entrainment speed (a) Equivalent radius of curvature; (b) Entrainment speed.
Lubricants 13 00392 g004

2.3. Minimum Film Thickness for Gear Lubrication

With the dynamic meshing force, time-variant equivalent curvature radius, and entrainment velocity, the MFT at each contact point express as [26]:
h min = 3.4 r w ¯ 0.095 u ¯ 0.71 g ¯ 0.57 [ 1 + 0.0027 σ ¯ 1.075 ( s k + 2 ) 0.3744 w ¯ 0.09451 u ¯ 0.974 g ¯ 0.806 ]
where w - , u - , g - represent load parameter, velocity parameter, and material parameter, respectively. σ ¯   and sk are dimensionless RMS roughness and skewness, respectively, their expressions can be written as:
w ¯ = w t l e r ,   u ¯ = η 0 u e r ,   g ¯ = α e ,   σ ¯ = σ r
where l represents tooth width, e denotes effective Young’s modulus, η 0 represents the viscosity at ambient conditions, α denotes pressure-viscosity coefficient. The ratio between the minimum film thickness and the comprehensive RMS roughness are usually employed to define the lubrication regime.

2.4. Lubrication Reliability Model

The construction of the lubrication reliability model is based on the concept of film thickness ratio in mixed elastohydrodynamic lubrication theory. The film thickness ratio refers to the ratio between the film thickness (usually the minimum film thickness) and the comprehensive RMS roughness, usually expressed by λ, and its expression is:
λ = h σ
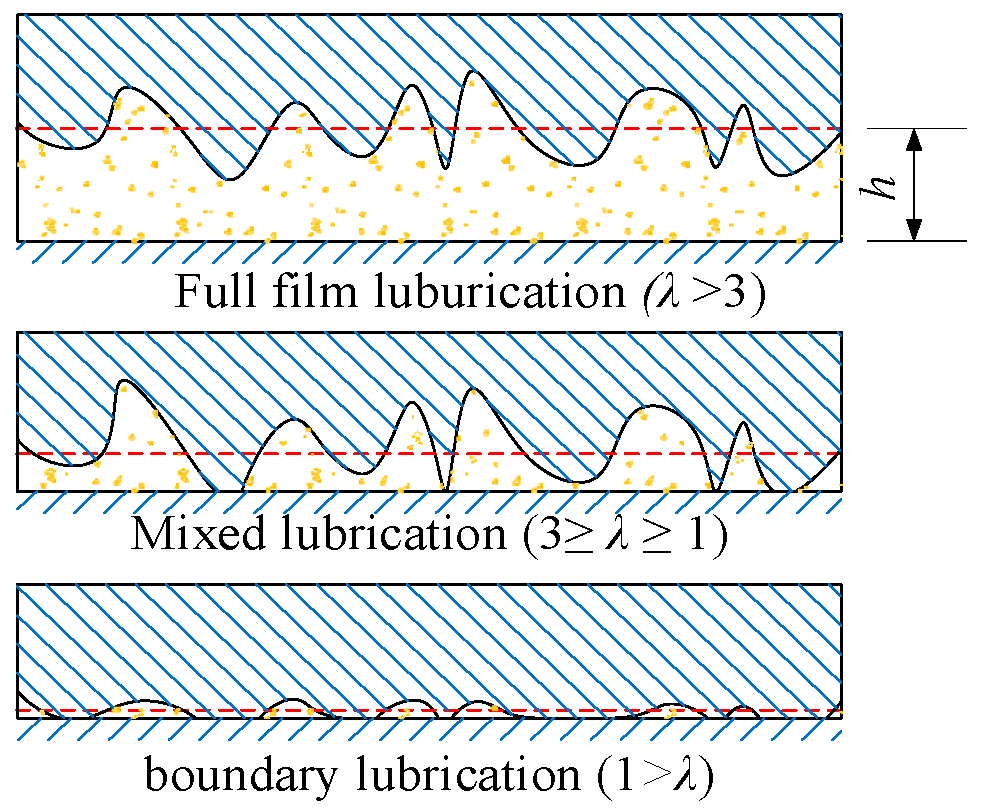
As shown in Figure 5, the three lubrication states are defined through film thickness ratio: full film lubrication, mixed lubrication, and boundary lubrication. When λ > 3, no direct contact exists between surface roughness peaks, the lubricating oil film supports the load, which is called full film lubrication. When 1 ≤ λ ≤ 3, a part of the surface roughness peak enters into contact, and the load is shared both by the lubricating oil film and the contact surface roughness peak, which is called mixed lubrication. When λ ≤ 1, most of the surface roughness peaks are in contact, and the load is almost completely borne by the contact surface roughness peaks, which are in the boundary lubrication state. The contact surface separates completely in full film lubrication state, and theoretically, no wear occurs in this lubrication state. Therefore, in engineering applications, it is expected that the contract always remains in a state of full film lubrication. However, due to the time variability and randomness of external excitation, structure of the contact surface, and lubricant properties, it is often difficult to ensure the continuous lubrication of full-film lubrication, and the lubrication state also has a certain randomness.
The functional functions of full film lubrication are:
g f ( H min , ) = H min 3 Σ
where Hmin represents the MFT, and Ʃ denotes the comprehensive RMS roughness, which are represented by capital letters to emphasize that they are random variables.
The failure probability of full film lubrication is:
p ff = Pr [ g f ( H min , Σ ) 0 ]
The functional functions of mixed lubrication are:
g m ( H min , Σ ) = H min Σ
The failure probability of mixed lubrication is:
p mf = Pr [ g m ( H min , Σ ) 0 ]
According to the classical lubrication theory, when the surface roughness peak contact directly, it can be regarded as a lubrication failure. In other words, lubrication failure denotes full film lubrication failure [27]. Therefore, the lubrication failure mentioned in this paper are defined as full film lubrication failure.

2.5. Gear Lubrication Reliability Model

According to the formula of MFT and the definition of lubrication reliability given above, the functional function of gear lubrication reliability can be obtained:
g f ( R ,   W ,   U ,   G , Σ ,   S k ) = 3.4 R W 0.095 U 0.71 G 0.57 [ 1 + 0.0027 ( Σ ) 1.075 ( S k + 2 ) 0.3744 W 0.09451 U 0.974 G 0.806 ] 3 Σ
where R is the dimensionless equivalent radius of curvature, W represents the load parameter, U is the velocity parameter, and G denotes the material parameter. Ʃ is the dimensionless comprehensive Root Mean Square value (RMS), and Sk is the skewness. Here, the parameters are represented in capital letters to indicate that they are random variables.

3. Lubrication Reliability Analysis and Its Numerical Procedure

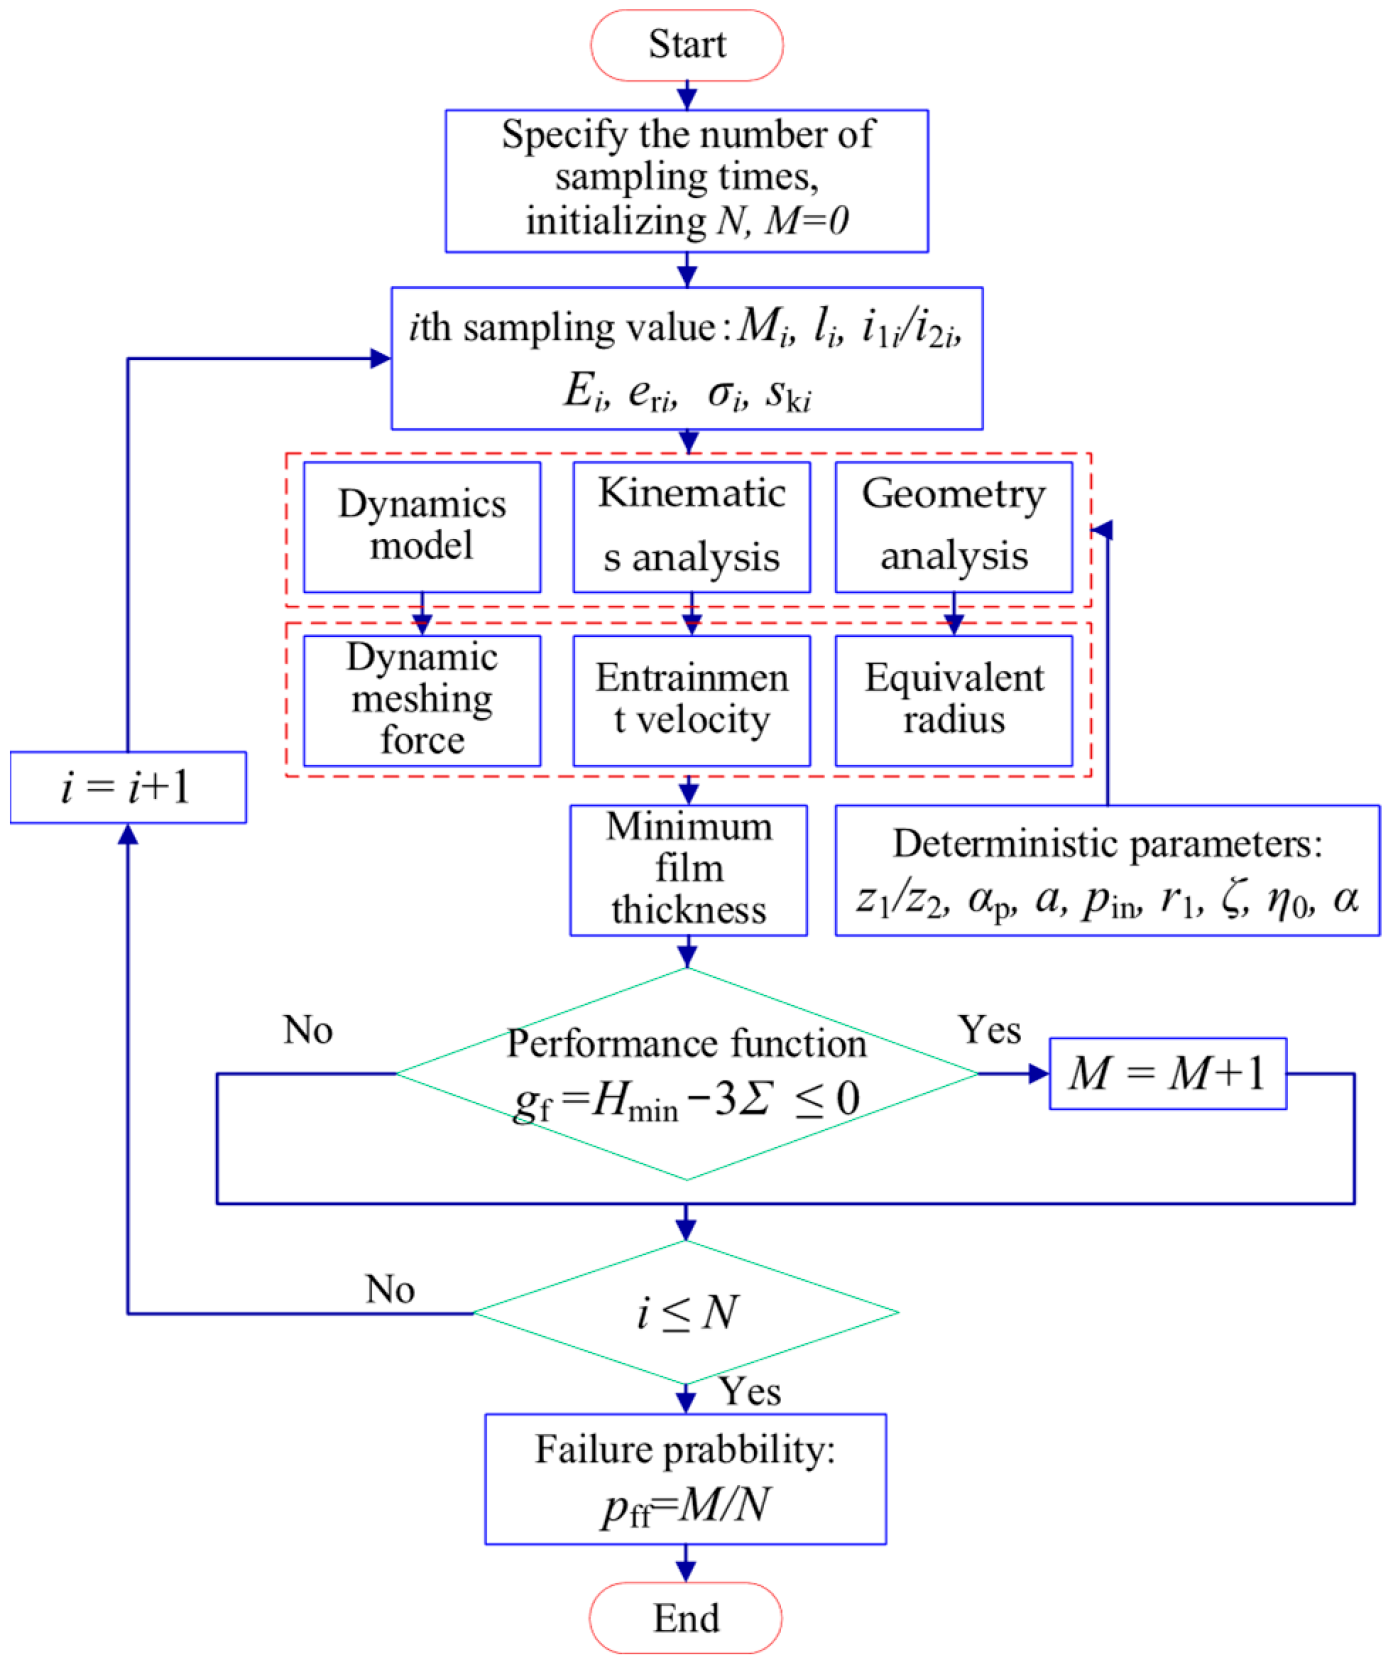
The lubrication reliability analysis process is shown in Figure 6. The main lubrication reliability analysis methods include first-order second moment method [28], surrogate model method [29,30], Monte Carlo method [31], interval analysis method [32], etc. Due to the advantage of high computational accuracy of the Monte Carlo method (MCS) with direct sampling, it is adopted to implement precise reliability analysis in this paper, whose mathematical model is as follows:
P f = Ω f f X x d x = I g x f X x d x = E I g x
where Pf is the lubrication failure probability. Fx(x) denotes the joint probability density function of uncertainty parameters. E(⸳) refers to expectation operator. I(⸳) is the failure indicator function and it can be expressed as
I = 1 , i f   g x 0 0 , i f   g x < 0
Based on the above formula, lubrication reliability analysis using MCS method can be used to calculate the failure probability through the following three steps:
Firstly, the gear modulus, tooth width, static transmission error amplitude, elastic model of material, and rotary inertia of the pinion and gear are defined as random variable. The sampling values of those parameters are obtained on the basis of their probability density function.
Then, with the samples of those parameters, the dynamic mesh-force was captured by the gear dynamics model. The time-variant entrainment velocity and equivalent curvature radius can be obtained through the gear kinematics and geometric analysis, and the MFT of the gear lubrication was further obtained.
Finally, the dynamic meshing force, time-variant entrainment velocity, and time-variant equivalent curvature radius are substituted into functional functions to determine whether the gear lubrication failure occurs. After N times of sampling, the failure frequency is counted to estimate the failure probability of gear lubrication. In this paper, the sampling number N is set to 100,000 times, and the kinetic equation is calculated using the Runge-Kutta numerical integration method with fourth-order constant step size. The Monte Carlo simulation 105 times needs about 4 h On a personal computer with an i7-6700 CPU Intel Core i7-6700 Santa Clara, California, USA and a 3.4 GHz processor.

4. Results and Discussions

To investigated the lubrication reliability of the gear system, the stochastic geometric parameters and material characteristics are considered in this paper. The modulus of the gear, tooth width, moment of inertia of the pinion and gear, elastic modulus of the material, and amplitude of static transmission error are all obey Gaussian distribution, and these random variables are independent of each other [33,34]. The statistics law of these parameters can be obtained by measuring and statistical analyzing large number of samples. If the sample satisfies other distributions, the method still applies. The mean value and coefficient of variation are shown in Table 1, and the other parameters are constant.

4.1. Statistical Characteristics of the Dynamic Response of Gear System

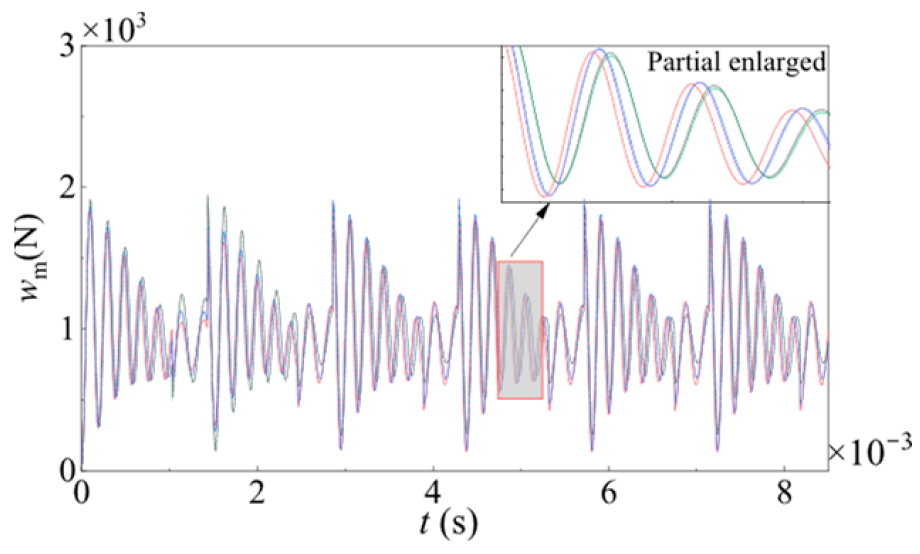
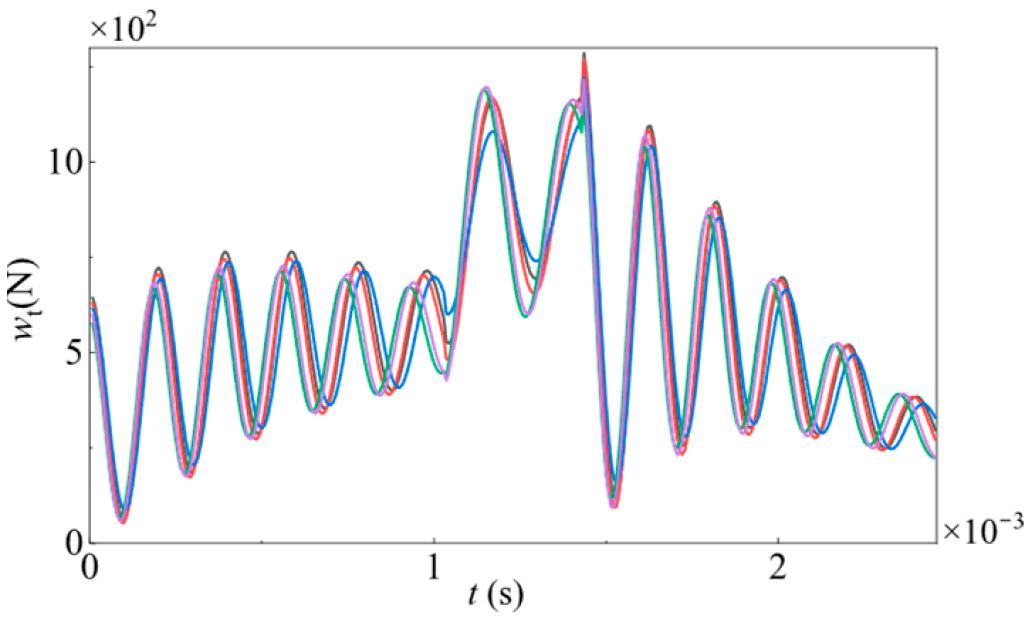
The dynamic response and meshing force of gear pair are no longer deterministic time function due to the randomness of gear parameters. Figure 7 depicts the samples meshing force. As can be seen, the meshing force on a single tooth region is larger than that of double teeth regions. It increases from the approach point to the lowest point of single tooth contact and decreases from the highest point of single tooth contact to the recession point. A single sample curve fluctuates due to single and double teeth transformation. The values of each meshing force sample are different at the same time, which is caused by the randomness of gear parameters. The sample of meshing force on a single tooth is illustrated in Figure 8. Figure 9 show samples of the equivalent radius of curvature and the entrainment velocity from mesh-in to mesh-out of the teeth. The meshing force, radius of curvature, entrainment velocity are not strictly stochastic process but random variable, the values at different time point are complete correlation.
Figure 10 shows the meshing force distribution histogram of the first six meshing cycles at the same time point (each time point is separated by one meshing cycle). It can be seen that the histograms of the first three cycles differ significantly, while the histograms become more identical from the 3rd to the 6th cycles.
Table 2 shows the first four statistical moments of meshing forces at the six moments in Figure 10. It can be observed that the numerical characteristics barely change after the 5th meshing cycle. Therefore, it can be concluded that the statistical characteristics of the meshing force tend to be stable after the 5th meshing cycle. If the degradation of gear parameters due to wear is not considered, any cycle after the 5th engagement cycle can be selected to study the lubrication reliability of gear.
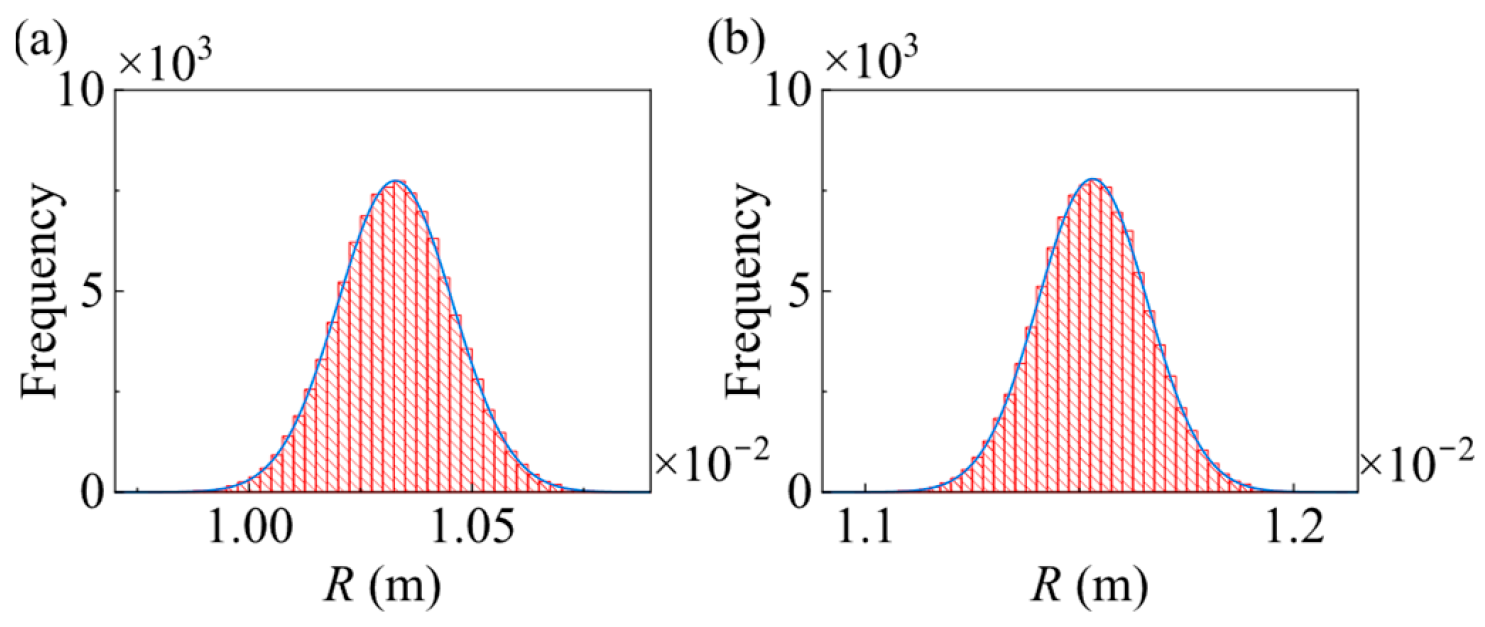
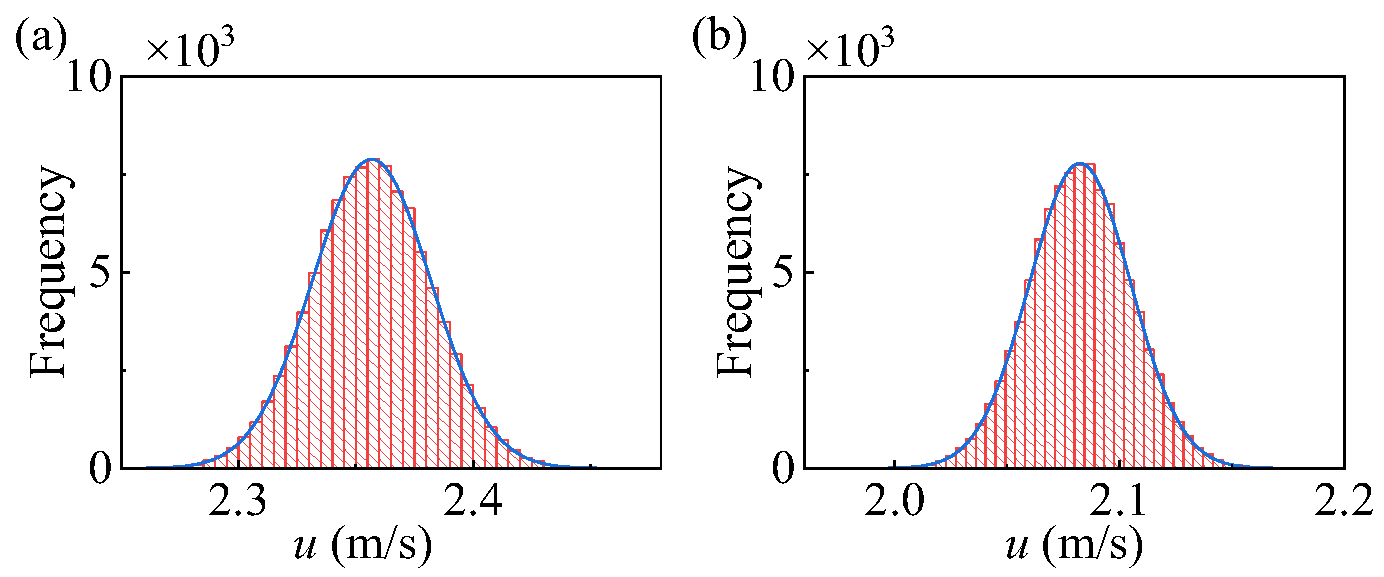
Figure 11 and Figure 12 are the distribution histograms of the equivalent curvature radius and entrainment velocity at two different time points, and the corresponding first four-order statistical moments are shown in Table 3 and Table 4. It can be seen that the variation coefficients of the equivalent curvature radius and the entrainment velocity at different moment virtually identical, and are close to 0.01 which is the variability coefficient of the gear parameters. The skewness approaches 0, and the kurtosis approaches 3. Conclusion can be drowned that the distribution of curvature radius and entrainment velocity obey Gaussian. The uncertainty from gear parameters to equivalent curvature radius and entrainment velocity does not change significantly.
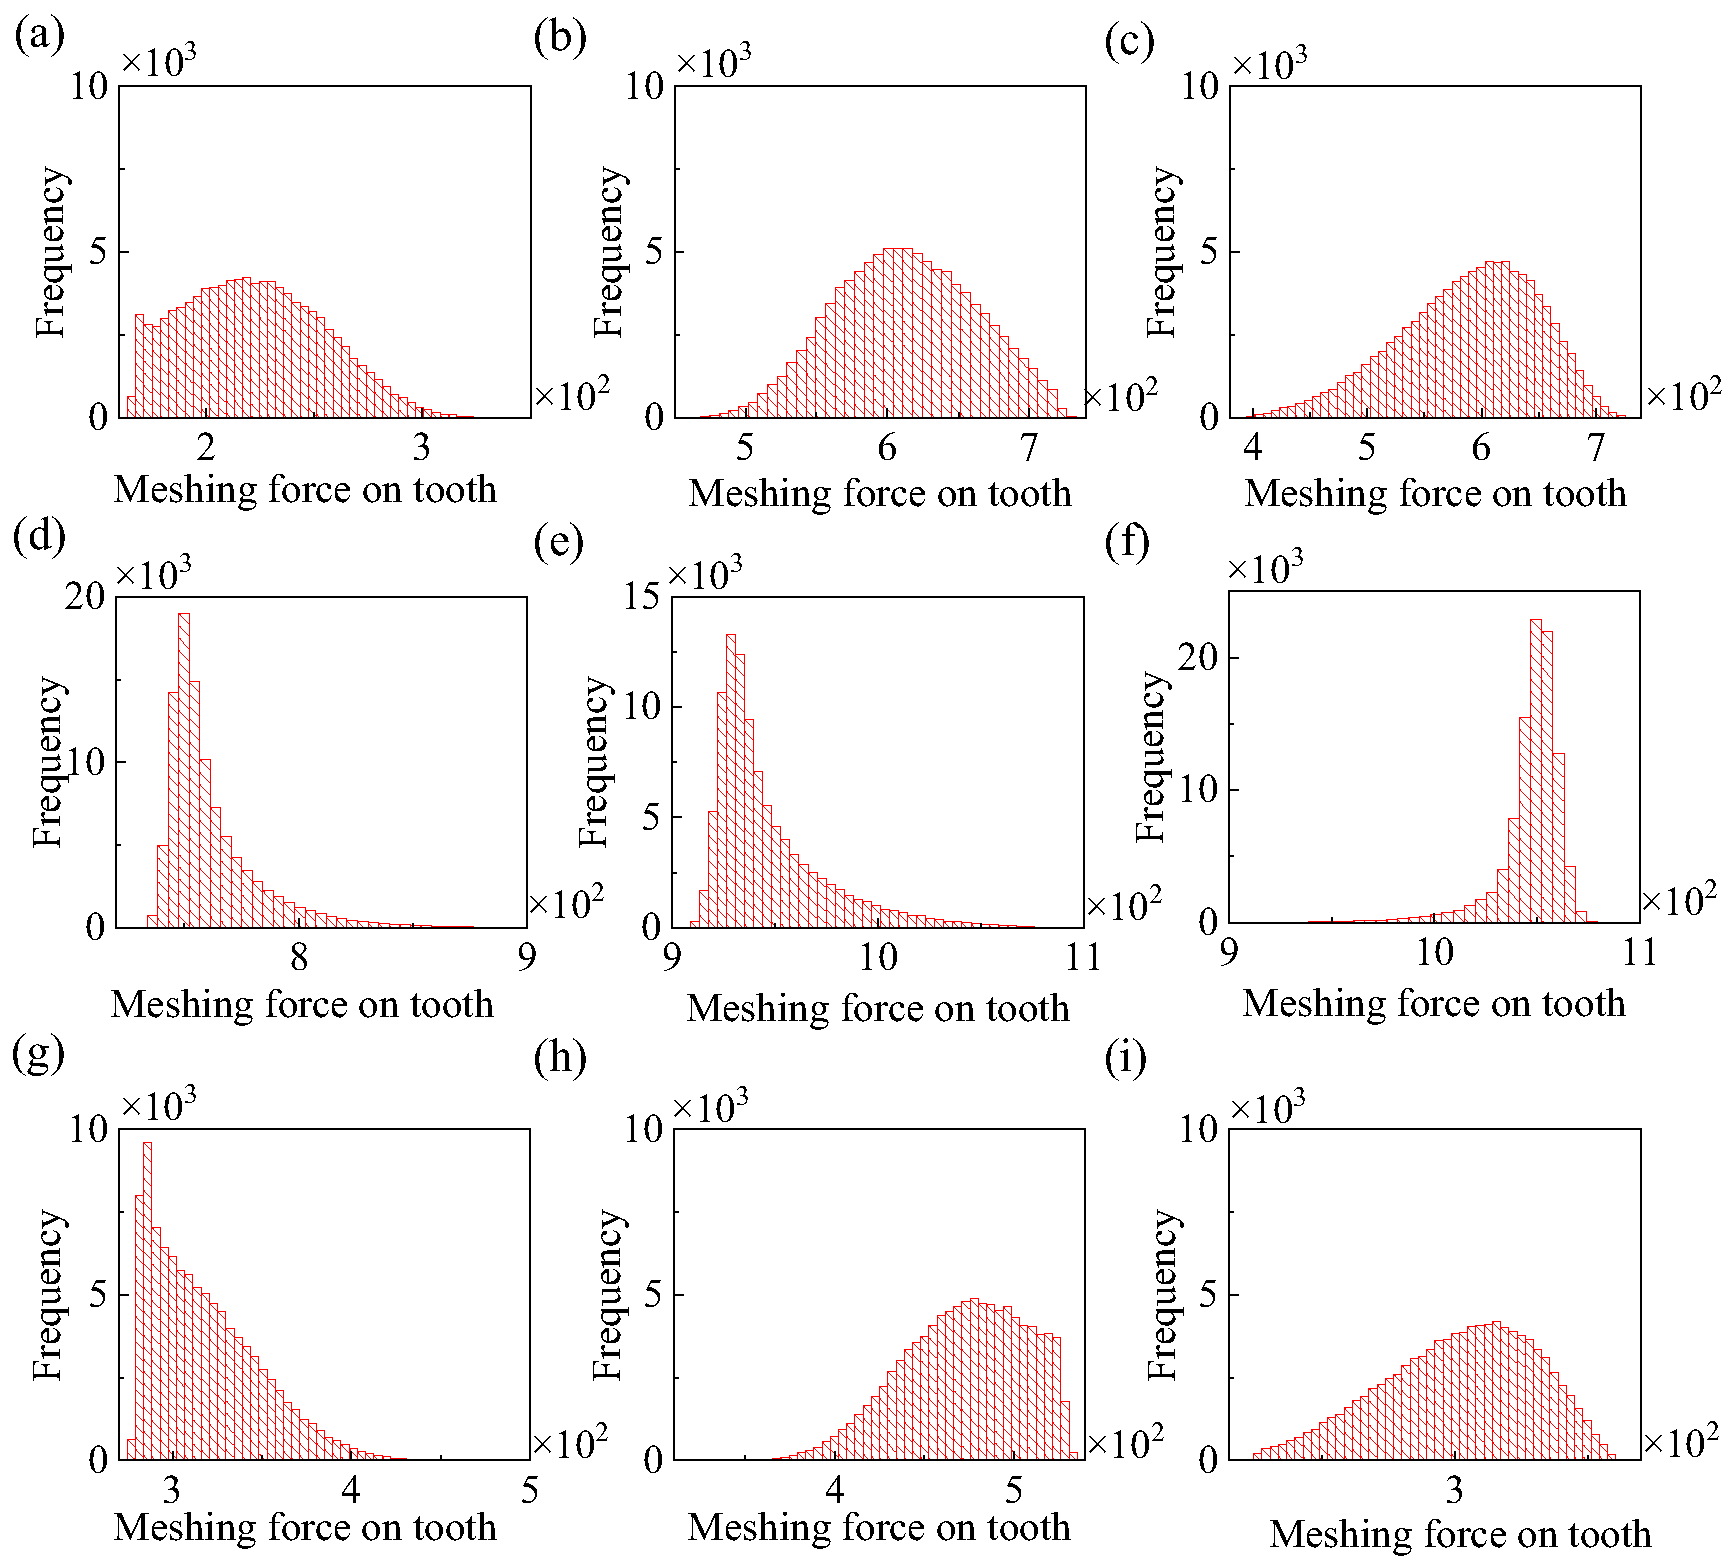
For the purpose of investigating the meshing force distribution on a single tooth, the 10th meshing cycle is chosen. The meshing cycle of a single tooth is segmented into 9 equal time intervals. The meshing force distribution histogram corresponding to each time point is presented in Figure 13. Evidently, the meshing forces at every time do not conform to the Gaussian distribution any longer, and the disparities are quite substantial. This phenomenon can be accounted for by the pronounced nonlinear characteristics inherent in the gear system.
Table 5 shows the first four order statistical moments and the variation coefficients of the meshing force corresponding to Figure 13. As is shown, the meshing force of single tooth exhibits stronger non-Gaussian characteristics, and the coefficient of variation at each time point is greater than the gear parameter. The non-Gaussian characteristics of the single tooth mesh force stems from the nonlinearity of the gear dynamics system. It can be seen that the uncertainty of gear parameters is increased by the action of the dynamic system.

4.2. Lubrication Reliability Analysis of Gear System

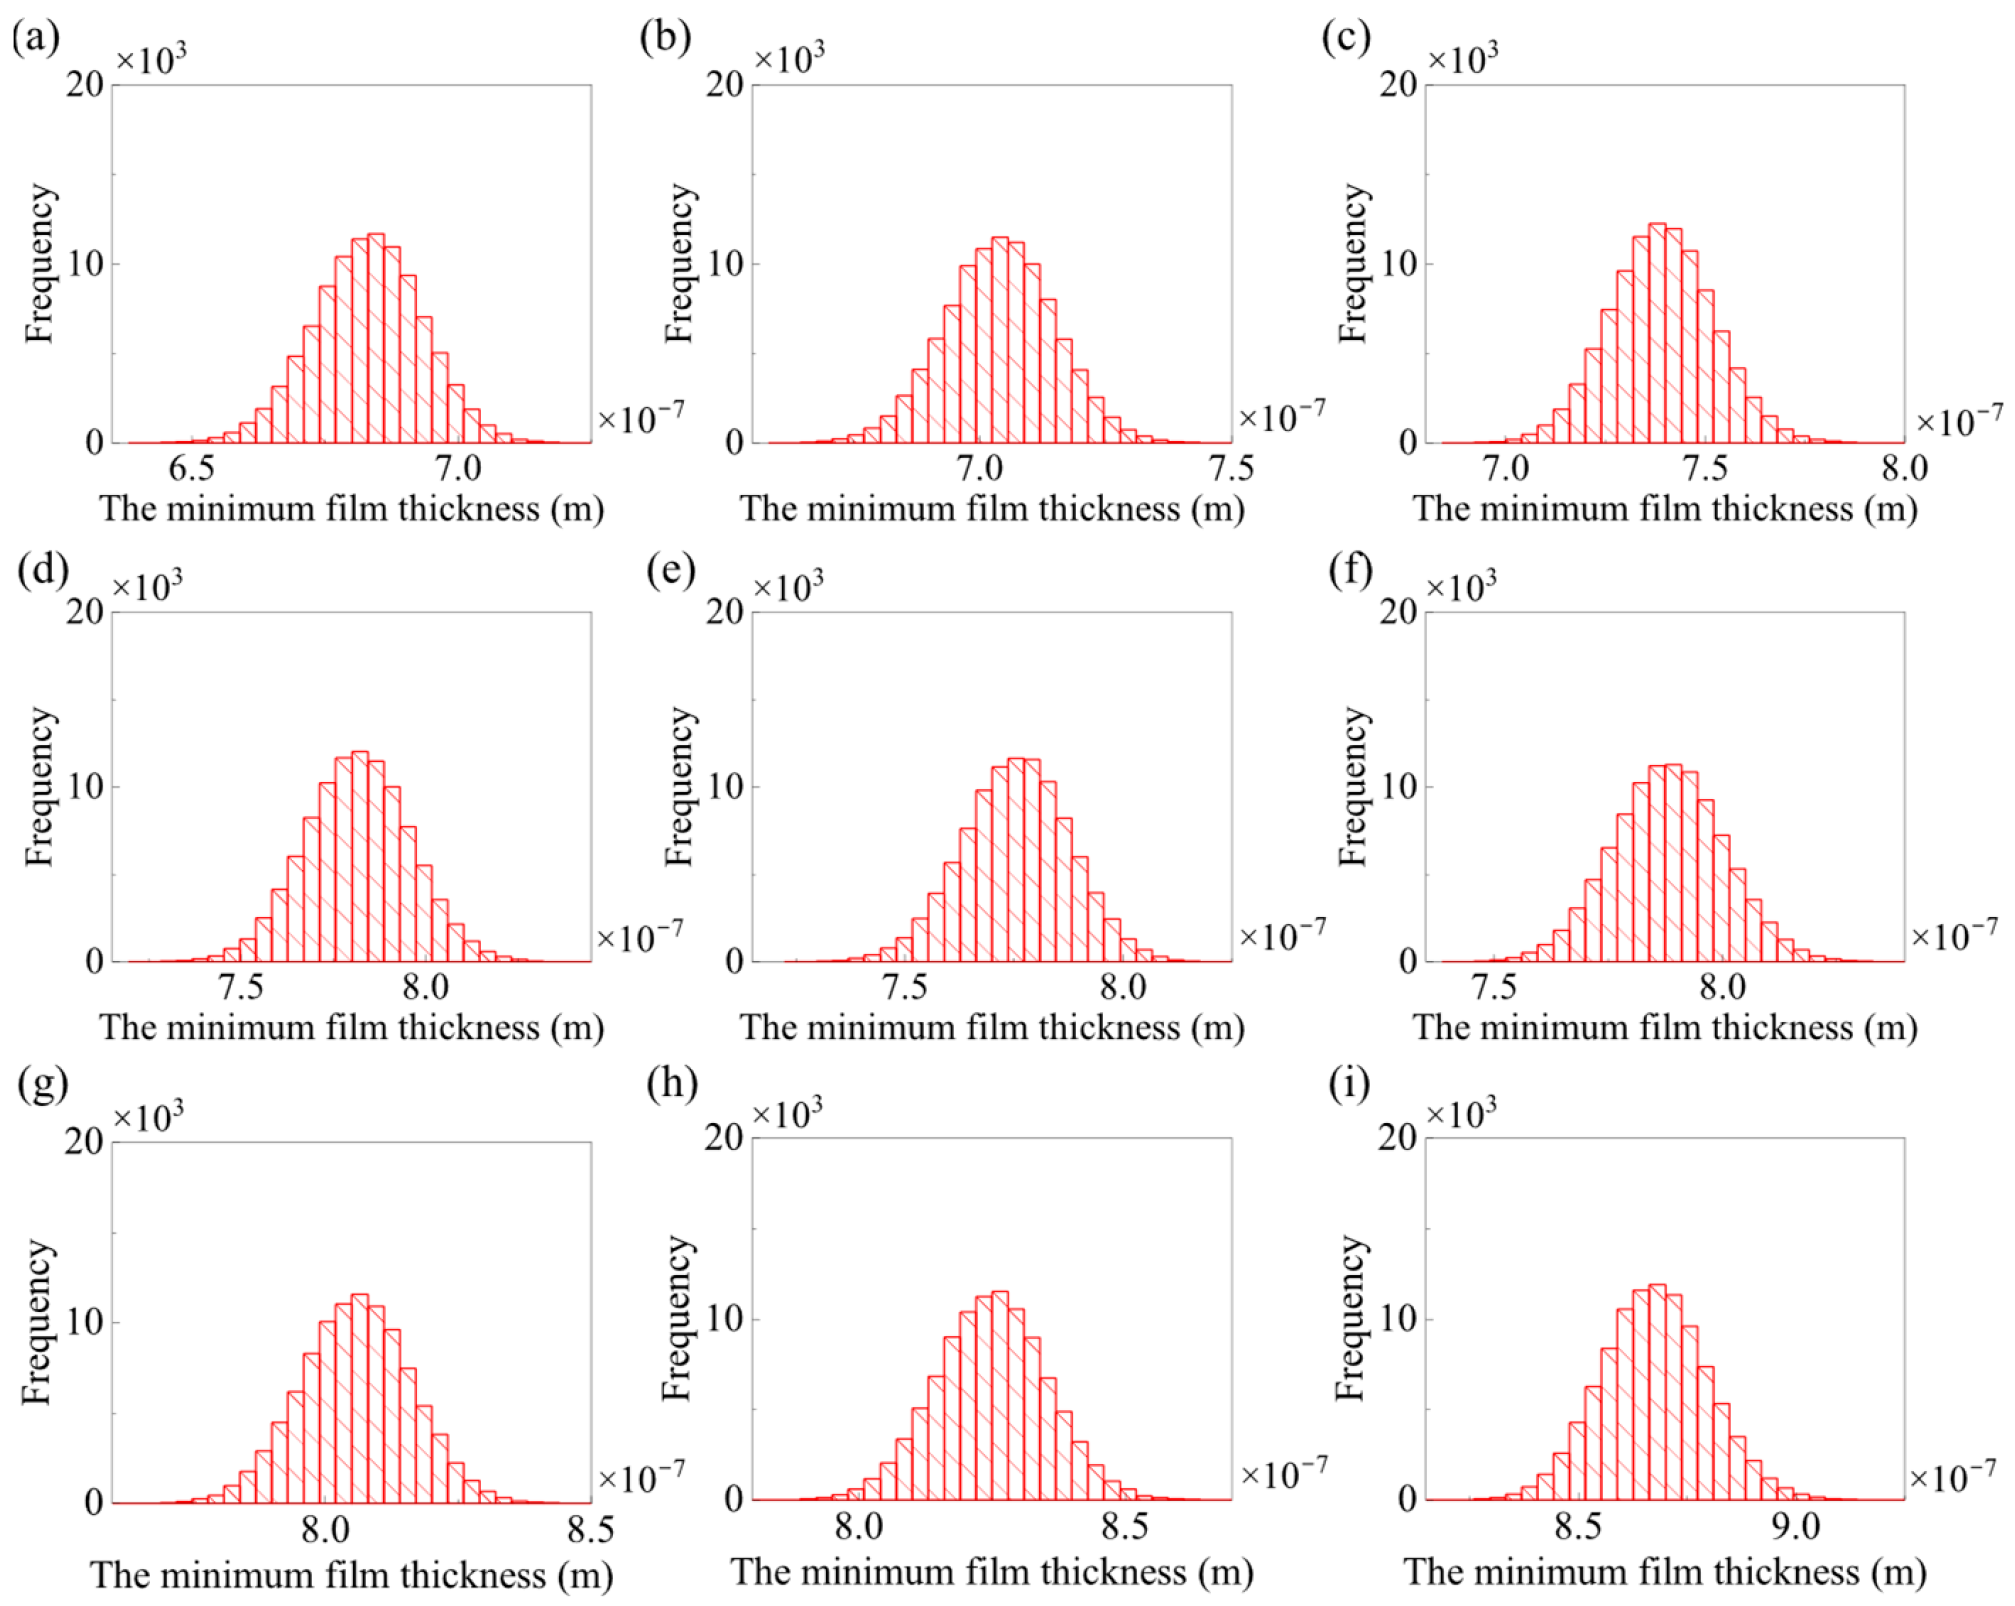
Before the gear lubrication reliability analysis, the MFT probability histogram of 9 moments corresponding to Figure 13 was obtained, and are shown in Figure 14. At the same time, the first four order statistical moments and variation coefficient of the MFT at the 9 moments are obtained in Table 6. The parameters selected in this section are as follow: the driving gear speed n1 = 1500 r/min, RMS roughness σ = 0.1 μm, skewness sk = 0, the variation coefficient of RMS roughness is 0.1, and the standard deviation of skewness is 0.2. As can be observed from Table 6 and Figure 14, the probability distribution of the MFT approximates the Gaussian distribution. This is due to the fact that both the equivalent curvature radius and the entrainment velocity are close to the Gaussian distribution. Consequently, it can be deduced that the impact of these two factors on the randomness of the MFT is more significant than that of the meshing force. Despite the coefficient of variation being larger than that of the gear parameter, no evident variation pattern is manifested. Thus, the uncertainty is augmented during the transmission from gear parameters to the MFT, yet the extent of amplification is not pronounced.
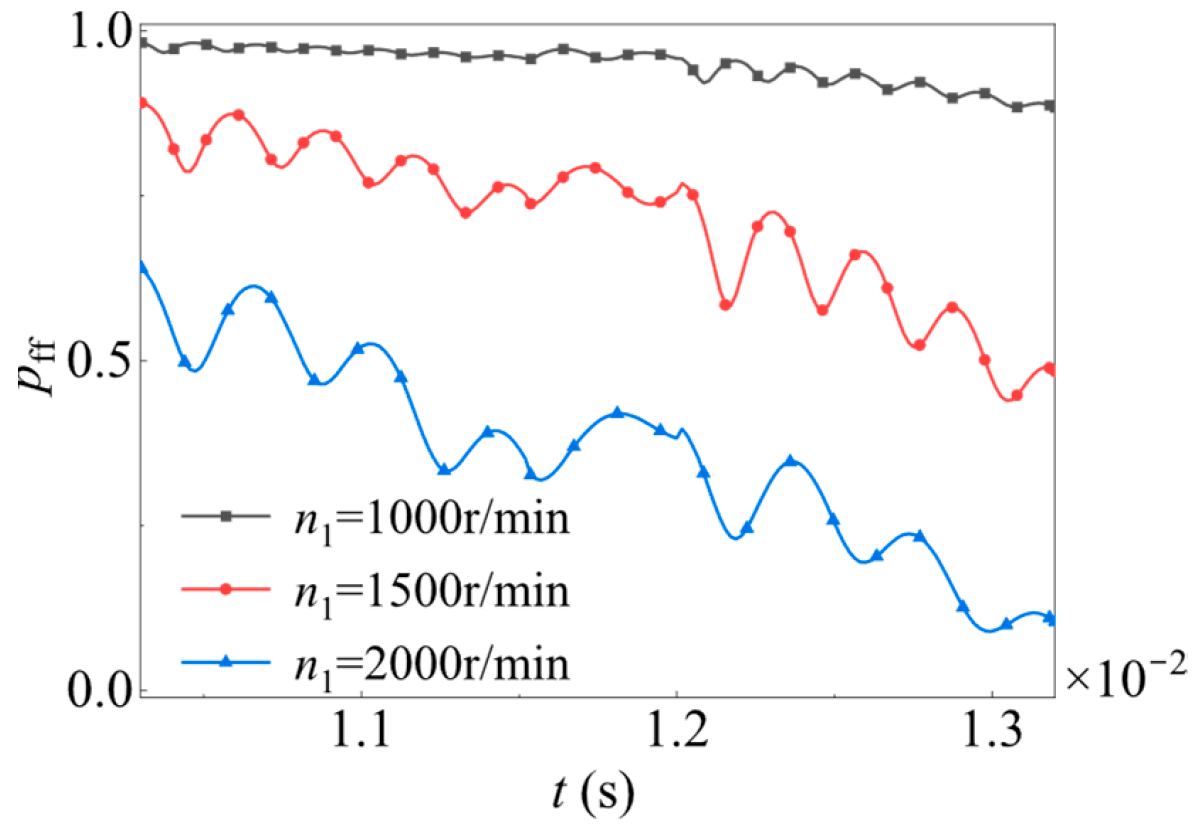
Figure 15 illustrates the probability of lubrication failure of a gear tooth from approach point to recession point at different gear speeds. The speed of the driving gear are set as n1 = 1000 r/min, n1 = 1500 r/min, and n1 = 2000 r/min respectively. The ordinate pff denotes the failure probability of lubrication. The mean of RMS roughness and skewness of rough surfaces are σm = 0.1 μm and skm = 0, respectively. Set the variation coefficient of RMS roughness to 0.2, and the standard deviation of skewness to 0.2 and keeps constant. The results indicate that the rotational speed has a substantial impact on the reliability of gear lubrication. When the speed is lower than a specific value, a complete oil film fails to be formed. However, when the speed exceeds a certain value, full film lubrication can always be ensured.
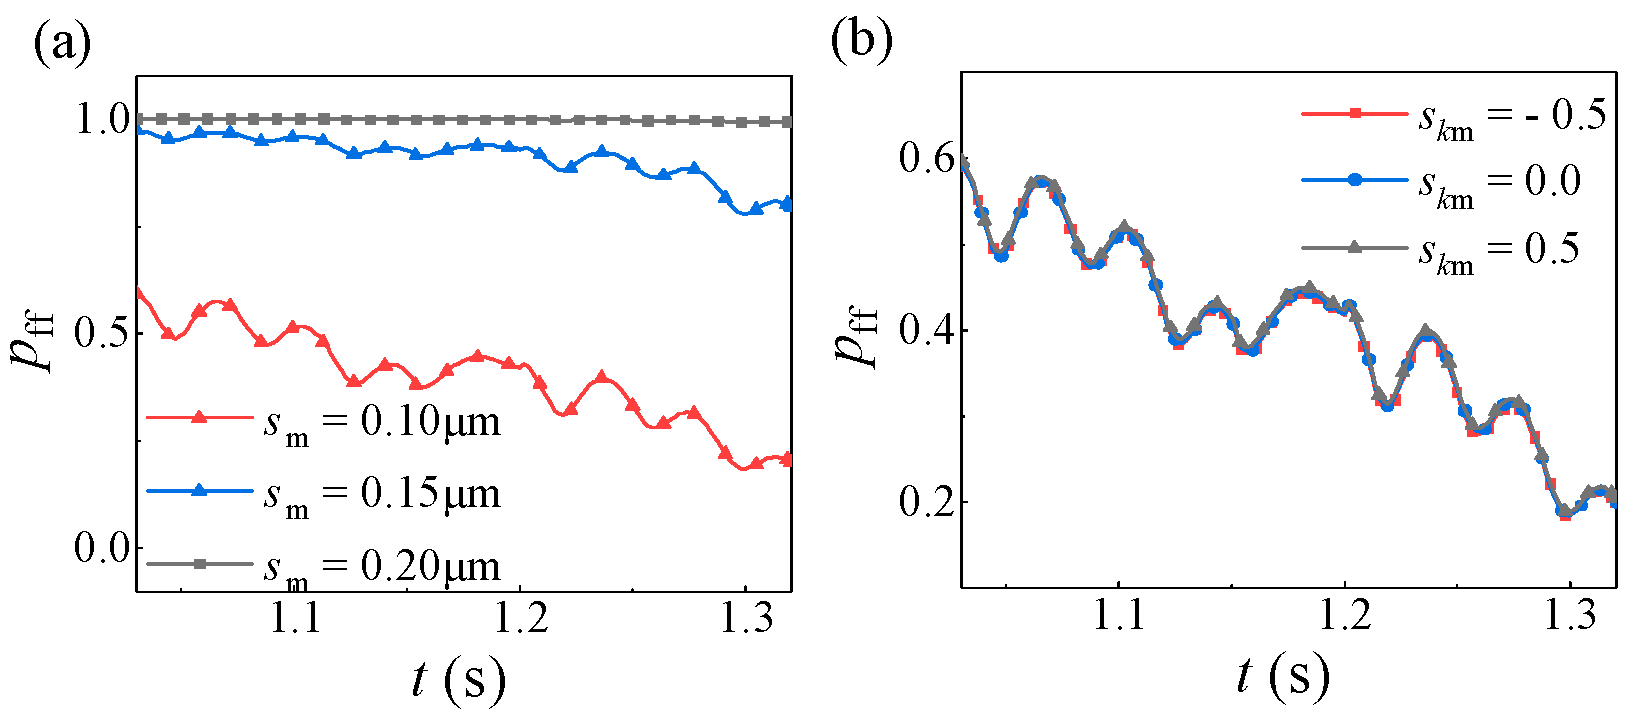
The lubrication failure probability of gear system with different comprehensive RMS roughness and skewness in the meshing cycle of single tooth is shown in Figure 16. The driving gear speed is n1 = 2000 r/min. In Figure 16a, the mean roughness of the comprehensive RMS is set as σm = 0.10 μm, σm = 0.15 μm, σm = 0.20 μm, respectively, their standard deviations are set as 0.03 μm, the mean skewness is skm = 0, and the standard deviations of skewness are all 0.3. In Figure 16b, the comprehensive RMS roughness is σm = 0.10 μm, the standard deviation is 0.03 μm. Skewness is set to skm = −0.5, skm = 0, skm = 0.5 respectively, and their standard deviations are set to 0.3. Based on the results, conclusions are drawn that the root RMS roughness exerts a significant influence on the lubrication reliability of gears. Specifically, the probability of lubrication failure tends to decrease as the roughness value decreases. Nevertheless, when the roughness drops below a certain value, the improvement effect brought about by further reducing it on the lubrication reliability becomes no longer evident. In contrast, the impact of skewness on the probability of lubrication failure is relatively minor. As the skewness increases, the probability of lubrication failure only experiences a slight increase.

4.3. Degradation Law of Gear Surface Roughness and Lubrication Reliability

In the process of service, with the increase of wear, the shape of the tooth surface also changes. From the preceding analysis, it is evident that the shape parameters of the tooth surface have a substantial influence on the lubrication reliability. Consequently, a gear wear test was devised to explore the patterns in which tooth surface roughness parameters such as Ra, Rq, Sk, and Ku vary with the degree of wear.

4.3.1. Design of Test Device

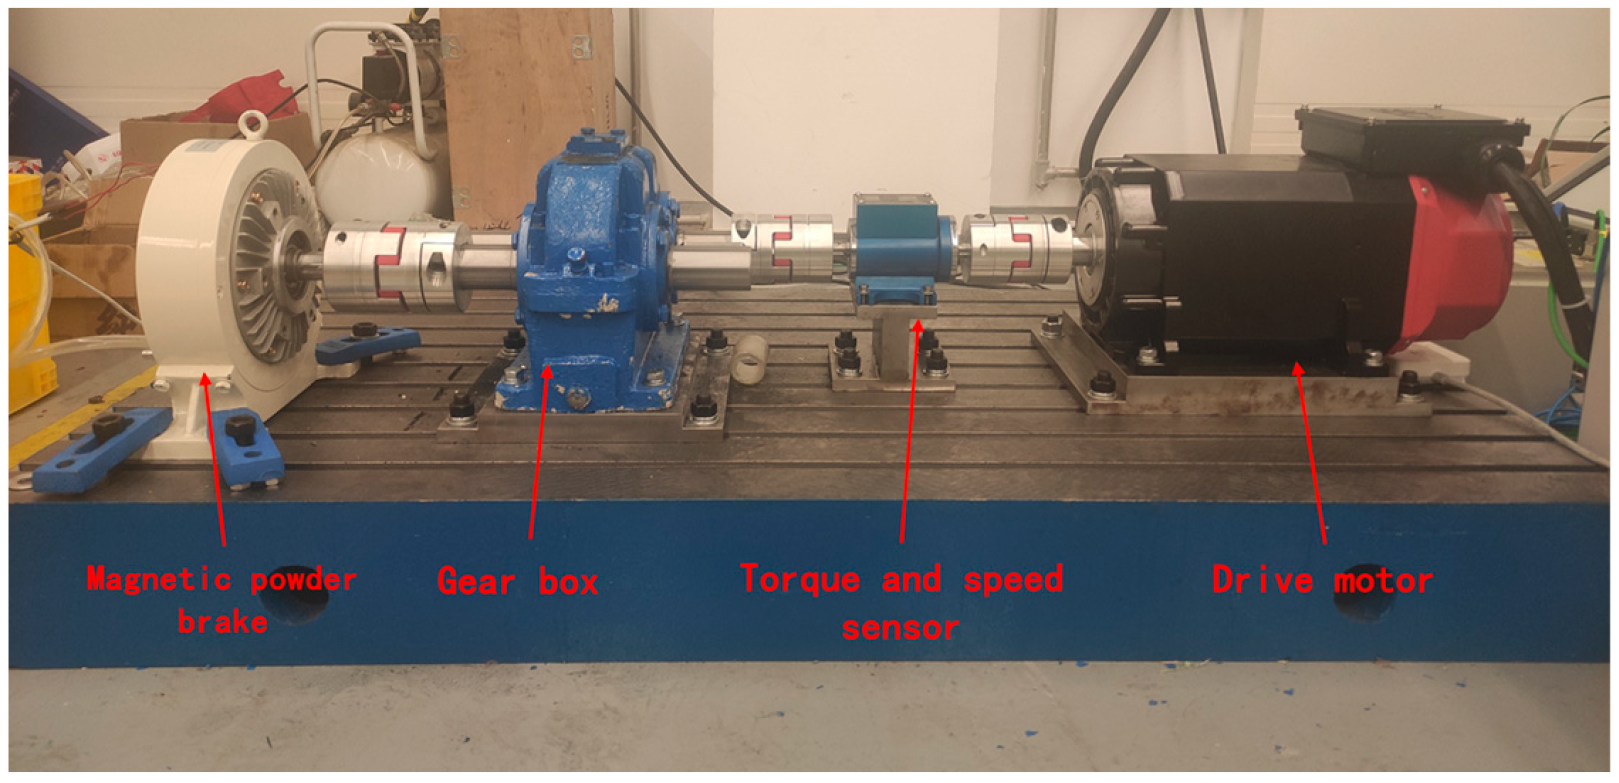
As illustrated in Figure 17, the gear test device consists of an AC servo motor, torque speed sensor, gearbox, magnetic powder brake, acceleration sensor, etc.
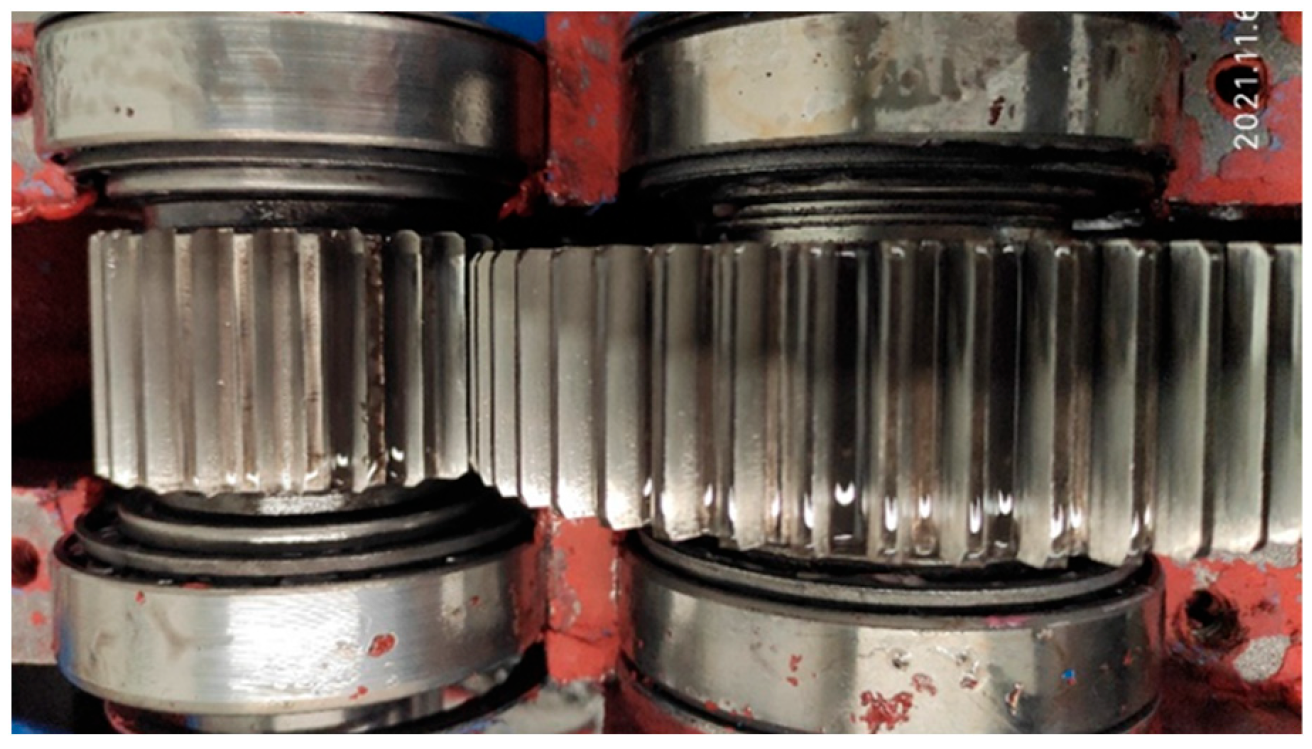
The control interface of the experimental device is shown in Figure 18. There are two control modes: torque and speed. The output torque and speed of the motor in real-time can be recorded. The test gear depicted in Figure 19 is an involute spur gear with a modulus of 2.75. The number of teeth on the driving wheel is 24, while that on the driven wheel is 49, and the machining accuracy is at level 6. During the experiment, the output torque of the driving motor was 50 N⸱m, and the output speed was 500 r/min.

4.3.2. Tooth Surface Roughness Experiment

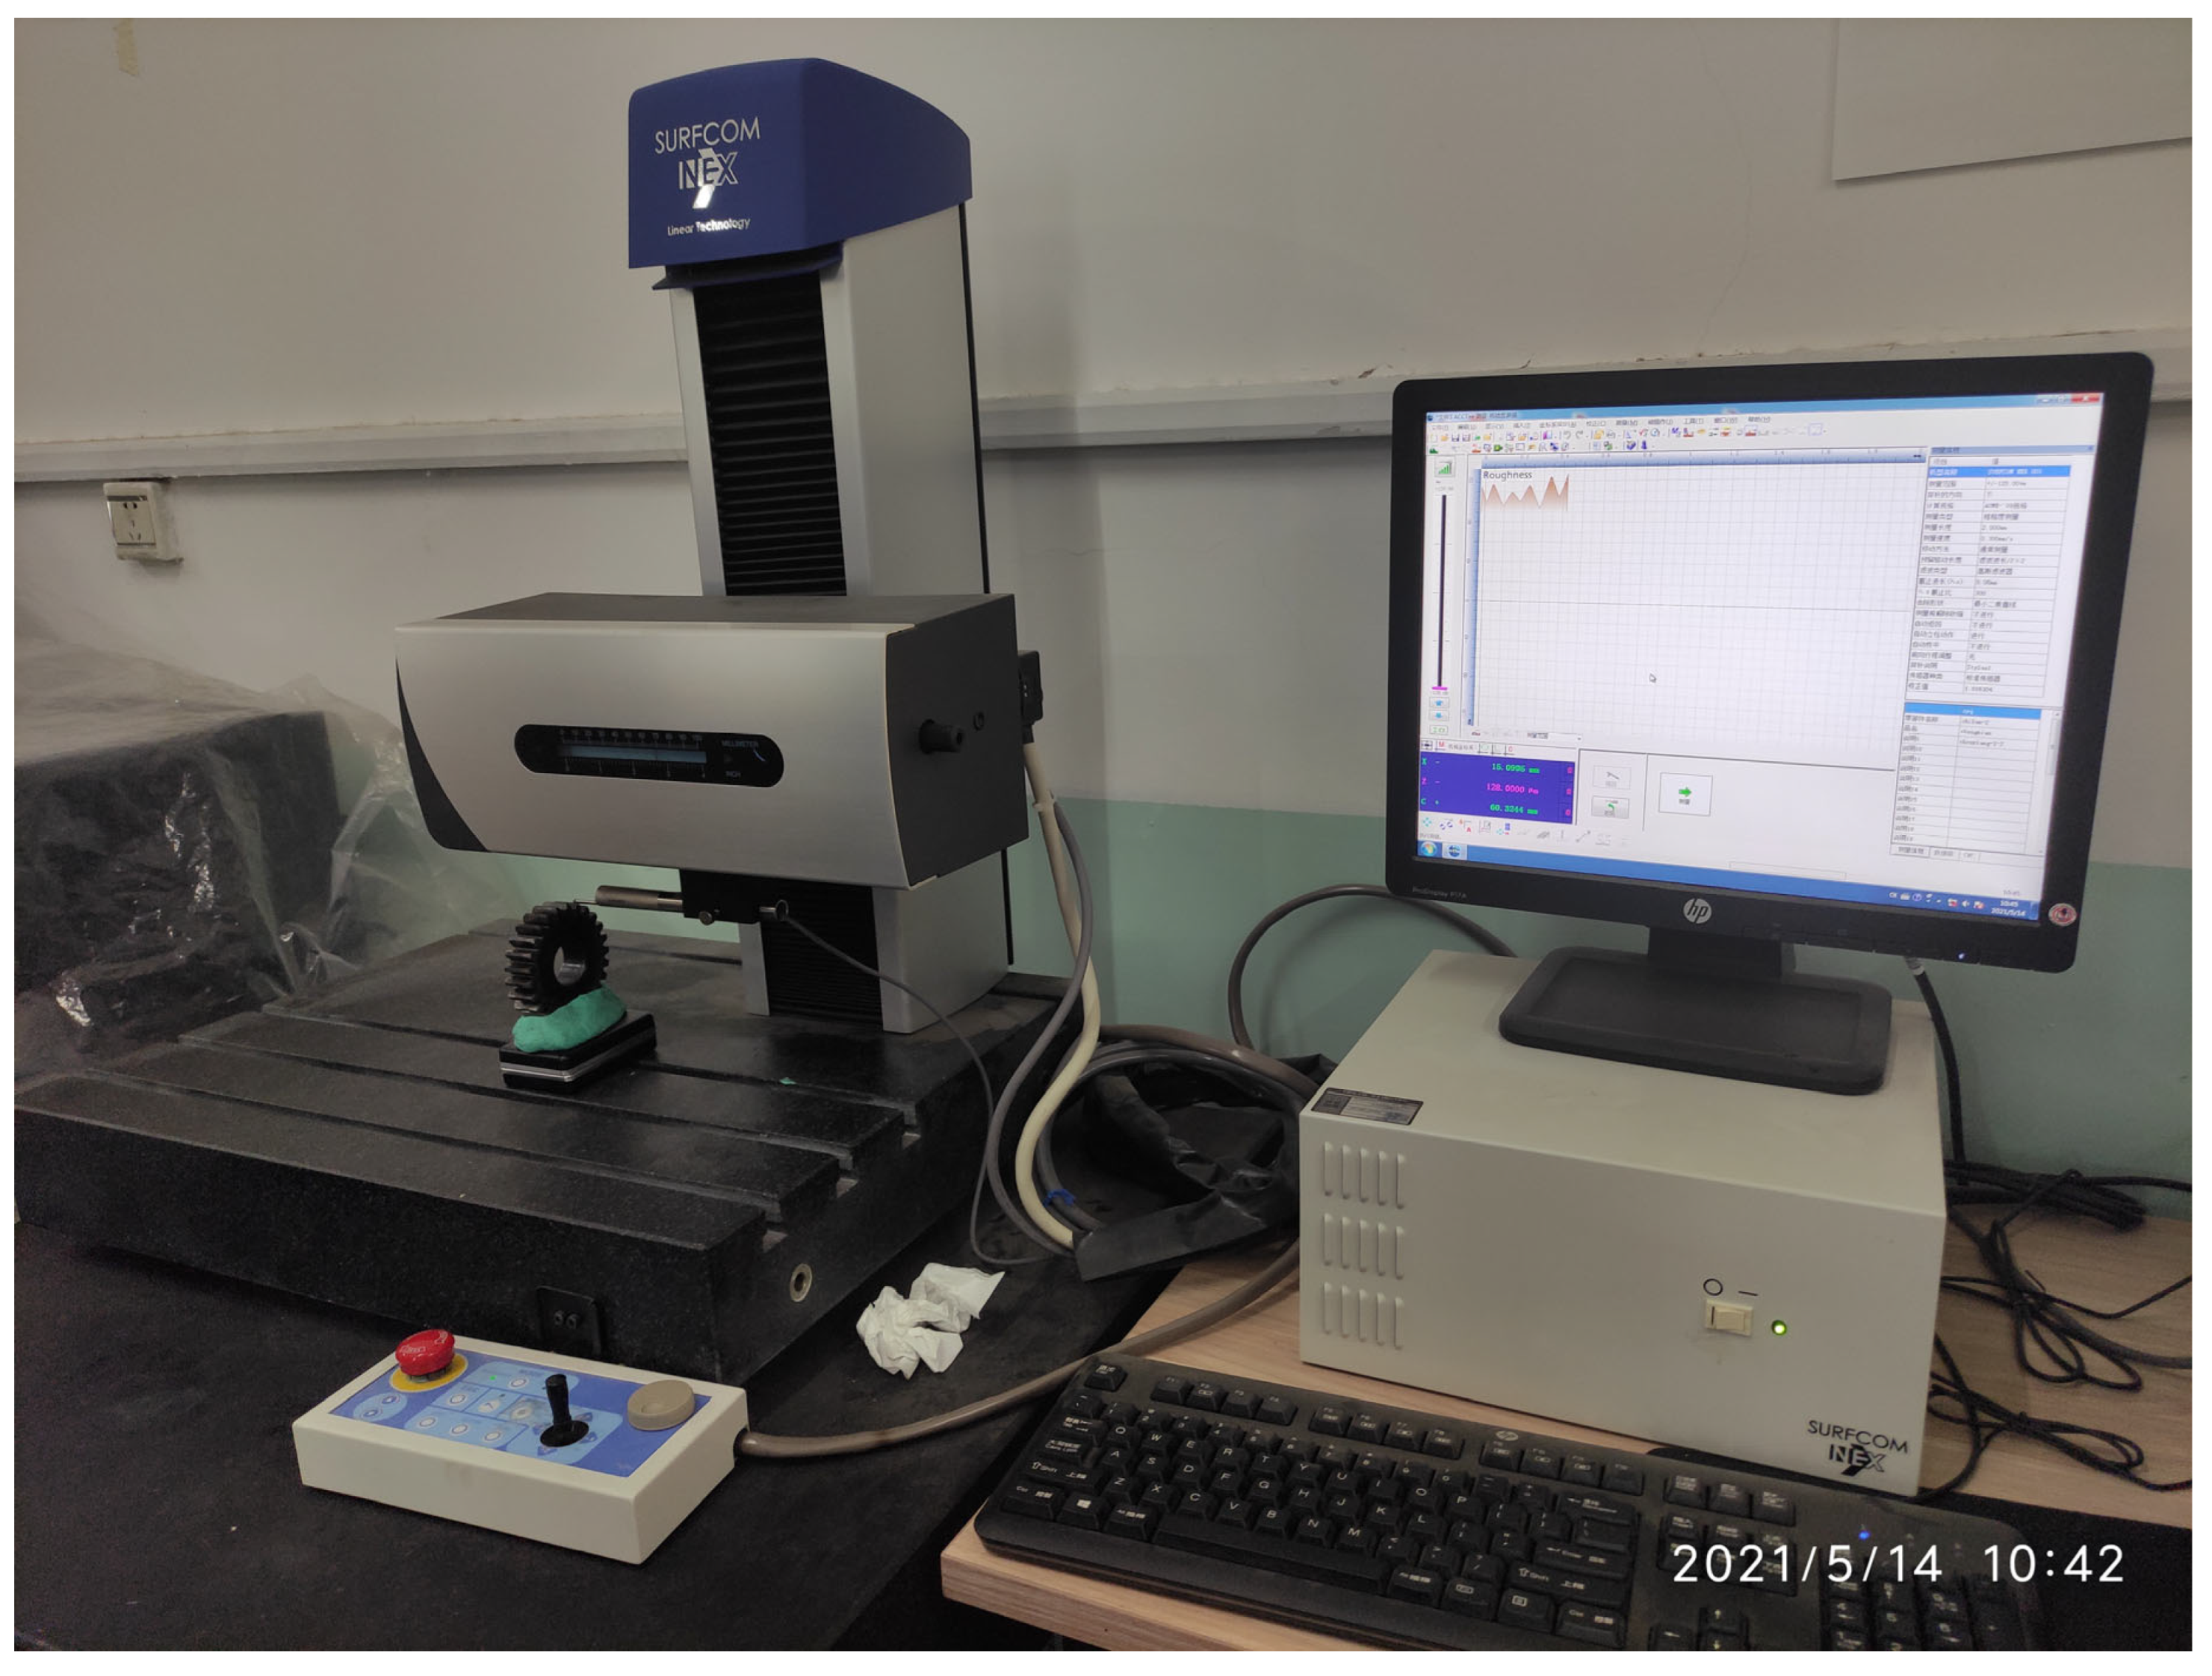
In this article, the roughness measurement of gears is conducted by utilizing the SURFCOM NEX 001SD-12 manufacted by Tokyo Seimitsu Co., LTD., Tokyo, Japan surface roughness measuring instrument manufactured by Tokyo Precision (as illustrated in Figure 20). This measuring instrument is applicable for measuring flat surfaces, inclined surfaces, outer cylindrical surfaces, inner hole surfaces and so on. It can readily acquire rough surface parameters such as Ra, Rq, Rz, Sk, Ku and others.
The data obtained by the roughness measuring instrument reflect the statistical characteristics of the surface height over the test length, and it is usually assumed that the surface height is stable in the measurement direction. Therefore, Rq, Sk, and Ku can be used to replace RMS roughness, sk, and ku in lubrication analysis.
The test lasted for 150 h, and the radial roughness of 3 specific teeth of the driving gear was measured every 30 h, and the meshing surface of each tooth was measured 5 times. Then 15 groups of measurement results were statistically processed. In 5 measurements from 30 h to 150 h, the mean value, standard deviation, and coefficient of variation of Ra, Rq, Sk, and Ku are shown in Table 7, Table 8, Table 9, Table 10, Table 11 and Table 12. The profiles of three gear teeth on the driving wheel are shown in Figure 21. (a–c) are the shapes of the three tooth profiles after 150 h, with the left side being the non-contact surface and the right side being the contact surface. It can be seen that the wear is greater in the root and top areas of the teeth, and the wear is the smallest near the nodes.
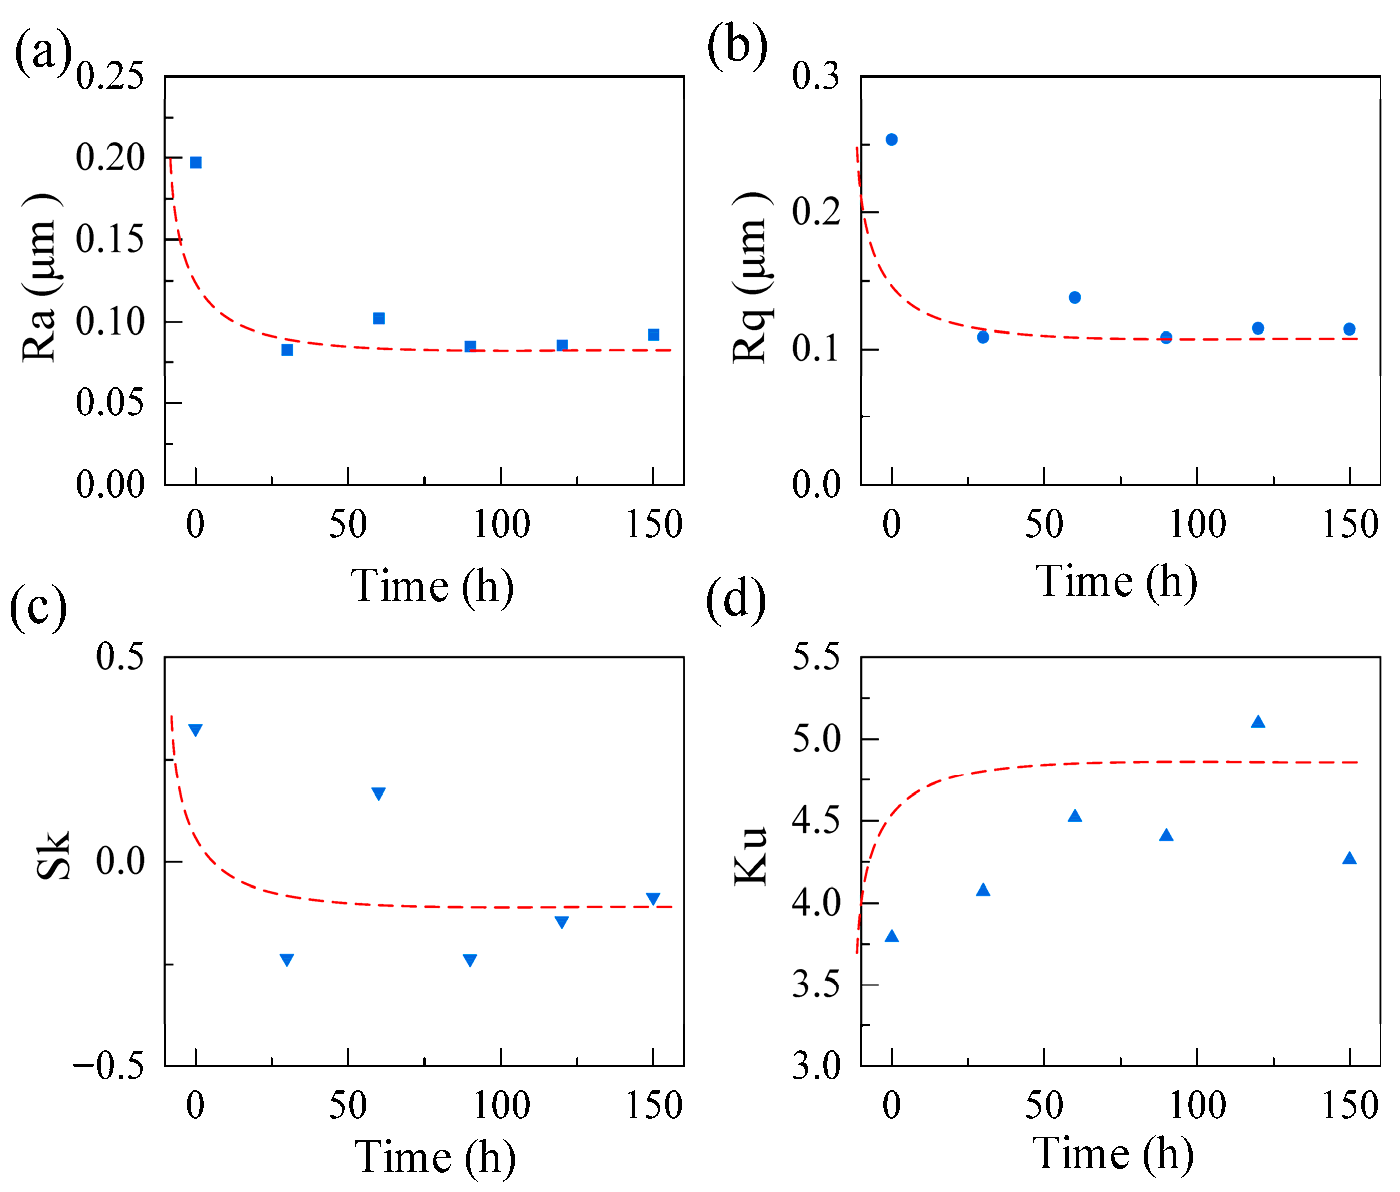
Figure 22 presents the variations in the mean values of the four roughness parameters within the time range from 0 to 150 h. The line represents the change trend of the roughness surface. It can be observed that the mean values of Ra and Rq initially decline rapidly as wear occurs and then gradually stabilize. The mean value of Sk demonstrates a downward trend, whereas the mean value of Ku increases first and then stabilizes. The randomness of Sk and Ku are greater than Ra and Rq. The variation patterns of these four parameters over time all display the characteristics of a bathtub curve, featuring a sharp change at first and then reaching a relatively stable plateau stage.
Figure 22. Variation process of gear surface roughness parameters with wear (a) average Ra; (b) average Rq; (c) average Sk; (d) average Ku.
Lubricants 13 00392 g022

4.3.3. Evolution of Gear Lubrication Reliability

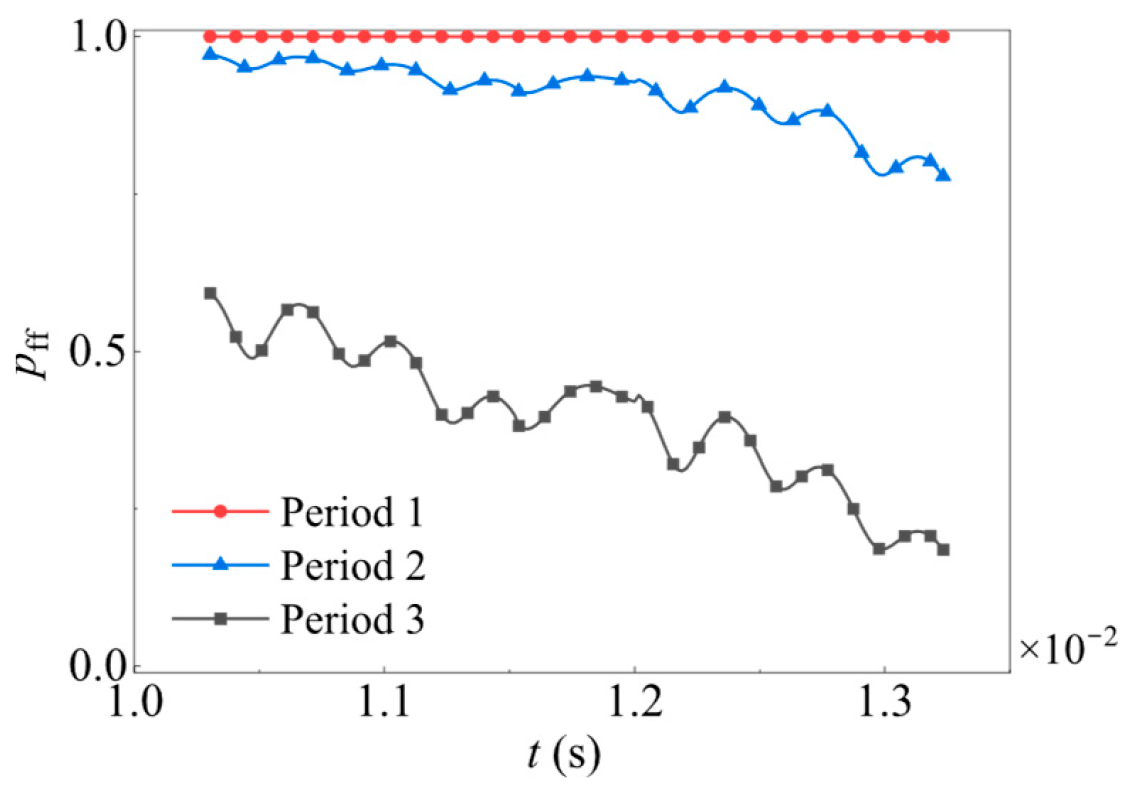
In order to investigate the alterations in the lubrication reliability of gears during the service period, this section selects three wear stages within the tooth surface wear process to simulate the three moments ranging from the running-in wear stage to the stable wear stage. Based on the previous experiment, it can be noticed that as the wear progresses, the RMS roughness and skewness gradually decrease, while the degree of dispersion gradually increases. The surface roughness parameters of these three stages are presented in Table 13.
The values of mean and standard deviation of RMS roughness and skewness in the three stages are shown in Table 13. The driving gear speed is taken as n1 = 2000 r/min. Figure 23 illustrates the probability of lubrication failure during a single tooth meshing cycle across three stages. It can be readily concluded that the probability of lubrication failure is relatively higher in the early stage of gear service (stage one). As the wear progresses, the lubrication reliability of the gear improves. Since this article only focuses on the running-in and stable wear stages, the lubrication performance gradually gets better over the service time. However, when the service time increases further, the roughness will increase sharply and enter the stage of severe wear. It can thus be easily predicted that the lubrication reliability will decline at that time as well.
Figure 23. Lubrication failure probability of a single tooth meshing cycle at different service stages.
Lubricants 13 00392 g023

5. Conclusions

To address the challenge of lubrication state reliability arising from gear parameter uncertainty, a gear lubrication reliability analysis method considering gear parameter uncertainty is proposed in the present work. A gear dynamics model was established to obtained the meshing force. The geometric and kinematic analyses of the gear pair were carried out to obtain the equivalent curvature radius and entrainment velocity. Finally, a gear lubrication reliability model was established, and the effects of rotational speed, surface roughness, and other parameters on gear lubrication reliability were systematically analyzed using MSC. The following conclusions were drawn:
  • The dynamic meshing force no longer follows a Gaussian distribution, whereas the equivalent curvature radius and entrainment velocity remain Gaussian-distributed. While the MFT does not obey the Gaussian distribution, its non-Gaussian property is weaker than the meshing force. Additionally, the uncertainties from gear parameters to meshing forces and MFT are increased.
2.
The lubrication failure probability of the gear pair is higher in the root area compared to other areas. The result indicates that the gear speed and RMS roughness have a significant effect on the lubrication reliability of the gear, while the skewness of the gear tooth surface has a relatively small effect.
3.
The tooth surface roughness parameters change drastically in the early stage of service and then tend to be stable. However, its randomness continues to increase with the increase of wear, and the lubrication reliability of the gear improves with the increase of wear in the early stage.
In summary, the present work highlights the significant influence of gear parameter uncertainties on lubrication reliability, providing deeper insights into the interactions between gear dynamics, wear behavior, and lubrication performance. These findings contribute valuable guidance for the design and maintenance of reliable gear systems under uncertain operating conditions.
Author Contributions

Conceptualization, J.P. and Y.T. (Yourui Tao); methodology, J.P.; software, J.P. and H.H.; validation, Y.T. (Yuanyuan Tian) and M.W.; formal analysis, M.W.; investigation, L.W.; resources, Y.T. (Yuanyuan Tian); data curation, Y.T. (Yourui Tao); writing—original draft preparation, J.P.; writing—review and editing, H.H.; visualization, Y.T. (Yuanyuan Tian); supervision, Y.T. (Yourui Tao); project administration, Y.T. (Yuanyuan Tian); funding acquisition, Y.T. (Yourui Tao). All authors have read and agreed to the published version of the manuscript.

Funding

This work is supported by the National Natural Science Foundation of China (U23A6017, 52075146).

Conflicts of Interest

The authors declare that they have no conflict of interest.

Nomenclature

cmeshing damping coefficientSkskewness of rough surface height (random variable)
estatic transmission error, mskskewness of rough surface height
e effective modulus of elasticityT1, T2input and output torques, N⸱m
Fmequivalent driving force, Ntcmeshing cycle, s
Gthe material parameter (random variable)Uvelocity parameter (random variable)
dimensionless material numberu1, u2instantaneous tangential velocity, m/s
Hminthe minimum film thickness (random uentrainment velocity, m/s
 variable)ūvelocity parameter
hminminimum film thickness, mWload parameter (random variable)
I1, I2moment of inertia of the pinion and gear w ¯ load parameter
 kg⸱m2αpressure-viscosity coefficient, m2/N
jbnbacklash, mβpressure angle
kmeshing stiffness, N/mζdamping ratio
kmaverage meshing stiffness, N/mη0viscosity at ambient conditions
ldimensionless rigid body displacementθ1, θ2torsional displacement of pinion and 
meequivalent massλgear film thickness ratio
Requivalent radius of curvature (random Σdimensionless RMS roughness (random 
 variable) variable)
Rb1, Rb2base radius of the pinion and gear, mσRMS roughness, m
r1, r2curvature radius of the pinion and gear, m σ ¯ dimensionless RMS roughness
rradius of the equivalent cylinderφphase angle
Spdistance between the meshing point and   
 the pitch point, m  

References

  1. Xiao, Z.; Li, Z.; Shi, X.; Zhou, C. Oil film damping analysis in non-Newtonian transient thermal elastohydrodynamic lubrication for gear transmission. J. Appl. Mech. Trans. ASME 2018, 85, 035001. [Google Scholar] [CrossRef]
  2. Larsson, R. Transient non-Newtonian elastohydrodynamic lubrication analysis of an involute spur gear. Wear 2021, 48, 74–84. [Google Scholar] [CrossRef]
  3. Jiang, Z.; Sun, Y.; Liu, B.; Yu, L.; Tong, Y.; Yan, M.; Yang, Z.; Hao, Y.; Shangguan, L.; Zhang, S.; et al. Research progresses of nanomaterials as lubricant additives. Friction 2024, 12, 1347–1391. [Google Scholar] [CrossRef]
  4. Conrad, A.; Hodapp, A.; Hochstein, B.; Willenbacher, N.; Jacob, K.H. Low-temperature rheology and thermoanalytical investigation of lubricating oils: Comparison of phase transition, viscosity, and pour point. Lubricants 2021, 9, 99. [Google Scholar] [CrossRef]
  5. Hjelm, R.; Wahlström, J. Influence of manufacturing error tolerances on thermal EHL behavior of gears. Lubricants 2022, 10, 323. [Google Scholar] [CrossRef]
  6. Luo, Q.; Dong, Q.; Zhao, B.; Yang, H.; Wei, J.; Zhao, B. A numerical investigation of mixed thermal elastohydrodynamic lubrication in tilting-pad journal bearing. ASME J. Tribol. 2024, 146, 092202. [Google Scholar] [CrossRef]
  7. Song, X.; Wu, W.; Yuan, S. Thermal elastohydrodynamic lubrication analysis of helical gear in electric vehicle’s reducer with micro-pitting taken into consideration. ASME J. Mech. Des. 2022, 339, 1–9. [Google Scholar]
  8. Yin, Z.; Fan, Z.; Wang, M. Thermal elastohydrodynamic lubrication characteristics of double involute gears at the graded position of tooth waist. Tribol. Int. 2020, 144, 106028. [Google Scholar] [CrossRef]
  9. Huang, X.; Yang, B.; Wang, Y. Influences of transient impact and vibration on the lubrication performance of spur gears. Proc. Inst. Mech. Eng. Part J J. Eng. Tribol. 2023, 47, 274–289. [Google Scholar] [CrossRef]
  10. Pei, J.; Tian, Y.; Hou, H.; Tao, Y.; Wu, M.; Guan, Z. Dynamic response and lubrication performance of spur gear pair under time-varying rotation speeds. Lubricants 2025, 13, 15. [Google Scholar] [CrossRef]
  11. Hultqvist , T.; Vrcek , A.; Marklund , P.; Prakash , B.; Larsson , R. Transient analysis of surface roughness features in thermal elastohydrodynamic contacts. Tribol. Int. 2020, 141, 105915. [Google Scholar]
  12. Wu, C.; Zhang, L. Surface texture transfer in skin-pass rolling under mixed lubrication. Int. J. Mech. Sci. 2025, 286, 109858. [Google Scholar] [CrossRef]
  13. Pei, J.; Han, X.; Tao, Y. A Reliability Analysis Method for Gear Elastohydrodynamic Lubrication under Stochastic Load. Tribol. Trans. 2020, 63, 879–890. [Google Scholar] [CrossRef]
  14. Chen, Z.; Sha, H.; Li, S.; Tong, Z.; Tong, S. Stochastic uncertain lubrication in gear transmission subjected to tribodynamic loading. Friction 2024, 12, 1741–1756. [Google Scholar] [CrossRef]
  15. Huang, X.; Hu, S.; Zhang, Y.; Xu, Y. A method to determine kinematic accuracy reliability of gear mechanisms with truncated random variables. Mech. Mach. Theor. 2015, 92, 200–212. [Google Scholar] [CrossRef]
  16. Hu, Y.; Liu, S.; Chang, J.; Zhang, J.G. An intelligent method for contact fatigue reliability analysis of spur gear under EHL. J. Cent. South Univ. 2015, 22, 3389–3396. [Google Scholar] [CrossRef]
  17. Hu, Y.; Liu, S.; Ding, S.; Liao, Y.S. Application of response surface method for contact fatigue reliability analysis of spur gear with consideration of EHL. J. Cent. South Univ. 2015, 22, 2549–2556. [Google Scholar] [CrossRef]
  18. Qian, H.-M.; Huang, H.; Li, Y.-F. A novel active learning Kriging-based reliability analysis method for aero-engine gear. ASME J. Risk Uncertain. Part B 2025, 11, 031208. [Google Scholar] [CrossRef]
  19. Li, M.; Xie, L.; Ding, L. Load sharing analysis and reliability prediction for planetary gear train of helicopter. Mech. Mach. Theor. 2017, 115, 97–113. [Google Scholar] [CrossRef]
  20. Chen, J.; Chen, L.; Qian, L. Time-dependent kinematic reliability analysis of gear mechanism based on sequential decoupling strategy and saddle-point approximation. Reliab. Eng. Syst. Saf. 2022, 220, 108292. [Google Scholar] [CrossRef]
  21. Yao, Q.; Dai, L.; Tang, J.; Wu, H.; Liu, T. High-speed rolling bearing lubrication reliability analysis based on probability box model. Probabilistic Eng. Mech. 2024, 76, 103612. [Google Scholar] [CrossRef]
  22. Pei, J.; Han, X.; Tao, Y.; Feng, S. Study on wear dynamic reliability of gear system based on Markov diffusive process. ASME J. Tribol. 2022, 144, 021202. [Google Scholar] [CrossRef]
  23. Wang, J.; He, G.; Zhang, J.; Zhao, Y.; Yao, Y. Nonlinear dynamics analysis of the spur gear system for railway locomotive. Mech. Syst. Signal Process. 2017, 85, 41–55. [Google Scholar] [CrossRef]
  24. Kahraman, A.; Singh, R. Non-linear dynamics of a spur gear pair. J. Sound. Vib. 1990, 142, 49–75. [Google Scholar] [CrossRef]
  25. Wang, K.L.; Cheng, H.S. A numerical solution to the dynamic load, film thickness, and surface temperature-sin spur gears, part I: Analysis. ASME J. Mech. Des. 1981, 103, 177–187. [Google Scholar]
  26. Pei, J.; Han, X.; Tao, Y.; Feng, S. Mixed elastohydrodynamic lubrication analysis of line contact with Non-Gaussian surface roughness. Tribol. Int. 2020, 151, 106449. [Google Scholar] [CrossRef]
  27. Wen, S.; Huang, P. Principles of Tribology; Tsinghua University Press: Beijing, China, 2002. [Google Scholar]
  28. Chen, Z.; Huang, D.; Li, X.; Qiu, G.; Zhao, P. A reliability analysis method based on the intersection area division of hypersphere and paraboloid. Reliab. Eng. Syst. Saf. 2024, 252, 110461. [Google Scholar] [CrossRef]
  29. Jiang, C.; Qiu, H.; Yang, Z.; Chen, L.; Gao, L.; Li, P. A general failure-pursuing sampling framework for surrogate-based reliability analysis. Reliab. Eng. Syst. Saf. 2019, 183, 47–59. [Google Scholar] [CrossRef]
  30. Yu, S.; Ren, Y.; Wu, X. Dynamic pruning-based Bayesian support vector regression for reliability analysis. Reliab. Eng. Syst. Saf. 2024, 244, 109922. [Google Scholar] [CrossRef]
  31. Yang, X.; Cheng, X.; Wang, T. System reliability analysis with small failure probability based on active learning Kriging model and multimodal adaptive importance sampling. Struct. Multidiscip. Optim. 2020, 62, 581–596. [Google Scholar] [CrossRef]
  32. Tang, J.; Zhang, T.; Liu, T.; Zhang, Z.; Cao, L.; Yao, Q. A non-intrusive interval analysis method for chatter stability of uncertain milling systems. J. Manuf. Process. 2025, 145, 142–157. [Google Scholar] [CrossRef]
  33. Wei, Y.; Chen, J.; Ma, H. Analysis of the nonlinear dynamic response of gear-rotor with random parameters. Eng. Mech. 2012, 29, 319–324. [Google Scholar]
  34. Wei, Y.; Chen, J.; Wang, M. Dynamic response of torsional vibration of gear-rotor with random parameters. J. Aerosp. 2010, 25, 2637–2642. [Google Scholar]
Figure 1. Dynamic model of the gear pair.
Lubricants 13 00392 g001
Figure 2. Time-variant meshing stiffness.
Lubricants 13 00392 g002
Figure 3. Geometric parameters of gears.
Lubricants 13 00392 g003
Figure 5. Three lubrication states.
Lubricants 13 00392 g005
Figure 6. Process of solving gear lubrication reliability by MCS method.
Lubricants 13 00392 g006
Figure 7. Dynamic mesh force sample.
Lubricants 13 00392 g007
Figure 8. Sample of single tooth meshing force.
Lubricants 13 00392 g008
Figure 9. Samples of radius of curvature and entrainment velocity (a) equivalent radius of curvature; (b) entrainment velocity.
Lubricants 13 00392 g009
Figure 10. Frequency histogram of a point’s engagement force in different engagement cycles (af) the 1st to 6th engagement cycles.
Lubricants 13 00392 g010
Figure 11. Histogram of the equivalent radius of curvature at different times (a) time 1; (b) time 2.
Lubricants 13 00392 g011
Figure 12. Histogram of entrainment velocity at different times (a) time 1; (b) time 2.
Lubricants 13 00392 g012
Figure 13. The meshing force histogram of 9 equal time intervals in a single tooth meshing cycle (ai) time 1 to time 9.
Lubricants 13 00392 g013
Figure 14. Histogram of minimum film thickness at 9 equal time intervals in a single tooth meshing cycle (ai) time 1 to time 9.
Lubricants 13 00392 g014
Figure 15. Lubrication failure probability of a single tooth meshing cycle at different drive gear speeds.
Lubricants 13 00392 g015
Figure 16. Lubrication failure probability of a single tooth meshing cycle with different (a) RMS roughness and (b) skewness.
Lubricants 13 00392 g016
Figure 17. Gear wear test device.
Lubricants 13 00392 g017
Figure 18. Control interface of the gear test device.
Lubricants 13 00392 g018
Figure 19. The test gear.
Lubricants 13 00392 g019
Figure 20. Roughness measuring instrument.
Lubricants 13 00392 g020
Figure 21. The profile of teeth after wear (a) tooth 1; (b) tooth 2; (c) tooth 3.
Lubricants 13 00392 g021
Table 1. Gear and lubricant parameters.
ParameterDistribution TypeMean (Value, Unite)Coefficient of Variation
Number of teeth35/58 
Pressure angle20º
ModuleGaussian3 mm0.01
Face widthGaussian20 mm0.01
Rotational inertiaGaussian1860/13,590 kg∙mm20.01
Modulus of elasticityGaussian2.06 GPa0.01
Center distance139.5 mm
Amplitude of static transmission errorGaussian0.01 mm0.01
Mean value of input power5 kW
Damping ratio0.05
Viscosity0.05 Pa∙s
Viscosity-pressure index0.68
Table 2. The first four statistical moments of the meshing force of a certain point in different meshing cycles.
TimeMean (N)Standard Deviation (N)SkewnessKurtosisCoefficient of Variation
1825.06683.6030.250−3.0010.101
21370.53647.231−1.8858.1640.034
31308.93595.913−0.098−3.6320.073
41303.76493.0790.157−3.5720.071
51303.82992.5410.159−3.5200.071
61303.83792.5370.157−3.5190.071
Table 3. First four statistical moments of equivalent radius of curvature at different times.
TimeMean (m)Standard Deviation (m)SkewnessKurtosisCoefficient of Variation
11.033 × 10−21.288 × 10−41.145 × 10−33.0340.012
21.153 × 10−21.280 × 10−40.924 × 10−33.0340.011
Table 4. The first four statistical moments of enrolling velocity at different times.
TimeMean (m/s)Standard Deviation (mm/s)SkewnessKurtosisCoefficient of Variation
12.0820.0230.0063.0330.011
22.3560.0250.0063.0330.011
Table 5. First four statistical moments of meshing force at 9 equal time intervals in a single tooth meshing cycle.
TimeMean (N)Standard Deviation (N)SkewnessKurtosisCoefficient of Variation
1222.18831.8250.2842.3990.143
2612.53648.922−0.0242.4370.080
3588.50260.283−0.4352.7070.102
4762.46221.3732.1779.6510.028
5947.53527.6741.7016.1940.029
61046.51316.510−3.04918.7170.016
7318.19730.2430.8723.2980.095
8472.33634.040−0.4002.5560.072
9301.69328.419−0.3592.4850.094
Table 6. The first four statistical moments of minimum film thickness at 9 equal time intervals in a single tooth meshing cycle.
TimeMean (m)Standard Deviation (m)SkewnessKurtosisCoefficient of Variation
16.83 × 10−71.02 × 10−8−0.0723.0151.49 × 10−2
27.04 × 10−71.09 × 10−8−0.0333.0251.55 × 10−2
37.39 × 10−71.30 × 10−80.0503.0691.76 × 10−2
47.82 × 10−71.43 × 10−80.0013.0231.83 × 10−2
57.76 × 10−71.23 × 10−8−0.0853.0011.59 × 10−2
67.88 × 10−71.21 × 10−80.0202.9791.54 × 10−2
78.06 × 10−71.04 × 10−8−0.0272.9801.28 × 10−2
88.25 × 10−71.04 × 10−8−0.0112.9961.26 × 10−2
98.68 × 10−71.22 × 10−80.0763.0411.41 × 10−2
Table 7. Statistical characteristics of initial roughness of tooth surface.
Ra (μm)Rq (μm)SkKu
Mean0.19730.25370.32673.7893
Standard deviation0.06690.08580.34191.2546
Coefficient of variation0.33930.33841.04640.3311
Table 8. Statistical characteristics of tooth surface roughness after 30 h.
Ra (μm)Rq (μm)SkKu
Mean0.08320.1089−0.23484.0709
Standard deviation0.03100.03900.50121.0802
Coefficient of variation0.37290.3584−2.13460.2653
Table 9. Statistical characteristics of tooth surface roughness after 60 h.
Ra (μm)Rq (μm)SkKu
Mean0.10210.13770.17034.5223
Standard deviation0.02790.04040.52272.0813
Coefficient of variation0.27360.29303.06920.4602
Table 10. Statistical characteristics of tooth surface roughness after 90 h.
Ra (μm)Rq (μm)SkKu
Mean0.08520.1085−023614.4048
Standard deviation0.05000.06200.63022.8187
Coefficient of variation0.58850.5713−2.66990.6399
Table 11. Statistical characteristics of tooth surface roughness after 120 h.
Ra (μm)Rq (μm)SkKu
Mean0.08610.1153−0.14225.0968
Standard deviation0.05110.06630.69933.1847
Coefficient of variation0.59330.5751−4.91900.6248
Table 12. Statistical characteristics of tooth surface roughness after 150 h.
Ra (μm)Rq (μm)SkKu
Mean0.09250.1145−0.08514.2621
Standard deviation0.05880.07110.51010.8154
Coefficient of variation0.63550.6210−6.00010.1913
Table 13. RMS roughness and skewness of the three wear stages.
Mean of RMS (μm)Standard Deviation of RMS (μm)Mean of SkewnessStandard Deviation of Skewness
Period 10.200.020.100.20
Period 20.150.030.000.30
Period 30.100.03−0.100.40
Disclaimer/Publisher’s Note: The statements, opinions and data contained in all publications are solely those of the individual author(s) and contributor(s) and not of MDPI and/or the editor(s). MDPI and/or the editor(s) disclaim responsibility for any injury to people or property resulting from any ideas, methods, instructions or products referred to in the content.