Article

Evaluation of Long-Term Skid Resistance in Granite Manufactured Sand Concrete

1
Poly Changda Engineering Co., Ltd., Guangzhou 511431, China
2
School of Civil Engineering and Architecture, Guangxi University, Nanning 530004, China
3
China Railway Communications Investment Group Co., Ltd., Nanning 530004, China
*
Author to whom correspondence should be addressed.
Lubricants 2025, 13(9), 375; https://doi.org/10.3390/lubricants13090375 (registering DOI)
Submission received: 27 June 2025 / Revised: 8 August 2025 / Accepted: 19 August 2025 / Published: 23 August 2025
(This article belongs to the Special Issue Tire/Road Interface and Road Surface Textures)

Abstract

The widespread application of granite manufactured sand (GS) concrete in pavement engineering is limited by issues such as suboptimal particle size distribution and an unclear optimal rock powder content. Furthermore, research on the long-term evolution of the skid resistance characteristics of GS concrete remains relatively scarce. This knowledge gap makes it difficult to accurately assess the skid resistance performance of GS concrete in practical engineering applications, thereby compromising traffic safety. To address this research gap, this study utilized a self-developed indoor abrasion tester for pavement concrete to assess the skid resistance of GS concrete. Three-dimensional laser scanning was employed to acquire the concrete’s surface texture parameters. Using the friction coefficient and texture parameters as skid resistance evaluation indicators, and combining these with changes in the concrete’s surface morphology, the study explores how effective sand content, stone powder content, and fine aggregate lithology affect the long-term skid resistance of GS concrete pavements and reveals the evolution trends of their long-term skid resistance. Research results show that as the number of wear cycles increases, low and high effective sand content affect the surface friction coefficient of specimens in opposite ways. Specimens with 95% effective sand content exhibit superior skid resistance. Stone powder content influences the friction coefficient in three distinct variation patterns, showing no clear overall trend. Nevertheless, specimens with 5% stone powder content demonstrate better skid resistance. Among different fine aggregate lithologies, GS yields a higher friction coefficient than river sand (RS), while limestone manufactured sand (LS) shows significant friction coefficient fluctuations across different wear cycles. Adding stone powder substantially enhances mortar strength and delays groove collapse edge formation. Moreover, higher effective sand content and proper stone powder content mitigate bleeding, thereby improving mortar performance.

1. Introduction

Granite manufactured sand (GS) is marked by high hardness, high wear resistance, and chemical stability. Its irregular particle shape and rough surface can boost the skid resistance of concrete. However, the poor particle gradation and unclear stone powder content in manufactured sand (MS) can give rise to problems like poor workability and bleeding in concrete. These issues can in turn impact the long-term skid resistance of pavement [1]. Additionally, pavement is subject to varying degrees of aging during its long-term service. This can reduce its skid resistance and jeopardize driving safety [2]. Therefore, studying the long-term skid resistance of GS concrete is significant for improving traffic safety.
Yu et al. demonstrated that a proper quantity of stone powder can enhance concrete’s compactness and interfacial transition zone strength, thereby boosting its strength and durability [3]. Wu et al. demonstrated that when the stone powder content is 7%, C80 concrete achieves optimal fluidity and exhibits enhanced compressive and splitting tensile strength [4]. Xue et al. [5] used stone powder as a cementitious material substitute for cement and observed that as the stone powder content increased, the concrete’s compressive and splitting strength first increased and then decreased. However, the reactivity profile of mineral powders fundamentally dictates their influence on concrete performance, necessitating differentiation between chemically active and inert fillers. For reactive powders exemplified by limestone, Tsivilis [6] established a critical threshold: substituting cement with limestone powder beyond 20% significantly diminishes workability and strength development, attributed to dilution effects and disrupted hydration kinetics. This finding aligns with industrial practices across Mediterranean regions, where Israeli ready-mix plants routinely incorporate 15–20% limestone powder in C50–C80 concrete to optimize pumpability while ensuring 56-day compressive strength exceeds design specifications. Nadia S. et al. studied the performance of high-strength concrete prepared by replacing cement with stone powder. It was found that replacing cement with 20% stone powder can significantly improve the performance of concrete [7]. The underlying mechanism, as elucidated by Craeye [8], involves limestone’s carbonate–aluminate reactivity: CaCO3 reacts with tricalcium aluminate (C3A), forming hemicarboaluminate phases, accelerating clinker dissolution and enhancing early-age microstructure densification. Conversely, inert powders like granite and quartz exert purely physical effects: Li et al. [9] documented that granite powder at 20% increased the compressive strength and elastic modulus by 12% and 9%, respectively, despite reducing early-age hydration rates. This apparent paradox is resolved through microstructural analysis: Lu et al. [10] demonstrated that granite particles (chemically inert) refine pore networks, reducing capillary absorption by 22% and creating confined spaces that indirectly facilitate hydration product growth. Such physical densification contrasts sharply with quartz powder, which Craeye confirmed exhibits zero chemical contribution in self-compacting concrete systems. The inert nature of these powders is further evidenced by their negligible impact on autogenous shrinkage kinetics, as pore structure alterations dominate over chemical interactions [8].
Rao et al. [11] utilized granite fine aggregates to substitute for river sand (RS) in concrete preparation. They found that as the MS replacement rate increased, the concrete’s mechanical properties first improved and then declined. The concrete’s compressive and tensile properties peaked at a 50% replacement rate. Even at a 100% replacement rate, the MS concrete’s compressive strength exceeded that of RS concrete. Singh et al. used granite processing industry waste powder to substitute for RS in concrete performance tests. At a water–cement ratio of 0.5, a 25% RS replacement rate yielded the concrete’s optimal mechanical and durability properties [12]. Binici compared the durability of concrete prepared with marble, granite, and limestone aggregates and found that granite aggregate concrete showed superior durability [13]. Torgal et al. [14] investigated the performance of C20- and C30-strength concrete using limestone and granite aggregates. They discovered that both limestone and granite aggregates affect concrete durability, and a correlation exists between the aggregates’ geometric characteristics and the concrete’s durability parameters. Hussin [15] investigated how different granite aggregates affect the interfacial transition zone of granite concrete. They found that at a water–cement ratio of 0.5, the chemical composition of different granite aggregates disparately affected the porosity, cement hydration degree, and interfacial transition zone hardness.
Research on the skid resistance of concrete has achieved notable progress. Regarding influencing factors, investigations have elucidated the impact mechanisms of key parameters—including aggregate type, gradation, shape, and surface texture, as well as cement content, water–cement ratio, and admixtures—on concrete skid resistance [16,17]. Quantitative relationships have been established through extensive experimental studies. In terms of detection techniques, traditional methods such as the pendulum friction tester method and texture depth measurements have undergone continuous refinement and standardization [17,18,19]. Concurrently, advanced technologies like laser scanning and digital image processing are increasingly being adopted, providing enhanced technical tools for the precise measurement and quantitative characterization of skid resistance [20,21,22,23]. Furthermore, to gain deeper insights into the evolution of long-term skid resistance, a limited number of studies have focused on developing or improving accelerated abrasion testers to simulate the actual service conditions of pavements under sustained traffic loading [19]. Mostafa Adresi et al.’s study shows that abrasion reduces the skid resistance of roller-compacted concrete pavement samples by about 10% [24]. Pawel Gierasimiuk et al. used a slab polisher to wear and polish concrete slabs under laboratory conditions [25]. It was found that the BPN and MPD of concrete decreased with the increase in wear cycles. Nevertheless, research in this domain remains relatively scarce, demanding more systematic and in-depth analysis of the underlying degradation mechanisms and predictive models.
Global research on GS concrete has predominantly concentrated on workability, mechanical properties, and durability. Moreover, most existing studies have only analyzed the short-term skid resistance of concrete. Key issues, such as changes in long-term skid resistance, decay mechanisms, and improvement methods, remain not yet fully understood. This limitation hinders the accurate assessment of the performance of GS concrete over its life cycle and restricts the material’s practical application and development. Additionally, comparative analyses of the skid resistance of GS concrete versus other types of MS concrete are extremely limited. This scarcity of research hinders the comprehensive evaluation of the performance advantages and practical applicability of GS concrete relative to other concrete types. Therefore, in-depth studies into long-term skid resistance, decay mechanisms, and improvement methods for GS in concrete are urgently needed in the field of concrete pavement engineering.
Based on the knowledge gap identified in the literature review above, this study systematically evaluated the anti-slip performance of concrete using a self-developed indoor abrasion test machine. By investigating the long-term anti-slip performance of GS concrete with varying effective sand content, stone powder content, and fine aggregate lithology, the optimal proportions of effective sand and stone powder were determined. Additionally, variations in concrete’s appearance were analyzed to reveal the changing trend of GS concrete’s long-term anti-slip performance from both macro-performance and appearance perspectives. This research not only promotes the diversified development of road materials, alleviating the issue of natural sand resource scarcity, but also reduces the traffic accident rate and ensures driving safety by enhancing pavement skid resistance, thereby generating substantial economic and social benefits.

2. Materials and Methods

2.1. Materials

(1)
Cement
The cement used in this study is P.O 42.5 ordinary Portland cement. The relevant technical indicators of the cement are tested by the manufacturer with reference to “Test Methods of Cement and Concrete for Highway Engineering (JTG E30-2005) [26]”. Its specific surface area is 352 m2/kg. The initial setting time is 185 min, and the final setting time is 237 min. The chloride ion content is 0.016%. The flexural strength at 3 days is 5.6 MPa, and at 28 days it is 8.4 MPa. The compressive strength at 3 days is 28.7 MPa, and at 28 days it is 56.7 MPa, both of which exceed the specified minimum requirements of 17.0 MPa and 42.5 MPa, respectively. The chemical composition of the P.O 42.5 cement is as follows: SiO2 accounts for 22.01%, Al2O3 for 6.21%, Fe2O3 for 4.58%, CaO for 65.08%, MgO for 1.15%, SO3 for 0.33%, and Na2O for 0.51%. The quality meets the relevant requirements of “general Portland cement” GB175 [27].
(2)
Fine aggregates
The fine aggregates utilized in this study comprise GS, limestone manufactured sand (LS), and RS. GS is sourced from the ongoing Cangwu–Rongxian Highway project in Fucheng County, Wuzhou City, whereas LS and RS are procured from the Laocun Sand, Stone, and Cement Store in Xixiangtang District, Nanning City.
For the GS fine aggregate, the cumulative sieve residues were 0.04% at 4.75 mm, 17.36% at 2.36 mm, 39.70% at 1.18 mm, 58.44% at 0.6 mm, 75.13% at 0.3 mm, and 85.23% at 0.15 mm, with a fineness modulus of 2.76. For the LS fine aggregate, the residues were 0.85% at 4.75 mm, 24.3% at 2.36 mm, 49.04% at 1.18 mm, 64.98% at 0.6 mm, 76.44% at 0.3 mm, and 82.35% at 0.15 mm, with a fineness modulus of 2.95. For the RS fine aggregate, the residues were 0.78% at 4.75 mm, 10.56% at 2.36 mm, 21.84% at 1.18 mm, 54.52% at 0.6 mm, 78.11% at 0.3 mm, and 93.22% at 0.15 mm, with a fineness modulus of 2.56.
In accordance with the testing protocols outlined in “construction sand” (GB/T 14684-2022) [28], the physical characteristics of the fine aggregate underwent examination. The GS fine aggregate has an apparent density of 2.645 g/cm3, a bulk density of 1.606 g/cm3, a porosity of 40.4%, a crushing value of 20%, and a stone powder content of 6.9%. The LS fine aggregate exhibits an apparent density of 2.706 g/cm3, a bulk density of 1.681 g/cm3, a porosity of 38.7%, a crushing value of 15%, and a stone powder content of 10.9%. The RS fine aggregate has an apparent density of 2.605 g/cm3, a bulk density of 1.545 g/cm3, a porosity of 42.8%, and a crushing value of 12%.
(3)
Coarse aggregates
The test coarse aggregate was limestone, divided into two particle sizes: 9.5–19.0 mm and 4.75–9.5 mm, mixed in a 3:1 mass ratio.
The technical indexes were tested according to the test procedures specified in “Pebble and crushed stone for construction” (GB/T 14685-2011) [29].
The coarse aggregate’s technical indicators are as follows: For 9.5–19.0 mm gravel, apparent density is 2650 g/cm3, porosity 43.8%, bulk density 1490 g/cm3, needle-like particle content 5.7%, clay content 0.5%, and crushing value 12.1%. For 4.75–9.5 mm gravel, bulk density is 1513 g/cm3, porosity 42.9%, apparent density 2658 g/cm3, needle-like particle content 5.3%, clay content 0.6%, and crushing value 11.1%. Specifications require apparent density ≥ 2600 g/cm3, porosity < 45%, clay content < 1.0%, needle-like particle content < 10%, and crushing value < 20%.
(4)
Stone powder
The GS fraction in the fine aggregate was sieved to obtain particles with a particle size of smaller than 0.075 mm as stone powder. The apparent density of these particles was measured to be 2678 kg/m3, and the specific surface area was 403 m2/kg. The chemical composition of these particles is as follows: SiO2 constitutes 59.02%, CaO 4.93%, Al2O3 16.85%, Fe2O3 5.62%, MgO 1.95%, Na2O 1.67%, K2O 0.62%, TiO2 3.82%, P2O5 0.71%, BaO 0.13%, SO3 0.32%, and ZrO2 0.11%.
(5)
Admixtures
A WYF-H retarding water-reducing agent, sourced from Nanning, China, was used in this study. WYF-H-type retarding superplasticizer belongs to naphthalene series (NSF) superplasticizer. This agent, a transparent to pale-yellow liquid, was applied at a dosage of 1.0% (the dosage of admixtures is defined as the mass percentage of admixture relative to the total binder content) and meets the standards set by “Concrete admixtures” (GB8076-2008) [30].
The technical indicators of the water-reducing agent are outlined as follows: The water reduction rate is 25%, and the air content is 3.0%. The pH value is 5.2, and the density is 1.06 g/cm3. The chloride ion content is 0.03%, and the total alkali content is 1.21%. These measured values meet the specification requirements: water reduction rate ≥ 25%, air content ≤ 6.0%, pH value 5.0 ± 1.0, density 1.06 ± 0.02 g/cm3, chloride ion content ≤ 0.6%, and total alkali content ≤ 10.0%.
(6)
Fly ash
Grade III fly ash was used in the test as an admixture. All test items meet the standard “Fly ash used for cement and concrete” (GB1596-2005) [31].
The technical indicators of the fly ash used in this study are detailed as follows: The measured loss on ignition is 2.62%, water content 0.4%, free calcium oxide 0.85%, sulfur trioxide 1.2%, density 2.23 g/cm3, chloride ion content 0.015%, and alkali content 0.75%. These measured values meet the specification requirements: ignition loss ≤ 5%, water content ≤ 1.0%, free calcium oxide ≤ 1.0%, sulfur trioxide ≤ 3.0%, density ≤ 2.6 g/cm3, chloride ion content ≤ 0.02%, and alkali content ≤ 1.5%.
(7)
Water
The water used in this study is Nanning’s tap water, which meets the “Standards for drinking water quality” (GB5749-2006) [32].

2.2. Indoor Abrasion Tester

2.2.1. Device Design and Structure

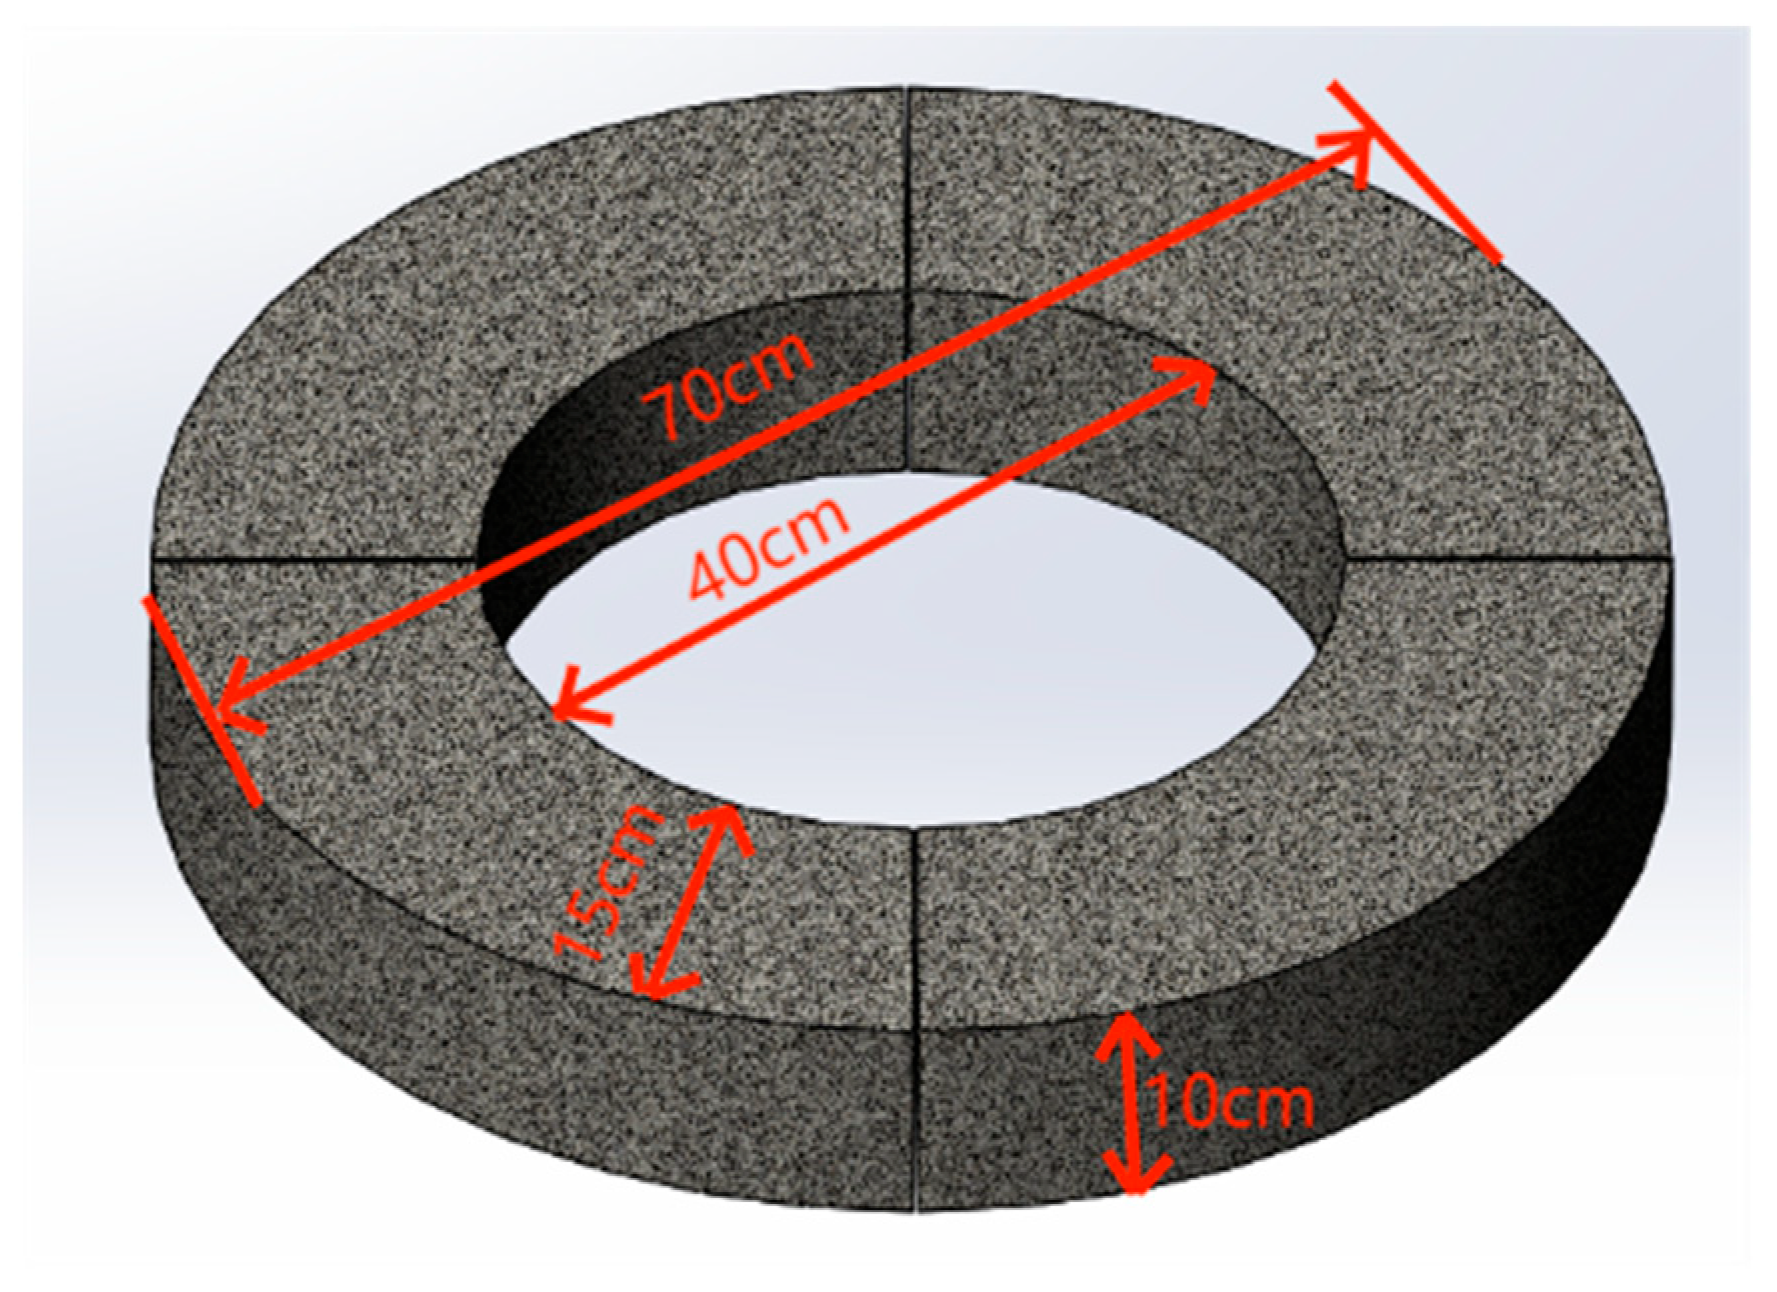
The equipment used in this study is an indoor abrasion device independently developed by the research team in the previous phase [33]. The apparatus prototype and effect design diagram are shown in Figure 1. The steel plate guide rail serves as a test platform, with four quarter-circle test specimens (as shown in Figure 2) positioned directly above it. These specimens feature an outer diameter of 700 mm, an inner diameter of 400 mm, and a height of 100 mm. This device accelerates specimen abrasion and consists of a loading unit, frame, and console. The electric control box is protected by the frame and located under the loading unit. The frame also holds the control panel and loading device. The control panel manages instrument switching, wheel height, vehicle load, wheel speed, and water circulation [33].
The travel path of the simulated wheel is designed as a circular trajectory. An angle of 15° is formed between the wheel’s travel direction and its alignment. This design aims to apply both vertical and horizontal loads when the simulated wheel traverses the circular path [34]. This results in both rolling friction and sliding friction, consequently and markedly augmenting the wear efficiency of the apparatus.

2.2.2. Device Test Steps

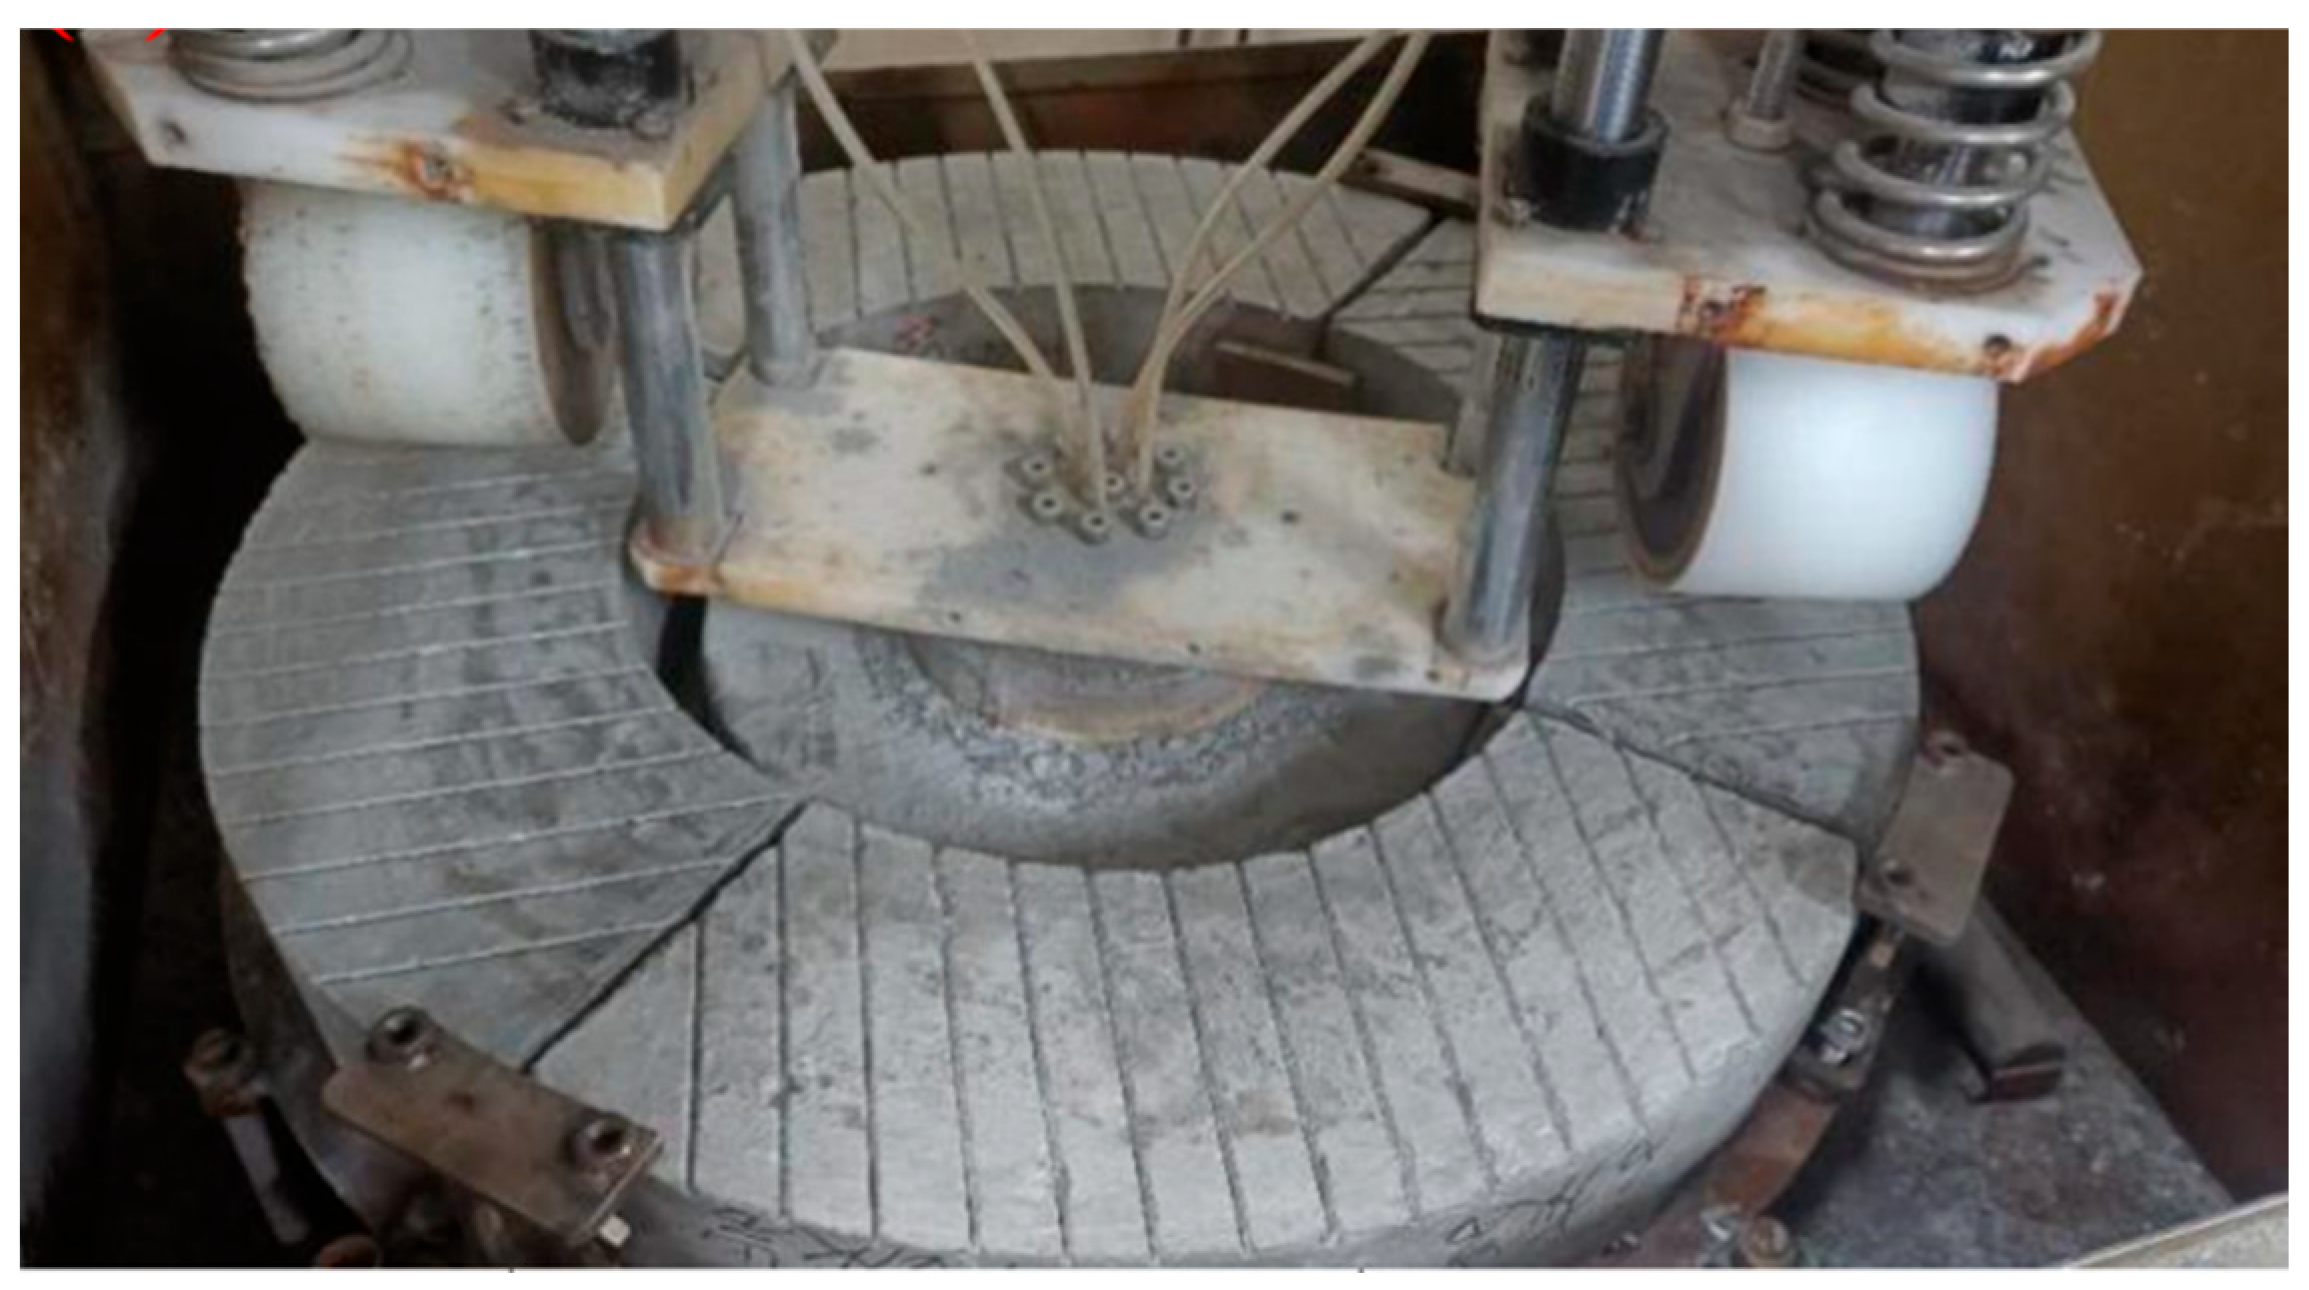
In tests, the wheel is set to a standard ground pressure of 0.7 MPa and a speed of 50 revolutions per minute. With two wheels on the circular path, each specimen is worn down 100 times per minute. The tire is 100 mm wide. Specimens are fixed in place, as shown in Figure 3. The tire’s path on the annular specimen covers an inner diameter of 454 mm and an outer diameter of 647 mm. Each quarter-annular specimen has an average wheel track area of approximately 0.04172 m2.

2.3. Specimen Preparation and Mixing Proportions

2.3.1. Mixing Proportions and Testing Program

Effective sand in MS is defined as particles ranging from 0.075 to 2.36 mm in size. The ratio of the mass of effective sand to the total mass of MS is the effective sand content. MS is categorized into three fractions: adjusted sand (2.36–4.75 mm), effective sand (0.075–2.36 mm), and stone powder (<0.075 mm). Gradation was adjusted by modifying the content of the main body sand. GS exhibits optimal gradation, with the particle size distribution of effective sand maintained in accordance with the “Specification for Mix Proportion Design of Ordinary Concrete” (JGJ55-2011) [35]. Screened effective sand was blended with adjusted sand, with the effective sand content ranging from 80% to 100% in 5% increments, designated as S80–S100. Mixtures J0–J15 contained stone powder replacing 0–15% of cement at variable intervals. For the specimens using fine aggregate with screened-out stone powder (RS, LS, and GS) [33], the specific mix proportions for each specimen are shown in Table 1, Table 2 and Table 3.
After the specimens were formed, the concrete specimens were cured under standard conditions for 28 days: temperature (20 ± 2) °C, relative humidity ≥ 95%. Then, according to the requirements specified in the “Specifications for Design of Highway Cement Concrete Pavement” (JTG D40-2011) [36], grooves were cut at equal intervals on the surface of the concrete ring specimens. The unified design parameters were a groove width of 3 mm, a groove depth of 5 mm, and a groove spacing of 25 mm. A schematic diagram of the grooving on the surface of the concrete circular specimen is shown in Figure 4.

2.3.2. Test Methods

(1)
Skid resistance test of concrete
Given that laboratory-scale specimens cannot meet the minimum test length requirement (>1 m) of standard methods such as ASTM E1911 [37] and ASTM E274 [38], the push–pull gauge method was employed for friction coefficient measurement. Sofi et al. demonstrated that a horizontal traction system with counterweights coupled to a force transducer effectively characterizes static friction behavior at concrete–rubber interfaces [39]. Zhang et al. further validated the precision of the push–pull gauge’s peak force mode in capturing critical static friction forces for manufactured sand concrete [40]. Collectively, these studies confirm the reliability of the push–pull gauge method for comparative friction evaluation under controlled boundary conditions in spatially constrained laboratory settings. It was therefore employed to assess the friction coefficient of granite manufactured sand concrete, ensuring compatibility with small specimen dimensions while maintaining data comparability.
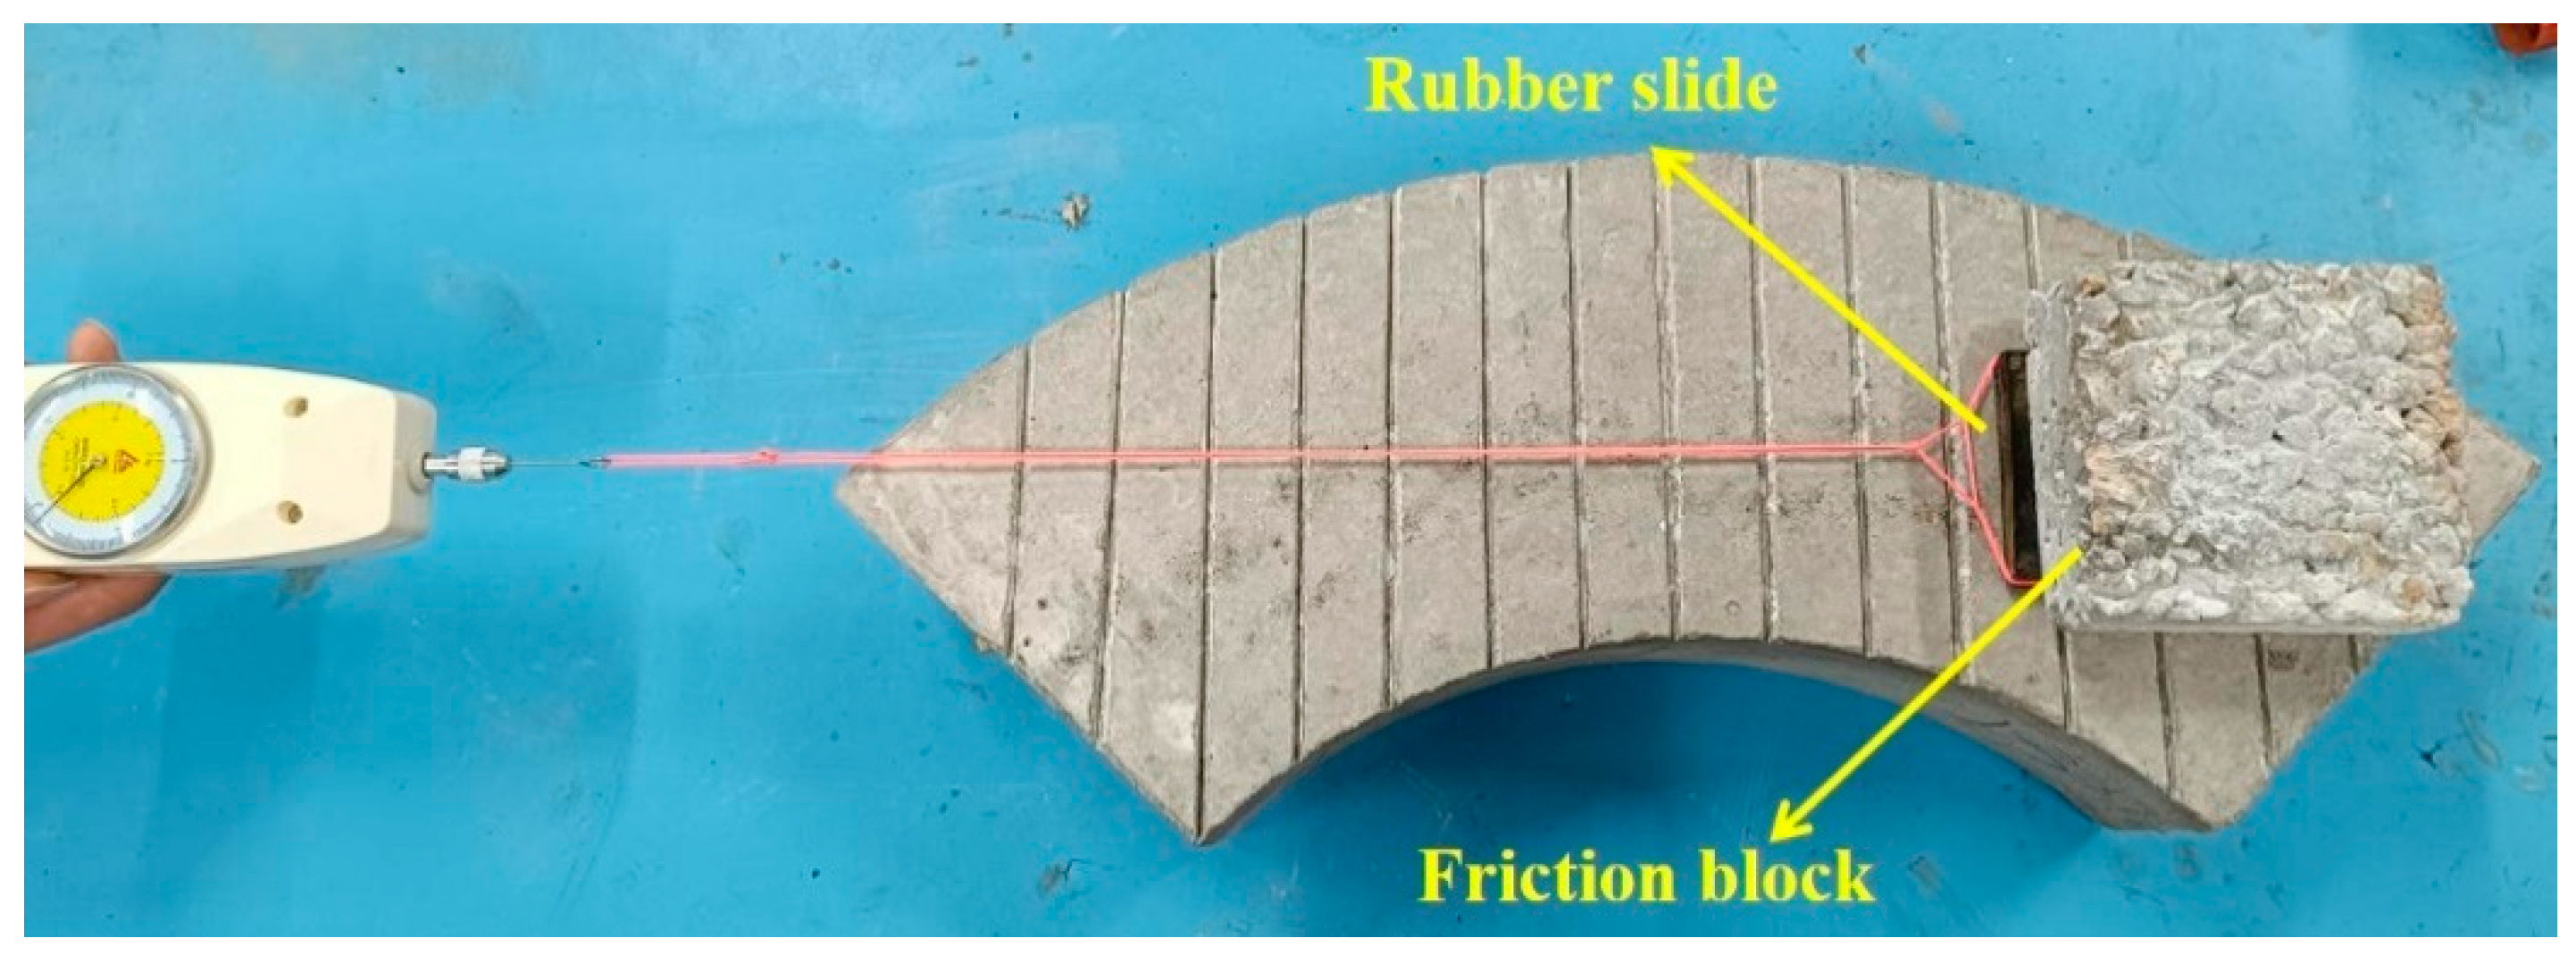
The test instrument used was a Japanese three-pointer digital push–pull force gauge, model NK-20N, with a measurement accuracy of ±1% and a maximum load capacity of 2 kg. In peak mode, this gauge can record the maximum force applied during operation, with a maximum measurement range of 20 N. The instrument and its operation process are shown in Figure 5.
Prior to testing, weights were selected as counterbalances for the rubber slider. The weights were placed on the rubber slider to serve as the friction block, and the total mass of the rubber slider and weights was recorded as m (Equation (1)). During the test, the friction block was placed on the specimen surface. A hand-held push–pull force gauge was then used to apply a slow and uniform tensile force to the friction block in the horizontal direction until the block moved 20 cm on the specimen surface. The peak tensile force recorded by the gauge was noted as the frictional force Fm. Consistency in the friction block was maintained across all tests.
During the test process, care was taken to keep the force application speed and direction consistent. Each test was repeated five times under the same conditions, and the average value was calculated to enhance data accuracy. The static friction coefficient of the specimen surface was calculated using the following formula:
μ = F m m g
where:
μ is the friction coefficient of the concrete;
Fm is the frictional force exerted by the friction block on the specimen, measured in newtons (N);
m is the mass of the friction block, measured in kilograms (kg);
g is the gravitational acceleration constant, taken as 9.8 N/kg.
This study initially selected one set of concrete ring specimens (designated A1–A4, totaling 4 specimens) prior to formal testing. These specimens were fabricated from identical materials, mix proportions, and curing conditions, and exhibited no prior surface wear. Uniform grooving was applied to all specimen surfaces using identical procedures. Following a 2 h equilibration period in a standard 20 °C curing chamber, the specimens were removed for concurrent testing: BPN measurements were performed using a pendulum friction tester, while the coefficient of friction was determined via the push–pull gauge method. Each specimen was measured 4 times. Descriptive statistics of the BPN and coefficient of friction values of the concrete pavements are presented in Table 4.
As shown in Table 4, the coefficient of variation for BPN measurements in groups A1–A3 was marginally lower than the corresponding coefficient of variation for the friction coefficient, indicating comparatively reduced data dispersion for BPN. However, this study attributes the lower BPN coefficient of variation primarily to its larger numerical magnitude rather than superior measurement precision. Conversely, the higher coefficient of variation observed for the friction coefficient reflects its inherently smaller value range (typically varying by 0.01 units), which confers greater resolution sensitivity to subtle variations in concrete surface microtexture. This heightened sensitivity to minute differences enables the friction coefficient to more effectively capture critical variations influencing pavement skid resistance. Consequently, the coefficient of friction is established as a reliable metric for evaluating the skid resistance performance of concrete pavements.
(2)
Acquisition and calculation of construct parameters
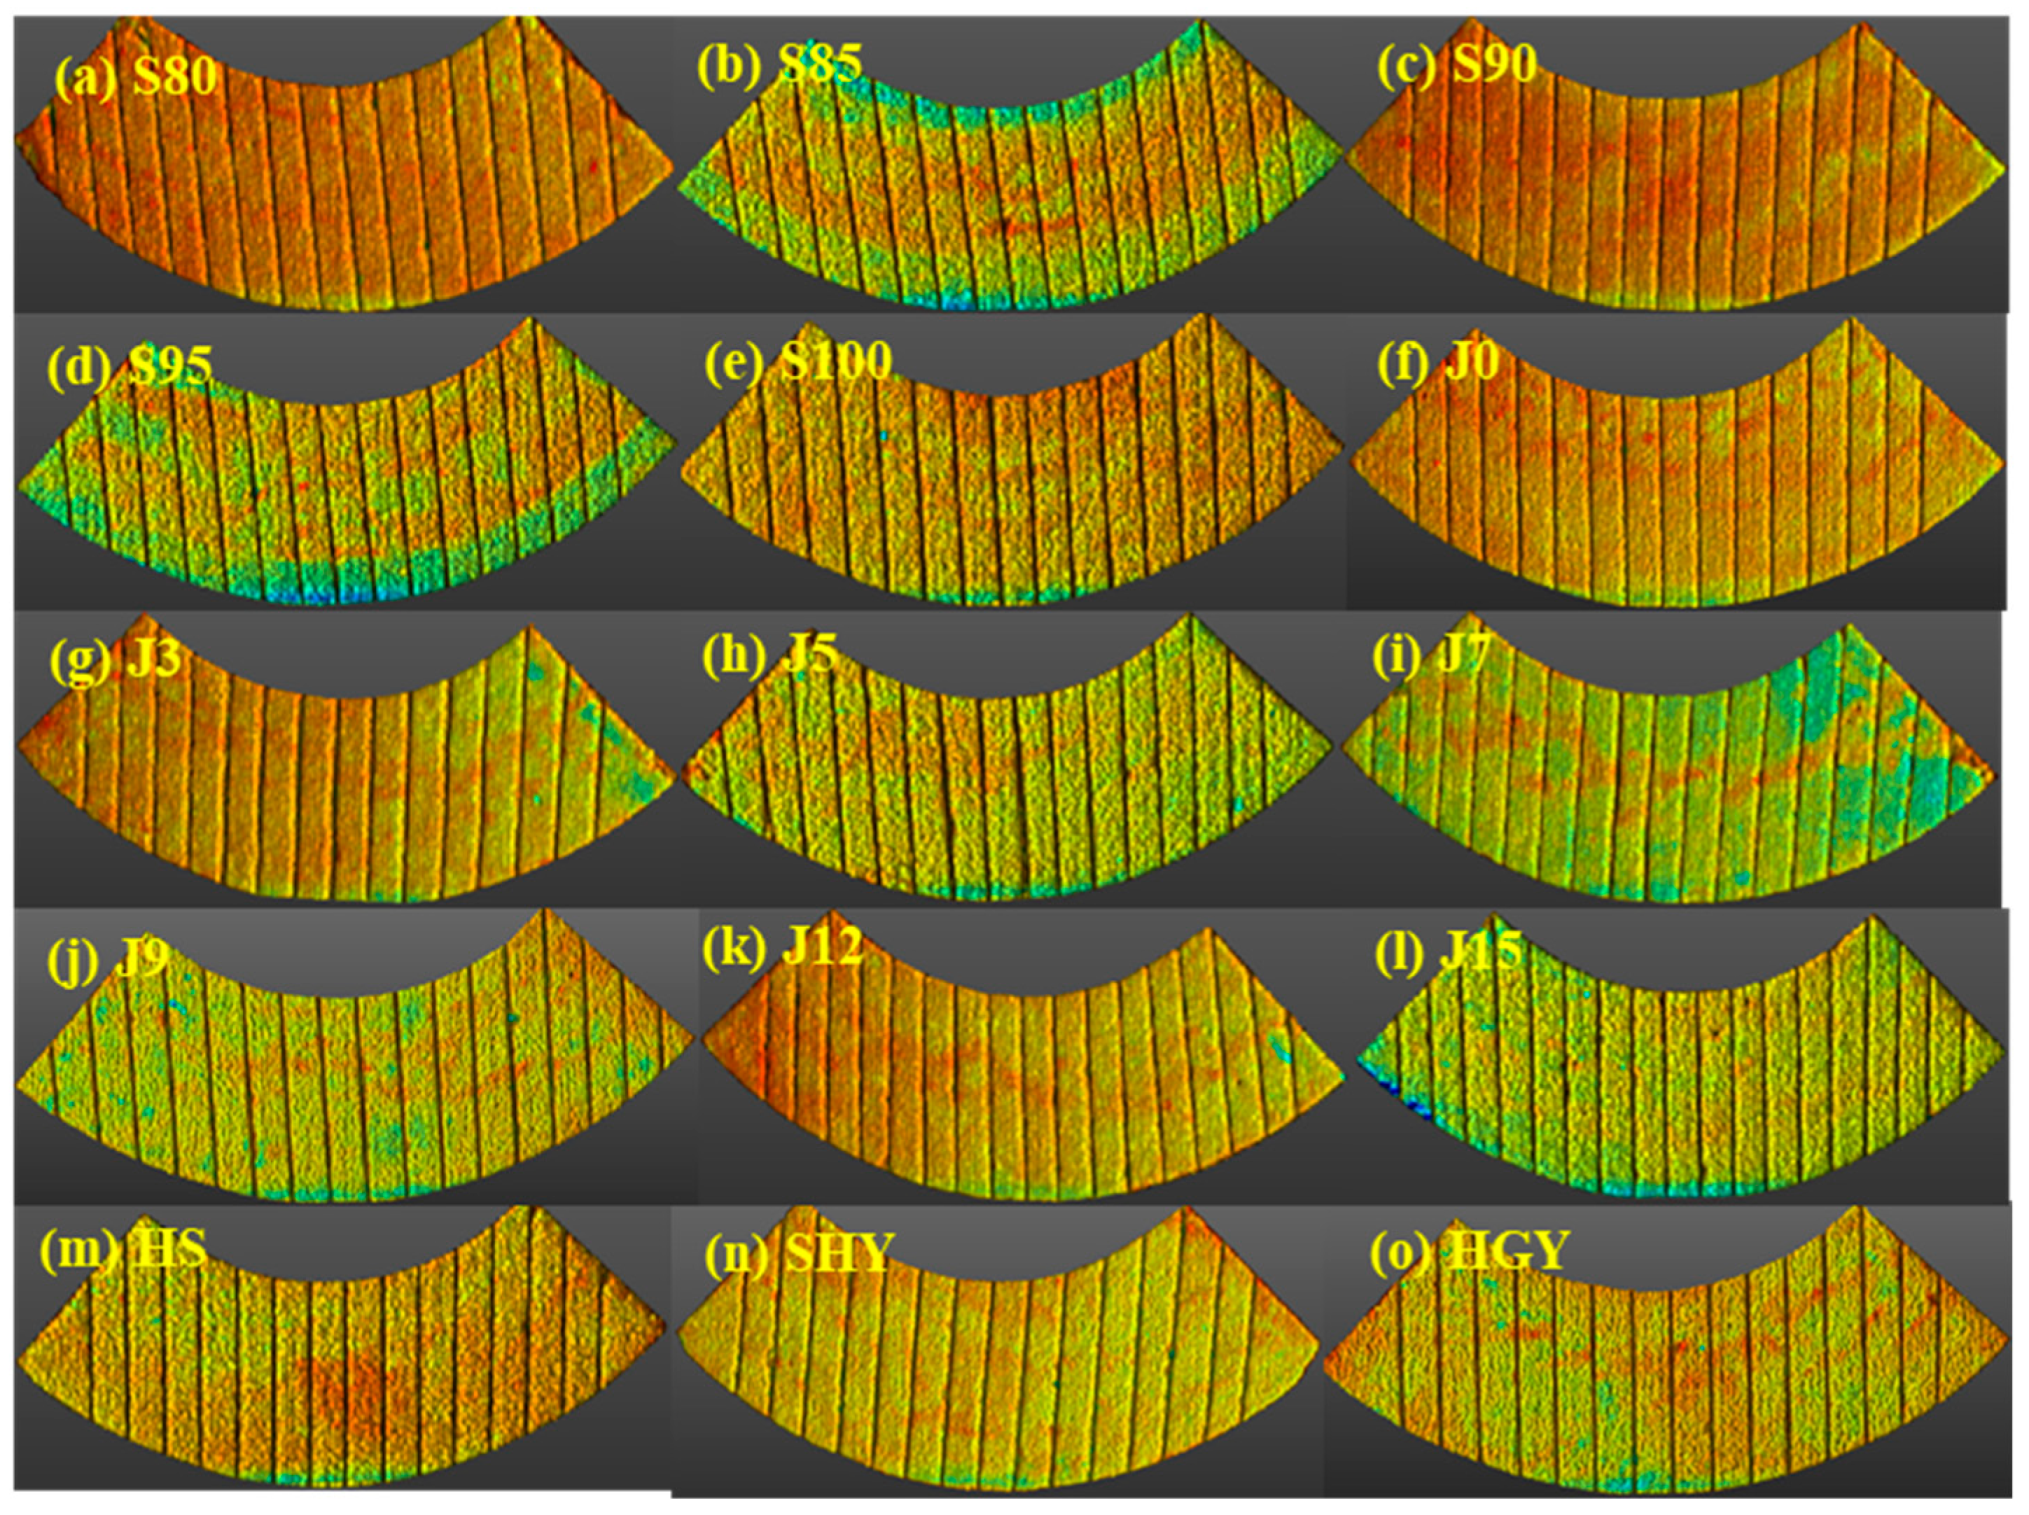
The three-dimensional (3D) data and images were acquired by scanning the specimen with a 3D laser scanner. The scanner was manufactured by Zoller + Frohlich, Germany, Wangen im Allgäu, Germany, and is designated as the 5010 C model. It features a scanning range of 360° horizontally and 320° vertically. The acquired data and images were then imported into the Trimble Real Works 12.2 software. Based on the image analysis, the wear surface area of the specimen was identified, and the relevant data were extracted. The data are recorded in millimeters (mm), with over 50,000 surface data points collected for each specimen. These data were used to calculate the pavement construction parameters. A portion of the 3D data image is shown in Figure 6.
The construction parameters were used to characterize the statistical characteristics, including the degree of texture disparity, deflection, and convexity of the specimen’s wear surface. These characteristics, in turn, reflect the alterations in pavement wear under various conditions. The construction parameter calculation method is detailed in Table 5.
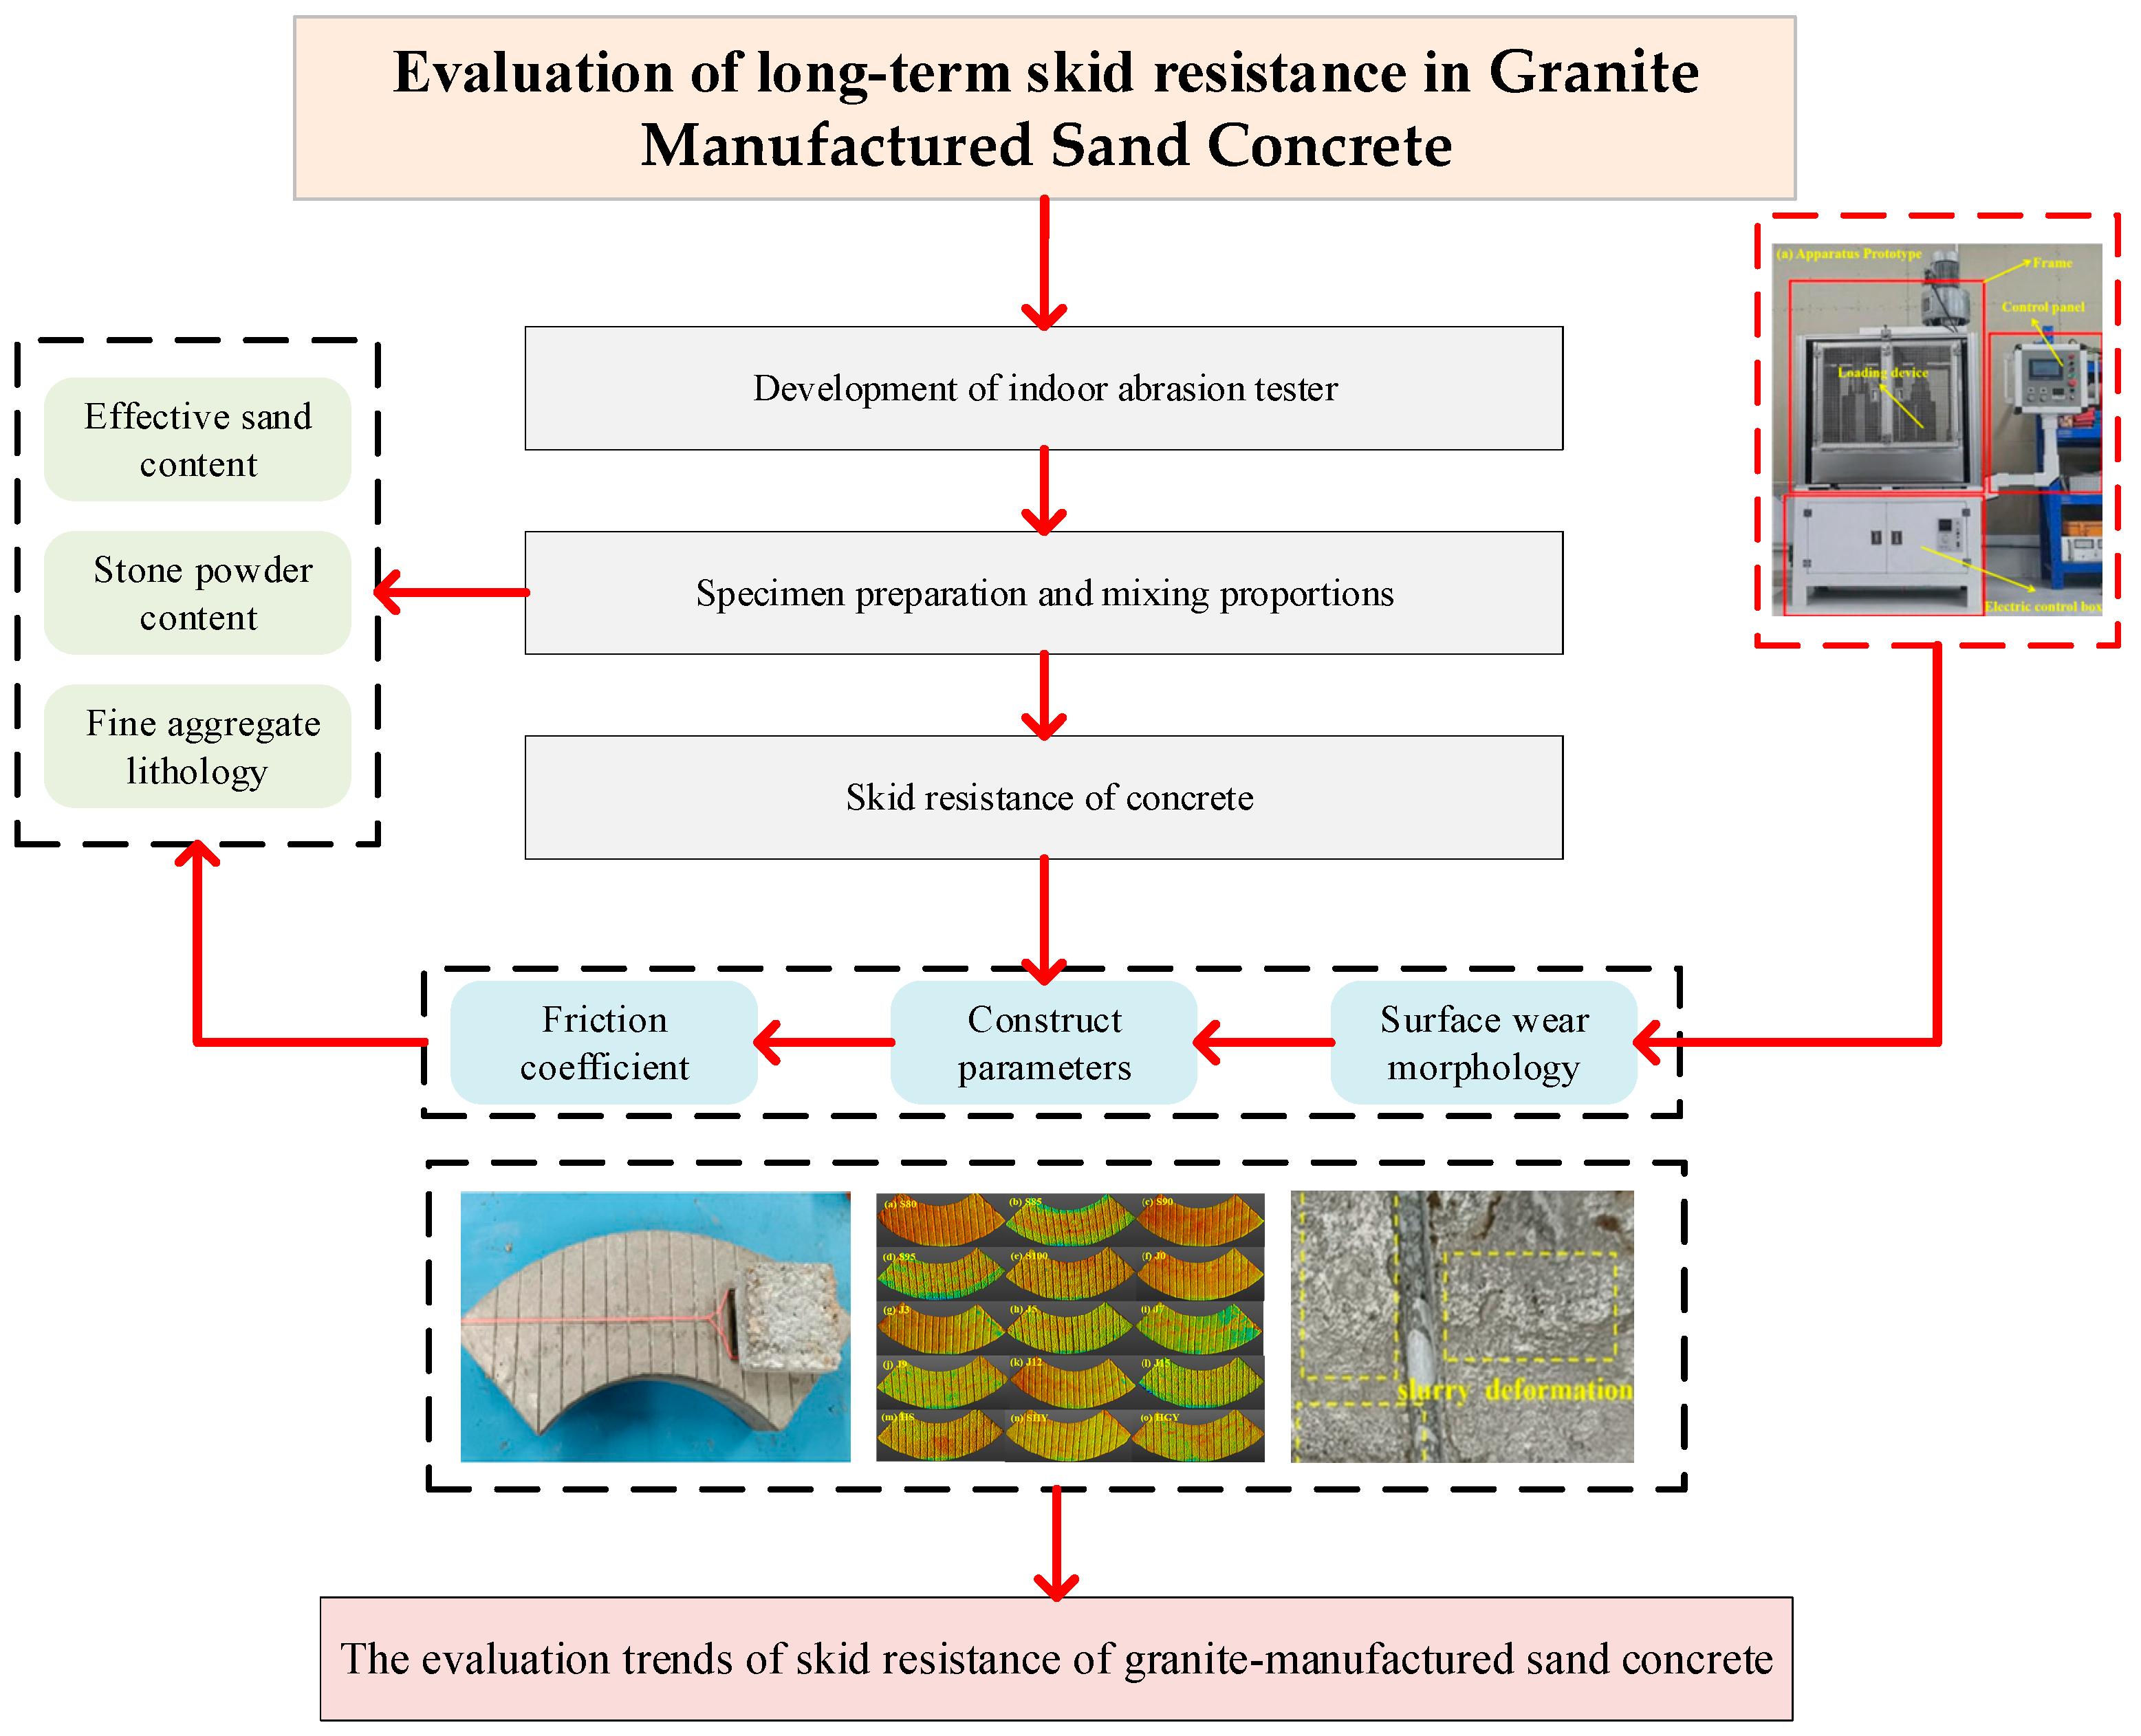
The research framework of this study is shown in Figure 7.

3. Results and Discussion

3.1. Evaluation Trends of Friction Coefficient of Concrete

3.1.1. Evaluation Trends of Friction Coefficient of GS Concrete with Different Effective Sand Content

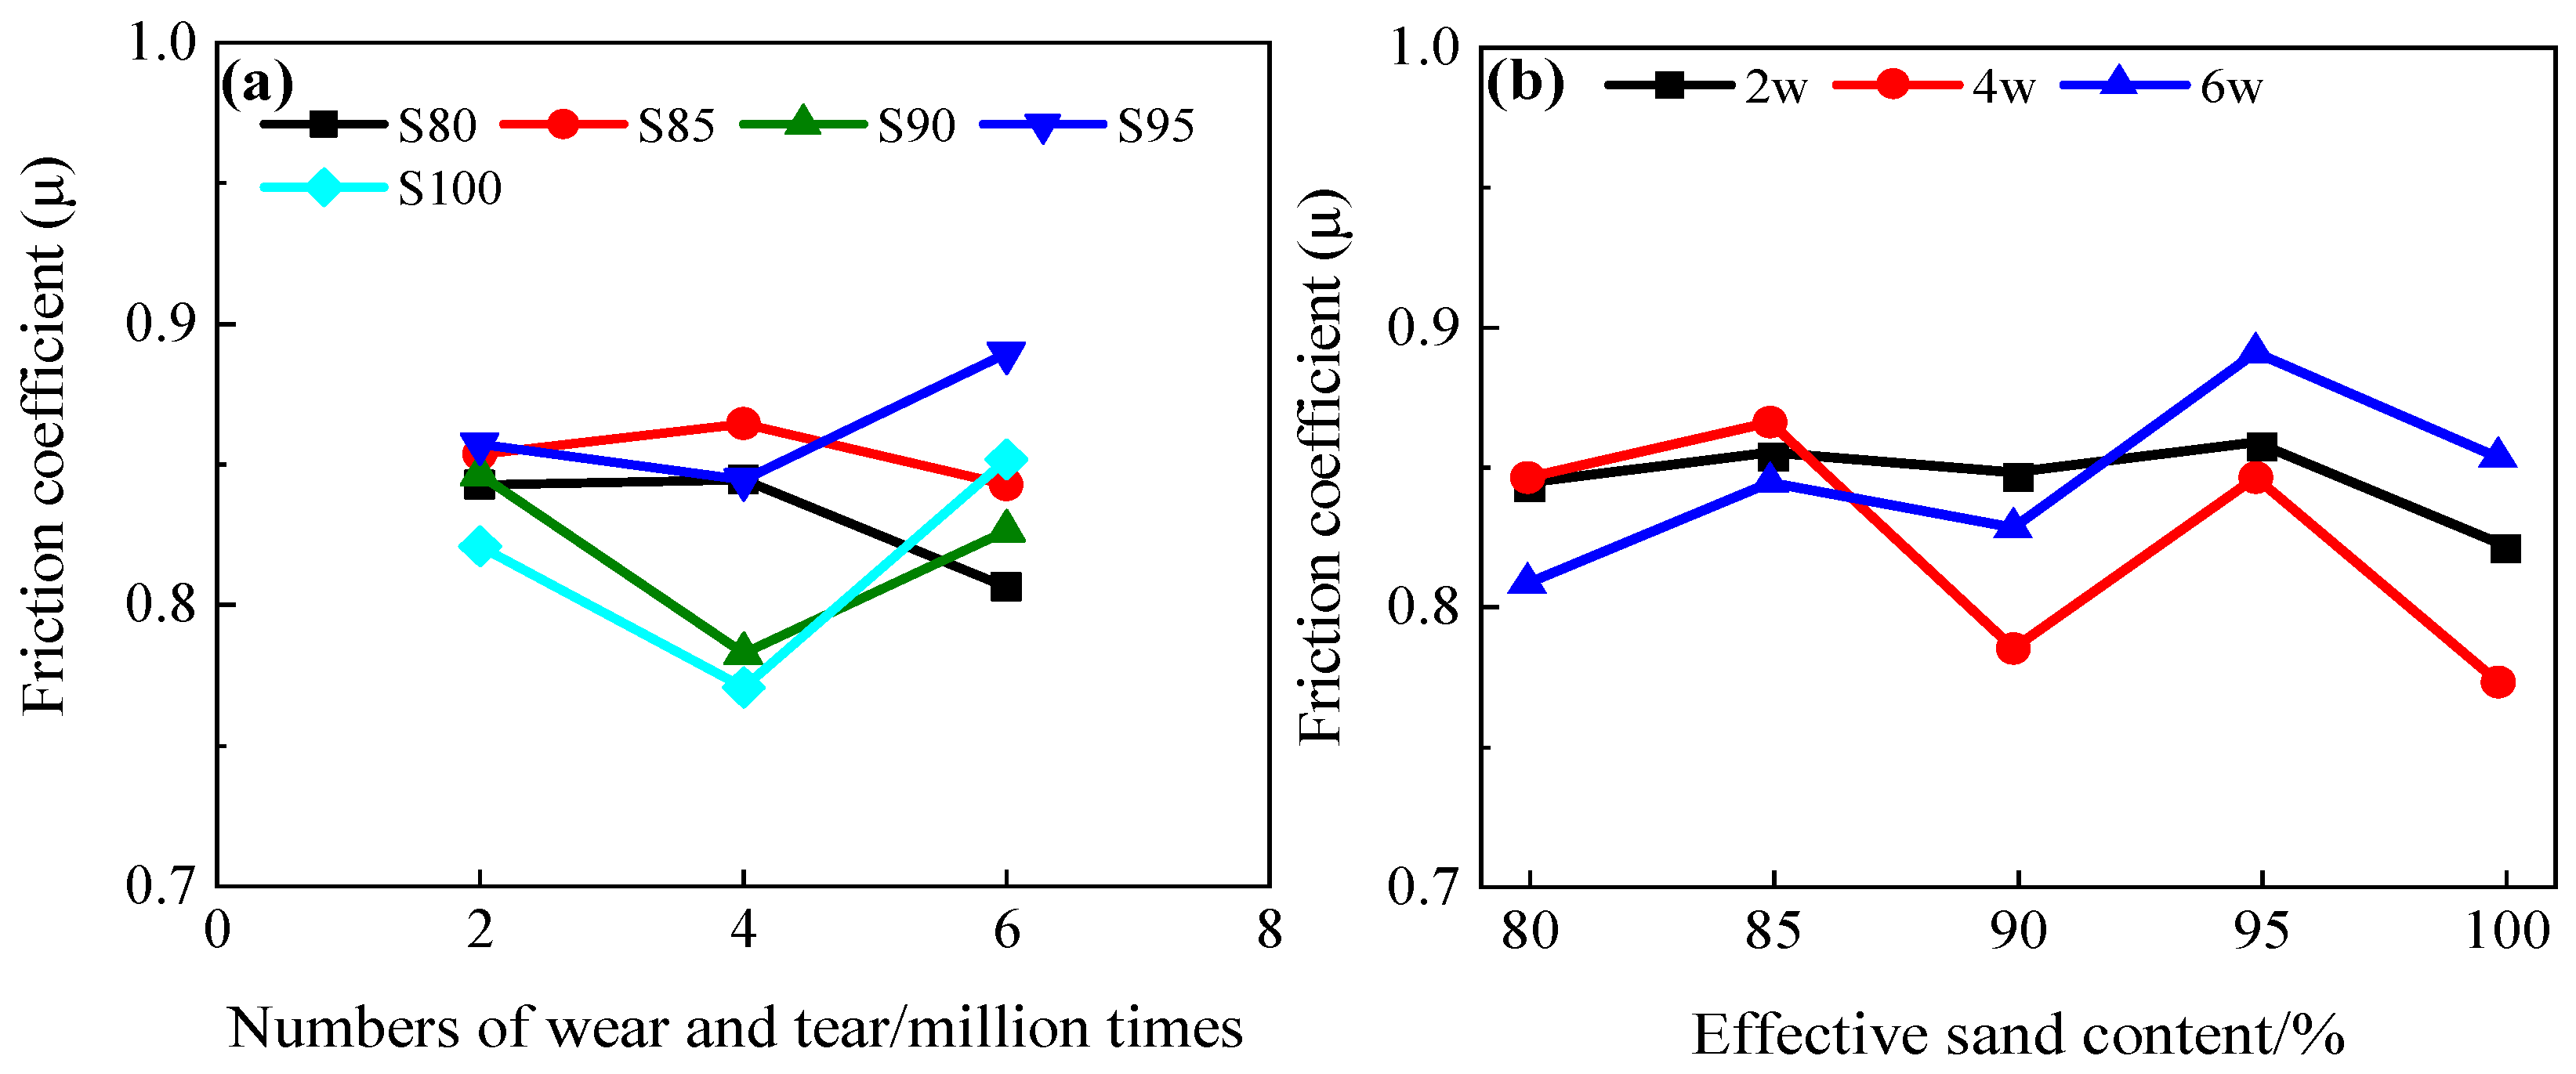
The effect of effective sand content on the coefficient of friction of GS concrete is shown in Figure 8. It indicates that for the concrete specimens with a low effective sand content (S80 and S85), the surface friction coefficient first increases and then decreases as the number of abrasion cycles increases, while the surface friction coefficient of specimens of concrete with higher effective sand content (S90, S95, and S100) decreases and then increases as the number of abrasion cycles increases. As the number of abrasion cycles increases, the difference in the surface friction coefficient among concretes with different effective sand contents becomes greater. We infer that the effective sand content is small and the specimen surface is prone to weeping, which leads to the formation of lower strength in the cement slurry, while a larger effective sand content can provide more interface for adsorption and fixation of water in the cement slurry, thus reducing the amount of free water and avoiding the phenomenon of weeping [41]. In addition, more sand particles can also enhance the overall structure of the cement paste through the skeleton effect [42]. Subsequently, it is continuously eroded by the abrasion and gradually becomes smooth. As a result, the friction coefficient of the concrete with a low effective sand content first increases and then decreases. The high effective sand content in the specimen leads to the direct abrasion of the protruding mortar on the surface. As the number of abrasion cycles increases, depressions and other significant losses appear on the surface, which increases the roughness. As a result, the coefficient of friction decreases initially and then increases [43,44].

3.1.2. Evaluation Trends of Friction Coefficient of GS Concrete with Different Stone Powder

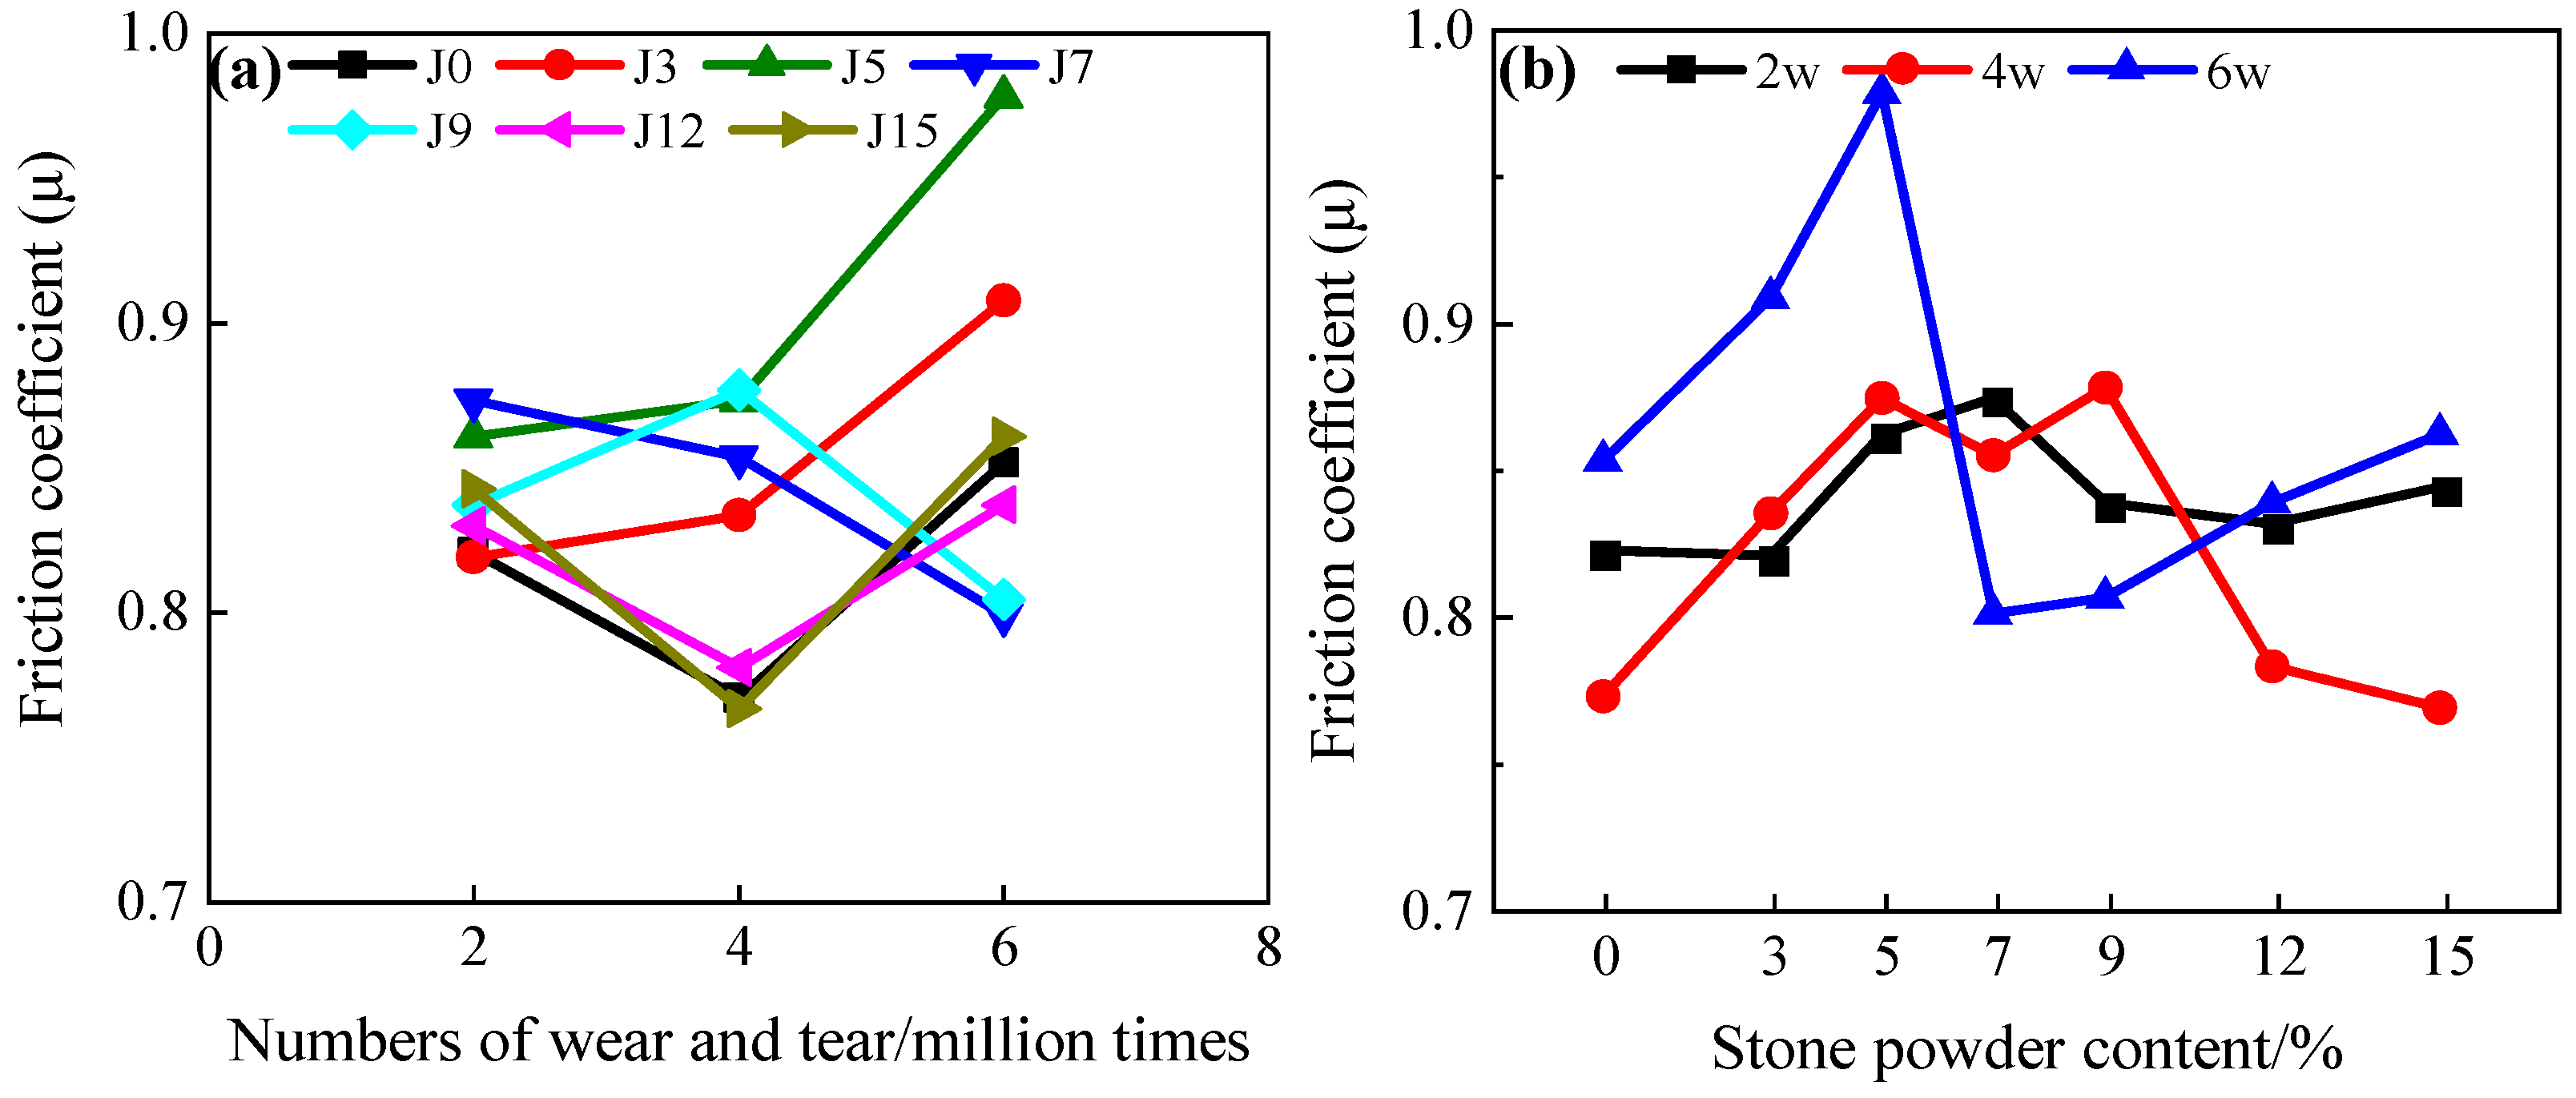
The effect of stone powder content on the skid resistance of GS concrete is shown in Figure 9. In Figure 9, it can be seen that the friction coefficients of different stone powder dosages increase with an equal increase in the number of abrasion cycles. This is because the stone powder, with its particle size falling within the micro-aggregate or micron particle range, serves two main functions: physical filling and promoting hydration reactions [5]. In the case of low stone powder content, stone powder particles effectively play a filling role, which may improve the strength of the cement paste. However, when the stone powder content is large, it will dilute the cement, resulting in a decrease in the hydration products per unit volume, which may reduce the strength of the cement paste. Therefore, an appropriate amount of stone powder may effectively improve the overall strength of the cement paste. With the increase in abrasion cycles, the surface loss of the specimen expands from partial abrasion to regional wear. The change in surface roughness of the specimen is affected by the distribution of cement paste, and the change in the friction coefficient is not obvious.

3.1.3. Evaluation Trends of Friction Coefficient of Concrete with Different Aggregate Lithology

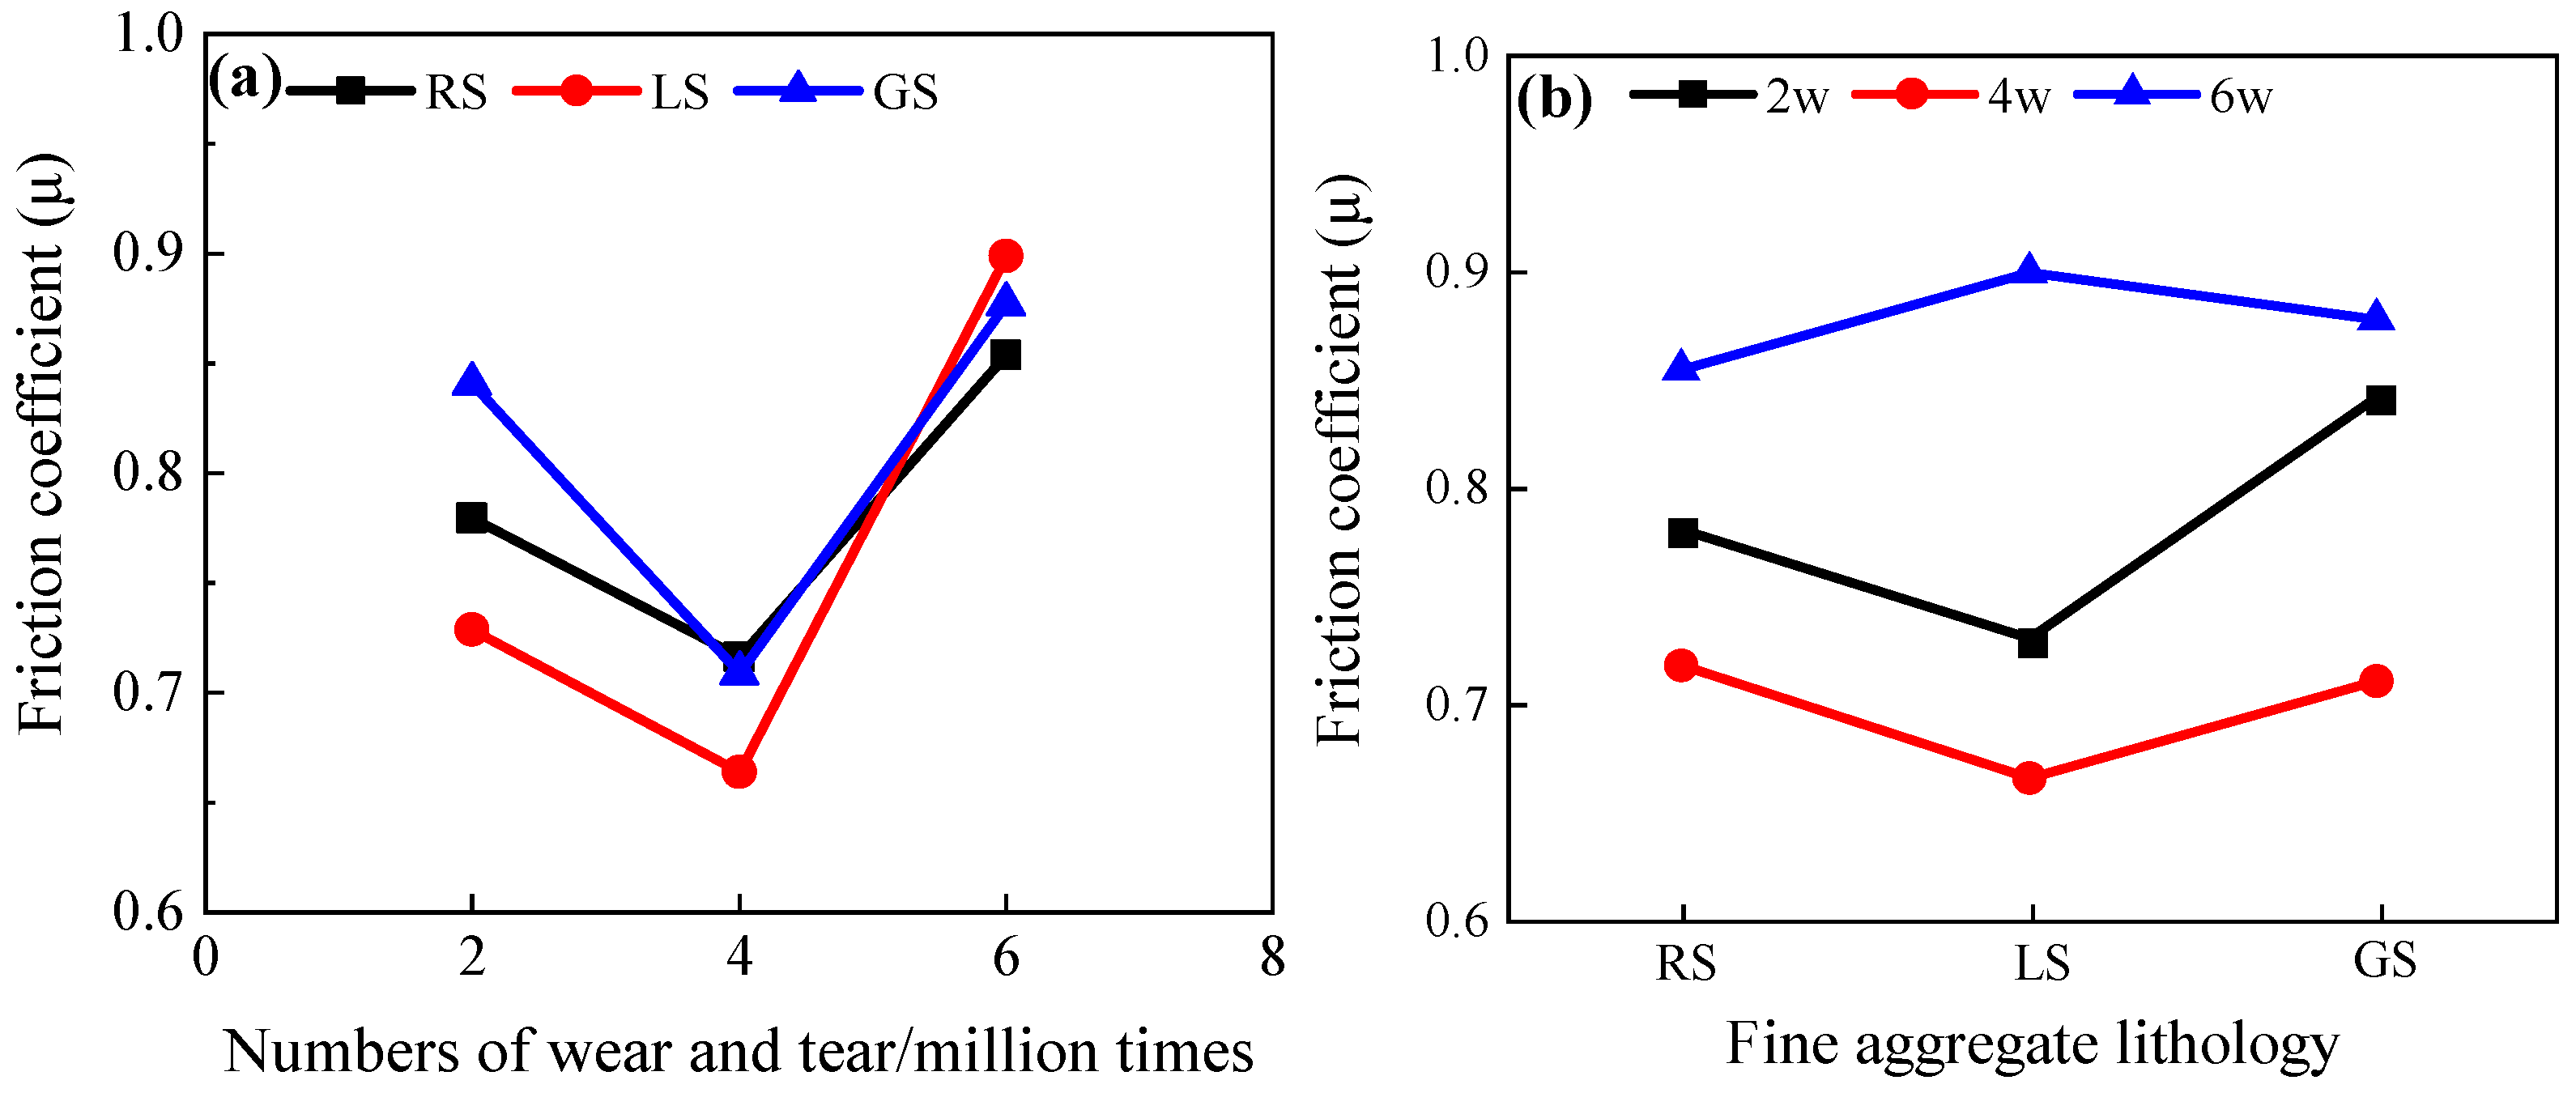
The effect of fine aggregate lithology on the skid resistance of concrete is shown in Figure 10. As observed in Figure 10, with the increase in the number of abrasion cycles, the friction coefficient of concrete with different fine aggregate lithologies initially decreases and then increases. When the number of wear cycles reaches 60,000 cycles, the friction coefficient exceeds that observed at 20,000 cycles. This indicates that the increase in abrasion leads to varying degrees of cement paste loss on the specimen’s surface [45]. When the abrasion cycle count is sufficiently high, the particles in the concrete gradually wear down and disperse, resulting in more fine particles and a more uneven surface structure, which ultimately causes an increase in the friction coefficient [46,47].
Among the friction coefficients of different fine aggregate lithologies, GS > RS concrete specimen in terms of the friction coefficient, and the LS concrete specimen exhibits the smallest friction coefficient within 40,000 abrasion cycles but experiences a sharp increase compared to other fine aggregate concrete specimens at 60,000 cycles. We speculate that this is because the GS concrete specimen better enhances the strength of the cement paste, resulting in the friction coefficient of the GS concrete specimen remaining high as the wear cycles increase. The uniformity of RS particles is stable, and the overall strength formed by the combination with cement may be higher [48,49]. As the number of wear cycles increases, the friction coefficient of the RS concrete specimen becomes slightly lower than that of the GS concrete specimen. The LS concrete specimen contains limestone powder to promote cement hydration, which makes the slurry higher [50]. As the number of wear cycles increases, the wear extends over a larger area, worsening surface roughness [51]. Therefore, the friction coefficient of the LS concrete specimen is the lowest before 40,000 abrasion cycles and increases sharply after 60,000 cycles of abrasion.

3.2. Study of the Construct Parameters of Concrete

3.2.1. Effect of Effective Sand Content on the Construct Parameters of GS Concrete

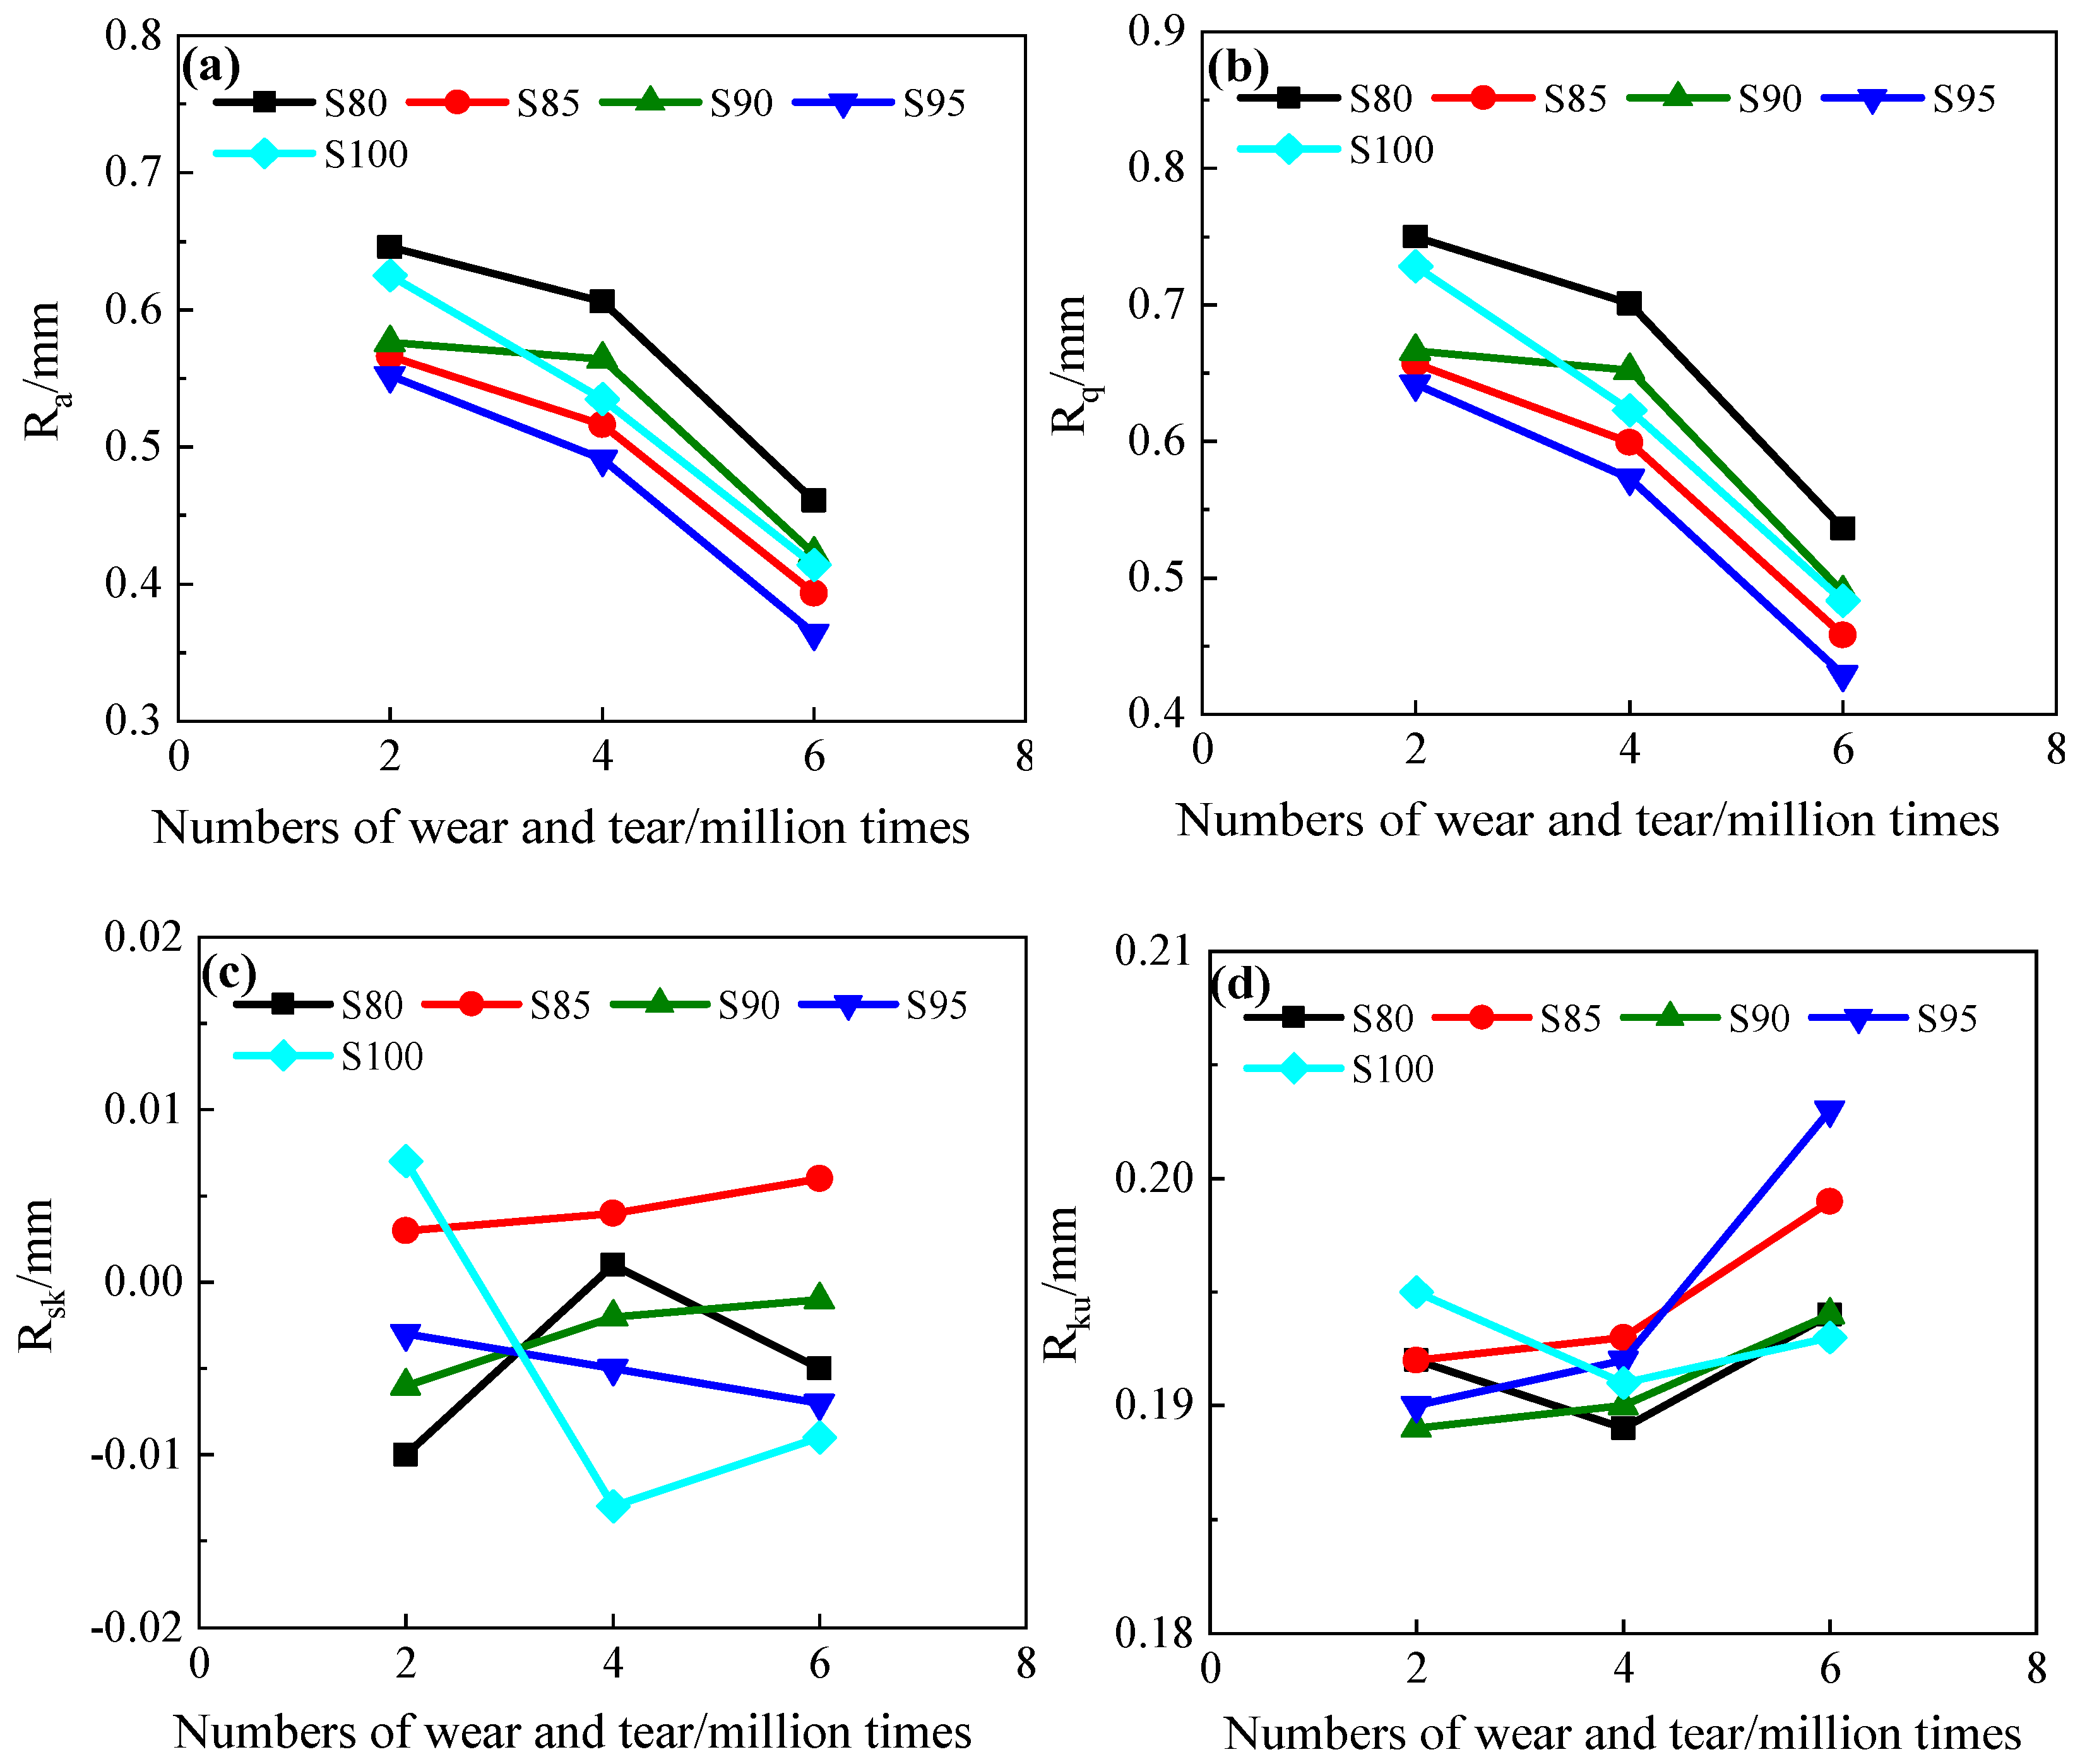
The influence of wear cycles and effective sand content on the structural parameters of GS concrete is illustrated in Figure 11. As shown in Figure 11a,b, Ra and Rq exhibit similar trends under varying abrasion durations and effective sand content. Although the arithmetic average value Ra and cross-section standard deviation Rq with different effective sand content decrease with the increase in wear cycles, the slope of the later decline is higher than that of the previous decline. In Figure 11c,d, it can be seen that there is no obvious change in the skewness Rsk of the concrete under different effective sand contents, but its absolute value is roughly within 0.1, indicating that the surface elevation distribution of the specimen is relatively symmetrical. The concrete kurtosis Rku under different effective sand contents basically maintains an upward trend when the number of abrasion cycles increases.
The results indicate that the cement matrix on the concrete surface undergoes primary wear during the initial stage, resulting in a gradual decrease in construction parameters. During the later stage, the abrasion of fine aggregates with smaller particle sizes causes aggregate detachment, resulting in void formation and significant alterations in structural parameters [52]. This phenomenon can be attributed to the relatively weaker mechanical properties of the cement matrix compared to other concrete components, particularly in regions containing interfacial transition zones (ITZs) and microvoids, which represent the most vulnerable areas within the concrete structure [53]. In the later stage of concrete, with the continuous action of external load, the original small defects such as ITZs and micro-voids may gradually expand, resulting in more cracks. These cracks usually start from fine aggregates with smaller particle size, because these fine aggregates are easier to wear down or peel off than larger aggregates [54]. When these fine aggregates are worn or peeled off, they will leave large voids in the concrete, which will significantly affect the construct parameters of the concrete.

3.2.2. Effect of Stone Powder on the Construct Parameters of GS Concrete

The effect of abrasion cycles and stone powder content on the construct parameters of GS concrete is shown in Figure 12. From Figure 12a,b, the trend of Ra and Rq is also roughly the same under different wear cycles and stone powder content. In Figure 12c,d, the trends of skewness Rsk of concrete with different stone powder contents is also not obvious. But the kurtosis Rku of concrete with different stone powder contents basically increases with the increase in abrasion cycles. The decrease rate of Ra and Rq with the increase in abrasion cycles is more consistent when the stone powder is not mixed. However, after the stone powder is mixed, the rates of decrease in Ra and Rq in the early stage of wear are significantly reduced, indicating that the stone powder can improve the compactness of the cement paste and enhance skid resistance [55]. Figure 12e–g further show that different stone powder contents have potential influence on the skid resistance of concrete pavement.

3.2.3. Effect of Fine Aggregate Lithology on the Construct Parameters of Concrete

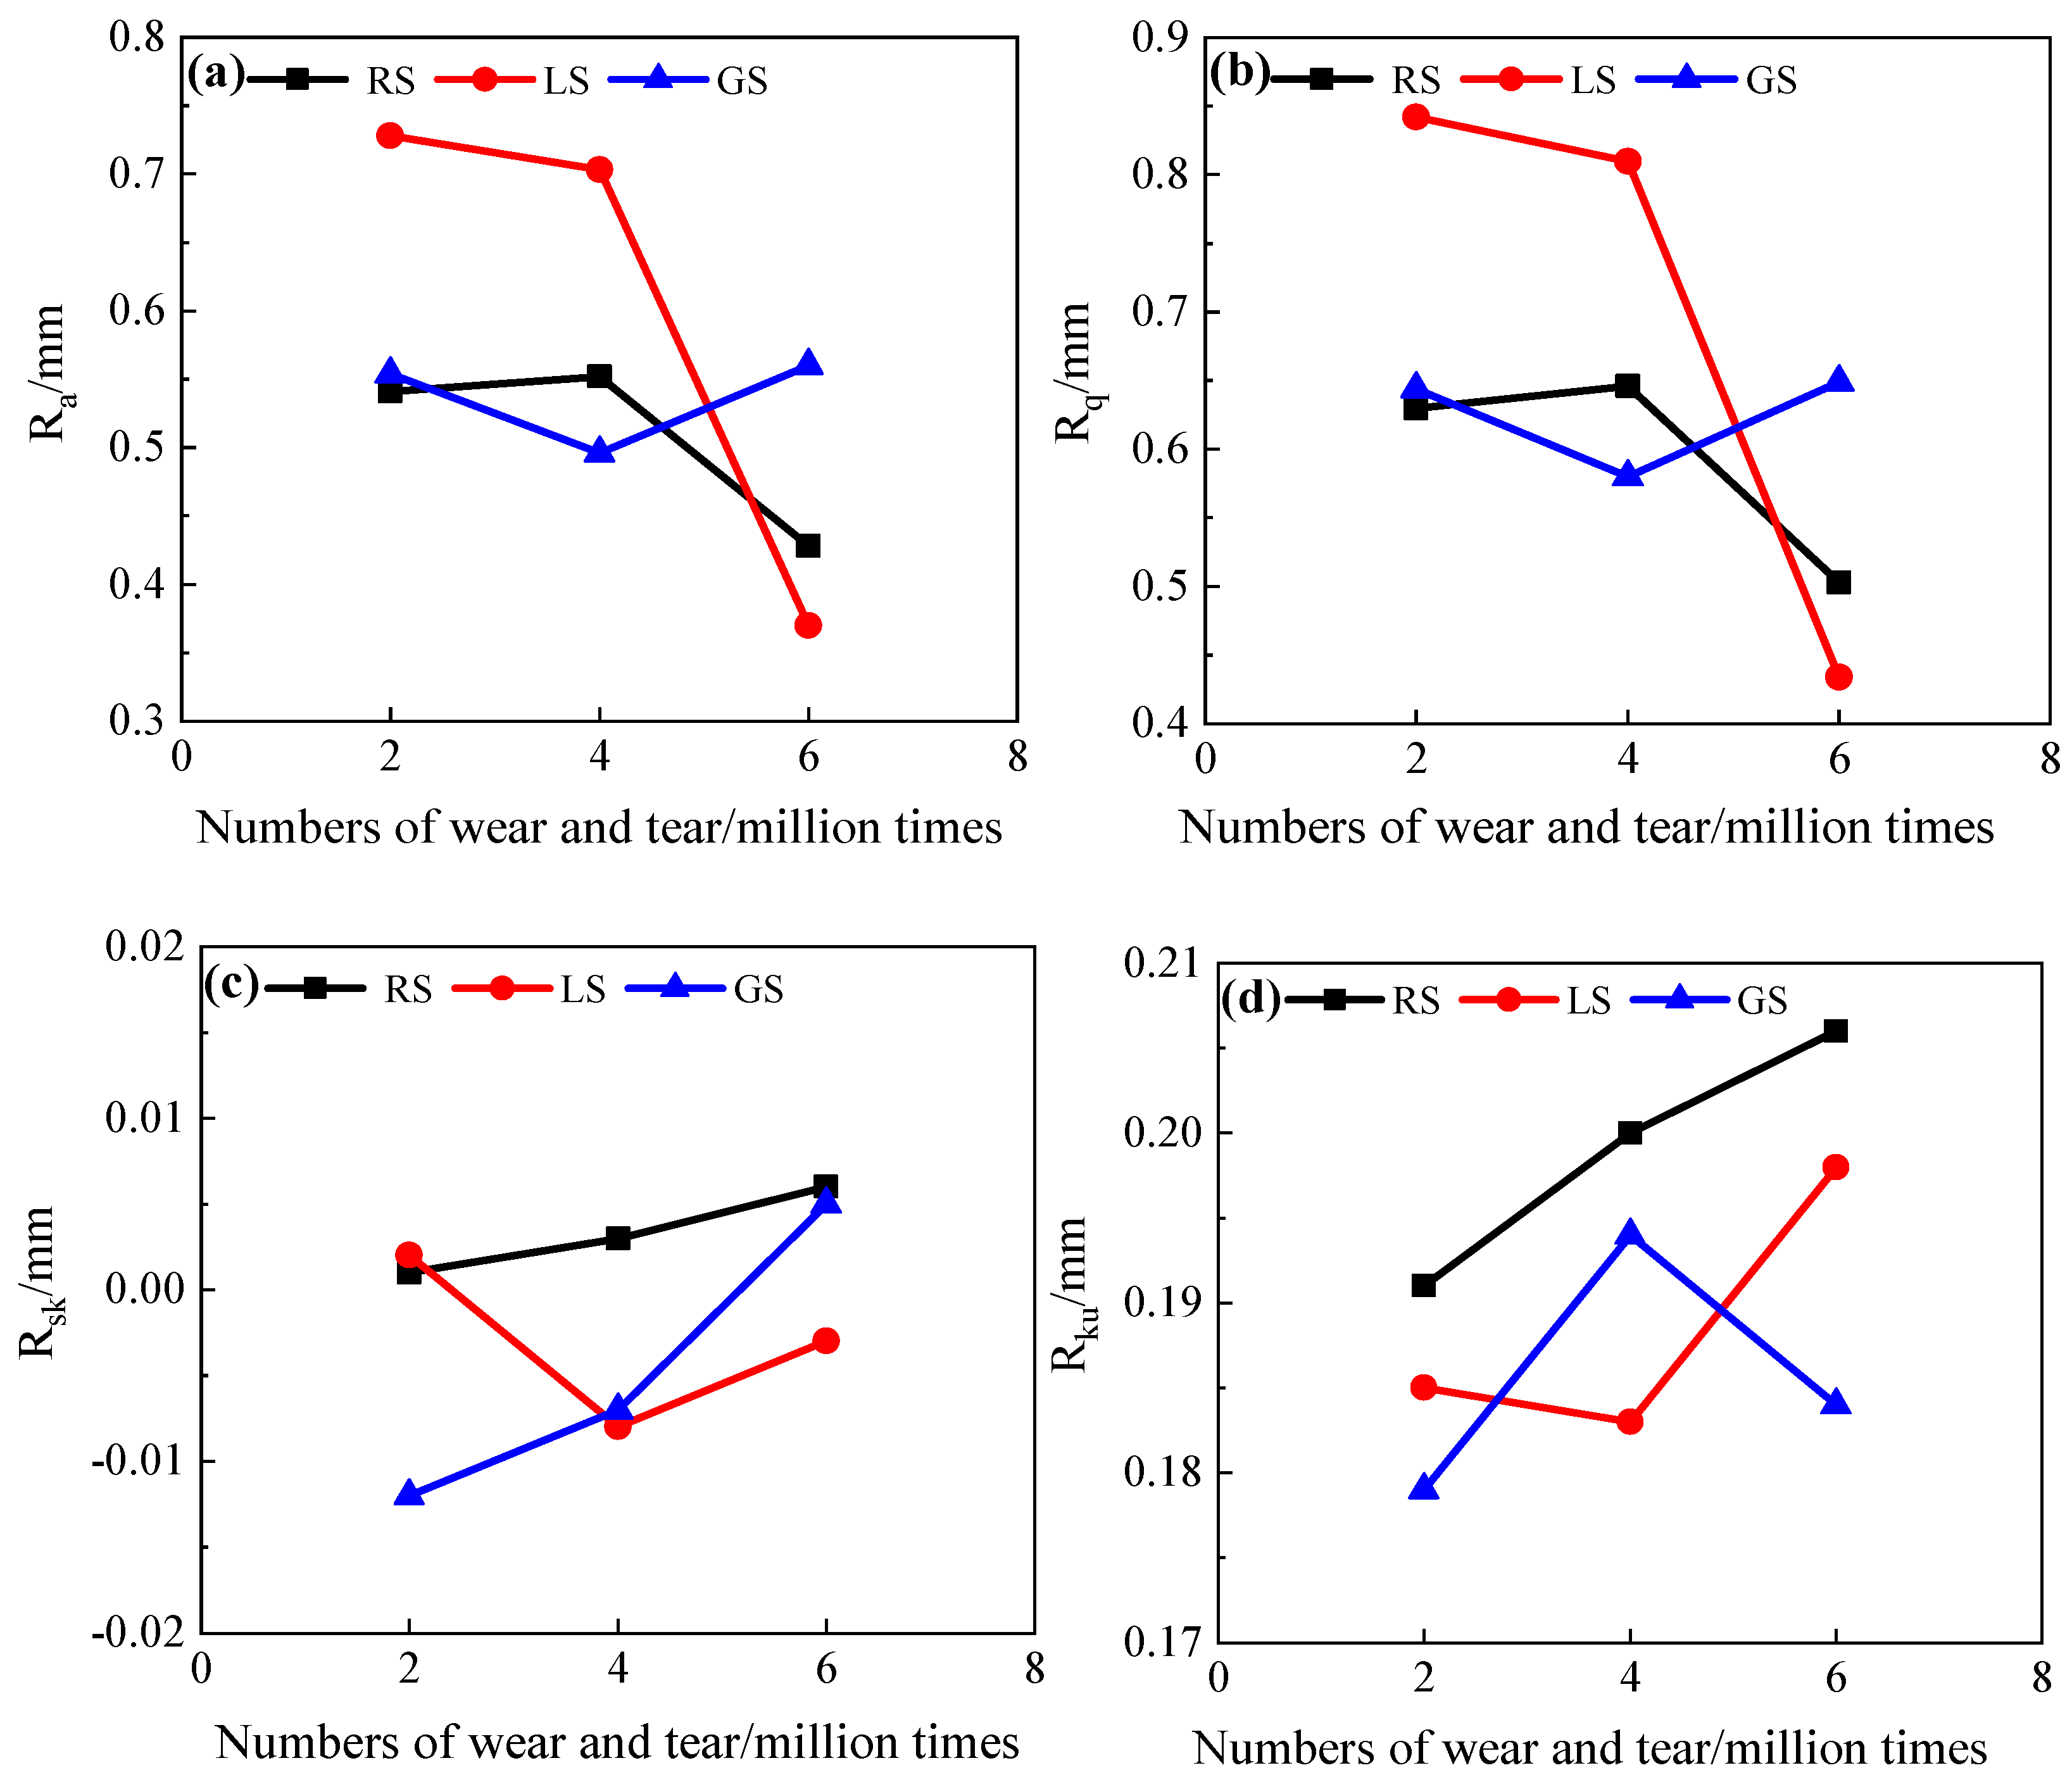
In Figure 13a,b, the changes in Ra and Rq in concrete specimens with different fine aggregate lithology are consistent. When the number of abrasion cycles increases, the changes in the three lithologic concrete specimens’ construct parameters are LS > RS > GS. The rate of decrease of the wear construction parameters in the early stage of LS concrete specimen is the slowest, and the rate of decrease in the later stage increases sharply. The construction parameters of the RS concrete specimen in the early stage increase slightly and decrease in the later stage. The construction parameters of the GS concrete specimen in the early stage decrease and increase in the later stage, and the difference between the initial and final construction parameters increases slightly. It can be seen from Figure 13c,d that there are differences in the Rsk and Rku of concrete specimens with different fine aggregate lithology. For the RS concrete specimen, the construct parameters keep increasing with the increase in abrasion cycles. For LS concrete specimen, with the increase in abrasion cycles, its Rsk increases first and then decreases in the negative direction, and its Rku decreases first and then increases significantly. For the GS concrete specimen, with the increase in abrasion cycles, its Rsk keeps decreasing from negative to positive, and its Rku increases first and then decreases.

3.3. Evolution Trends of Surface Wear Morphology of Concrete

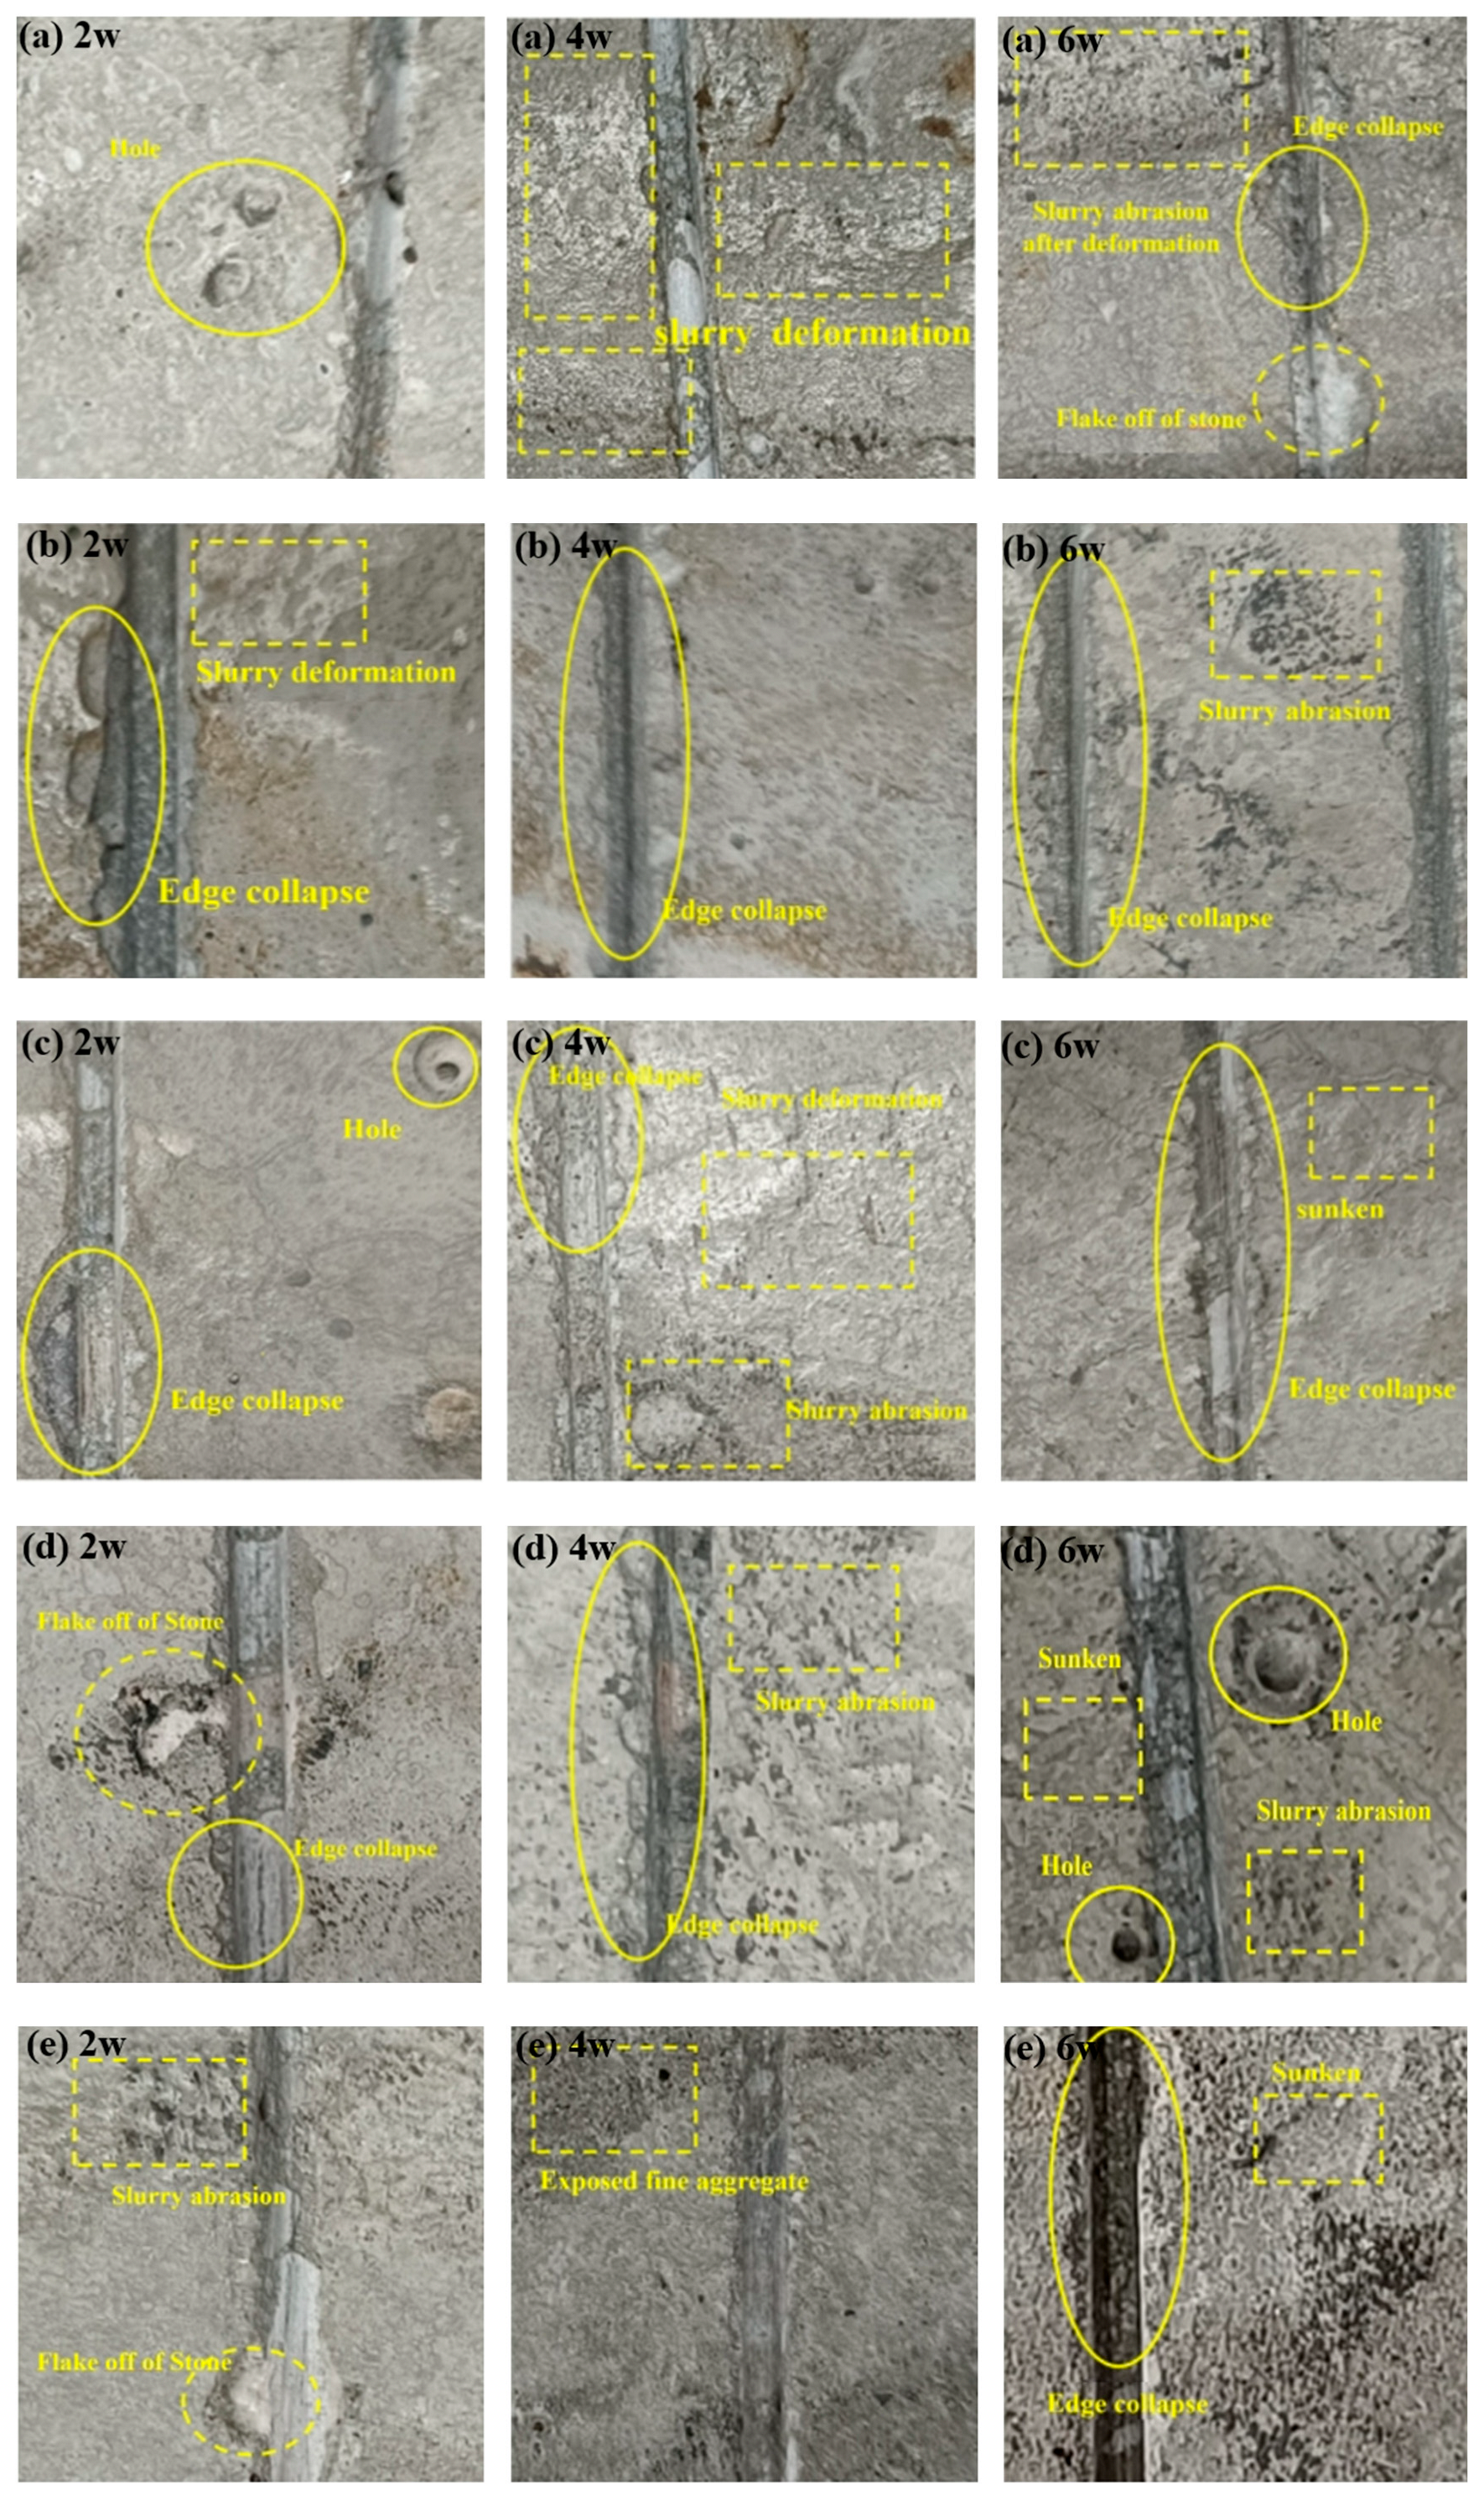
3.3.1. Evolution Trends of Surface Wear Morphology of GS Concrete with Different Effective Sand Content

The characteristic points of the surface morphology of concrete with different effective sand contents under different numbers of wear cycles are shown in Figure 14. It can be seen from Figure 15 that when the concrete with different effective sand contents is worn down 20,000 times, it is prone to suffering from collapse and spalling of the groove edge or the formation of holes on the surface. This is because when the tire runs on the surface of the specimen under the action of traffic load, the edge of the groove is prone to experiencing stress concentration and brittle failure. If there is stone material with an exposed cutting surface at the edge of the groove, it will also peel off due to stress concentration. If there are holes below the surface of the specimen, the thinner cement paste above the hole will undergo brittle failure when subjected to traffic load, exposing the underlying holes.
When the number of wear cycles reaches 40,000, the collapse of the groove edge is no longer limited to one location but is evenly distributed along all edges. Moreover, when the effective sand content is less than 90%, the surface of the specimen is prone to exhibiting slurry deformation. This may be due to the increase in road surface temperature caused by the reciprocating rolling of the tires. Under combined thermomechanical stresses induced by tire friction heat and rolling thrust, the surface cement paste undergoes plastic deformation, resulting in localized undulations on the specimen surface [56,57]. This process deteriorates skid resistance by altering macrotexture characteristics.
This phenomenon is related to the slurry formed by the bleeding of the concrete on the surface [58,59]. When the effective sand content of concrete is high, it leads to a high content of small-sized particles and a reduction in bleeding. Consequently, the rutting phenomenon is less likely to occur under such circumstances [60]. When the number of wear cycles reaches 60,000, the defects at the edge of the groove and the holes on the surface of the specimen will expand until the structure stabilizes.

3.3.2. Evolution Trends of Surface Wear Morphology of GS Concrete with Different Stone Powder

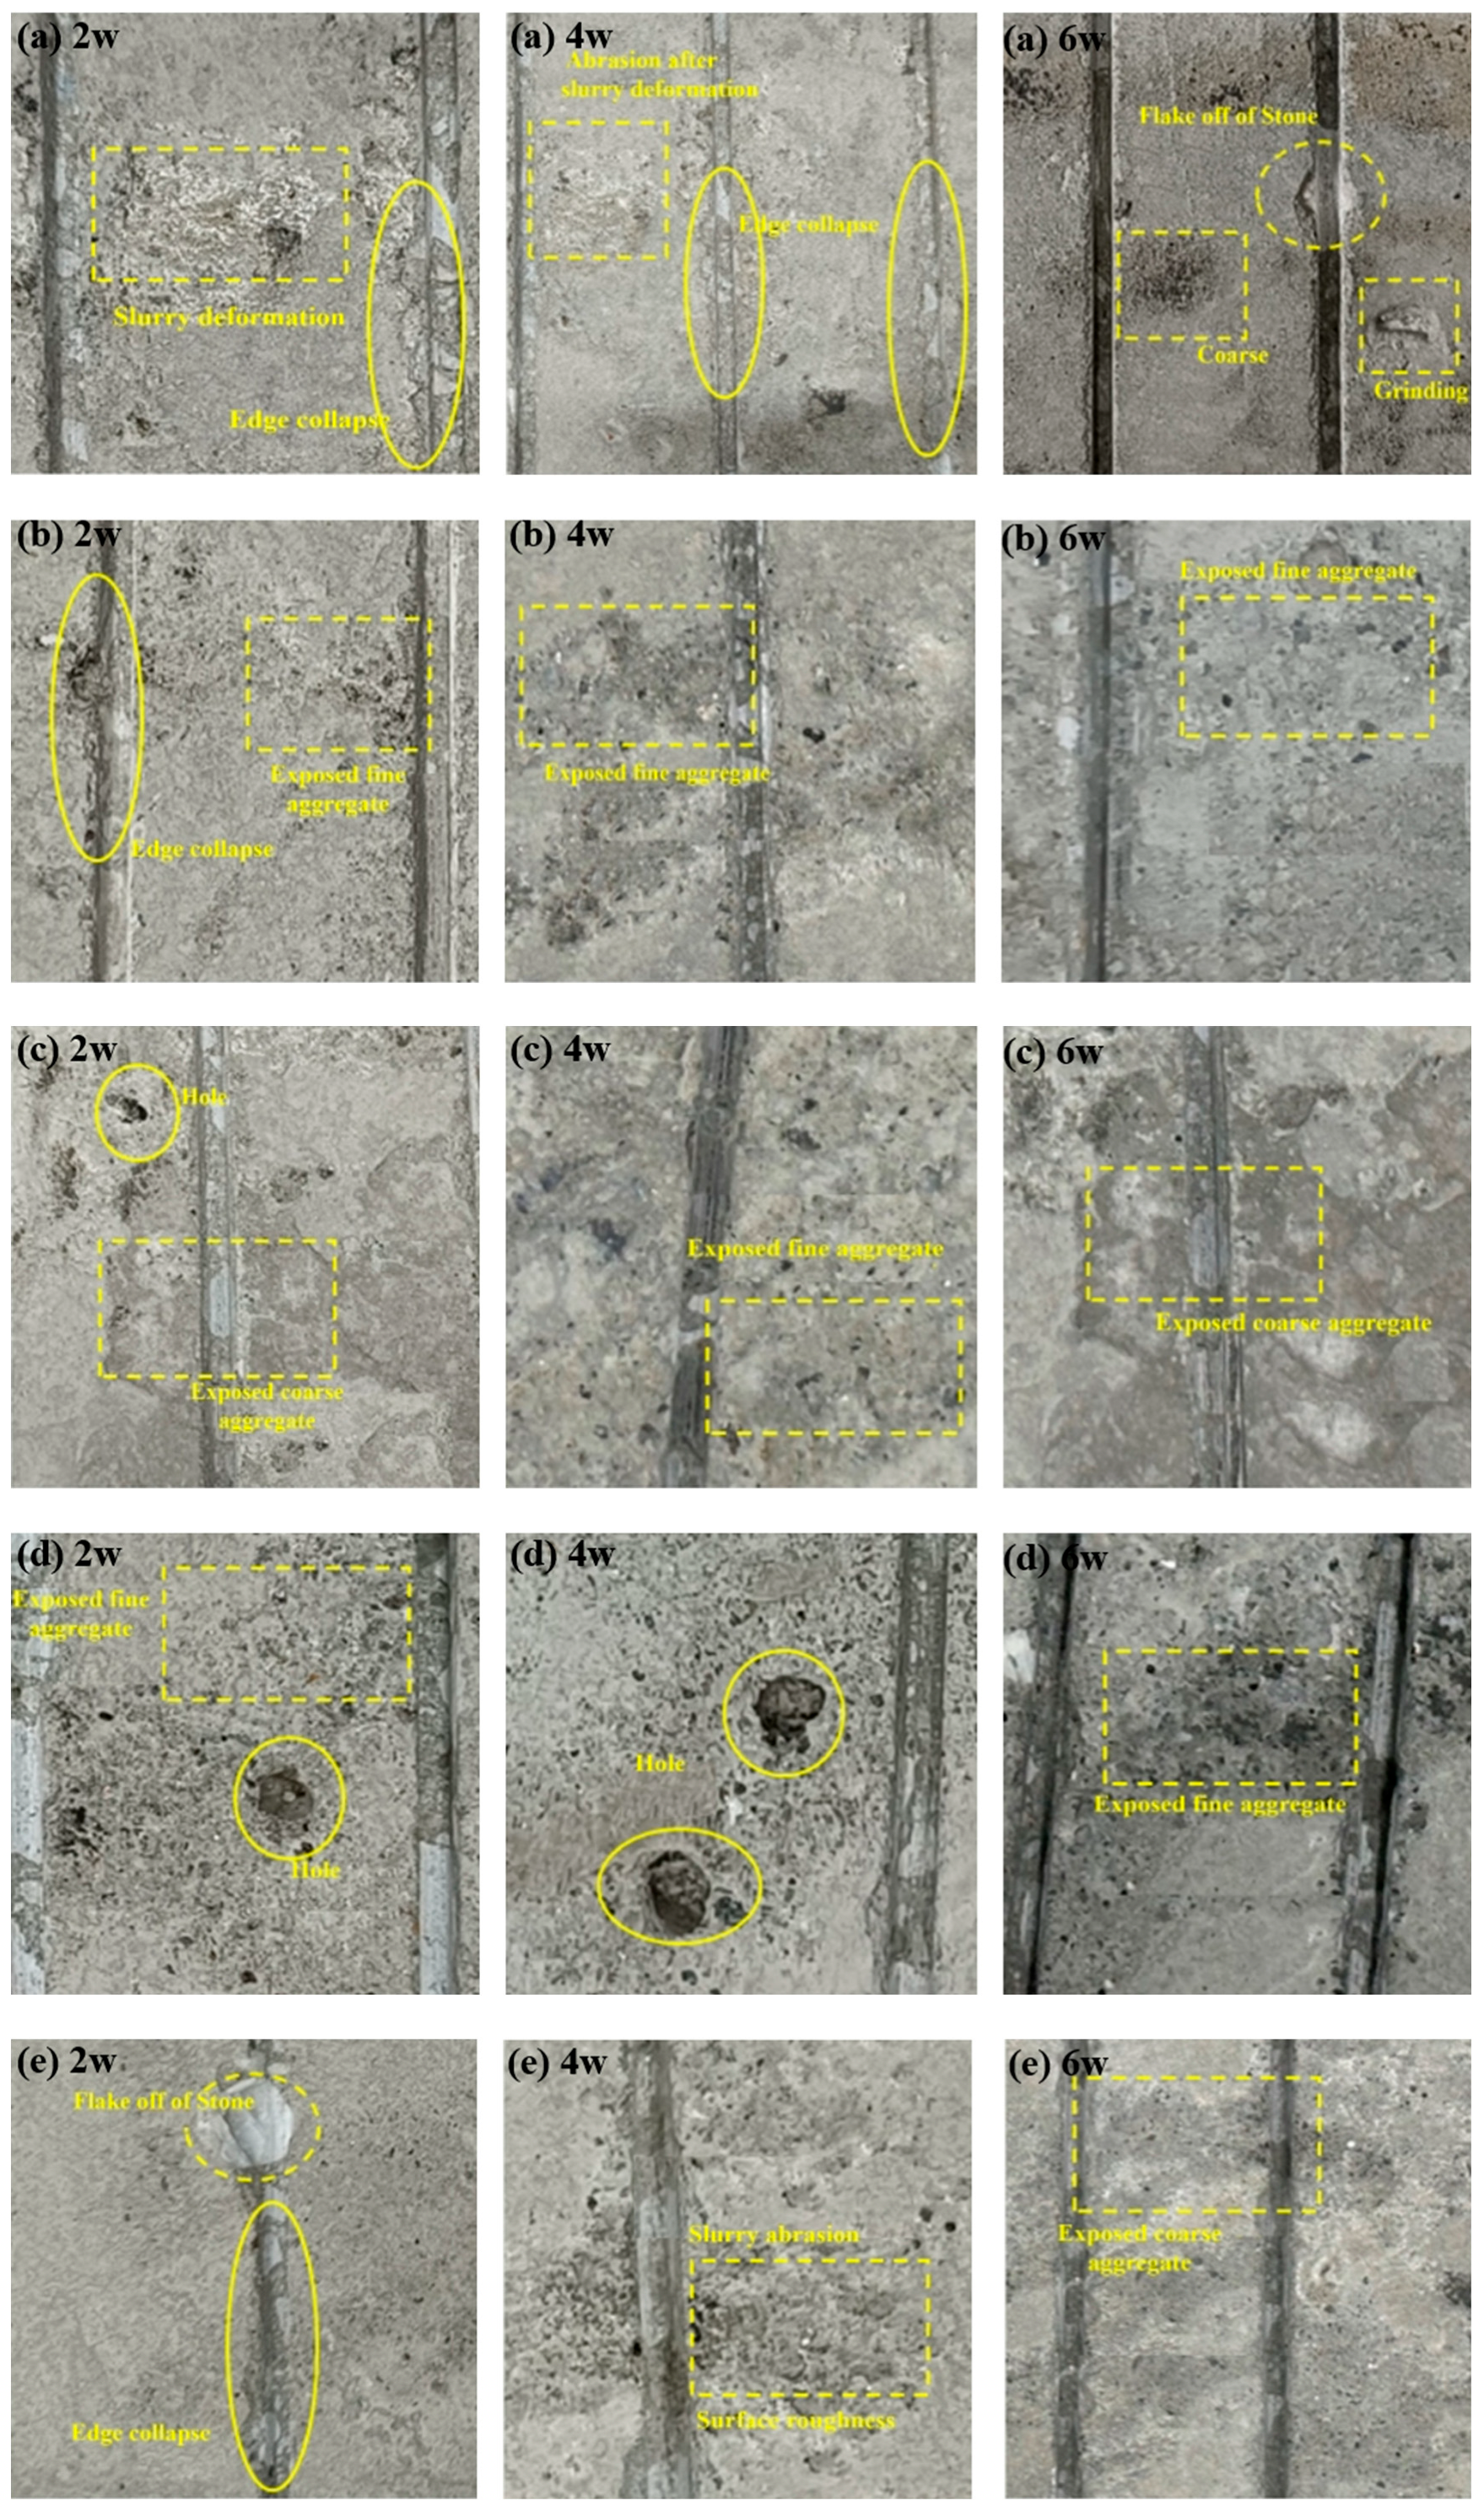
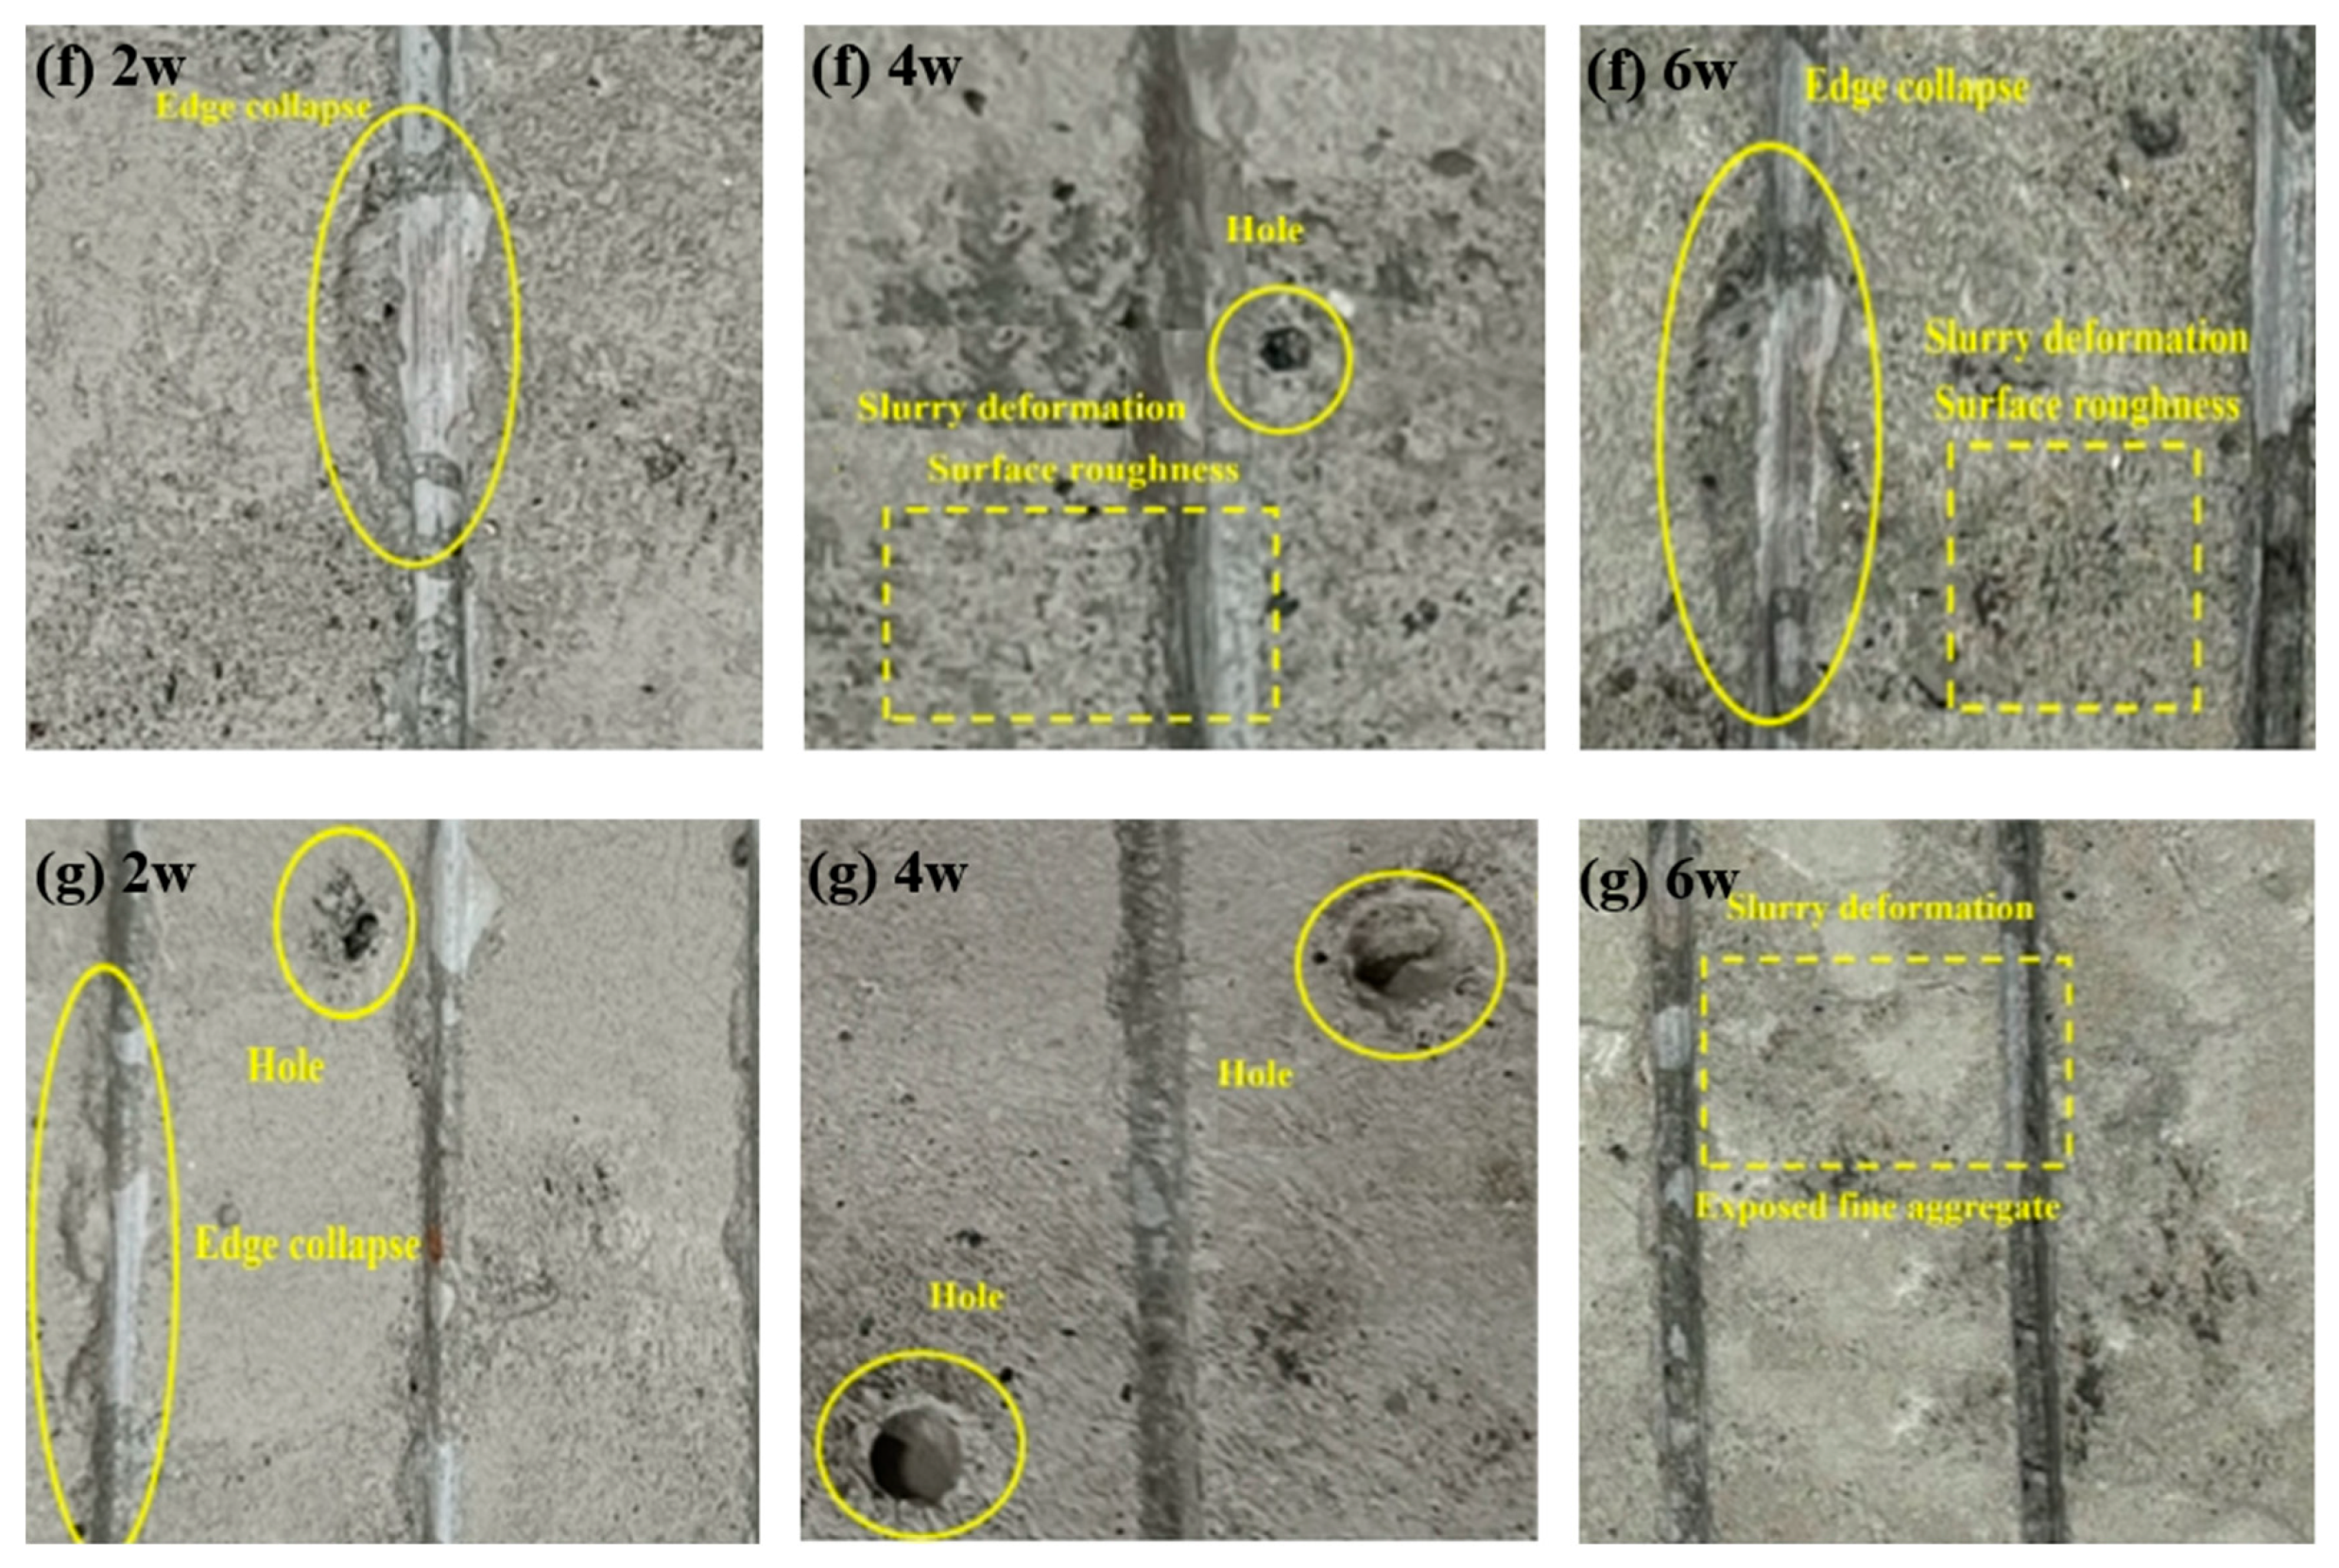
The characteristic points of the surface morphology of the specimens with different stone powder contents under different numbers of abrasion cycles are shown in Figure 15. It can be observed that the thermal deformation of the cement paste occurs only when the stone powder content in the concrete is low (0% and 3%), while the bleeding phenomenon in concretes with other contents is not obvious. In the early stage of wear, the groove collapse phenomenon is more likely to occur in concretes with higher stone powder contents (12% and 15%). Besides the spalling of the stones, the morphology of the groove edge of the remaining concrete remains relatively stable. We speculate that an appropriate stone powder content can enhance the strength of the cement mortar and help it effectively resist abrasion. Conversely, a higher stone powder content will reduce the strength of the cement mortar, which is in line with the findings of the previous analysis.
When comparing the wear morphology of concretes with different contents, it is observed that the surface wear of the J9 specimen is less severe (or less extensive). The surface of the J9 specimen mainly consists of exposed fine aggregate particles resulting from the abrasion of the sand–gravel slurry and the shallow flake-like abrasion of the cement paste between the aggregates. Holes are present on the surfaces of specimens J7, J12, and J15, and these holes expand as the number of wear cycles increases. The surfaces of specimens J3, J5, and J15 exhibit abrasion of the cement paste between the concrete aggregates. Through the analysis and comparison of the abrasion morphology, it is observed that the formation of holes has a negligible impact on the friction coefficient, whereas the spalling of the cement matrix renders the concrete surface uneven and rough, significantly affecting the friction coefficient [61]. Therefore, the friction coefficients of J3 and J5 keep increasing, while the friction coefficients of J0, J12, and J15, which are not mixed with stone powder or are mixed with stone powder, decrease first and then increase.

3.3.3. Evolution Trends of Surface Wear Morphology of Concrete with Different Fine Aggregate Lithology

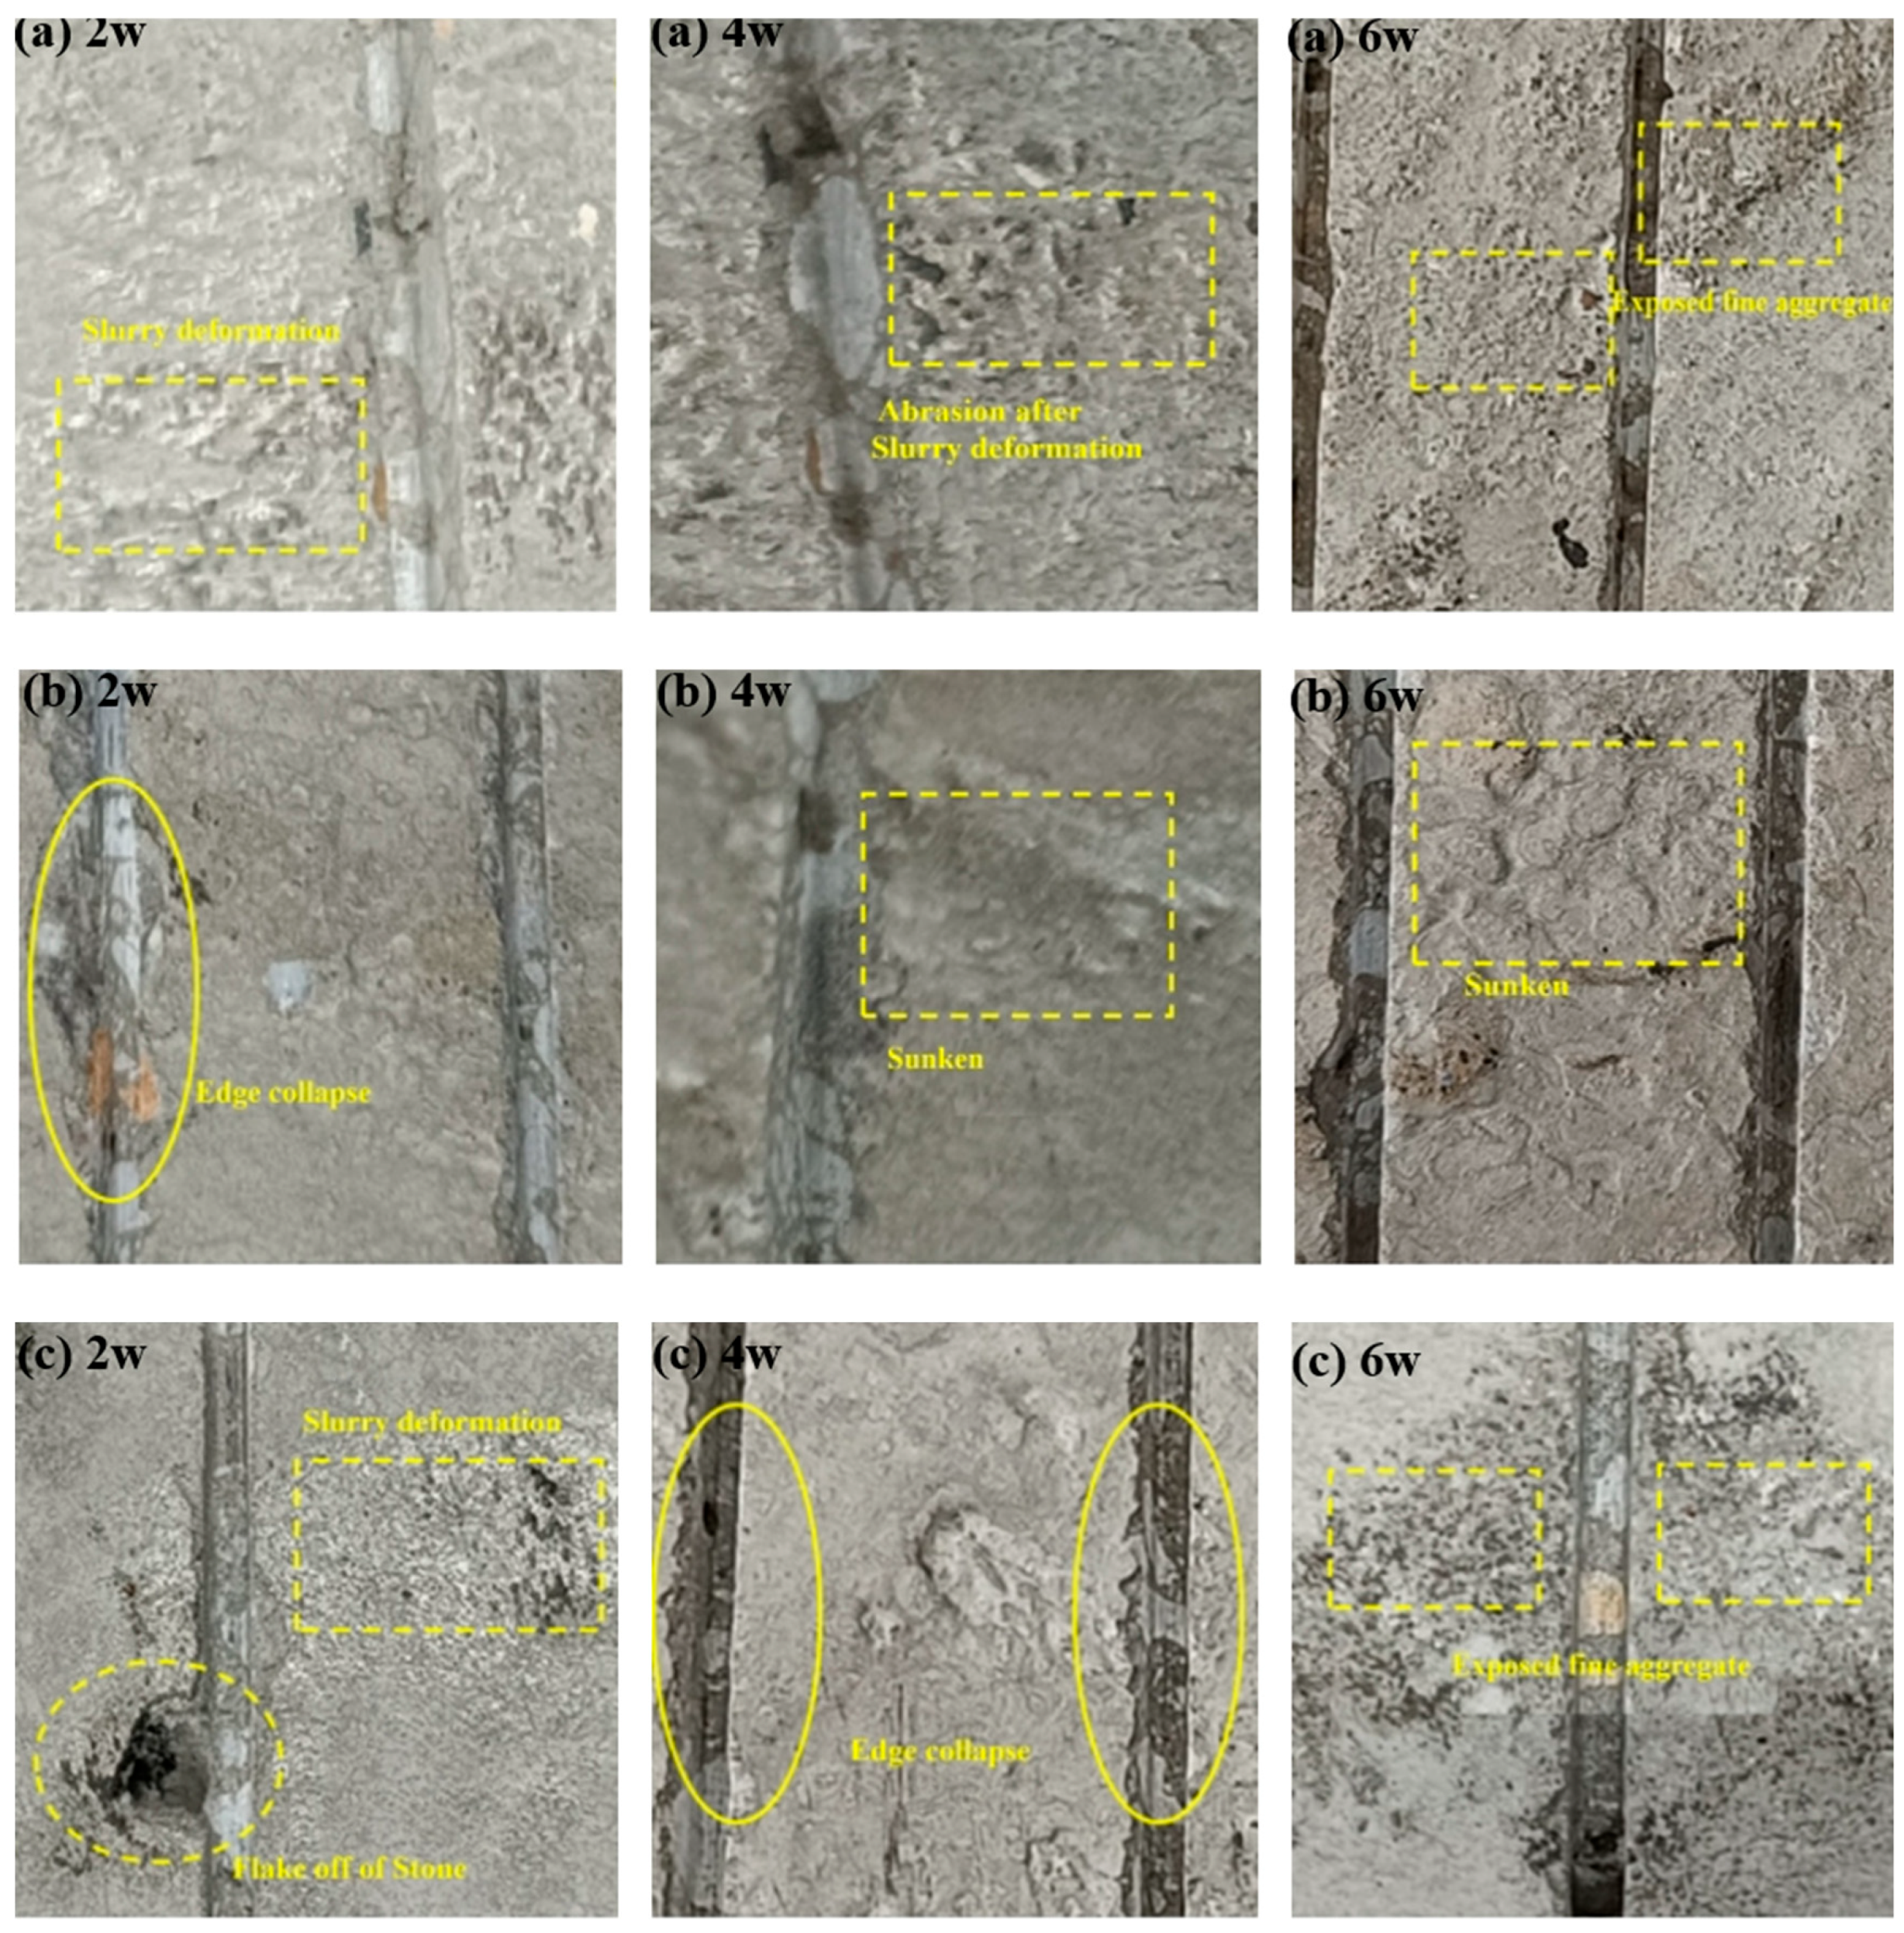
The characteristic points of the surface morphology of concrete with different fine aggregate lithology under different numbers of wear cycles are shown in Figure 16. It can be seen from Figure 16 that the thermal deformation of the cement paste due to the early wear of the specimen is evident. However, in the later stage, the cement paste is gradually worn away, exposing the fine aggregate. Although the LS concrete specimen exhibits edge collapse and depression, the surface of the specimen in the later stage is rough, and the fine aggregate is not distinctly visible. The early wear of the GS concrete specimen leads to evident stone spalling, yet the slurry deformation is not noticeable. In the middle stage, groove collapse and cement matrix spalling occurs. In the later stage, the abrasion results in damage to the cement matrix on the surface of the specimen, thereby exposing the fine aggregate. We speculate that the limestone powder contained in LS has reactivity, which promotes the formation of hydration products and forms a thicker slurry coating on the aggregate [62]. However, the stone powder in GS only plays a filling role to improve the strength of the mortar, so the surface abrasion morphology of the GS is more than that of the LS concrete specimen.
The surface of LS is coated with more cement paste, which makes it difficult to expose fine aggregate. Therefore, the surface of LS is relatively flat in the early stage of wear, and the friction coefficient is lower than that of RS and GS. When the number of wear cycles reaches 60,000, the surface unevenness caused by depression significantly increases the friction coefficient of the specimen and reduces the construct parameters Ra and Rq. For RS and GS, the deformation part of the slurry on the surface of the specimen is smooth, and the more slurry there is, the more cycles of wear are required to carry out abrasion on the surface of the fine aggregate, so the friction coefficient of GS is greater than that of RS

4. Conclusions

This study systematically investigates the long-term skid resistance of GS concrete. By analyzing the changes in specimen surface abrasion morphology and combining these observations with skid resistance evaluation indicators, this study provides an in-depth analysis of the skid resistance decay mechanism of GS concrete. The principal conclusions are as follows:
  • Within the tested sand content range (80–100%), we observed that the friction coefficient increased first and then decreased with the wear cycles with a lower effective sand content. With a higher effective sand content, the friction coefficient decreases first and then increases. The 95% sand content maintains a relatively high friction coefficient throughout the test cycle. These trends indicate that there is a potential link between sand content and friction behavior related to the wear stage, but generalization is required to expand the data range.
  • Within the tested stone powder content range (0–15%), we observed that the influence of stone powder content on the friction coefficient as the number of wear cycles increases manifests in three distinct patterns: For 0%, 12%, and 15% stone powder content, the friction coefficient initially decreases and then increases; for 3% and 5% content, it consistently increases; and for 7% and 9% content, it eventually decreases. Under the same number of wear cycles, the differences in friction coefficients among different stone powder contents progressively increase with additional wear cycles. However, specimens with 5% stone powder content maintain a high friction coefficient across various wear cycles, exhibiting the best skid resistance, suggesting potential optimization value within this experimental scope.
  • For the fine aggregate lithologies examined (LS/RS/GS), the friction coefficient generally decreases then increases with wear cycles. GS yields higher friction values than RS in the tested samples, while LS exhibits greater variability. This implies lithology-dependent wear mechanisms, but geological diversity (e.g., mineral composition variations within lithologies) necessitates broader sampling for conclusive claims.
  • Combined with wear morphology analysis, groove edge collapse progressively occurs as the number of wear cycles increases. However, we speculate that the addition of stone powder can significantly enhance the paste strength and delay the onset of groove edge collapse. Paste deformation primarily results from the low-strength cement paste formed due to surface bleeding, which is associated with the fine aggregate grading. Higher effective sand content and the addition of stone powder can effectively reduce the bleeding phenomenon.

Author Contributions

Methodology, H.L. and Y.Z.; software, B.S. and W.Z.; validation, X.Y. and B.S.; formal analysis, M.P. and Z.C.; investigation, Y.C.; resources, Y.C.; data curation, M.P. and C.D.; writing—original draft, H.L.; writing—review and editing, Y.C.; project administration, Y.C.; funding acquisition, Y.C. All authors have read and agreed to the published version of the manuscript.

Funding

This research was supported by the Guangxi Science and Technology Program (grant No. GuikeAB24010355).

Data Availability Statement

The original contributions presented in this study are included in the article. Further inquiries can be directed to the corresponding author.

Acknowledgments

The authors thank the reviewers of this paper for their comments and suggestions.

Conflicts of Interest

Authors Hongjie Li, Biao Shu, Chenglin Du, Yingming Zhuo, Zongxi Chen, Wentao Zhang and Xiaolong Yang were employed by Poly Changda Engineering Co., Ltd. Author Minqiang Pan was employed by China Railway Communications Investment Group Co., Ltd. The remaining authors declare that the research was conducted in the absence of any commercial or financial relationships that could be construed as a potential conflict of interest.

References

  1. Zhang, Y.; Zhang, X.; Jin, F.; Zhao, X. Impact of Stone Powder Content on Corrosion Resistance in Reinforced Concrete under Stray Current and Chloride Interactions. Materials 2024, 17, 196. [Google Scholar] [CrossRef]
  2. Chen, Y.; Li, Z.; Wang, Y.; Liang, G.; Yang, X. A Review of Long-Term Skid Resistance of Asphalt Pavement. Appl. Sci. 2025, 15, 1895. [Google Scholar] [CrossRef]
  3. Tang, Y.; Qiu, W.; Liu, D.; Zhang, W.; Zhang, R. Experimental Study on the Properties of Mortar and Concrete Made with Tunnel Slag Machine-Made Sand. Materials 2022, 15, 4817. [Google Scholar] [CrossRef]
  4. Wu, H.; Liu, K.; Yang, F.; Shen, B.; Ma, K.; Zhang, J.; Liu, B. Experimental Mechanical Properties and Numerical Simulation of C80 Concrete with Different Contents of Stone Powder. Materials 2022, 15, 3282. [Google Scholar] [CrossRef]
  5. Xue, H.; Chen, M.; Tang, Z.; Fan, G.; Zhou, J. Macro and Micro Impact Mechanisms of Stone Powder in Manufactured Sand on Physical and Mechanical Properties of Concrete. Adv. Eng. Sci. 2023, 55, 151–160. [Google Scholar]
  6. Tsivilis, S.; Batis, G.; Chaniotakis, E.; Grigoriadis, G.; Theodossis, D. Properties and Behavior of Limestone Cement Concrete and Mortar. Cem. Concr. Res. 2000, 30, 1679–1683. [Google Scholar] [CrossRef]
  7. Ismaeel, N.S.; Khalaf, M.A. Properties of High Strength Concrete Containing StonePowder as Natural Pozzolanic Materials. J. Univ. Anbar Pure Sci. 2014, 7, 1–7. [Google Scholar] [CrossRef]
  8. Craeye, B.; De Schutter, G.; Desmet, B.; Vantomme, J.; Heirman, G.; Vandewalle, L.; Cizer, Ö.; Aggoun, S.; Kadri, E. Effect of Mineral Filler Type on Autogenous Shrinkage of Self-Compacting Concrete. Cem. Concr. Res. 2010, 40, 908–913. [Google Scholar] [CrossRef]
  9. Li, H.; Huang, F.; Cheng, G.; Xie, Y.; Tan, Y.; Li, L.; Yi, Z. Effect of Granite Dust on Mechanical and Some Durability Properties of Manufactured Sand Concrete. Constr. Build. Mater. 2016, 109, 41–46. [Google Scholar] [CrossRef]
  10. Lu, L.; Yang, Z.; Lin, Y.; Dong, S. Partial Replacement of Manufactured Sand with Homologous Granite Powder in Mortar: The Effect on Porosity and Capillary Water Absorption. Constr. Build. Mater. 2023, 376, 131031. [Google Scholar] [CrossRef]
  11. Rao, K.; Desai, V.; Mohan, D. Experimental Investigations on Mode II Fracture of Concrete with Crushed Granite Stone Fine Aggregate Replacing Sand. Mater. Res.-Ibero-Am. J. Mater. 2012, 15, 41–50. [Google Scholar] [CrossRef]
  12. Singh, S.; Nande, N.; Bansal, P.; Nagar, R. Experimental Investigation of Sustainable Concrete Made with Granite Industry By-Product. J. Mater. Civ. Eng. 2017, 29, e017559. [Google Scholar] [CrossRef]
  13. Binici, H.; Shah, T.; Aksogan, O.; Kaplan, H. Durability of Concrete Made with Granite and Marble as Recycle Aggregates. J. Mater. Process. Technol. 2008, 208, 299–308. [Google Scholar] [CrossRef]
  14. Torgal, F.; Castro-Gomes, J. Influence of Physical and Geometrical Properties of Granite and Limestone Aggregates on the Durability of a C20/25 Strength Class Concrete. Constr. Build. Mater. 2006, 20, 1079–1088. [Google Scholar] [CrossRef]
  15. Hussin, A.; Poole, C. Petrography Evidence of the Interfacial Transition Zone (ITZ) in the Normal Strength Concrete Containing Granitic and Limestone Aggregates. Constr. Build. Mater. 2011, 25, 2298–2303. [Google Scholar] [CrossRef]
  16. Sheng, W.; Wang, D.; Cheng, H.; Yang, R.; Wang, Y. Joint Improvements of Skid and Abrasion Resistance of Concrete Pavements through Manufactured Micro- and Macro-Textures. Constr. Build. Mater. 2025, 487, 142033. [Google Scholar] [CrossRef]
  17. Zhao, W.; Zhang, J.; Lai, J.; Shi, X.; Xu, Z. Skid Resistance of Cement Concrete Pavement in Highway Tunnel: A Review. Constr. Build. Mater. 2023, 406, 133235. [Google Scholar] [CrossRef]
  18. Valença, J.; Puente, I.; Júlio, E.; González-Jorge, H.; Arias-Sánchez, P. Assessment of Cracks on Concrete Bridges Using Image Processing Supported by Laser Scanning Survey. Constr. Build. Mater. 2017, 146, 668–678. [Google Scholar] [CrossRef]
  19. Guo, F.; Pei, J.; Zhang, J.; Li, R.; Zhou, B.; Chen, Z. Study on the Skid Resistance of Asphalt Pavement: A State-of-the-Art Review and Future Prospective. Constr. Build. Mater. 2021, 303, 124411. [Google Scholar] [CrossRef]
  20. Cui, X.; Chu, L.; Fwa, T.F. Experimental-Cum-Numerical Approach for Directional Skid Resistance Measurement of Grooved Pavements. Measurement 2022, 205, 112129. [Google Scholar] [CrossRef]
  21. Liu, C.; Liu, Y.; Chen, Y.; Zhao, C.; Qiu, J.; Wu, D.; Liu, T.; Fan, H.; Qin, Y.; Tang, K. A State-of-the-Practice Review of Three-Dimensional Laser Scanning Technology for Tunnel Distress Monitoring. J. Perform. Constr. Facil. 2023, 37, 03123001. [Google Scholar] [CrossRef]
  22. Hanson, D.; Prowell, B. Evaluation of Circular Texture Meter for Measuring Surface Texture of Pavements. Transp. Res. Rec. 2005, 1929, 88–96. [Google Scholar] [CrossRef]
  23. Mora, C.F.; Kwan, A.K.H. Sphericity, Shape Factor, and Convexity Measurement of Coarse Aggregate for Concrete Using Digital Image Processing. Cem. Concr. Res. 2000, 30, 351–358. [Google Scholar] [CrossRef]
  24. Adresi, M.; Lacidogna, G. Investigating the Micro/Macro-Texture Performance of Roller-Compacted Concrete Pavement under Simulated Traffic Abrasion. Appl. Sci. 2021, 11, 5704. [Google Scholar] [CrossRef]
  25. Gierasimiuk, P.; Wasilewska, M.; Gardziejczyk, W. A Comparative Study on Skid Resistance of Concrete Pavements Differing in Texturing Technique. Materials 2021, 14, 178. [Google Scholar] [CrossRef]
  26. JTG E30-2005; Test Methods of Cement and Concrete for Highway Engineering. China Communications Press: Beijing, China, 2005.
  27. GB 175-2007; Common Portland Cement. China Standards Press: Beijing, China, 2007.
  28. GB/T 14684-2022; Sand for Construction. State Administration for Market Regulation: Beijing, China, 2022.
  29. GB/T 14685-2011; Pebble and Crushed Stone for Construction. General Administration of Quality Supervision, Inspection and Quarantine: Beijing, China, 2011.
  30. GB 8076-2008; Concrete Admixtures. General Administration of Quality Supervision, Inspection and Quarantine: Beijing, China, 2008.
  31. GB/T 1596-2005; Fly Ash Used for Cement and Concrete. General Administration of Quality Supervision, Inspection and Quarantine: Beijing, China, 2005.
  32. GB 5749-2006; Standards for Drinking Water Quality. Ministry of Health of China: Beijing, China, 2006.
  33. Li, Z.; Wang, Y.; Yang, X.; Liang, J.; Chen, Y.; Pan, M. Study on Abrasion Resistance of Granite Manufactured Sand Concrete Based on Indoor Abrasion Tester. Coatings 2025, 15, 659. [Google Scholar] [CrossRef]
  34. Kim, S.H.; Shin, M.C. Steering Pull Model and Its Sensitivity Analysis. Appl. Sci. 2020, 10, 8027. [Google Scholar] [CrossRef]
  35. JGJ 55-2011; Specification for Mix Proportion Design of Ordinary Concrete. Ministry of Housing and Urban-Rural Development of the People’s Republic of China: Beijing, China, 2011.
  36. JTG D40-2011; Specifications for Design of Highway Cement Concrete Pavement. Ministry of Transport of the People’s Republic of China: Beijing, China, 2011.
  37. ASTM E1911; Standard Test Method for Measuring the Response of Materials to Thermal and Mechanical Stimuli Using Dynamic Mechan ical Analysis. ASTM International: West Conshohocken, PA, USA, 2020.
  38. ASTM E274; Standard Test Method for Skid-Resistance of Paved Surfaces Using a Full-Scale Tire. ASTM International: West Conshohocken, PA, USA, 2018.
  39. Tian, Y.; Kasyap, S.S.; Senetakis, K. Influence of Loading History and Soil Type on the Normal Contact Behavior of Natural Sand Grain-Elastomer Composite Interfaces. Polymers 2021, 13, 1830. [Google Scholar] [CrossRef] [PubMed]
  40. Zhang, W.; Mao, J.; Yu, X.; Zhou, B.; Wang, L. Study on the Dynamic Mechanical Properties of Ultrahigh-Performance Concrete under Triaxial Constraints. Materials 2023, 16, 6591. [Google Scholar] [CrossRef]
  41. Zhou, Z.; Liu, J.; Wu, R.; Wu, A.; Wang, H.; Wang, S. Analysis of Bleeding of Low Concentration Full Tailings Filling Material and Its Regulate-control. Chin. J. Mater. Res. 2020, 34, 481–488. [Google Scholar]
  42. Wang, A.; Shi, Y.; Liu, K.; Sun, D.; Lu, B.; Liu, P. Effect of Aircooled Blast Furnace Slag as Fine Aggregate on the Properties of Cement Mortar. Mater. Rep. 2017, 31, 121–125. [Google Scholar]
  43. Janakiraman, V.; Li, S.; Kahraman, A. An Investigation of the Impacts of Contact Parameters on Wear Coefficient. J. Tribol. 2014, 136, 031602. [Google Scholar] [CrossRef]
  44. Burdzik, R.; Folega, P.; Lazarz, B.; Stanik, Z.; Warczek, J. Analysis of the impact of surface layer parameters on wear intensity of friction pairs. Arch. Metall. Mater. 2012, 57, 987–993. [Google Scholar] [CrossRef]
  45. Xin, Y.; Lu, X.; Ji, H.; Hao, H.; Dong, S. Analysis of early damage characteristics and late mechanical behavior of cement specimens. J. China Coal Soc. 2020, 45, 3119–3130. [Google Scholar] [CrossRef]
  46. Abid, S.R.; Hilo, A.N.; Daek, Y.H. Experimental Tests on the Underwater Abrasion of Engineered Cementitious Composites. Constr. Build. Mater. 2018, 171, 779–792. [Google Scholar] [CrossRef]
  47. Cheyad, S.M.; Hilo, A.N.; Al-Gasham, T.S. Comparing the Abrasion Resistance of Conventional Concrete and Geopolymer Samples. Mater. Today Proc. 2022, 56, 1832–1839. [Google Scholar] [CrossRef]
  48. Zhao, M.; Dai, M.; Li, J.; Li, C. Case Study on Performance of Pumping Concrete with Super-Fine River-Sand and Manufactured-Sand. Case Stud. Constr. Mater. 2023, 18, e01850. [Google Scholar] [CrossRef]
  49. Opara, H.E.; Eziefula, U.G.; Eziefula, B.I. Comparison of Physical and Mechanical Properties of River Sand Concrete with Quarry Dust Concrete. Sel. Sci. Pap.-J. Civ. Eng. 2018, 13, 127–134. [Google Scholar] [CrossRef]
  50. Xiao, J.; Jin, Y.; Gou, C.; Wang, Y. Effect of ground limestone on hydration characteristics and pore structure of cement pastes. J. Cent. S. Univ. 2010, 41, 2313–2320. [Google Scholar]
  51. Ding, Z.F. Experimental Study of Crushing and Wear Resistance of Limestone and Basalt Coarse Aggregate Contrast. Highw. Eng. 2014. Available online: https://api.semanticscholar.org/CorpusID:131417272 (accessed on 18 August 2025).
  52. Najafi Koopas, R.; Rauter, N.; Lammering, R. Two-Dimensional Mesoscale Finite Element Modeling of Concrete Damage and Failure. Appl. Sci. 2023, 13, 8971. [Google Scholar] [CrossRef]
  53. Xiong, Y.; Yin, J. A Review on Microscopic Property of Concrete’s Aggregate-Mortar Interface Transition Zone. Appl. Mech. Mater. 2016, 847, 544–552. [Google Scholar] [CrossRef]
  54. Horník, J.; Čižmárová, E.; Krum, S.; Krčil, J.; Mára, V. The Influence of Microstructure on the Fracture Development in Engineering Parts. Solid State Phenom. 2017, 270, 74–79. [Google Scholar] [CrossRef]
  55. Zhu, Y.; Wen, C.; Chen, J. Influence of Stone Powder on Properties of Concrete with Low Cementitious Materials. IOP Conf. Ser. Mater. Sci. Eng. 2018, 371, 012021. [Google Scholar] [CrossRef]
  56. Srirangam, S.K.; Anupam, K.; Scarpas, A.; Kasbergen, C. Development of a Thermomechanical Tire-Pavement Interaction Model. Int. J. Pavement Eng. 2014, 16, 721–729. [Google Scholar] [CrossRef]
  57. Anupam, K.; Srirangam, S.K.; Scarpas, A.; Kasbergen, C. Influence of Temperature on Tire-Pavement Friction: Analyses. Transp. Res. Rec. 2013, 2369, 114–124. [Google Scholar] [CrossRef]
  58. Dong, W.; Liu, C.; Bao, X.; Xiang, T.; Chen, D. Advances in the Deformation and Failure of Concrete Pavement under Coupling Action of Moisture, Temperature, and Wheel Load. Materials 2020, 13, 5530. [Google Scholar] [CrossRef]
  59. Fattah, M.Y.; El-Ghany, S.A.; Abdaljabbar, A.S. Analysis of the Performance of Flexible Pavement under the Effect of Wheel and Thermal Loads. Eng. Technol. J. 2010, 28, 5782–5802. [Google Scholar] [CrossRef]
  60. Coughlin, J.P.; Campbell, C.D.; Mays, D.C. Infiltration and Clogging by Sand and Clay in a Pervious Concrete Pavement System. J. Hydrol. Eng. 2012, 17, 68–73. [Google Scholar] [CrossRef]
  61. Kampmann, R.; Roddenberry, M.; Ping, W.V. Contribution of Specimen Surface Friction to Size Effect and Rupture Behavior of Concrete. ACI Mater. J. 2013, 110, 169–176. [Google Scholar] [CrossRef]
  62. Sua-Iam, G.; Makul, N. Use of Limestone Powder to Improve the Properties of Self-Compacting Concrete Produced Using Cathode Ray Tube Waste as Fine Aggregate. Appl. Mech. Mater. 2012, 193–194, 472–476. [Google Scholar] [CrossRef]
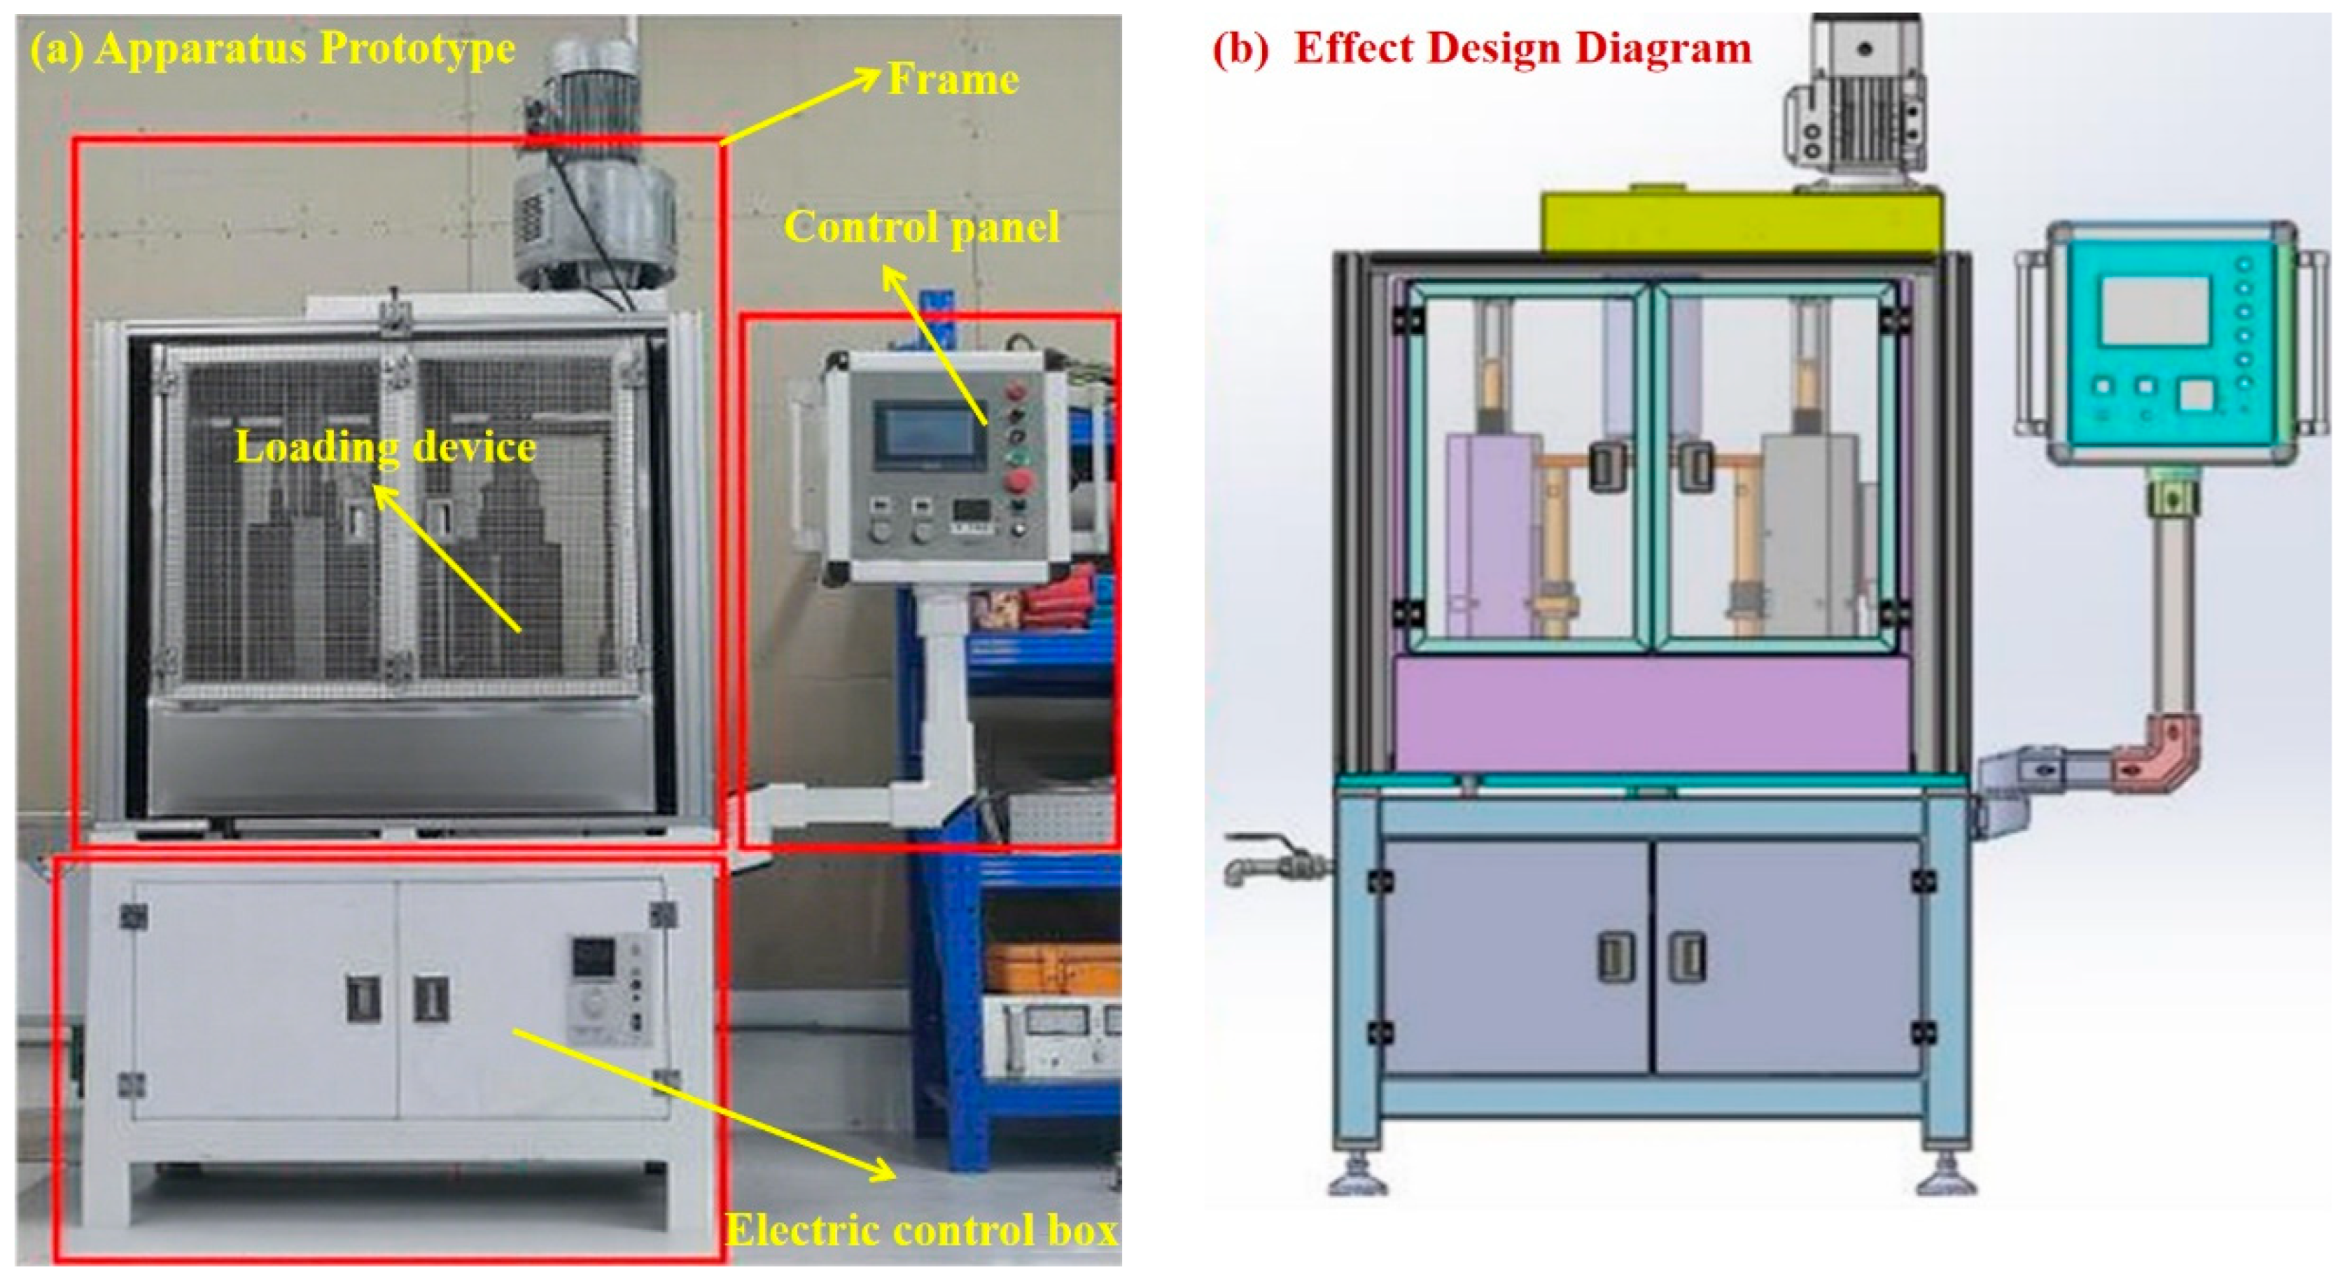
Figure 1. The apparatus prototype and effect design diagram [33].
Lubricants 13 00375 g001
Figure 2. Circular specimen size.
Lubricants 13 00375 g002
Figure 3. Specimen fixation method.
Lubricants 13 00375 g003
Figure 4. Concrete surface grooves.
Lubricants 13 00375 g004
Figure 5. Concrete friction coefficient test.
Lubricants 13 00375 g005
Figure 6. Part of the 3D data image.
Lubricants 13 00375 g006
Figure 7. Research framework.
Lubricants 13 00375 g007
Figure 8. (a) Friction coefficient under different numbers of abrasion cycles. (b) Friction coefficient under different effective sand content.
Lubricants 13 00375 g008
Figure 9. (a) Friction coefficient under different numbers of abrasion cycles. (b) Friction coefficient under different stone powder content.
Lubricants 13 00375 g009
Figure 10. (a) Friction coefficient under different numbers of abrasion cycles. (b) Friction coefficient under different fine aggregate lithology.
Lubricants 13 00375 g010
Figure 11. The construct parameters of GS concrete with different effective sand content: (a) Ra, (b) Rq, (c) Rsk, and (d) Rku.
Lubricants 13 00375 g011
Figure 12. The construct parameters of GS concrete with different stone powders: (a) Ra, (b) Rq, (c) Rsk, (d) Rku, (e) 2w, (f) 4w, and (g) 6w.
Lubricants 13 00375 g012
Figure 13. The construct parameters of concrete with different fine aggregate lithology: (a) Ra, (b) Rq, (c) Rsk, and (d) Rku.
Lubricants 13 00375 g013
Figure 14. The surface wear morphology of GS concrete with different effective sand content: (ae) (S80)~(S100).
Lubricants 13 00375 g014
Figure 15. The surface wear morphology of GS concrete with different stone powder content: (ag) (J0)~(J15)).
Lubricants 13 00375 g015aLubricants 13 00375 g015b
Figure 16. The surface wear morphology of concrete with different fine aggregate lithology: (a) RS, (b) LS, and (c) GS.
Lubricants 13 00375 g016
Table 1. Proportioning design of concrete with varied effective sand content.
Specimen NumberContent of Various Materials (kg/m3)
WaterCementGravelAdjusted SandEffective SandWater Reducing AgentFly Ash
S80973429221315261.2938
S8599558
S9066591
S9533624
S1000657
Table 2. Proportioning design of concrete with varied stone powder content.
Specimen NumberContent of Various Materials (kg/m3)
WaterFly AshCementStone PowderMSGravelWater Reducing Agent
J0973834206579221.29
J333210
J532517
J731824
J931131
J1230141
J1529151
Table 3. Concrete mix ratios based on fine aggregate lithology.
Content of Various Materials (kg/m3)
Specimen NumberWaterFly AshCementSandGravelWater Reducing Agent
RS/LS/GS97383426579221.29
Table 4. Descriptive statistics of BPN and coefficient of friction values of concrete pavements.
Description of SampleBPNCoefficient of FrictionStandard Deviation of BPNCoefficient of Variation of BPNStandard Deviation of Coefficient of FrictionCoefficient of Variation of Coefficient of Friction
A1780.810.8291.08%0.014791.88%
760.78
760.77
770.79
A2770.790.8161.07%0.010541.36%
750.76
760.77
760.77
A3780.810.9571.24%0.011181.40%
780.8
770.79
760.78
A4750.770.8161.07%0.010541.36%
770.79
760.77
760.76
Table 5. Construction parameter calculation method.
IndicatorsCalculation FormulaNote
Arithmetic average value Ra R a = 1 n i = 1 n z i Z ¯ n is the number of sampling points on the surface;
Z ¯ is the average value of Z;
σ is the standard deviation of Z.
Cross-section standard deviation Rq R q = 1 n 1 i = 1 n z i Z ¯ 2
Skewness Rsk R s k = 1 σ 3 n i = 1 n z i Z ¯ 3
Kurtosis Rku R k u = 1 σ 4 n i = 1 n z i Z ¯ 4
Disclaimer/Publisher’s Note: The statements, opinions and data contained in all publications are solely those of the individual author(s) and contributor(s) and not of MDPI and/or the editor(s). MDPI and/or the editor(s) disclaim responsibility for any injury to people or property resulting from any ideas, methods, instructions or products referred to in the content.