Article

Using the Principle of Newton’s Rings to Monitor Oil Film Thickness in CNC Machine Tool Feed Systems

1
The Graduate Institute of Precision Manufacturing, National Chin-Yi University of Technology, Taichung City 411030, Taiwan
2
Department of Mechanical Engineering, National Chin-Yi University of Technology, Taichung City 411030, Taiwan
*
Author to whom correspondence should be addressed.
Lubricants 2025, 13(8), 371; https://doi.org/10.3390/lubricants13080371
Submission received: 1 July 2025 / Revised: 15 August 2025 / Accepted: 18 August 2025 / Published: 21 August 2025
(This article belongs to the Special Issue Recent Advances in Tribological Properties of Machine Tools)

Abstract

The lubrication state of the feed system of a CNC machine tool will affect its positioning accuracy, repetition accuracy, and minimum movement amount. Insufficient or excessive lubrication will affect the accuracy. The primary objective of this study is to resolve issues related to the lubrication condition of the feed system, aiming to enhance its operational stability and accuracy. In this study, a measurement system based on images of Newton’s rings was developed. The relationship between the pattern of Newton’s rings and the oil film thickness was established based on the theoretical principle of Newton’s rings. Furthermore, fuzzy logic theory was applied to predict the oil film thickness. In the oil film thickness prediction model based on the radius of Newton’s rings, the average error is 6.5%. When the average feed rate increases by 2 m/min, the oil film thickness value decreases by 43%. Finally, the prediction model is compared with the results of an actual verification experiment. The trends in oil supply timing are consistent between the predicted and experimental results, and the relative error values are less than 10%. Therefore, this study solves the problem of insufficient or excessive oil supply in the feed system guideway, increasing the accuracy of CNC machine tools and contributing to green energy technology.

1. Introduction

The axial dynamic accuracy of machine tools depends on the guideway and ball-screw, and an effective lubrication system can ensure the tool’s accuracy and long life. Currently, the oil supply systems of CNC machine tools are controlled by PLC and Macro, resulting in insufficient or excessive lubrication. The guideway of the feed system cannot be supplied with oil and lubricated according to the actual conditions. Excessive lubrication will produce a hydrodynamic lubrication state and then produce viscous friction. Insufficient lubrication will produce a boundary lubrication state, leading to wear and frictional resistance. The main purpose of this study is to solve this problem by developing technology to ensure the appropriate lubrication state of the CNC machine tool feed system. The lubrication state of the slide guideway is monitored in the feed system. Monitoring is performed using both direct and indirect measurements. The direct measurement method uses a self-developed system based on images of Newton’s rings; a feed platform is installed and moves synchronously. The main components can be divided into the measurement mechanism, firmware, and software. The oil film thickness is measured using images of Newton’s rings captured with a CCD, and the accuracy reaches 0.002 mm. The indirect measurement method uses Hall current and torque sensing components through an MCU and an A/D card. In the firmware and sensing components, capacitors and electronic components are used for filtering. After A/D conversion, a Kalman filter is used for filtering, and a model is built. In terms of software, the signals and images from direct and indirect measurements are integrated, including images of Newton’s rings, current values, and the lubrication state. A fuzzy system is used for prediction, with the ultimate goal of achieving the optimal lubrication function. The oil film thickness and current are monitored: current monitoring primarily involves measuring the lubrication and friction status of the entire slide way, while oil film thickness monitoring primarily entails determining the condition of the oil film. The two parameters can be monitored synchronously in real time.
The uniformly distributed micro-textures are the same in the tribological model and the CFD simulation process. The depth ratio, width ratio, and velocity obtained by the two models can affect the friction coefficient, which can be reduced by choosing a reasonable structural geometry [1,2].
In a study on the prediction of the Stribeck curve in a hydrodynamic lubrication system, the results showed that the mean deviation of predicted hydrodynamic lubrication and surface roughness was 8%, so surface roughness could predict the relative friction coefficient [3,4]. Surface pits have a positive impact in reducing friction [5,6]. In order to measure the motor’s power consumption, scholars studied its correlation with the parts in the feed system, using two differential probes for measuring voltage and two current clamps for measuring current. The results showed that the ball-screw was the main component affecting power consumption, where a screw with a larger lead increased power consumption. The torque induced by the relative motion angular velocity was the main factor in power consumption [7,8,9,10].
Optical interferometry has been used to measure Newton’s rings. An LED was used as a light source with monochromatic light wavelengths of 490 nm, 590 nm, and 645 nm to observe the characteristics of the rings. The experimental results show that the thickness measurement error at different wavelengths is less than 5%, indicating that it is a very accurate method [11,12]. Contact resistance technology has been used to research the mixed lubrication condition, and the results show that the load has a significant impact on the experimental contact voltage behavior of rough surfaces, because a high load causes the temperature to rise at the contact point, reducing the viscosity of the lubricant, thereby reducing the oil film’s lubrication ability [13,14]. Experimental results show that three types of OLED can measure interference lengths of 3~10 um. The light source of the measurement equipment and system and the OLED’s spectrum and bandwidth are determined. An OLED with a wider EL spectrum can measure longer interference lengths, and this result can be used as a reference for modeling optical properties of OLEDs in the future [15,16]. The advantage of using ultrasound to measure the oil film thickness is its ability to measure it in media with multiple layers of materials and different densities [17].
In research on oil film measurement using a two-probe microscope, contact measurements can be employed. The radius of the front probe is 4.84 um, and the equipment can measure the lubrication performance of the oil film at a speed of 1~0.2 m/s. It is used to study oil films at the nanoscale. As the sliding speed increases, the lubrication curve of the lubricating oil follows the trend of the Stribeck curve [18]. The friction coefficient decreases and then increases. It is known that the lubrication mode changes from boundary lubrication to mixed lubrication, eventually reaching the fluid lubrication state [19,20,21].
A set of spheres and disks are used to obtain the contact pressure and oil film distribution. Contact pressure is predicted by solving the Reynolds equation. In terms of changes in plasticity, hardness changes at the local scale; tribofilm growth and mixed lubrication models are combined, and the degree of contact is changed while maintaining the mixed lubrication condition to evaluate the model’s ability to predict tribofilm growth. The results show that the average tribofilm thickness value increases with the SRR value (sliding/rolling ratio), and the lower the entrainment velocity, the lower the λ ratio, and the thicker the tribofilm. The changes in average friction thickness at different λ ratios can be seen, where the tribofilm growth rate decreases as the λ ratio increases [22,23].
The effect of the contact geometry on the fretting contact of a lubricant and the effect of fretting friction when using the lubricant were simulated, and the results were compared with experimental observations. Under lubrication conditions, after 100,000 fretting cycles (0.2 μm), the wear depth of the flat part was very small, while the wear scars under dry conditions were approximately 5.76 μm in depth and 1 mm in width, close to surface topography test results, where the width of the dent was about 1 mm and the maximum hole spacing depth under dry conditions was 6.6 μm [24]. Under lubrication conditions, the dents are very small, indicating that oil lubrication effectively reduces fretting wear and friction. The formation of the tribofilm was studied under perfect and insufficient lubrication conditions. In perfect lubrication, the presence of the adsorbed oil film dominated the tribological behavior of the tribofilm. After the running-in period, the textured and untextured surfaces reached similar friction coefficients.
The objectives of this study include (1) evaluating the effectiveness of lubrication status in feed systems, (2) comparing the influence of Newton’s rings and current measurement on oil film thickness and lubrication, and (3) investigating the effect of Newton’s rings on oil film thickness using fuzzy methodology prediction.

2. Principle and Methodology

In this study, a Newton’s ring measurement system was independently developed. The measurement mechanism is equipped with preload and parallelism control functions. The Newton’s rings were formed using imaging measurement and its underlying principles, and their relationship with oil film thickness was established. Fuzzy theory was then employed for prediction and analysis.

2.1. Principle of Feed System Lubrication

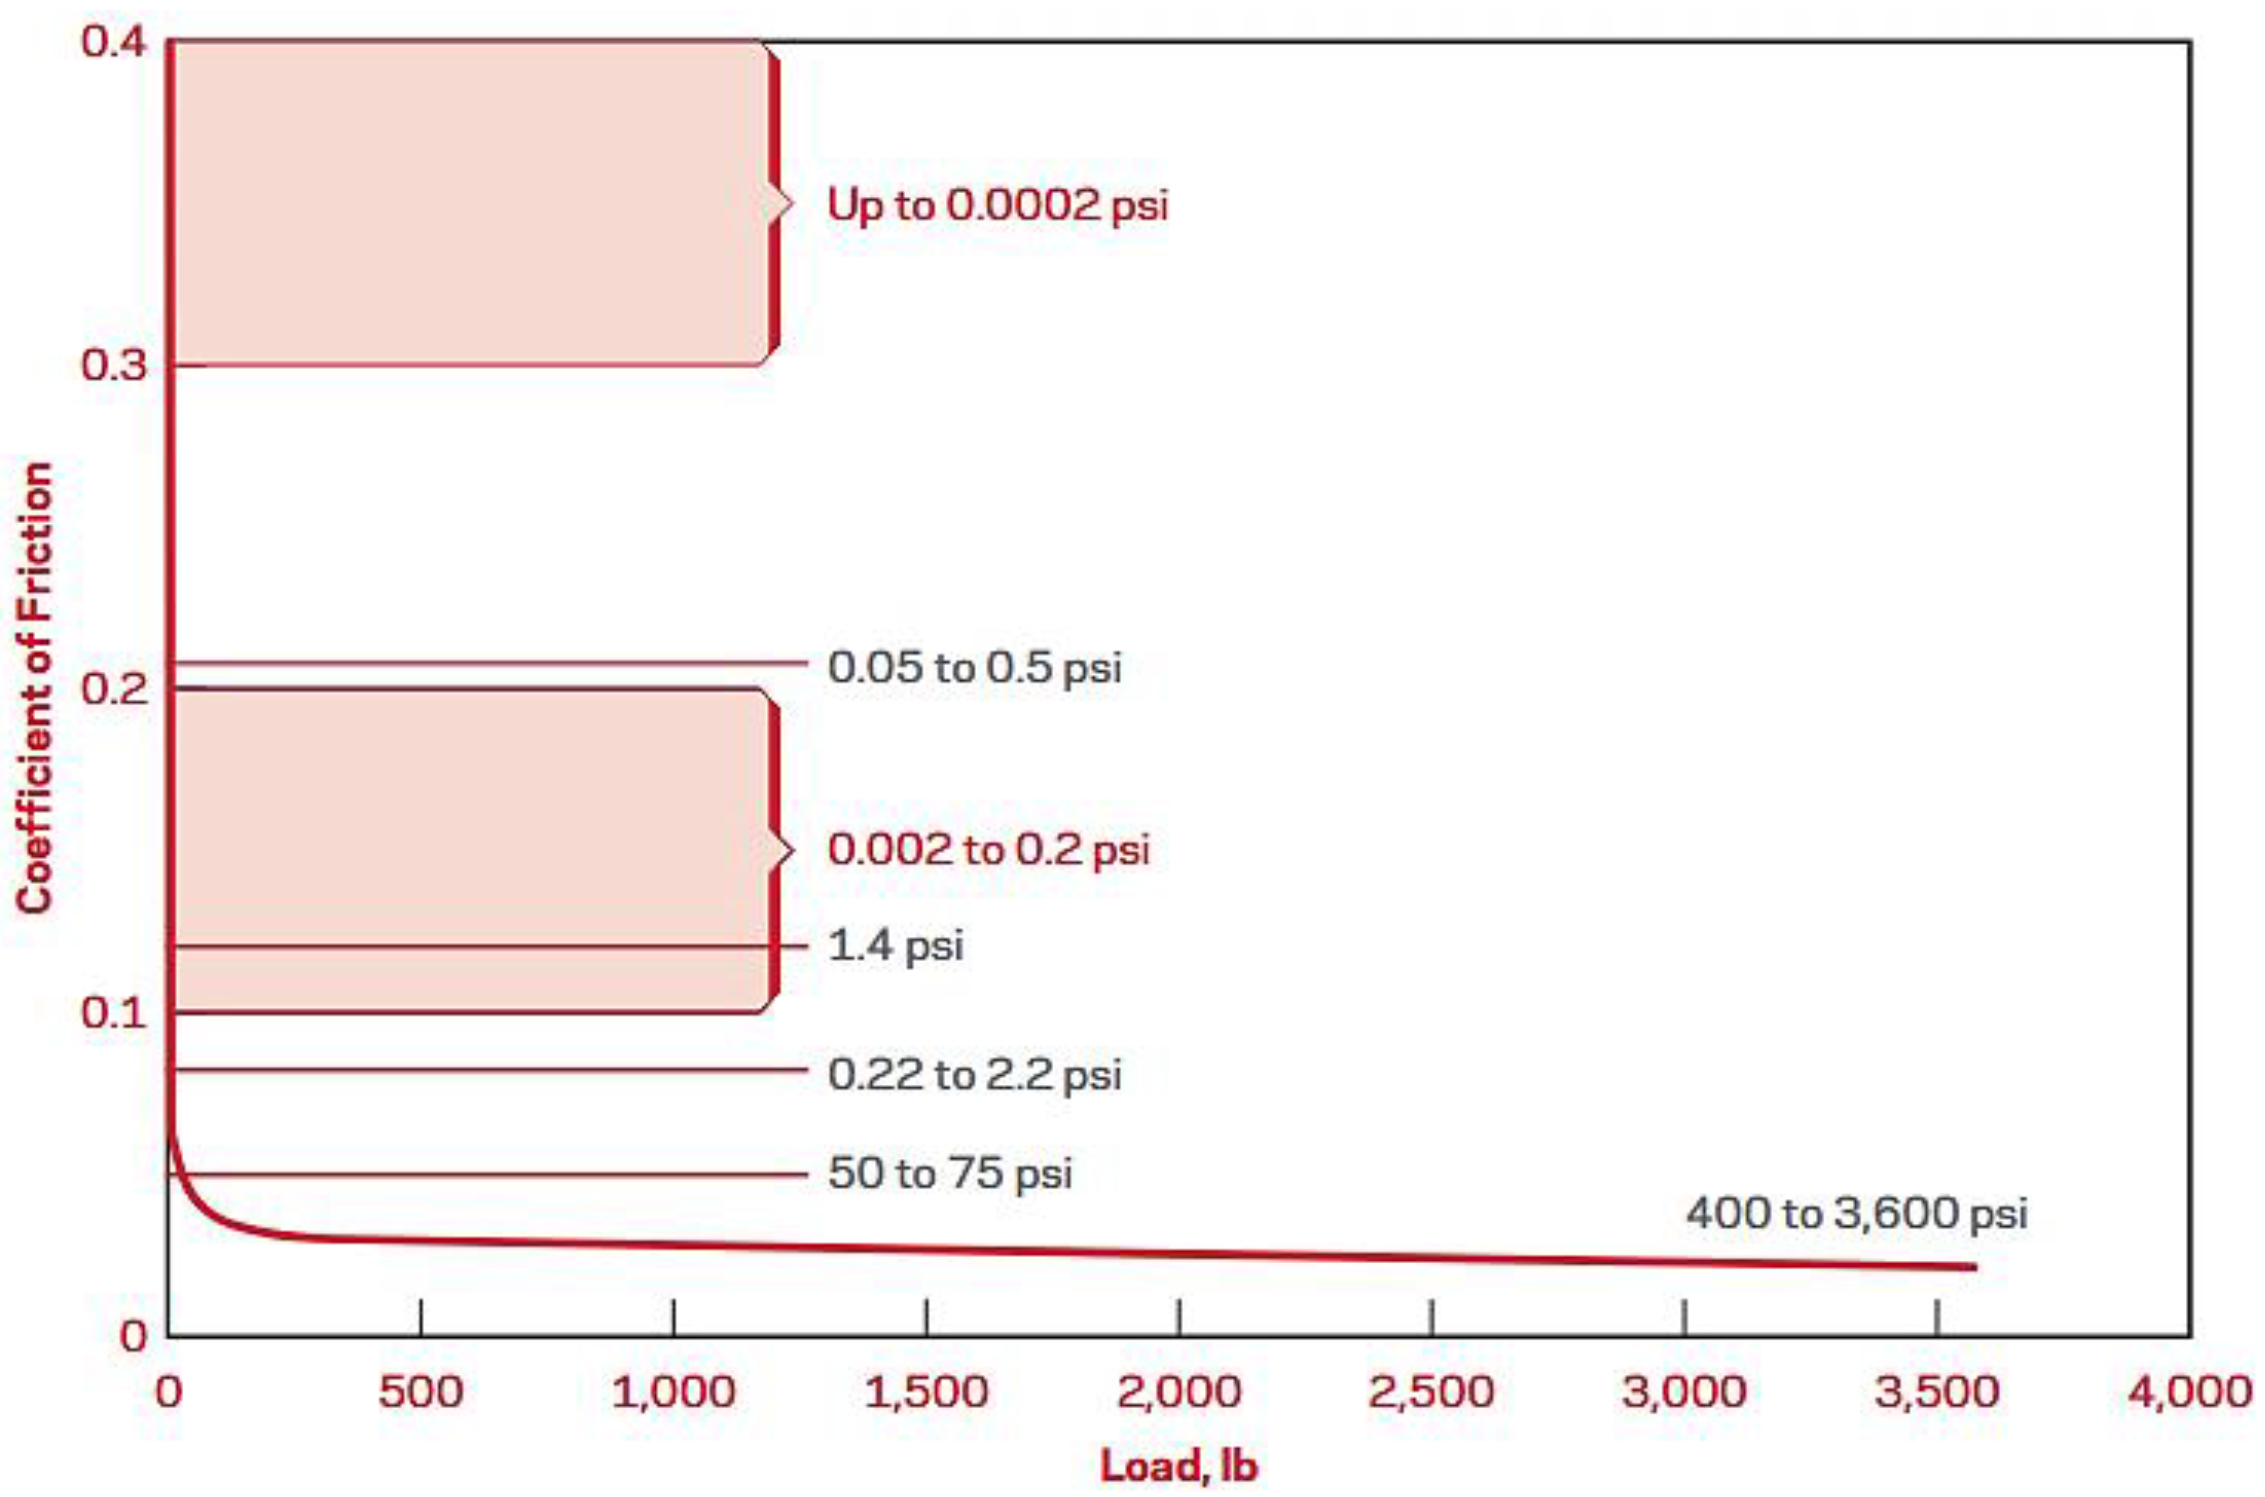
The CNC machine tool transmission and feed system mainly consists of lead screws, guideways, couplings, and motors. The guideways can be divided into sliding and rolling guideways. This study focuses on the lubrication state of the sliding guideway. The main fixed surface of the sliding guideway is made of FC20 or FC35 gray cast iron, which is processed by a milling machine, then hardened by high-frequency flame, and finally ground. The sliding surface is covered with Turcite-B material. Turcite-B is a synthetic resin made by mixing PTFE with chromium–copper–tin alloy; it is characterized by high strength, low deformation, and wear and corrosion resistance. Ultralow wear rates were retained as the interface temperature increased to 100 °C [25]. Accordingly, temperature was excluded as a variable in this study. The feed system architecture is shown in Figure 1 [26]. When a metallic material is coated with polytetrafluoroethylene (PTFE), an increase in force per unit area results in a relative decrease in friction, as shown in Figure 2 [27]. Consequently, higher current values are observed under no-load conditions. Therefore, no external load or cutting force was applied in this study.

2.2. Principle of Lubrication

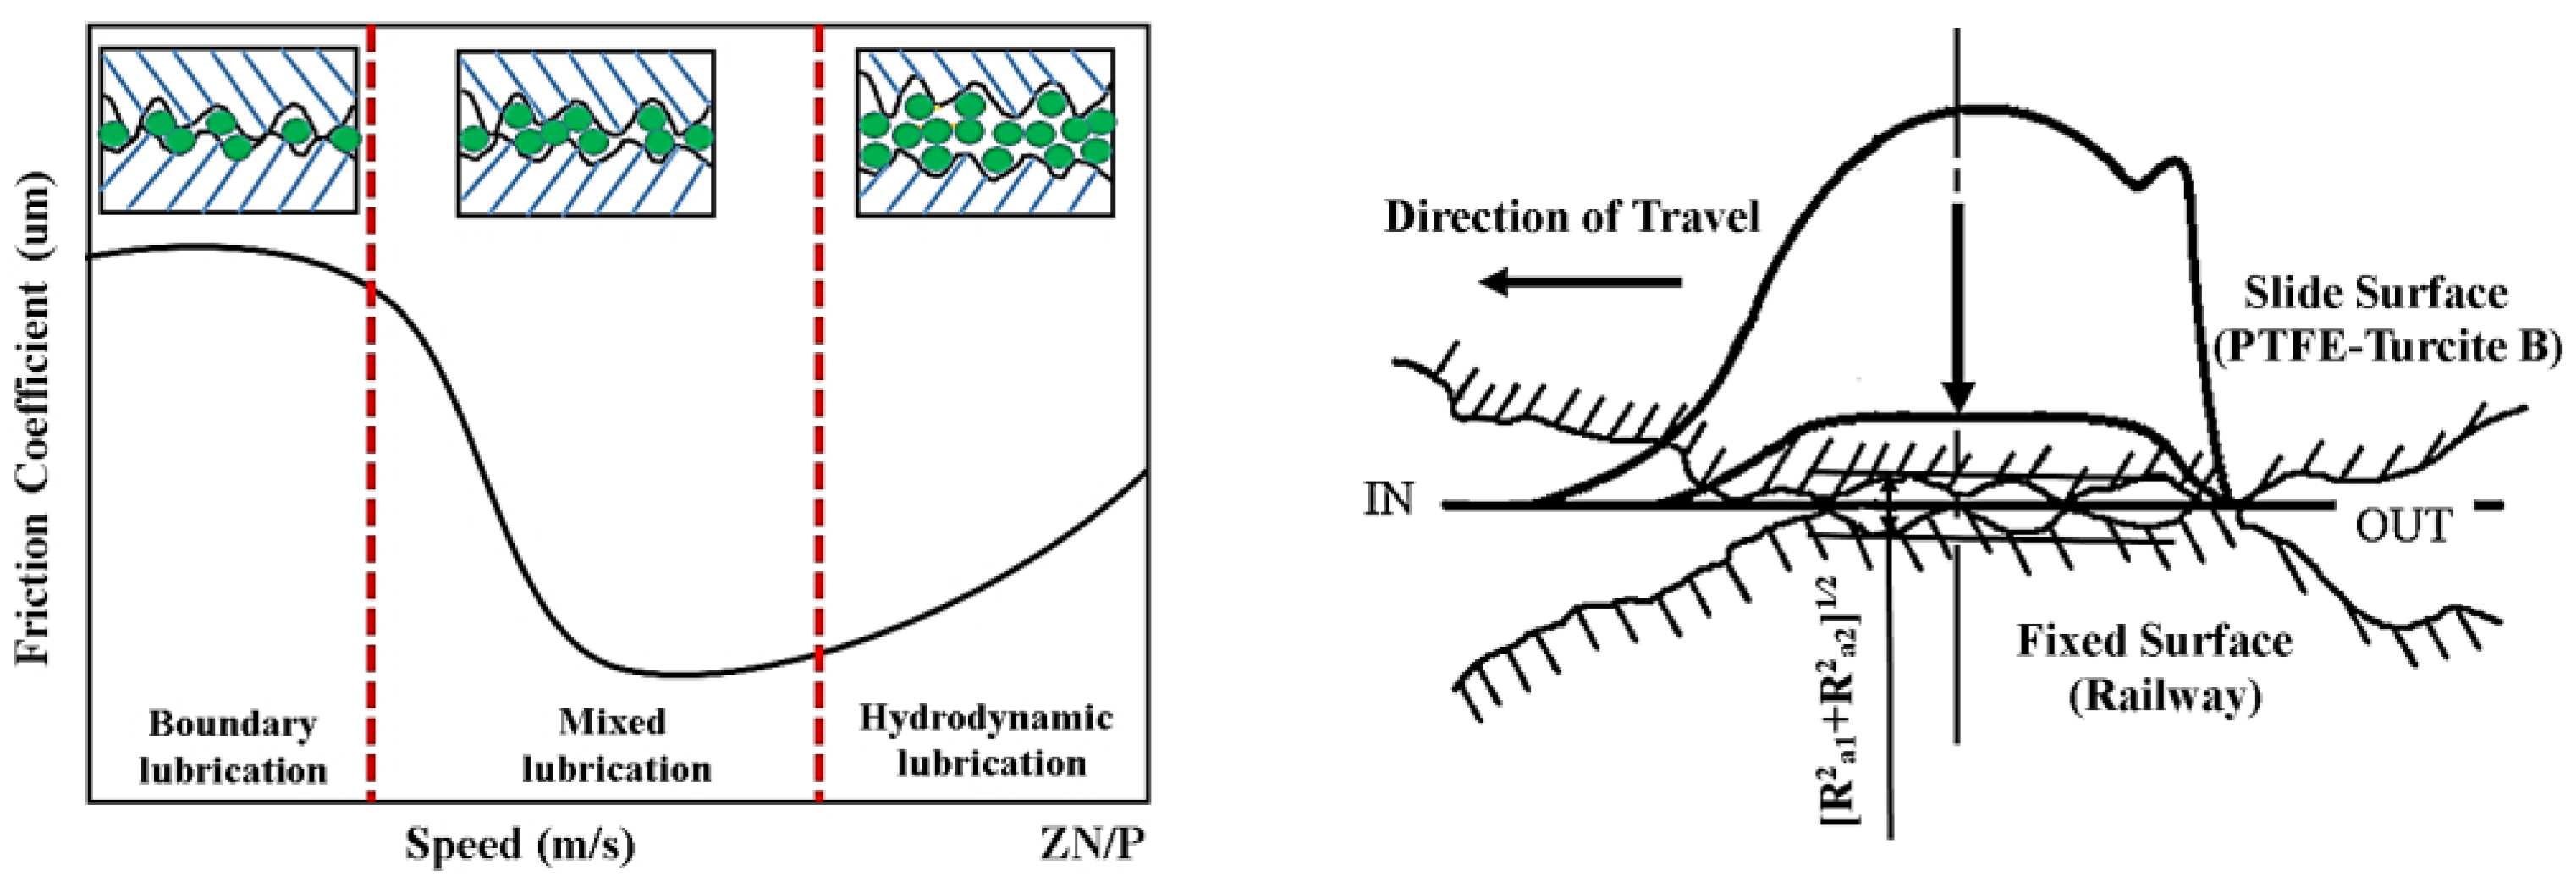
The sliding guideway of the feed system can be analyzed using the lubrication principle. It can be divided into three areas: boundary lubrication, mixed lubrication, and hydrodynamic lubrication, as shown in Figure 3. The lubrication state is characterized by the Stribeck lubrication curve, where the friction coefficient, which is a dimensionless term, is determined by the absolute viscosity of the lubricant, the feed speed, and the load per unit area. Excessive or insufficient lubricating oil will affect the accuracy and life of the feed system. The lubrication state can be classified as hydrodynamic, elasto-hydrodynamic, mixed, or boundary lubrication [28]. The lubrication model can be constructed using the ratio of oil film thickness to surface roughness, λ , corresponding to the Stribeck lubrication curve, expressed as follows:
λ = h 0 R ¯
The contact surface is R a 1 2 + R a 2 2 1 / 2 , that is, the sum of the roughnesses of two sliding surfaces, denoted by R a 1 and R a 2 . In the boundary lubrication zone, λ < 1 , there is almost no oil film between the two sliding surfaces. Sliding results in wear, reducing life and increasing the temperature of the sliding surface. In the mixed lubrication zone, 1 < λ < 5 , the two sliding surfaces have a few salient points in contact. In the hydrodynamic lubrication zone (HYD), 5 λ 100 , the oil film thickness is at least five times the roughness ratio of the two sliding surfaces.

2.3. Principle of Newton’s Rings

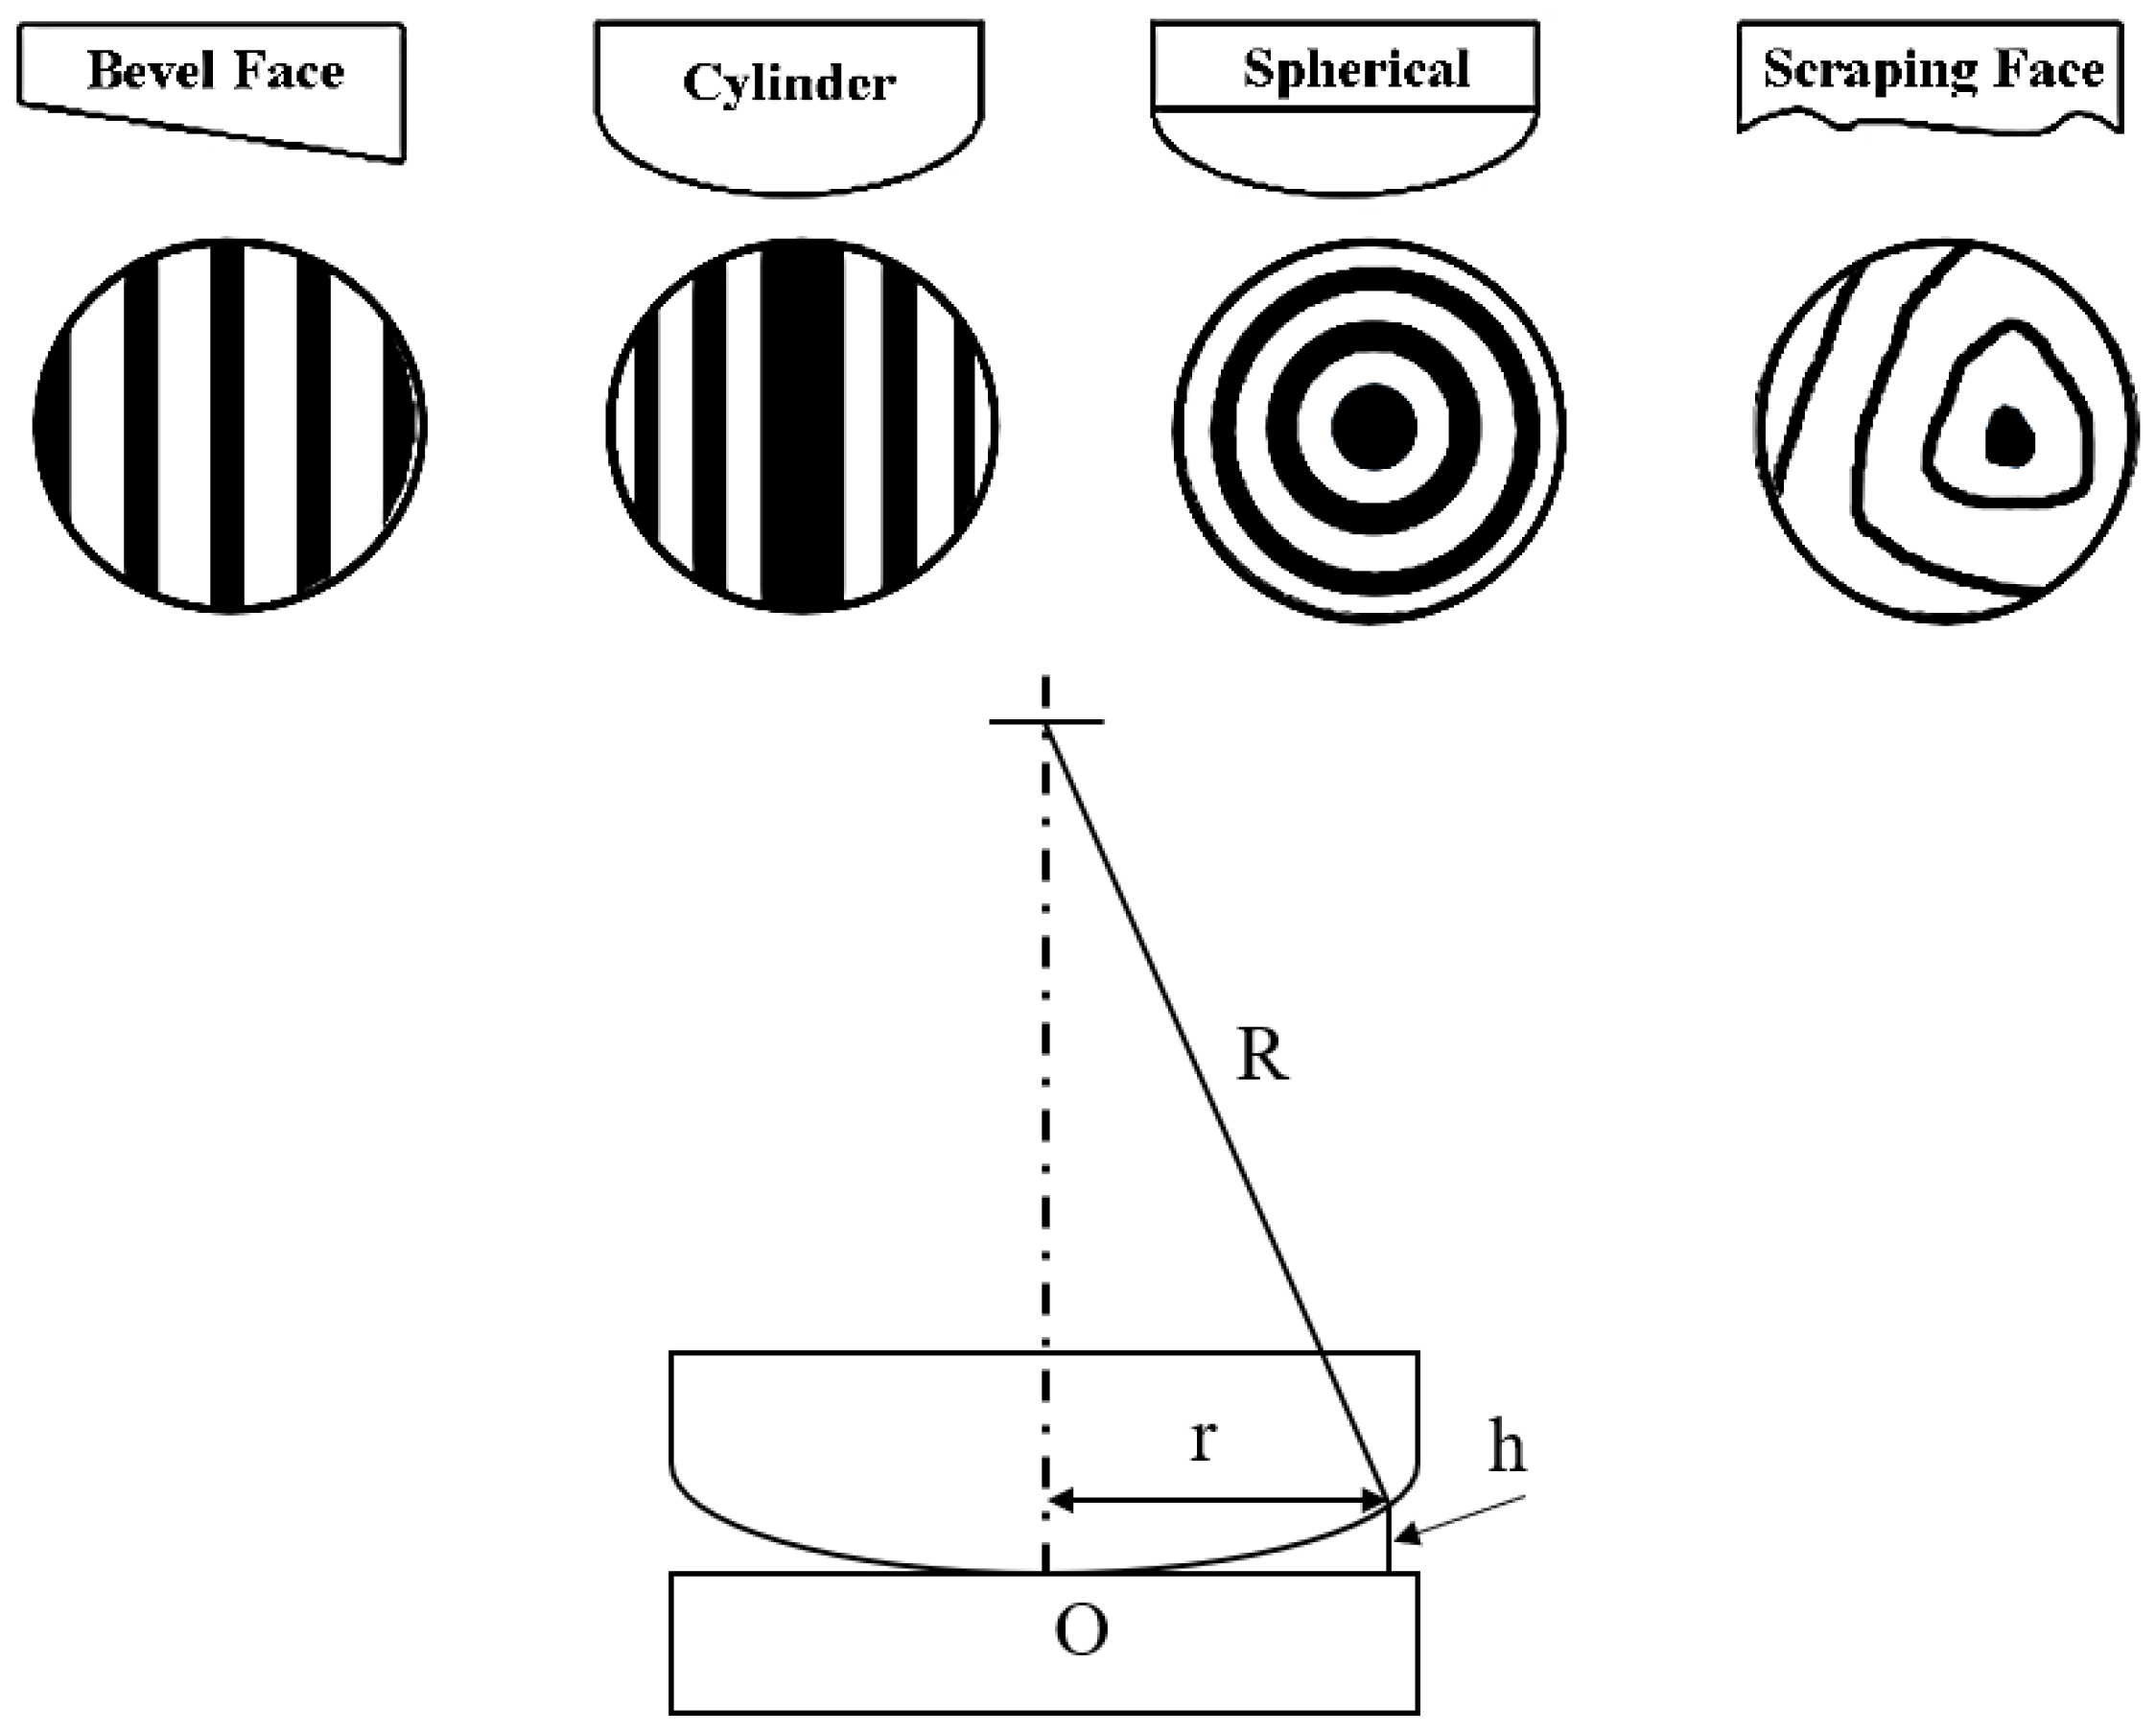
Newton’s rings are a phenomenon of equal-thickness film interference. A plano-convex lens with its convex surface facing down is placed on a flat lens, and the monochromatic light directly irradiates the plane of the convex lens. Alternating light and dark ring fringes are observable [29,30]. If white light is used, rainbow-like colored ring fringes can be observed. Newton’s rings result from the interference of the light rays reflected by the lower convex surface of the plano-convex lens and the upper surface of the plane lens (i.e., the upper and lower surfaces of the air film between the two lenses), as shown in Figure 4 [31,32].
R 2 = ( R h ) 2 + r 2
When R >> h, the coefficient h2 can be omitted, and thus, h = r 2 2 R .
The difference in light reflected by the upper and lower edge faces of the air layer is Δ = λ 2 + 2 h .
The half-wave loss is Δ = r 2 R + λ 2 . The intensity distribution formula for Newton’s rings of light is
I = I 1 + I 2 + 2 I 1 I 2 cos 2 π λ Δ
The intensity distribution formula for Newton’s rings of reflected light is
I = I 2 + I 2 + 2 I 1 I 2 s i n π r 2 R λ

3. Experimental Equipment Development and Process

This study developed a device to measure Newton’s rings in real time and convert the measured Newton’s rings into oil film thickness. The Newton’s rings interferometer uses the characteristics of light to combine the light waves from two or more light sources with the same characteristics at a certain point in space. Because of the difference between phases, the light strengthens or weakens, which is called the interference phenomenon.

3.1. Newton’s Rings Image Measurement System

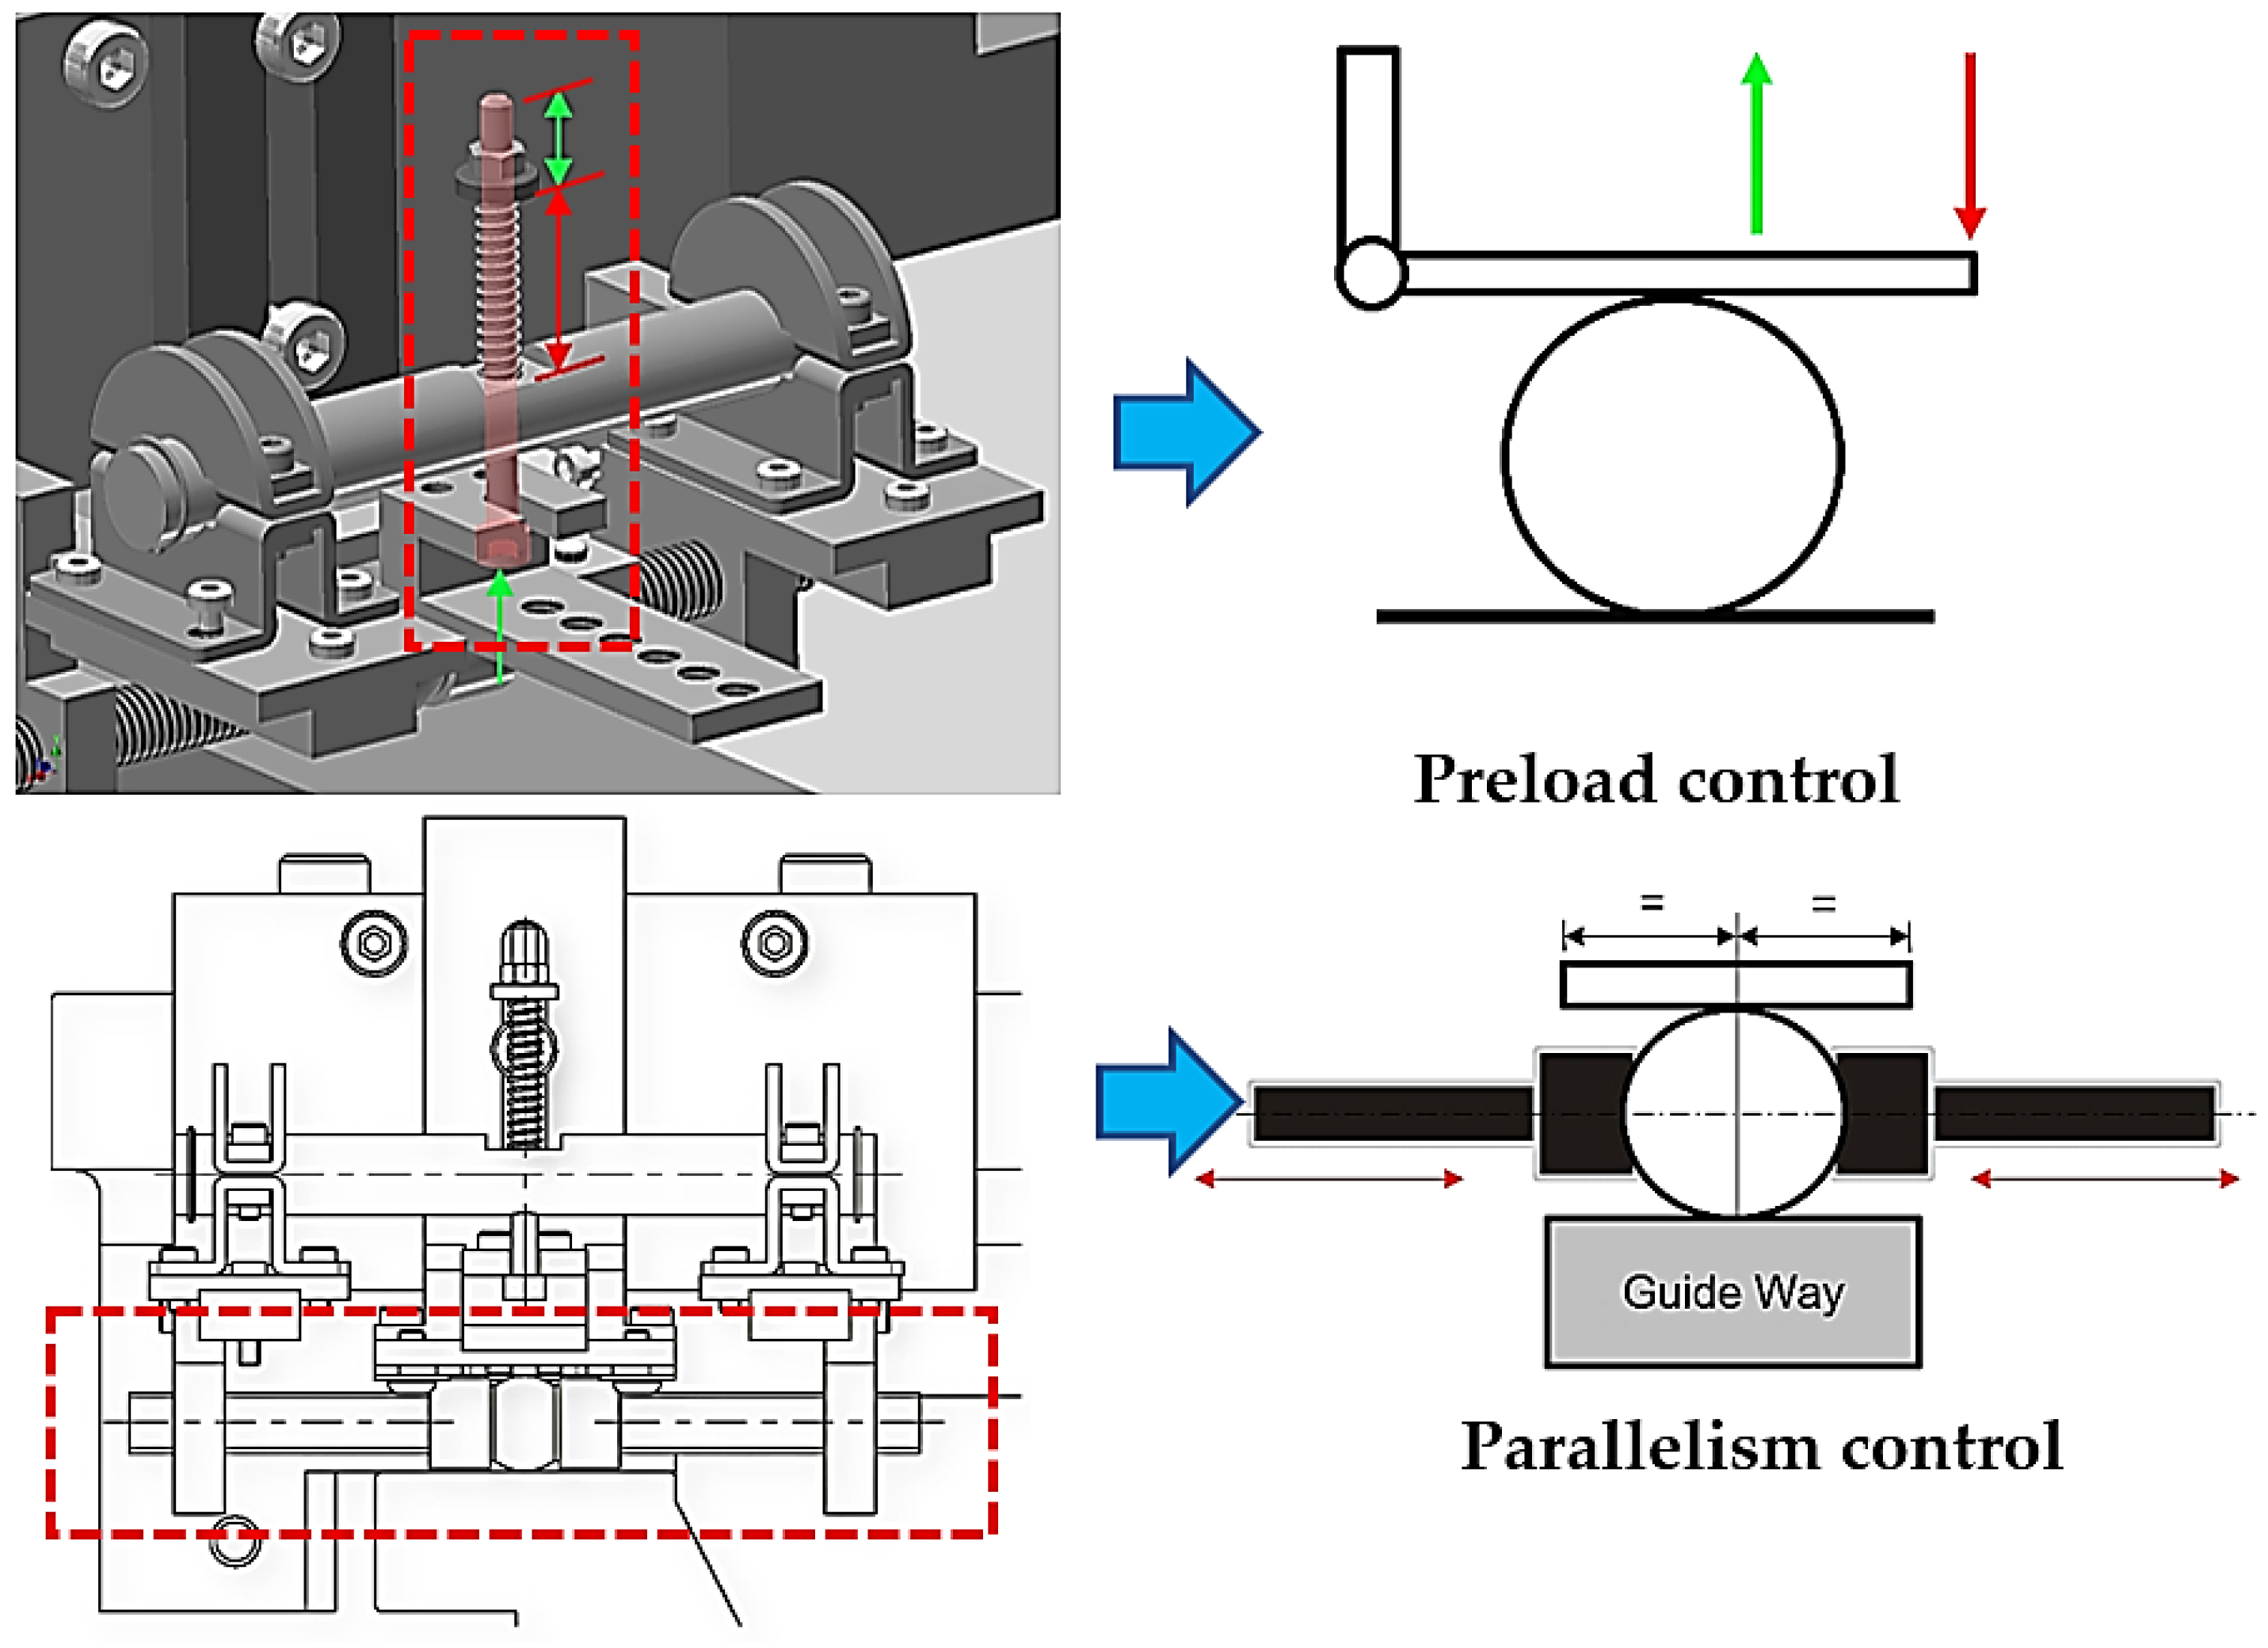
The oil film imaging device in the Newton’s rings image measurement system was self-developed for this study. The principle is to roll a steel ball on the sliding surface of the hard rail so as to bring the oil film from the rail plane to a glass plate, which is irradiated with coaxial light. The light penetrates the glass plate through the oil film to the steel ball; finally, the refracted light passes through the lens, and a Charge-Coupled Device (CCD) camera lens takes pictures of the oil film. The measurement mechanism has three functions: (1) constant pressure control, (2) parallelism control, (3) stability control. The wear of the sliding surfaces compromises the ability to maintain constant pressure and parallel alignment, thereby hindering the formation of Newton’s rings; the mechanism’s functions will be detailed below. In terms of mechanism design’s preload control, the rolling function of the ball is controlled; a compression spring is used to adjust the preload such that the lens contacts the steel ball. In terms of parallelism control in the mechanism design, the direction of the ball is controlled, and the positions of the bolts on both sides are adjusted to bring the steel ball to the center of the lens. The schematic diagram is shown in Figure 5.

3.2. Experimental Design and Method

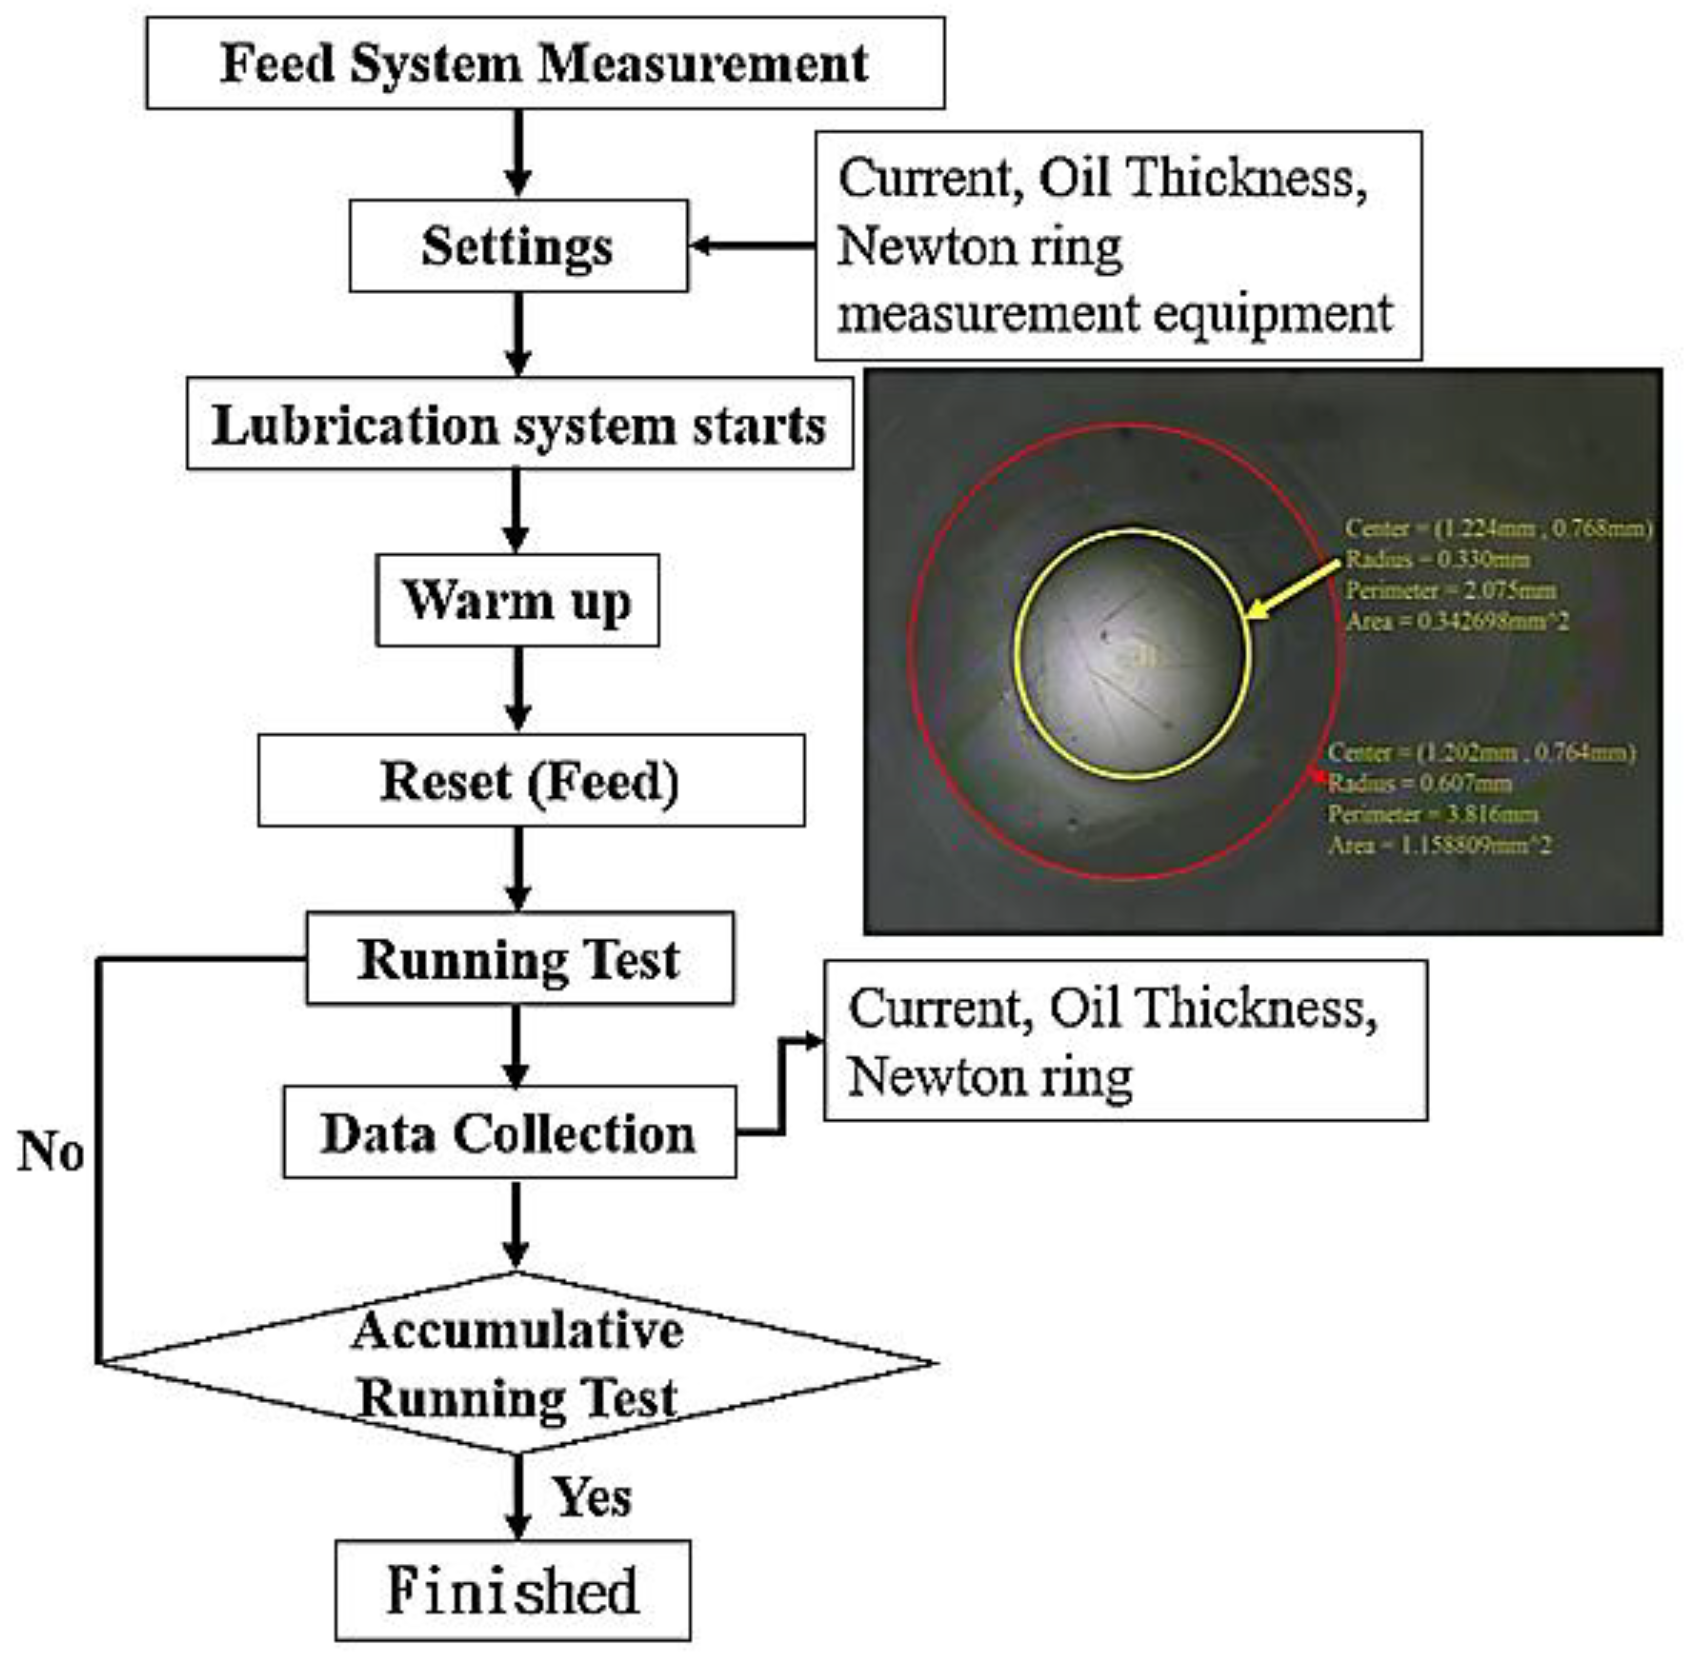
The feed rate for the experiment and measurement in this study is 4~8 m/min, and the measurement frequency is once every 15 min; the measurement data are the current values and the diameters of Newton’s rings. The actual setup of the device for capturing the Newton’s rings oil film image is shown in Figure 6. Currently, the industry uses ISO VG 68 for all slideway lubricants. This study used ISO VG 68 for experiments. The experimental process is as follows: equipment initialization → return of confocal laser displacement meter to zero in relative position and oil film image device positioning → oil supply for five seconds → feed system reciprocation operation → capture and collection of data such as current values, thickness values, and Newton’s rings images, and feed system reciprocation and data capture. The experiment is designed to use different rates and the same load, with two purposes: (1) obtain the overall oil film loss trend of the feed system and (2) establish the relationship between the oil film thickness and characteristics of the imaged Newton’s rings. In this study, the oil film thickness and current are monitored. Current monitoring primarily entails measuring the lubrication and friction status of the entire slide way, while oil film thickness monitoring primarily involves measuring the condition of the oil film. The two parameters can be monitored synchronously in real time. The experimental flow chart is shown in Figure 7.
The surface roughness of the planar rail of the feed system is 0.712 um, and that of the stage wear plate is 2.384 um. The four areas of the lubrication curve are boundary lubrication, mixed lubrication, elasto-hydrodynamic lubrication, and hydrodynamic lubrication. When the lubrication state of the feed system is in the mixed lubrication area, the friction coefficient value is the smallest. In the following, λ represents the ratio of the oil film thickness to the surface roughness. The two sliding surfaces are calculated as follows:
R ¯ = ( R a t r a c k ) 2 + R a T u r c i t e 2 1 / 2
= [(2.384)2  + (0.712)2]1/2 = 2.488 um
According to the above calculation results, R ¯ is 2.488 um, which is put in the mixed lubrication area to compare the oil film thickness. The calculation is as follows:
h 0 = λ × R ¯
λ = 1 ~ 3 , h 0 = 2.488 ~ 7.464   u m
h 0 / 2 = 1.244 ~ 3.732   u m
From the above calculation, it is concluded that the oil film thickness of 2.488~7.464 um places it in the mixed lubrication area, which is the optimal lubrication state of the feed system. The oil film measurement in this experiment is a single-rail measurement, so the oil film thickness in the single-rail mixed lubrication area is h 0 / 2 = 1.244 ~ 3.732   u m . Because the existing oil supply mechanism will change the lubrication state of the feed system to hydrodynamic lubrication, mixed lubrication will gradually be reached after a running-in period, so a mixed lubrication λ = 1 is selected; that is, the optimal oil film thickness, 1.244 um, maximizes the time that the feed system is in the mixed lubrication area [33].

4. Results and Discussion

In this study, the equipment was initialized before the feed system experiment began. The real-time operation of the system aimed at measuring the current, operating the confocal laser displacement meter, and capturing Newton’s rings oil film images. The relationships between different rates and the current, oil film thickness, and radius of Newton’s rings were analyzed. Afterwards, the oil supply timing and oil film thickness were predicted according to fuzzy theory and the relationship between the radius of Newton’s rings and the oil film thickness. Finally, relevant equations were established, and predictions were verified. The main indirect sensors for monitoring the feed system measure the current, and the direct sensors measure oil film thickness and the radius of Newton’s rings. Currently, there are no direct monitoring systems.

4.1. Effect of Different Feed Rates on Oil Film Thickness

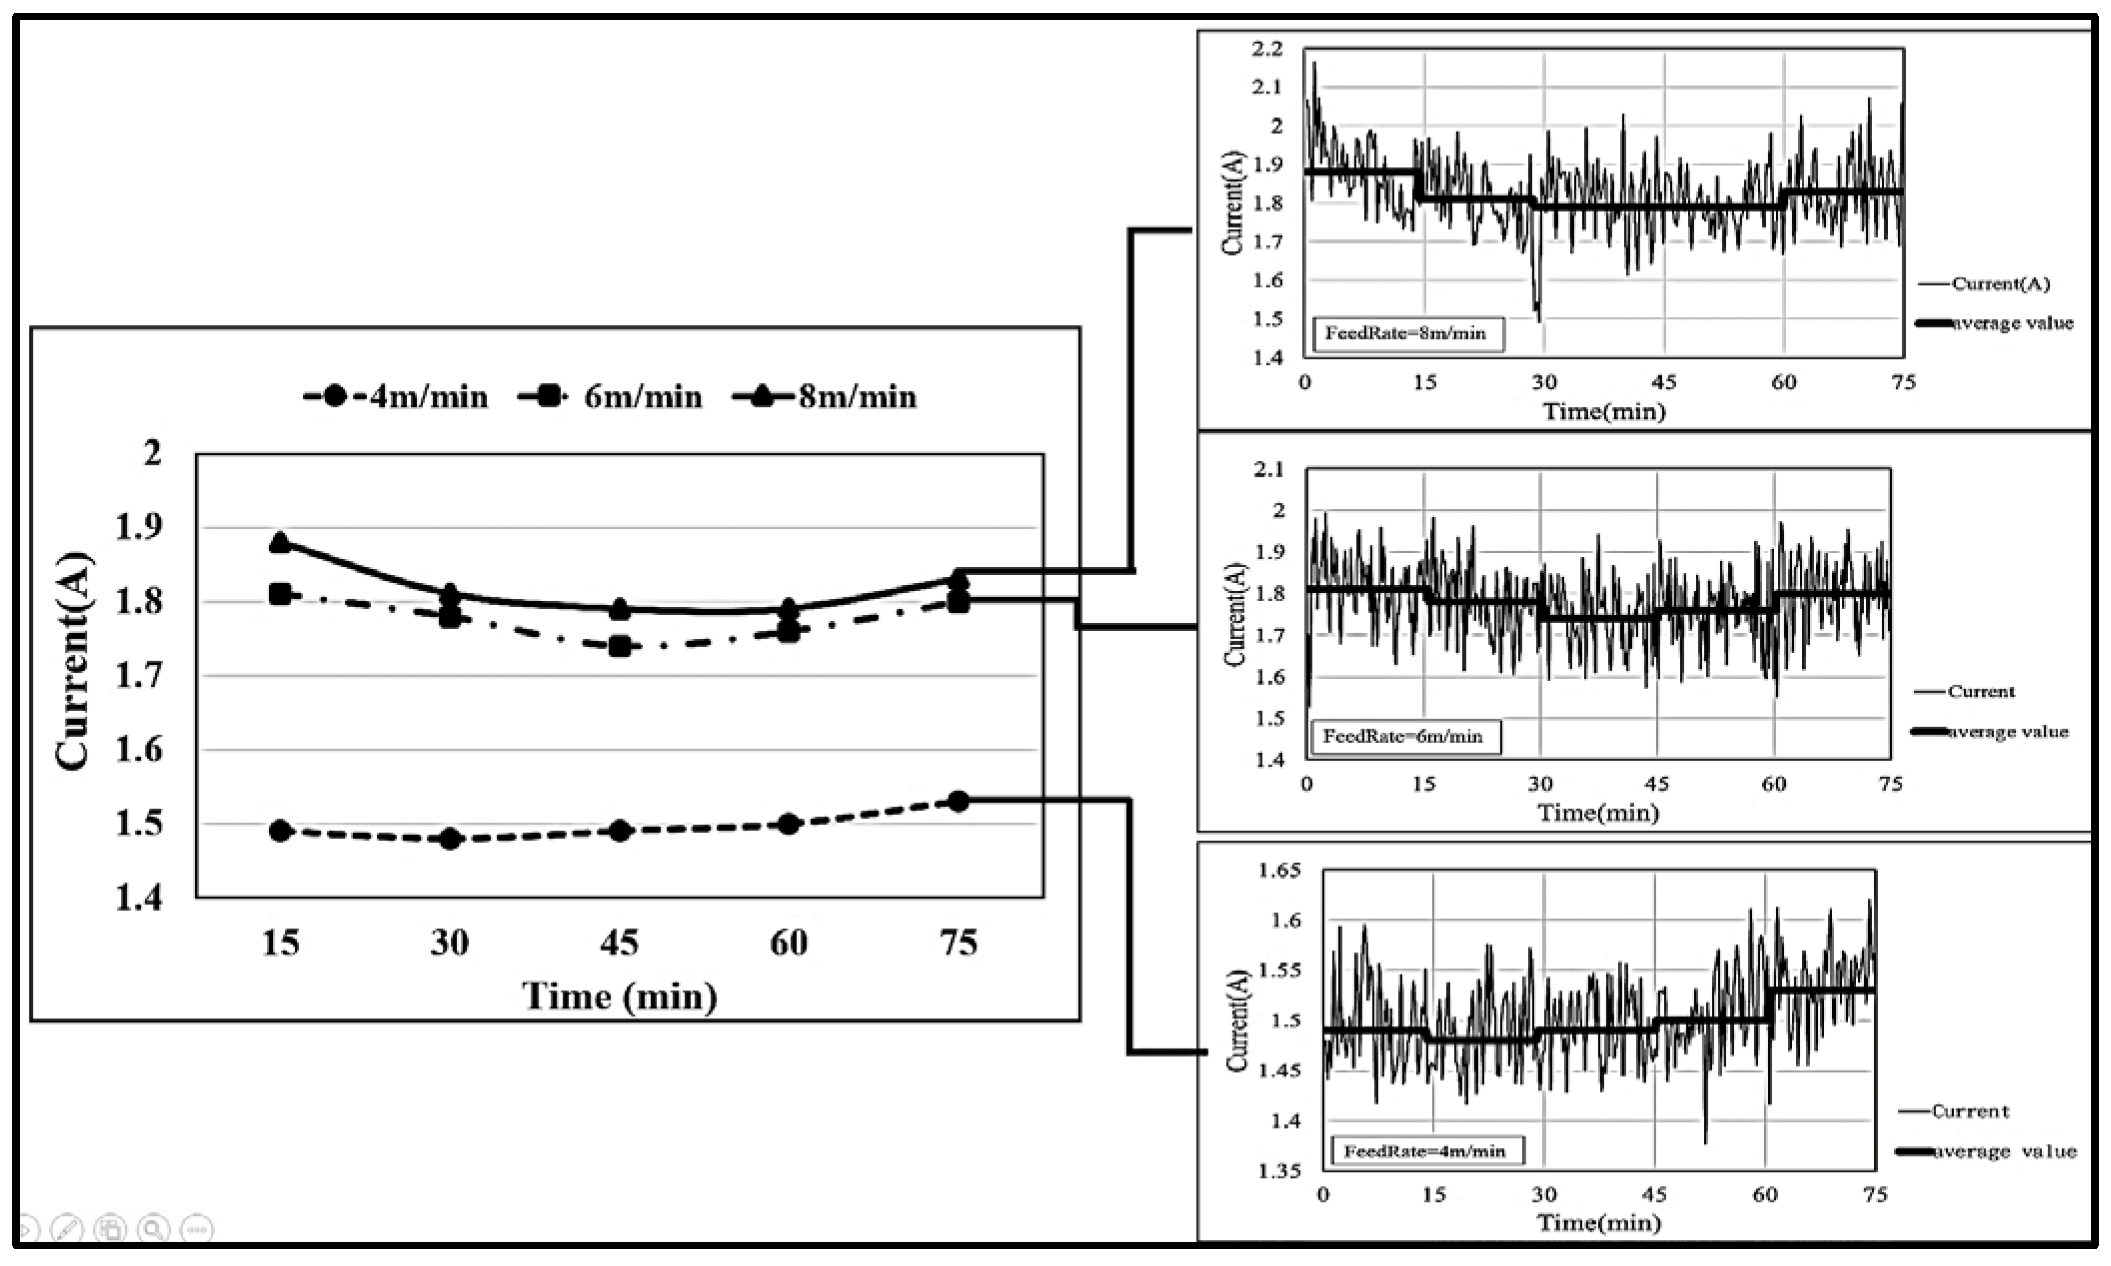
The oil film thickness varies with the running time, load, and temperature. According to the Stribeck lubrication curve formula, when the feed rate is fixed, the longer the running time, the smaller the oil film thickness, and the lubrication condition gradually changes from mixed lubrication to boundary lubrication. When the feed rate is increased, the oil film thickness decreases. The main reason for this change is that the feed rate is proportional to oil film consumption. As the feed rate increased from 4 m/min to 6 m/min, the oil film thickness decreased by 53%, while the current increased by 18%. With a further increase in the feed rate to 8 m/min, the oil film thickness decreased by 33%, and the current rose by 21%. For every 2 m/min increase in the average feed rate, the oil film thickness value decreased by 43%, as shown in Figure 8. In the mixed lubrication and boundary lubrication areas, the oil film thickness is proportional to the viscosity coefficient of the lubricating oil, and the smaller the feed rate, the smaller the current value, for two main reasons: (1) the smaller the feed rate, the lower the mechanical power, and the smaller the relative current value; (2) the feed rate is proportional to the viscosity coefficient of the lubricating oil. The test results are shown in Figure 9, expressed as follows:
F = η × A × N h
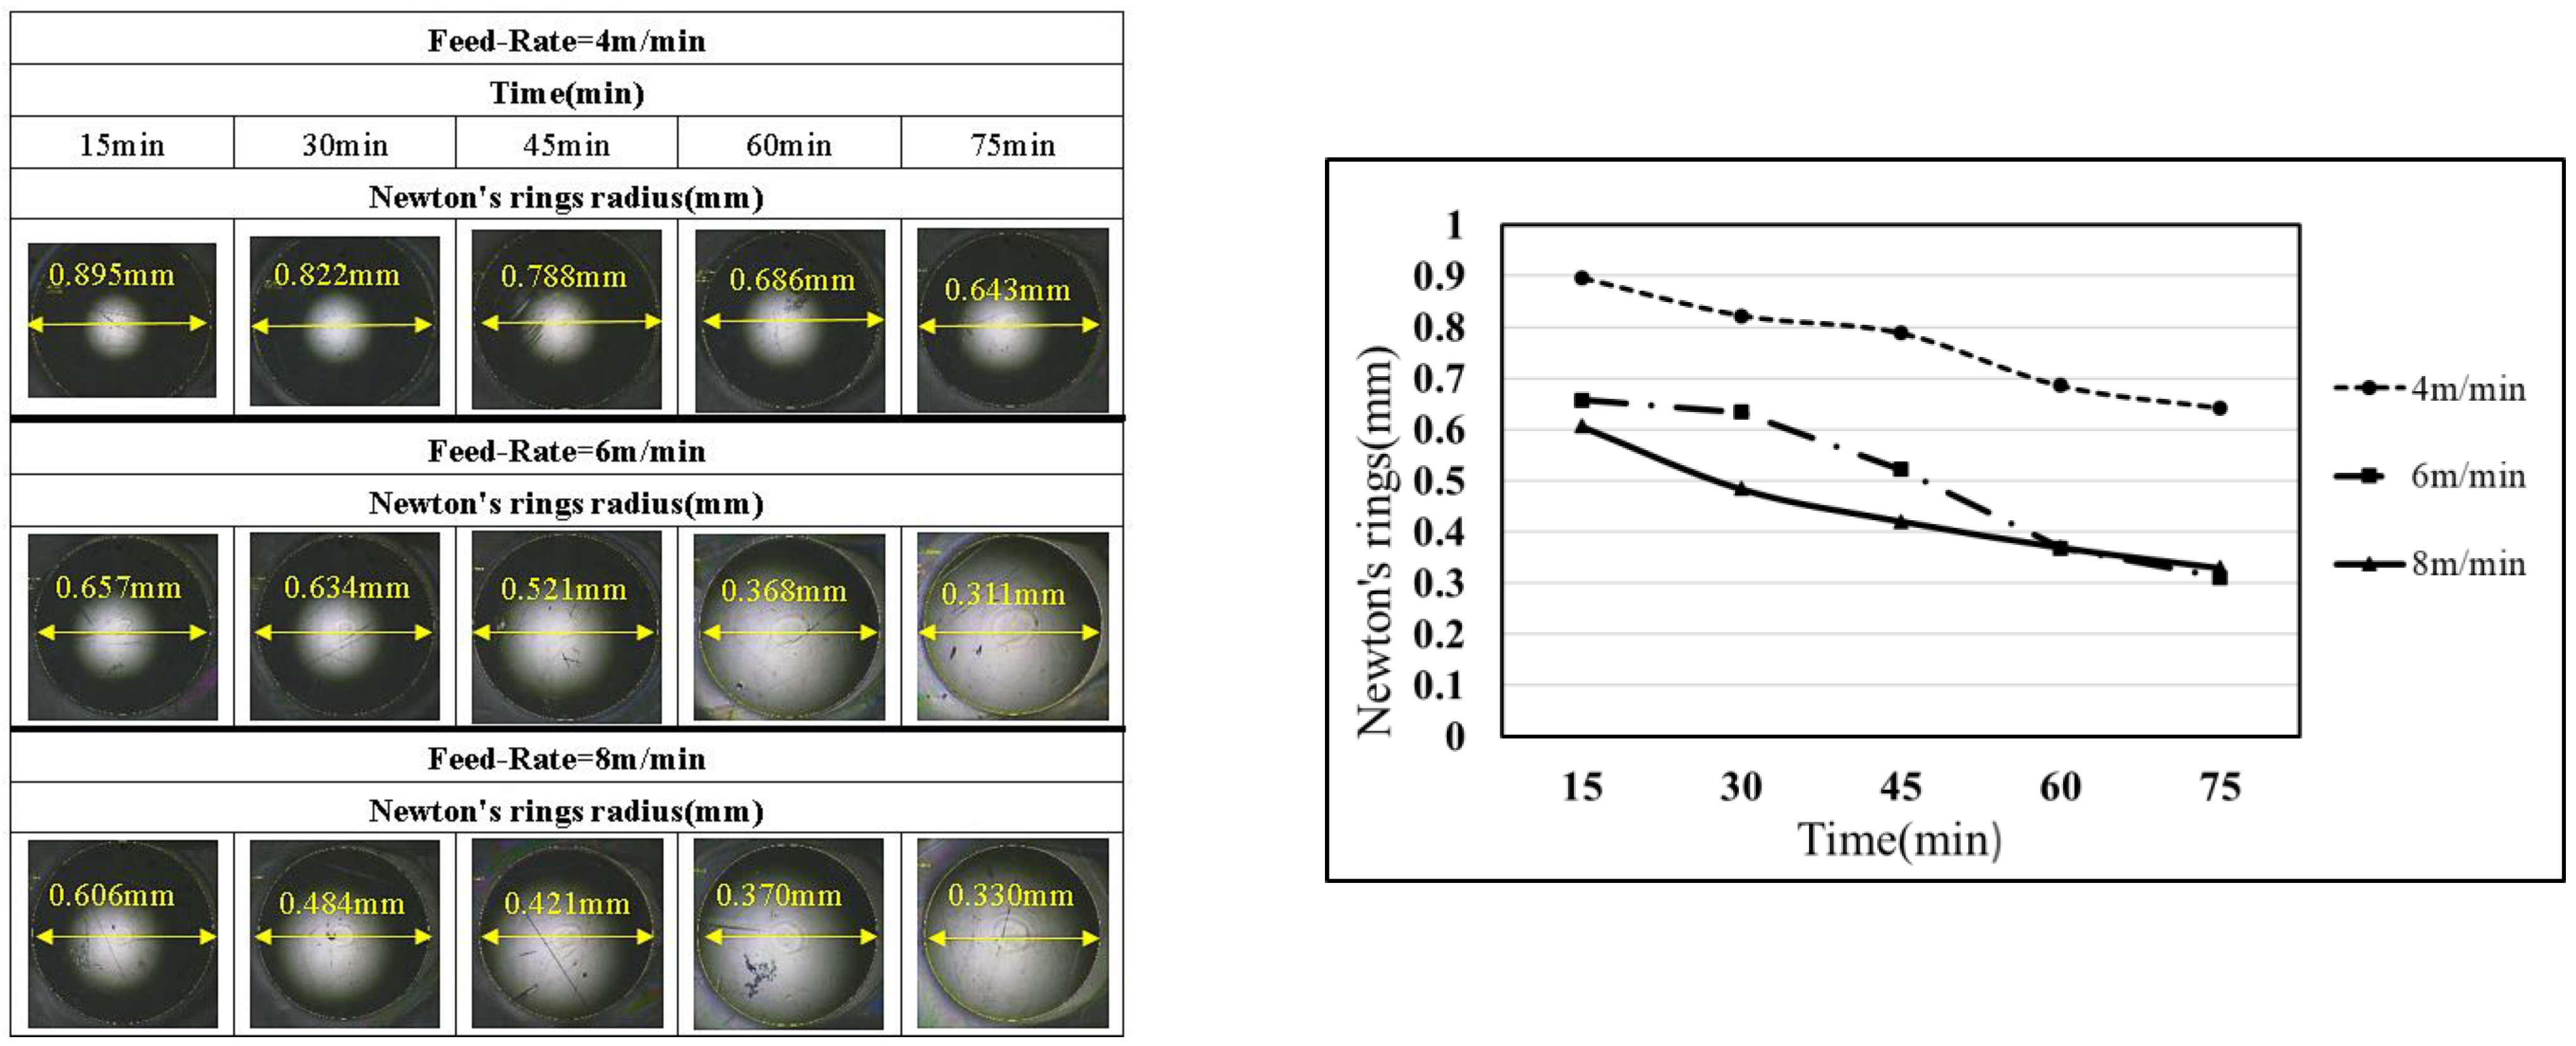
Since the radius size of the interference fringes of Newton’s rings is a direct influencing factor, the radius of Newton’s rings is proportional to the oil film thickness. The higher the feed rate of the feed system, the thinner the oil film, as shown in Figure 10. During a long-term operation, the radius of the interference fringes of Newton’s rings decreases, because the thinning of the oil film results in changes in the radius.

4.2. Relationship Between the Radius of Newton’s Rings and Oil Film Thickness

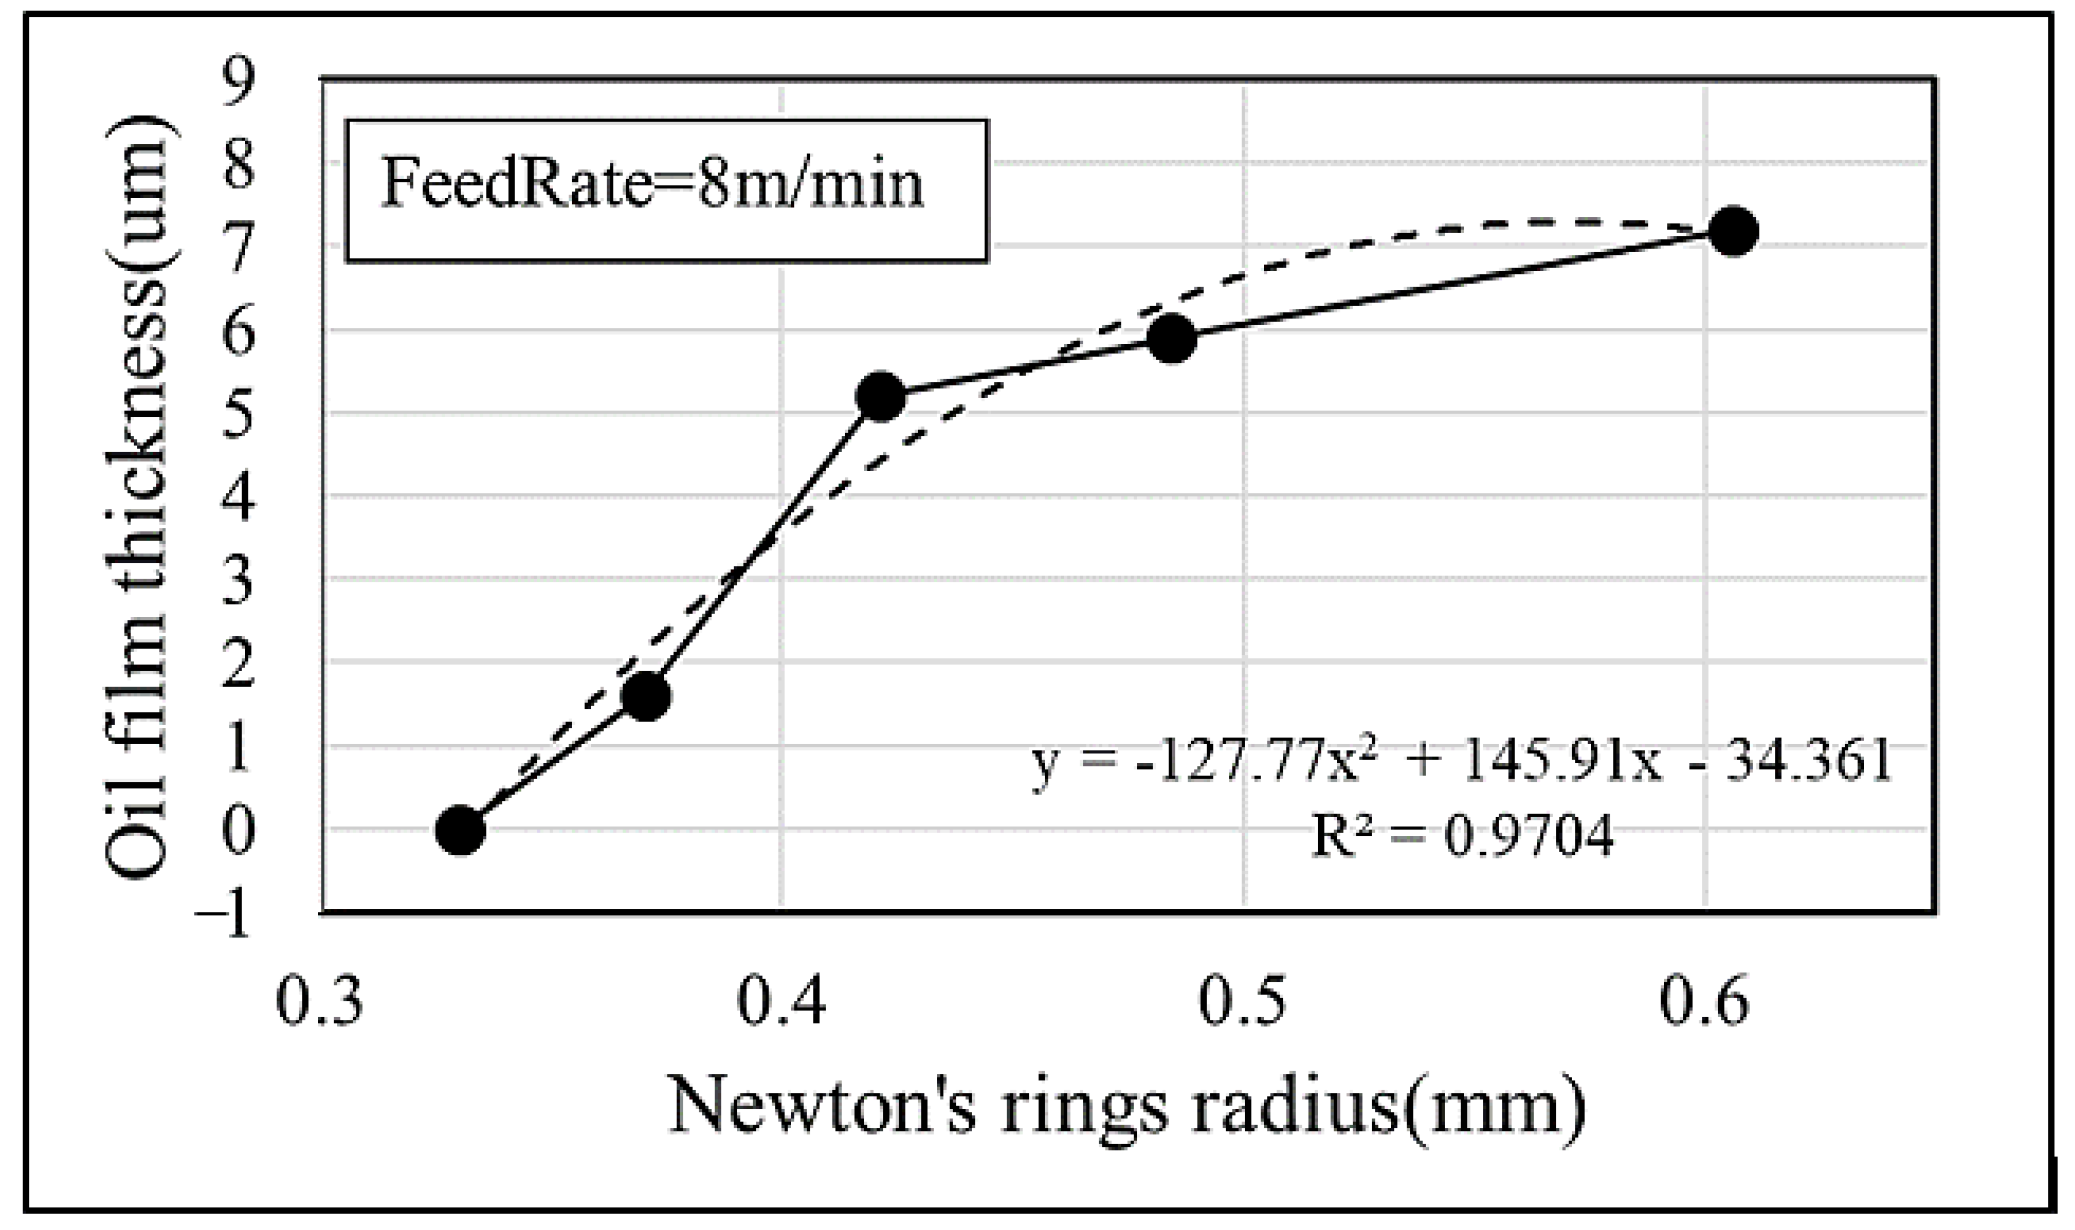
The oil film thickness can be measured using a laser displacement meter, with a resolution reaching 0.25 um. Therefore, fitting curves and prediction models are constructed for the oil film thickness and the radius of Newton’s rings. The fitting curves all show positive correlations under the condition of different feed rates, as shown in Figure 11 and Figure 12, where the dotted line is the fitting curve, and the linear regression model uses R 2 (coefficient of determination) to reflect the relationship between the two variables. In the verification relationship, R 2 is between 0.87 and 0.97; a value greater than 0.7 represents a high correlation. In addition, for the F-TEST shown in Table 1, the confidence interval is set to 95% (α = 0.05).
In the verification experiment, the radius of Newton’s rings is introduced into the polynomial linear regression model to verify the error value. With a fixed feed rate, the radius of Newton’s rings at any time is input, and the predicted value can be compared with the actual oil film thickness. The relative error (e) is used for the comparison of prediction results; the average error is 6.5%, as shown in Table 2.

4.3. Using Fuzzy Theory to Predict Oil Supply Timing and Oil Film Thickness

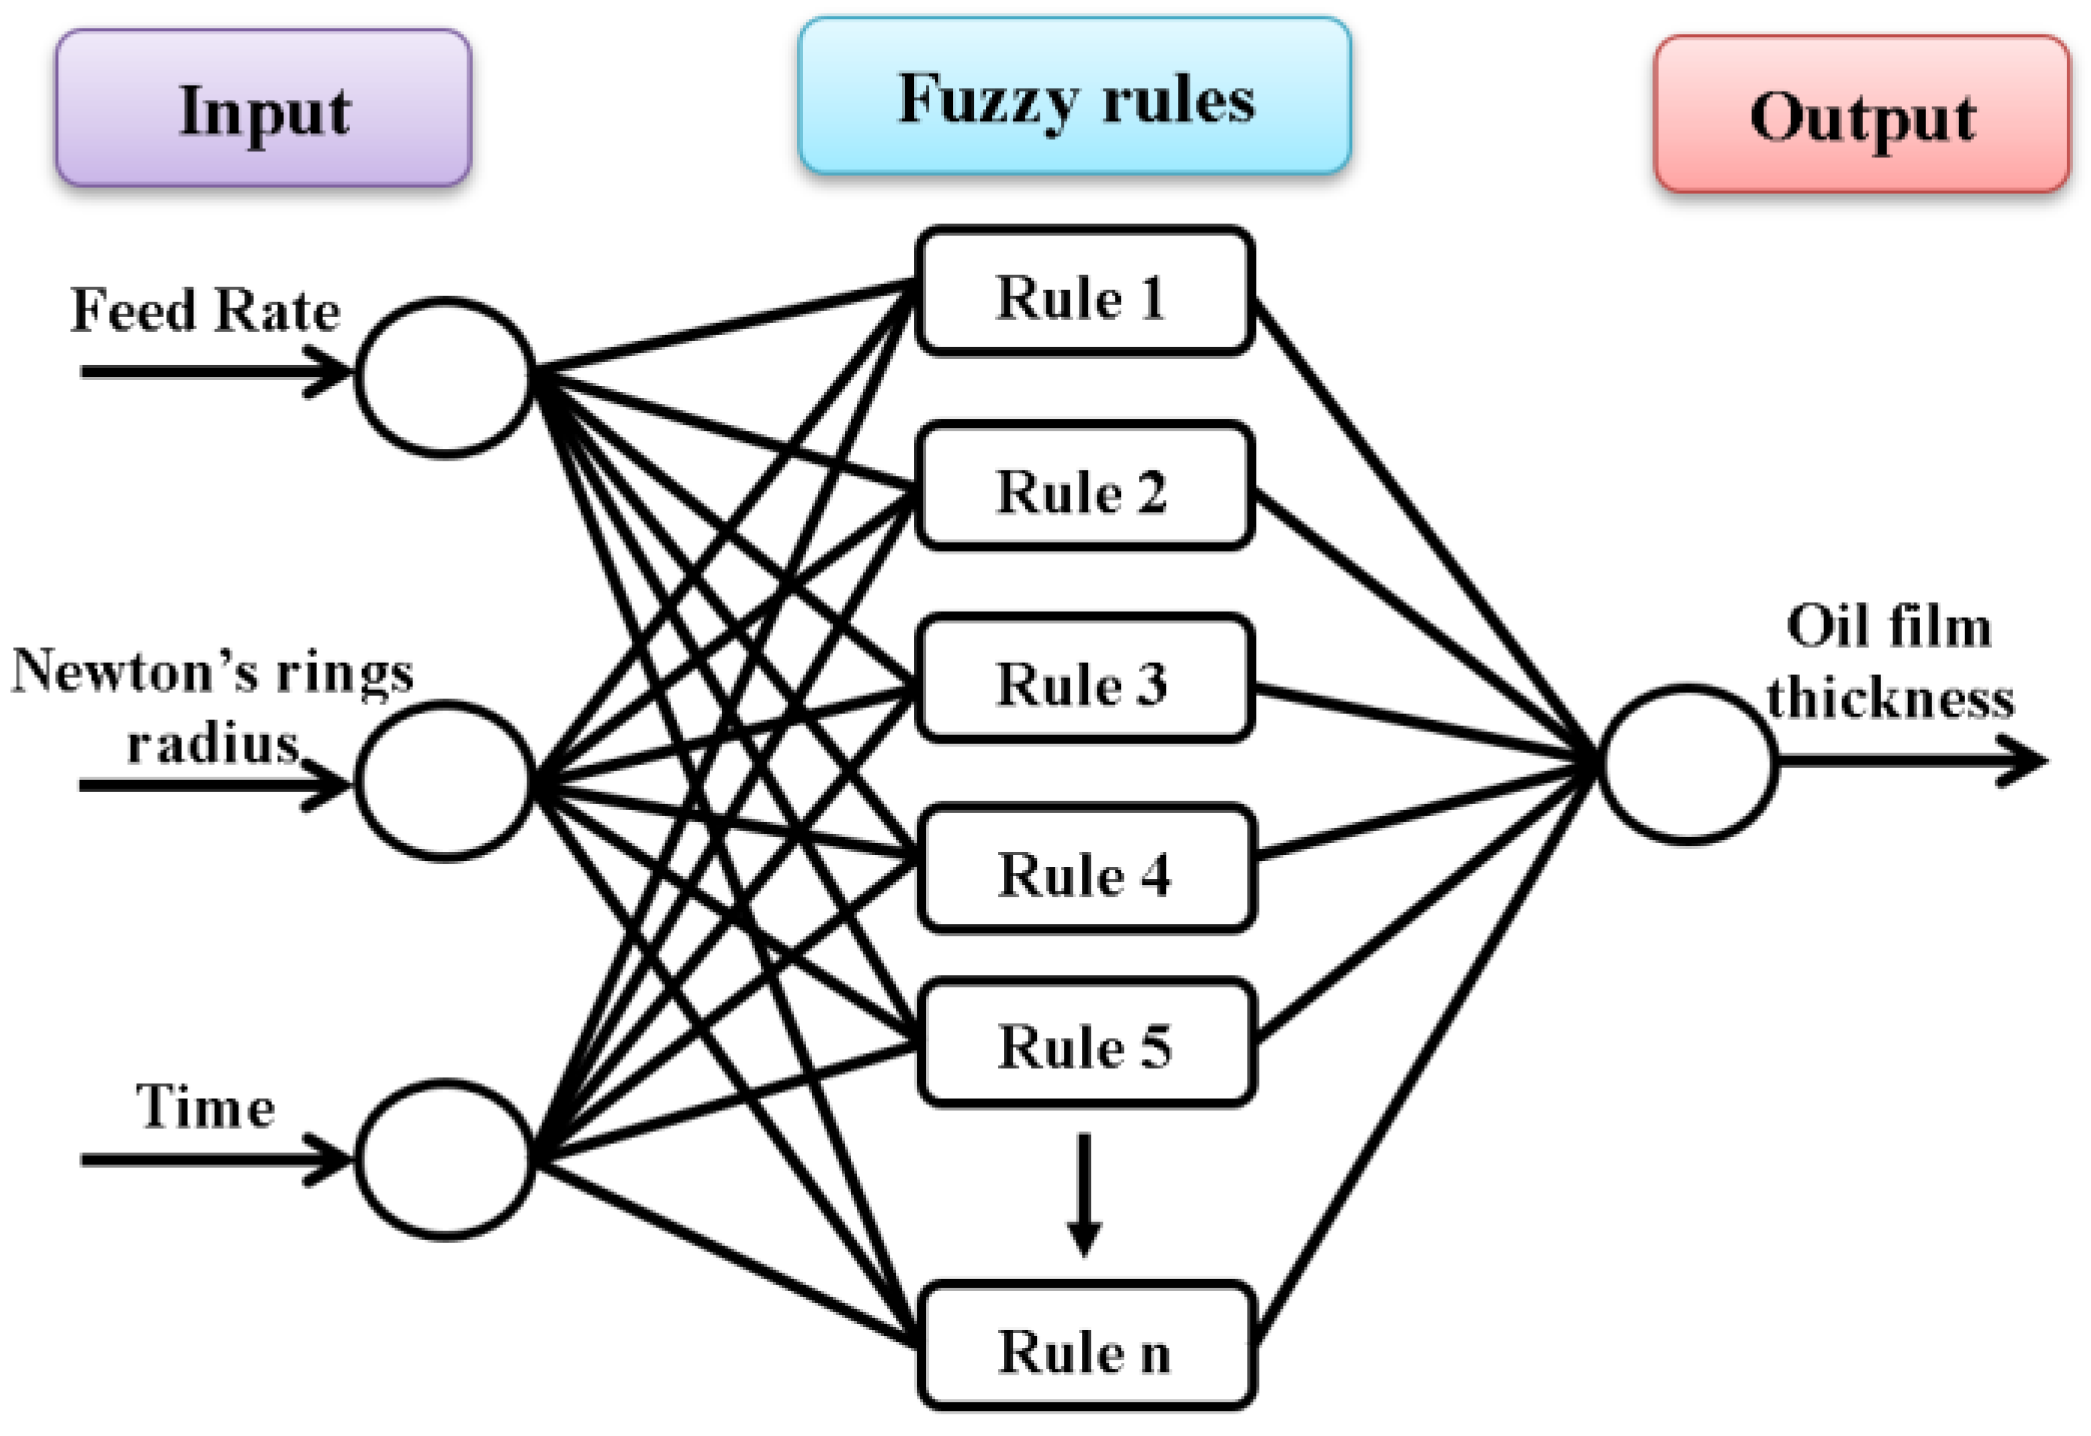
Different feed rates will result in different oil film thicknesses and Newton’s rings’ radii, so fuzzy theory is used for prediction. In this experiment, fuzzy theory is used with the feed rate, the radius of Newton’s rings, and the measurement time as inputs to predict the oil film thickness. The feed rate for the model is bounded by 4 m/min and 8 m/min. A feed rate of 6 m/min is used as data when training the model, and then feed rates of 5 m/min and 7 m/min are used to verify the prediction model, as shown in Figure 13.
In creating the Fuzzy Rule Base, the modeling data for fuzzy control consists of three input values corresponding to one output value, and the value range is bounded by the maximum and minimum values of the feed rate.
For the degree of membership of the oil supply time and oil film thickness changes at different feed rates, three membership functions are set for the feed rate, namely, small (low feed rate), medium (medium feed rate), and big (high feed rate). Since the boundaries are set as 4 m/min and 8 m/min, any feed rate below 4 m/min is a low feed rate, and a feed rate above 8 m/min is a high feed rate, as shown in Figure 14.
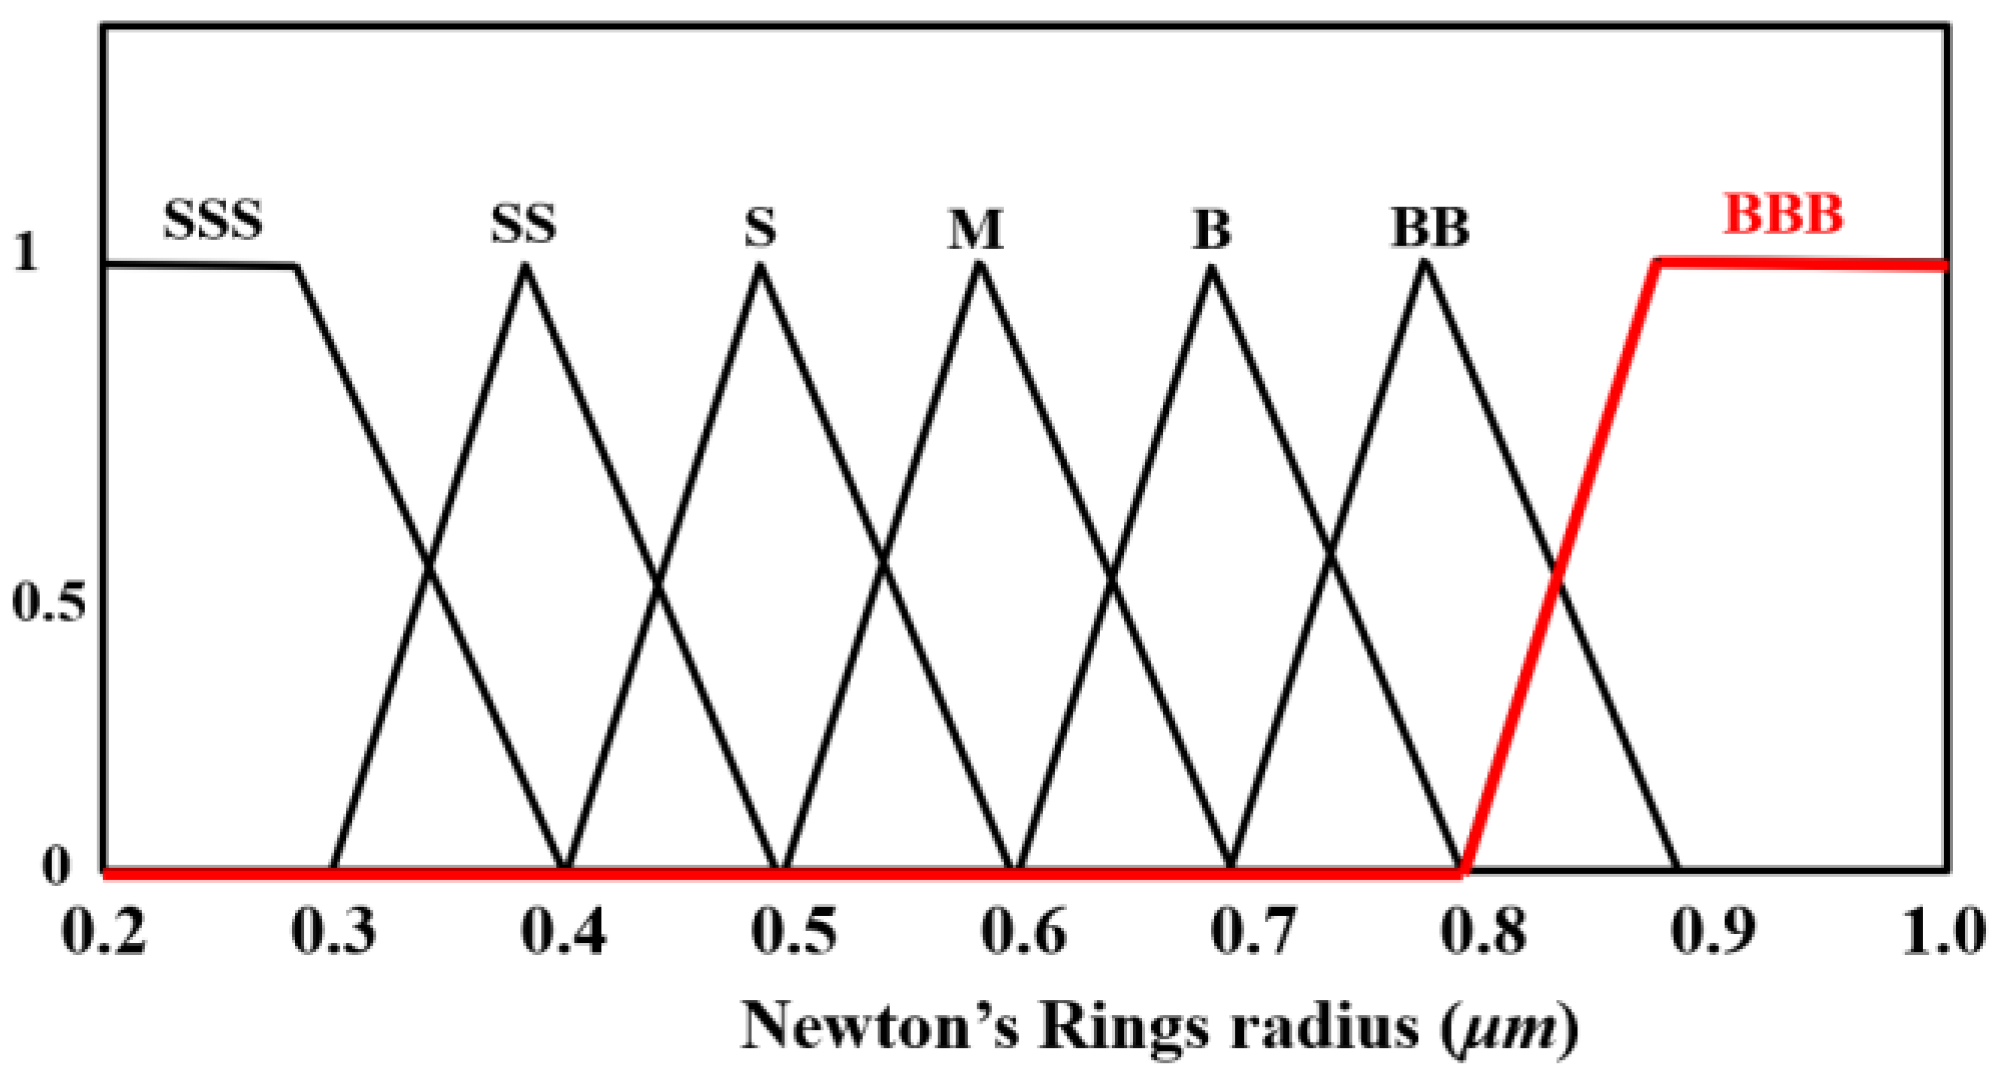
For the membership degree of different radii of Newton’s rings, seven membership functions are set for the radius, which are SSS (very small), SS (small), S (slightly small), M (medium), B (slightly big), BB (big), and BBB (very big). Since the set boundaries are 0.3 mm and 0.9 mm, values below 0.3 mm are classified as SSS (very small), and values above 0.8 mm are classified as BBB (very big), as shown in Figure 15.
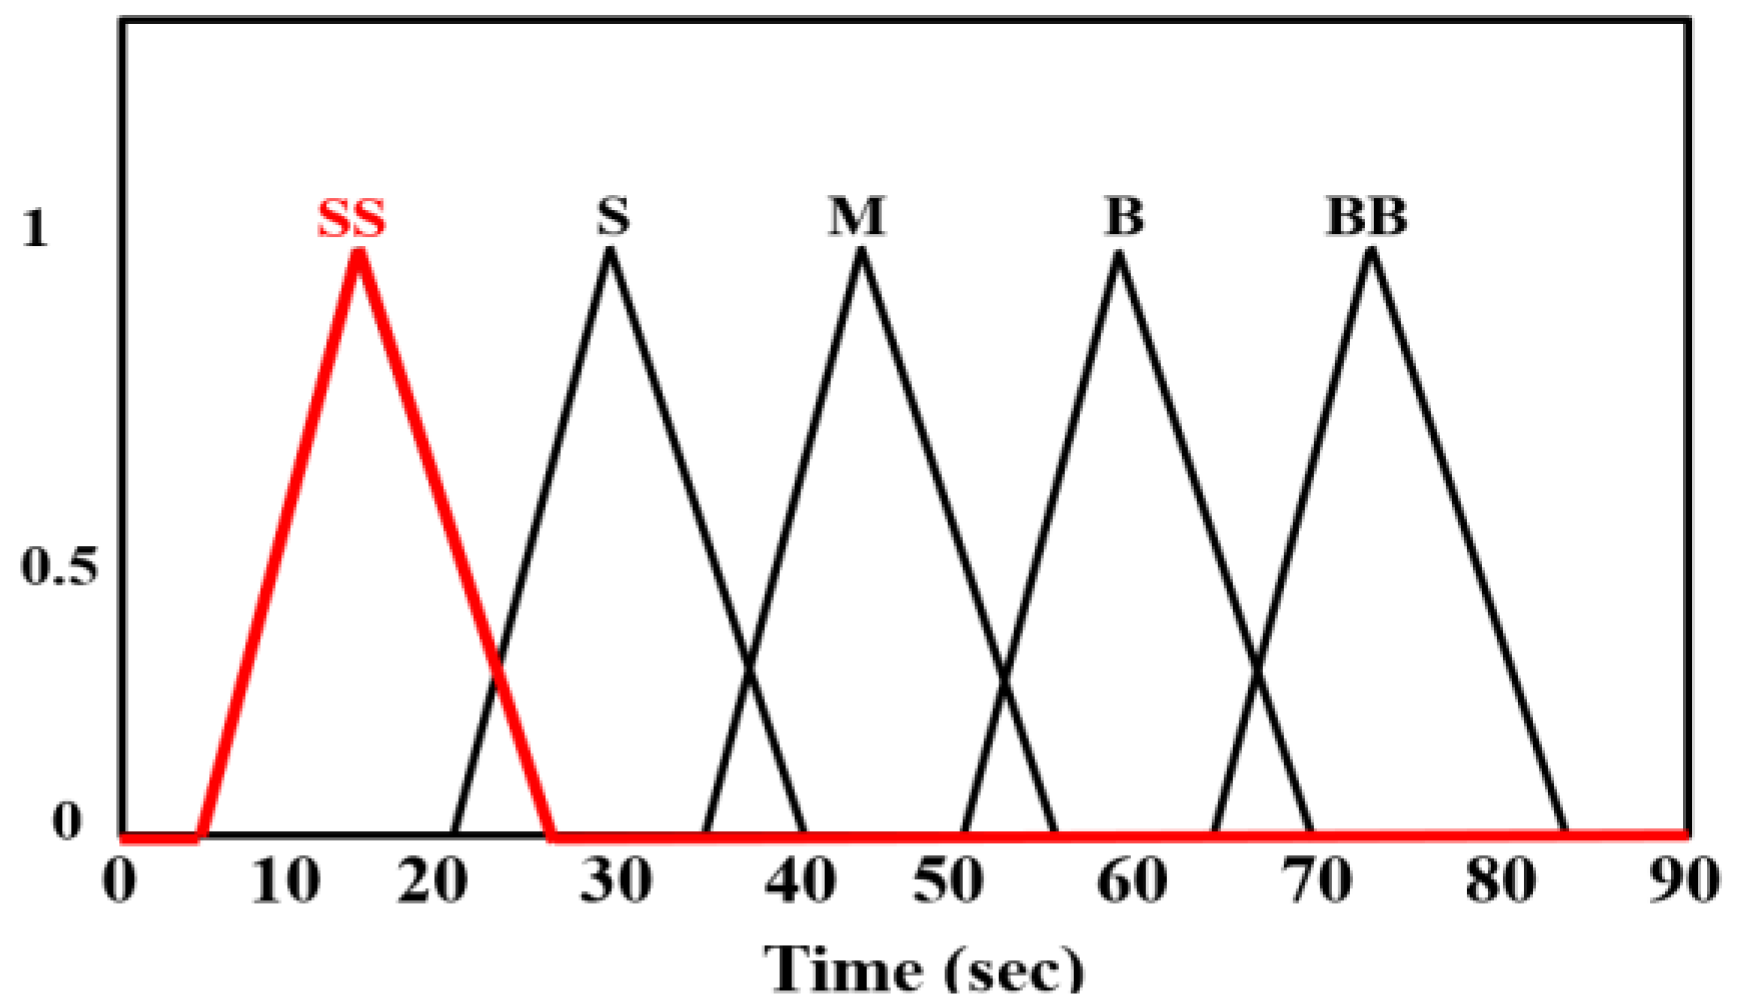
For the degree of membership of different measurement times, five membership functions are set for the measurement time, namely, SS (very short time), S (short time), M (medium time), B (long time), and BB (very long time); the boundary sets oil supply time equal to the sensor acquisition time: SS (very short time) is 15 min, S (short time) is 30 min, M (medium time) is 45 min, B (long time) is 60 min, and BB (very long time) is 75 min, as shown in Figure 16.
Eight membership functions are set for the oil film thickness under different feed rates and radii of Newton’s rings. In order to make the data easier to analyze, the set boundary values are regularized. The original oil film thickness value ranges from 3.3 um to −5.4 um; normalization adds 5.4 um to all data, so the range is 8.7 um to 0 um. To predict the oil film thickness corresponding to different feed rates and radii of Newton’s rings, 10 membership functions are set for the oil film thickness, namely, zero (zero point), S4 (extremely thin), S3 (very thin), S2 (thin), S1 (slightly thin), M (medium), B1 (slightly thick), B2 (thick), B3 (very thick), and B4 (extremely thick), as shown in Figure 17.
The fuzzy analysis method in this study is the Mamdani fuzzy rule. This method establishes the rules for the feed rate and the radius of Newton’s rings. The correspondence between the feed system platform and the variation trend of Newton’s rings is established using the Mamdani fuzzy rule with experimental data. The three-dimensional model analysis shows the variation trend of the oil film thickness with the feed rate, radius of Newton’s rings, and measurement time, as shown in Figure 18. The input parameters are the feed rate, radius of Newton’s rings, and measurement time, and the predicted value is the oil film thickness.
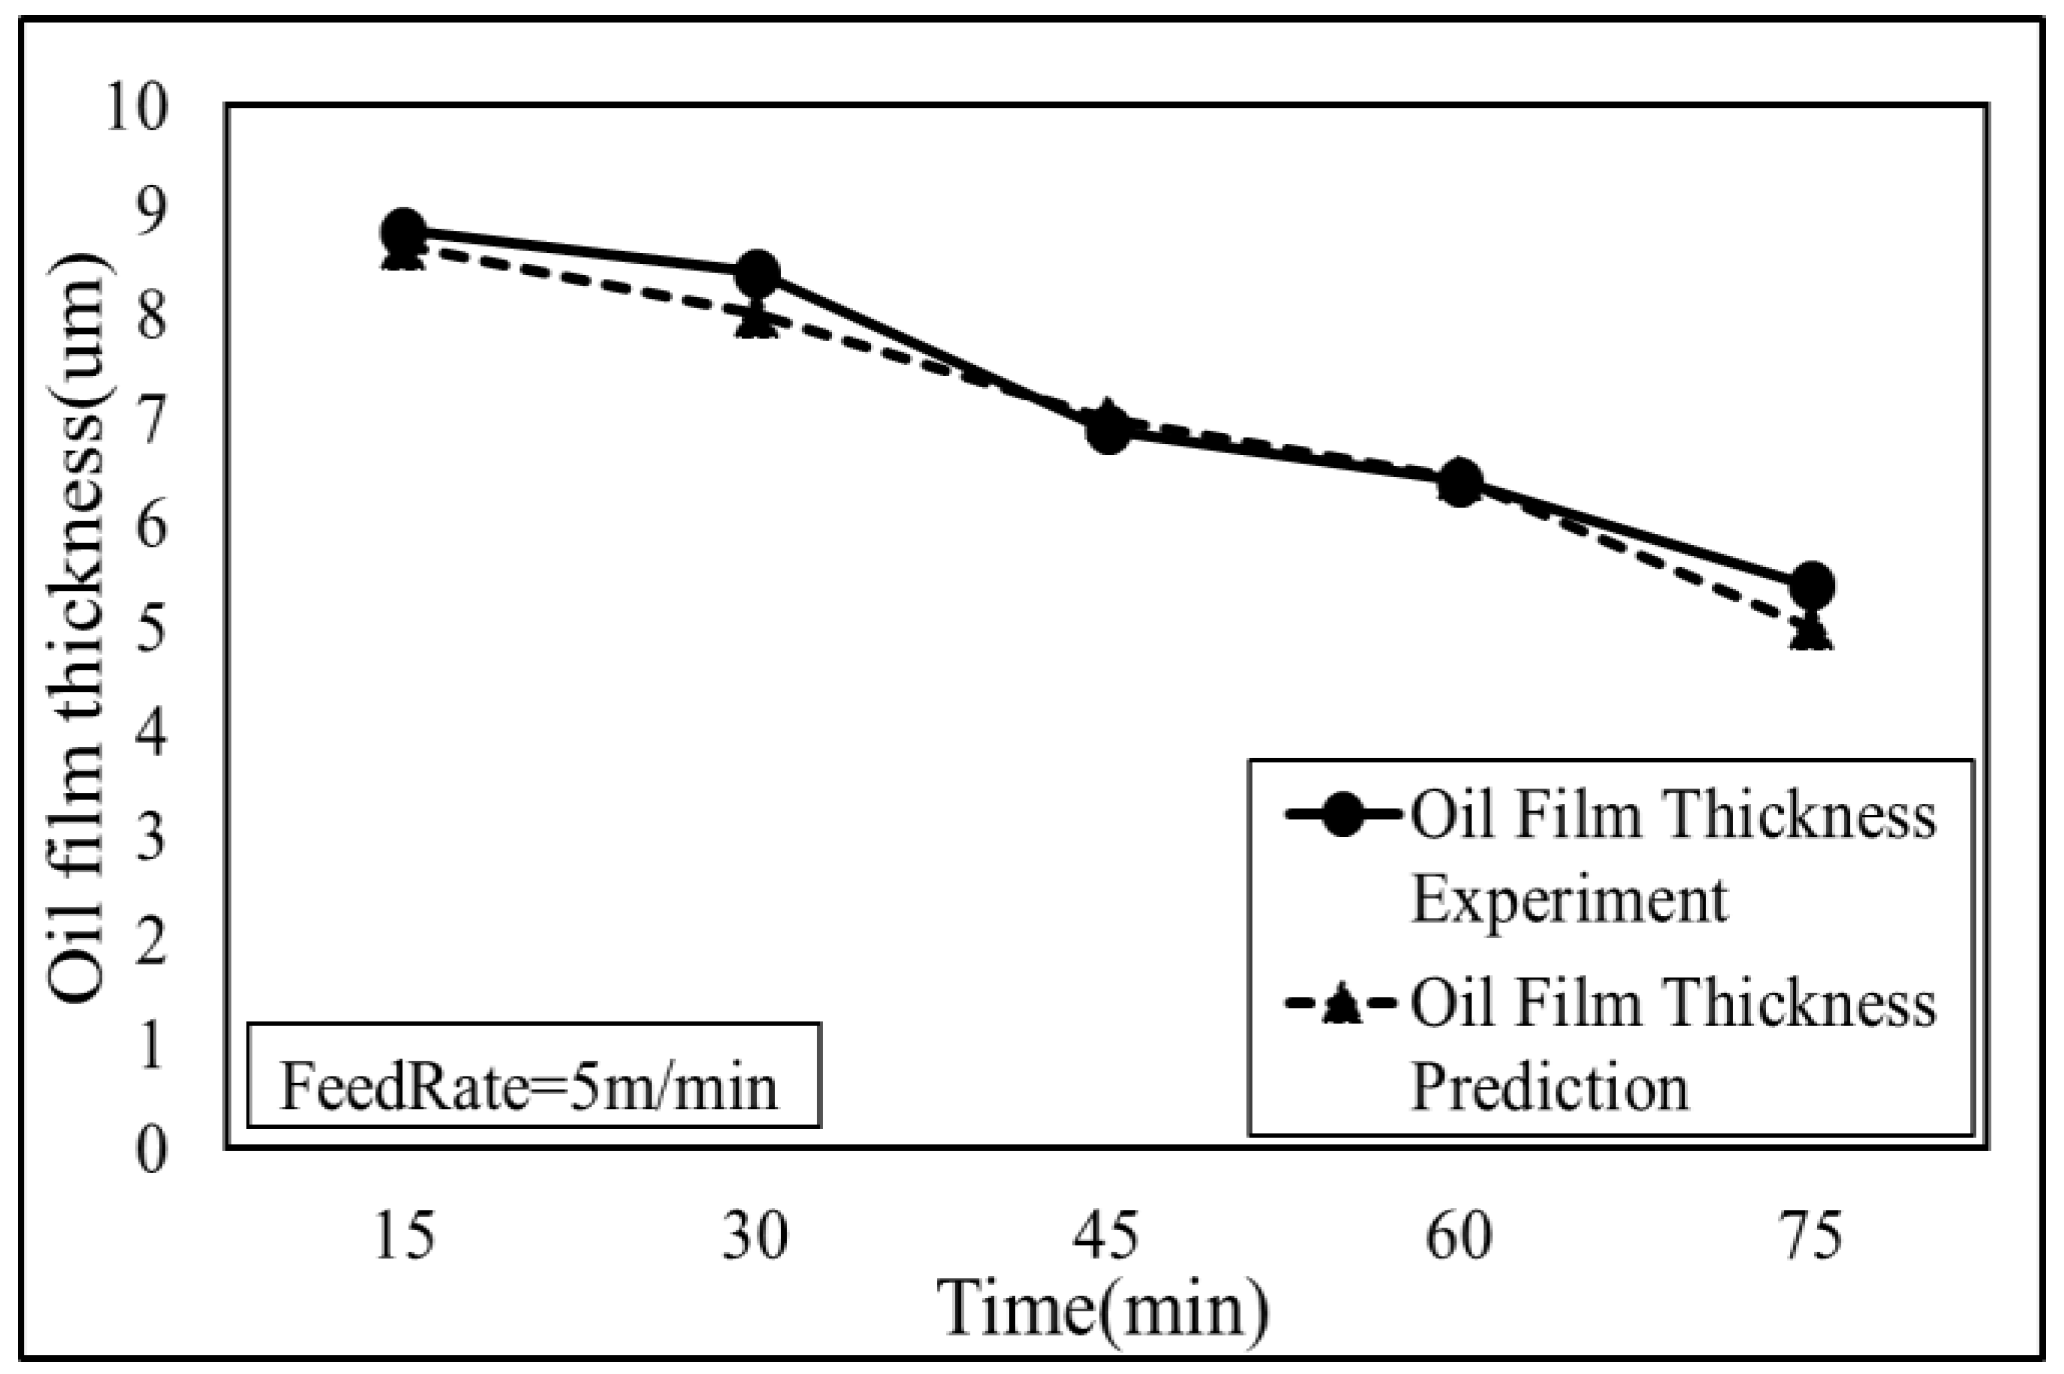
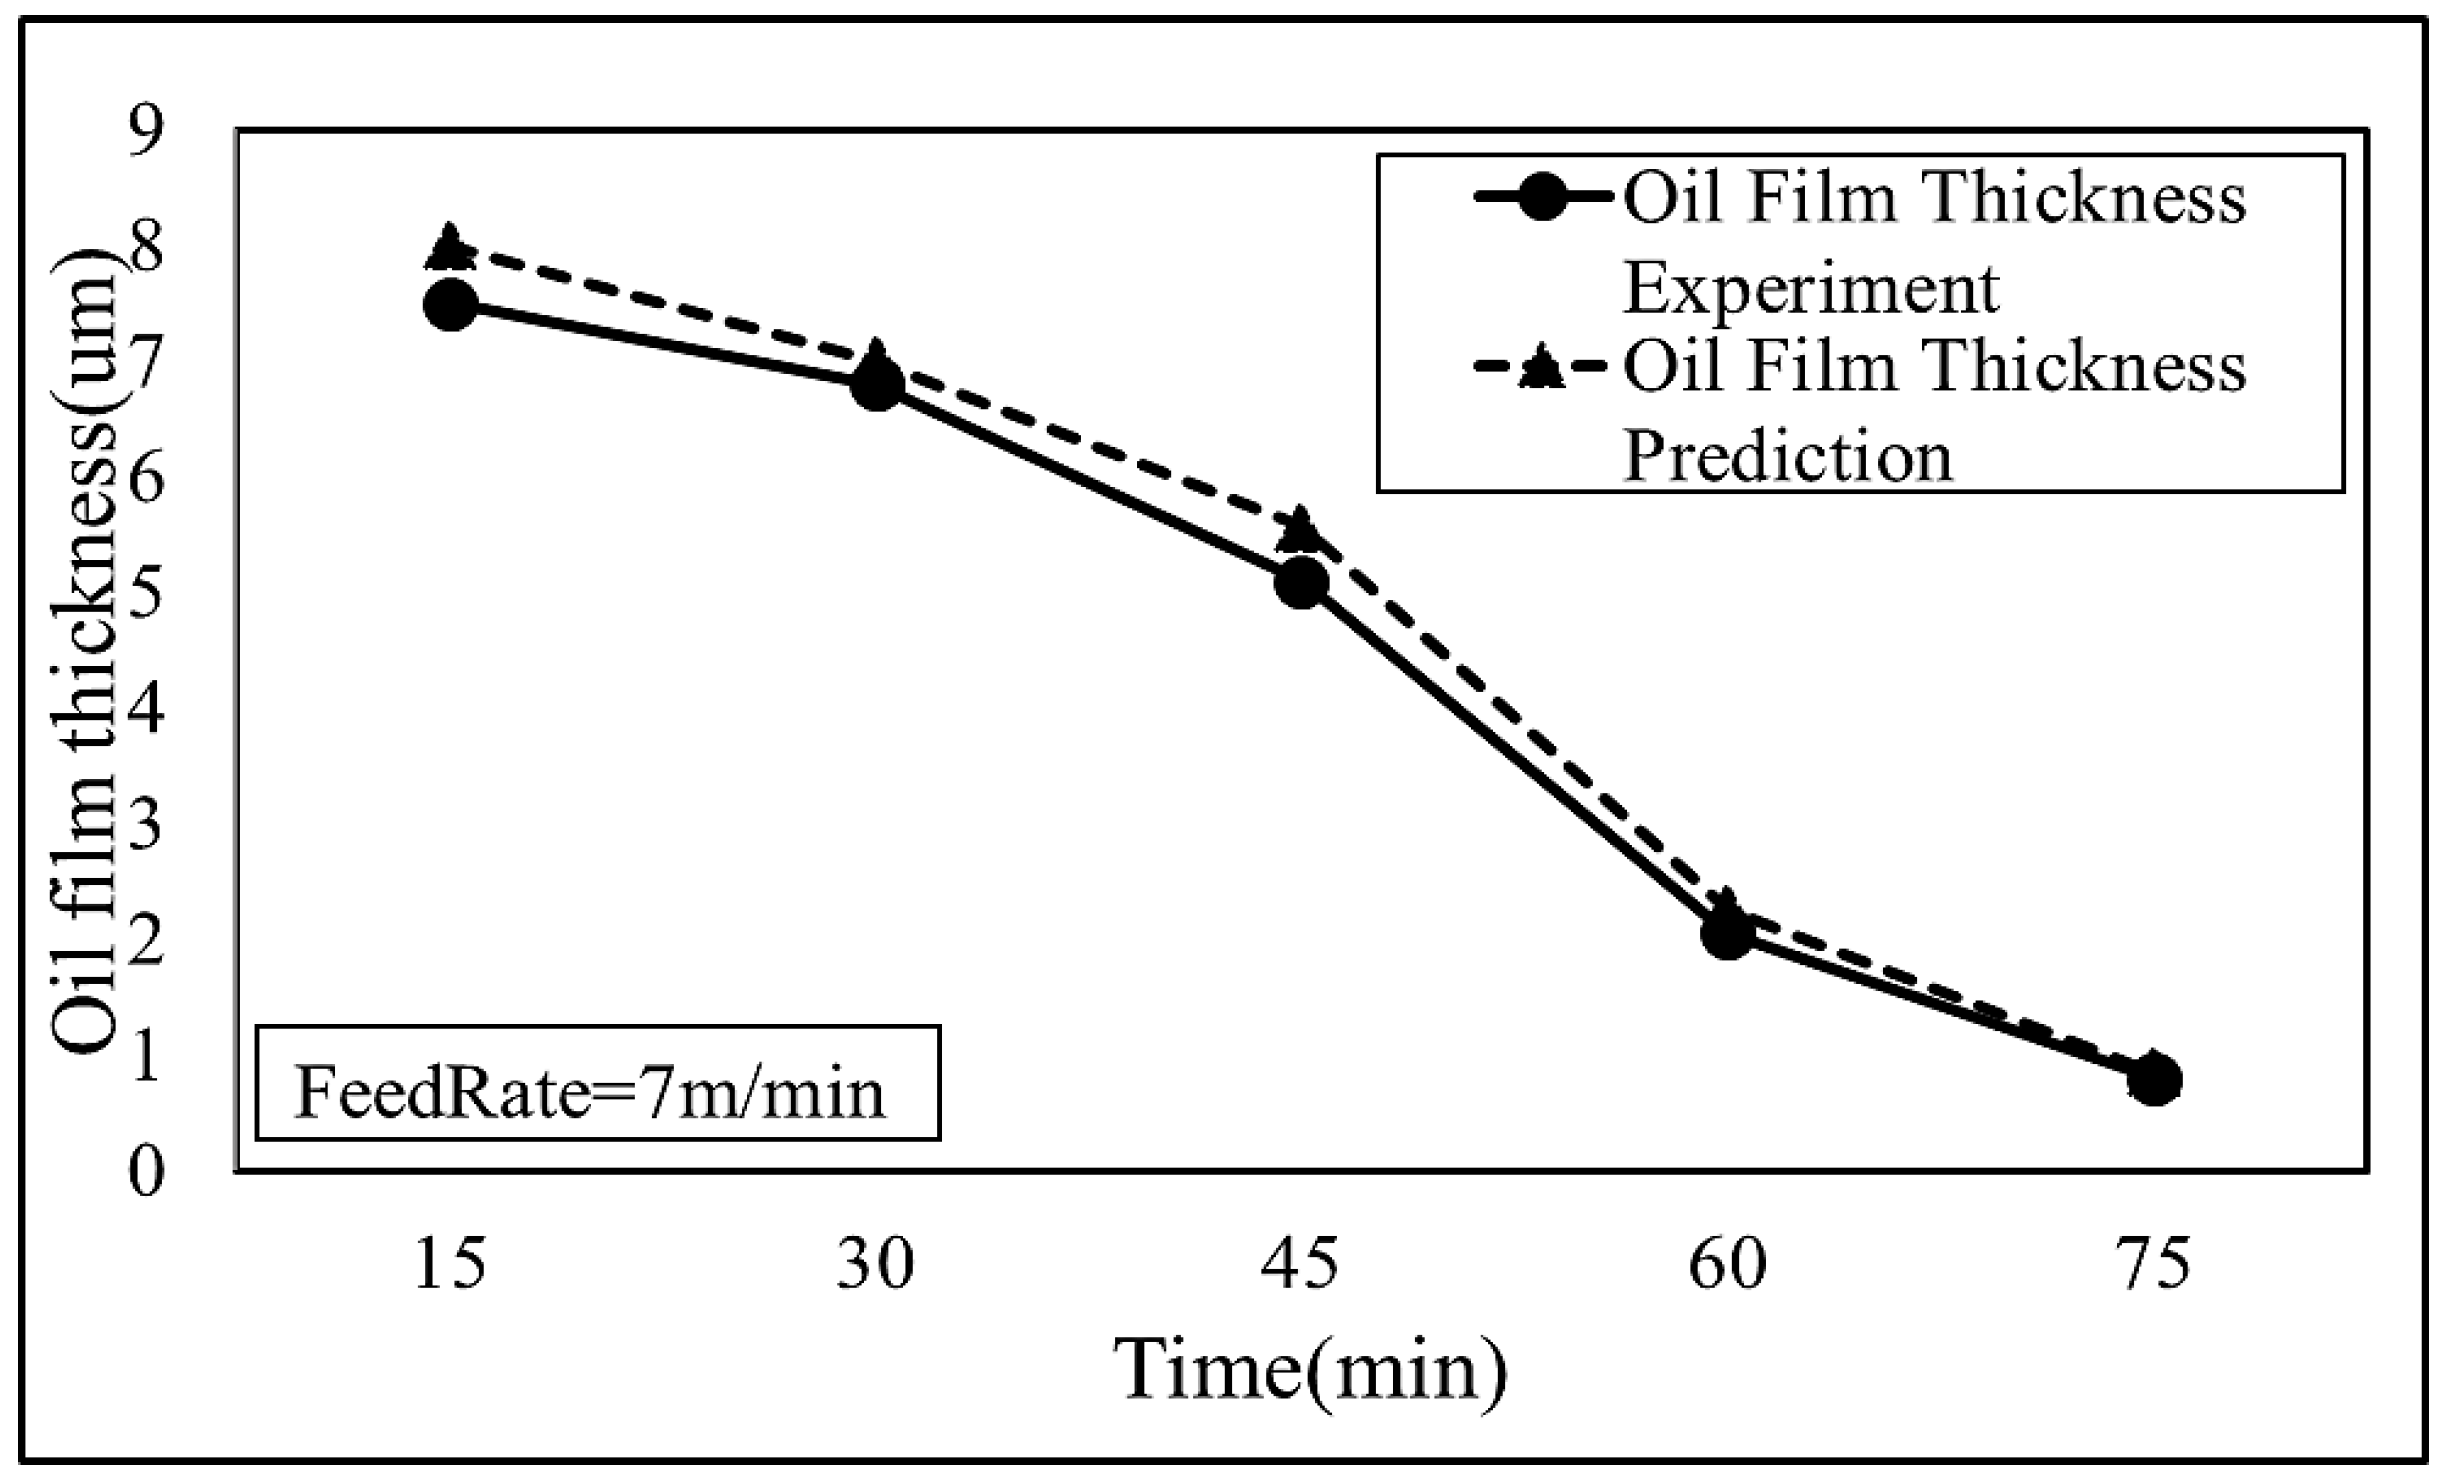
Different feed rates were used in the verification experiment. Figure 19 and Table 3 show the predicted and actual value curves of the oil film thickness when the feed rate is 5 m/min. The errors are less than 10%. When the measurement time is 60 min, the actual and predicted values of oil film thickness are 6.4 um and 6.43 um, respectively. Both are lower than 6.64 um, meeting the oil supply conditions, proving that the actual oil supply timing in the fuzzy theory analysis is consistent with the verification experiment. During the verification, the feed rate was increased to 7 m/min. The predicted and actual value curves of the oil film thickness are shown in Figure 20 and Table 4. When the measurement time is 45 min, the actual and predicted values of the oil film thickness are 5.1 um and 5.56 um, respectively; both are lower than 6.64 um, meeting the oil supply conditions, meaning that the actual oil supply timing in the fuzzy model is consistent with that in the verification experiment. At 60 min, the maximum difference between the actual (2.05 um) and predicted (2.25 um) values of oil film thickness is 10%. At 30 min, the minimum difference between the actual (6.8 um) and predicted (7 um) values of oil film thickness is 3%.

5. Conclusions

  • An increase in feed rate from 4 m/min to 6 m/min led to an 18% rise in current. Further increasing the feed rate to 8 m/min resulted in a 21% increase in current. There are two main reasons for this observation: (1) the smaller the feed rate, the lower the mechanical power and the smaller the relative current; (2) the feed rate is proportional to the viscosity coefficient of the lubricating oil.
  • The variation trend in the radius of Newton’s rings is consistent with the trend of the oil film thickness value. The radius of Newton’s rings and oil film thickness were measured at different feed rates, and linear regression shows that the R2 ranges from 0.87 to 0.94, surpassing the threshold of 0.7 for a high correlation. The average error is 6.5%.
  • Oil film consumption is proportional to the feed rate, as shown in Formula 10. An increase in feed rate from 4 m/min to 6 m/min resulted in a 219% increase in oil film consumption, while a further increase to 8 m/min led to a 300% increase.
  • This study uses fuzzy theory with three different feed rates to predict the oil supply timing and oil film thickness. It is verified that the experimental results are consistent with the predicted results, with errors less than 10%. The regression analysis method is used to illustrate that the trends in oil film thickness and the radius of Newton’s rings are consistent, a result that can be used to identify the rail lubrication state.

Author Contributions

Methodology, S.-H.C.; data curation, S.-H.C.; formal analysis, S.-H.C.; writing-original draft, S.-H.C.; data curation, L.-Y.H.; formal analysis, L.-Y.H.; writing-original draft, L.-Y.H. All authors have read and agreed to the published version of the manuscript.

Funding

This research received no external funding.

Data Availability Statement

The data required to reproduce these findings cannot be shared at this time as the data also forms part of an ongoing study.

Conflicts of Interest

The authors declare no conflict of interest.

Nomenclature

ZAbsolute viscosity of lubricant
NFeed speed (mm/min)
PLoad per unit area (N)
Ra1, Ra2Contact surfaces
ΛBoundary lubrication
FFriction (N)
ηViscosity coefficient of lubricating oil
AContact area (um2)
NFeeding system platform reciprocating feed rate
HDisplacement-meter-measured rail oil film thickness value (um)
R ¯   Composite surface roughness (um)
Ra trackHard rail surface roughness (um)
Ra TurciteWear plate surface roughness (um)
rRadius of ring (um)
RRadius of curvature of lens (um)
I1, I2Light intensity (CD)

References

  1. Lo, S.W.; Yang, T.S. A New Mechanism of Asperity Flattening in Sliding Contact—The Role of Tool Elastic Micro-wedge. ASME Trans. J. Tribol. 2003, 125, 713–719. [Google Scholar] [CrossRef]
  2. Maurya, A.; Kumar, A.; Punia, A.D. CFD and Frictional Torque Analysis of Hydrodynamic Journal Bearing. IJERT 2019, 8, 959–968. [Google Scholar]
  3. Meng, Y.; Xu, J.; Jin, Z.; Prakash, B.; Hu, Y. A review of recent advances in tribology. Friction 2020, 8, 221–300. [Google Scholar] [CrossRef]
  4. Zapletal, T.; Sperka, P.; Krupka, I.; Hartl, M. The effect of surface grooves on transition to mixed lubrication. Tribol. Int. 2017, 114, 409–417. [Google Scholar] [CrossRef]
  5. Nordhagen, E.M.; Sveinsson, H.A.; Malthe-Sørenssen, A. Diffusion-Driven Frictional Aging in Silicon Carbide. Tribol. Lett. 2023, 71, 95. [Google Scholar] [CrossRef]
  6. Liu, S.; Zhang, B.; Cai, L.; Wang, W.; Liang, T.; Lei, M. High-Temperature and High-Pressure Tribological Properties of Siliconized Graphite for Water-Lubricated Thrust Bearing Application in Main Coolant Pump. Lubricants 2024, 12, 159. [Google Scholar] [CrossRef]
  7. Qi, B.; Zhao, J.; Chen, C.; Song, X.; Jiang, H. Accuracy decay mechanism of ball screw in CNC machine tools for mixed sliding-rolling motion un-der non-constant operating conditions. Int. J. Adv. Manuf. Technol. 2023, 124, 4349–4363. [Google Scholar] [CrossRef]
  8. Parameswaran, G.; Jayaram, V.; Kailas, S.V. Frictional Characteristic Curves of Ground Surfaces in Lubricated Sliding. Lubricants 2023, 11, 354. [Google Scholar] [CrossRef]
  9. Li, C.; Xu, M.; Song, W.; Zhang, H. A review of static and dynamic analysis of ball screw feed drives, recirculating linear guideway, and ball screw. Int. J. Mach. Tools Manuf. 2023, 188, 104021. [Google Scholar] [CrossRef]
  10. Verma, K.; Belokar, R.M. Experimental investigations of ball screws over static and accelerating torque-based lead factor in CNC machining centre. J. Eng. 2018, 2018, 17–21. [Google Scholar] [CrossRef]
  11. Chen, S.H.; Lin, M.Y. Development and design of intelligent lubricating equipment for feed systems. Heliyon 2024, 10, e26124. [Google Scholar] [CrossRef] [PubMed]
  12. Rigacci, M.; Sato, R.; Shirase, K. Experimental evaluation of mechanical and electrical power consumption of feed drive systems driven by a ball-screw. Precis. Eng. 2020, 64, 280–287. [Google Scholar] [CrossRef]
  13. Yu, H.; Luan, X.; Zheng, G.; Hao, G.; Liu, Y.; Xing, H.; Liu, Y.; Fu, X.; Liu, Z. Analysis and Experiment of Thermal Field Distribution and Thermal Deformation of Nut Rotary Ball Screw Transmission Mechanism. Appl. Sci. 2024, 14, 5790. [Google Scholar] [CrossRef]
  14. Cui, P.; Hou, Z.; He, L.; Zheng, H.; He, Y.; Fan, Y.; An, L.; Huang, Y. Experimental Study on In Situ Storage of Grease-Lubricated Ball Screws. Appl. Sci. 2024, 14, 2734. [Google Scholar] [CrossRef]
  15. Goncalves, D.; Graca, B.; Campos, A.V.; Seabra, J. Film thickness and friction behaviour of thermally aged lubricating greases. Tribol. Int. 2016, 100, 231–241. [Google Scholar] [CrossRef]
  16. Grebe, M.; Ruland, M. Influence of Mechanical, Thermal, Oxidative and Catalytic Processes on Thickener Structure and Thus on the Service Life of Rolling Bearings. Lubricants 2022, 10, 77. [Google Scholar] [CrossRef]
  17. Wen, S.; Huang, P. Principles of Tribology; John Wiley & Sons: Hoboken, NJ, USA, 2017. [Google Scholar]
  18. Luo, J. Thin Film Lubrication. In Encyclopedia of Tribology; Wang, Q.J., Chung, Y.W., Eds.; Springer: Boston, MA, USA, 2013. [Google Scholar] [CrossRef]
  19. Ramadan, W.A.; Wahba, H.H.; El-Tawargy, A.S. Enhanced short temporal coherence length measurement using Newton’s rings interference. Opt. Laser Technol. 2020, 127, 106192. [Google Scholar] [CrossRef]
  20. Chu, H.M.; Lee, R.T.; Chiou, Y.C.; Huang, B.W. EHL Optical interferometry Inverse approach Viscosity. Bull. Yung-Ta Inst. Technol. Commer. 2005, 6, 53–63. Available online: http://catalog.digitalarchives.tw/item/00/4c/40/e2.html (accessed on 30 June 2025).
  21. Tofighi-Niaki, E.; Safizadeh, M.S. Dynamic of a Flexible Rotor-Bearing System Supported by Worn Tilting Journal Bearings Experiencing Rub-Impact. Lubricants 2023, 11, 212. [Google Scholar] [CrossRef]
  22. Tošić, M.; Larsson, R.; Lohner, T. Thermal Effects in Slender EHL Contacts. Lubricants 2022, 10, 89. [Google Scholar] [CrossRef]
  23. Zhu, J.; Li, X.; Beamish, S.; Dwyer-Joyce, R.S. An ultrasonic method for measurement of oil films in reciprocating rubber O-ring seals. Tribol. Int. 2022, 167, 107407. [Google Scholar] [CrossRef]
  24. Qin, W.; Wang, M.; Sun, W.; Shipway, P.; Li, X. Modeling the effectiveness of oil lubrication in reducing both friction and wear in a fretting contact. Wear 2019, 426, 770–777. [Google Scholar] [CrossRef]
  25. Khare, H.S.; Moore, A.C.; Haidar, D.R.; Gong, L.; Ye, J.; Rabolt, J.F.; Burris, D.L. Interrelated effects of temperature and environment on wear and tribochemistry of an ultralow wear PTFE composite. J. Phys. Chem. C 2015, 119, 16518–16527. [Google Scholar] [CrossRef]
  26. Chen, S.-H.; Haung, Z.-J. A study of using back-propagation neural model in automatic lubrication installation for the feeding system of computer numerical control machine tool. Proc. Inst. Mech. Eng. Part J J. Eng. Tribol. 2022, 236, 1219–1231. [Google Scholar] [CrossRef]
  27. Teflon PTFE. Properties Handbook. 2020. Available online: http://www.rjchase.com/ptfe_handbook.pdf (accessed on 30 June 2025).
  28. Sheng, L.R. Lubrication; Quan-Hua Science and Technology Book Co., Ltd.: Taipei, Taiwan, 1994; ISBN 9789571410067. [Google Scholar]
  29. Tsai, C.-H.; Tien, K.-C.; Chen, M.-C.; Chang, K.-M.; Lin, M.-S.; Cheng, H.C.; Lin, Y.-H.; Chang, H.-W.; Lin, H.-W.; Lin, C.-L.; et al. Characterizing coherence lengths of organic light-emitting devices using Newton’s rings apparatus. Org. Electron. 2010, 11, 439–444. [Google Scholar] [CrossRef]
  30. Beamish, S.; Reddyhoff, T.; Hunter, A.; Dwyer-Joyce, R.S. A method to determine acoustic properties of solids and its application to measuring oil film thickness in bearing shells of unknown composition. Measurement 2022, 195, 111176. [Google Scholar] [CrossRef]
  31. Yang, S.W.; Lin, C.S.; Fu, S.H.; Yeh, M.S.; Tsou, C.; Lai, T.H. Lens sag measurement of microlens array using optical interferometric microscope. Opt. Commun. 2012, 285, 1066–1074. [Google Scholar] [CrossRef]
  32. Guo, S.D. Optical Testing Technology; Beijing Institute of Technology Press: Beijing, China, 2010; ISBN 9787564025649. [Google Scholar]
  33. Lee, K.-T. Lubrication; Gaoli Books Co., Ltd.: Taipei, Taiwan, 2019; ISBN 9789575840617. [Google Scholar]
Figure 1. Structure diagram of the feed system and slide way [28].
Lubricants 13 00371 g001
Figure 2. Coefficient of friction versus load [27].
Lubricants 13 00371 g002
Figure 3. Stribeck curves.
Lubricants 13 00371 g003
Figure 4. Formation of Newton’s rings.
Lubricants 13 00371 g004
Figure 5. Schematic diagram of preload and parallelism control in mechanism design.
Lubricants 13 00371 g005
Figure 6. Overall setup and simulated mounting positions.
Lubricants 13 00371 g006
Figure 7. Experimental flow chart.
Lubricants 13 00371 g007
Figure 8. Oil film thickness curves with different feed rates.
Lubricants 13 00371 g008
Figure 9. Current curves with different feed rates.
Lubricants 13 00371 g009
Figure 10. Relationship between different feed rates and the diameter of Newton’s rings.
Lubricants 13 00371 g010
Figure 11. Fitting line of polynomial linear regression for 4 m/min.
Lubricants 13 00371 g011
Figure 12. Fitting line of polynomial linear regression for 8 m/min.
Lubricants 13 00371 g012
Figure 13. Fuzzy parameter settings.
Lubricants 13 00371 g013
Figure 14. Degree of membership of different feed rates.
Lubricants 13 00371 g014
Figure 15. Degree of membership of radius of Newton’s rings.
Lubricants 13 00371 g015
Figure 16. Degree of membership of measurement time.
Lubricants 13 00371 g016
Figure 17. Degree of membership of oil film thickness.
Lubricants 13 00371 g017
Figure 18. Three-dimensional model diagram of predicted oil film thickness with oil supply time at different feed rates.
Lubricants 13 00371 g018
Figure 19. Film thickness verification experiment with 5 m/min oil.
Lubricants 13 00371 g019
Figure 20. Oil film thickness verification experiment at 7 m/min.
Lubricants 13 00371 g020
Table 1. Coefficient of determination of feed rates, F-test values, and regression formulas.
Feed RateR2FFormula
4 m/min0.8719.68 y 4000 = 1.9604x2 + 5.0079x + 2.6109
6 m/min0.9425.37 y 6000 = −45.395x2 + 60.094x − 12.319
8 m/min0.9714.68 y 8000 = −127.77x2 + 145.91x − 34.361
Table 2. Polynomial linear regression formula sheet for verifying feed rates.
Feed Rate
(m/min)
Time
(min)
Newton’s Rings (mm)Predicted Thickness
(mm)
Actual Thickness
(mm)
Error Value
4150.98.78.61%
750.66.35.515%
6300.86.76.93%
750.31.61.58%
8300.56.66.27%
450.43.53.45%
Average error6.5%
Table 3. Actual and predicted values of oil film thickness at 5 m/min.
Time
(min)
Newton’s Rings Radius (mm)Oil Film Thickness (um)Relative Error e%
Actual ValueFigureActualPredict
150.87Lubricants 13 00371 i0018.88.652%
300.86Lubricants 13 00371 i0028.485%
450.66Lubricants 13 00371 i0036.971%
600.53Lubricants 13 00371 i0046.46.430%
750.51Lubricants 13 00371 i0055.487%
Table 4. Actual and predicted values of oil film thickness at 7 m/min.
Time
(min)
Newton’s Rings Radius (mm)Oil Film Thickness (um)Relative Error e%
Actual ValueFigureActualPredict
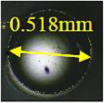
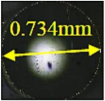
150.73Lubricants 13 00371 i0067.587%
300.62Lubricants 13 00371 i0076.873%
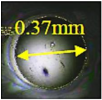
450.46Lubricants 13 00371 i0085.15.569%
600.37Lubricants 13 00371 i0092.052.2510%
750.3Lubricants 13 00371 i0100.850.87%
Disclaimer/Publisher’s Note: The statements, opinions and data contained in all publications are solely those of the individual author(s) and contributor(s) and not of MDPI and/or the editor(s). MDPI and/or the editor(s) disclaim responsibility for any injury to people or property resulting from any ideas, methods, instructions or products referred to in the content.