Article

Tribo-Dynamic Investigation of Cryogenic Ball Bearings Considering Varying Traction Parameters

1
College of Information Technology, Luoyang Normal University, Luoyang 471934, China
2
College of Mechanical and Vehicle Engineering, Chongqing University, Chongqing 400044, China
3
College of Mechanical Engineering, Xi’an Jiaotong University, Xi’an 710049, China
*
Author to whom correspondence should be addressed.
Lubricants 2025, 13(8), 352; https://doi.org/10.3390/lubricants13080352
Submission received: 22 July 2025 / Revised: 2 August 2025 / Accepted: 3 August 2025 / Published: 5 August 2025
(This article belongs to the Special Issue Tribological Characteristics of Bearing System, 3rd Edition)

Abstract

The traction behavior in cryogenic solid-lubricated ball bearings (CSLBBs) used in liquid rocket engines (LREs) affects not only the dynamic response of the bearing but also the lubricity and wear characteristics of the solid lubrication coating. The traction coefficient between the ball and raceway depends on factors such as contact material, relative sliding velocity, and contact pressure. However, existing traction curve models for CSLBBs typically consider only one or two of these factors, limiting the accuracy and applicability of theoretical predictions. In this study, a novel traction model for CSLBBs is proposed, which incorporates the combined effects of contact material, relative sliding velocity, and contact pressure. Based on this model, a tribo-dynamic framework is developed to investigate the tribological and dynamic behavior of CSLBBs. The model is validated through both theoretical analysis and experimental data. Results show that the inclusion of solid lubricant effects significantly alters the relative sliding and frictional forces between the rolling elements and the raceway. These changes in turn influence the impact dynamics between the rolling elements and the cage, leading to notable variations in the bearing’s vibrational response. The findings may offer valuable insights for the wear resistance and vibration reduction design of CSLBBs.

1. Introduction

Ball bearings in liquid rocket engines (LREs) are typically subjected to high loads and rotational speeds during operation, posing a significant challenge to their reusability. The presence of cryogenic fluids (such as liquid methane and liquid oxygen, serving as fuel and oxidants) necessitates the use of solid lubrication in these bearings, which further increases the risk of insufficient lubrication and even wear [1]. Due to the high cost and safety concerns associated with experimental investigations [2], theoretical modeling is often required in the early stages to study the operational performance and failure mechanisms of cryogenic solid-lubricated ball bearings (CSLBBs) [3]. Given the complex operating conditions described above, it is crucial to develop more accurate multidisciplinary coupled models for CSLBBs.
As summarized by Gupta [4], Hong et al. [5] and Cao et al. [6], the mechanical modeling of rolling element bearings (REBs) has seen significant advancements over the past half-century. With the continuous improvement of computational capabilities, increasingly sophisticated mechanical models have been developed by incorporating various factors such as rotor tilting [7,8], cage motion [9,10], ball skidding [11,12], wearing [13,14], and the effects of defects or faults [15,16]. However, mechanical models need not be as complex as possible; instead, the selection of factors should be guided by the specific research objectives. It is important to note that the accuracy of the predicted rotational speeds of bearing components is highly dependent on the traction or friction model adopted in the bearing simulation [17,18]. To improve the precision of traction modeling in solid-lubricated ball bearings, extensive efforts have been made by researchers in both theoretical and experimental domains.
The Kragelskii traction curve [19], which directly characterizes the coefficient of friction (COF) between the rolling elements and the raceways as a function of relative sliding velocity, is considered the first solid-lubricated traction model developed for rolling element bearings (REBs). Utilizing this model in a dynamic framework, Gupta [17] demonstrated that the traction behavior at the rolling contact interface is a key factor influencing the dynamic response of REBs. Subsequently, he derived empirical formulas to extract traction parameters from test data and compiled a database of traction coefficients for various solid lubricants [20]. To more accurately capture the traction characteristics under cryogenic conditions in liquid rocket engine (LRE) ball bearings, cryogenic traction tests—such as ball-on-disk and pin-on-disk experiments—have been conducted to generate more representative traction curves for CSLBBs [21,22]. Based on these experimentally obtained curves, the tribological and dynamic behavior of CSLBBs can be studied with greater precision. For instance, using the traction data provided in [23], Gupta et al. [24] developed a tribo-thermal-dynamic model to analyze the heating behavior of CSLBBs at temperatures around −240 °F. Similarly, Kwak et al. [21] proposed a modified traction curve that accounts for the hydrodynamic effect of liquid nitrogen (LN2), and used it to analyze the friction torque of CSLBBs based on pin-on-disk measurements. Zhang et al. [25] utilized traction data obtained from a newly developed cryogenic ball-on-disk tribometer to construct a multi-degree-of-freedom (DOF) dynamic model and investigated the power loss characteristics of CSLBBs. Although the traction curve provides a direct representation of the COF in REBs, the empirical nature and lack of physical interpretation of its parameters limit its ability to capture key contact phenomena such as rolling-sliding creepage and the tangential elastic deformation of contact asperities. Moreover, experimental results from [25] indicate that the parameters of the traction curve vary significantly under different contact pressures. In real REB operation, the rolling elements experience varying contact pressures at different azimuthal positions due to the applied radial load. This implies that the parameters of the traction model should vary dynamically with time in response to local contact pressure changes.
To incorporate the physical properties of contact surfaces into traction modeling, researchers have attempted to introduce classical rolling contact theories—such as Kalker’s simplified rolling contact model and the FASTSIM algorithm [26]—into the mechanical models of dry-lubricated or solid-lubricated REBs. These rolling contact models, along with their subsequent improvements [27,28], more accurately account for elastic deformation and relative sliding between contact asperities, thereby offering improved analytical precision. However, due to their high computational complexity and time consumption, these models are currently limited to static or quasi-static analyses of REBs [29,30]. As a result, traction curve models are still commonly adopted in dynamic simulations of REBs to enable efficient analysis of their transient dynamic responses. Nevertheless, to further improve the modeling accuracy of traction behavior, it is essential to consider more influential factors that affect the shape and parameters of the traction curve.
Based on the dynamic friction and contact parameters obtained from the tribo-dynamic model of rolling element bearings (REBs), it becomes feasible to evaluate real-time wear performance at ball–raceway and ball–cage interfaces using classical wear models such as the Archard [31] or Fleischer theory [32]. As summarized in [33], the wear evolution of REBs is generally divided into five stages: running-in, steady-state, defect initiation, defect propagation, and damage growth. Numerous theoretical studies have been conducted to investigate raceway wear behavior in REBs under this framework. However, the wear behavior in CSLBBs exhibits distinct characteristics due to the presence of solid lubrication coatings. While CSLBBs possess self-lubricating capabilities, sliding and spinning of the balls can still induce localized wear of the solid lubricant coating on the raceway [34]. Such localized damage may cause transient impacts in bearing vibration. Once the coating is partially worn off, direct contact between the rolling element and the raceway occurs, leading to unlubricated contact conditions. This results in a sudden increase in the coefficient of friction (COF) at the damaged location, which can be interpreted as a transient variation in traction parameters. Therefore, it is of significant importance to investigate the dynamic behavior and early-stage wear mechanisms of CSLBBs, in order to provide a theoretical foundation for their design optimization and early wear monitoring.
Based on the above analysis, a specialized tribo-dynamic model is proposed for cryogenic solid-lubricated ball bearings (CSLBBs) to investigate their dynamic behavior and wear mechanisms under various operating conditions. The traction model incorporates newly obtained experimental data and accounts for variations in traction parameters caused by changes in contact pressure and the local detachment of the solid lubricant coating. The dynamic model includes six degrees of freedom (DOFs) for the ball, two DOFs for the outer ring, three DOFs for the inner ring, and one DOF for the cage. It also considers resistance forces from the cryogenic fluid, ball–cage collisions, and impact forces induced by local wear defects. The model is validated against both experimental results and theoretical predictions.
The remainder of the paper is organized as follows. Section 2 presents the derivation of the traction model with varying parameters and the wear rate formulation. In Section 3, the construction of the governing differential equations for the bearing components is detailed. Section 4 validates the proposed traction and dynamic models using both theoretical analysis and experimental results. Section 5 discusses the effects of solid lubricant coatings and axial preload on bearing performance. Finally, conclusions are summarized in Section 6.

2. Traction and Wear Modelling of Ball-Raceway Contacts

In this section, the so-called varying traction parameter model is developed, incorporating the effects of contact material, relative sliding velocity, and contact pressure. To improve the accuracy of the traction model, the expression for relative sliding velocity—accounting for the differential slip between contact asperities—is derived specifically for angular contact ball bearings. Subsequently, wear rate formulations for both the raceways and cage pockets of CSLBBs are established based on the Archard wear model.

2.1. Solid Lubricated Traction Model with Varying Traction Parameters

The four-parameter bearing traction model originally introduced by Kragelskii [19] is formulated as
κ = A + B s e C s + D
where A, B, C and D are parameters without physical meaning. This model characterizes the variation of the coefficient of friction (COF) with relative sliding velocity and is applicable to both oil-lubricated and solid-lubricated conditions. The resulting traction curve can be distinctly divided into two regimes, corresponding to S < Sₘ and S > Sₘ. In the first regime, the COF increases nearly linearly with S, reflecting the tangential elastic response of the solid material. In the second regime, the COF gradually decreases, thereby demonstrating the falling friction effect [35]. Gupta demonstrated that varying only four parameters is sufficient to represent different types of solid lubricants [20]. These four parameters—obtained through curve fitting using experimental values for Kₘ, Sₘ, and K—correspond to the maximum COF, the sliding velocity at which the maximum COF occurs, and the COF at an infinite sliding velocity, respectively.
Through various traction experiments, it has been found that COF depends not only on the relative sliding velocity but also on the normal contact pressure [22,25]. The experimental parameters Km, Sm and K can be expressed as polynomial functions of the normal stress, with the polynomial order determined by the number of experimental data points available.
P m p = a m , 1 p n + a m , 2 p n 1 + + a m , n p + b m
where m indicates Sm, Km or K, p is the Hertz contact pressure and a and b are constants of the function.
To account for the influence of the ball’s spinning motion and the micro-slip behavior within the contact patch, the Hertzian contact area is first normalized to a unit circle and then discretized into several arc-shaped segments, each represented by a central particle, as illustrated in Figure 1. The relative velocity of each particle can then be expressed as:
Δ v x = V ξ x φ y ξ h y Δ v y = V ξ y + φ x
where ∆vx and ∆vy are relative sliding velocities along longitude (along rolling direction) and lateral directions, respectively, V is the average rolling velocity, ξx, ξy and φ are longitude, lateral and spinning slide-to-roll ratios of the contact patch, respectively and x and y are coordinates of the contact particle.
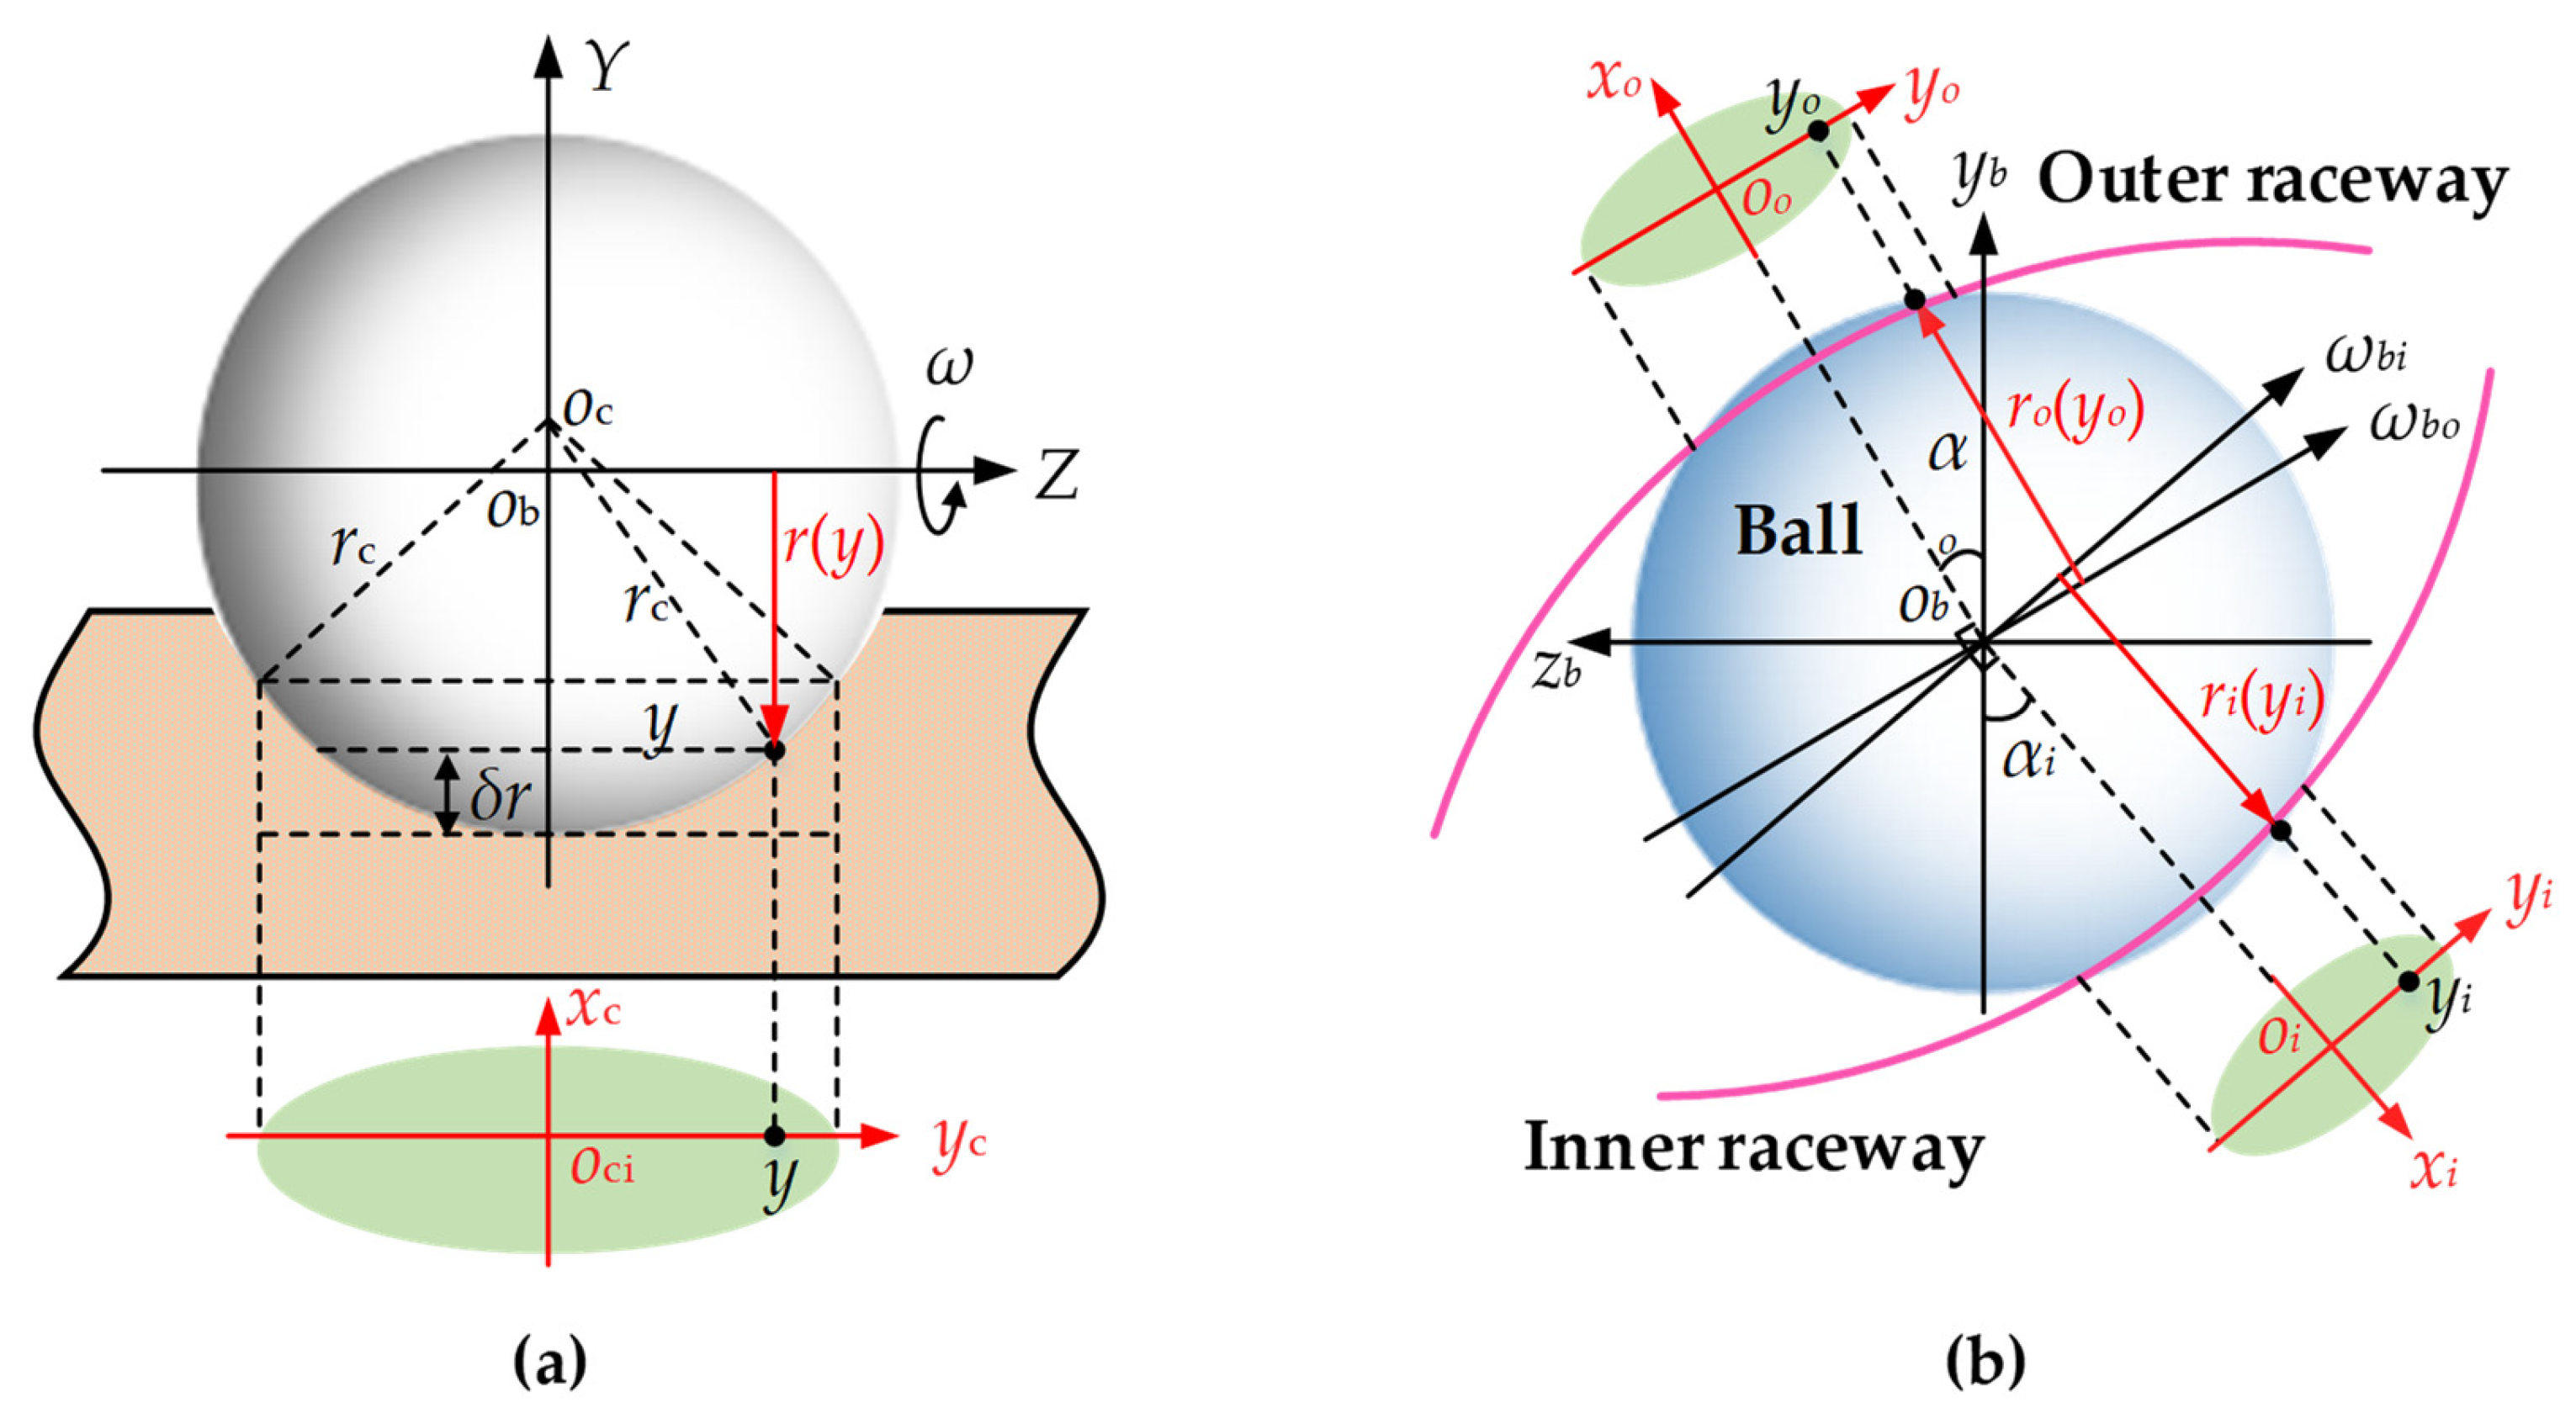
While the contact patch is often approximated as a flat area in Hertzian contact theory, the actual ball–raceway contact surface in a ball bearing is curved, since the ball and raceway have comparable curvature radii. As illustrated in Figure 2, the longitudinal curvature radius of the raceway is significantly larger than the lateral radius, resulting in an elliptical contact patch. Consequently, the elliptical semi-major coordinate of a particle substantially influences its linear velocity. The variation in rotational radius as a function of the y-coordinate is described by Heathcote [36] as:
δ r = r c r c 2 y 2 y 2 / 2 r c
where rc = 2rbre/(rb + re) is the equivalent radius of the contact with rb and re are the radii of ball and raceway, respectively and e means inner or outer. Based on the Heathcote expression in Equation (4) and the geometry relationship illustrated in Figure 2b, the differential slip terms of the angular contact ball bearing can be deduced as
ξ h i y = ω bi + ω i y 2 / 2 R ci V r ξ h o y = ω bo ω o y 2 / 2 R co V r
where ωbi/bo, ωi and ωo are the rotational speeds of the ball, inner raceway and outer raceway, respectively.
In summary, the traction calculation proceeds as follows, as illustrated in Figure 3:
Preprocessing: Fit the traction polynomial function based on experimental traction data, discretize the non-dimensional contact circle, and save the relevant parameters.
During the iteration of dynamic equations: Using Hertz contact theory and the transient displacements of bearing elements, calculate the normal pressure on each contact particle and determine the traction parameters via the polynomial function.
Tangential force and moment calculation: Compute the tangential force and moment for each contact particle based on the slide-to-roll ratio and spinning ratio, using the slide-to-roll ratio and Equation (1).
Integration: Integrate over the contact patch to obtain the total traction force and moment.

2.2. Ball Bearing Wear Behavior

In CSLBBs, the thickness of the solid lubricant coating typically ranges from a few nanometers to several tens of micrometers [20,37], depending on the lubricant material used. When the coating undergoes wear or delamination, it can significantly influence the frictional behavior and the motion of the rolling elements.
Wear in CSLBBs primarily occurs at three locations: ball–inner raceway contact, ball–outer raceway contact, and ball–cage contact. Generally, wear performance is quantitatively evaluated using the wear rate, which represents the average amount of material loss at the contact surface over time. The Archard wear model [31] is adopted to calculate the bearing’s wear rate, expressed as:
w = K w Q Δ V H
where w is the wear rate with a unit of m3/s, Kw is the wear coefficient, Q is the normal contact force, ∆V is the relative sliding velocity, H is the Brinell hardness of the contact material.
The ball-raceway contact wear rate is calculated by integrating the contact patch and number of balls:
w br = K br H br i = 1 N b c p x , y Δ v br x , y d x d y
As the ball-cage relative model is almost pure sliding, the wear rate can be easily obtained by:
w bc = K b c H b c j = 1 N b p b c Δ v b c
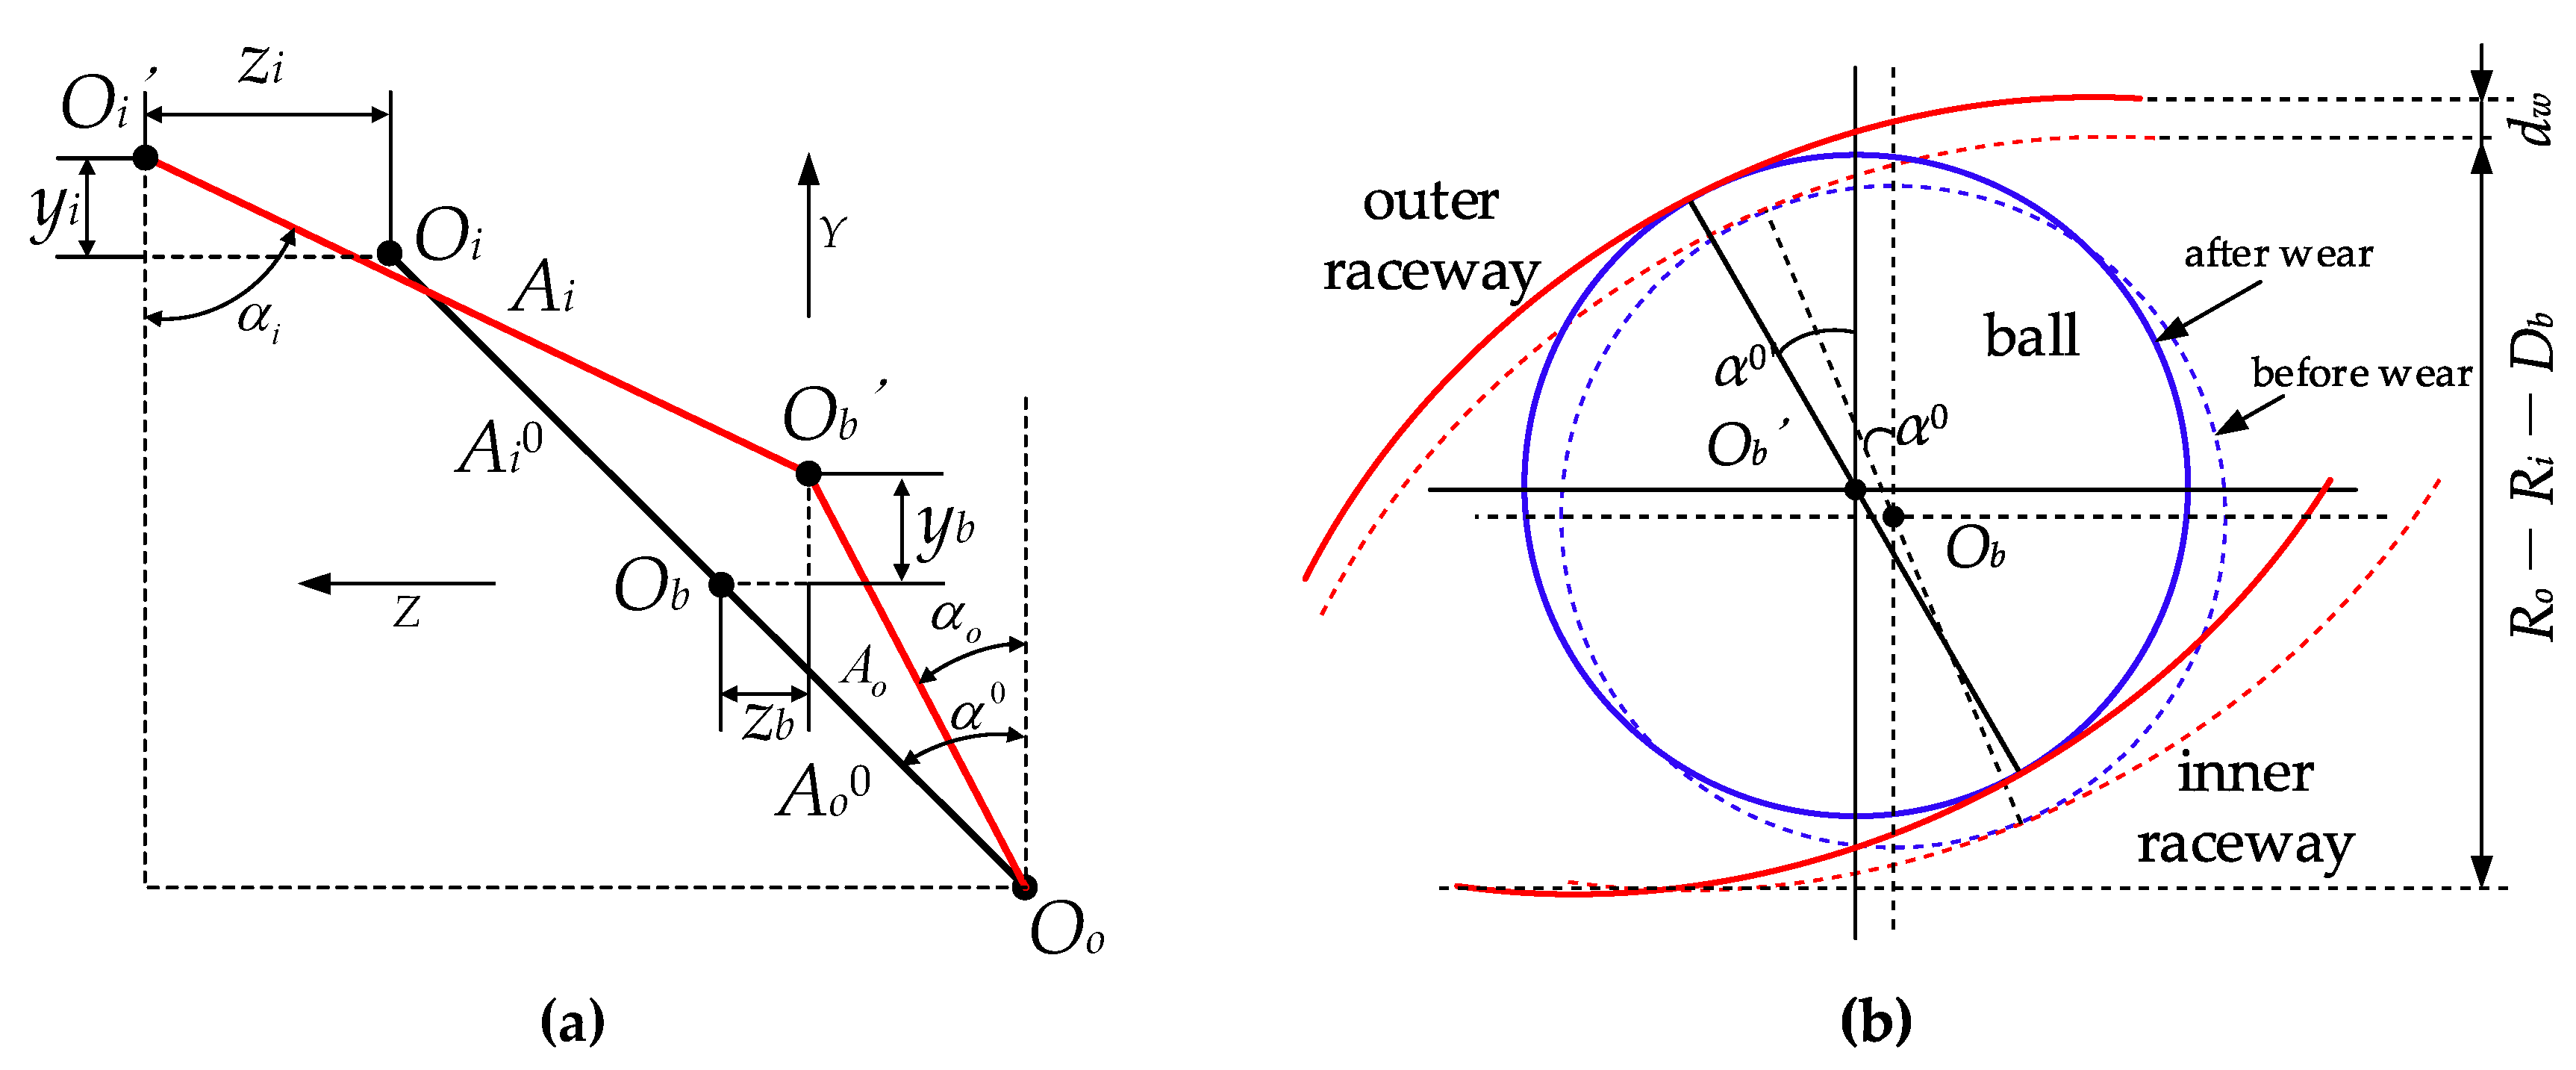
Generally, the time-varying contact angles of the ball can be calculated utilizing the origin contact angle based on the deformation compatibility condition as shown in Figure 4a. However, the relative position changes when the raceway is worn as the wear defect will change the raceway curvature radius, as shown in Figure 4b.
Generally, the time-varying contact angles of the ball can be calculated from the initial contact angle using the deformation compatibility condition, as illustrated in Figure 4a. However, when raceway wear occurs, the relative positions of the bearing elements change due to the alteration of the raceway’s curvature radius caused by the wear defect, as shown in Figure 4b.
Under healthy condition, utilizing the displacements of the ball and inner/outer raceways, contact angles of the ball are expressed as follows:
α i = arctan A i 0 sin α 0 + z i + z b A i 0 cos α 0 + y b
α o = arctan A o 0 sin α 0 + z b A o 0 cos α 0 + y b
where A0 is the initial distance between curvature centers of the ball and the inner/outer raceway, α0 is the initial contact angle, zi and zb are axial displacements of the inner ring and ball, respectively and yb is the radial displacement of the ball.
As shown in Figure 4 and Figure 5, the presence of wear depth inevitably alters the original contact angle of the ball. The original contact angle can be derived based on the bearing clearance and the curvature radii of the ball and raceways. In this study, it is assumed that the wear depth affects only the curvature radii of the raceways. Accordingly, the wear behavior is considered equivalent to an increase in bearing clearance, and the worn contact angle can be expressed as:
α w 0 = cos 1 R o R i D b + d w o + i D b
where Ri/o is the inner/outer ring radius, Db is the ball diameter, i/o is the inner/outer curvature radius, dw is the depth of the local wear fault.
It should be noted that, due to the limited thickness of the solid lubrication coating, complete wear of the coating will result in a significant increase in the coefficient of friction (COF) at the contact interface. This phenomenon can be interpreted as a local variation in the traction parameters.

3. Dynamic Modelling of the Bearing

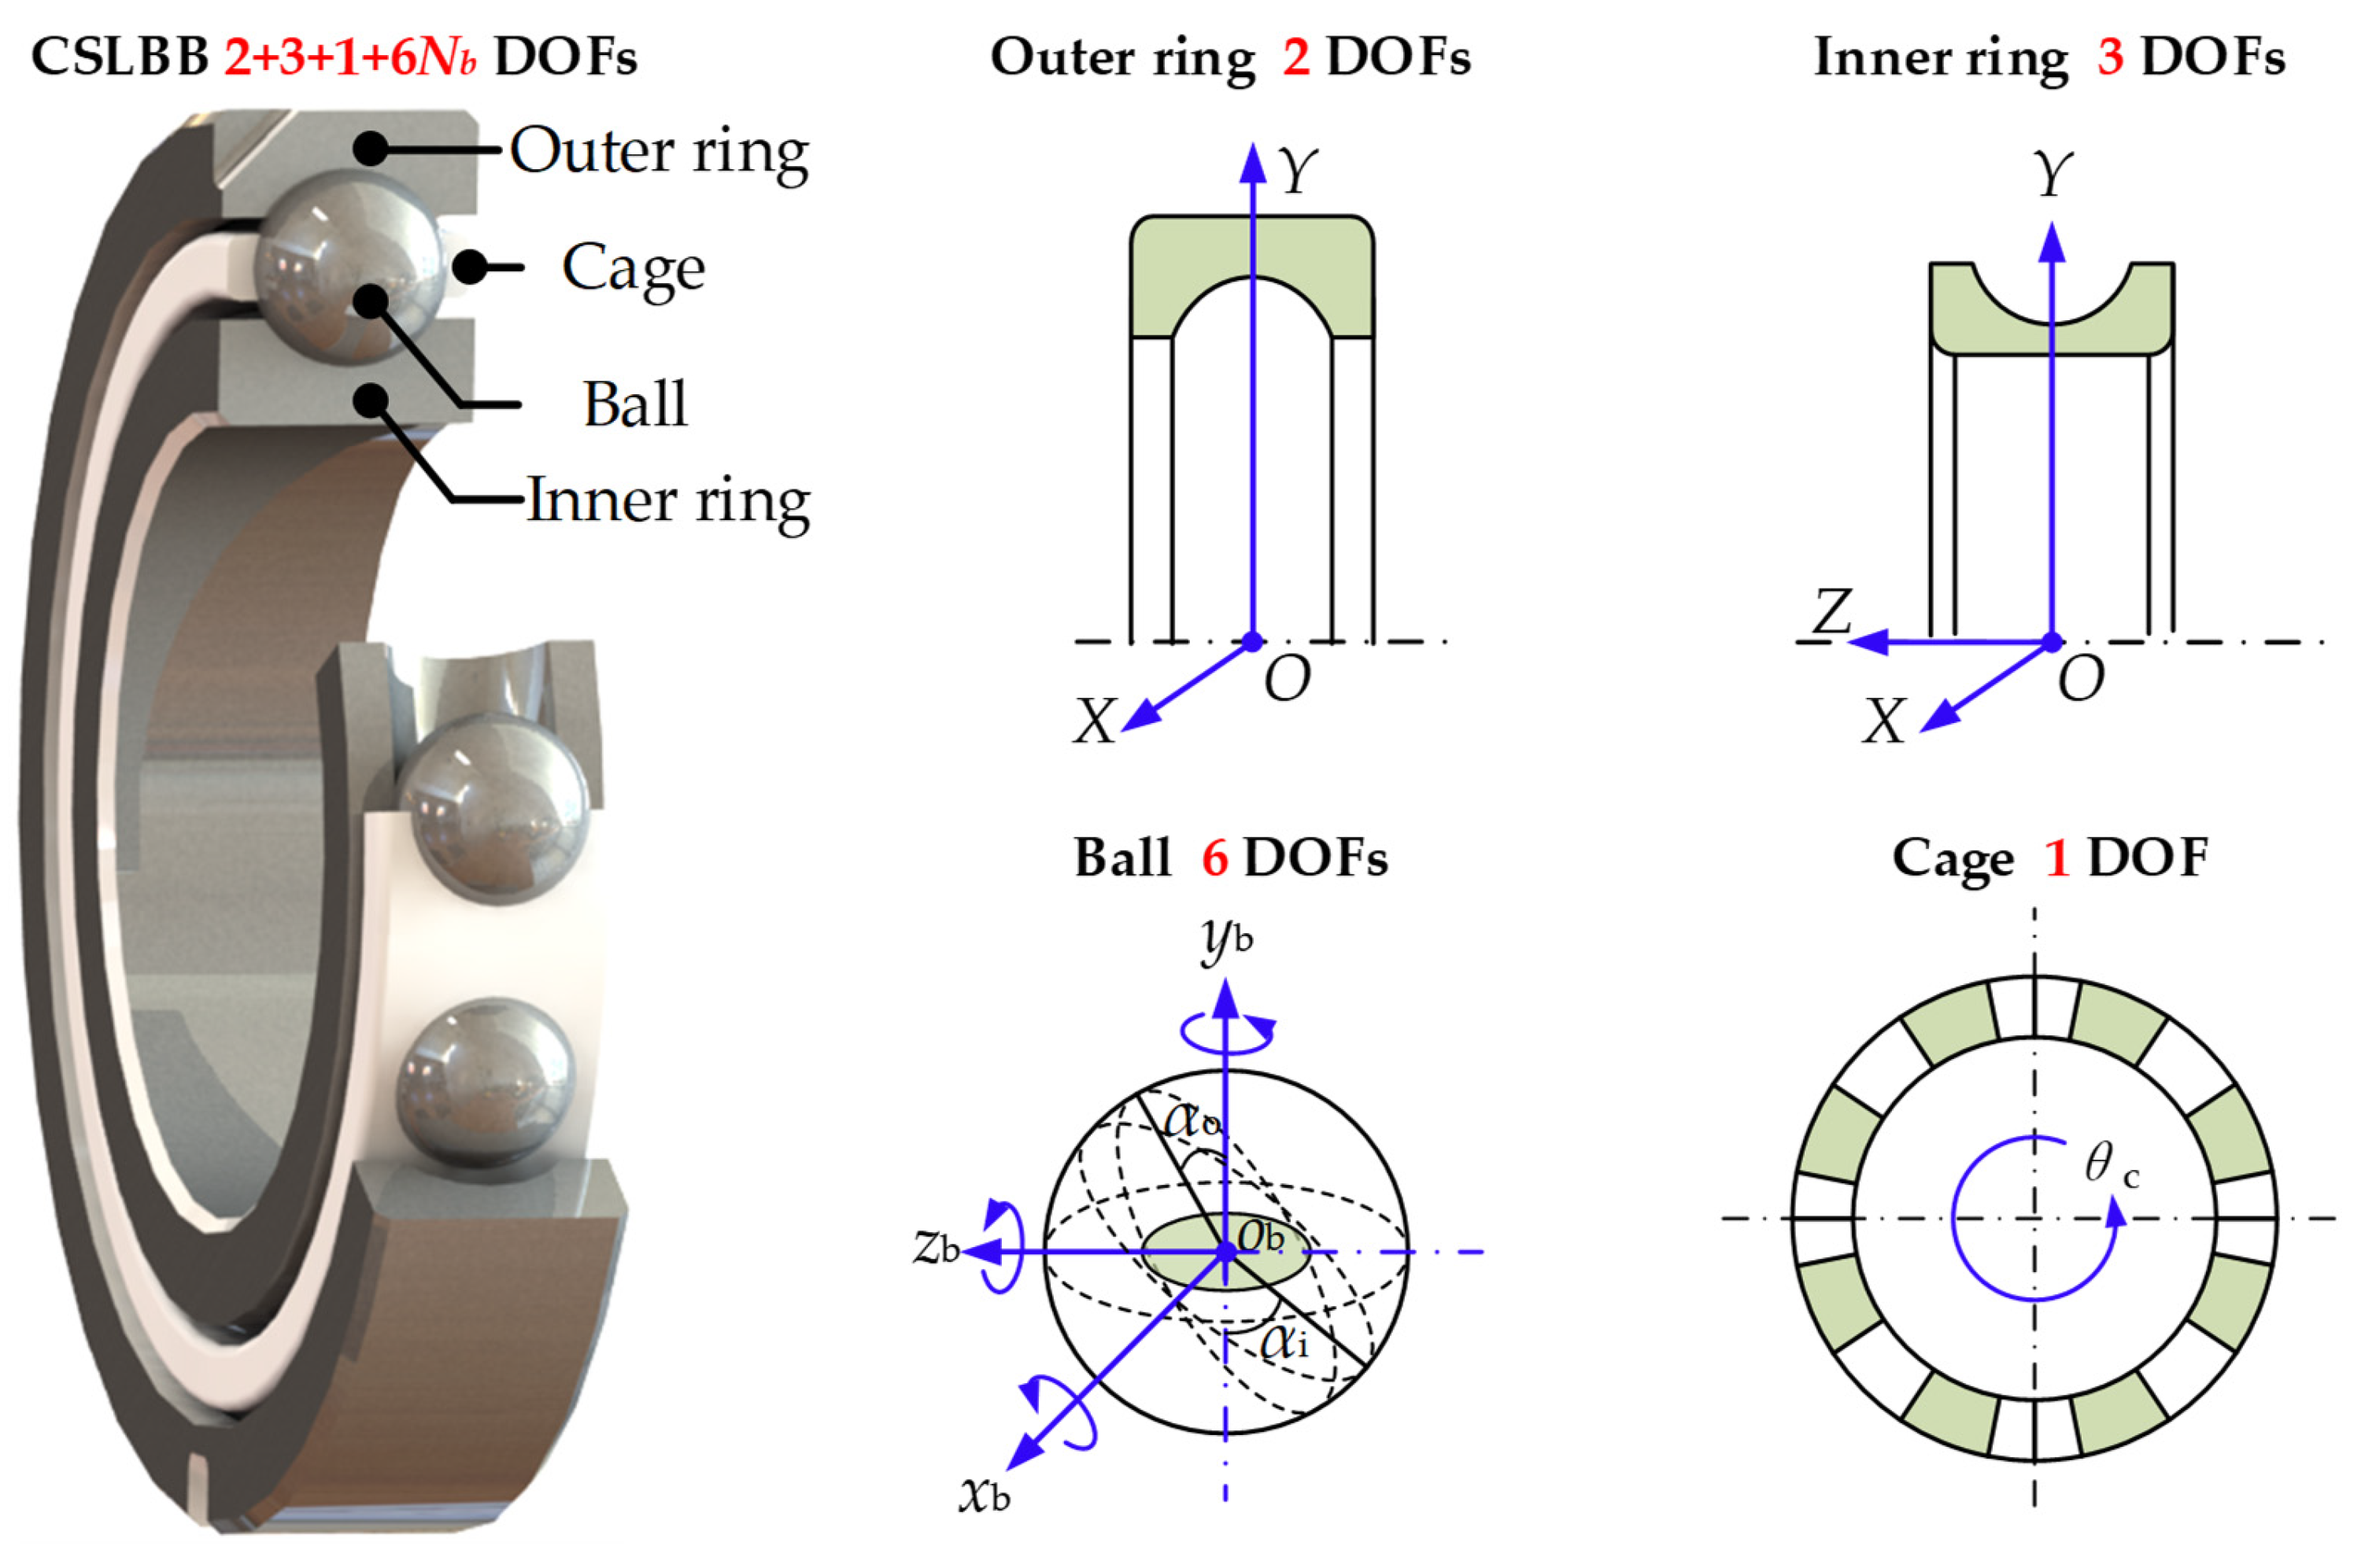
To fully consider the influence of collision force between different bearing elements, a multi-degree-of-freedom dynamic model is proposed in this section, as shown in Figure 6.
The ball has three translational and three rotational DOFs in the moving coordinate system ob-xbybzb. Differential equations of the ball are formulated as:
M b y ¨ b + C b y ˙ b = F b x = T o x + T i x + F cb + F d M b z ¨ b + C b z ˙ b = F b y = Q o cos α o + Q i cos α i + T o y sin α o + T i y sin α i + F c f cb M b r p x ¨ b + 2 M b y ˙ b ω bm = F b z = Q o sin α o + Q i sin α i T o y cos α o T i y cos α i I b θ ¨ b x = M b x = M o x + M i x M g x + M b x I b θ ¨ b y = M b y = M o z cos α o + M i z cos α i + M i y sin α i + M o y sin α o M g y + M b y I b θ ¨ b z = M b z = M o z sin α o + M i z sin α i M i y cos α i M o y cos α o M g z + M b z
where Fcb is the ball-cage collision force, Fd/Mb is hydraulic force/moment being calculated by referring to relevant equations in [30] and [38], Ti/o and Mi/o are traction forces/moments of the ball, Mg represents the gyroscopic moment of the ball.
The ball-cage collision force is a nonlinear force, which exists only when there is a collision between the ball and the cage and is expressed as:
F cb = 0 Δ θ < θ cl K cb r p Δ θ + C cb r p Δ θ ˙ Δ θ > θ cl
where rp is the pitch radius of the ball, ∆θ is the difference of angular coordinates of the ball and the cage pocket and θcl is the cage clearance.
As the cage only has a rotational DOF, its differential equation is expressed as:
I c θ ¨ c = M c + r p 2 k = 1 N b K cb Δ θ k + C cb Δ θ ˙ k
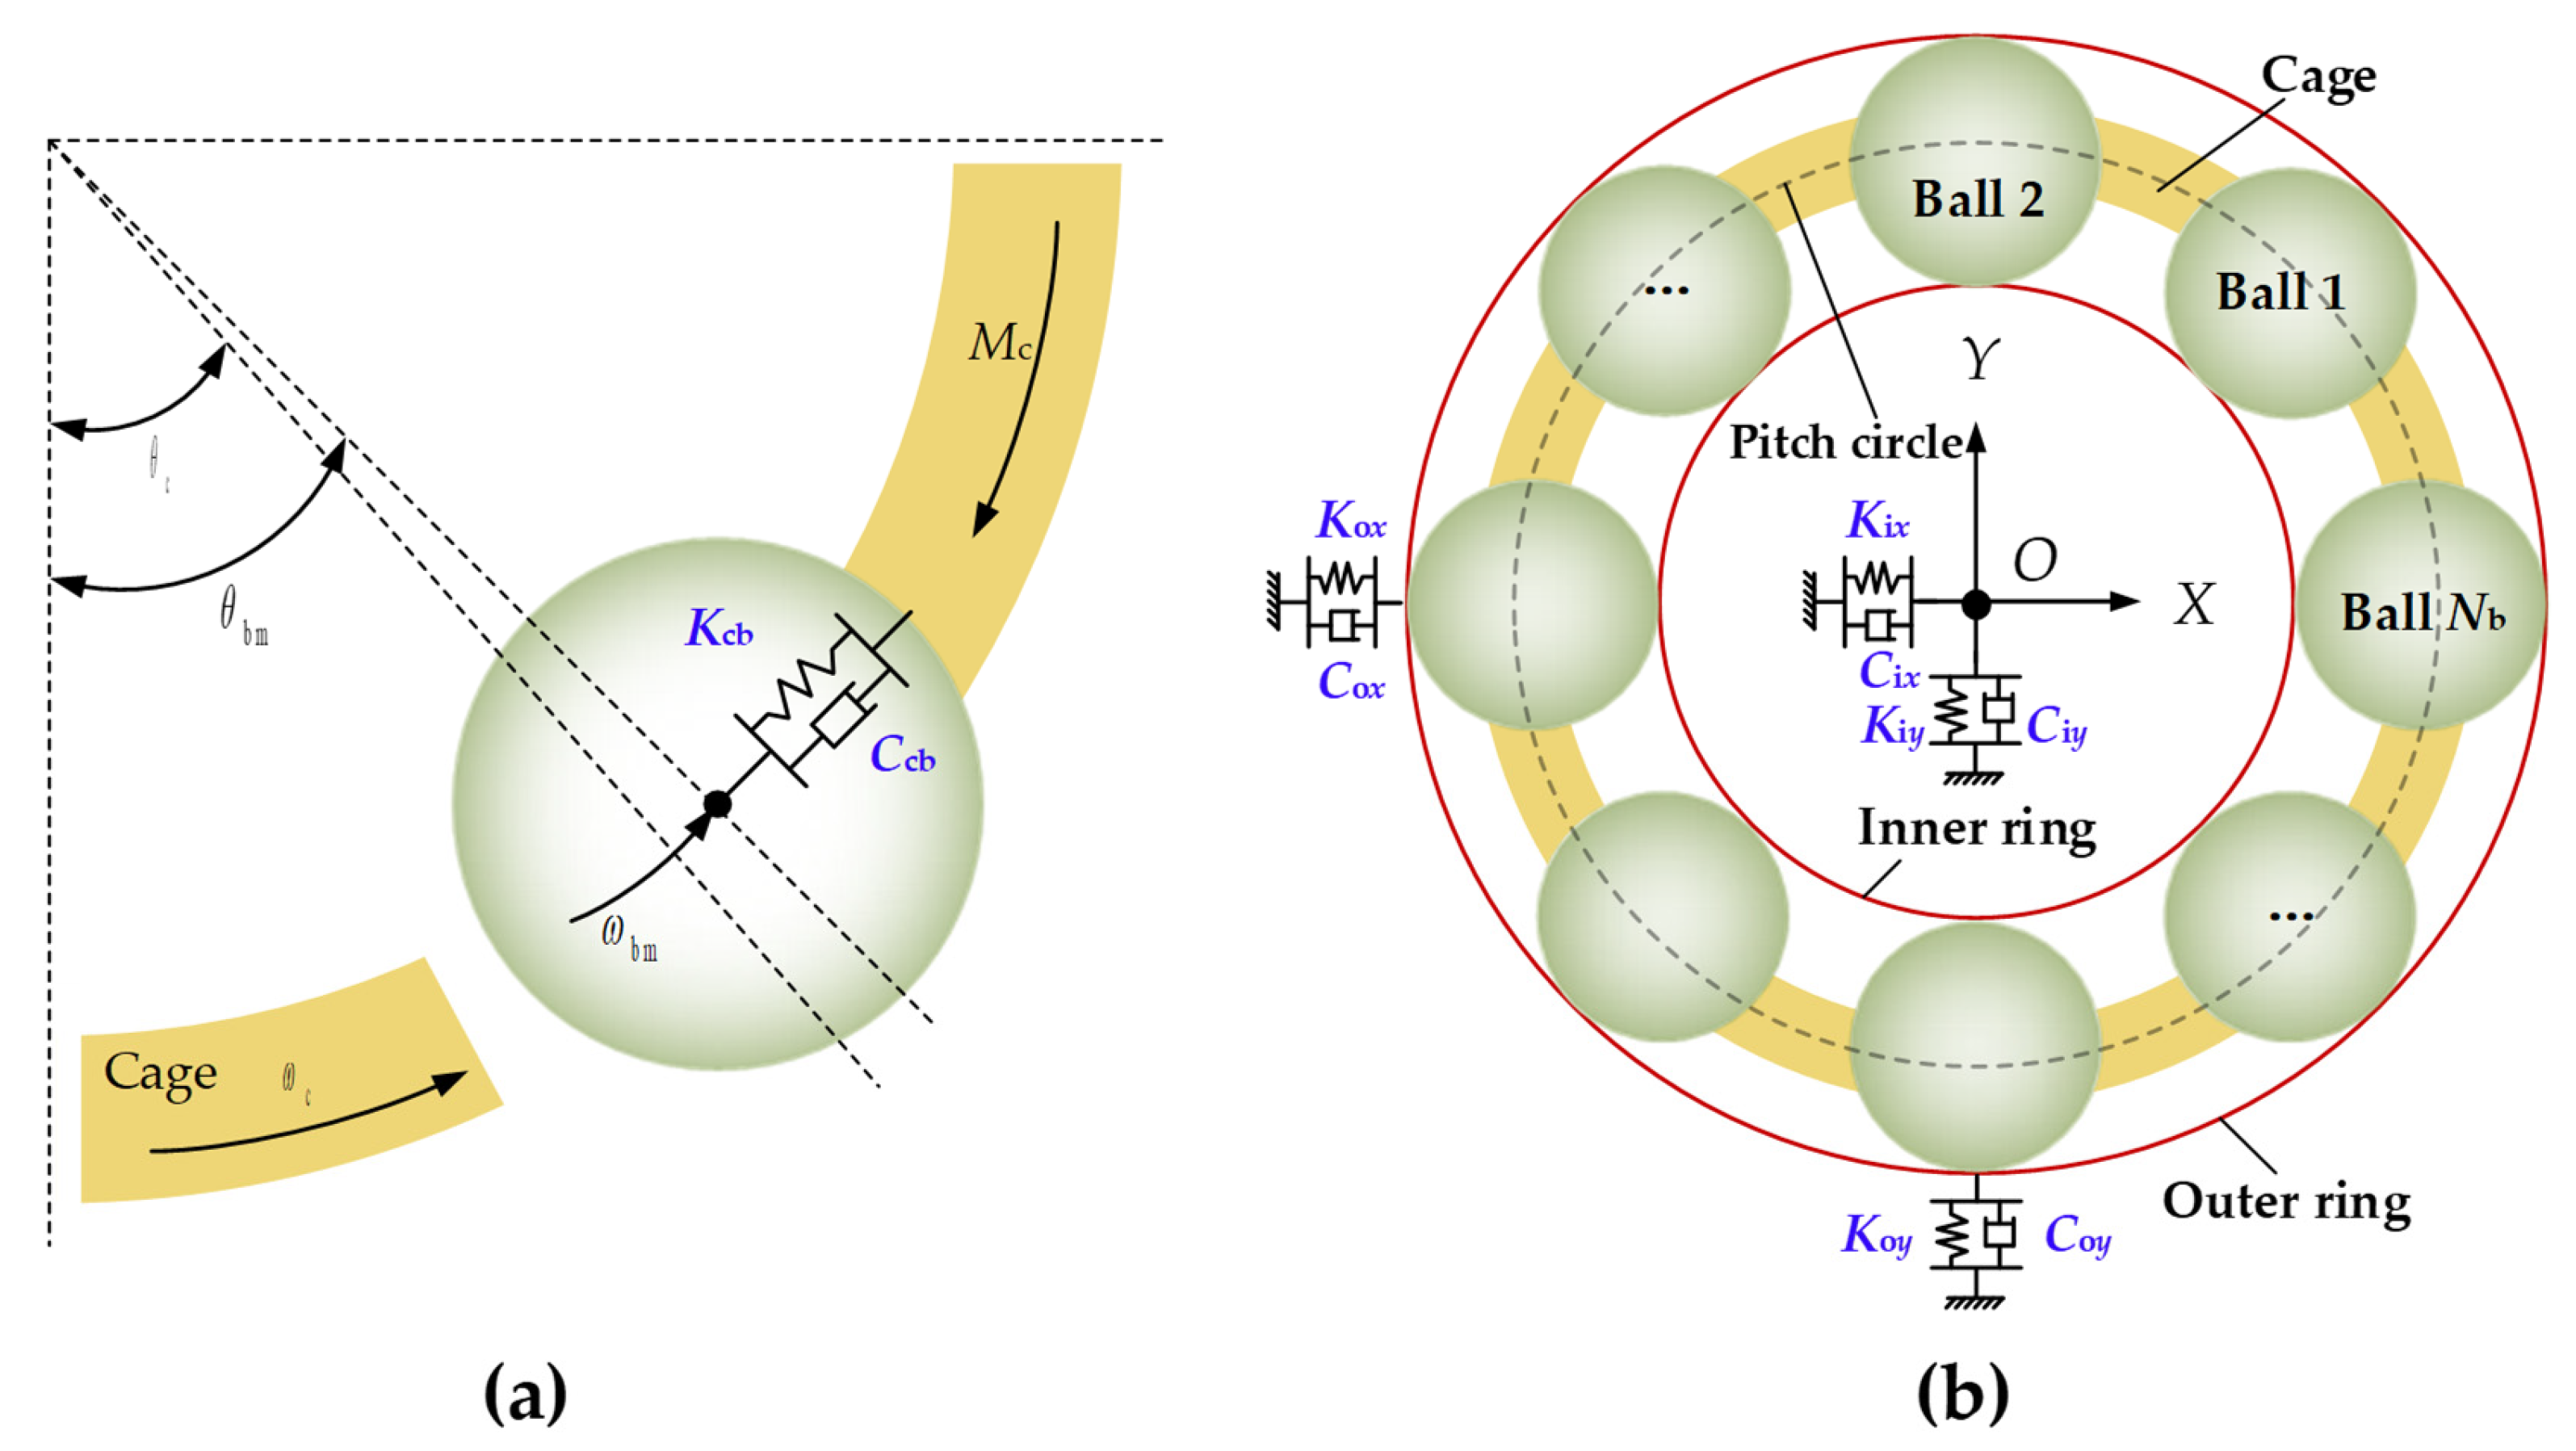
where Mc is the churning moment, Ic is the polar moment of inertia of the cage and θc is angular displacement of the cage. The ball-cage collision model is illustrated in Figure 7a.
The inner ring has three translational DOFs in three axes of the inertial coordinate system, whose differential equations are expressed as:
M i x ¨ i + C i x ˙ i + K i x i + F i x + F x = 0 M i y ¨ i + C i y ˙ i + K i y i + F i y + F y = 0 M i z ¨ i + C i z ˙ i + K i z i + F i z + F z = 0
where ΣFi is the resultant force subject from the ball in X/Y/Z direction of in the inertial coordinate system, Fx/y/z is the loads acting on the inner ring. The forces of the inner ring are derived from the contact and traction forces of the ball using a transformation matrix:
F i x F i y F i z = sin φ cos φ 0 0 0 cos φ sin φ 0 0 0 0 0 1 R i sin φ R i cos φ T T i x T i y sin α i Q i cos α i T i y cos α i Q i sin α i
where φ is the angular coordinate of the ball, Ri is the pitch radius of the inner ring. There are also two DOFs of the outer ring to simulate the acquisition of bearing vibration signals. Differential equations of the outer ring in X and Y directions in the inertial coordinate system are as below:
M o x ¨ o + C o x ˙ o + K o x o + F o x = 0 M o y ¨ o + C o y ˙ o + K o y o + F o y = 0
The forces are also transformed from the contact and traction forces of the ball:
F o x F o y F o z = sin φ cos φ 0 0 0 cos φ sin φ 0 0 0 0 0 1 R o sin φ R o cos φ T T o x T o y sin α o + Q o cos α o T o y cos α o + Q o sin α o
where Ro is the pitch radius of the outer ring. The whole dynamic system are illustrated in Figure 7b.

4. Solution Procedure and Model Validation

This section first outlines the solution strategy of the proposed tribo-dynamic model and subsequently presents its validation in two aspects: traction model validation and dynamic model validation. The traction model is verified against a set of experimental traction data reported in [25], while the dynamic model is validated by comparing the simulated cage rotational speed with results from both an existing theoretical model and cryogenic ball bearing experiments.

4.1. Model Solving

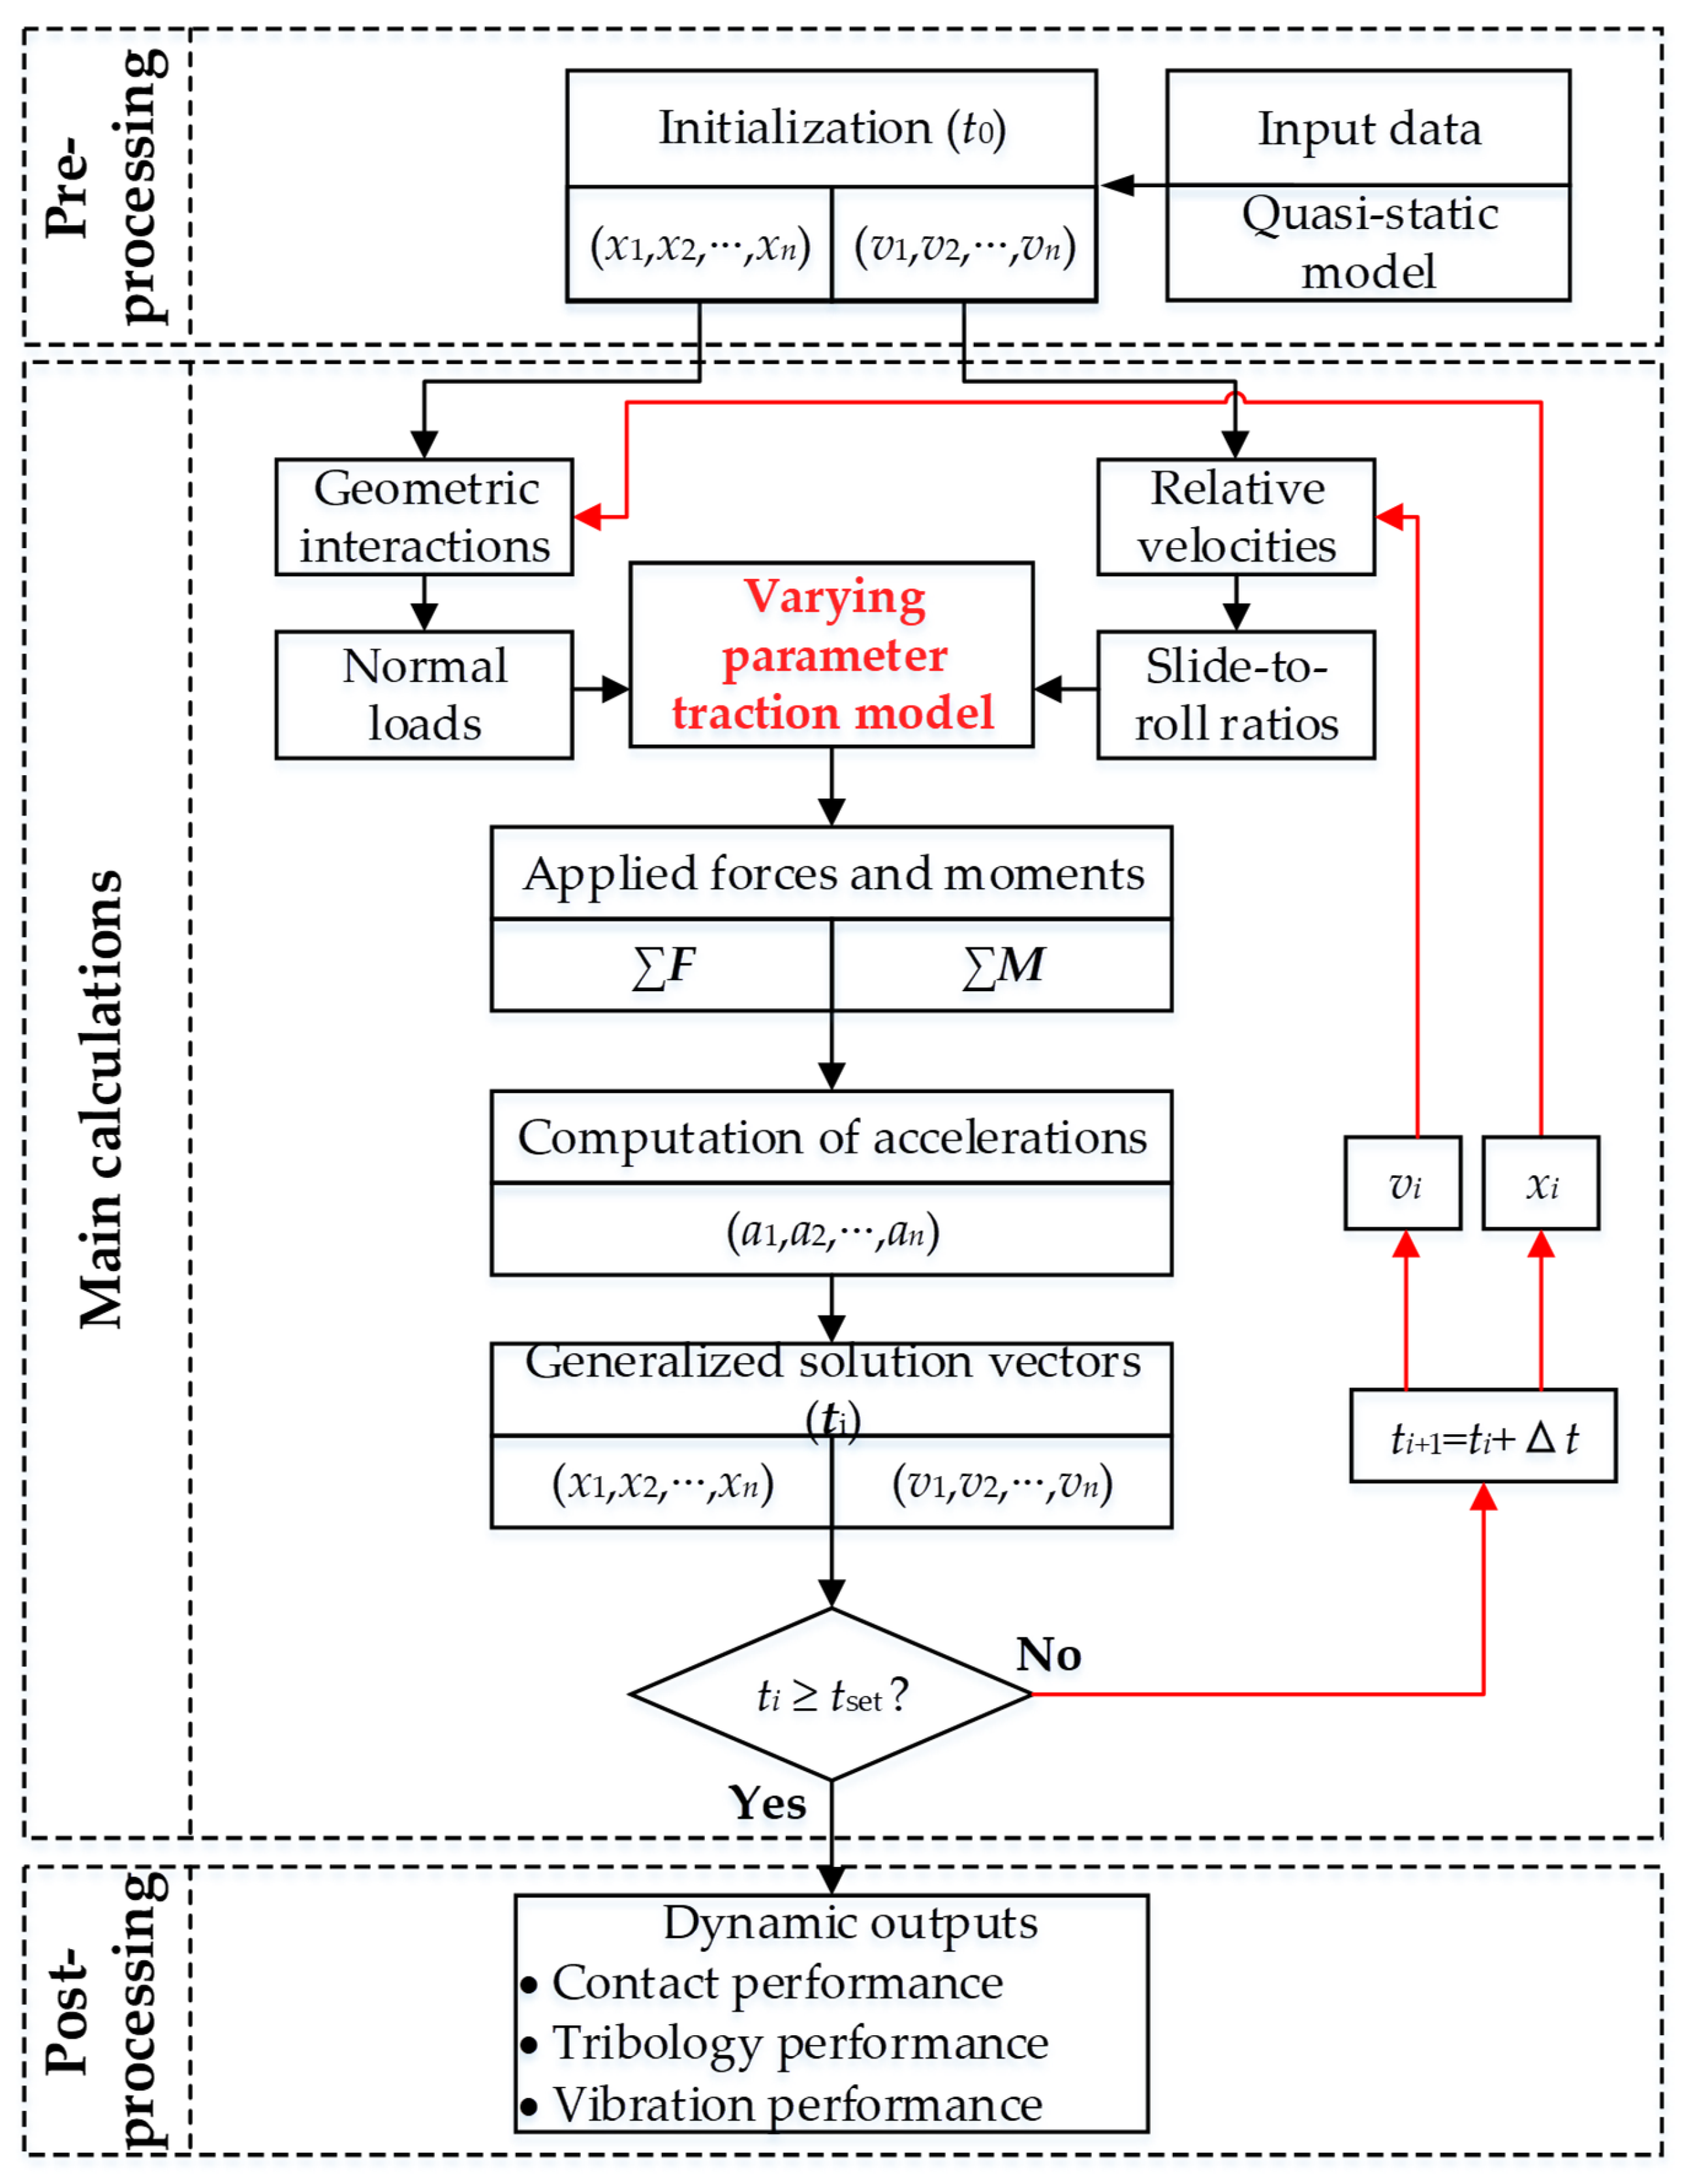
As described in Section 3, the complete dynamic system comprises 3 + 2 + 1 + 6Nb ordinary differential equations, where Nb denotes the number of balls. These equations are solved using MATLAB’s (R2024a) ODE45 solver with a fixed time step of 1 × 10⁻⁵ s. The quasi-static model proposed in [12] is utilized to compute the static responses under specified loading conditions, providing accurate estimations of the initial displacements and velocities of the balls and raceways. These results serve as refined initial guesses for the iterative solution of the dynamic model, thereby enhancing computational efficiency. At each time step, the governing variables are primarily divided into two categories: displacement variables for solving the normal contact problem, and velocity variables for addressing the tangential traction problem. While it is commonly believed that surface defects on the raceway primarily affect the normal contact force [39], in solid-lubricated REBs, wear defects may simultaneously influence both the contact and traction behaviors.
The entire solution process of the dynamic system is illustrated in Figure 8.

4.2. Traction Model Validation

Traction or friction behavior is one of the most important factors that influence the dynamic characteristics of the REB, which is however rather complicated in the CSLBBs. There are generally four types of contacts in CSLBBs, namely, pre-coated lubricated contact, self-lubricated contact, sacrificial contact and unlubricated contact. As the cage is generally made of solid lubrication material such as PTFE fabric, it is expected that the ball will scrape lubricant from the cage, which is called sacrificial contact here, when it contacts the cage and bring it into the contact between the ball and raceway to form a solid-lubricated condition. However, in early operating stage, solid lubricant from the cage is apparently insufficient to lubricate the race, therefore, the pre-processed solid coating such as Ag coating is often needed to support the early lubrication condition. With a continuous service of the bearing, the pre-processed coating and self-lubricated coating can be gradually scuffed due to the severe working condition, resulting in unlubricated or steal-to-steal contact between the ball and the raceway, which is very detrimental to the safe operation of CSLBBs.
The traction or friction behavior is one of the key factors influencing the dynamic characteristics of rolling element bearings (REBs), and it becomes particularly complex in cryogenic solid-lubricated ball bearings (CSLBBs). In CSLBBs, four typical types of contact conditions can be identified: pre-coated lubricated contact, self-lubricated contact, sacrificial contact, and unlubricated contact. The bearing cage is typically fabricated from solid lubricant materials, such as PTFE fabric. When the ball comes into contact with the cage, it is expected to scrape lubricant from the cage surface and carry it into the ball–raceway contact region—this process is referred to here as sacrificial contact. However, during the early stage of operation, the amount of lubricant scraped from the cage is often insufficient to ensure stable lubrication. Therefore, a pre-applied solid lubricant coating, such as silver (Ag) compound, is commonly used to provide initial lubrication. As the bearing continues to operate under harsh conditions, both the pre-coated and self-lubricating films are gradually worn away. Eventually, this leads to unlubricated or metal-to-metal (steel-to-steel) contact between the ball and the raceway, which severely compromises the lubrication performance and poses a significant risk to the safe operation of CSLBBs.
To establish a traction model suitable for integration into the dynamic simulation of cryogenic solid-lubricated ball bearings (CSLBBs), Liu et al. [22] developed a custom tribometer to experimentally measure the traction coefficient of friction (COF) under ball-on-plate contact conditions in a cryogenic environment. Building upon this experimental foundation, Zhang et al. [25] investigated the power loss characteristics of cryogenic rolling element bearings (REBs) by developing a dynamic model calibrated with the measured traction data. In their study, the COF was measured under various slide-to-roll ratios, and the resulting traction curves were fitted using the Kragelskii traction model, as defined in Equation (1). The identified traction parameters obtained from this fitting process are presented in Figure 9.
Using the traction parameters reported in [25], the proposed traction model is validated for two types of solid lubrication coatings under contact pressures of 2.5 GPa, 3.0 GPa, and 3.5 GPa, respectively. The experimental and simulation conditions are summarized in Table 1, while the corresponding fitted Kragelskii traction parameters are listed in Table 2. The results show that the maximum fitting error for the Ag-coated sample is limited to 18.6001%, whereas the PTFE-coated sample demonstrates a significantly lower maximum error of 1.8023%, indicating better agreement between the model and experimental data for the latter.
As shown in Figure 9, an increase in contact pressure consistently reduces the traction coefficient of friction (COF). The traction COF initially increases almost linearly with increasing relative sliding velocity and then gradually decreases, clearly reflecting the two distinct phases of rolling contact friction—tangential elastic deformation and the so-called falling friction behavior. The fitted curves accurately capture the experimental trends and closely match the simulation results, thereby validating the proposed traction model.
Interestingly, the slope of the COF curves for the PTFE coating is steeper than that for the Ag coating, indicating that the Ag coating exhibits a greater tangential elasticity.

4.3. Bearing Model Validation

4.3.1. Test Rig Description

Mao et al. [40] designed and established a cryogenic test rig to test the reliability of the CSLBB, as shown in Figure 10. The tester mainly consists of four parts, namely, driving system, testing system, fluid providing system and data acquisition system.
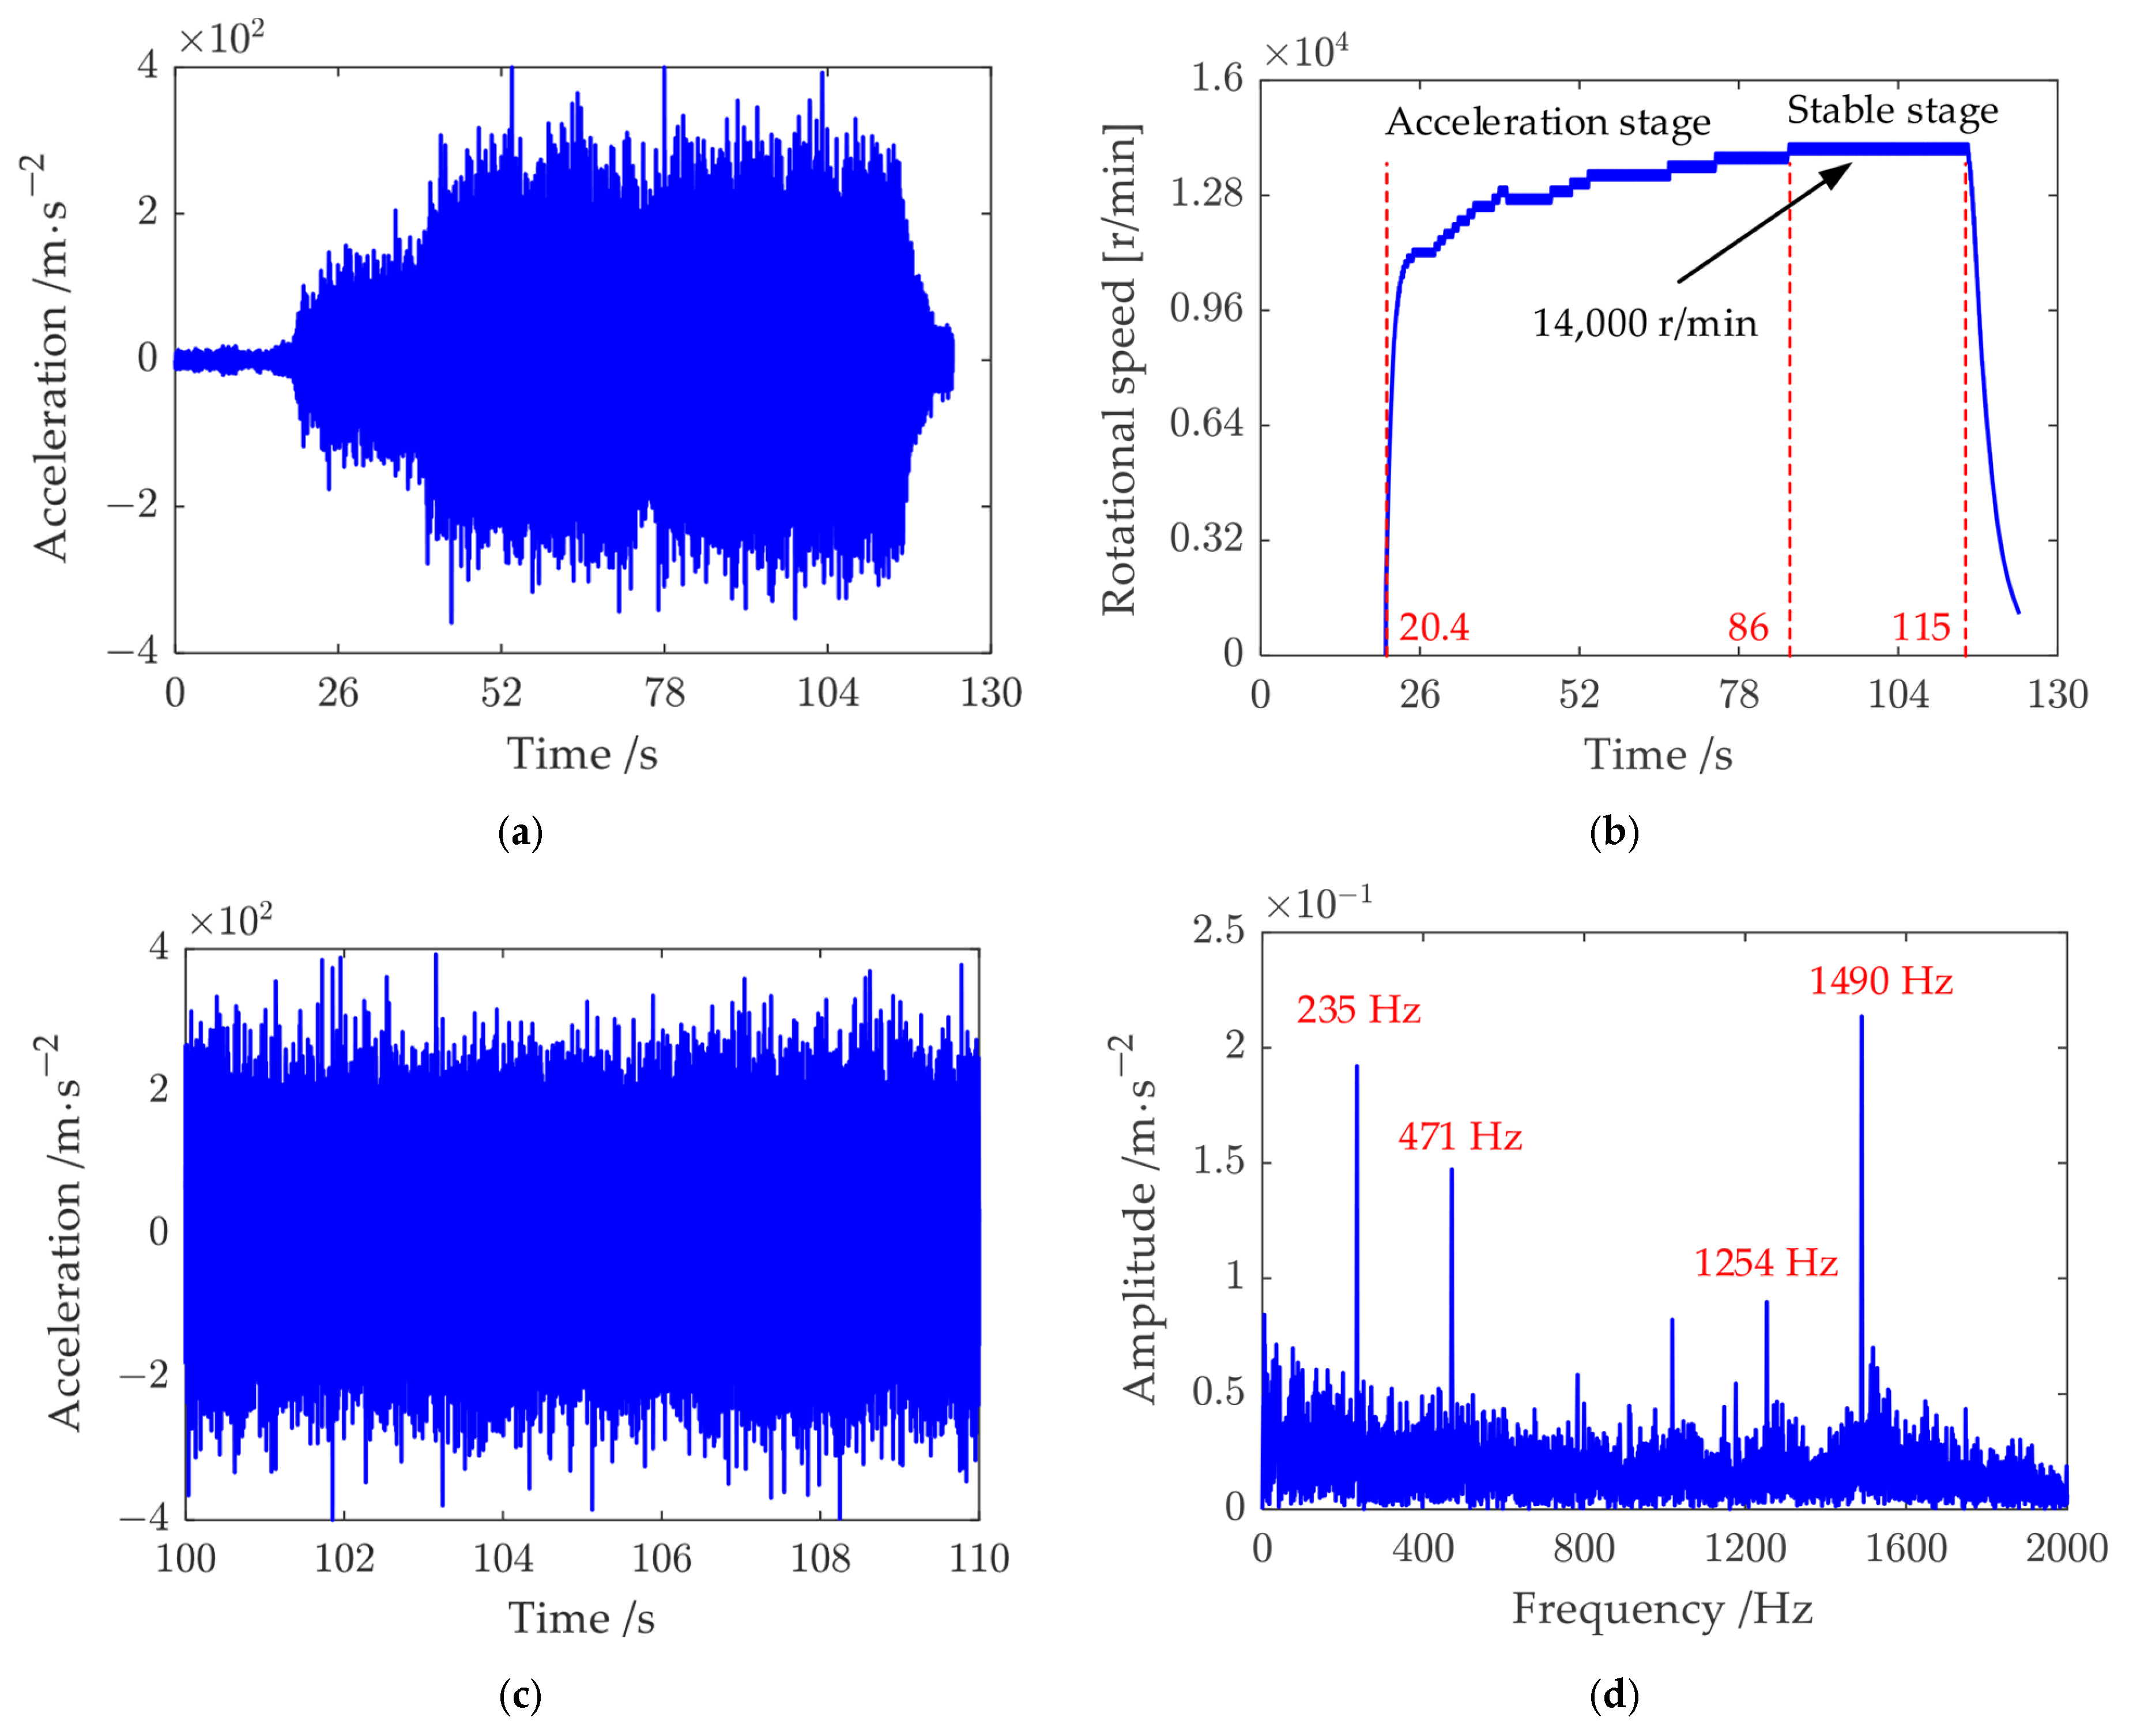
The testing bearing is a ball bearing lubricated by the Ag coating with a thickness of 10 μm as well as a self-lubricating cage made of PTFE fabric. The bearing operates in a LN2 environment with a temperature of −196 °C. Geometry and operating parameters of the testing bearing are listed in Table 3. The tester is driven by the air turbine to speed up from zero to 14,000 r/min in tens of minutes and then stays unchanged. The vibration acceleration and key phase data is collected by the sensors installed on the shell near the testing bearing and the sampling frequency is 25.6 kHz.

4.3.2. Experimental Data Analysis

The complete vibration signal is presented in Figure 11a, which displays an increasing trend from the outset. According to the rotational speed data derived from the key phase signal, the test rig undergoes a rapid acceleration to over 10,000 r/min within approximately 10 s, followed by a more gradual acceleration phase. As shown in Figure 11b, it takes around 70 s for the system to reach the final speed of approximately 14,000 r/min. Due to the complexity of the test system, direct measurement of the cage rotational speed is challenging. Instead, the cage speed is estimated from a signal processing perspective, utilizing the steady-state portion of the vibration signal, as illustrated in Figure 11c.
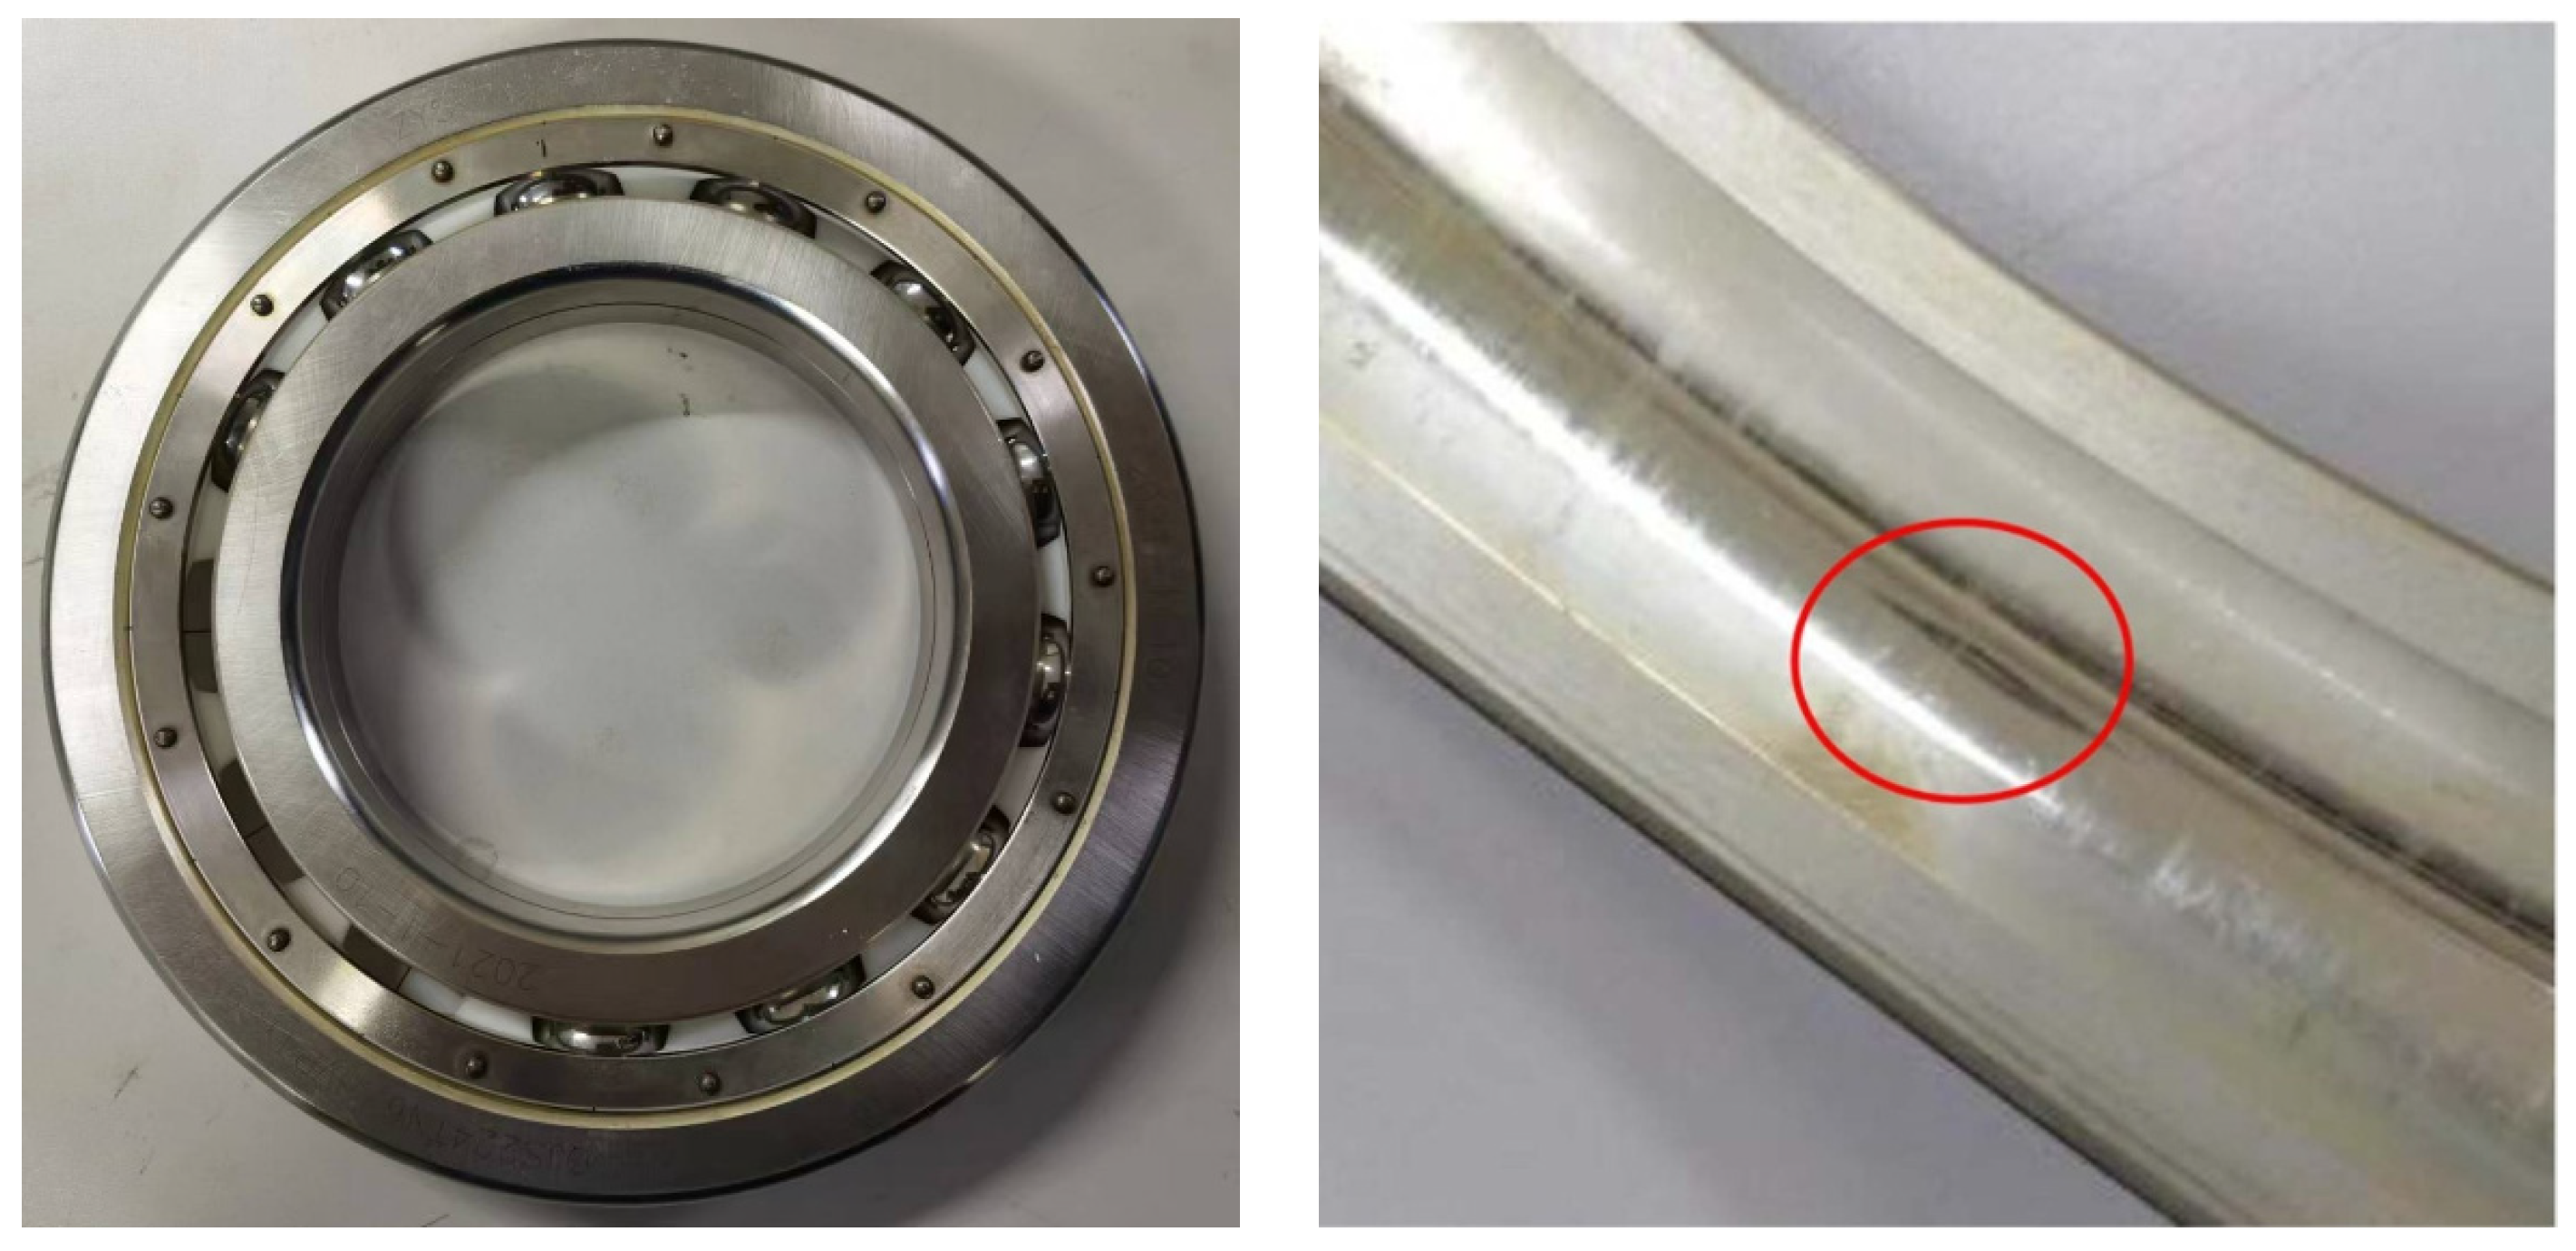
Due to the interference of fluid excitation, the original vibration signal contains a large amount of noise. Therefore, the signal is first denoised and then demodulated, finally the fast Fourier transform (FFT) spectrum is given in Figure 11d. As can be seen in Figure 11d, there are mainly two frequency components in the frequency spectrum, that is, 233 Hz and 1254 Hz and their multipliers. While it is clear that 233 Hz corresponds the rotational speed of the inner ring, 1254 Hz is the outer ring fault (ORF) frequency calculated by 5.31fr where fr is the inner ring rotational frequency. By observing the outer ring after the experiment, it is found that there is indeed a defect fault on the outer raceway, as shown in Figure 12. Based on the fact that the ORF is actually the product of the cage rotational frequency and the ball number, the cage rotational speed can be calculated as 1254/Nb × 60 = 5788 r/min.
Due to fluid excitation interference, the original vibration signal contains considerable noise. Therefore, the signal was first denoised and then demodulated, and the resulting fast Fourier transform (FFT) spectrum is presented in Figure 11d. As shown in Figure 11d, two dominant frequency components appear in the spectrum at approximately 233 Hz and 1254 Hz, along with their harmonics. The 233 Hz frequency corresponds to the rotational speed of the inner ring, while the 1254 Hz component matches the outer ring fault (ORF) frequency, calculated as 5.31fr, where fr is the inner ring rotational frequency. Post-experiment inspection of the outer ring confirmed the presence of a defect on the outer raceway, as illustrated in Figure 12. Given that the ORF equals the product of the cage rotational frequency and the ball number, the cage rotational speed is calculated as 1254 N b   ×   60   =   5788 r/min.

4.3.3. Model Validation

The simulated outer ring vibration signal is presented in Figure 13a. It can be observed that the system converges within approximately 0.1 s, after which the vibration acceleration amplitude stabilizes at around 5 m/s2. The frequency spectrum of the steady-state signal reveals a single dominant frequency component at 1260 Hz, which closely matches the bearing’s outer ring fault (ORF) frequency. The difference between the simulated and experimental ORF frequencies is only 0.48%, confirming the accuracy of the dynamic model. Additionally, the actual cage rotational speed is shown in Figure 13b, where the ball orbital rotational speed ranges between 5810 r/min and 5844 r/min, exhibiting an error of less than 1% compared to the experimental measurements.
To validate the influence of varying traction and differential slip, based on the quasi-static model, cage rotational speeds of the bearing under different cases are compared, as listed Table 4. Descriptions of these cases are as follows:
(a) QSJH: Quasi-static Jones-Harris (QSJH) model under outer raceway control hypothesis (unable to consider the traction effect);
(b) case 1: Quasi-static (QS) model with varying traction effect and differential slip;
(c) case 2: QS model with differential slip and without varying traction effect;
(d) case 3: QS model with varying traction effect and without differential slip;
(e) case 4: QS model without varying traction effect and differential slip;
(f) Dynamic: dynamic model considering all factors including varying traction effect and differential slip.
The cage speed errors reported in Table 4 represent the average deviation of the orbital speeds of all 13 balls, calculated relative to the cage speed obtained from experimental measurements. It is evident that models incorporating variable drag effects and differential sliding—whether quasi-static (QS) or dynamic—achieve the highest computational accuracy. The results demonstrate that accounting for both variable drag and differential sliding improves the accuracy of cage speed predictions by at least 1%.

5. Numerical Results and Discussion

In this section, both the stable (quasi-static) and transient dynamic behaviors of the bearing are investigated using the quasi-static and dynamic model, respectively. The quasi-static model offers computational efficiency, making it suitable for studying the effects of various parameters. Since this model accounts for the inertial forces and moments of the balls and provides results for balls at different azimuthal positions, its outputs are regarded as representing steady-state dynamics. In contrast, the transient dynamic model incorporates not only inertial forces and moments but also interactions such as collisions between bearing components, resulting in time-dependent dynamic responses.

5.1. Steady-State Dynamic Characteristics of the Bearing

5.1.1. Contact Performance of the Ball

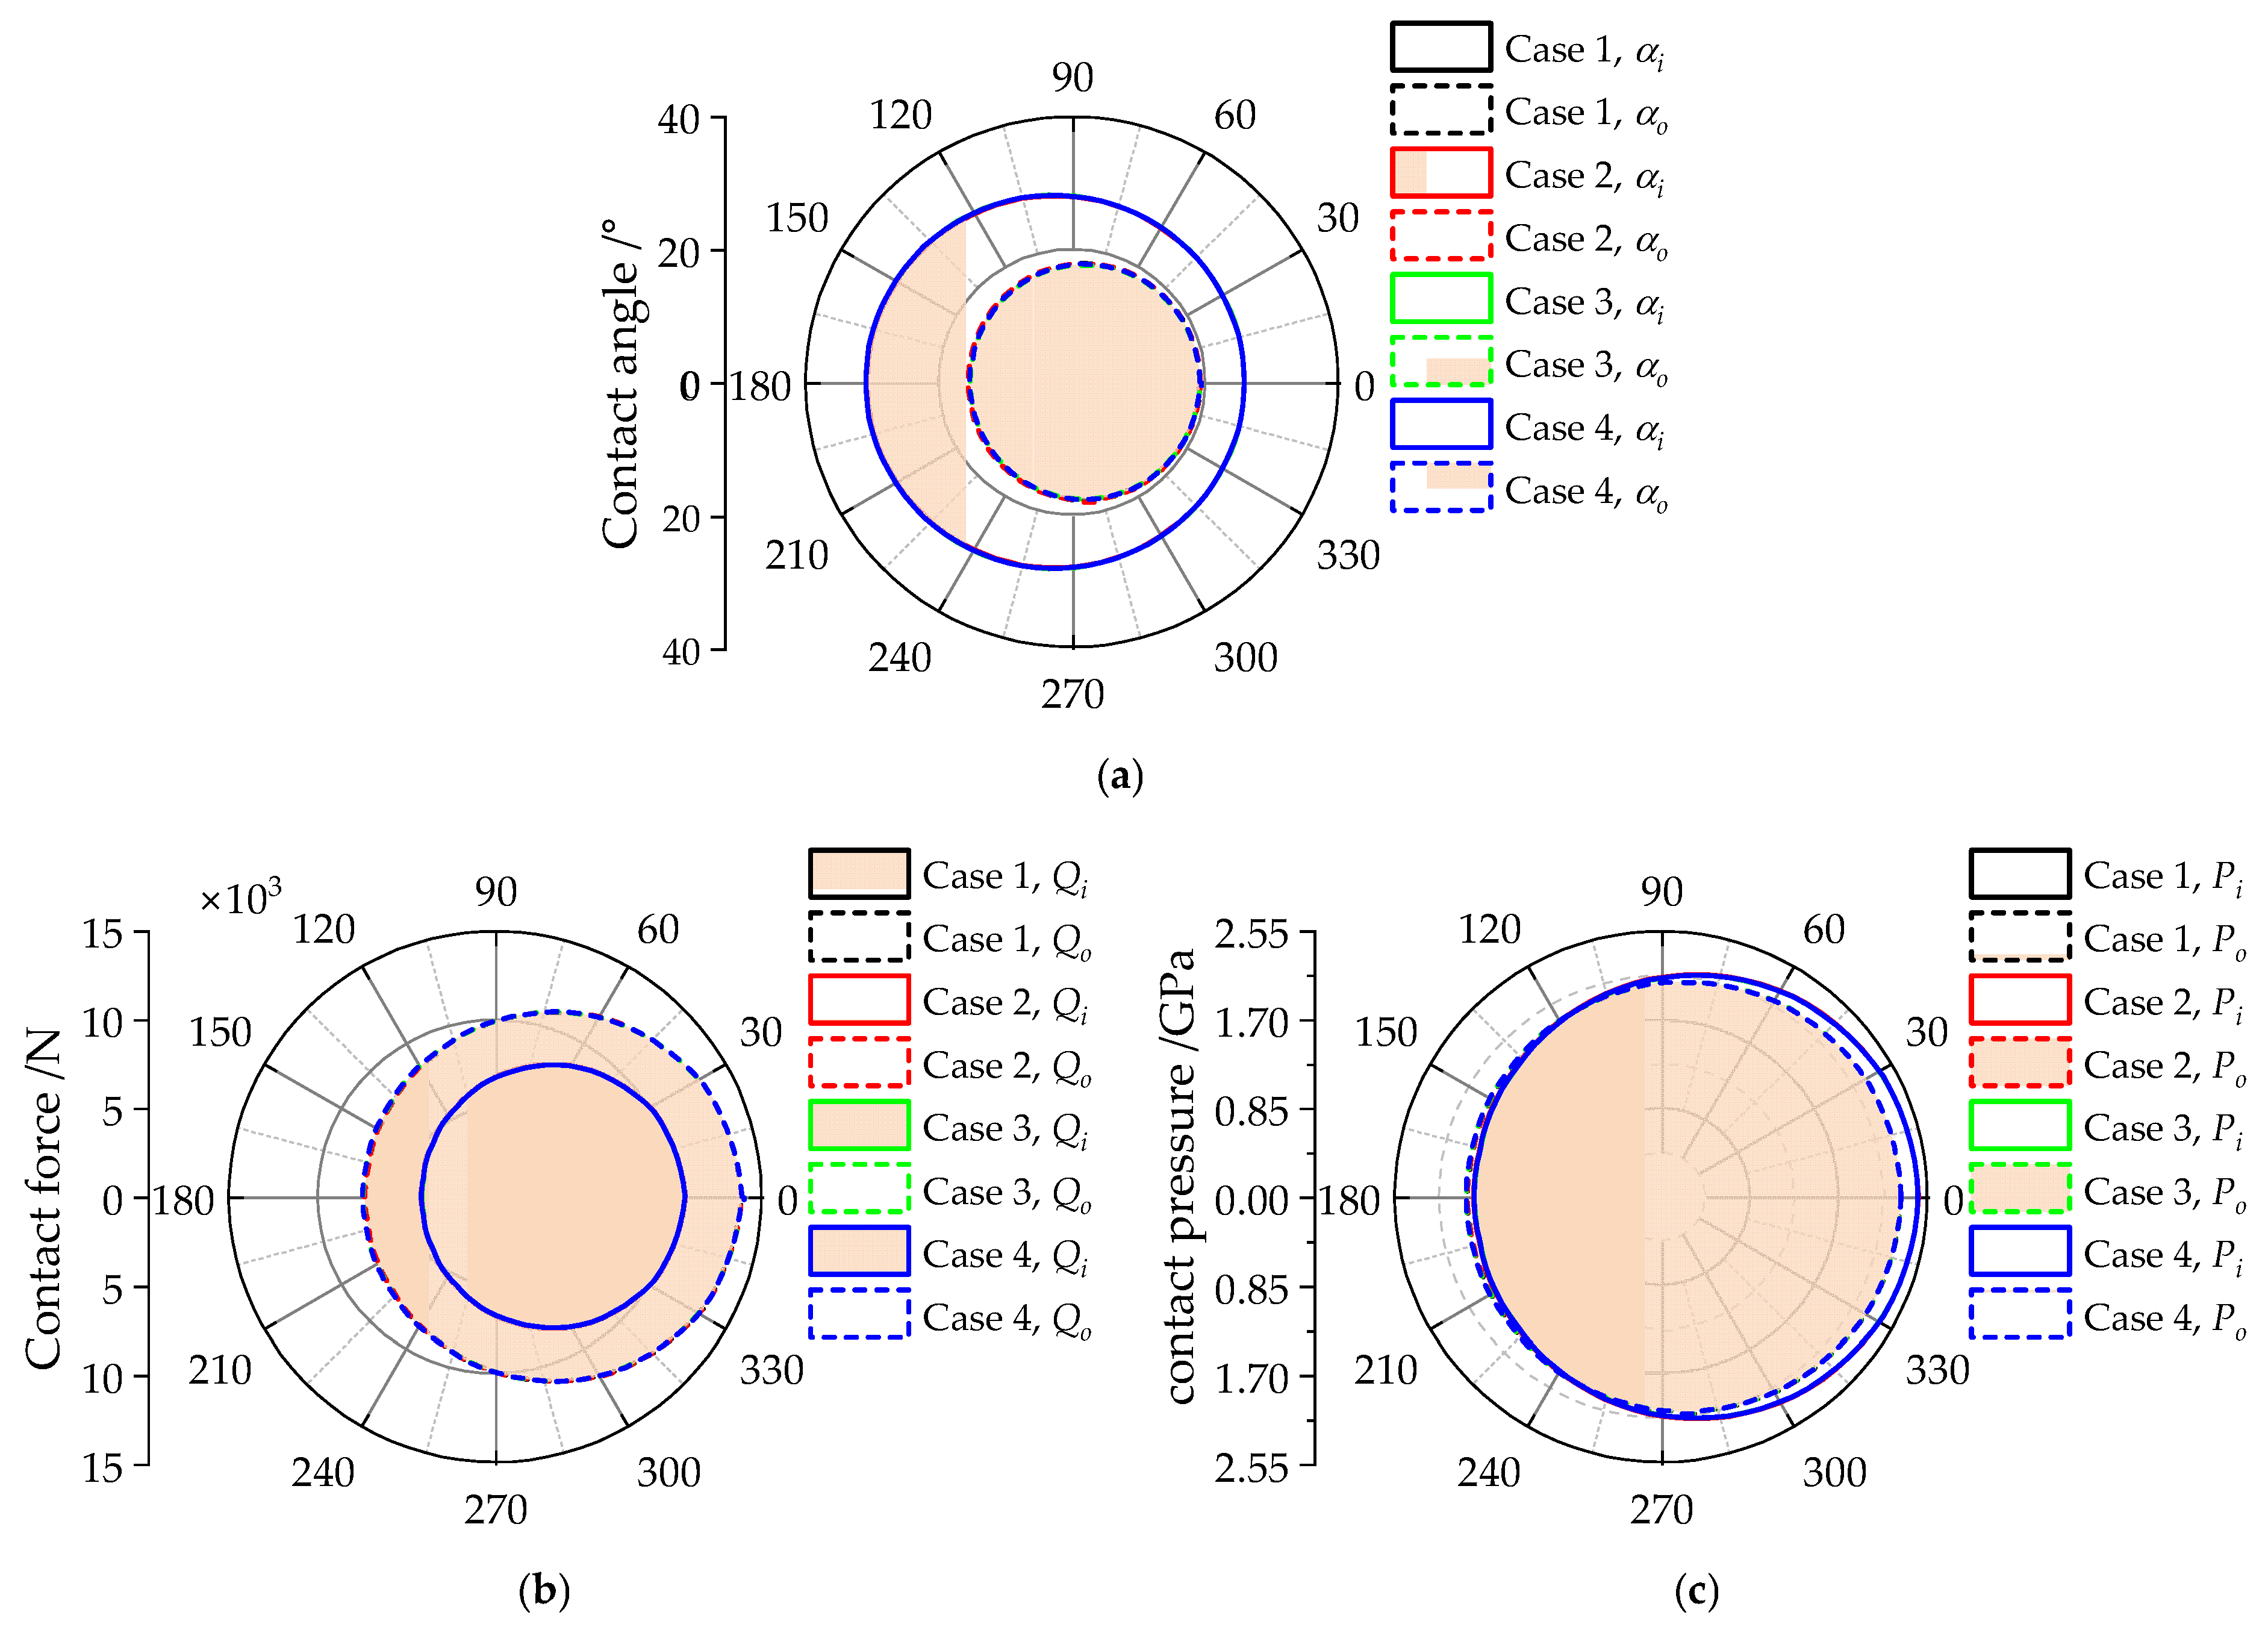
Figure 14 presents the contact performance of the ball through polar plots, illustrating the inner and outer contact angles, contact deformation, contact force, and contact stress. As shown, the contact angles and contact forces obtained from the four cases are nearly identical, indicating that the varying traction effect and differential slip have a negligible impact on ball contact performance. Due to the high centrifugal force at elevated operating speeds, the outer contact force is significantly greater than the inner contact force. Furthermore, under radial load, the maximum contact force in the heavily loaded zone is nearly twice that in the lightly loaded zone, as depicted in Figure 14b. Although the outer contact force exceeds the inner contact force across all azimuth positions, the inner contact pressure is slightly higher in most azimuthal locations, as shown in Figure 14c and Table 5. This is attributed to the concave nature of the ball–inner raceway contact, which results in a smaller contact area compared to the ball–outer raceway contact, thereby increasing the Hertzian contact pressure.
Using the experimental traction data parameters Sm, Km and K reported in [25], the fitted parabolic curves for the Ag coating traction data are presented in Figure 15. These curves enable the Kragelskii traction parameters to be updated dynamically at each iterative step during model solution. As shown in Figure 14c, the contact stress on the ball varies between 1.79 GPa and 2.46 GPa. To ensure that the traction parameters remain consistent with the experimental data, the applicable range of the fitted functions is restricted to 1.5 GPa to 4 GPa.

5.1.2. Tribology and Wear Performance

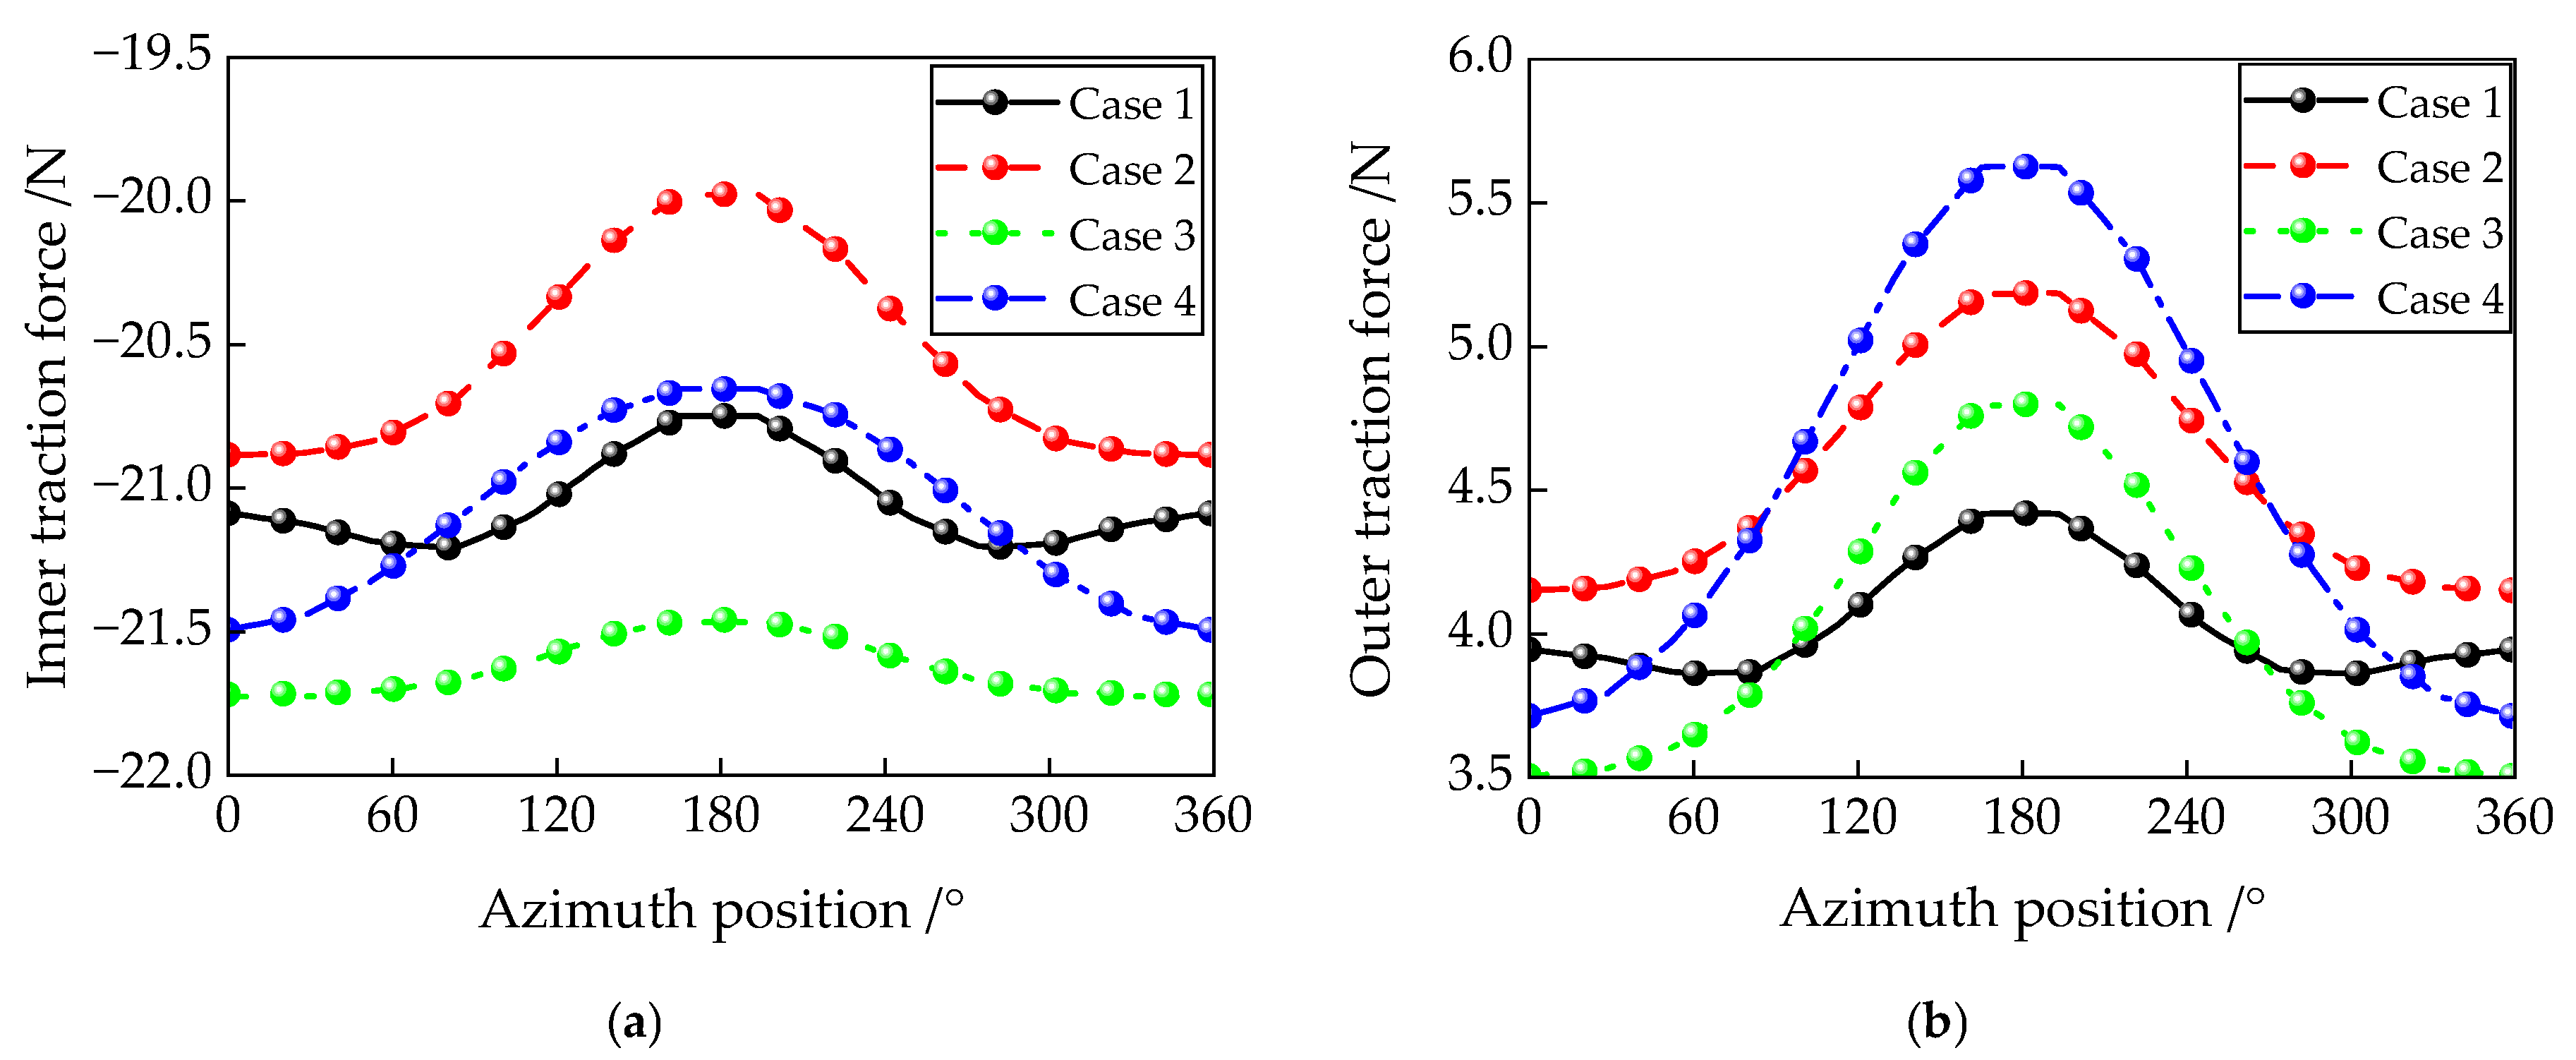
Figure 16 illustrates the inner and outer longitudinal traction forces Tx of the ball at different azimuth positions. The magnitude of the inner traction force decreases from the heavily loaded zone (−90° to 90°) to the lightly loaded zone (90° to 270°), whereas the outer traction force exhibits the opposite trend, increasing over the same range. The fluctuations in cases 1 and 3 (which incorporate varying traction effects) are smaller than those in cases 2 and 4 (which do not consider varying traction effects). This behavior, as seen in Figure 16, can be attributed to the higher contact pressure in the heavily loaded zone, which reduces the traction coefficient and consequently lowers the traction force.
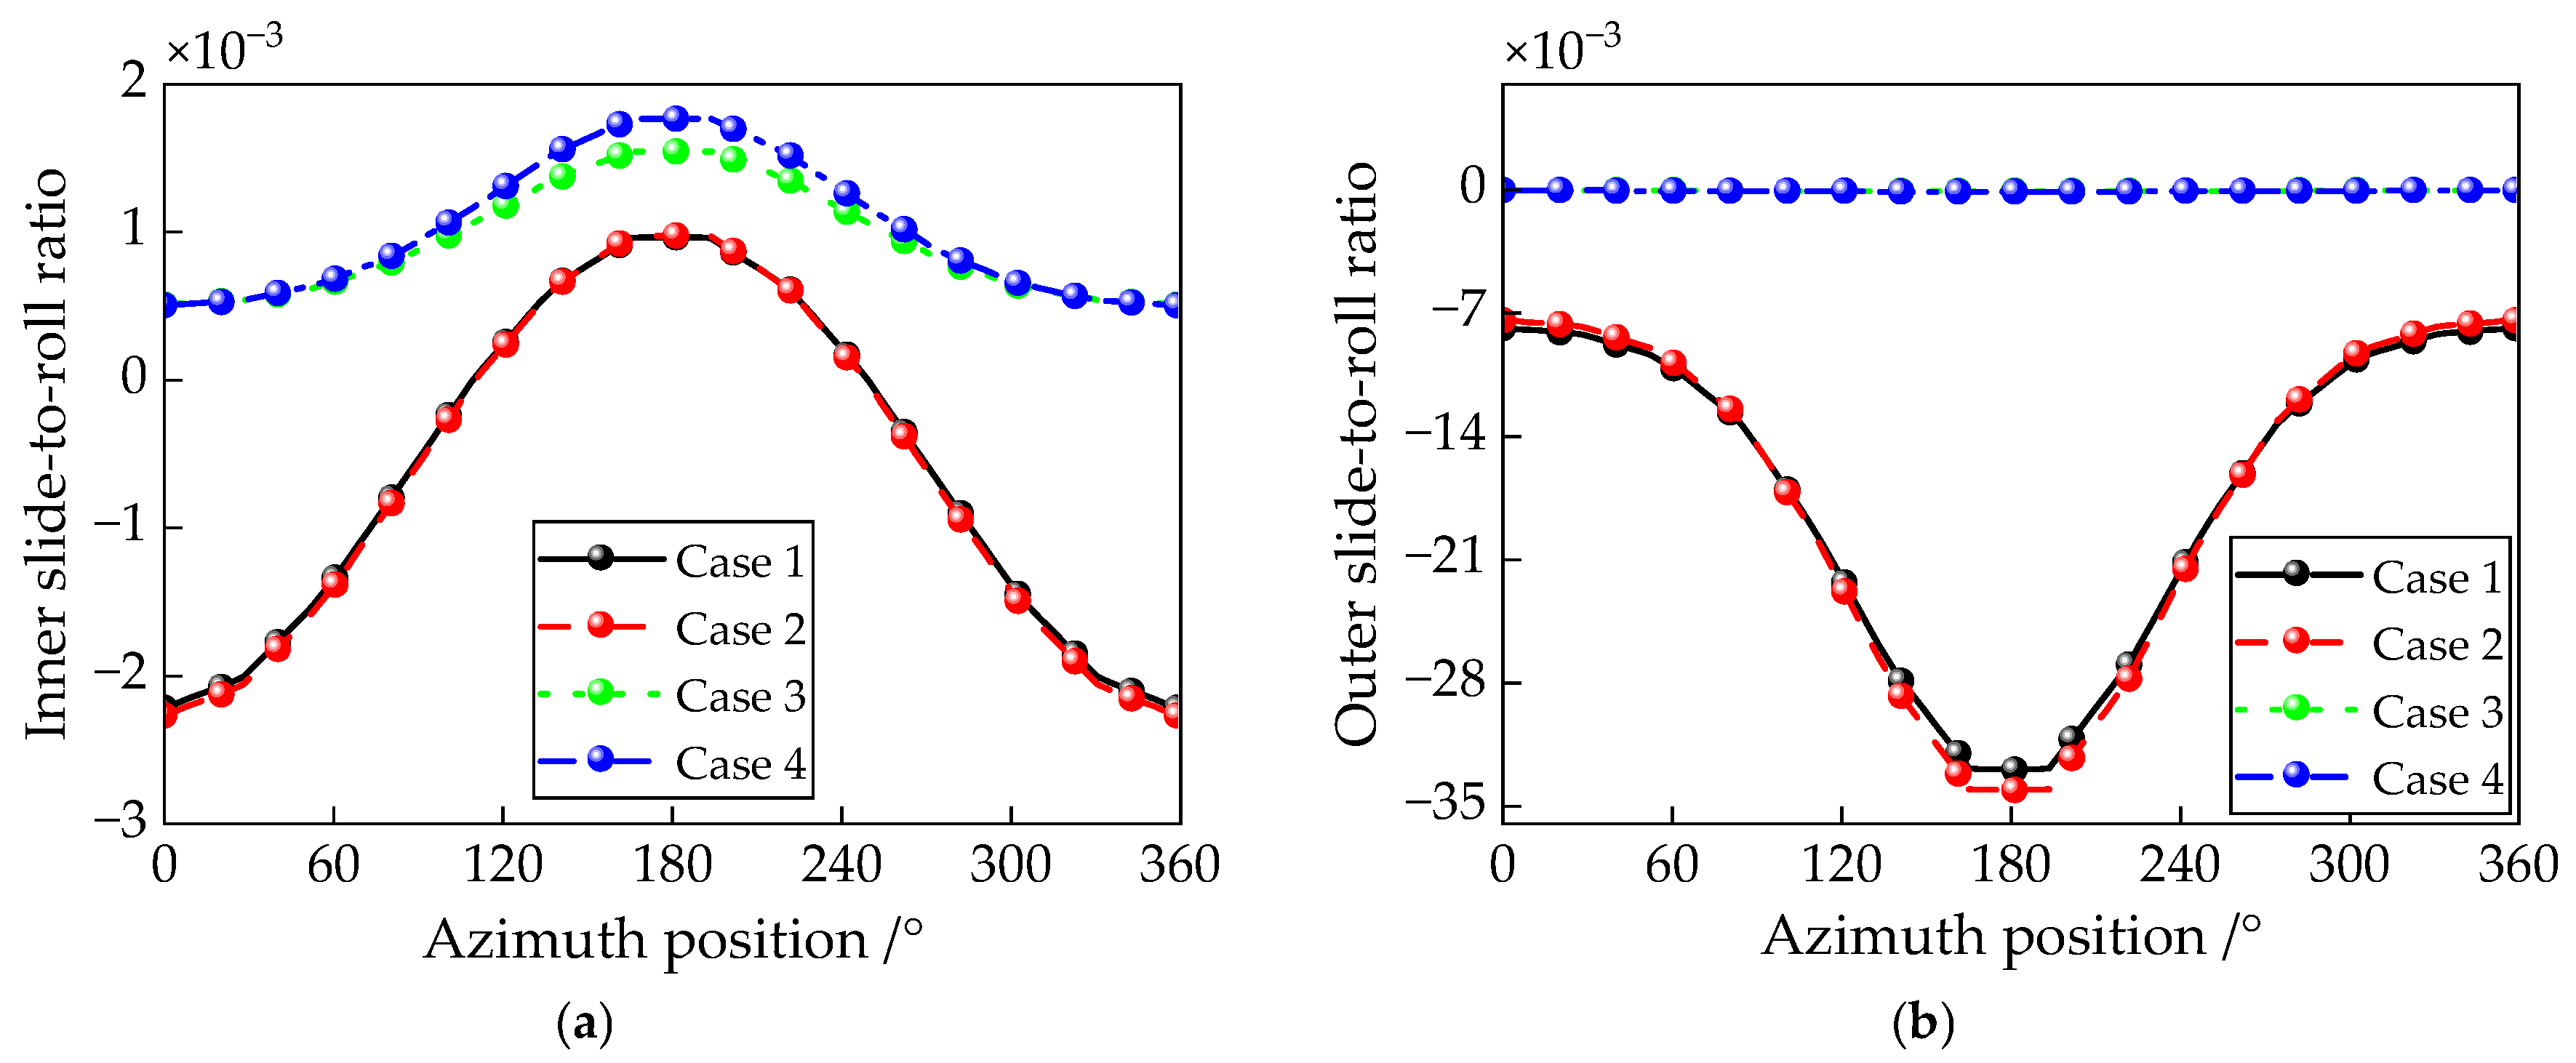
Figure 17 shows the inner and outer longitudinal slide-to-roll ratios ξx of the ball throughout a complete orbital rotation. It can be observed that the inner slide-to-roll ratios in cases 1 and 2 are significantly larger than those in cases 3 and 4, indicating that differential slip has a notable effect on the ball’s skidding behavior. Additionally, it is noteworthy that the inner slide-to-roll ratios in cases 1 and 2 are negative in the heavily loaded zone and positive in the lightly loaded zone. This implies that the ball’s line velocity is slower than that of the inner raceway in the heavily loaded region, which is attributed to the compression of the ball in this area causing a reduction in its rotational speed.
Figure 18 presents the wear rates of the ball–raceway and ball–cage contacts at different azimuthal positions of the ball. It can be observed that cases 1 and 2 exhibit lower wear rates at the ball–inner raceway and ball–cage contacts, while the wear rate at the ball–outer raceway contact is comparatively higher. This indicates that differential slip reduces wear at the ball–raceway and ball–cage interfaces but increases wear at the ball–outer raceway contact. Notably, the wear rate at the inner contact is significantly greater than that at the outer contact. Additionally, both the inner and outer rings experience higher wear rates in the heavily loaded zone, whereas the cage shows mild wear predominantly in the lightly loaded zone, suggesting that ball–cage collisions are more pronounced in this region.

5.2. Transient Dynamic Characteristics of the Bearing

As a complement to the steady-state dynamic analysis, the transient dynamic model provides real-time simulation of the bearing’s behavior, capturing its transient responses including vibration and impact phenomena. In this section, based on the proposed dynamic model, the effects of lubrication condition, axial preload, and wear defect depth are investigated with respect to the bearing’s contact mechanics, traction behavior, and vibration response.

5.2.1. Effects of the Solid Lubricants

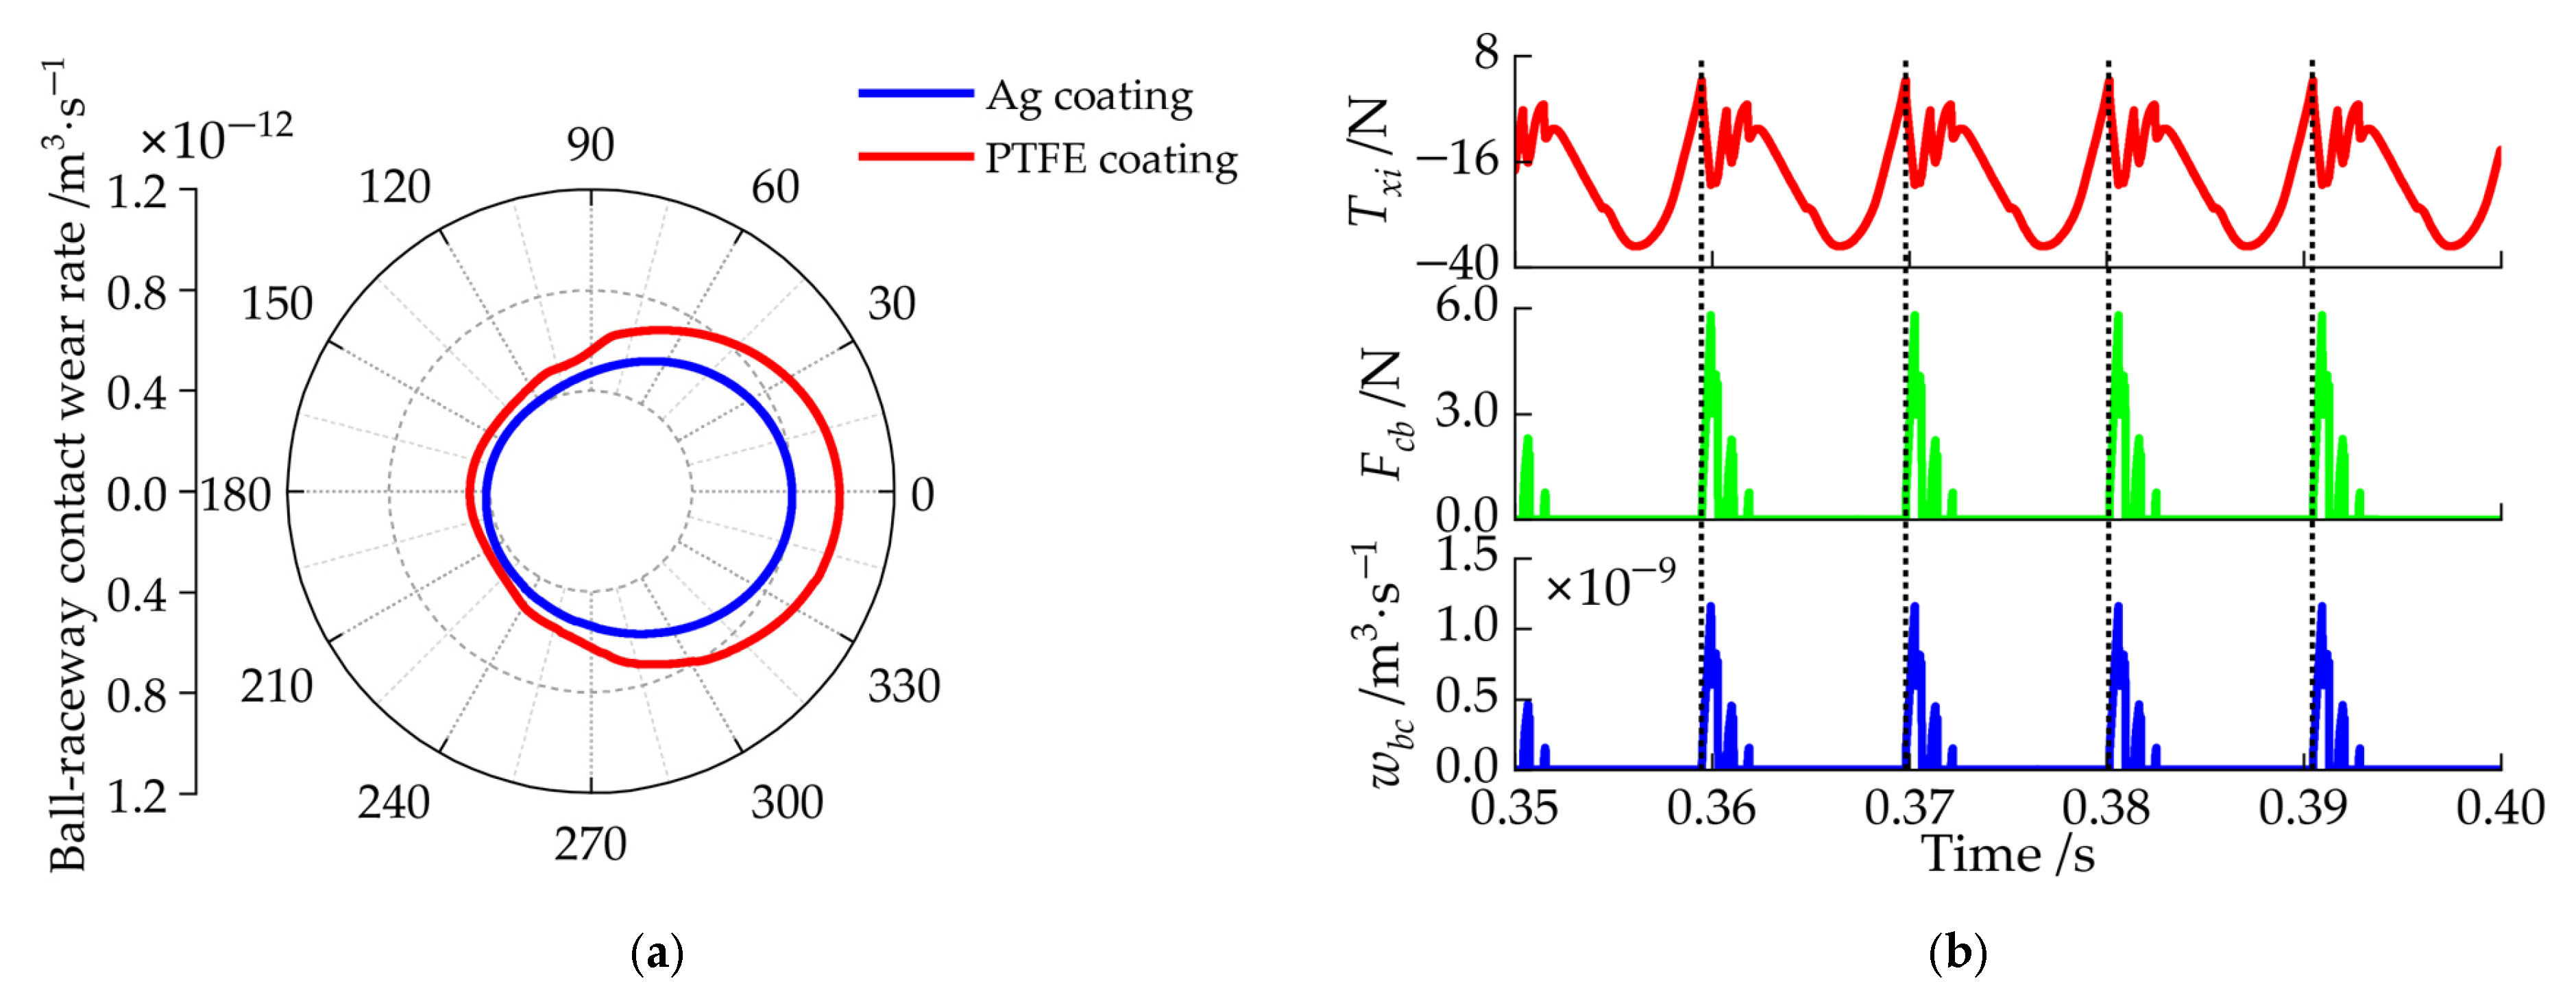
As discussed in Section 4.2, the solid lubrication in a CSLBB transitions from an Ag coating to a self-lubricating PTFE coating during operation. It is important to note that the traction parameters for these two lubricants differ significantly, as shown in Table 2. To investigate the dynamic and wear mechanisms across different lubrication stages, the bearing’s dynamic performance under both Ag and PTFE coatings is simulated and compared using the proposed tribo-dynamic model.
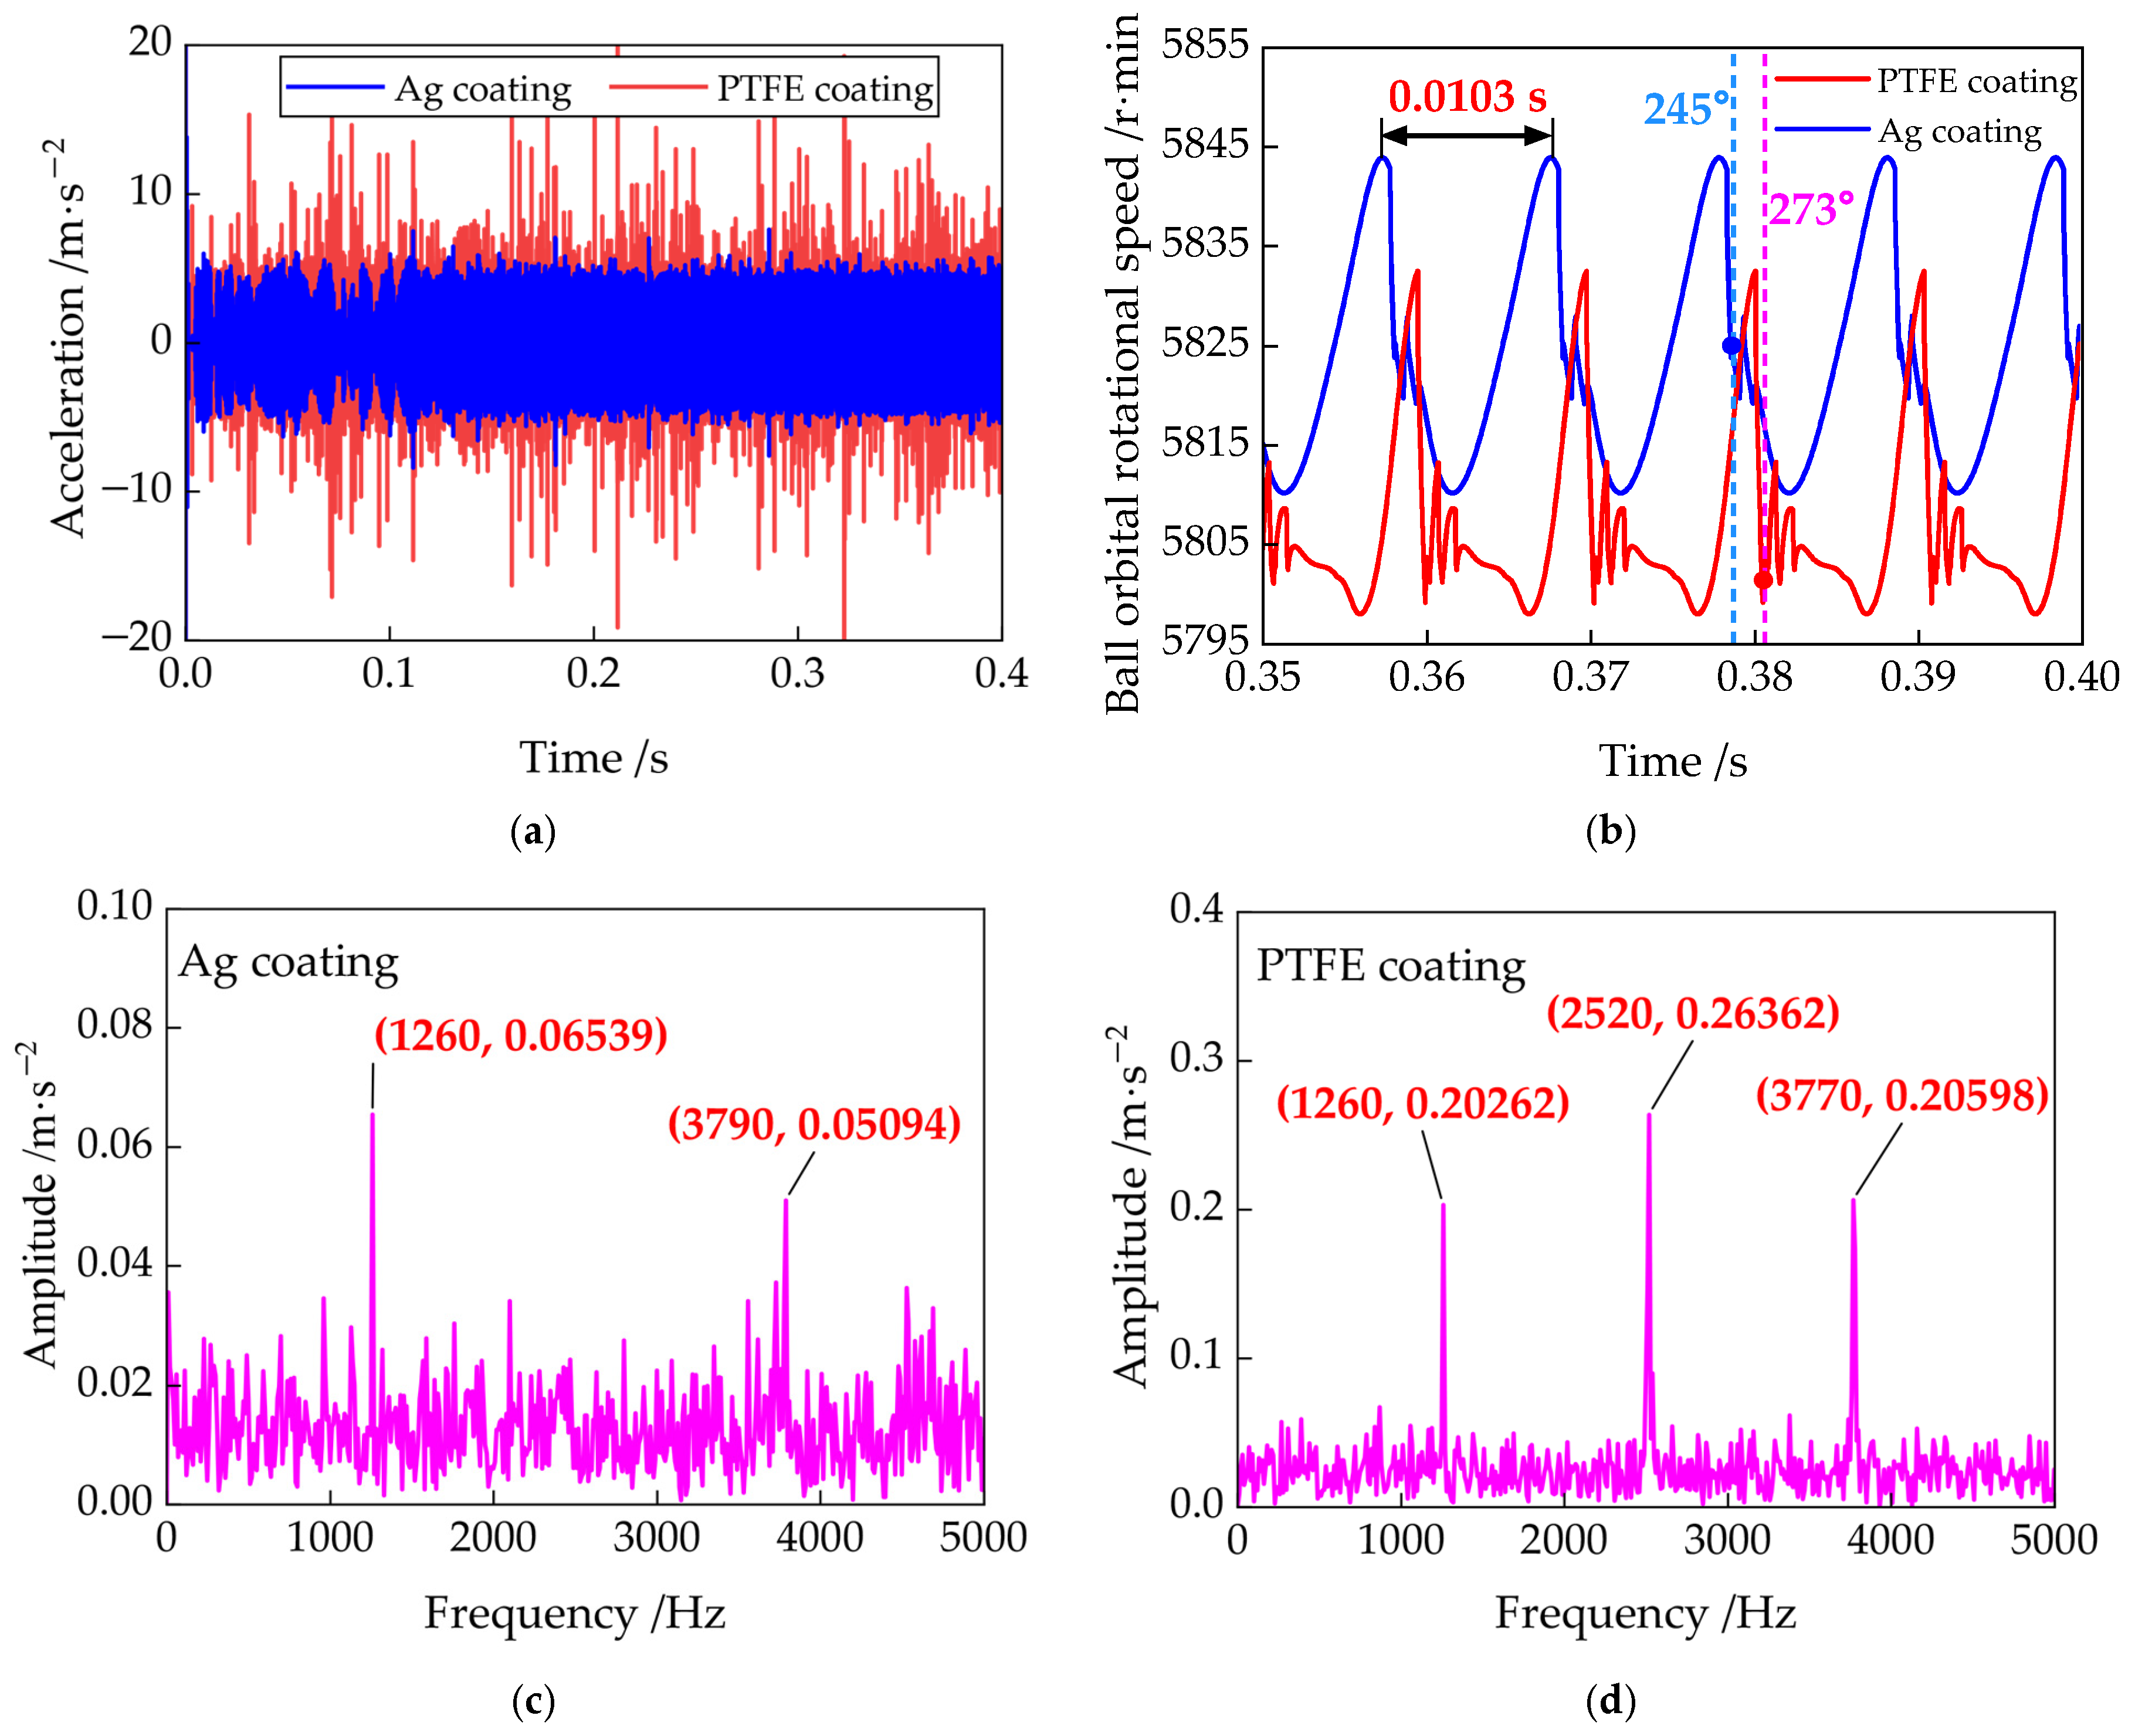
Figure 19a,b compare the time-varying dynamic responses of the outer ring acceleration and the ball orbital rotational speed, respectively. The results reveal a more pronounced impact in the dynamic response under the PTFE coating. Specifically, the maximum vibration acceleration amplitudes under Ag and PTFE lubrication conditions are 8.41 m/s2 and 22.65 m/s2, respectively. The variation period of the ball orbital speed is 0.0103 s, corresponding exactly to the ball’s orbital frequency. Furthermore, the impact observed between 245° and 330° of the ball’s orbital position suggests that this disturbance mainly occurs during the transition of the ball from the lightly loaded zone to the heavily loaded zone. Figure 19c,d show the frequency spectra of the acceleration signals, where only the cage frequency and its harmonics are present. This indicates that the ball orbital motion has a dominant influence on the bearing’s vibration response.
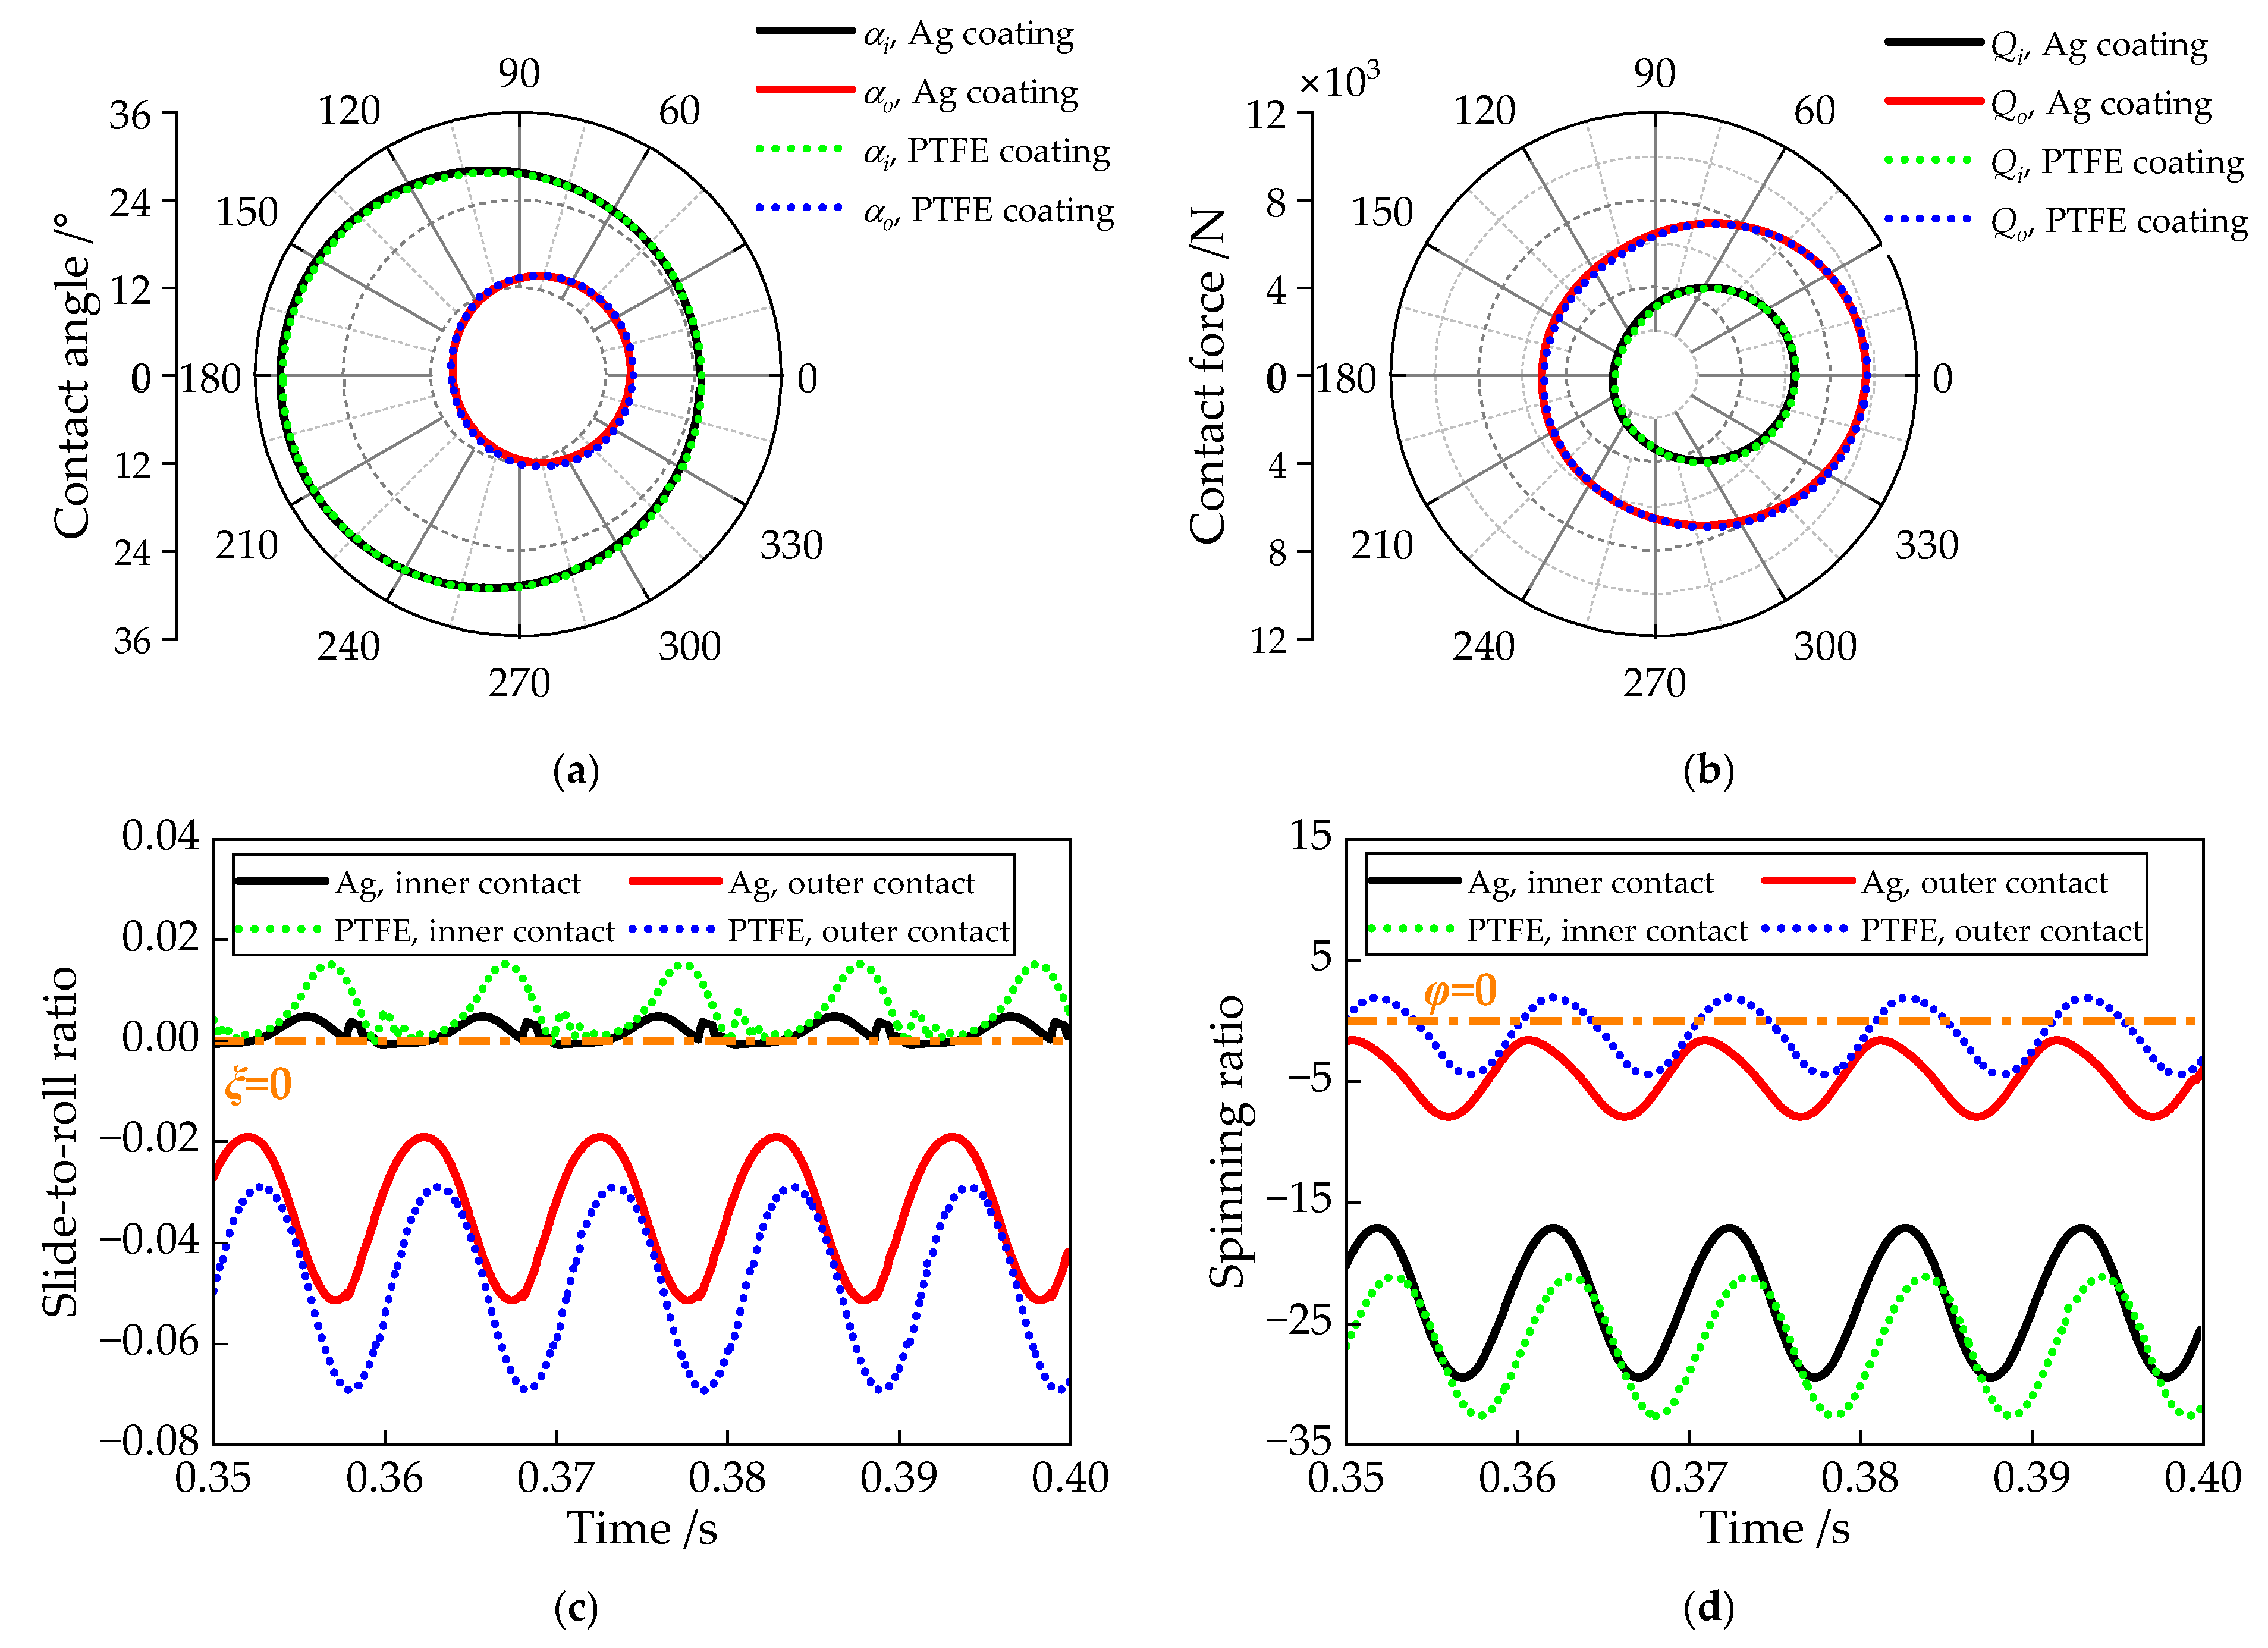
To further investigate the influence mechanisms of the two solid coatings, the ball’s contact performance is presented in Figure 20. Polar plots of the contact angles and contact loads are shown in Figure 20a,b, respectively, while time-domain curves of the ball’s slide-to-roll and spinning ratios are displayed in Figure 20c,d. Due to the centrifugal force generated by high rotational speeds, the inner contact angle and outer contact load are greater than their outer contact angle and inner contact load counterparts, respectively. Additionally, under the effect of a high radial load, the contact force on the ball in the heavily loaded zone is nearly twice that in the lightly loaded zone. Notably, the contact angles and contact loads are largely unaffected by both ball-cage collision forces and the type of solid lubricant coating.
As shown in Figure 20c, the slide-to-roll ratio under the PTFE coating is larger than that under the Ag coating, indicating that skidding behavior is more pronounced with the PTFE coating. This difference may be attributed to the lower coefficient of friction (COF) associated with the Ag coating. Since the outer slide-to-roll ratio is significantly greater than the inner slide-to-roll ratio, ball–cage collisions have a more substantial impact on the outer contact behavior. However, due to the centrifugal effect at high rotational speeds, the outer spinning ratio is smaller than the inner spinning ratio, consistent with the outer raceway control hypothesis.
Figure 21 presents the wear rates of the ball–raceway contact (comprising both ball–inner and ball–outer raceway contacts) and the ball–cage contact for a single ball. To illustrate the impact of ball–cage collisions, the time-varying responses of the ball–cage collision force and traction force are also plotted for comparison. It is evident that the ball–raceway wear rate under PTFE coating is significantly higher than that under Ag coating. As shown in Figure 20c, the absolute value of the slide-to-roll ratio is greater under PTFE lubrication, indicating that the increased slide-to-roll ratio is the primary factor contributing to the more severe wear observed with PTFE lubrication. Although the slide-to-roll ratio is lower in the heavily loaded zone, the ball–raceway wear rate remains higher in this region. This discrepancy arises because the wear rate calculation depends not only on sliding velocity but also on contact force. Furthermore, the comparison of ball–cage collision force, ball traction force, and ball–cage contact wear suggests that ball–cage collisions are the fundamental factor influencing both the traction force and wear at the ball–cage interface.

5.2.2. Effects of Axial Preloads

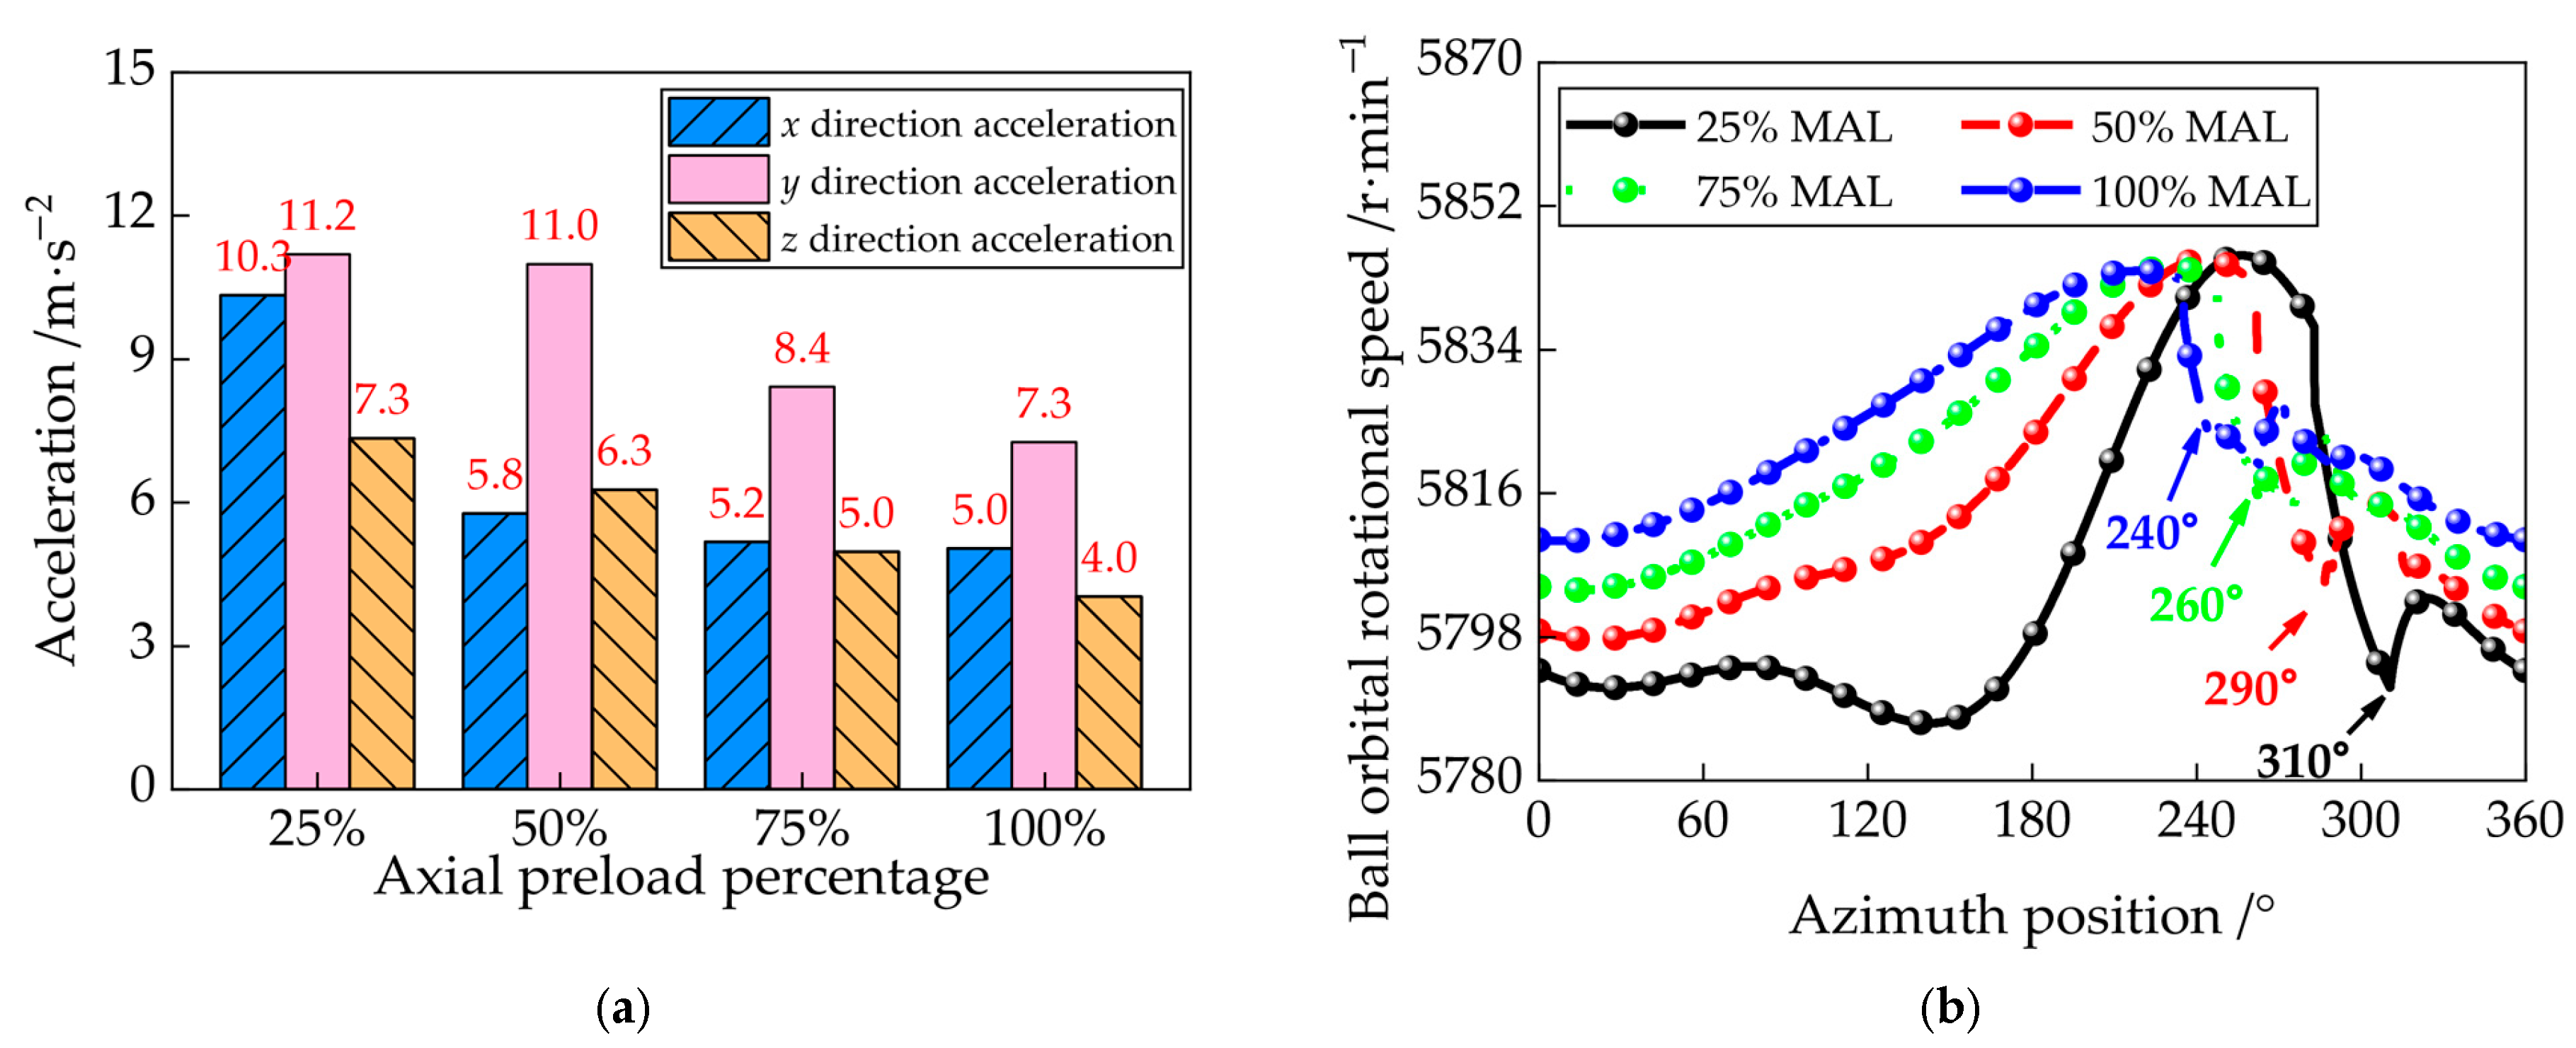
Subjected to the axial forces generated by rotating turbo and pump rotors, the axial load acting on the CSLBB typically ranges from zero to several tens of thousands of Newtons. Since axial load significantly affects the bearing’s contact and traction performance, this section investigates the influence of insufficient axial preload on bearing dynamics. Dynamic responses under 25%, 50%, 75%, and 100% of the maximum axial load (MAL) are simulated, compared, and analyzed to provide insights for the design of CSLBBs.
To evaluate the bearing’s capability to stably support the rotor, the acceleration amplitudes of the inner ring in three translational directions are presented in the bar chart shown in Figure 22a. It can be observed that increasing axial load leads to a corresponding increase in the inner ring’s vibration amplitude. As indicated by the ball orbital rotational speed results in Figure 22b, the orbital speed decreases with decreasing axial preload, suggesting more severe skidding. The initial impact azimuth positions of the ball orbital speed under axial preloads of 25%, 50%, 75%, and 100% are approximately 310°, 290°, 260°, and 240°, respectively, indicating that the heavily loaded zone expands as axial preload increases. Furthermore, Figure 22a reveals that the inner ring acceleration in the x-direction is most sensitive to changes in axial preload. This sensitivity arises because the radial preload is applied along the x-direction, and a reduction in the heavily loaded zone exacerbates load distribution non-uniformity in this direction.
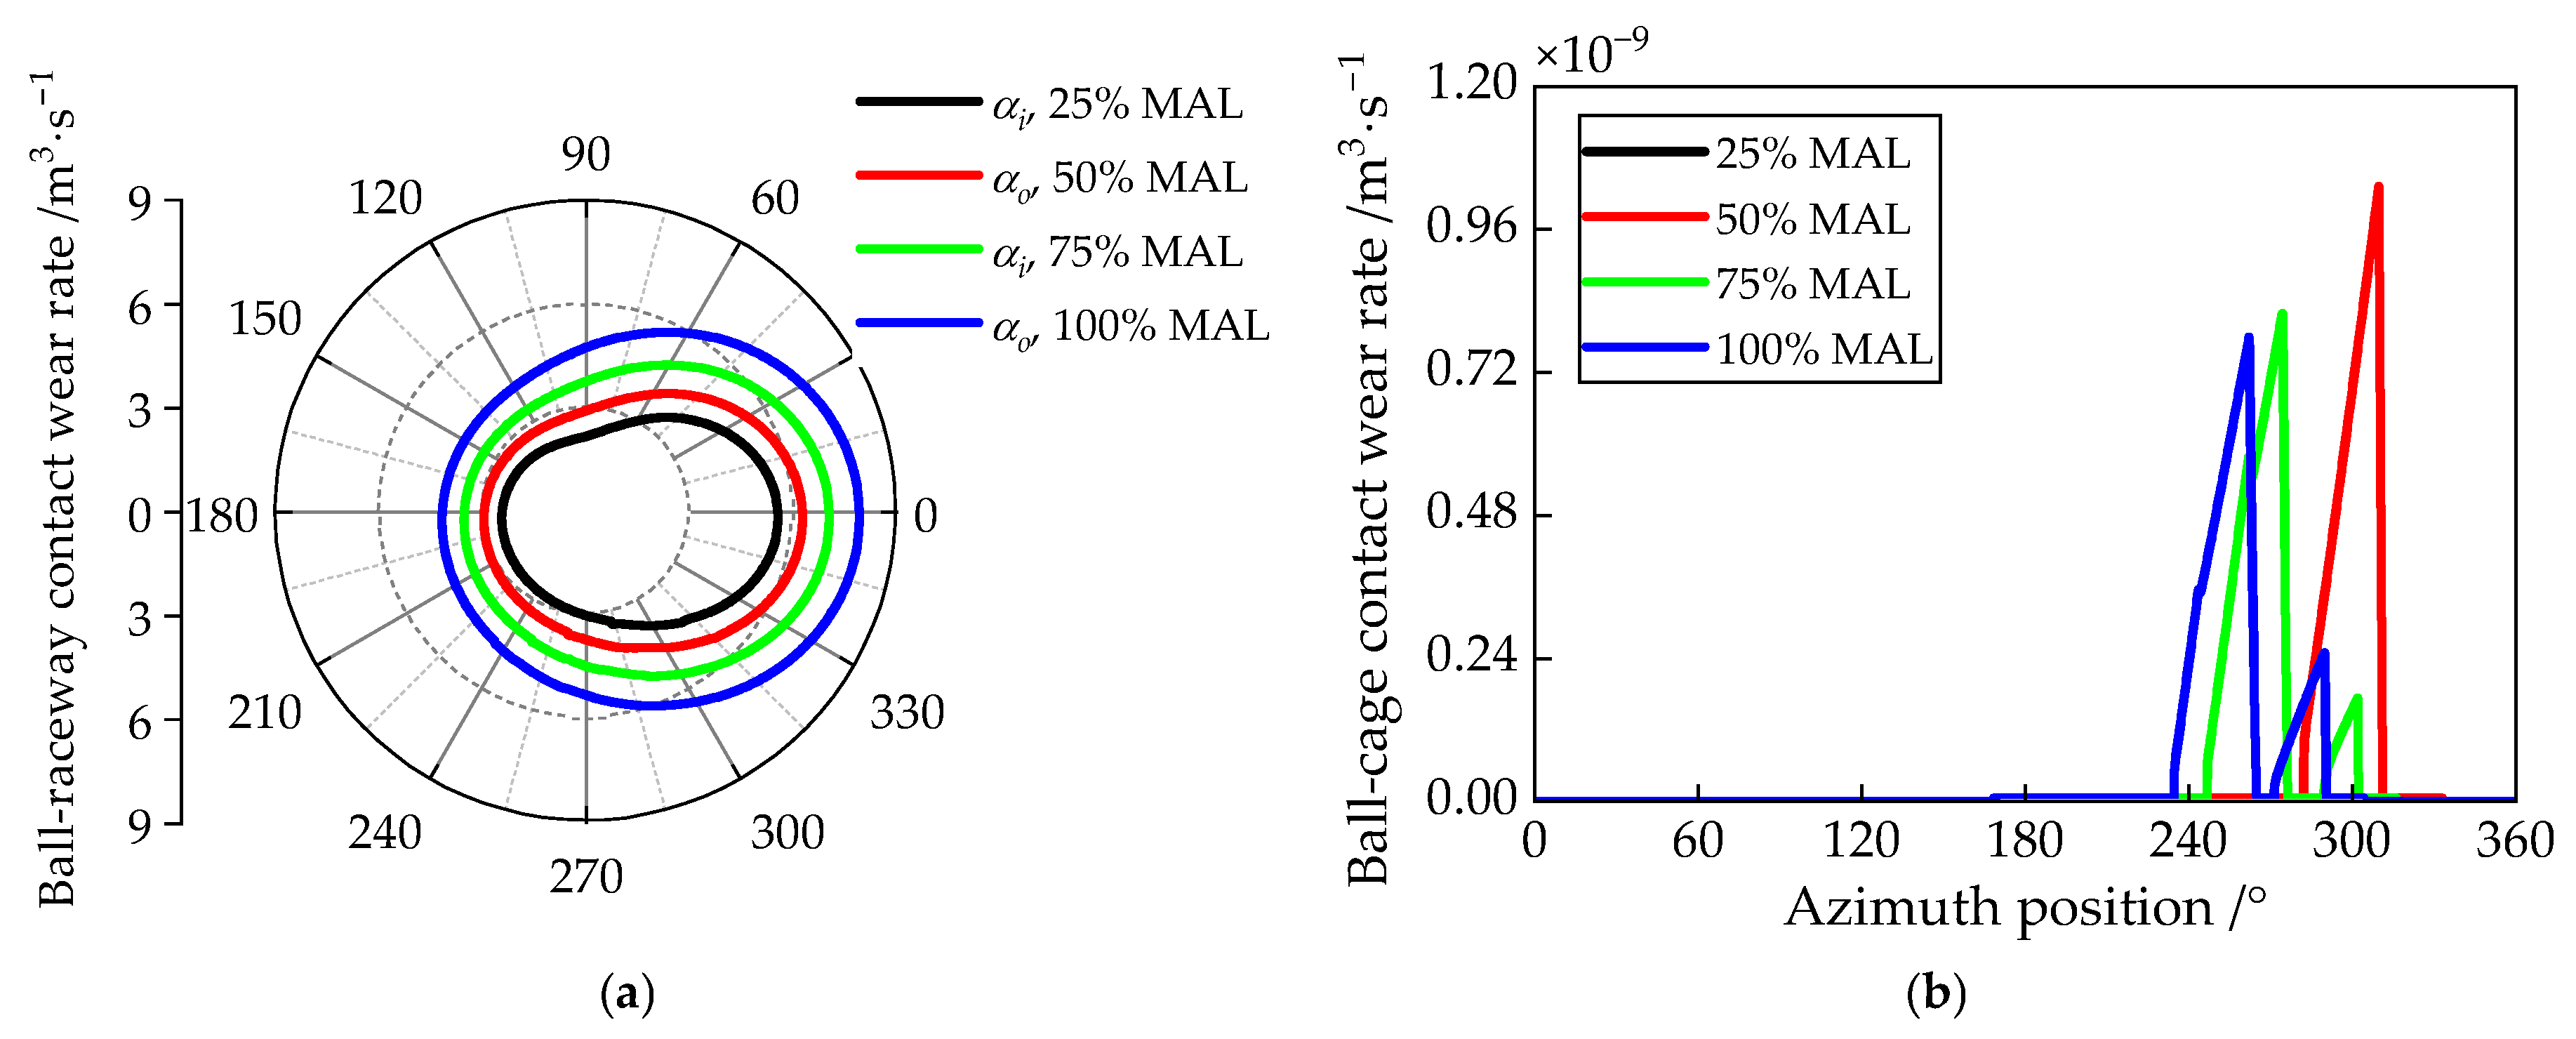
The dynamic contact responses—including contact angles, contact forces, slide-to-roll ratios, and ball–cage collision forces over a complete orbital rotation of the ball—are presented in Figure 23. Both inner and outer contact angles and forces increase with rising axial preload. Correspondingly, the slide-to-roll ratios decrease as axial preload increases, indicating that insufficient axial preload promotes skidding within the bearing. Figure 23d shows the magnitude of the collision force between the ball and the cage pocket during one ball revolution. The peak impact force grows with increasing bearing load. Additionally, the phase shift observed in the ball–collision force curves reveals that collision timing is delayed as axial preload decreases, consistent with the earlier conclusion that insufficient axial preload shortens the heavily loaded zone. Figure 24 provides wear rate analyses of the ball–raceway and ball–cage contacts under varying axial preload conditions. Comparing Figure 23c and Figure 24a shows that although increasing axial load reduces the absolute value of the ball’s slide-to-roll ratio, it also intensifies wear between the ball and raceway. Moreover, the comparison of Figure 23d and Figure 24b indicates that higher axial preload reduces both the impact force and the associated wear at the ball–cage interface.
Based on the above analysis, a decrease in axial load leads to increased bearing vibration by altering the load distribution within the bearing. On one hand, the reduced axial load lowers the contact force between the ball and raceway, thereby promoting skidding. On the other hand, it exacerbates the non-uniformity of load distribution, which further amplifies vibration. Since the bearing wear rate increases with axial load, the optimal design of axial preload must balance both vibration and wear performance. In other words, if operational accuracy is the primary requirement, a higher axial load is preferred; conversely, if service life is the main concern, a lower axial load should be considered.

6. Conclusions

A dynamic model of CSLBBs incorporating a varying traction parameter is proposed to investigate the bearing’s dynamic and wear mechanisms. The multi-degree-of-freedom dynamic model accounts for factors influencing traction, collisions between balls and the cage, as well as impacts caused by wear defects. Based on the theoretical analysis, the following conclusions are drawn:
(1) Differential slip significantly increases the slide-to-roll ratio and traction force between the ball and the outer raceway, thereby accelerating wear on the outer raceway.
(2) Reducing the friction coefficient of the solid lubricant coating effectively mitigates raceway wear; however, it may induce instability in the orbital motion of rolling elements, leading to increased vibration and cage wear.
(3) Increasing the axial load reduces bearing vibration and enhances operational accuracy, but the accompanying rise in contact force accelerates wear, ultimately shortening bearing service life.

Author Contributions

S.Z.: Methodology, Software, Writing—original draft. S.J.: Investigation, Formal analysis, Validation. Y.Z. (Yuhao Zhao): Project administration, Data curation, Resources, Supervision. J.W.: Conceptualization, Resources. Y.Z. (Yanyang Zi): Data curation, Resources. All authors have read and agreed to the published version of the manuscript.

Funding

This research was supported by the Key R&D Program of Henan Province (No. 231111241300), the Natural Science Foundation of Henan Province (No. 232300420155), the Science & Technology Research Projects of Henan Province (No. 242102241021, 252102321137, 252102210140) and the Key Scientific Research projects in higher education institutions of Henan Province (No. 24A460020).

Data Availability Statement

All data generated during this study are included in this article and the datasets are available from the corresponding author on reasonable request.

Conflicts of Interest

The authors declare no conflict of interest.

References

  1. Miao, X.; Hu, M.; Li, A.; Wang, D.; Weng, L.; Li, X.; Zhang, G. Investigation on the lubricity of self-lubricating ball bearings for cryogenic turbine pump. Tribol. Int. 2018, 121, 45–53. [Google Scholar] [CrossRef]
  2. Choe, B.; Kwak, W.; Jeon, D.; Lee, Y. Experimental study on dynamic behavior of ball bearing cage in cryogenic environments, Part II: Effects of cage mass imbalance. Mech. Syst. Signal Process. 2019, 116, 25–39. [Google Scholar] [CrossRef]
  3. Gupta, P.K. Minimum Energy Hypothesis in Quasi-Static Equilibrium Solutions for Angular Contact Ball Bearings. Tribol. Trans. 2020, 63, 1051–1066. [Google Scholar] [CrossRef]
  4. Gupta, P.K. Current Status of and Future Innovations in Rolling Bearing Modeling. Tribol. Trans. 2011, 54, 394–403. [Google Scholar] [CrossRef]
  5. Hong, S.-W.; Van-Canh, T. Rolling-Element Bearing Modeling: A Review. Int. J. Precis. Eng. Manuf. 2016, 17, 1729–1749. [Google Scholar] [CrossRef]
  6. Cao, H.; Niu, L.; Xi, S.; Chen, X. Mechanical model development of rolling bearing-rotor systems: A review. Mech. Syst. Signal Process. 2018, 102, 37–58. [Google Scholar] [CrossRef]
  7. Oktaviana, L.; Van-Canh, T.; Hong, S.-W. Skidding analysis of angular contact ball bearing subjected to radial load and angular misalignment. J. Mech. Sci. Technol. 2019, 33, 837–845. [Google Scholar] [CrossRef]
  8. Wen, C.; Meng, X.; Lyu, B.; Gu, J.; Xiao, L. Influence of angular misalignment on the tribological performance of high-speed micro ball bearings considering full multibody interactions. Proc. Inst. Mech. Eng. Part J-J. Eng. Tribol. 2020, 235, 1168–1189. [Google Scholar] [CrossRef]
  9. Gao, S.; Han, Q.; Zhou, N.; Pennacchi, P.; Chatterton, S.; Qing, T.; Zhang, J.; Chu, F. Experimental and theoretical approaches for determining cage motion dynamic characteristics of angular contact ball bearings considering whirling and overall skidding behaviors. Mech. Syst. Signal Process. 2022, 168, 108704. [Google Scholar] [CrossRef]
  10. Deng, S.; Zhu, X.; Qian, D.; Wang, F.; Hua, L. Nonlinear dynamic correlation between balls, cage and bearing rings of angular contact ball bearings at different number of balls and groove curvature radii. Nonlinear Dyn. 2023, 111, 3207–3237. [Google Scholar] [CrossRef]
  11. Han, Q.; Chu, F. Nonlinear dynamic model for skidding behavior of angular contact ball bearings. J. Sound Vib. 2015, 354, 219–235. [Google Scholar] [CrossRef]
  12. Zhao, Y.; Ma, Z.; Zi, Y. Skidding and Spinning Investigation for Dry-lubricated Angular Contact Ball Bearing under Combined Loads. Friction 2023, 11, 1987–2007. [Google Scholar] [CrossRef]
  13. Zhang, T.; Chen, X.; Gu, J.; Wang, Z. Influences of preload on the friction and wear properties of high-speed instrument angular contact ball bearings. Chin. J. Aeronaut. 2018, 31, 597–607. [Google Scholar] [CrossRef]
  14. Yu, H.; Ran, Y.; Zhang, G.; Li, X.; Li, B. A time-varying comprehensive dynamic model for the rotor system with multiple bearing faults. J. Sound Vib. 2020, 488, 115650. [Google Scholar] [CrossRef]
  15. Cao, H.; Su, S.; Jing, X.; Li, D. Vibration mechanism analysis for cylindrical roller bearings with single/multi defects and compound faults. Mech. Syst. Signal Process. 2020, 144, 106903. [Google Scholar] [CrossRef]
  16. Wen, C.; Meng, X.; Fang, C.; Gu, J.; Xiao, L.; Jiang, S. Dynamic behaviors of angular contact ball bearing with a localized surface defect considering the influence of cage and oil lubrication. Mech. Mach. Theory 2021, 162, 104352. [Google Scholar] [CrossRef]
  17. Gupta, P.K. Some Dynamic Effects in High-Speed Solid-Lubricated Ball Bearings. ASLE Trans. 1983, 26, 393–400. [Google Scholar] [CrossRef]
  18. Ma, S.; Yin, Y.; Zhu, L.; Yan, K.; Zhu, Y. Dimensional Discussion of Traction Force Vector on Ball/Raceway Interface and Study of Bearing Dynamic Behavior. J. Tribol. 2023, 145, 091108. [Google Scholar] [CrossRef]
  19. Kragelskii, I.V. Friction and Wear; Butterwonhs: London, UK, 1965. [Google Scholar]
  20. Gupta, P.K. Traction coefficients for some solid lubricants for rolling bearing dynamics modeling. Tribol. Trans. 2000, 43, 647–652. [Google Scholar] [CrossRef]
  21. Kwak, W.; Lee, J.; Lee, Y.B. Theoretical and experimental approach to ball bearing frictional characteristics compared with cryogenic friction model and dry friction model. Mech. Syst. Signal Process. 2019, 124, 424–438. [Google Scholar] [CrossRef]
  22. Liu, F.; Su, B.; Zhang, G.; Ren, J.; Zhang, W. Development of a Cryogenic Tester with Air Bearing to Test Sliding-Rolling Contact Friction. Lubricants 2022, 10, 119. [Google Scholar] [CrossRef]
  23. Chang, L.; Hall, P.; Thom, R. Scuffing Characteristics of High-Load Rolling/Sliding Contacts Operating in Liquid Oxygen–-Effects of Materials and Surface Roughness. Tribol. Trans. 1998, 41, 87–95. [Google Scholar] [CrossRef]
  24. Gupta, P.K.; Gibson, H.G. Real-Time Dynamics Modeling of Cryogenic Ball Bearings With Thermal Coupling. J. Tribol.-Trans. Asme 2021, 143, 13. [Google Scholar] [CrossRef]
  25. Zhang, W.; Zhang, C.; Miao, X.; Li, L.; Deng, S. Research on the Power Loss of High-Speed and High-Load Ball Bearing for Cryogenic Turbopump. Machines 2022, 10, 1080. [Google Scholar] [CrossRef]
  26. Kalker, J.J. A fast algorithm for the simplified theory of rolling contact. Veh. Syst. Dyn. 1982, 11, 1–13. [Google Scholar] [CrossRef]
  27. Vollebregt, E.A.H.; Wilders, P. FASTSIM2: A second-order accurate frictional rolling contact algorithm. Comput. Mech. 2011, 47, 105–116. [Google Scholar] [CrossRef]
  28. Liu, B.; Bruni, S.; Lewis, R. Numerical calculation of wear in rolling contact based on the Archard equation: Effect of contact parameters and consideration of uncertainties. Wear 2022, 490–491, 204188. [Google Scholar] [CrossRef]
  29. Chen, W.; Ma, Z.; Gao, L.; Li, X.; Pan, J. Quasi-static analysis of thrust-loaded angular contact ball bearings part I: Theoretical formulation. Chin. J. Mech. Eng. 2012, 25, 71–80. [Google Scholar] [CrossRef]
  30. Zhao, Y.; Zi, Y.; Chen, Z.; Zhang, M.; Zhu, Y.; Yin, J. Power loss investigation of ball bearings considering rolling-sliding contacts. Int. J. Mech. Sci. 2023, 250, 108318. [Google Scholar] [CrossRef]
  31. Archard, J.F. Contact and Rubbing of Flat Surfaces. J. Appl. Phys. 1953, 24, 981–988. [Google Scholar] [CrossRef]
  32. Fleischer, G.; Gröger, H.; Thum, H. Verschleiß und Zuverlässigkeit; Verlag Technik: Berlin, Germany, 1980. [Google Scholar]
  33. El-Thalji, I.; Jantunen, E. Fault analysis of the wear fault development in rolling bearings. Eng. Fail. Anal. 2015, 57, 470–482. [Google Scholar] [CrossRef]
  34. Goryacheva, I.G.; Zobova, A.A. Dynamics of deformable contacting bodies with sliding, rolling, and spinning. Int. J. Mech. Sci. 2022, 216, 106981. [Google Scholar] [CrossRef]
  35. Rovira, A.; Roda, A.; Lewis, R.; Marshall, M.B. Application of Fastsim with variable coefficient of friction using twin disc experimental measurements. Wear 2012, 274–275, 109–126. [Google Scholar] [CrossRef]
  36. Dowson, D. History of Tribology, 2nd ed.; John Wiley & Sons, Inc.: Hoboken, NJ, USA, 1998; Volume 50. [Google Scholar]
  37. Marian, M.; Berman, D.; Rota, A.; Jackson, R.L.; Rosenkranz, A. Layered 2D nanomaterials to tailor friction and wear in machine elements—A review. Adv. Mater. Interfaces 2022, 9, 2101622. [Google Scholar] [CrossRef]
  38. Gao, W.J.; Nelias, D.; Boisson, N.; Lyu, Y.G. Model formulation of churning losses in cylindrical roller bearings based on numerical simulation. Tribol. Int. 2018, 121, 420–434. [Google Scholar] [CrossRef]
  39. Liu, J.; Shao, Y. Overview of dynamic modelling and analysis of rolling element bearings with localized and distributed faults. Nonlinear Dyn. 2018, 93, 1765–1798. [Google Scholar] [CrossRef]
  40. Mao, K.; Miao, X.; Chen, H.; Niu, X. Experimental research on bearing life of turbopump in liquid rocket engine. J. Rocket Propuls. 2016, 42, 24–27. [Google Scholar]
Figure 1. Discretization method of the contact patch: (a) the Hertz contact spot; (b) the unit circle; (c) discretization method.
Lubricants 13 00352 g001
Figure 2. The Heathcote differential sliding in ball bearings: (a) the schematic diagram of a curved contact surface; (b) differential slip between the ball-inner raceway contact and ball-outer raceway contacts in angular contact ball bearings.
Lubricants 13 00352 g002
Figure 3. Flow chart of the traction calculation considering varying traction parameters.
Lubricants 13 00352 g003
Figure 4. Deformation compatibility condition between the ball and raceways before and after wear: (a) relative position between the center of curvature of the sphere and the center of curvature of the channel before wear, where the black lines represent the configuration before deformation, while the red lines indicate the configuration after deformation; (b) relative position of the ball and raceways after wear.
Lubricants 13 00352 g004
Figure 5. Contact characteristics between the ball and raceway under different wear conditions: (a) coating unworn; (b) coating partially worn; (c) coating completely worn.
Lubricants 13 00352 g005
Figure 6. Coordinate and DOFs of the analyzed cryogenic ball bearing, who has totally 6Nb + 6 DOFs.
Lubricants 13 00352 g006
Figure 7. Dynamic systems of the cage and the whole bearing: (a) schematic diagram of the dynamic model of the cage; (b) schematic diagram of the dynamic model of the whole system.
Lubricants 13 00352 g007
Figure 8. The solution process of the entire dynamic model.
Lubricants 13 00352 g008
Figure 9. Comparison of traction curves based on theoretical calculations and experimental tests: (a) the comparison of traction curve for Ag coating; (b) the comparison of traction curve for PTFE coating [25].
Lubricants 13 00352 g009
Figure 10. Actual and sketch diagrams of the CSLBB test rig: (a) the cryogenic ball bearing vibration tester; (b) controller and data acquisition system.
Lubricants 13 00352 g010
Figure 11. Experimental vibration data and its FFT spectrum: (a) acceleration of the bearing x ¨ i in the x-direction, (b) inner ring speed ωi obtained from the key phase signal, (c) stable acceleration signal extracted from the complete data, (d) frequency spectrum of the stable signal.
Lubricants 13 00352 g011
Figure 12. The tested bearing and outer raceway after the experiment, where an obvious peeling defect can be found in the outer raceway, where the spalling defect on the outer race is highlighted within the red circle.
Lubricants 13 00352 g012
Figure 13. Numerical results of the bearing: (a) time-domain x-direction acceleration x ¨ o of the outer ring, where the signal reaches a stable state after about 0.1 s; (b) time-domain ball orbital rotational speed ωc; (c) frequency spectrum of the outer ring acceleration signal.
Lubricants 13 00352 g013
Figure 14. Steady-state dynamic contact performance of the bearing, which reflect different contact parameters of the ball in a whole orbital rotation φ using the polar diagram: (a) inner contact angle αi and outer contact angle αo of the ball; (b) inner contact force Qi and outer contact force Qo of the ball; (c) inner contact stress pi and outer contact stress po of the ball.
Lubricants 13 00352 g014
Figure 15. Curve fitting of the traction data: (a) fitted curve of the traction parameter Sm; (b) fitted curve of the traction parameter Km; (c) fitted curve of the traction parameter K [25].
Lubricants 13 00352 g015
Figure 16. Inner and outer longitude traction forces in different azimuth positions of the ball of the four cases: (a) inner longitude traction force Qi; (b) outer longitude traction force Qo.
Lubricants 13 00352 g016
Figure 17. Inner and outer slide-to-roll ratios of the ball in different azimuth positions of the ball of the four cases: (a) inner slide-to-roll ratio of the ball ξi; (b) outer slide-to-roll ratio of the ball ξo.
Lubricants 13 00352 g017
Figure 18. Wear rates between the ball and the raceways/cage in different azimuth positions of the ball under four cases: (a) ball-inner raceway contact wear rate wri and ball-outer raceway contact wear rate wro in different azimuth positions; (b) ball-cage pocket contact wear rate wbc in different azimuth positions.
Lubricants 13 00352 g018
Figure 19. Time domain and frequency domain response of the bearing with Ag coating and PTFE coating: (a) outer ring acceleration x ¨ o ; (b) time-varying cage rotational speed ωc; (c) frequency spectrum of the outer ring acceleration with Ag coating; (d) frequency spectrum of the outer ring acceleration with PTFE coating.
Lubricants 13 00352 g019
Figure 20. Contact performance of the ball-raceway contacts with different coatings, where the ball-raceway contact angles and contact forces are plotted as polar diagram and the ball slide-to-roll ratio and ball spinning ratio are drawn as time-varying curves: (a) contact angles αi and αo; (b) contact forces Qi and Qo; (c) slide-to-roll ratios ξi and ξo (d) spinning ratios φi and φo.
Lubricants 13 00352 g020
Figure 21. Wear rates of the ball-raceway contact and ball-cage contact with different coatings: (a) polar diagram of ball-raceway contact wear rates wr, which is represented as the sum of ball-inner raceway contact wear rate and ball-outer raceway contact wear rate; (b) graph of ball-cage contact wear rate wbc, comparing with the time varying traction force and ball-cage collision force.
Lubricants 13 00352 g021
Figure 22. Inner ring acceleration response and ball orbital rotational speed results under different percentages of the maximum axial load: (a) histogram of RMS of the inner ring or rotor acceleration x ¨ i and x ¨ o ; (b) graph of ball orbital rotational speed ωbm under different percentages of the maximum axial load.
Lubricants 13 00352 g022
Figure 23. Dynamic contact performance of the bearing under different percentages of MAL: (a) polar plot of the inner and outer contact angles αi and αo; (b) polar plot of the inner and outer contact forces Qi and Qo; (c) time history graph of the inner and outer slide-to-roll ratios ξi and ξo; (d) time history graph of the ball-cage collision force Fbc.
Lubricants 13 00352 g023aLubricants 13 00352 g023b
Figure 24. Wear rate results of the bearing under different percentages of the given axial preload: (a) polar plot of the ball-raceway contact wear rate wr in a complete orbital rotation; (b) time history graph of the ball-cage collision wear rate wbc.
Lubricants 13 00352 g024
Table 1. Tested and simulation parameters of solid-lubricated traction.
ParametersValues
Ball diameter, rb, mm10
Normal contact force, F, N200
Hertz contact stress, P, GPa2.5/3.0/3.5
Solid lubrication typeAg coating/PTFE coating
Radial slices of the contact patch, R10
Circumferential slices of the contact patch, N40
Table 2. Fitted Kragelskii traction parameters.
ParametersAg CoatingPTFE Coating
Pressures2.5 GPa3.0 GPa3.5 GPa2.5 GPa3.0 GPa3.5 GPa
A−0.124−0.116−0.102−0.109−0.105−0.100
B0.0790.0660.0620.1030.0960.086
C0.6980.6480.5130.7240.6830.666
D0.1240.1160.1020.1090.1050.100
Error (%)18.60017.24674.23251.32611.24811.8023
Table 3. Geometry and operating parameters of the testing bearing.
ParametersValues
Bearing inner diameter, Di (mm)120
Bearing outer diameter, Do (mm)215
Ball diameter, Db (mm)30.16
Origin contact angle, α0 (degree)18
Fluid materialLN2
Fluid temperature, T (K)85~90
Fluid pressure, p (MPa)3~5
Table 4. Comparison of cage rotational speeds of different cases.
Models/CasesCage Speed ωc/r∙min−1Error/%
QSJH58551.16
case 158020.24
case 258020.24
case 358611.26
case 458601.25
Dynamic57990.20
Table 5. Contact stress distribution of the ball in different azimuth positions.
φPi/GPaPo/GPa
02.462.30
602.282.17
1201.941.94
1801.791.85
2401.941.94
3002.282.17
3602.462.30
Disclaimer/Publisher’s Note: The statements, opinions and data contained in all publications are solely those of the individual author(s) and contributor(s) and not of MDPI and/or the editor(s). MDPI and/or the editor(s) disclaim responsibility for any injury to people or property resulting from any ideas, methods, instructions or products referred to in the content.