Abstract
The accurate and precise measurement of lubricating oil consumption is critical for developing environmentally friendly internal combustion engines, particularly hydrogen-fueled internal combustion engines. The deuterium tracer method is based on the addition of poly-deuterated base oil tracers to fully formulated oils for precise, accurate, and fast lubricating oil consumption measurements. Previously performed measurements have shown that the use of poly-deuterated poly-alpha olefins has minimal impact on lubricating oil properties, except for a slight drop in oil viscosity. To further reduce the impact on lubricating oil characteristics, a new base oil for the synthesis of a poly-deuterated tracer is introduced, and its influence on the lubricating oil’s chemical, tribological, and rheological properties is analyzed. Furthermore, the influence of the tracer addition on the preignition tendencies of the fully formulated oil is also examined. Based on the analyses, no relevant changes in the lubricating oil properties, such as viscosity, density, and thermal degradation behavior, can be observed. Additionally, the deuterium tracer does not negatively influence combustion anomalies, thus reducing preignition tendencies. These results establish the method’s compatibility with new-generation engines, especially hydrogen-fueled internal combustion engines.
1. Introduction
The reduction of lubricating oil consumption (LOC) is one of the critical factors in developing robust and environmentally friendly internal combustion engines. LOC affects various aspects of the internal combustion engine’s operation, including engine efficiency, particle and hydrocarbon emissions, the lifetime of after-treatment systems, and the occurrence of combustion anomalies. While not all occurrences of combustion anomalies are related to the LOC, the study of the relationship between combustion anomalies and LOC is vital, especially since combustion anomalies can decrease an engine’s overall efficiency and impose additional stress and wear on components, potentially leading to engine failure. It follows that reducing combustion anomalies is considered critical for enhancing the reliability and performance of hydrogen internal combustion engines (H2-ICEs).
Numerous methods for measuring LOC are available, each offering unique advantages and presenting specific limitations. These methods vary in terms of precision, accuracy, safety, technical intricacy, cost, and suitability.
1.1. LOC Measurement Methods
Historically, the LOC of internal combustion engines (ICEs) was measured using the drain and weigh method. To measure the LOC utilizing this method, a known amount of lubricating oil had to be poured into the engine, and the engine had to be operated for several hours at a constant operating point or operated at a very specific repeatable cycle [1]. The prolonged measurement and the low absolute measurement accuracy are significant limitations of this method. More recently, new and faster technologies like the “hydrocarbon method” have been developed. The hydrocarbon method uses mass spectrometry analysis to detect and quantify specific molecules from the lubricating oil in the exhaust gas. While the method is very fast, up to crank angle (CA) resolution, this method can only measure the evaporated oil fraction, while the combusted oil fraction cannot be detected. The high specificity in the measurement is its most significant disadvantage since the ratio between evaporated and combusted LOC changes depending on combustion conditions [2,3].
For carbon-free fueled engines the LOC can also be determined by establishing a carbon mass balance between the carbon content in intake air, fuel, and lubricating oil and the carbon content in the exhaust gas. The carbon mass balance can be represented in Equation (1)
with as the intake air’s carbon mass flow rate, as the fuel’s carbon mass flow rate, as the oil’s carbon mass flow rate, and as the exhaust’s carbon mass flow rate. The measurement requires the usage of highly sensitive CO2, HC, and soot detectors for monitoring carbon balance. The method is very sensitive to the fluctuation of CO2 in the air and fuel intake because the carbon coming from oil consumption has a minimal share of the total carbon balance. The biggest drawback of the method is the need to use high-purity carbon-free fuel and a high degree of postprocessing needed to obtain reliable results [4].
The more flexible yet effective methods are the tracer-based methods. The tracer-based methods have online capabilities and fast response times. They are based on measuring the concentration of a specific lubricating oil component, referred to as a tracer in the engine’s exhaust gas, to calculate the LOC. One well-established tracer method measures the LOC using the naturally abundant sulfur in the formulated oil as a tracer [5,6]. For this method, no extra treatment is required, the response time is fast, and it is a well-established, stable method. The main challenges lie in the selectivity issues regarding fuel and LOC caused by the natural presence of sulfur in conventional fuels [7]. Furthermore, the low LOC values in modern engines, combined with new sulfur emission regulations, significantly reduce the amount of detectable sulfur in the exhaust, effectively reducing the viability of sulfur-based detection methods.
Other tracer methods include the use of radioactive tracers such as tritium [8,9] or bromine [10]. These methods are highly selective but potentially hazardous to humans and nature. The tracer-based methods can thus be broadly categorized into two groups: those characterized by low detection limits and those associated with potential hazards. However, one relatively new method, the deuterium tracer method [7], can overcome many of the drawbacks of the tracer methods and produce highly accurate outputs without sacrificing safety.
1.2. Deuterium-Based LOC Measurement
This method uses a non-radioactive hydrogen isotope, deuterium, as a tracer element. The amount of naturally occurring deuterium in the lubricating oil is usually between 0.01 and 0.02% [11]. This amount is artificially increased 200-fold by the addition of a poly-deuterated base oil, referred to as deuterium tracer (DT) [7], to the fully formulated oil. The DT is based on synthetic lubrication base oils (type IV)—poly-alpha olefins (PAOs), whose hydrogen atoms were exchanged for deuterium using a catalytic chemical reaction; see Figure 1.
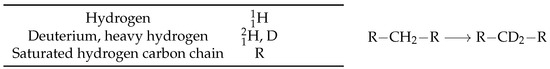
Figure 1.
Schematic representation of the catalytic reaction of exchange of hydrogen for deuterium in long-chained hydrocarbons.
After a background calibration, the DT is added to the lubricating oil and blended until a homogeneous mixture is achieved. To ensure accurate measurement, a deuterium atomic concentration of 2 to 3 at. % in the mixture is required. This is accomplished by adding 4–5 wt. % of DT to the fully formulated oil [11]. The engine is then operated with enriched oil. During the engine operation, the DT is combusted or evaporated together with lubricating oil and carried out with the exhaust gas. A partial exhaust gas flow is extracted and led through a catalytic converter to completely oxidize the evaporated fraction to a mixture of carbon dioxide and water [12]. After the catalytic conversion, the partial exhaust gas stream contains water with a very specific hydrogen–deuterium ratio proportional to the lubricating oil consumed. This ratio can be determined using cavity-enhanced laser spectroscopy [13] and is then used to calculate the LOC. The method is schematically represented in Figure 2.
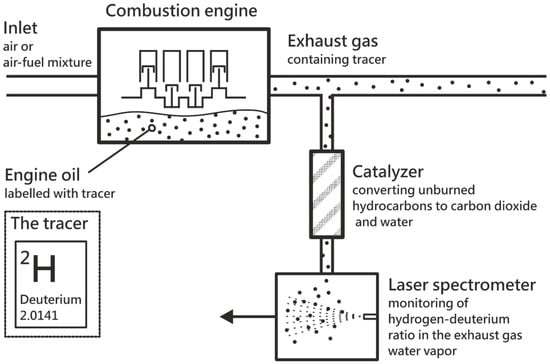
Figure 2.
A schematic representation of the deuterium tracer method for LOC measurements. The deuterium method traces the stable isotope deuterium from its source (the enriched engine oil) to the exhaust gas. It enables the calculation of the LOC by quantitative deuterium detection in the exhaust gas stream.
The DT’s major strength is its flexibility; it has been implemented on many different engine types in terms of, for example, engine size, speed, fuel, and combustion concept. Furthermore, the DT has been tested extensively against other state-of-the-art methods, i.e., sulfur, carbon balance, and hydrocarbon methods, and has proven to lead to reliable and precise results [7].
The DT and its impact on the chemical–physical properties of oil were studied in [11]. Vareka et al. observed minimal to no differences in the chemical and physical properties and viscosity between PAO 4 and poly-deuterated poly-alpha olefin 4 (PAO 4-d). Additionally, it was observed that adding PAO 4-d to a fully formulated oil in a 4–5 wt. % concentration caused minor to no changes in the fully formulated oil’s chemical and physical properties, except for the oil’s viscosity. The kinematic viscosity of engine oils at 100 °C is usually between 9 and 13 mm2/s [14], while PAO 4’s is, by definition, 4 mm2/s. The selection of PAO 4 as DT precursor, despite its low viscosity, was motivated by its higher chemical reactivity compared to more viscous PAOs, allowing higher yields with the catalytic reaction [11]. However, recent advancements in the catalytic process may enable the synthesis of DT using base oils with higher viscosity. For this reason, PAO 8, with a kinematic viscosity of 8 mm2/s at 100 °C, was chosen as a more suitable candidate as a precursor for DT. Therefore, the PAO 8-d addition is expected to impact the fully formulated oil’s viscosity less than previously used tracers while not affecting the chemical–physical properties of the fully formulated oil. However, the effects of PAO 8-d on fully formulated oils, as well as the H2-ICE combustion anomalies, have not yet been measured.
1.3. Hydrogen Combustion Anomalies
One of the most challenging aspects of H2-ICE is the high susceptibility to combustion anomalies, mainly due to hydrogen’s low ignition energy and its capability of igniting over a wide excess air ratio range. The combustion anomalies are a wide variety of abnormal combustion processes such as knock, preignition (PI), misfire, and backfire. The causes of combustion anomalies can be traced to multiple factors [15], such as oil droplets. The role of oil droplets in combustion anomalies, mainly PIs, has long been a topic of investigation, particularly in the context of H2-ICEs. PIs and backfire events in H2-ICE represent a significant challenge, especially at the higher loads encountered in such engines [4,16,17,18]. One of the fast and elegant techniques for studying the influence of oil-induced combustion anomalies in various hydrogen engines was developed by Gschiel et al. [4]. This procedure enables observation of the variation in the number of PI events caused by different oil formulations, as well as by the addition or depletion of additives. It has already been applied to assess the DT’s influence on PI in [7]. In their study, Rossegger et al. [7] observed a slight reduction in PI events when 10% DT was added to the oil.
To confidently propose the new PAO 8-d tracer as a viable option, its impact on the oil’s properties must be thoroughly evaluated, including its effect on long-term oil stability and its compatibility with hydrogen engines, with particular emphasis on PI behavior. Therefore, new DT, specifically PAO 8-d, will be produced using an adapted version of the previously published catalytic reaction [11]. An FT-IR spectrum will be used to compare the results and yield to previously performed reactions. After analysis, the tracer will be added to two different fully formulated oils, and its impact will then be evaluated by assessing the changes in total acid and total base number, as well as the variation of the tribological and rheological properties. Potential side reactions and unexpected effects will be controlled by analyzing the specific IR peaks and areas. The tendencies to induce PIs in fully formulated oils with and without DT will be explored with the aforementioned method, and the results will be corroborated with steady state investigation. Furthermore, the DT and oil solutions will be artificially aged, and the long-term thermal stability of the tracer will be evaluated using FT-IR.
2. Materials and Methods
In this publication, PAO 8-d tracer was produced following the chemical reaction described below. The finished DT was then added to the fully formulated, commercially available mineral-based oils for further investigation. The DT was added to group III, passenger car engine oil, class SAE 5W30, referred to as Oil A, and group II, gas engine oil, class SAE 40, referred to as Oil B. The DT was blended in a concentration of 10% and the influences of the DT were evaluated.
2.1. Deuterium Reaction
PAO 8, commercially available as SPECTRASYN™ 8, was used as a base oil for the deuteration. The catalyst used in this reaction is palladium 5% on carbon, wetted with ca. 55% water (CAS Registry Number: 7440-05-3), referred to in this paper as Pd/C. The deuteration of PAO 8 was performed in a two-step reaction adapted from a previously developed procedure for the synthesis of PAO 4-d. [11]. After a run of optimization, the reaction time has been reduced from 70 h to 65 h, the Pd/C has been increased from 0.3 wt.% to a total of 0.38 wt.%, 6 bar of H2 gas is being used instead of 1 bar D2 gas, and as well the total D2O equivalent has been reduced from 3.4 eq. to 2.8 eq. Due to the resulting high pressure and temperatures, the reaction was performed in a 5 L pressure vessel from the company UOSLAB—UKRORGSYNTEZ Ltd. (Kyiv, Ukraine). The first step was performed with 1.8 volumetric equivalent 70% concentrated D2O, with 0.18 wt.% Pd/C catalyst with an H2 partial pressure of 6 bar and then heated to 215 °C in a closed pressure reactor for 65 h, summarized in Equation (2).

The second step was performed with the resulting partially deuterated PAO 8, 1.8 volumetric equivalent 99.9% concentrated D2O, with 0.20 wt.% Pd/C catalyst and a H2 partial pressure of 6 bar. Then, the reactants were heated to 215 °C in a closed-pressure reactor for 65 h, similar to Equation (2). The second step reaction is summarized in Equation (3).

The substitution rate of hydrogen with deuterium was determined using fourier transform infrared spectroscopy (FT-IR), using the specific absorption band of the deuterium–carbon bond between 2050 and 2250 cm−1. The calibration curve was determined using 1H-nuclear magnetic resonance spectroscopy (NMR), similar to [11].
2.2. Chemical Analysis
2.2.1. FT-IR
All the FT-IR analyses are performed using ERASPEC OIL, from the company Eralytics GmbH (Langenzersdorf, Austria). FT-IR is used for quantification analysis of DT in the fully formulated oil as well as for oil condition monitoring. The comparison of the peaks and areas follows different standards:
- Additives depletion by relative peak height difference;
- Oil condition monitoring according to ASME E2412 [19] standard, including oxidation, depletion of antiwear additives, as well as adapted methods for oxidation and nitration of oil [20,21];
- Deuterium concentration was determined by integrating the specific deuterium peak area, as explained in the previous section and in [11].
2.2.2. TAN and TBN
Total acid number (TAN) was measured according to ASTM D664 [22] and total base number (TBN) corresponding to ASTM D2896 [22] to determine the change of acid-, base-reserve additives, respectively.
2.3. Rheological Analysis
Kinematic viscosity and density at 40 °C as well as 100 °C were determined according to ASTM D7042, the viscosity index (VI) from ASTM D2270 [22]. Viscosity and density analyses are performed using ERAVISC X from the company Eralytics GmbH (Langenzersdorf, Austria).
2.4. Tribological Analysis
The friction and wear properties of the samples were tested using the ball-on-disc experiment, according to ASTM D6425 [22]. The parameters for the investigation are chosen according to the standard and listed in Table 1.

Table 1.
Ball-on-disc experiment settings.
Four possible combinations were explored, all of which formulated oils with and without tracer. Every investigated combination is measured three times. The coefficient of friction (CoF) is determined in the window between 500 and 7000 s and is obtained by the average of the triple determinations. The wear scar diameters, vertical and horizontal, were measured, the wear scar area was calculated, and the volume was calculated based on 3D surface topography.
2.5. Artificial Aging
The oil artificial aging was performed following the guidelines from the “Coordinating European Council for the Development of Performance Tests for Fuel” and adapted to a small engine condition following the work from Besser et al. [23,24]. Aging is performed at 160 °C in an open Erlenmeyer flask (500 mL). The oil is stirred using a magnetic stirrer (400 rpm) and equipped with a thermocouple feedback loop to dynamically control the temperature. The aging process is performed for 100 h, according to the standard. The time is counted as soon as the target temperature is reached. After aging, the samples are cooled to room temperature and then evaluated using FT-IR analysis as described in Section 2.2.1.
2.6. Preignition Evaluation
The effects of the DT addition were tested first using the dosing method mentioned in the introduction. This method is schematically represented in Figure 3. Figure 3b illustrates the outcome of the PI test performed in [7]. The procedure was designed to operate the engine at a constant load and speed for 10 to 20 min. Subsequently, the oil dosing is activated. Oil dosing directly increases the likelihood of PI by introducing oil droplets in the intake, allowing the consistent observation of an otherwise random phenomenon. A further step of constant load operation follows the oil dosing step. The peak cylinder pressure (PCP) is monitored and evaluated continuously throughout the test. The test itself is repeated twice. As is possible to see in Figure 3b, during the test, the oil consumption is artificially raised.
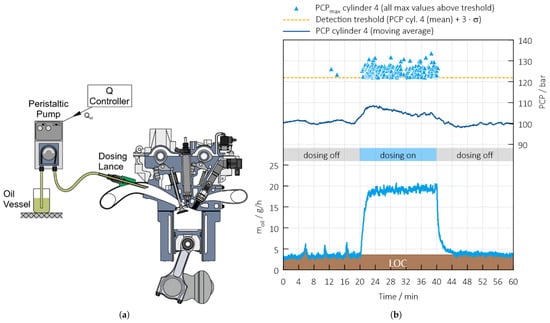
Figure 3.
Represented in (a) is a schematic representation of the oil dosing method, and in (b) a typical outcome of one PI test with 20-min dosing from [7]. The abscissa represents the time in minutes. The data are presented on multiple y-axes, with the dosing oil mass flow rate in grams per hour, the state of the dosing unit, and the PCP shown. The maximum peak cylinder pressure (PCPmax) is obtained by adding the threshold of the average PCP plus three standard deviations. In the figure, only those instances where the PCPmax value exceeds the threshold are plotted. The oil consumption was artificially increased, as can be seen in the lower section of the graph.
In this research, a light-duty vehicle engine, with its specifications summarized in Table 2 was used to perform all the investigations related to PI. The test was performed for each oil with and without 10% DT, first for 10 min without oil dosing, followed by 10 min of oil dosing, then 10 min without it again, with constant PCP monitoring. This procedure was repeated twice. In this study, the oil consumption was artificially increased from an average of 4 g per hour to an average of 10 g during the dosing. After the test, the engine is operated in stationary conditions, and the PI are evaluated with the same criteria as during the oil dosing. The results are then compared. The operating points are listed in Table 3.
Table 2.
Engine data specification.
Table 3.
Operating condition of the PI test.
3. Results and Discussion
3.1. Reaction Yield
After the adapted two-step reaction, 82% of the hydrogen atoms were exchanged for deuterium. The conversion rate was calculated using the calibration curve discussed in Section 2. Using DT with the obtained deuterium concentration, only 4–5% tracer addition is necessary for an accurate oil consumption measurement.
3.2. Chemical Analysis
3.2.1. FT-IR Analysis Results
A comparison between the FT-IR spectrum of PAO 8 and PAO 8-d can be seen in Figure 4.
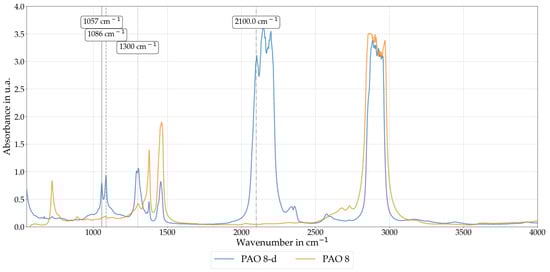
Figure 4.
FT-IR spectrum of PAO 8 before and after the reaction, referred to as PAO 8 and PAO 8-d respectively. From the comparison, it is possible to observe the characteristic deuterium-carbon peaks, which can be used to evaluate the deuteration percentage as in [11].
Unlike the PAO 8 spectrum the PAO 8-d has four new characteristic peaks:
- One peak with wavenumber at ≈1057 cm−1;
- One peak with wavenumber at ≈1086 cm−1;
- One peak with wavenumber at ≈1300 cm−1;
- One peak with wavenumber at ≈2100 cm−1.
The wavenumber can be calculated using Equation (4), where c is the speed of light and k is the force constant of the covalent bond linking two atoms with atomic masses and , respectively. When one of the two atoms, i.e., hydrogen, is exchanged with deuterium, doubling the mass, the force k remains constant, but the wavenumber associated with the characteristic vibrational modes shifts by a factor of .
This explains the shift of the peaks at 1450 cm−1 (CH2 scissoring) to around 1050 cm−1 and 1380 cm−1 (CH3 bending) to around 1086 cm−1. The peak at 2100 cm−1 corresponds to the peak at 3000 cm−1 (CH stretch), shifted by about the factor . The peak at 1300 cm−1 might result from the activation of an otherwise IR inactive peak, which can be seen in the spectra due to the partial deuteration. The peaks’ shift can be used for fast and low-cost determination of deuterium concentration in lubricating oil, as presented in [11] and in Figure 5.
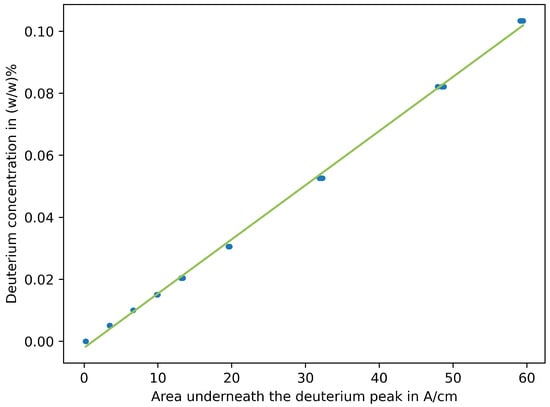
Figure 5.
Linear correlation between deuterium concentration and area in the IR spectrum (blue dots: measurement points, green line: regression line) from [11].
Oil A and B are analyzed before and after adding 10% DT. The FT-IR spectra of Oil A before and after the DT addition can be seen in Figure 6. After the DT addition, the peaks’ intensity in the region 600–1800 cm−1 is reduced. This effect is caused by the additives’ concentration reduction. On the other hand, it is possible to observe an increase in the peaks’ intensity at 1050 cm−1, 1086 cm−1, 1300 cm−1, and especially 2100 cm−1, which are the DT’s characteristic peaks. Using the standards mentioned in Section 2.2.1, it is possible to confirm that the addition of the tracer did not cause an increase in oxidation. Instead, the oxidation area is reduced from 12.35 to 10.40. Similarly, the antiwear area is reduced from 12.47 to 12.12. It is safe to assume that the depletion of the additives causes the reduction in intensity and that the tracer does not cause any unexpected reactions or side products.
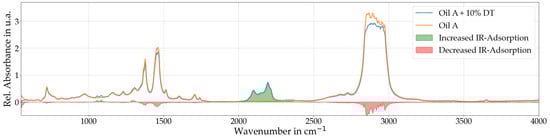
Figure 6.
FT-IR Spectrum of the Oil A before and after the addition of the DT, in orange the sample before, and in blue the sample after the addition. The green areas show an increase in the IR absorption, while the red areas show a decrease. In the figure, a large increase in the aforementioned DT characteristic peaks can be observed, while a small depletion of the other peaks can be distinguished.
Similar observations can be drawn from Oil B results, which can be observed in Figure 7. A decrease in additive concentration, due to reduced absorption, can be observed from the results. Similar to the results of Oil A, the oxidation and antiwear areas showed a measurable decrease. All the results, Oil A and Oil B, are presented in Figure 8.
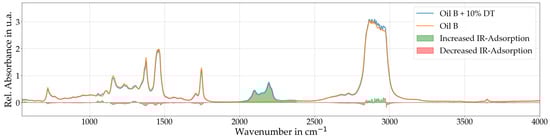
Figure 7.
Similar to Figure 6, this figure depicts the FT-IR Spectrum of the Oil B before and after the addition of the DT, the sample before the addition is in orange, and the sample after the addition is in blue. The areas with an increase in IR absorption are in green, while the areas with a decrease are in red. From the results, a large increase in the DT characteristic peaks can be seen, and there is a slight reduction in the other peaks.
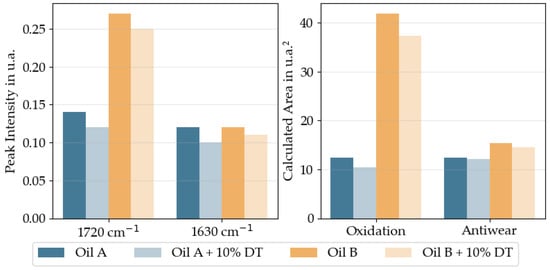
Figure 8.
Results of the FT-IR of Oil A and Oil B before and after the addition of 10% DT. The results representing the oxidation and antiwear areas are obtained using the standards and machinery described in the material section. Also, two non-characteristic wavenumbers, 1720 cm−1 and 1630 cm−1, are chosen to display the peak intensity reduction, caused by the dilution of the additive package, in the region 600–1800.
3.2.2. TAN and TBN Results
The TAN values experienced minor changes in Oil A and Oil B, while the TBN values had a slight decrease in value in Oil A and Oil B. The results are overall very similar, and there are practically no changes in TAN and TBN. The results are summarized in Table 4.
Table 4.
Comparison of the variation of the TAN and the TBN results before and after the DT addition.
3.3. Rheological Analysis Results
The investigated rheological properties of PAO 8 and PAO 8-d are listed in Table 5 and Table 6. The measured kinematic viscosity of PAO 8 at 40 °C is 48.85 mm2/s, while the kinematic viscosity of the tracer at the same temperature is 44.27 mm2/s with a relative change of 10%. At 100 °C, the relative difference is reduced to 8%. The addition of the tracer exhibits different effects on the relative variation of the formulated oils. The relative change in the formulated oil is given mainly by the difference in starting viscosity. Oil A has a kinematic viscosity of 66.3 mm2/s at 40 °C and 11.8 mm2/s at 100 °C, corresponding to a relative change of 4.75% and 6.31%, respectively. Oil B instead has a kinematic viscosity of 109.8 mm2/s at 40 °C and 13.2 mm2/s at 100 °C. The tracer’s addition causes a relative change of 10.8% at 40 °C and 6.45% at 100 °C. Overall, the addition of tracer has a minor influence on the VI. The values are summarized in Table 5.
Table 5.
Measured viscosity values of PAO 8, PAO 8-d, Oil A with and without 10% tracer, and Oil B with and without tracer.
Table 6.
Measured density values of PAO 8, PAO 8-d, Oil A with and without 10% tracer, and Oil B with and without 10% tracer.
The difference in density between the samples with and without tracer can be considered minor and is summarized in Table 6.
3.4. Tribological Analysis Results
From the results of the ball-on-disk experiment, it is possible to determine the CoF. The results are shown in Figure 9 and Figure 10. The CoF of the Oil A slightly decreases with the addition of the tracer, from 0.143 to 0.133.
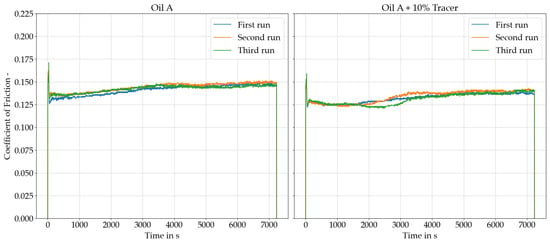
Figure 9.
Ball test results: CoF Oil A without (Left) and with 10% DT (Right).
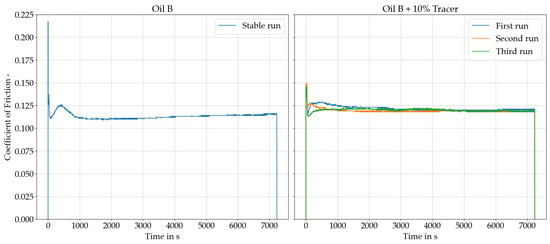
Figure 10.
Ball test results: CoF Oil B without (Left) and with 10% DT (Right).
The results of Oil B led to inconclusive results; two of the three repetitions of the formulated oil without the tracer led to unstable results with big fluctuations. Using the stable repetition, it is possible to observe a slight increase in the CoF, going from 0.113 to 0.120. The results of the Oil B can be seen in Figure 10. The results of the tribological analysis are summarized in Table 7.
Table 7.
Summary of the CoF results obtained with the ball test.
From the analysis of the imprint that the ball left on the accompanying piece, it is possible to obtain four values: two imprint ball diameters, the wear surface, and the wear scar volume. From all the results, it can be observed that the samples with the tracer leave smaller scar diameters, less wear area, and around 50% less wear scar volume. The ball-on-disk experimental results can be seen in the Supplementary Materials and are summarized in Figure 11.
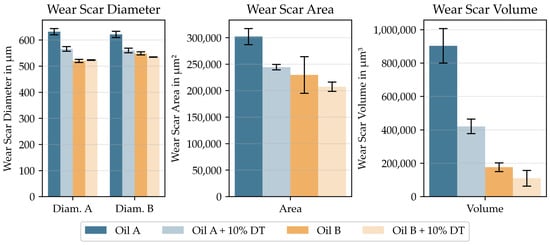
Figure 11.
Wear results obtained with the ball test. The wear scar diameter is measured twice, once vertically (A) and horizontally (B). Only Oil B stable results are depicted in the diagram.
3.5. Effects on the Preignition
The effects of adding 10% DT have been first analyzed using the oil dosing technique described in Section 2.6. In order to clearly observe the tracer effects on the PI, double the necessary amount of DT required for an LOC investigation was added. Oil A and Oil B with 10% DT addition and without the tracer were investigated. The obtained results are shown in Figure 12.
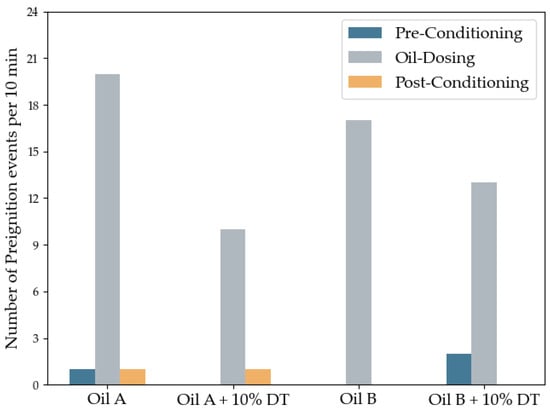
Figure 12.
Comparison of the tracer effects on the oil-caused PI. In blue during pre-conditioning, in grey during oil-dosing, and in orange during post-conditioning.
From the results obtained, it is possible to observe that the tracer does not cause an increase in PI events but rather a decrease. This decrease is more pronounced in the case of Oil A. In both cases, the number of PI events is in the same order of magnitude. The changes in a number of PI events during both pre-conditioning and post-conditioning are negligible. The findings obtained using the oil dosing technique have been corroborated by operating the engine under stationary conditions with and without the tracer. The exact settings are listed in Table 3. In this case, only Oil A has been tested; the results can be observed in the Figure 13.
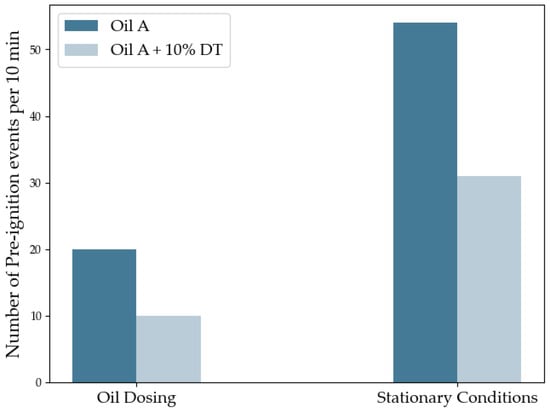
Figure 13.
Comparison of DT addition effects on the number of PI events per 10 min. On the left, results obtained during oil dosing were 20 events for Oil A and 10 events for Oil A + 10%DT can be observed. On the right, the results obtained during stationary conditions. During stationary conditions, 54 events for Oil A and 31 events for Oil A + 10%DT were recorded. Both conditions are listed in Table 3.
The stationary condition investigations on the complete engine using Oil A—with and without 10% DT—as operating lubricant, showed a similar pattern to the measurements conducted with the oil dosing method. While the absolute values are not directly comparable, as the tests were carried out at two different operating points, these investigations demonstrated that the dosing method provides transferable results to real engine operation. Thus, this method allows for relatively simple and reproducible testing of various oil formulations with regard to PI.
3.6. Oil Aging Test
Both oils, with and without the DT, were aged following the procedure outlined in Section 2.5. This was performed to ensure that the tracer does not affect the degradation of the base oil and additives, as well as to demonstrate the stability of the tracer and its concentration under high-temperature conditions. After 100 h of aging, the oil samples with and without the tracer were analyzed with the FT-IR, and the spectra obtained were compared. It was observed that the aging behavior of oils with and without DT is almost identical in terms of oxidation and degradation of antiwear additives.The behavior of Oil A differs from that of Oil B. However, the behavior of Oil A is similar to that of Oil A with DT added, and the behavior of Oil B is similar to that of Oil B with DT added. The results for Oil A are presented in Figure 14. From the analysis, it is evident that in both cases, with and without DT, the peak at 1720 cm−1 increased, while the peak at 1630 cm−1 remained constant. Also, with and without DT, it is possible to observe a sharp decline in the antiwear area and an increase in the oxidation area. The deuterium concentration instead remains constant after aging.
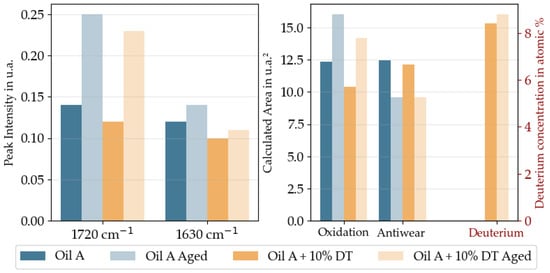
Figure 14.
Graphical representation of Oil A aging results. The results representing the oxidation and antiwear areas are obtained using the standards and machinery described in Section 2.2.1, while the deuterium concentration values are obtained using the calibration curve discussed in Section 3.2.1.
The results for Oil B are shown in Figure 15. Oil B, with and without DT, peaks at 1720 cm−1 increases, while the peak at 1630 cm−1 stays constant. In both cases, with and without DT, an increased oxidation area is observed, but unlike Oil A, no changes in antiwear properties are noted, which could be attributed to the presence of more temperature-resistant antiwear additives. Noticeably, the deuterium concentration stays constant during aging.
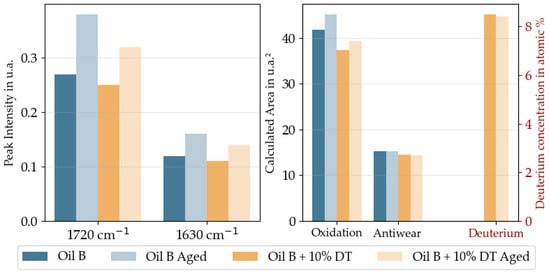
Figure 15.
Graphical representation of Oil B aging results. The results representing the oxidation and antiwear areas are obtained using the aforementioned standards and curves described in Section 2.2.1, and in Section 3.2.1.
4. Conclusions
Highly precise and reliable methods of LOC measurement are essential for the development of modern, robust, and low-emission engines. This publication aims to demonstrate the viability of the recently introduced deuterium tracer LOC method and its suitability for H2-ICEs by studying the influence of DT addition on lubricating oil properties and engine combustion behavior. This paper shows that the newly introduced PAO 8-d as DT does not have a negative influence on the lubricating oil properties and performance of internal combustion engine oils, particularly in relation to PI. The addition of PAO 8-d to the previously introduced DTs based on PAO 6-d and PAO 4-d further increases the flexibility of the method. In this work, the following was observed:
- Minor to no changes in standard oil condition parameters, such as a TAN, TBN.
- No side reactions were observed by tracer addition in the fully formulated oils, as indicated by the lack of unexpected FT-IR peaks.
- The addition of the PAO 8-d has only a minor influence on rheological parameters such as viscosity and density. Even doubling the amount of required lubricating oil causes no significant shift and does not exceed the manufacturer’s limits. The deviation from the original formulation was around 6% for both oils A and B.
- No relevant change was observed in the CoF of Oil A and Oil B with and without DT. Nevertheless, a positive impact on the other tribological properties was observed: a relevant reduction in both wear scar area and wear scar volume.
- After thermal alteration, the deuterium concentration remains constant. No drop in tracer concentration has been observed during aging, and no noticeable changes in aging behavior were detected.
- This study shows that adding DT to the fully formulated oil does not cause an increase in PI events, which would otherwise prevent its use for hydrogen engines. In both the PI evaluations, the oil dosing method, and the observation during stationary conditions, the frequency of PI events was reduced. The causes of this effect have yet to be investigated. The difference in PI frequency between oil with DT and oil without DT is more likely reduced if, instead of 10% DT, a standard amount of tracer was used.
Supplementary Materials
The following supporting information can be downloaded at: https://www.mdpi.com/article/10.3390/lubricants13080351/s1, Spectrasyn8 Datasheet and Results wear.
Author Contributions
Investigation, K.G., F.M. and M.V.; data Curation, F.M. and M.V.; writing—original draft preparation, F.M.; writing—review and editing, F.M., M.V. and N.W.; supervision, M.V., B.R. and N.W.; project administration: P.G., M.E. and N.W. All authors have read and agreed to the published version of the manuscript.
Funding
The authors would like to acknowledge the financial support of the “COMET—Competence Centers for Excellent Technologies” Program of the Austrian Federal Ministry for Innovation, Mobility, and Infrastructure, the Austrian Federal Ministry of Economy, Energy, and Tourism, and the Provinces of Salzburg, Styria, and Tyrol for the COMET Centre (K1) LEC GETS. The COMET Program is managed by the Austrian Research Promotion Agency (FFG).
Data Availability Statement
The original contributions presented in this study are included in the Supplementary Materials. Further inquiries can be directed to the corresponding author.
Conflicts of Interest
Authors Martin Vareka, Bernhard Rossegger, Michael Engelmayer, and Nicole Wermuth were employed by the company LEC GmbH. The remaining author declares that the research was conducted in the absence of any commercial or financial relationships that could be construed as a potential conflict of interest.
Abbreviations
| CO2 | Carbon dioxide |
| H2 | Hydrogen |
| HC | Hydrocarbons |
| CA | Crank angle |
| CoF | Coefficient of friction |
| DT | Deuterium tracer |
| FT-IR | Fourier transform infrared spectroscopy |
| H2-ICE | Hydrogen internal combustion engine |
| ICE | Internal combustion engine |
| LOC | Lubricating oil consumption |
| PAO | Poly-alpha olefin |
| PCP | Peak cylinder pressure |
| PI | Preignition |
| TAN | Total acid number |
| TBN | Total base number |
| VI | Viscosity index |
References
- Köch, K. Experience with Oil Consumption Measurements on the Engine Test Bed; SAE Technical Paper 931667; SAE International: São Paulo, Brazil, 1993. [Google Scholar] [CrossRef]
- Lensch-Franzen, C.; Gohl, M.; Scholl, P.; Paoloni, F. Impact of Engine Lubricant Volatility on Oil and Particle Emissions. MTZ Worldw. 2019, 80, 44–53. [Google Scholar] [CrossRef]
- Lensch-Franzen, C.; Friedmann, M.; Gohl, M.; Müller, G. Methods for Analysis of HC and Particle Emission. MTZ Worldw. 2018, 79, 40–45. [Google Scholar] [CrossRef]
- Gschiel, K.; Wilfling, K.; Schneider, M. Development of a method to investigate the influence of engine oil and its additives on combustion anomalies in hydrogen engines. Automot. Engine Technol. 2024, 9, 3. [Google Scholar] [CrossRef]
- Chown, D.; Koszewnik, J.; MacKenzie, R.; Pfeifer, D.; Callahan, B.; Vittal, M.; Froelund, K. Achieving Ultra-Low Oil Consumption in Opposed Piston Two-Stroke Engines; SAE Technical Paper 2019-01-0068; SAE International: Austin, TX, USA, 2019. [Google Scholar] [CrossRef]
- Froelund, K. Real-time steady-state oil consumption measurement on commercial SI-engine. SAE Trans. 1999, 108, 1337–1346. [Google Scholar]
- Rossegger, B.; Grabner, P.; Gschiel, K.; Vareka, M. Towards Robust Hydrogen Combustion: Precise Lube Oil Consumption Measurement as an Enabler for Tackling Pre-Ignition; SAE Technical Paper 2024-01-4290; SAE International: Euclid, OH, USA, 2024. [Google Scholar] [CrossRef]
- Fritzsche, G. Entwicklung von Oelverbrauchsmeßmethoden für Kolbenmaschinen unterVerwendung der Radionuklidtechnik; Kernforschungszentrum Karlsruhe Report 2463; Kernforschungszentrum Karlsruhe: Frankfurt, Germany, 1978. [Google Scholar]
- Evans, R. A Tritium-Tracer Technique for the Measurement of Oil Consumption in Gasoline and Diesel Engines. Int. J. Appl. Radiat. Isot. 1973, 24, 19–27. [Google Scholar] [CrossRef]
- Seibold, J.; Zeuner, A.; Röthig, J. A method of measuring oil consumption by labelling with radioactive bromine. Tribo Test 2000, 6, 251–265. [Google Scholar] [CrossRef]
- Vareka, M.; Rossegger, B.; Novotny-Farkas, F.; Engelmayer, M.; Wimmer, A. Deuterium Tracer for Accurate Online Lube-Oil-Consumption Measurement: Stability, Compatibility, and Tribological Characteristics. Lubricants 2022, 10, 84. [Google Scholar] [CrossRef]
- He, C.; Cheng, J.; Zhang, X.; Douthwaite, M.; Pattisson, S.; Hao, Z. Recent Advances in the Catalytic Oxidation of Volatile Organic Compounds: A Review Based on Pollutant Sorts and Sources. Chem. Rev. 2019, 119, 4471–4568. [Google Scholar] [CrossRef] [PubMed]
- O’Keefe, A.; Scherer, J.J.; Paul, J.B.; Saykally, R.J. Cavity ring-down laser spectroscopy (CRDS): History, development, and applications. Amer. Chem. Soc. Symp. Ser. 1999, 720, 71–92. [Google Scholar] [CrossRef]
- Wolak, A.; Zając, G.; Fijorek, K.; Janocha, P.; Matwijczuk, A. Experimental Investigation of the Viscosity Parameters Ranges—Case Study of Engine Oils in the Selected Viscosity Grade. Energies 2020, 13, 3152. [Google Scholar] [CrossRef]
- Verhelst, S.; Wallner, T. Hydrogen-fueled internal combustion engines. Prog. Energy Combust. Sci. 2009, 35, 490–527. [Google Scholar] [CrossRef]
- Luef, R. Development of a Test Method for Determining the Oil Impact on Irregular Combustion Phenomena in Highly Charged Di-Gasoline Engines. PhD Thesis, Graz University of Technology, Graz, Austria, 2015. [Google Scholar]
- Dahnz, C.; Han, K.M.; Magar, M. Vorentflammung bei Ottomotoren: Untersuchung des Auftretens und der Ursache von Selbstzündungen vor Zündungseinleitung bei aufgeladenen Motoren mit hohem Verdichtungsverhältnis; Final Report FVV-Project 931; German National Library: Frankfurt am Main, Germany, 2010. [Google Scholar]
- Heintzel, A. Internationaler Motorenkongress 2023; Springer: Berlin/Heidelberg, Germany, 2024. [Google Scholar] [CrossRef]
- ASTM E2412-10; Standard Practice for Condition Monitoring of In-Service Lubricants by Trend Analysis Using Fourier Transform Infrared (FT-IR) Spectrometry. ASTM International: West Conshohocken, PA, USA, 2010. [CrossRef]
- Agocs, A.; Nagy, A.L.; Tabakov, Z.; Perger, J.; Rohde-Brandenburger, J.; Schandl, M.; Besser, C.; Dörr, N. Comprehensive assessment of oil degradation patterns in petrol and diesel engines observed in a field test with passenger cars—Conventional oil analysis and fuel dilution. Tribol. Int. 2021, 161, 107079. [Google Scholar] [CrossRef]
- Dörr, N.; Agocs, A.; Besser, C.; Ristić, A.; Frauscher, M. Engine Oils in the Field: A Comprehensive Chemical Assessment of Engine Oil Degradation in a Passenger Car. Tribol. Lett. 2019, 67, 68. [Google Scholar] [CrossRef]
- Nadkarni, R.A. Guide to ASTM Test Methods for the Analysis of Petroleum Products and Lubricants; ASTM International: Warrendale, PA, USA, 2007; p. 299. [Google Scholar]
- Oxidation Stability of Lubricating Oils Used in Automotive Transmissions by Artificial Ageing CEC L-48-A-00; Coordinating European Council for the Development of Performance Tests for Fuels, Lubricants and Other Fluids: Brussels, Belgium, 2007.
- Besser, C.; Schneidhofer, C.; Dörr, N.; Novotny-Farkas, F.; Allmaier, G. Investigation of long-term engine oil performance using lab-based artificial ageing illustrated by the impact of ethanol as fuel component. Tribol. Int. 2012, 46, 174–182. [Google Scholar] [CrossRef]


Disclaimer/Publisher’s Note: The statements, opinions and data contained in all publications are solely those of the individual author(s) and contributor(s) and not of MDPI and/or the editor(s). MDPI and/or the editor(s) disclaim responsibility for any injury to people or property resulting from any ideas, methods, instructions or products referred to in the content. |
© 2025 by the authors. Licensee MDPI, Basel, Switzerland. This article is an open access article distributed under the terms and conditions of the Creative Commons Attribution (CC BY) license (https://creativecommons.org/licenses/by/4.0/).