Analysis of the Impact of Frog Wear on the Wheel–Rail Dynamic Performance in Turnout Zones of Urban Rail Transit Lines


Abstract
1. Introduction
- Conducted dimensional testing on frog profiles and wheel tread geometries across different service cycles, quantitatively analyzing the wear distribution characteristics and their evolution patterns with accumulated operational duration.
- Developed vehicle–frog coupled dynamics models reflecting varying wear severity levels by incorporating measured frog profiles from distinct service phases into multi-body dynamics simulations.
- Systematically evaluated the evolution trends of safety performance metrics, ride stability indices, and wheel–rail contact stresses relative to service cycles through dynamics modeling and parametric studies.
2. Investigation and Analysis of Frog Wear
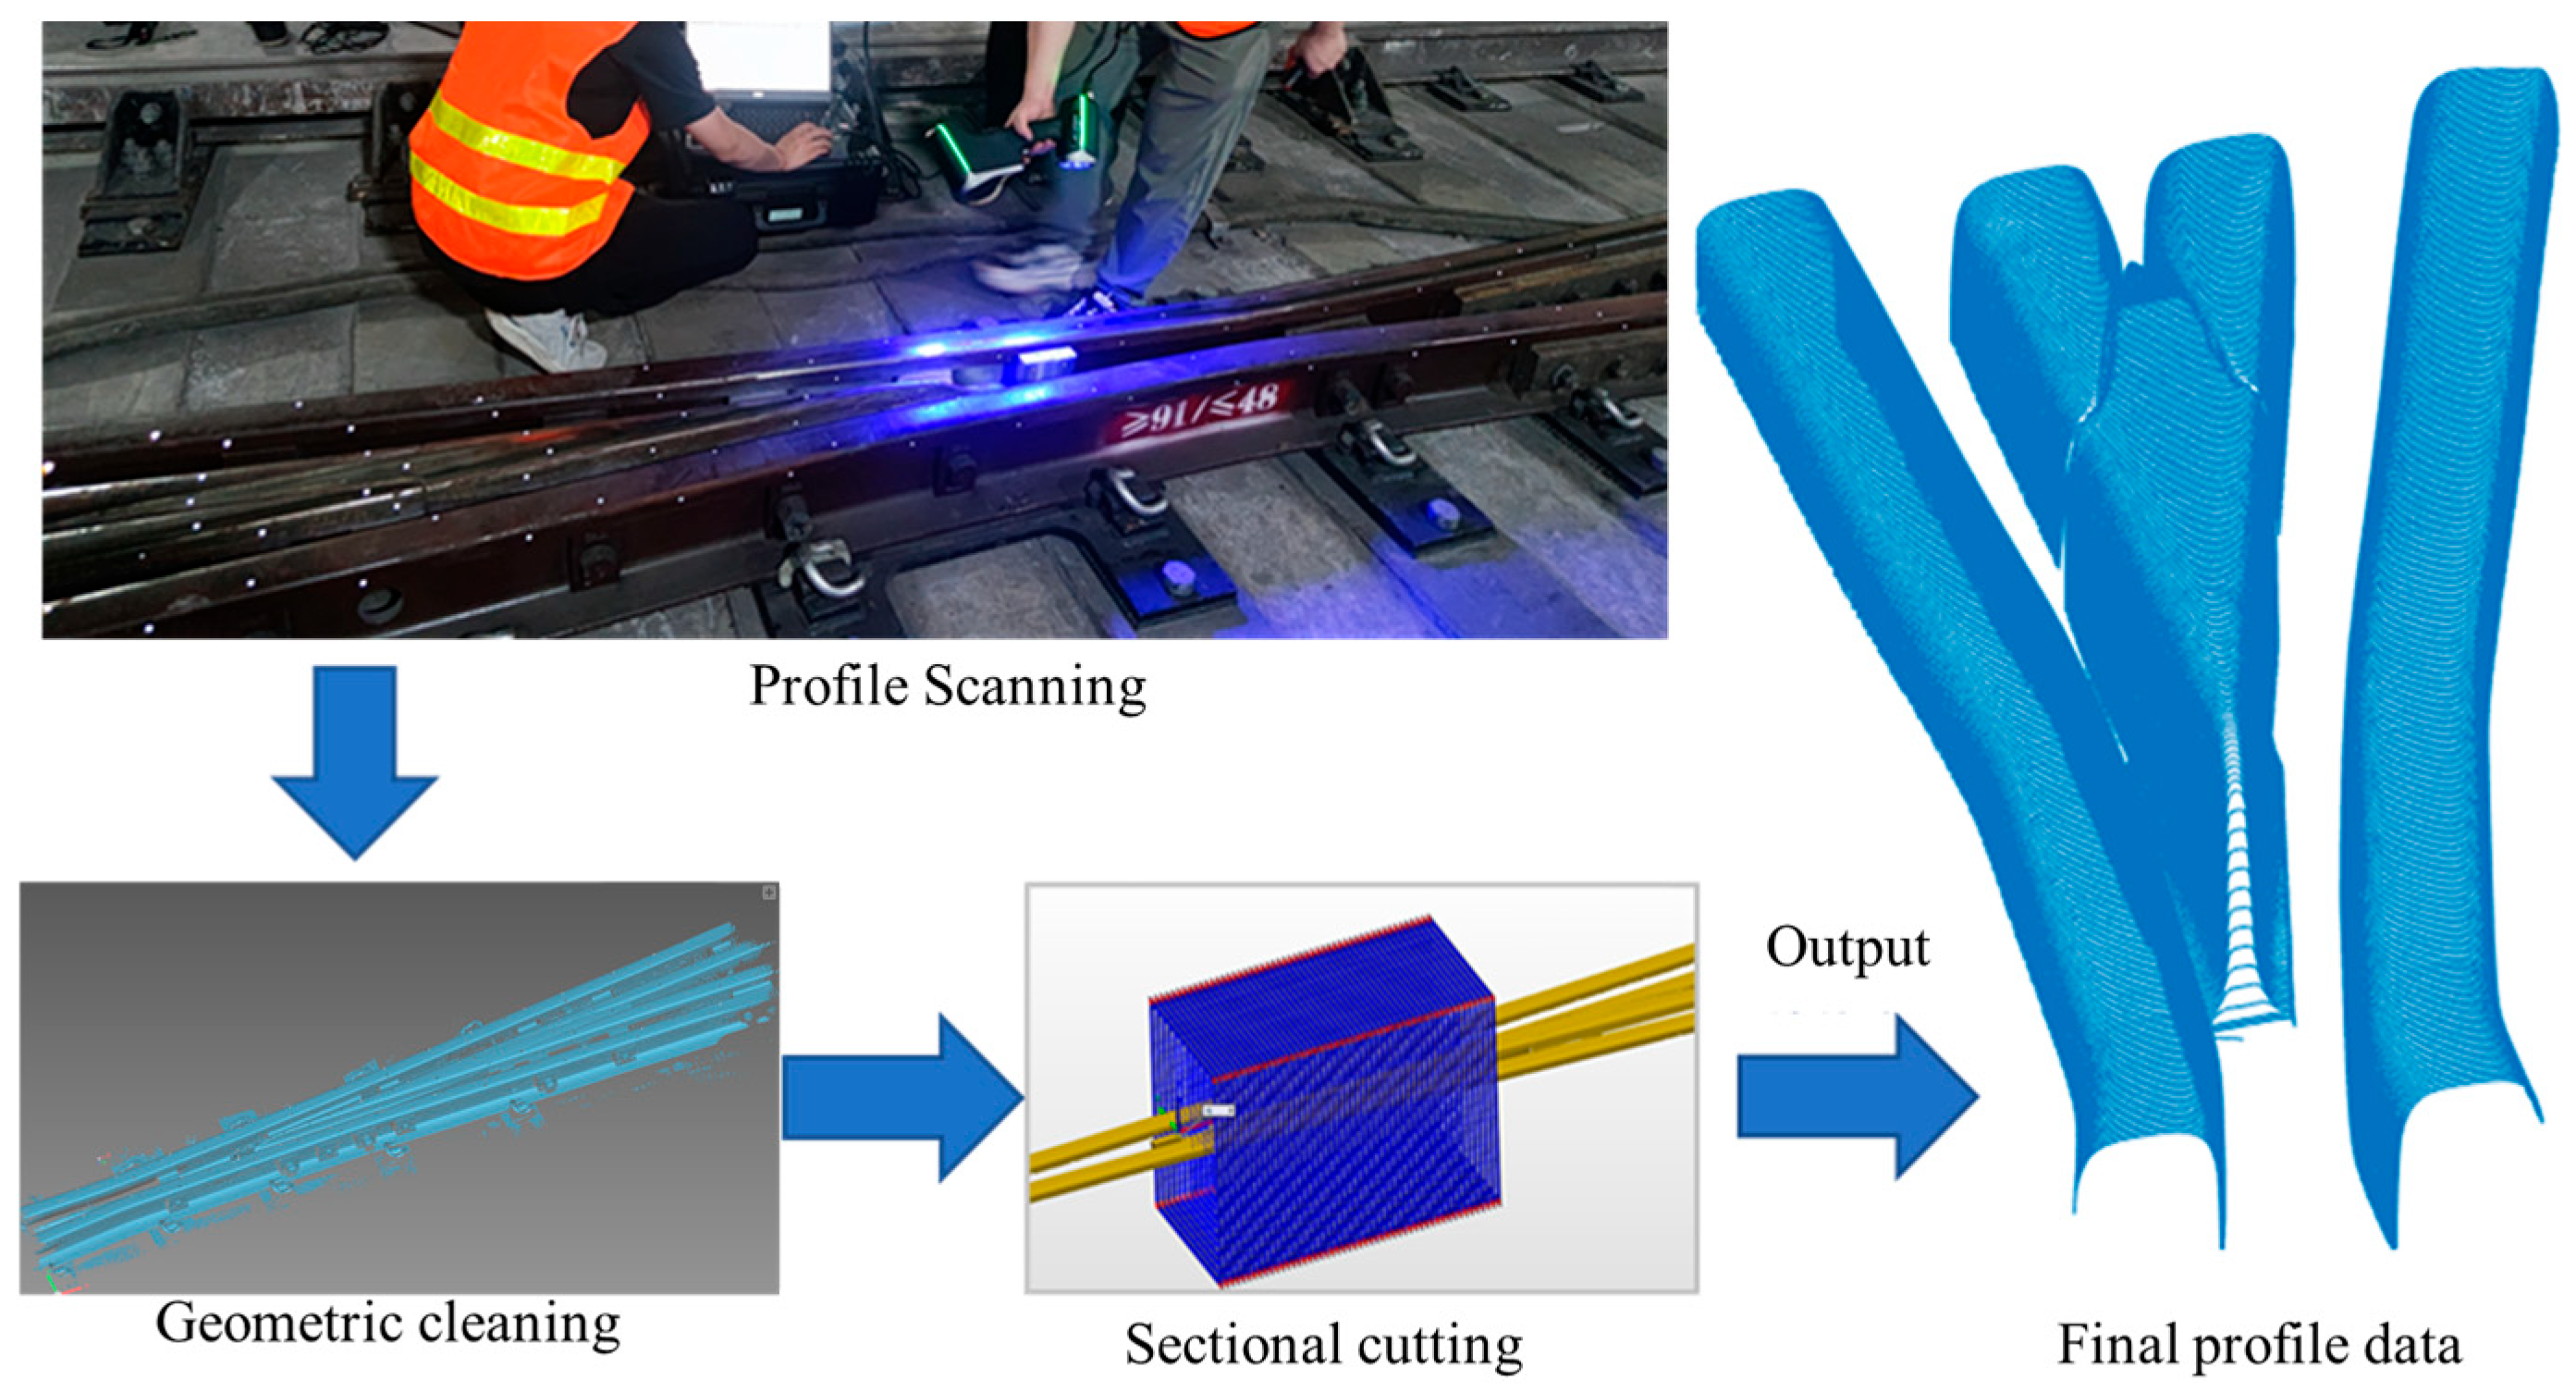
2.1. Investigation of the Defect
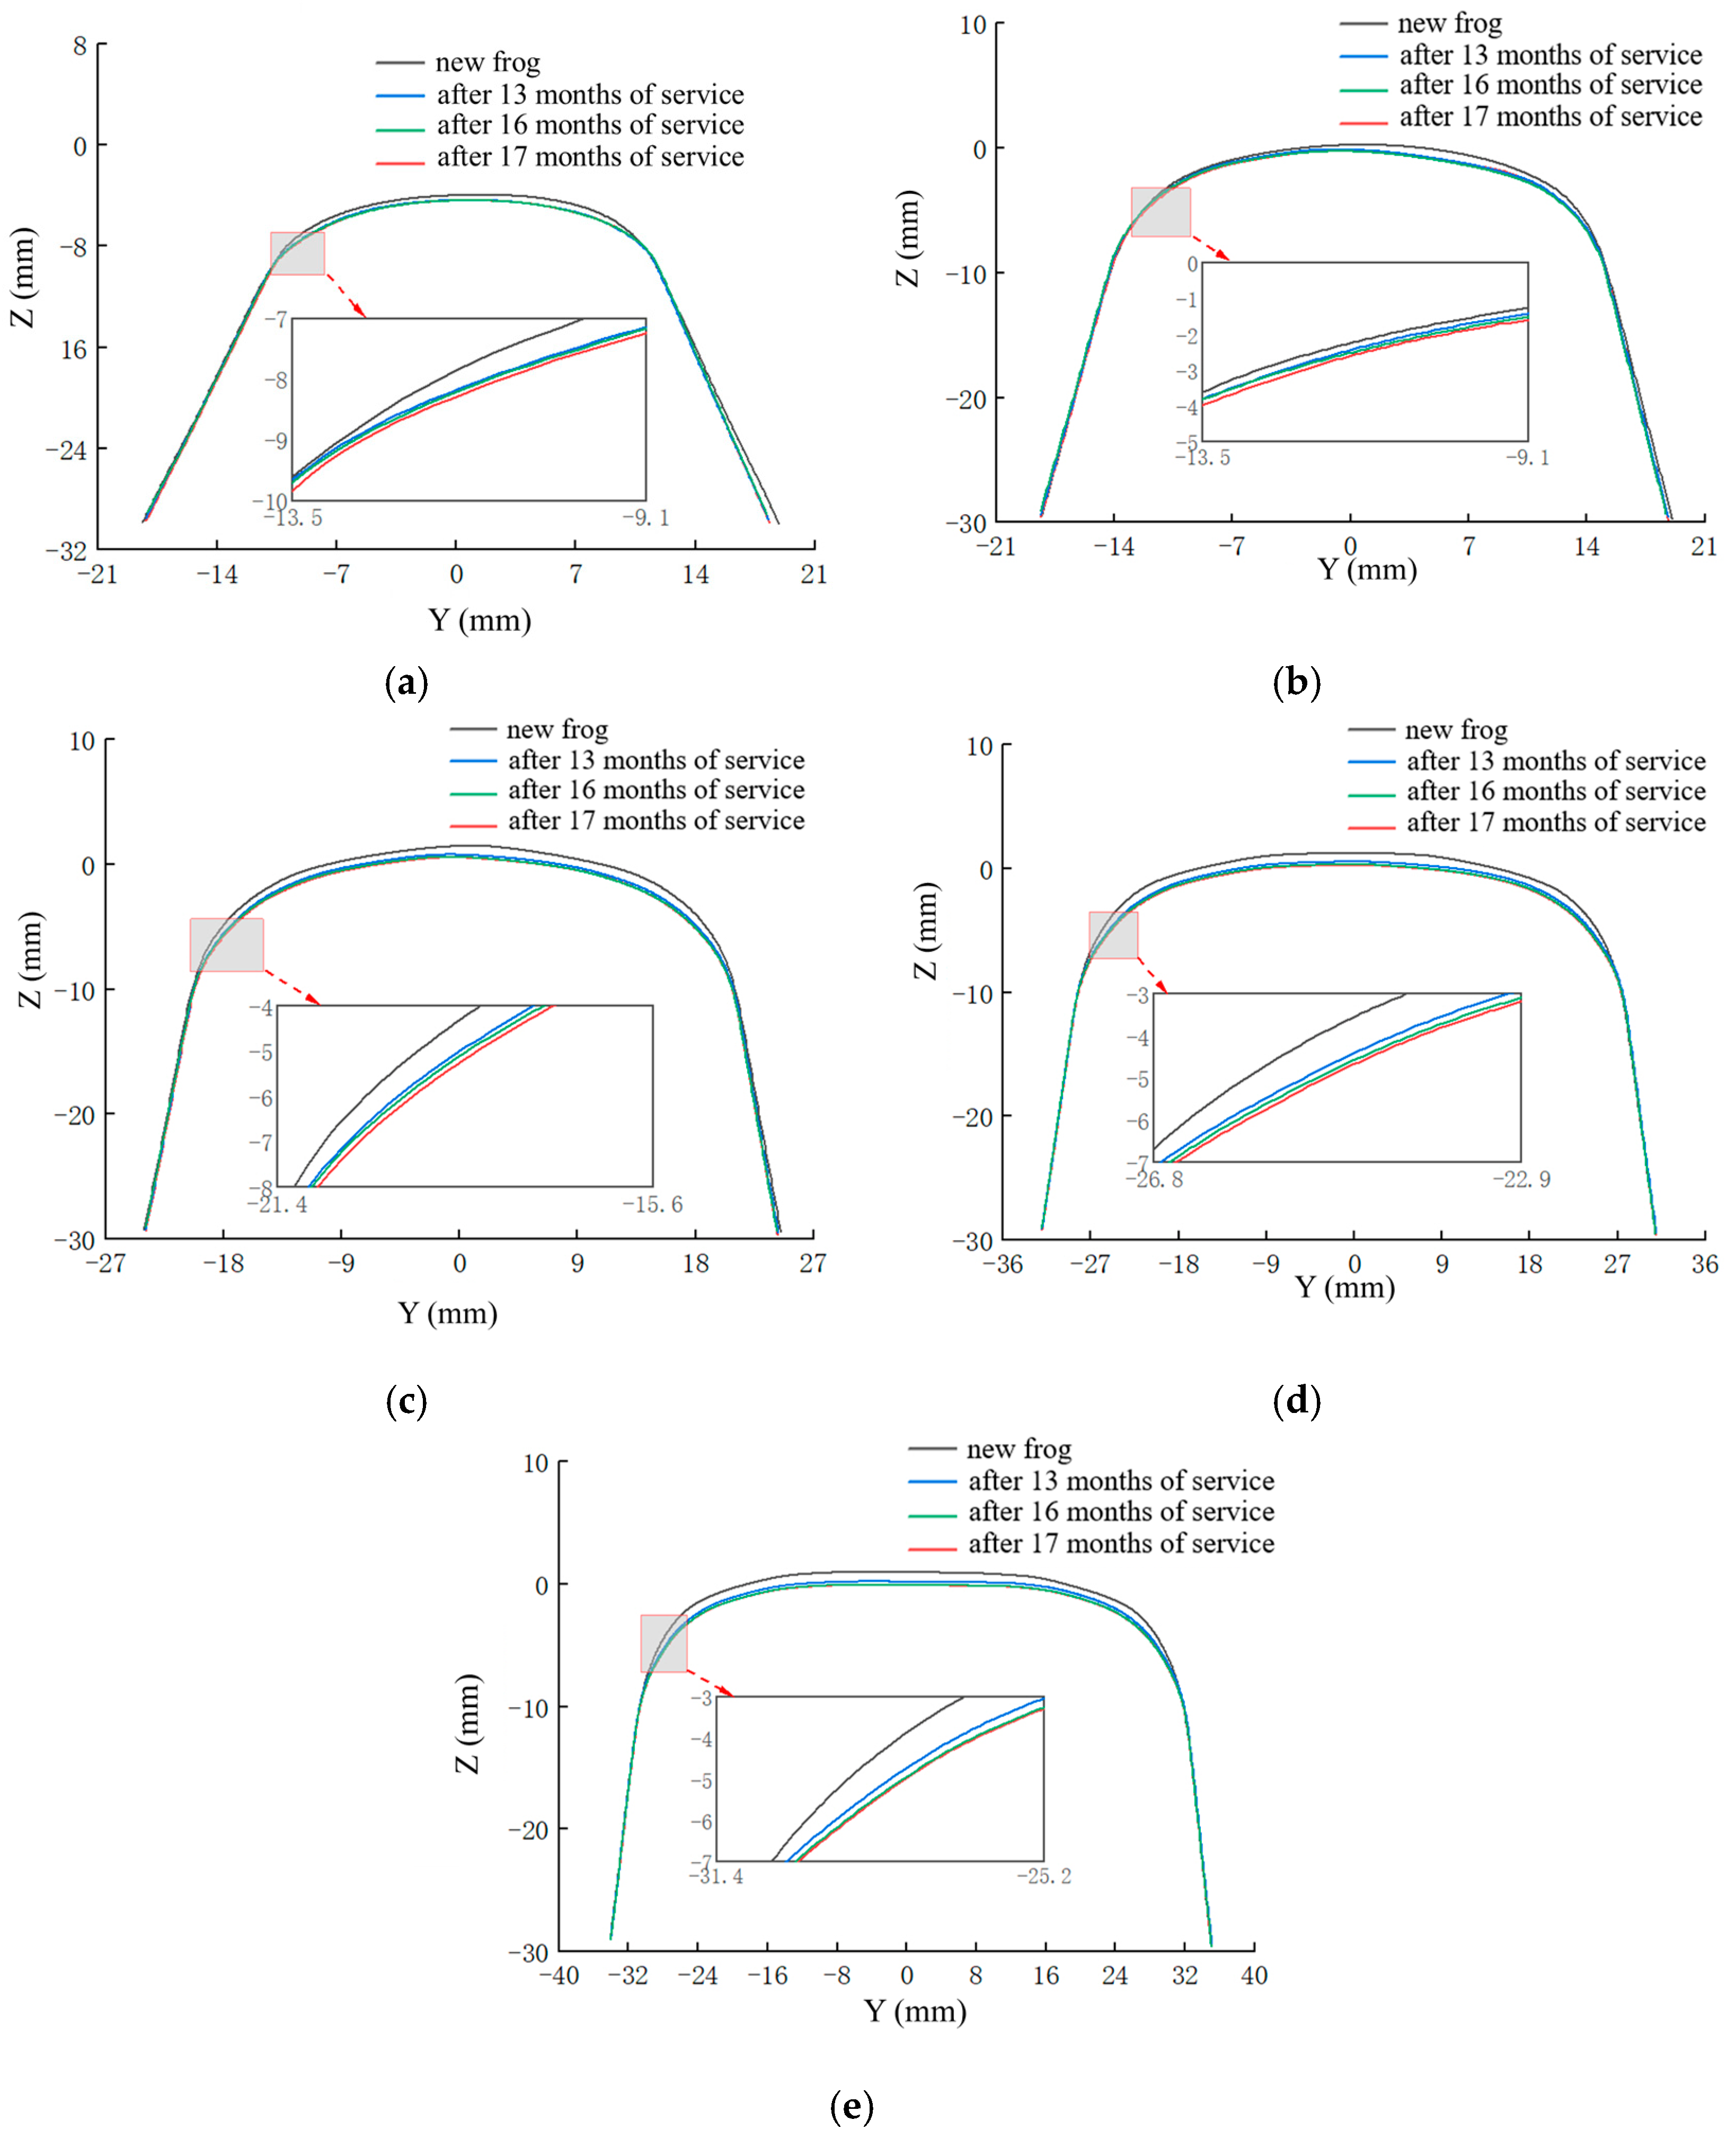
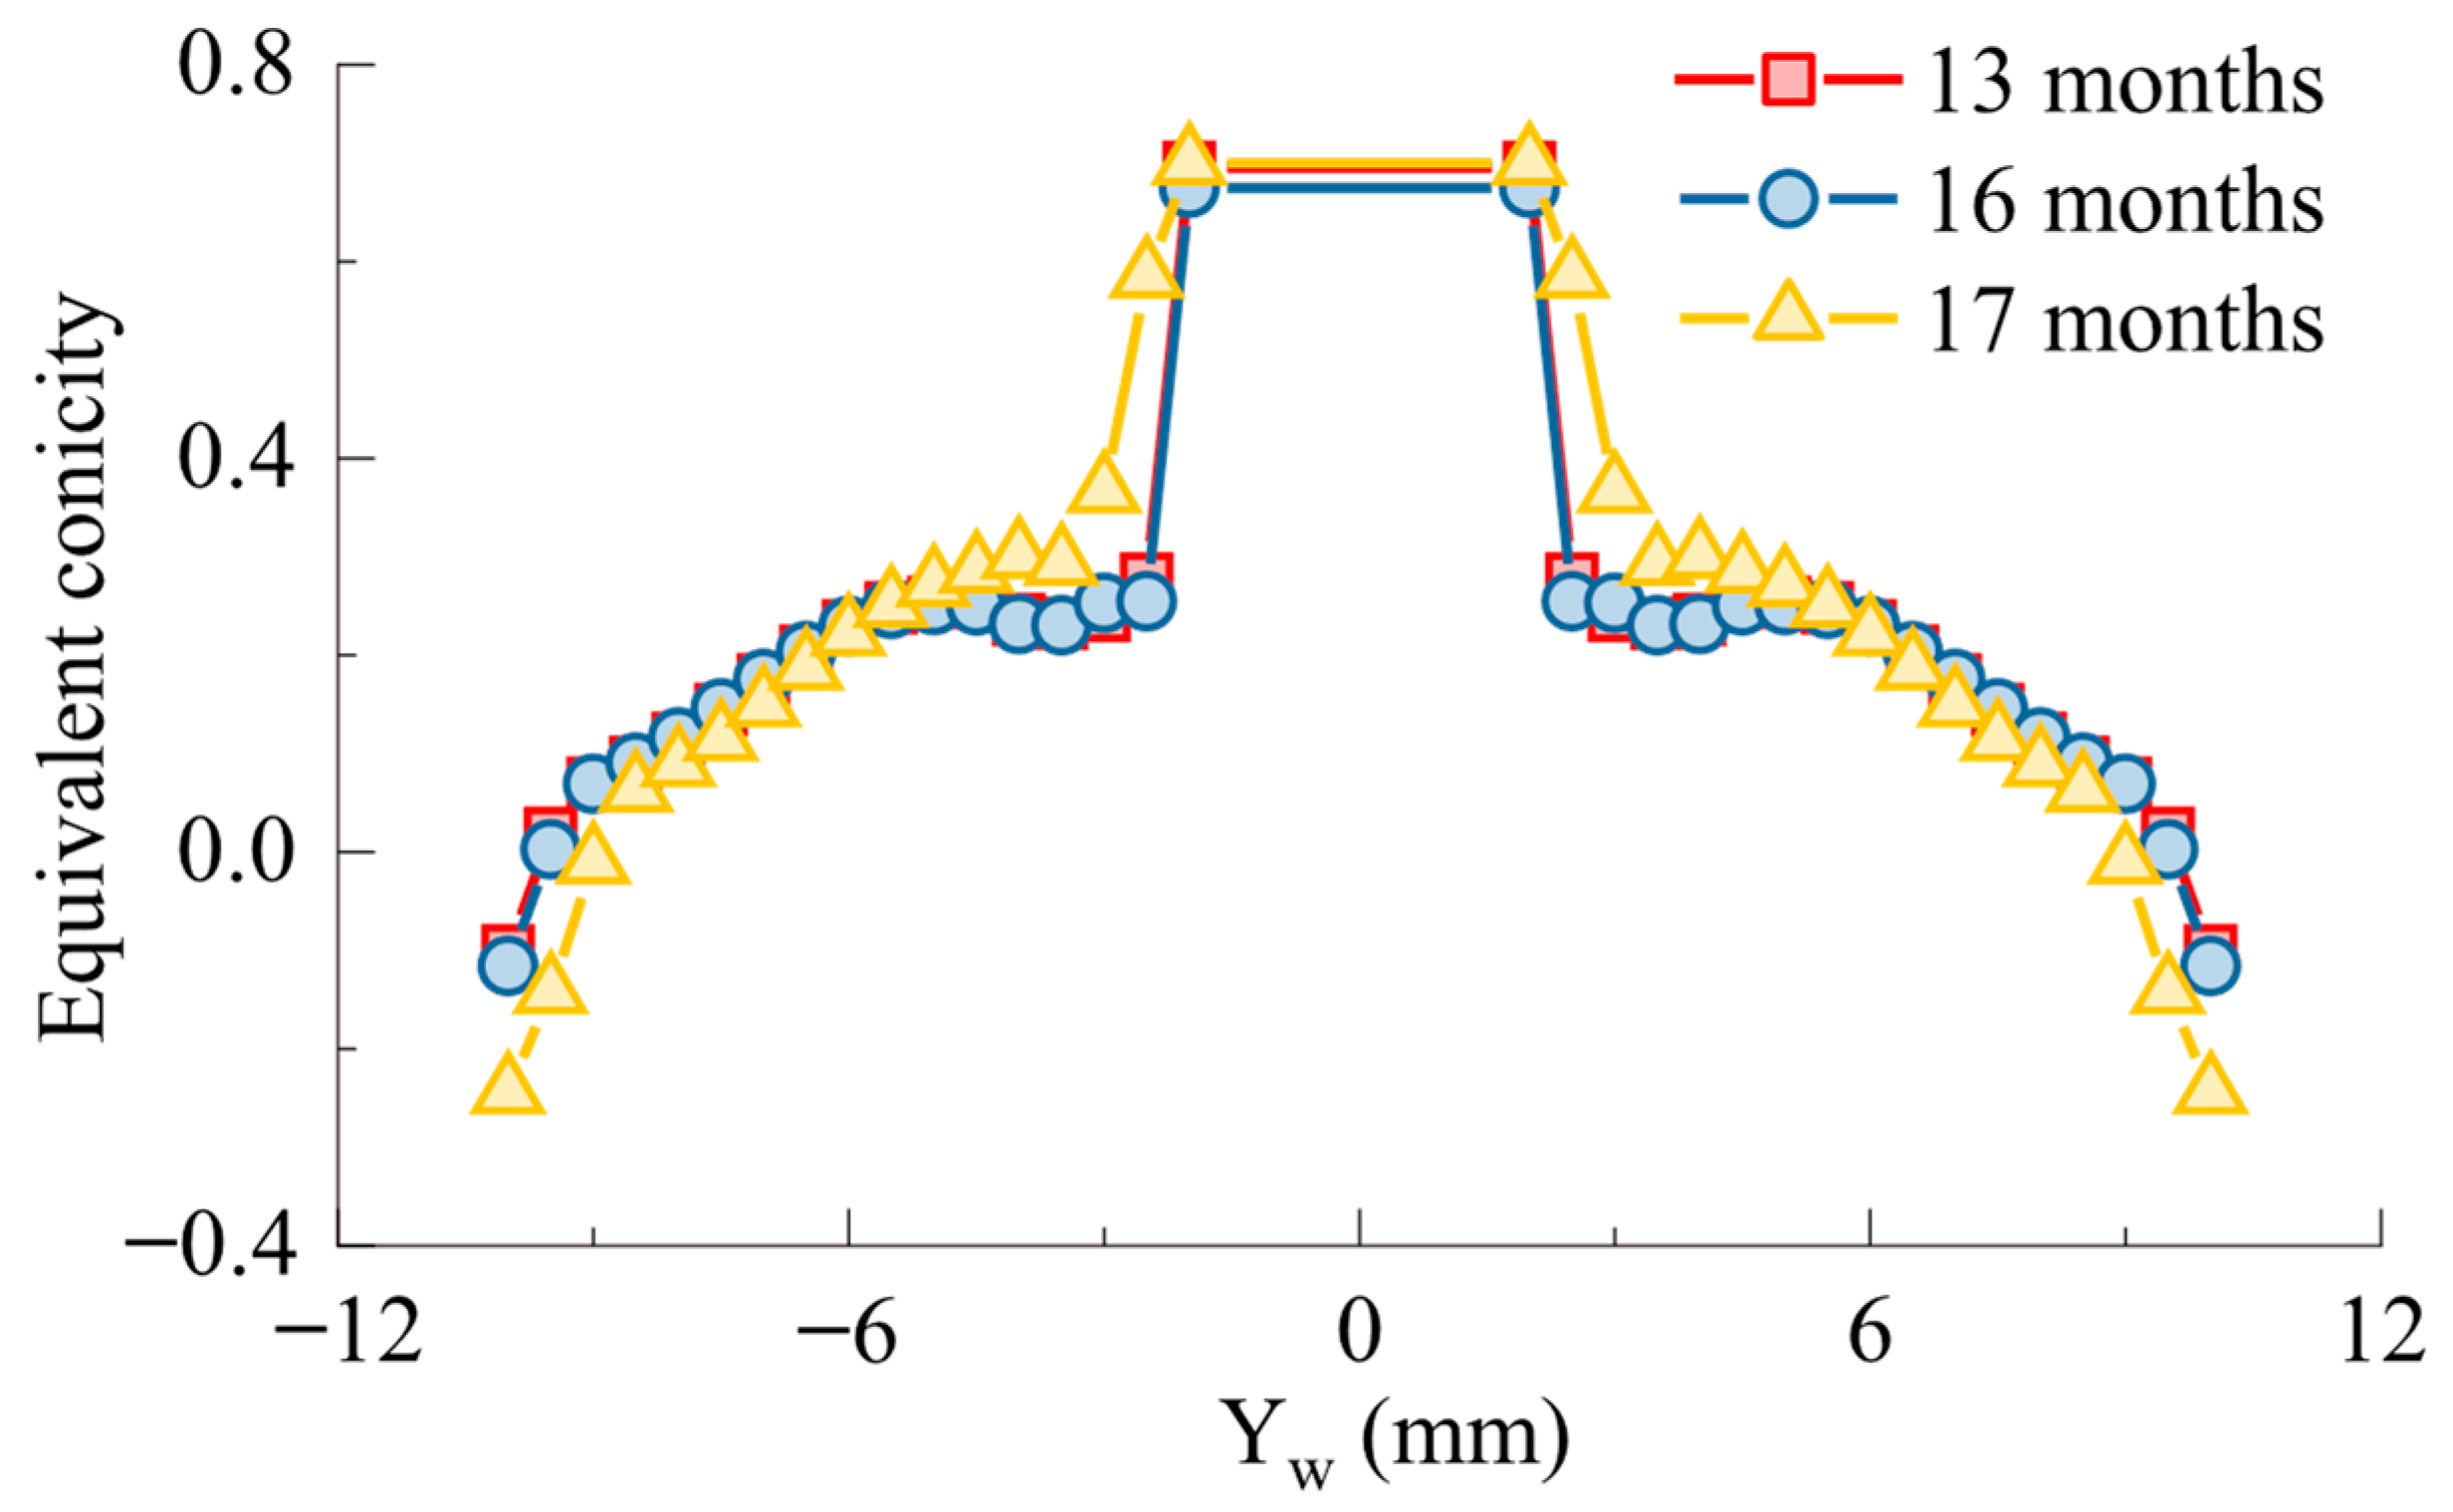
2.2. Influence of the Frog Wear on the Wheel and Rail Profiles
3. Dynamics Model
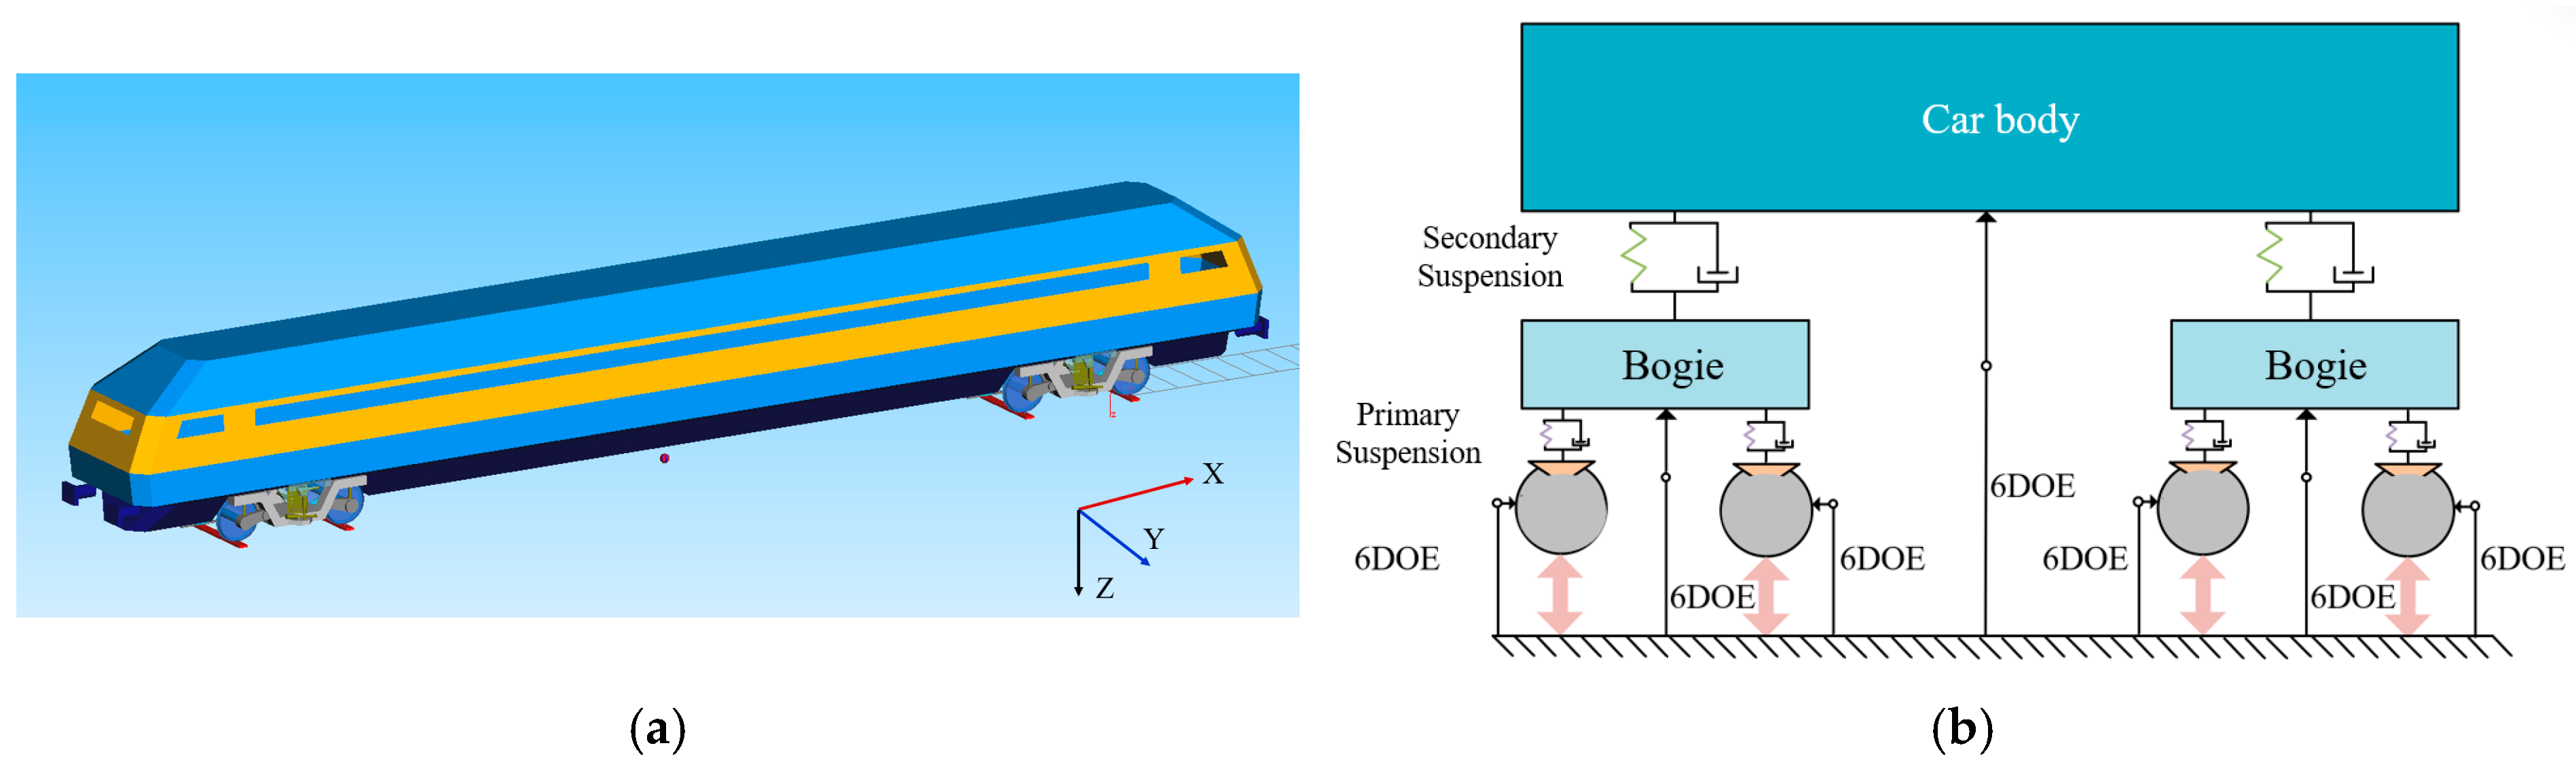
3.1. Vehicle–Turnout Coupled Dynamic Model
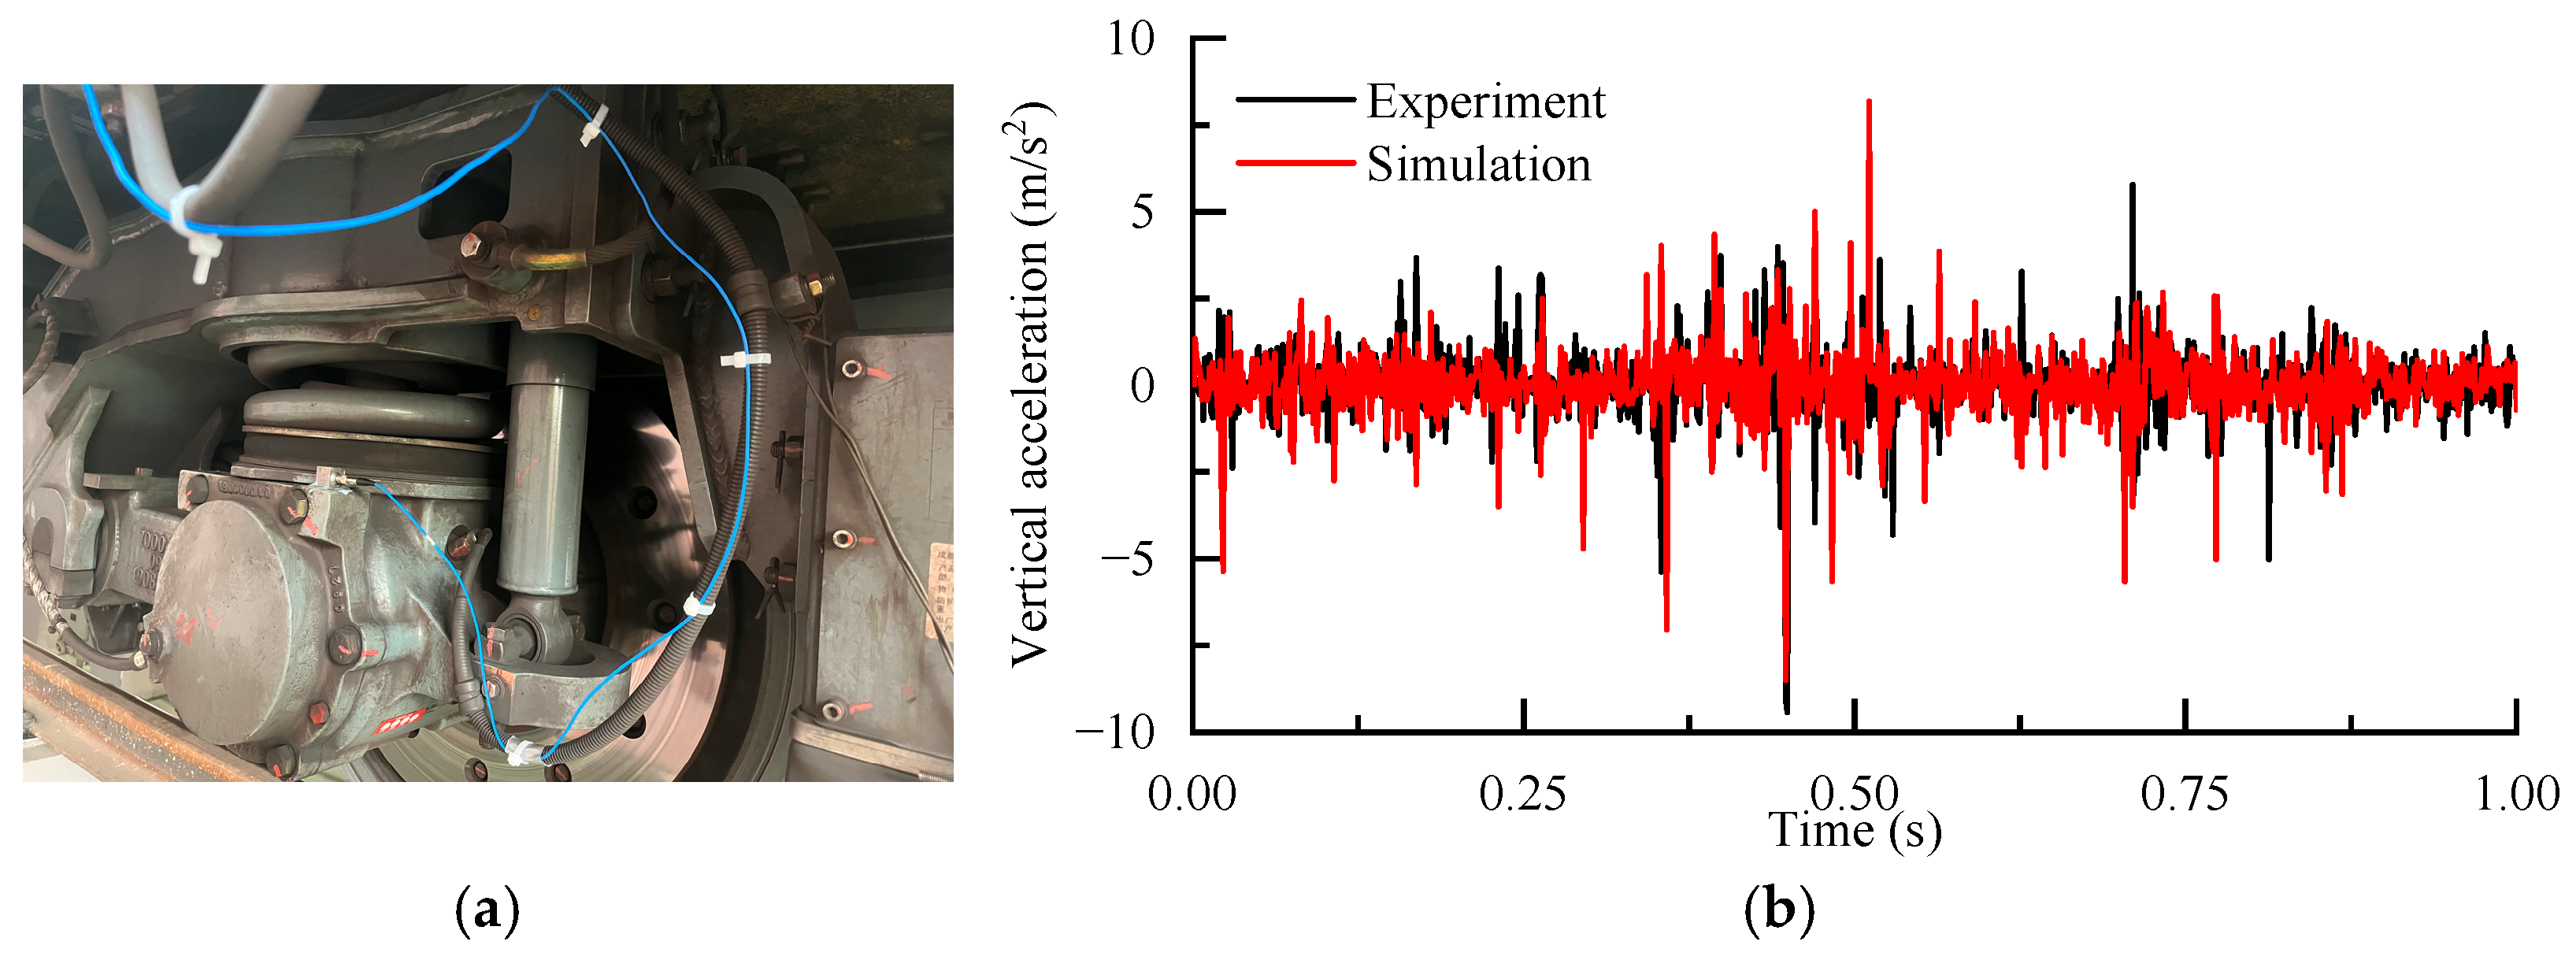
3.2. Model Validation
4. Simulation Analysis
4.1. Wheel–Rail Contact Analysis
4.2. Influence of the Frog Wear on Vehicle Dynamic Performance
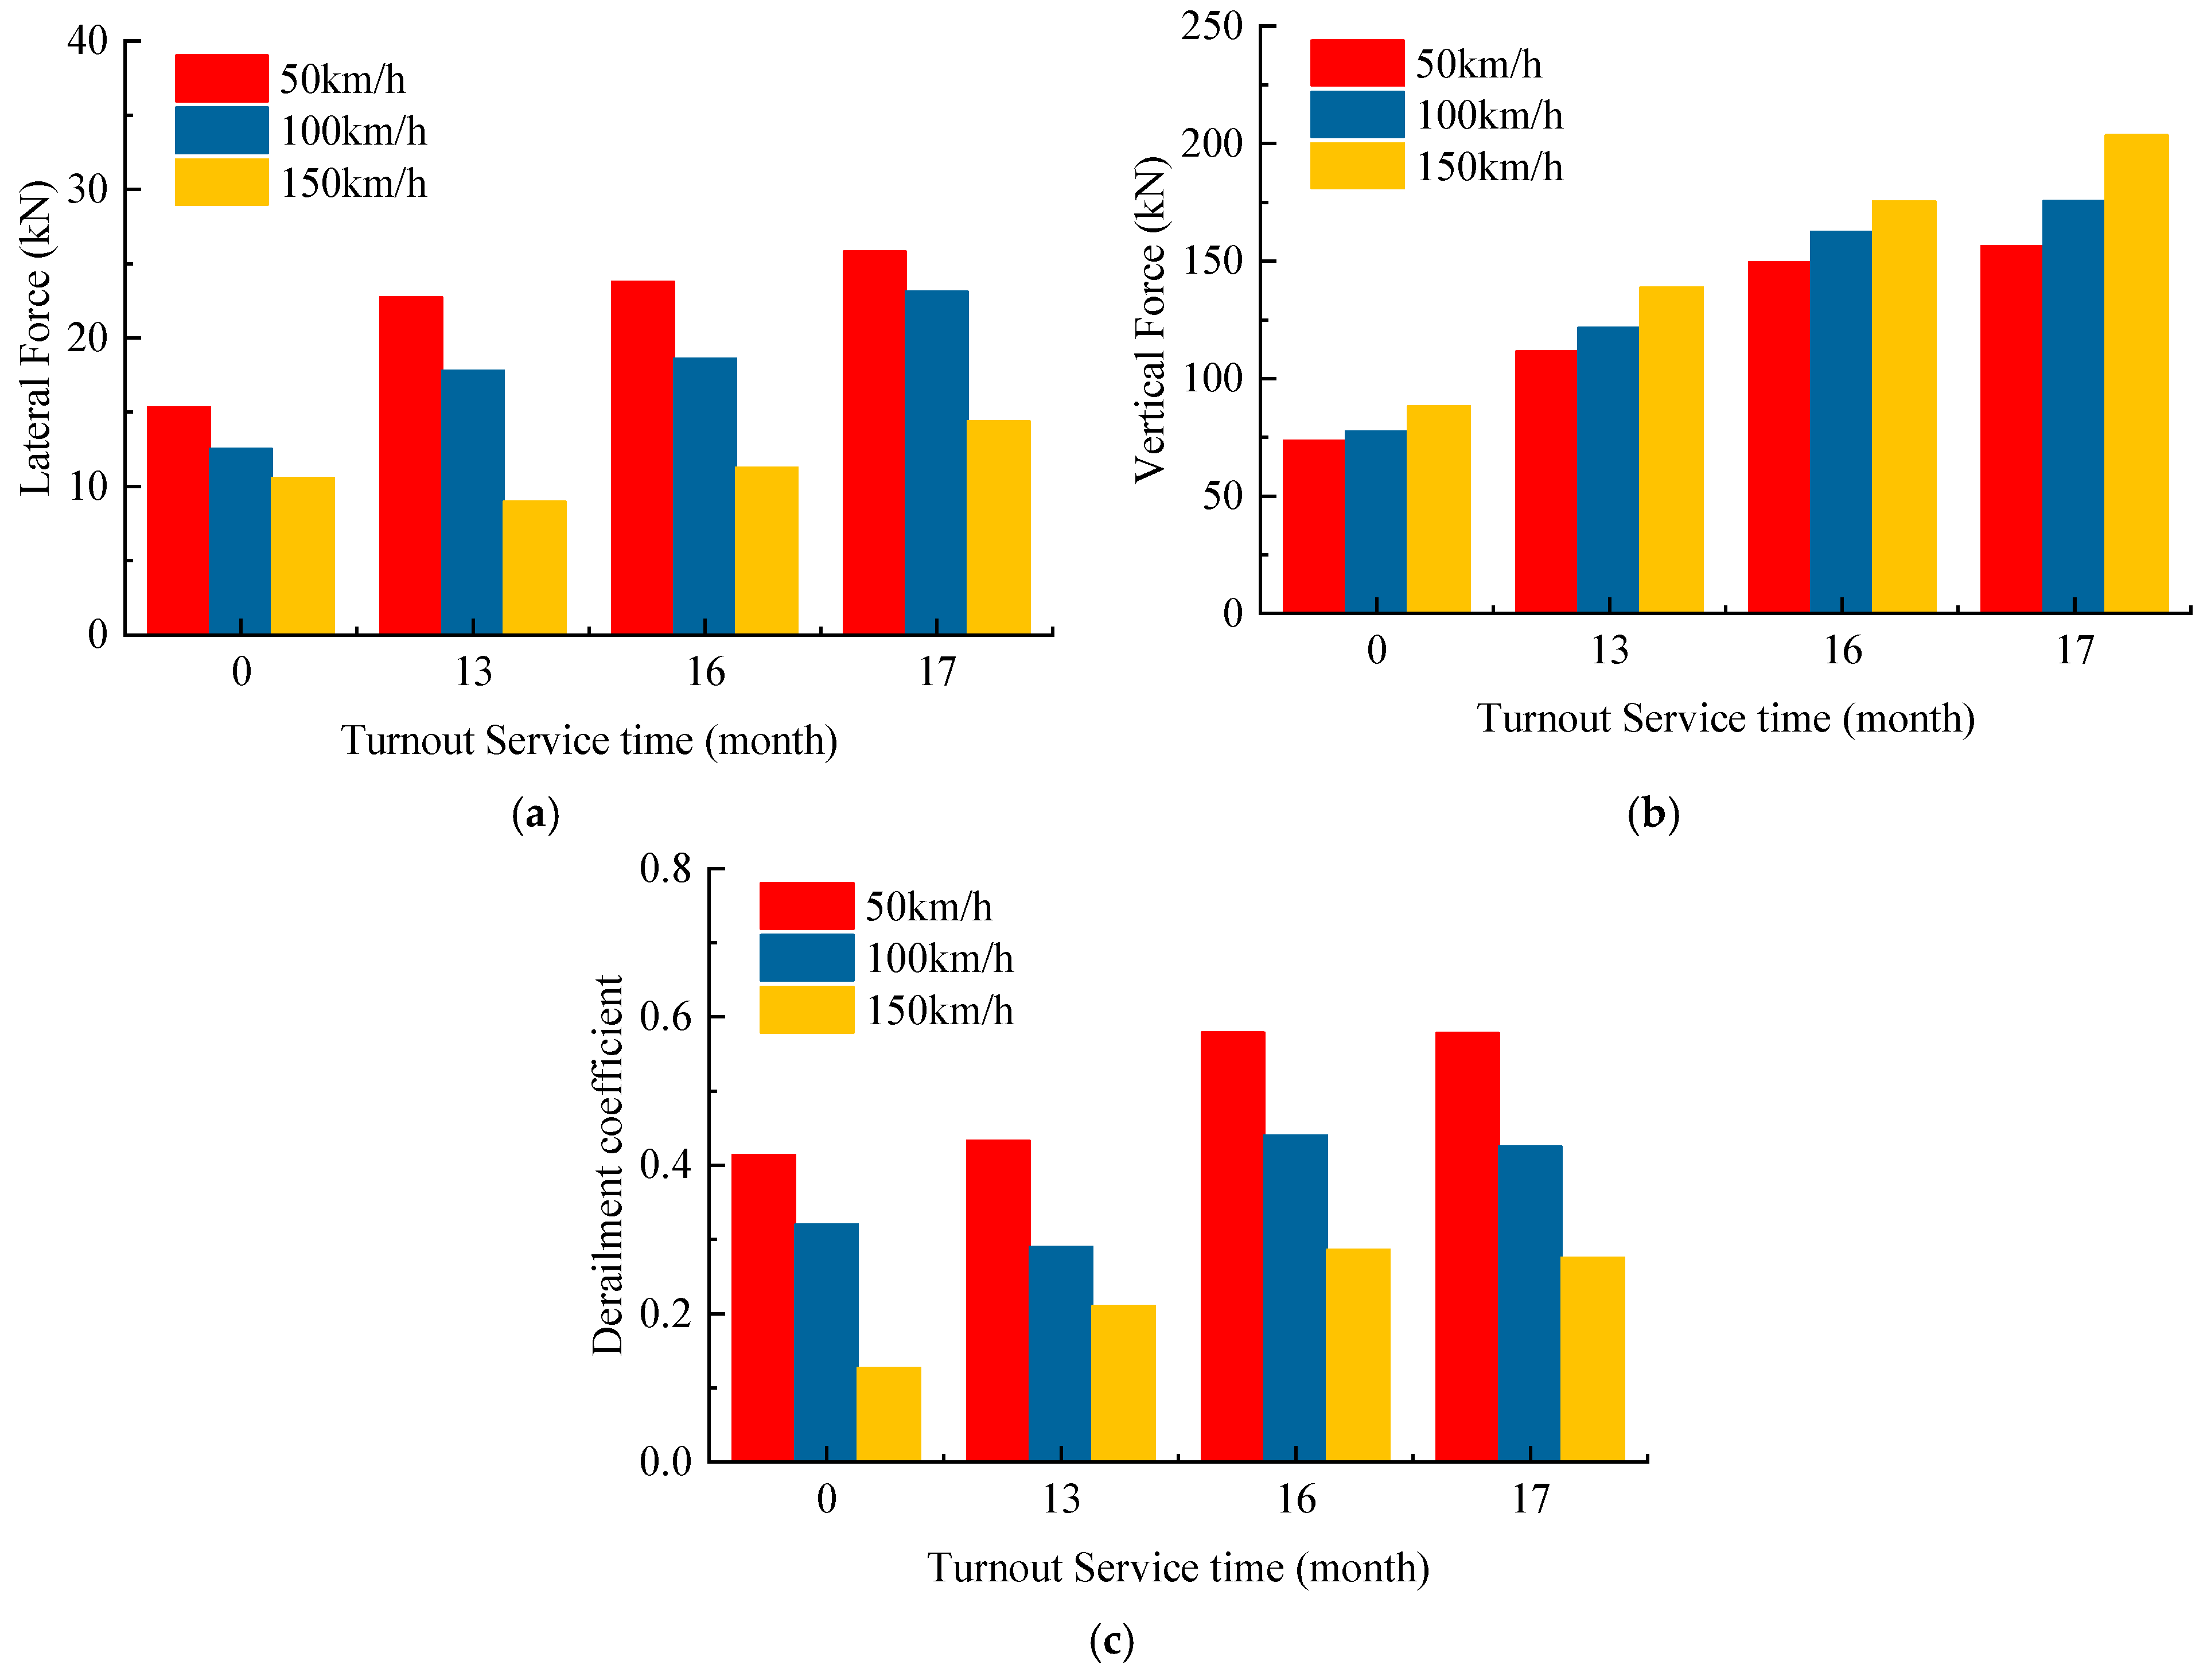
4.2.1. Wheel–Rail Forces
4.2.2. Dynamic Performance of the Vehicle
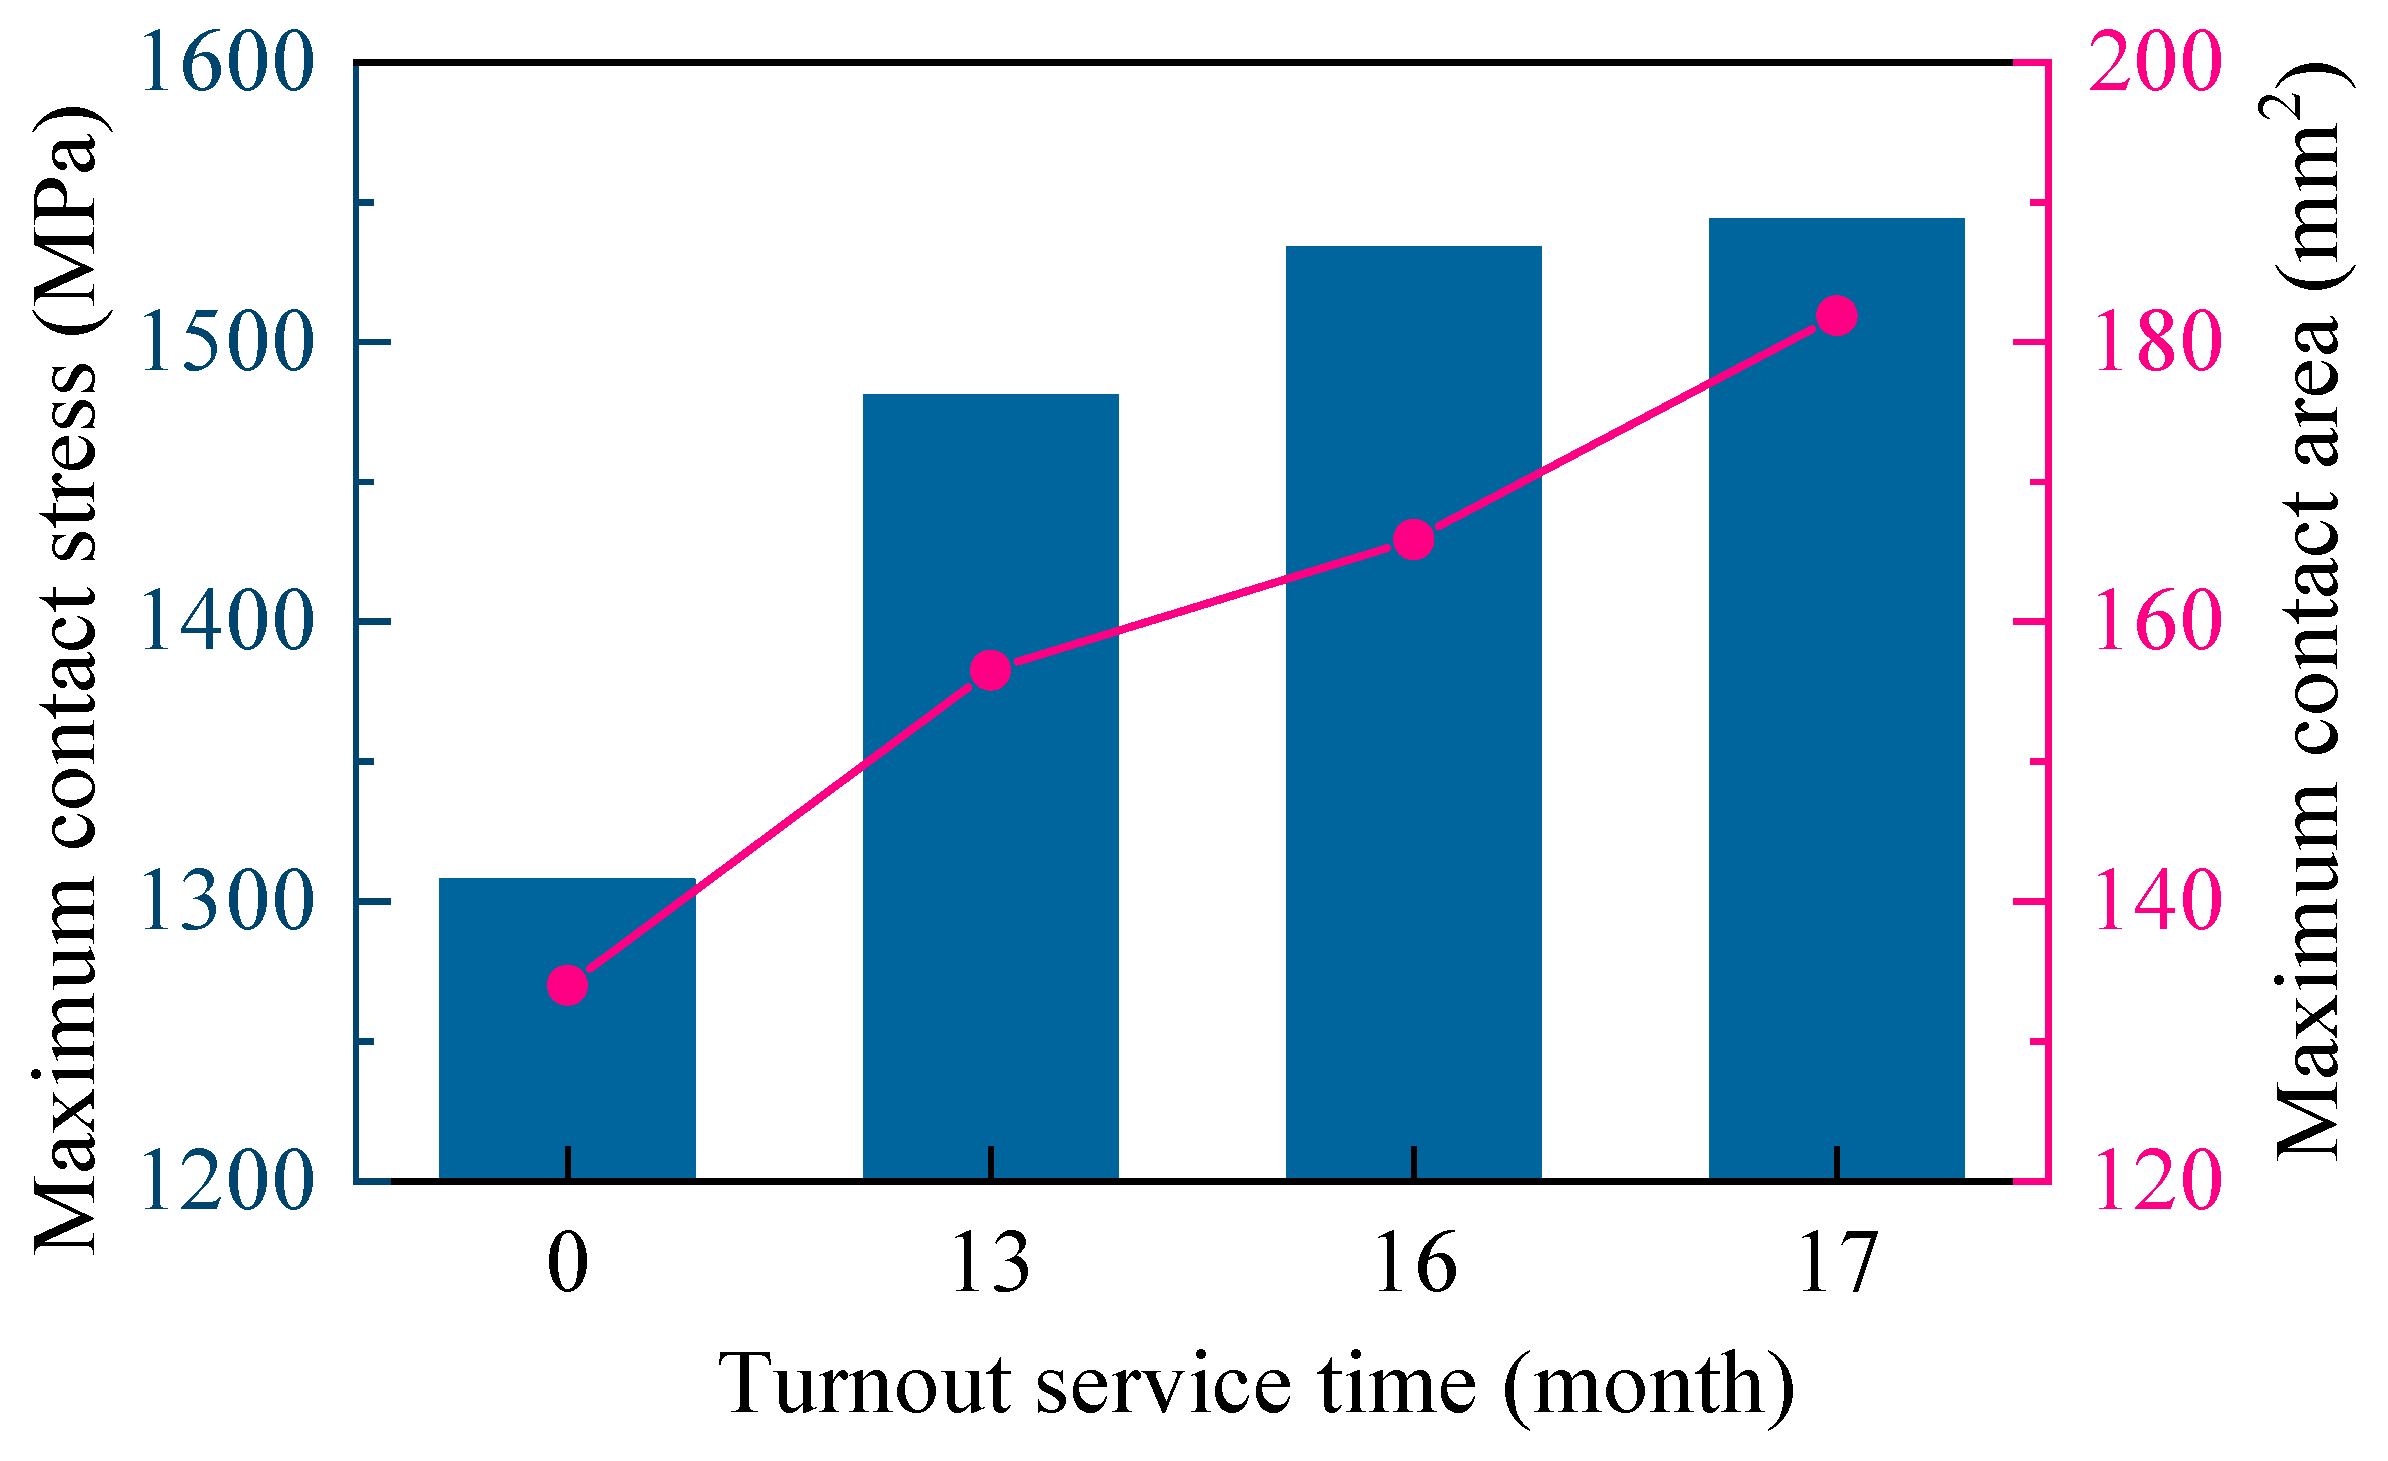
4.2.3. Contact Stress
4.3. Influence of Frog Wear on Dynamic Performance of Vehicles Under Different Operating States
4.3.1. Vehicle Passing Speed
4.3.2. Vehicle Loading Conditions
5. Conclusions
- With increased service time, the wear of the frog gradually deepens. After 13 months of service, the wear reaches 1.31 mm, and after 17 months, it increases by an additional 0.11 mm. The primary wear occurs in the region located 500 mm behind the frog point.
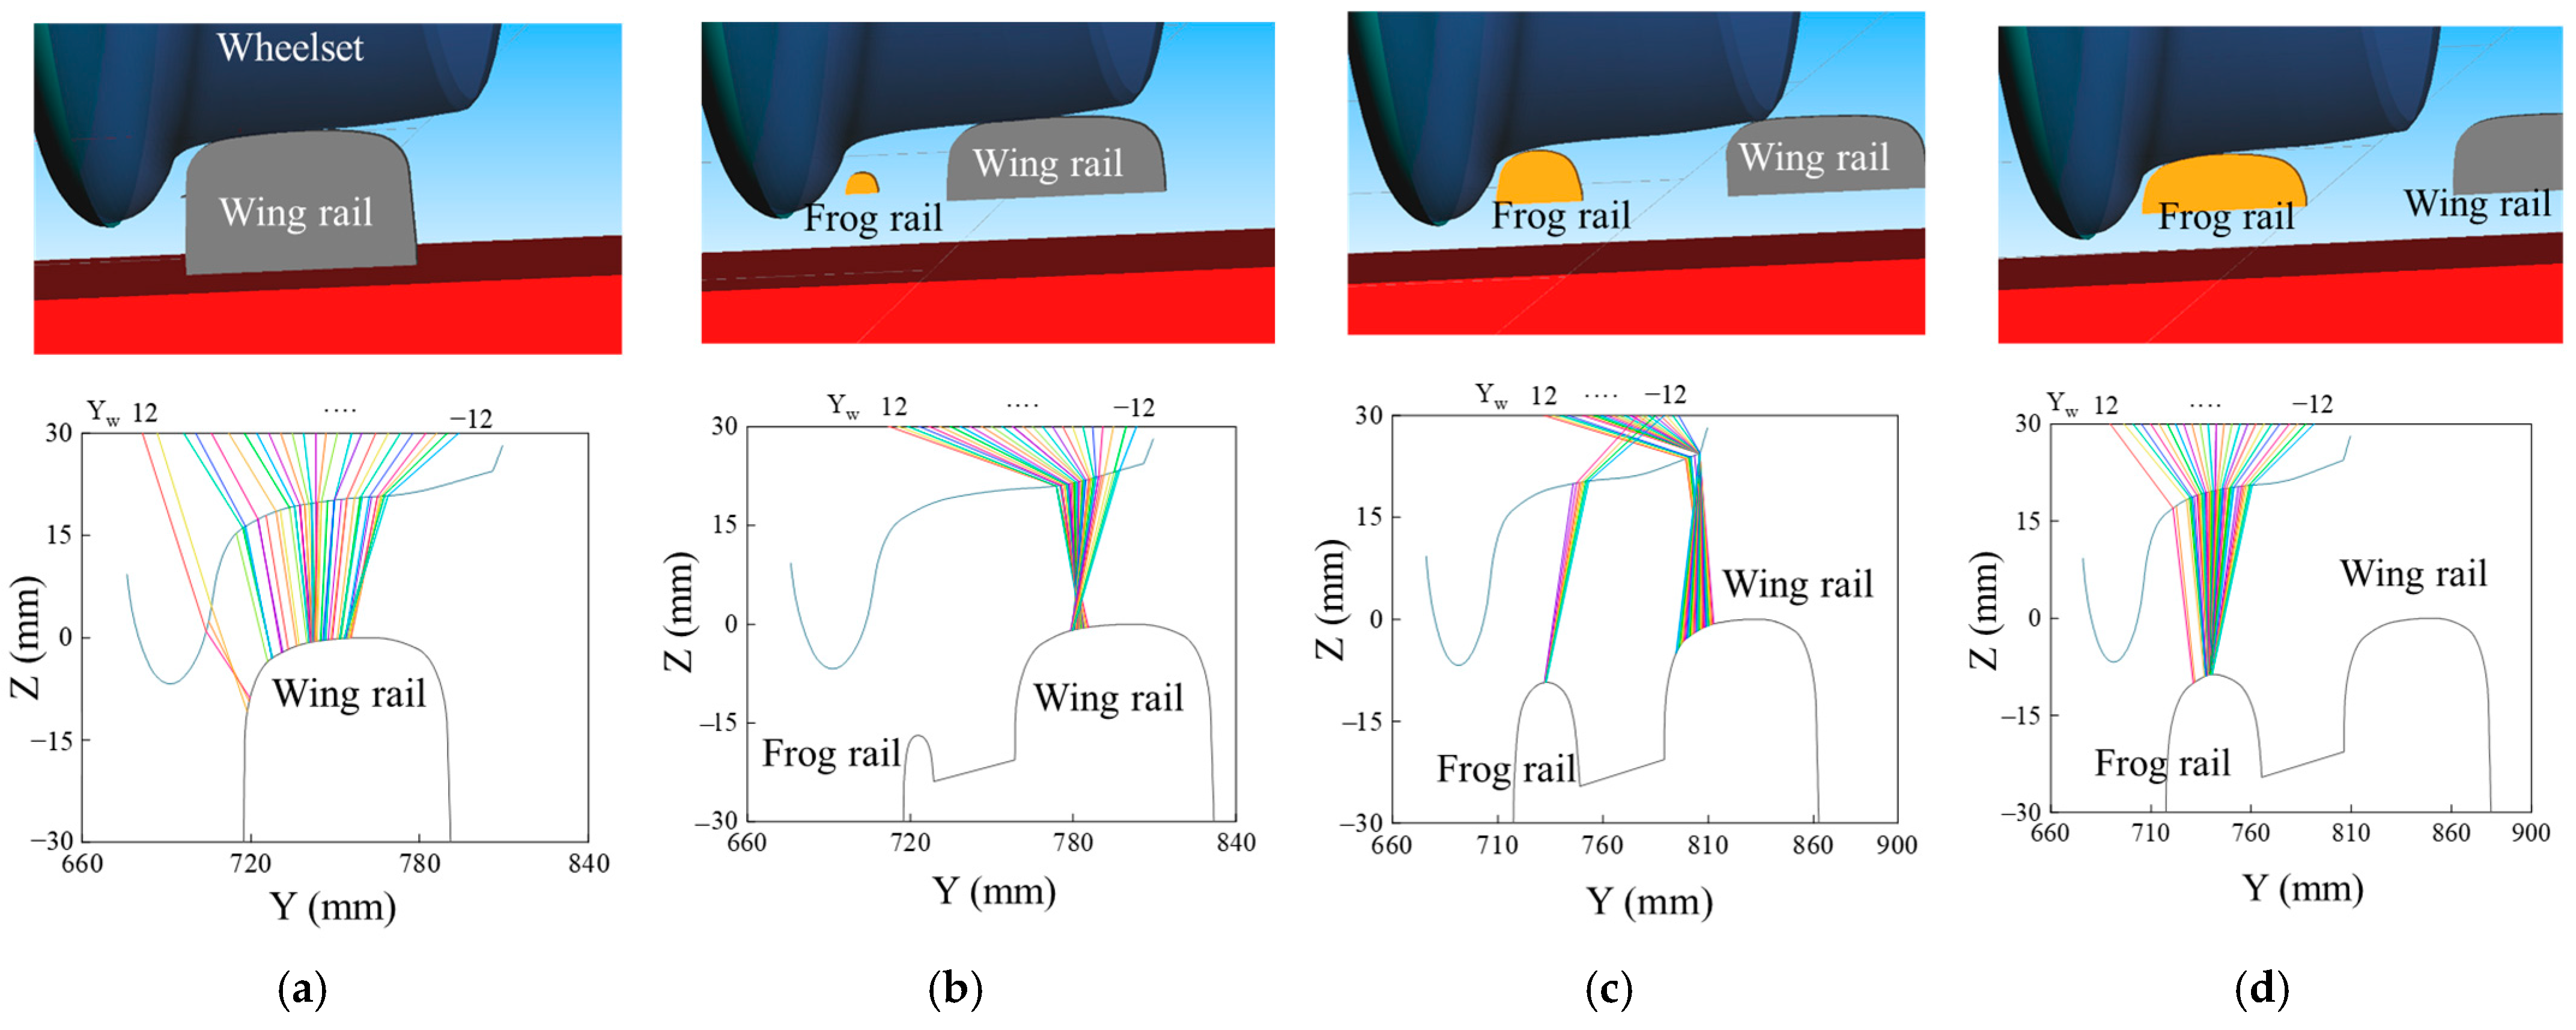
- The wheel–rail contact state undergoes significant variation as the vehicle enters the frog area. Initially, the wheel contacts the wing rail at the mid-region of the tread. Within the flangeway gap, both the tread and flange back of the wheel interact with the gauge corner and inner face of the wing rail, respectively. After passing over the frog point, the wheel contacts both the frog and the right rail simultaneously, leading to a high-stress concentration at the primary contact location, which is prone to frog damage. Subsequently, the wheel is fully supported by the railhead, and the contact state improves.
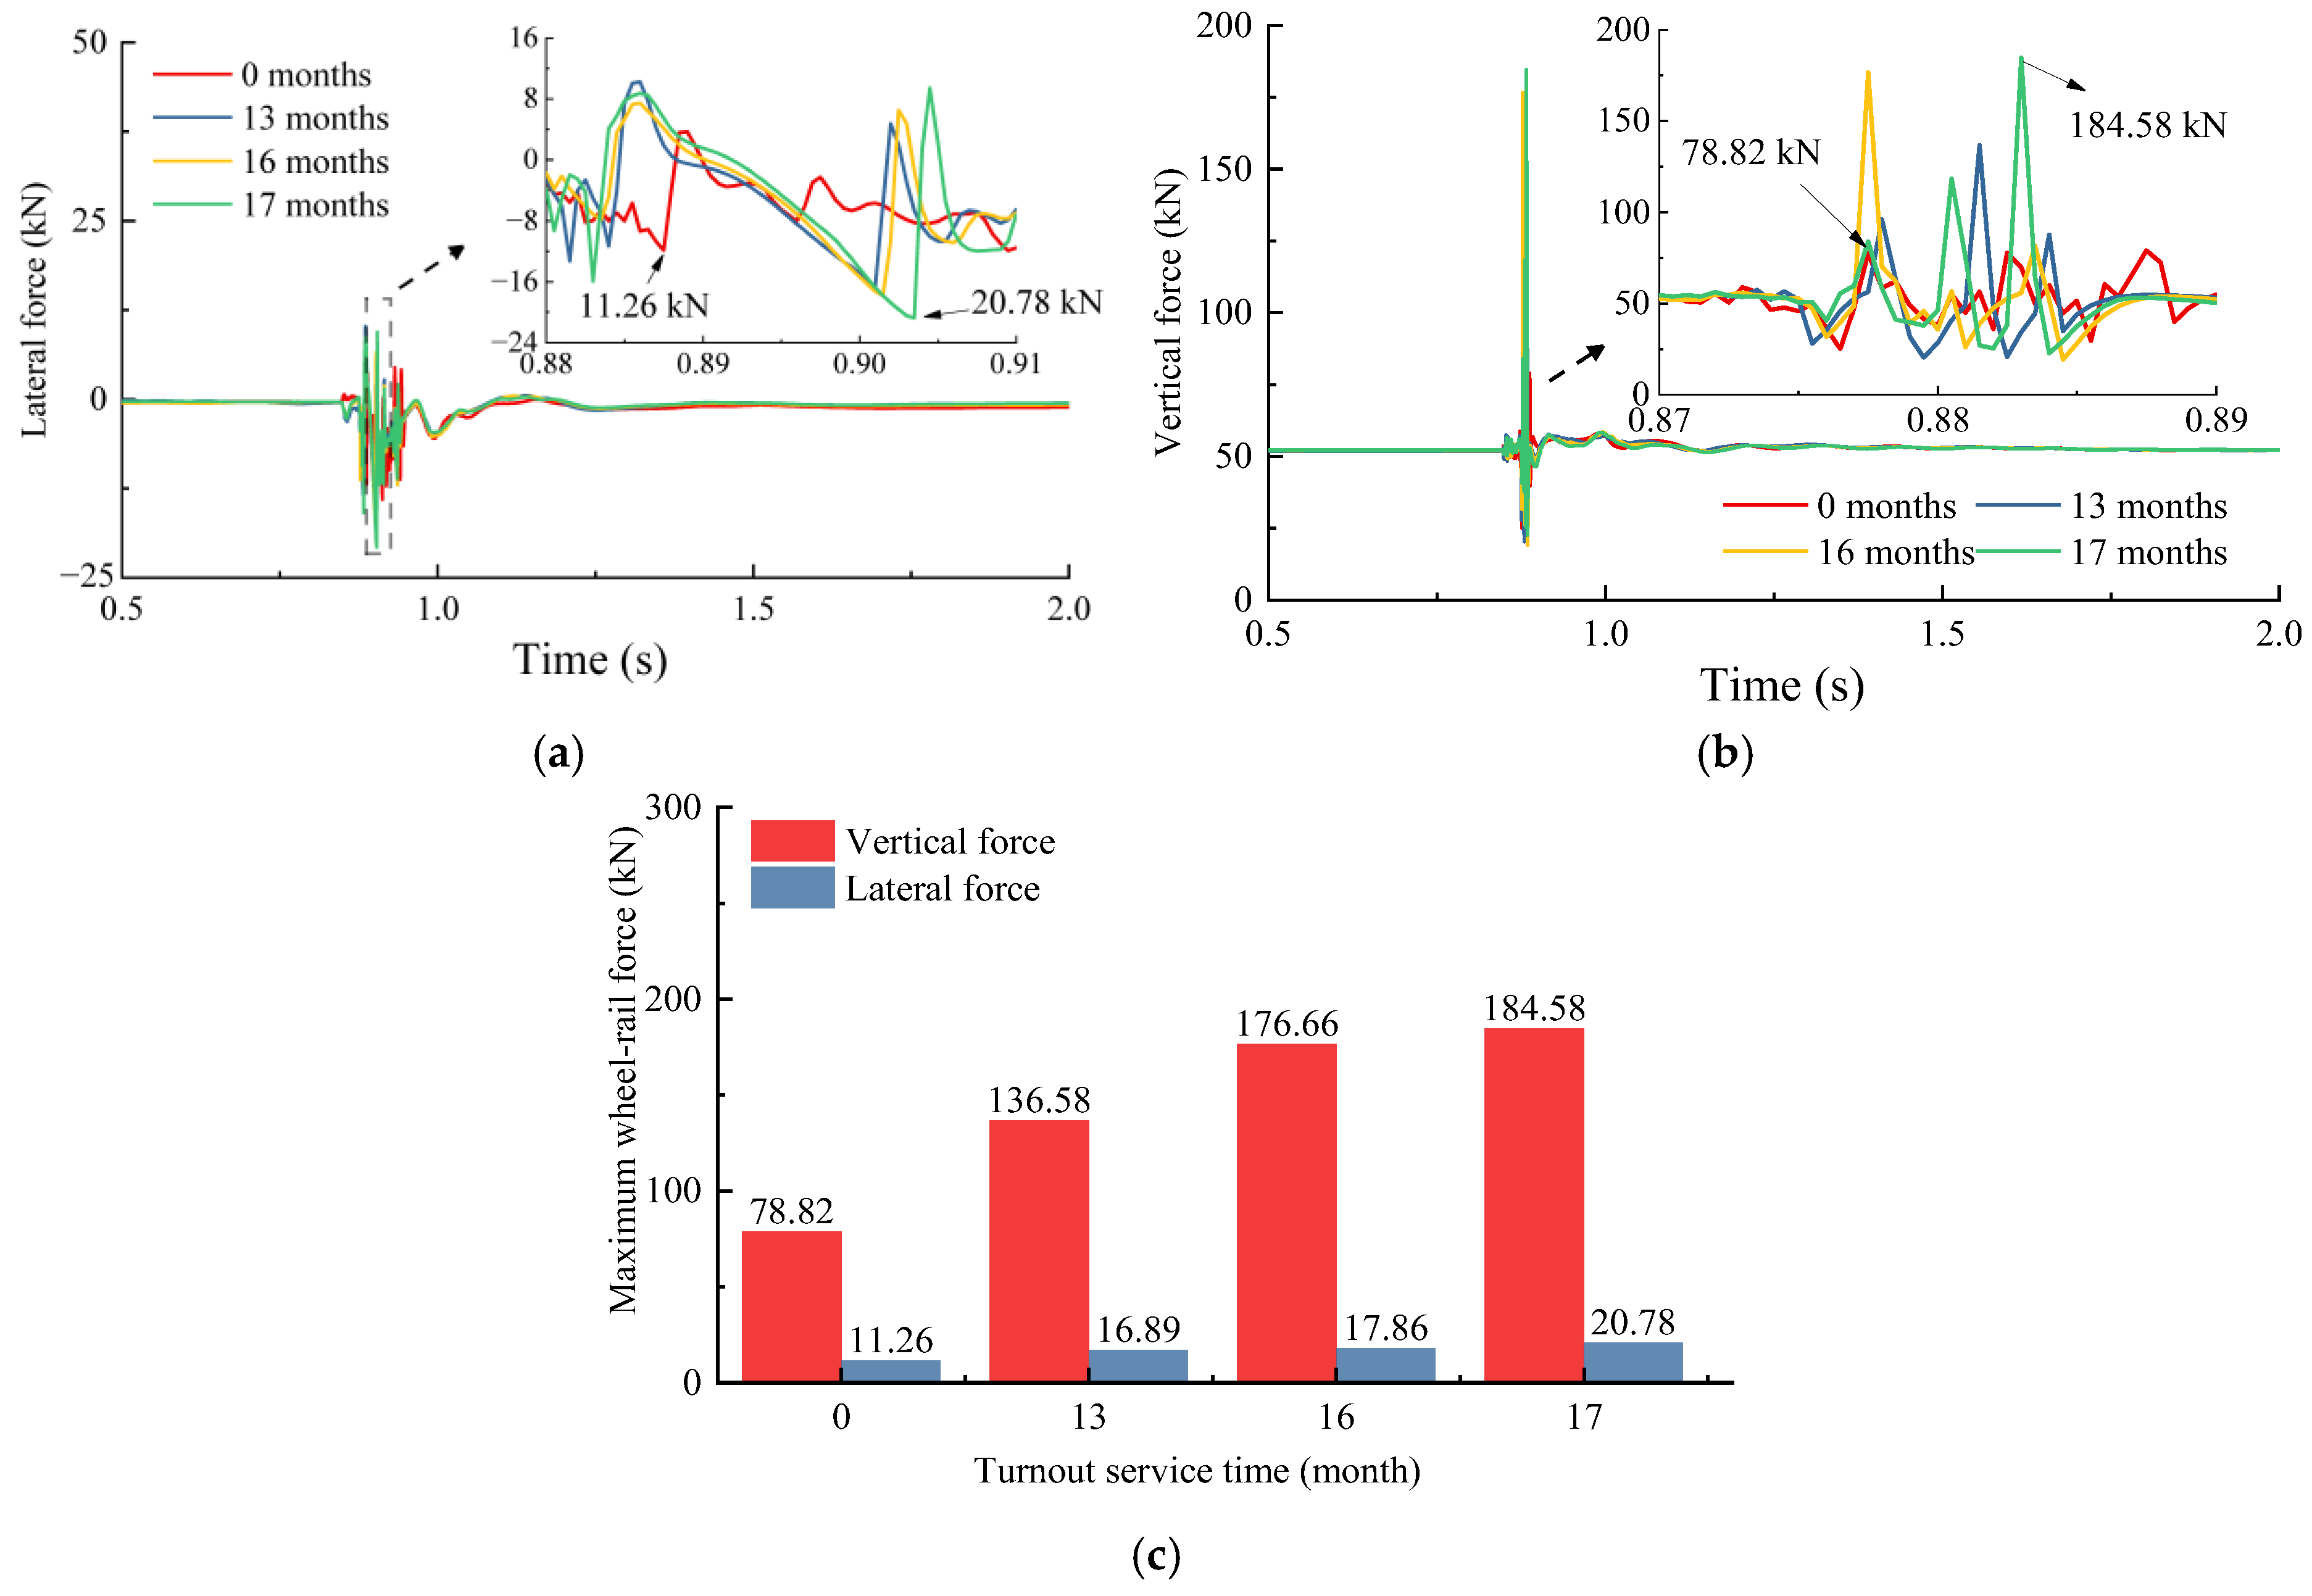
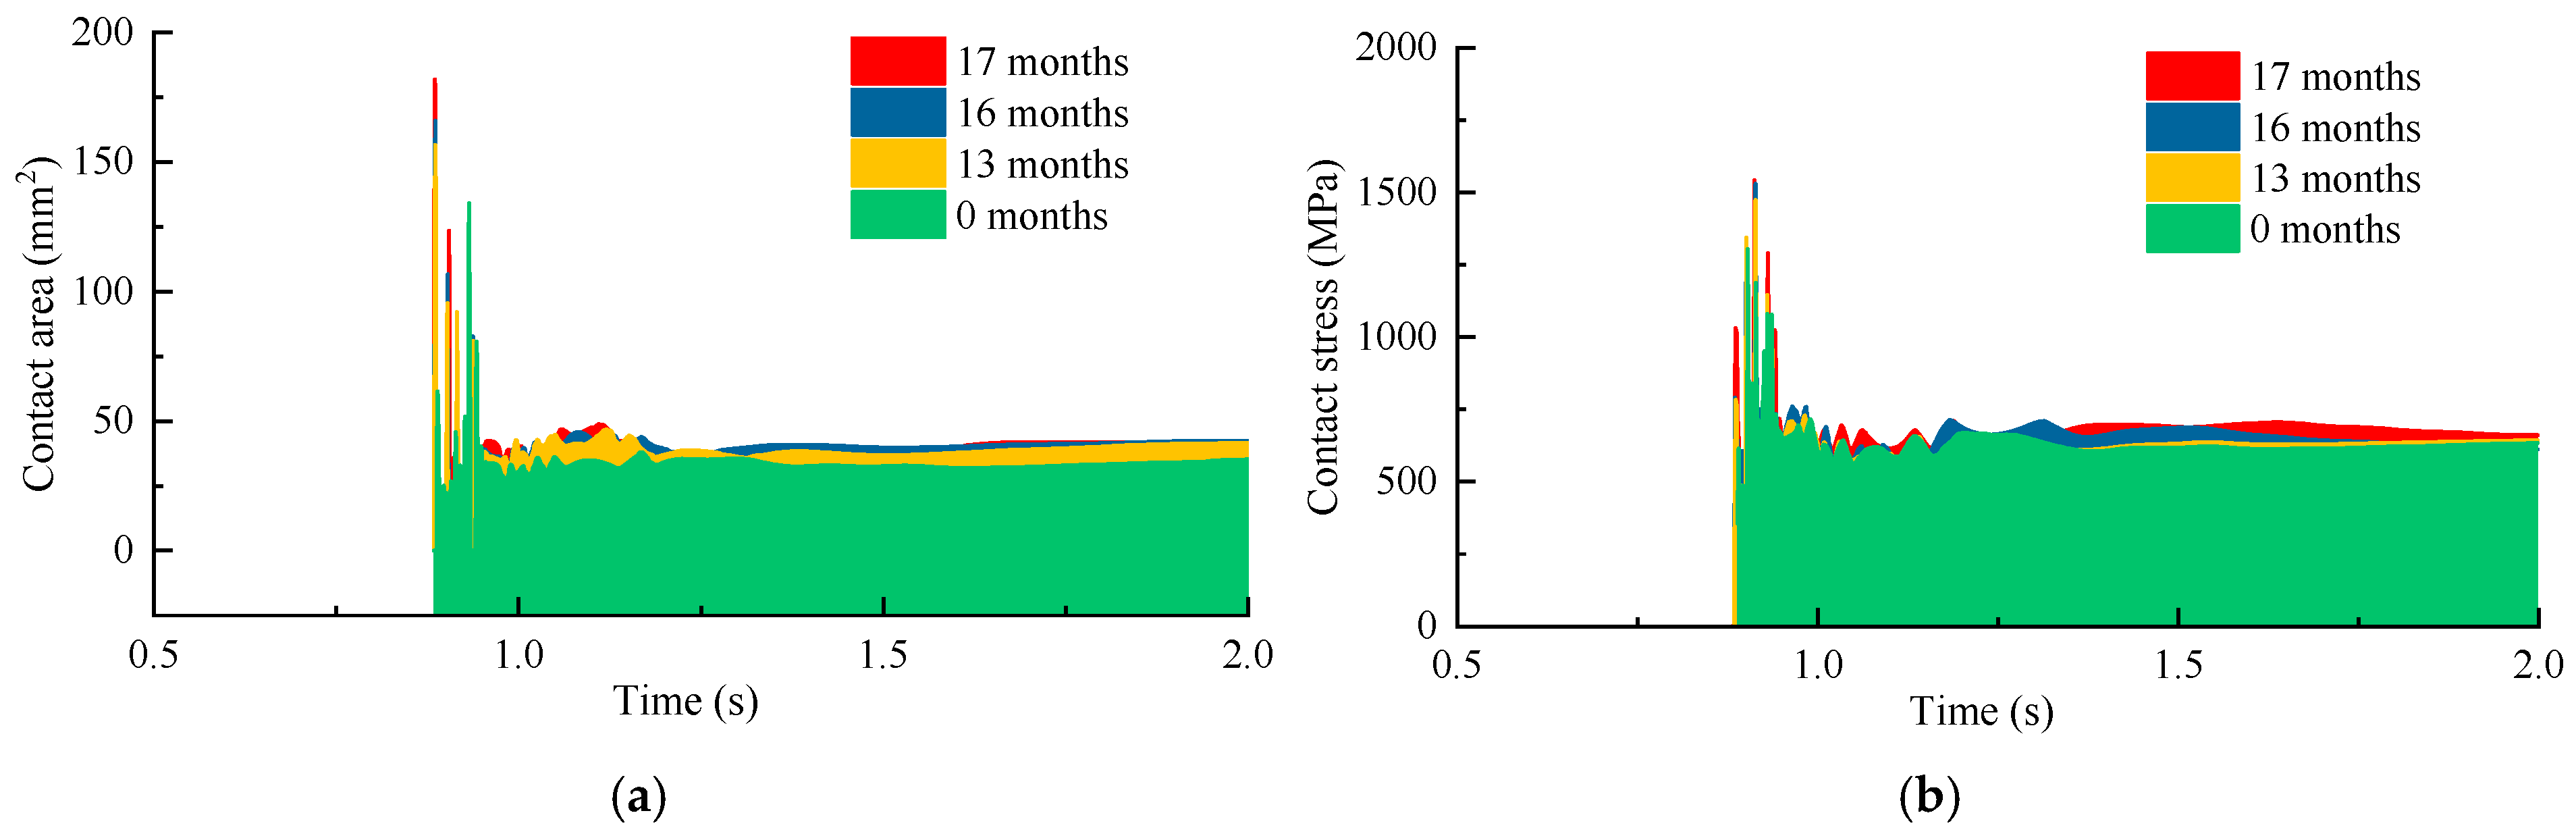
- When a vehicle passes over a frog with 17 months of wear at 120 km/h, compared to a new frog, the maximum lateral wheel–rail force increases by 9.52 kN, the maximum vertical force increases by 105.76 kN, the derailment coefficient increases by up to 0.14, the peak lateral acceleration of the car body rises by 0.17 m/s2, the maximum contact pressure increases by 236 MPa, and the contact patch area expands by 35.73%. As speed increases, the magnitude of the increase in lateral force diminishes, while the magnitudes of the increases in vertical force and derailment coefficient become more pronounced. Additionally, with increasing speed, the maximum lateral force itself decreases significantly, while the vertical force gradually increases. This results in a significant reduction in the maximum derailment coefficient.
- Under different vehicle loading conditions, all dynamic indicators increase with greater frog wear. As frog wear increases, heavier vehicle loads correspond to reduced percentage increases in dynamic indicators such as lateral and vertical wheel–rail forces. Conversely, the percentage increase in the derailment coefficient becomes larger. Furthermore, higher vehicle loads cause substantial increases in all dynamic indicators. After 17 months of turnout service, the vertical force for a fully loaded vehicle increases from 141.47 kN to 269.82 kN, exceeding the safety standard limit. For high-speed metro systems, it is recommended that turnouts undergo inspection and maintenance every 12 to 16 months.
Author Contributions
Funding
Data Availability Statement
Acknowledgments
Conflicts of Interest
References
- Nielsen, J.C.; Pålsson, B.A.; Torstensson, P.T. Switch panel design based on simulation of accumulated rail damage in a railway turnout. Wear 2016, 366–367, 241–248. [Google Scholar] [CrossRef]
- Sun, Y.; Cole, C.; Boyd, P. A numerical method using VAMPIRE modelling for prediction of turnout curve wheel-rail. Wear 2011, 271, 482–491. [Google Scholar] [CrossRef]
- Ignesti, M.; Malvezzi, M.; Marini, L.; Meli, E.; Rindi, A. Development of a wear model for the prediction of wheel and rial profile evolution in railway systems. Wear 2012, 284–285, 1–17. [Google Scholar] [CrossRef]
- Wen, Z.; Wu, L.; Li, W.; Jin, X.; Zhu, M. Three-dimensional elastic-plastic stress analysis of wheel-rail rolling contact. Wear 2011, 271, 426–436. [Google Scholar] [CrossRef]
- Zhao, X.; Li, Z. The solution of fraction wheel-rail rolling contact with a 3D transient finite element model—Validation and error analysis. Wear 2011, 201, 444–452. [Google Scholar] [CrossRef]
- Kim, S.J.; Eom, B.G.; Kang, B.B.; Lee, H.S. A study of running safety according to the section shape of an F10/F12 turnout. Trans. Korean Soc. Mech. Eng. A 2011, 35, 591–598. [Google Scholar] [CrossRef]
- Sala, A.J.; Felez, J.; de Dios Sanz, J.; Gonzalez, J. New anti-derailment system in railway crossings. Machines 2022, 10, 1224. [Google Scholar] [CrossRef]
- Nijman, E.; Buchegger, B.; Pickl, W.; Sazgetdinov, K. The influence of the lateral contact point trajectory and the rotation of the monoblock on the impact loads in railway turnouts. J. Sound Vib. 2022, 536, 117–118. [Google Scholar] [CrossRef]
- Braghin, F.; Lewis, R.; Dwyer-Joyce, R.; Bruni, S. A mathematical model to predict railway wheel profile evolution due to wear. Wear 2006, 261, 1253–1264. [Google Scholar] [CrossRef]
- Seo, J.W.; Jun, H.K.; Kwon, S.J.; Lee, D.H. Rolling contact fatigue and wear of two different rail steels under rolling-sliding contact. Int. J. Fatigue 2016, 83, 184–194. [Google Scholar] [CrossRef]
- Cremona, M.A.; Liu, B.; Hu, Y.; Bruni, S.; Lewis, R. Predicting railway wheel wear under uncertainty of wear coefficient, using universal kriging. Reliab. Eng. Syst. Saf. 2016, 154, 49–59. [Google Scholar] [CrossRef]
- Xin, L.; Markine, V.; Shevtsov, I. Numerical procedure for fatigue life prediction for railway turnout crossings using explicit finite element approach. Wear 2016, 366–367, 167–179. [Google Scholar] [CrossRef]
- Jendel, T.; Berg, M. Prediction of wheel profile wear: Methodology and verification. Veh. Syst. Dyn. 2002, 37, 502–513. [Google Scholar] [CrossRef]
- Pearce, T.; Sherratt, N. Prediction of wheel profile wear. Wear 1991, 144, 343–351. [Google Scholar] [CrossRef]
- Zobory, I. Prediction of wheel/rail profile wear. Veh. Syst. Dyn. 1997, 28, 221–259. [Google Scholar] [CrossRef]
- Markine, V.L.; Shevtsov, I.Y. Experimental analysis of the dynamic behaviour of railway turnouts. In Proceedings of the 11th International Conference on Computational Structures Technology, Dubrovnik, Croatia, 4–7 September 2012; Civil-Comp Press: Stirling, Australia, 2012; p. 131. [Google Scholar]
- Aniołek, K.; Herian, J. Numerical modeling of load and stress on the contact surface of a turnout and a railway vehicle. J. Transp. Eng. 2013, 139, 533–539. [Google Scholar] [CrossRef]
- Ishak, M.F.; Dindar, S.; Kaewunruen, S. Safety-based maintenance for geometry restoration of railway turnout systems in various operational environments. In Proceedings of the 21st National Convention on Civil Engineering, Songkhla, Thailand, 28–30 June 2016. [Google Scholar]
- Zhou, Y.; Ye, Y.; Hecht, M. Running safety analysis of a freight train passing through a single crossover during braking. Veh. Syst. Dyn. 2022, 60, 3519–3539. [Google Scholar] [CrossRef]


| Parameter | Value |
|---|---|
| Car Body Length/m | 22 |
| Car Body Width/m | 3 |
| Floor Height Above Rail/m | 1.13 |
| Vehicle Wheelbase/m | 15.7 |
| Axle Load/t | 17 |
| Track Gauge/m | 1.435 |
| Bogie Wheelbase/m | 2.5 |
| Wheelset Back-to-Back Distance/m | 1.353 |
| Wheel Diameter/m | 0.86 |
| Profile Location (mm) | Interval (mm) |
|---|---|
| −1000 to 0 | 100 |
| 0 to 200 | 50 |
| 200 to 1000 | 100 |
| 1000 to 2000 | 20 |
Disclaimer/Publisher’s Note: The statements, opinions and data contained in all publications are solely those of the individual author(s) and contributor(s) and not of MDPI and/or the editor(s). MDPI and/or the editor(s) disclaim responsibility for any injury to people or property resulting from any ideas, methods, instructions or products referred to in the content. |
© 2025 by the authors. Licensee MDPI, Basel, Switzerland. This article is an open access article distributed under the terms and conditions of the Creative Commons Attribution (CC BY) license (https://creativecommons.org/licenses/by/4.0/).
Share and Cite
Li, Y.; Zeng, D.; Wei, X.; Hu, X.; Wang, K. Analysis of the Impact of Frog Wear on the Wheel–Rail Dynamic Performance in Turnout Zones of Urban Rail Transit Lines. Lubricants 2025, 13, 317. https://doi.org/10.3390/lubricants13070317
Li Y, Zeng D, Wei X, Hu X, Wang K. Analysis of the Impact of Frog Wear on the Wheel–Rail Dynamic Performance in Turnout Zones of Urban Rail Transit Lines. Lubricants. 2025; 13(7):317. https://doi.org/10.3390/lubricants13070317
Chicago/Turabian StyleLi, Yanlei, Dongliang Zeng, Xiuqi Wei, Xiaoyu Hu, and Kaiyun Wang. 2025. "Analysis of the Impact of Frog Wear on the Wheel–Rail Dynamic Performance in Turnout Zones of Urban Rail Transit Lines" Lubricants 13, no. 7: 317. https://doi.org/10.3390/lubricants13070317
APA StyleLi, Y., Zeng, D., Wei, X., Hu, X., & Wang, K. (2025). Analysis of the Impact of Frog Wear on the Wheel–Rail Dynamic Performance in Turnout Zones of Urban Rail Transit Lines. Lubricants, 13(7), 317. https://doi.org/10.3390/lubricants13070317